The first quarter of 2013 has been quite rewarding for the ETF
industry, wherein some funds witnessed tremendous asset
accumulation driven by growing investor confidence.
In fact, ETFs saw massive inflows of $54.73 billion in the
quarter, marking the third biggest quarter inflows in the 20-year
history of the industry. With this, total AUM reached the $1.467
trillion mark, which is 21% higher than the year-ago quarter.
In terms of funds driving this total, investors should note that
equity products experienced the heaviest inflows followed by fixed
income funds. Meanwhile, commodities lost over $6.6 billion in
assets, due in large part to the terrible performance by gold and
gold ETFs (read: Have We Seen the Bottom in Gold ETFs?).
Let us have a look at the top 10 most popular ETFs that
witnessed a combined inflow of $19.91 billion in the quarter:
|
Fund
|
Category
|
Inflows ($ in millions)
|
Expense Ratio
|
1st Quarter Returns
|
|
DXJ
|
Japan Equities
|
3,946.88
|
0.48%
|
11.71%
|
|
IVV
|
Large Cap Equities
|
2,358.67
|
0.07%
|
9.57%
|
|
BSV
|
Total Bonds Market
|
2,230.97
|
0.11%
|
-0.17%
|
|
VTI
|
All Cap Equities
|
2,154.40
|
0.06%
|
9.89%
|
|
USMV
|
All Cap Equities
|
1,680.53
|
0.15%
|
12.60%
|
|
VNQ
|
REITs ETF
|
1,677.29
|
0.10%
|
7.51%
|
|
VOO
|
Large Cap Equities
|
1,528.79
|
0.05%
|
9.59%
|
|
BKLN
|
High Yield Bonds
|
1,500.85
|
0.76%
|
0.85%
|
|
EWJ
|
Japan Equities
|
1,453.27
|
0.51%
|
6.46%
|
|
XLF
|
Financial Equities
|
1,380.13
|
0.18%
|
10.56%
|
*Source: Indexuniverse
Japan ETF: Rising Star
One segment that stands out on this list is Japan ETFs. Assets
have been flowing into the nation at a robust rate, suggesting high
levels of demand for these securities. Investors have flocked into
the funds to take advantage of the surging economy and rising stock
market as well as the declining yen.
Unsurprisingly, WisdomTree Japan Hedged Equity Fund
(DXJ) is the top ETF of
Q1, having gathered over $3.9 billion, propelling the fund’s asset
base to nearly $5.6 billion. The ETF follows the WisdomTree Japan
Hedged Equity Index while provides a hedge against any fall in the
yen against the U.S. dollar. The fund charges a fee of 48 basis
points on an annual basis (read: DXJ--Best ETF to Play the Japan
Rally).
Another Japanese ETF – the iShares MSCI Japan ETF
(EWJ) – tracking the
MSCI Japan Index has also gained strong momentum as it pulled in
roughly $1.5 billion in the quarter. The product has amassed about
$7.3 billion in AUM so far while charging an expense ratio of
0.51%.
DXJ is up 11.71% during the quarter while EWJ has gained a bit
less at 6.46%.
U.S. ETFs: Broad Rally, Broad Market
ETFs
As broad markets are approaching their all-time highs, investors
are gaining confidence over the riskier asset classes. As such, a
number of domestic broad market funds have made it to the top 10
list, showing heavy inflows in Q1 on the heels of improving global
economic conditions.
The iShares Core S&P 500 ETF
(IVV) and the
Vanguard S&P 500 ETF
(VOO) have accumulated
roughly $2.3 billion and $1.5 billion, respectively. These inflows
have propelled the funds’ asset bases to $41.0 billion and $8.8
billion, respectively.
Both funds track the S&P 500 index and are the low cost
choices in the space charging 0.07% and 0.05% in annual fees,
respectively, from investors. Both products gained about 9.6% in
the quarter (read: 3 Ways to Play the S&P 500 Rally with
ETFs).
Beyond the S&P 500 funds, other broad market ETFs tracking
other indexes have featured in this elite list. The
Vanguard Total Stock Market ETF
(VTI) tracking the MSCI
US Broad Market Index and iShares MSCI USA Minimum
Volatility ETF (USMV)
tracking MSCI USA Minimum Volatility index have made it to the top
10 list.
The former is a total market ETF which comprises stocks from the
entire spectrum of market capitalization, while the latter measures
the performance of the U.S. securities that have lower absolute
volatility.
VTI pulled in about $2.1 billion in Q1, reaching over $29
billion in total assets while USMV attracted about $1.7 billion,
accumulating $2.6 billion in AUM so far. Both the products are
cheap, charging 6 bps and 15 bps in annual fees, respectively.
However, USMV leads in terms of returns by fetching investors
12.60% followed by VTI returning 9.89%.
Fixed Income ETFs: Mixed Bag
Given the threats of interest rate hikes later this year or in
the next, investors are seeking safe exposure to fixed income. As
such, some investors are back to the short-term bond markets, where
default risk and interest rate sensitivity are low.
The PowerShares Senior Loan Portfolio Fund
(BKLN) gathered $1.5
billion in the quarter, sending its asset base to $3.0 billion. The
product provides exposure to the senior loan market and focuses on
intermediate term investment grade corporate bonds.
The expense ratio is 76 bps a year, which is three times the low
cost junk bond ETFs. The ETF gained 0.85% in the first quarter (see
more ETFs in the Zacks ETF Center).
The Vanguard Short Term Bond ETF
(BSV) is the only ETF in
this list which has posted negative returns for the first quarter
in spite of accumulating nearly $2.2 billion. The ETF zeroes in on
the U.S. government, high-quality corporate, and investment-grade
international dollar-denominated bonds having maturity of 1–5
years. It charges 11 bps per year in annual fees and has amassed
$11.5 billion in AUM.
Real Estate ETFs: Winners of 2013
The real estate sector has been gaining immense popularity of
late, thanks to a gradual recovery in the U.S. economy. Stronger
commercial as well as residential real estate fundamentals, upbeat
housing data and higher home prices are making securities in this
segment attractive at present.
The Vanguard REIT ETF
(VNQ) is the most
popular ETF of Q1 in this segment tracking the MSCI US REIT Index.
The fund gathered over $1.7 billion so far this year, leading to an
asset base over $18.3 billion. The product added 7.51% in the
quarter and is one of the low cost choices in the space, charging
only 10 bps in annual fees from investors.
Financial ETFs: Top Sector of 2013
The only financial ETF that made to the top 10 list is
Financial Select Sector SPDR
(XLF), which follows the S&P
Financial Select Sector Index. The fund has seen inflows of $1.3
billion in the same time frame, accumulating roughly $11.6 billion
in its asset base.
The product generated double-digit returns in the quarter buoyed
by an impressive comeback by bank stocks (read: Two Sector ETFs
Posting Incredible Gains).
The strong performance was attributable to sound balance sheets,
an uptick in mortgage activity, lesser credit loss provisions,
expanding consumer credit, improved lending activity and good
credit quality. Further, solid economic data such as higher
consumer spending and GDP, an improving housing market as well as
declining unemployment rate point towards optimism in Q2.
Want the latest recommendations from Zacks Investment Research?
Today, you can download 7 Best Stocks for the Next 30
Days. Click to get this free report >>
PWRSH-SNR LN PR (BKLN): ETF Research Reports
VANGD-SHT TRM B (BSV): ETF Research Reports
WISDMTR-J HEF (DXJ): ETF Research Reports
ISHARS-JAPAN (EWJ): ETF Research Reports
ISHARS-SP500 (IVV): ETF Research Reports
ISHARS-MS US MV (USMV): ETF Research Reports
VIPERS-REIT (VNQ): ETF Research Reports
VANGD-SP5 ETF (VOO): ETF Research Reports
VIPERS-TOT STK (VTI): ETF Research Reports
SPDR-FINL SELS (XLF): ETF Research Reports
To read this article on Zacks.com click here.
Zacks Investment Research
Want the latest recommendations from Zacks Investment Research?
Today, you can download 7 Best Stocks for the Next 30 Days. Click
to get this free report
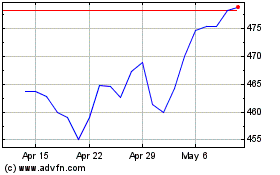
Vanguard S&P 500 (AMEX:VOO)
Historical Stock Chart
From Apr 2024 to May 2024

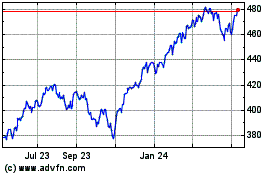
Vanguard S&P 500 (AMEX:VOO)
Historical Stock Chart
From May 2023 to May 2024
