Thanks to more fuel efficient cars, a sluggish economy, and
increased technological innovation, the U.S. is poised to become a
force in the energy market once again. New fracking methods and a
lack of demand in the domestic market has dramatically increased
oil production over the past few years, and simultaneously pushed
oil imports to their lowest level in decades.
In fact, the IEA recently projected that the U.S. would leapfrog
both Russia and Saudi Arabia to become the world’s biggest producer
of oil in just five years time. The international organization also
said that the U.S. could become self-sufficient in energy by 2035
and a net exporter of natural gas by the end of the decade (read
Three ETFs for the Unconventional Oil Revolution).
Clearly if these trends hold it could have an enormous impact on
the American economy and once again allow global energy firms to
focus on the U.S. market as opposed to dictator-run petro-powers
from across the Middle East and increasingly in smaller markets
across Asia and Latin America as well.
If this happens, it could continue a surge in investment
interest in the North American oil market as oil companies from
around the globe flock to a relatively safe place to drill, refine,
and export oil from. Obviously this situation would be good news
for many firms in the oil and gas industry, making a number of
companies in this space interesting investments for the long term
(although not necessarily in the short-term).
However, as we saw with the BP debacle, a look
to a single energy firm can be extremely risky, suggesting a more
diversified approach should probably be taken. Fortunately there
are a dozens of energy ETFs out there giving investors plenty of
choices in the space (see Inside The Forgotten Energy ETFs).
Below, we highlight three ETFs that we think could be
particularly intriguing choices for a continued American oil boom.
Any of these should benefit if America continues to expand its oil
production levels and once again become a leader in energy
development:
Market Vectors Oil Services ETF (OIH)
As more wells and drilling takes place across America, more oil
services and equipment will be required. Thanks to this expansion
in the home grown market, it seems likely that funds targeting this
segment of the oil industry could be a beneficiary of the boom,
with potentially a lower risk level as well.
Easily the most popular ETF in this segment is OIH, now from
Market Vectors. The ETF has over $1.2 billion in assets and sees
over four million shares in volume a day, suggesting low bid ask
spreads which only had to the fund’s favorable cost level as
expense are at 35 basis points a year (read Time to Buy Oil and Gas
Services ETFs?).
However, investors should note that the product is pretty
concentrated in Schlumberger (SLB) with 20% of the
assets, followed by NOV and HAL
at another 17% combined. Still, the product has a heavy U.S. focus
and a decent mid cap contingent, suggesting it should be driven by
the events in the North American market.
PowerShares S&P Small Cap Energy Portfolio
(PSCE)
As more large caps hone in on the fracking and oil production
trend at home, they will probably have to deal with small caps in
at least a few segments. That is because many of these pint sized
securities are 100% focused on the U.S. market and either have
claims to key and untapped areas, or important patents, factors
that are likely to make them top takeover targets as trend gets
further underway.
Yet since we can never be sure of which will be targeted,
investors should look to PSCE for diversified exposure to the space
to play a ‘rising tide lifts all boats’ theory. The fund holds
roughly 25 stocks in its basket, but it remains somewhat
unpopular—despite low fees of 0.29% a year—so bid ask spreads could
be relatively wide for this fund (see Crude Oil ETF Investing
101).
Still, the product offers up a nice mix between equipment and
exploration/production firms with roughly a 50/50 split.
Additionally, the fund is relatively well spread out as no one firm
makes up more than 10% of assets, although four do account for more
than 8% each.
Market Vectors Unconventional Oil & Gas ETF
(FRAK)
At the heart of the American energy boom is fracking technology.
This process, which injects fluids into rocks in order force oil
and gas up to an extraction point, has been used more extensively
and effectively over the past few years to boost yields at a number
of oil and gas fields across the country.
While a number of companies use the technology on a regular
basis, those in the aptly-named FRAK truly thrive on it. This fund
consists of roughly 45 companies that are in the Market Vectors
Unconventional Oil & Gas Index, a benchmark that looks to track
the coalbed methane, coal seam gas, shale oil & gas, and sands
market, charging 54 basis points a year in fees (see The
Comprehensive Guide to Natural Gas ETFs).
Top components include large caps like Anadarko
(APC) and Occidental (OXY), while
EOG Resources (EOG) is the third biggest
component. Volume and AUM are still quite low for this large cap
focused fund—suggesting modest bid ask spreads-- but it is arguably
one of the better ways to play booming American oil production in
ETF form.
Want the latest recommendations from Zacks Investment Research?
Today, you can download 7 Best Stocks for the Next 30
Days. Click to get this free report >>
Follow @Eric Dutram on Twitter
ANADARKO PETROL (APC): Free Stock Analysis Report
BP PLC (BP): Free Stock Analysis Report
MKT VEC-UNC O&G (FRAK): ETF Research Reports
MKT VEC-OIL SVC (OIH): ETF Research Reports
PWRSH-SP SC EGY (PSCE): ETF Research Reports
SCHLUMBERGER LT (SLB): Free Stock Analysis Report
To read this article on Zacks.com click here.
Zacks Investment Research
Want the latest recommendations from Zacks Investment Research?
Today, you can download 7 Best Stocks for the Next 30 Days. Click
to get this free report
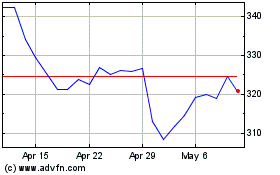
VanEck Oil Services ETF (AMEX:OIH)
Historical Stock Chart
From Dec 2024 to Jan 2025

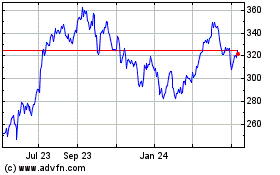
VanEck Oil Services ETF (AMEX:OIH)
Historical Stock Chart
From Jan 2024 to Jan 2025
