UNITED STATES
SECURITIES AND EXCHANGE COMMISSION
Washington, D.C. 20549
FORM 6-K
Report
of Foreign Private Issuer Pursuant to Rule 13a-16
or 15d-16 of the Securities Exchange Act of 1934
| For the month of September 2023 |
| |
| Commission File Number 001-40569 |
| Standard Lithium Ltd. |
| (Translation of registrant’s name into English) |
| |
|
Suite 1625, 1075 West Georgia Street
Vancouver, British Columbia, Canada V6E 3C9 |
| (Address of principal executive offices) |
Indicate by check mark whether the registrant files or will file annual
reports under cover of Form 20-F or Form 40-F:
Form 20-F ¨
Form 40-F x
Indicate by check mark if the registrant is submitting the Form 6-K
in paper as permitted by Regulation S-T Rule 101(b)(1): ¨
Indicate by check mark if the registrant is submitting the Form 6-K
in paper as permitted by Regulation S-T Rule 101(b)(7): ¨
DOCUMENTS INCLUDED AS PART OF THIS REPORT
SIGNATURES
Pursuant to the requirements of the Securities
Exchange Act of 1934, the registrant has duly caused this report to be signed on its behalf by the undersigned, thereunto duly authorized.
| |
Standard Lithium Ltd. |
| |
(Registrant) |
| |
|
| Date: |
September 18, 2023 |
|
By: |
/s/ Robert Mintak |
| |
|
|
|
Name: |
Robert Mintak |
| |
|
|
|
Title: |
CEO and Director |
Exhibit 99.1
September 18, 2023

STANDARD LITHIUM
FILES TECHNICAL REPORT FOR THE SOUTH WEST ARKANSAS PROJECT
September 18,
2023 – El Dorado, AR, USA – Standard Lithium Ltd. (“Standard Lithium” or the “Company”)
(TSXV:SLI) (NYSE American:SLI) (FRA:S5L), a leading near-commercial lithium company, announces that the Preliminary Feasibility Study
for the South West Arkansas Project (the “Report”), as announced on August 8, 2023, has been filed.
The Report is available
for review under the Company’s profile on SEDAR+ at www.sedar.com and on the Company’s website at www.standardlithium.com/projects/arkansas-smackover.
For highlights of this Report, please refer to the Company’s press release dated 8 August 2023.
About the South West Arkansas Project
The South West Arkansas Project (“SWA Project”)
is located approximately 15 miles west of the City of Magnolia in southwestern Arkansas. The SWA Project’s Indicated and Inferred
Mineral Resource of 1.4 Mt and 0.4 Mt lithium carbonate equivalent, respectively, has some of the highest reported lithium brine concentrations
in North America, averaging above 400 mg/L. The Preliminary Feasibility Study demonstrates robust economics, assuming production of at
least 30,000 tonnes per year of battery-quality lithium hydroxide beginning in 2027 over a 20-plus year operating life.
The Company anticipates completing a FEED and
Definitive Feasibility Study for the SWA Project in 2024 and beginning construction in 2025. Commercial production is expected in 2027,
subject to continuing project definition, due diligence, project financing and receipt of future feasibility studies.
About Standard Lithium Ltd.
Standard Lithium is a leading near-commercial
lithium development company focused on the sustainable development of a portfolio of lithium-brine bearing properties in the United States. The
Company prioritizes brine projects characterized by high-grade resources, robust infrastructure, skilled labor, and streamlined permitting.
The Company aims to achieve sustainable, commercial-scale lithium production via the application of a scalable and fully-integrated Direct
Lithium Extraction (“DLE”) and purification process. The Company’s signature projects, the Phase 1A Project and the
South West Arkansas Project, are located on the Smackover Formation in southern Arkansas near the Louisiana state line, a region with
a long-standing and established brine processing industry. The Company has also identified a number of highly prospective lithium brine
project areas in the Smackover Formation in East Texas and began an extensive brine leasing program in the key project areas. In
addition, the Company has an interest in certain mineral leases located in the Mojave Desert in San Bernardino County, California.
Standard Lithium
trades on both the TSX Venture Exchange and the NYSE American under the symbol “SLI”; and on the Frankfurt Stock Exchange
under the symbol “S5L”. Please visit the Company’s website at www.standardlithium.com.
Qualified Person
Steve Ross, P.Geol., a qualified person as
defined by National Instrument 43-101, and Vice President Resource Development for the Company, has reviewed and approved the relevant
scientific and technical information in this news release.
Investor and Media Inquiries
Allysa Howell
Vice President, Corporate Communications
+1 720 484 1147
a.howell@standardlithium.com
Twitter: @standardlithium
LinkedIn: https://www.linkedin.com/company/standard-lithium/
Neither
the TSX Venture Exchange nor its Regulation Services Provider (as that term is defined in policies of the TSX Venture Exchange) accepts
responsibility for the adequacy or accuracy of this release. This news release may contain certain “Forward-Looking Statements”
within the meaning of the United States Private Securities Litigation Reform Act of 1995 and applicable Canadian securities laws. When
used in this news release, the words “anticipate”, “believe”, “estimate”, “expect”, “target,
“plan”, “forecast”, “may”, “schedule” and other similar words or expressions identify
forward-looking statements or information. These forward-looking statements or information may relate to intended development timelines,
future prices of commodities, accuracy of mineral or resource exploration activity, reserves or resources, regulatory or government requirements
or approvals, the reliability of third party information, continued access to mineral properties or infrastructure, fluctuations in the
market for lithium and its derivatives, changes in exploration costs and government regulation in Canada and the United States, and other
factors or information. Such statements represent the Company’s current views with respect to future events and are necessarily
based upon a number of assumptions and estimates that, while considered reasonable by the Company, are inherently subject to significant
business, economic, competitive, political and social risks, contingencies and uncertainties. Many factors, both known and unknown, could
cause results, performance or achievements to be materially different from the results, performance or achievements that are or may be
expressed or implied by such forward-looking statements. The Company does not intend, and does not assume any obligation, to update these
forward-looking statements or information to reflect changes in assumptions or changes in circumstances or any other events affecting
such statements and information other than as required by applicable laws, rules and regulations.
Exhibit 99.2
| South West Arkansas Project Pre-Feasibility Study | 18 Sept 23 |
Cautionary Note
Regarding Forward-Looking Information
Information contained
in this report and the documents referred to herein which are not statements of historical facts, may be “forward-looking information”
for the purposes of Canadian Securities laws. Such forward looking information involves risks, uncertainties and other factors that could
cause actual results, performance, prospects and opportunities to differ materially from those expressed or implied by such forward looking
information. The words “expect”, “target”, “estimate”, “may”, “anticipate”,
“should”, “will”, and similar expressions identify forward-looking information.
These forward-looking
statements relate to, among other things, resource estimates, grades and recoveries, development plans, mining methods and metrics including
recovery process and, mining and production expectations including expected cash flows, capital cost estimates and expected life of mine,
operating costs, the expected payback period, receipt of government approvals and licenses, time frame for construction, financial forecasts
including net present value and internal rate of return estimates, tax and royalty rates, and other expected costs.
Forward-looking
information is necessarily based upon a number of estimates and assumptions that, while considered reasonable, are inherently subject
to significant political, business, economic and competitive uncertainties and contingencies. There may be factors that cause results,
assumptions, performance, achievements, prospects or opportunities in future periods not to be as anticipated, estimated or intended.
There can be no
assurances that forward-looking information and statements will prove to be accurate, as many factors and future events, both known and
unknown could cause actual results, performance or achievements to vary or differ materially from the results, performance or achievements
that are or may be expressed or implied by such forward-looking statements contained herein or incorporated by reference. Accordingly,
all such factors should be considered carefully when making decisions with respect to the Project, and prospective investors should not
place undue reliance on forward-looking information. Forward-looking information in this technical report is as of the issue date, September 18th
2023. Standard Lithium Ltd. assumes no obligation to update or revise forward-looking information to reflect changes in assumptions,
changes in circumstances or any other events affecting such forward-looking information, except as required by applicable law.
| South West Arkansas Project Pre-Feasibility Study | 18 Sept 23 |
Table
of Contents
| Table of Contents |
II |
| List of Figures |
IX |
| List of Tables |
XI |
| 1 | Summary |
1 |
| 1.1 | Issuer
and Purpose |
1 |
| 1.2 | Property
Location and Ownership |
1 |
| 1.3 | Geology
and Mineralization |
2 |
| 1.4 | Status
of Exploration |
2 |
| 1.5 | Updated
Mineral Resource Estimation |
3 |
| 1.6 | Mining
Methods |
5 |
| 1.7 | Recovery
Method and Mineral Processing |
5 |
| 1.8 | Capital
and Operating Cost Estimates |
7 |
| 1.8.1 | Capital
Expenditure Costs |
7 |
| 1.8.2 | Operating
Expenditure Costs (OPEX) |
8 |
| 1.9 | Economic
Analysis |
10 |
| 1.10 | QP
Conclusions |
12 |
| 1.10.1 | Exploration
work |
12 |
| 1.10.2 | Mineral
Processing work |
12 |
| 1.11 | Key
Study Recommendations |
13 |
| 2 | Introduction |
15 |
| 2.1 | Issuer
and Purpose |
15 |
| 2.2 | Technical
Report Authors and Personal Inspection of Property |
17 |
| 2.3 | Sources
of Information |
18 |
| 2.4 | Units
of Measure, Currency, and Acronyms |
20 |
| 3 | Reliance
on Other Experts |
24 |
| 4 | Property
Description and Location |
25 |
| 4.1 | Property
Description and Location |
25 |
| 4.2 | Lithium-Brine
Mineral Production Rights |
25 |
| South West Arkansas Project Pre-Feasibility Study | 18 Sept 23 |
| 4.2.1 | Summary
of the Standard Lithium – TETRA Agreement |
26 |
| 4.2.2 | Summary
of Salt Water (Brine) Deeds |
27 |
| 4.2.3 | Summary
of Leases |
27 |
| 4.2.4 | Mineral
Brine Right Distribution on Individual Leases |
28 |
| 4.3 | Surface
(and Mineral) Rights in Arkansas |
31 |
| 4.4 | Unitization |
33 |
| 4.5 | Potential
Future Royalty Payments to Lessors |
34 |
| 4.6 | Property
Environmental Liabilities and Permitting |
35 |
| 4.7 | Risks
and Uncertainties |
36 |
| 5 | Accessibility,
Climate, Local Resources, Infrastructure, and Physiography |
37 |
| 5.1 | Accessibility |
37 |
| 5.1.1 | Airport
Access |
37 |
| 5.1.2 | Rail
Access |
37 |
| 5.1.3 | Road
Access |
37 |
| 5.2 | Climate |
39 |
| 5.3 | Local
Resources and Infrastructure |
39 |
| 5.4 | Physiography |
39 |
| 6 | History |
40 |
| 6.1 | Introduction
To Brine Production |
40 |
| 6.2 | Regional
Assessment of the Lithium Potential of the Smackover Formation Brine |
42 |
| 6.3 | SWA
Property Historical Infrastructure Summary |
47 |
| 7 | Geological
Setting and Mineralization |
49 |
| 8 | Deposit
Type |
57 |
| 9 | Exploration |
58 |
| 9.1 | Subsurface
data review |
58 |
| 9.2 | 2018
and 2023 Lithium Concentration Data Sampling program |
58 |
| 9.3 | Exploration
Results and Interpretation |
62 |
| 10 | Drilling |
64 |
| 10.1 | Standard
Lithium exploration program |
67 |
| South West Arkansas Project Pre-Feasibility Study | 18 Sept 23 |
| 10.1.1 | Taylor,
Beulah et al 1 Well Re-entry |
70 |
| 10.1.2 | International
Paper Company 1 Well Re-entry |
71 |
| 10.1.3 | Carter-Moore
1 Well Re-entry |
71 |
| 10.1.4 | Speer
1 New Well |
71 |
| 10.1.5 | Montague
1 New Well |
71 |
| 11 | Sample
Preparation, Analyses, and Security |
72 |
| 11.1 | Sampling
Methods |
72 |
| 11.2 | Sample
Preparation, Analyses And Security |
72 |
| 11.2.1 | Brine
Sample Collection |
72 |
| 11.2.2 | Security |
74 |
| 11.2.3 | Analytical
Methodology |
74 |
| 11.3 | Quality
Control/Quality Assurance |
75 |
| 11.3.1 | Field
Duplicate Samples |
75 |
| 11.4 | Other
Data: Core Reports |
76 |
| 11.5 | Summary |
77 |
| 12 | Data
Verification |
78 |
| 12.1 | Verification
of Lithium Concentration Data |
78 |
| 12.2 | Verification
of Well Logs and Core Data |
79 |
| 12.3 | Qualified
Persons Opinion |
79 |
| 13 | Mineral
Processing and Metallurgical Testing |
80 |
| 13.1 | Introduction |
80 |
| 13.1.1 | Process
Selection Rationale |
81 |
| 13.1.2 | Process
Overview |
82 |
| 13.2 | Historical
Testing |
83 |
| 13.3 | Demonstration
Plant Testing |
83 |
| 13.3.1 | Overview |
83 |
| 13.3.2 | Brine
Pre-Treatment Testing |
88 |
| 13.3.3 | DLE
Testing at the Demonstration Plant |
88 |
| 13.3.4 | LSS
Laboratory Testing |
91 |
| 13.4 | Demonstration
Plant LiCl Purification and Concentration |
92 |
| South West Arkansas Project Pre-Feasibility Study | 18 Sept 23 |
| 13.5 | Additional
LiCl Purification and Concentration Testing |
93 |
| 13.6 | LiCl
Conversion Testing |
93 |
| 13.6.1 | Electrolysis |
94 |
| 13.6.2 | Bi-polar
Membrane Electrodialysis (BPMED) |
95 |
| 13.6.3 | Direct
Lithium Conversion |
96 |
| 13.6.4 | Further
Development |
96 |
| 13.7 | Crystallization
and Packaging |
97 |
| 13.8 | Process
Testing QA/QC |
97 |
| 13.9 | Process
Scalability |
98 |
| 13.10 | Process
Technical Risks and Mitigation Measures |
98 |
| 13.11 | Conclusions
and Recommendations |
99 |
| 14 | Mineral
Resource Estimates |
100 |
| 14.1 | Geologic
Model Description |
101 |
| 14.2 | Lithium
Resource Estimates |
110 |
| 14.3 | QP
Discussion |
112 |
| 15 | Mineral
Reserve Estimates |
114 |
| 16 | Mining
Methods |
115 |
| 16.1 | Lithium
Recovery Process |
115 |
| 16.2 | Methodology |
116 |
| 16.3 | Well
Field Overview |
118 |
| 16.4 | Well
Field Configuration |
119 |
| 16.4.1 | Production
Wells |
119 |
| 16.4.2 | Injection
Wells |
120 |
| 17 | Recovery
Methods |
121 |
| 17.1 | Brine
Production and Delivery |
123 |
| 17.2 | Production
of Purified Lithium Chloride Solution |
123 |
| 17.2.1 | Pretreatment
of the Feed Brine |
123 |
| 17.2.2 | Lithium
Extraction Process |
124 |
| 17.2.3 | Lithium
Barren Brine Disposal |
124 |
| 17.2.4 | Raw
Lithium Chloride Purification and Concentration |
125 |
| South West Arkansas Project Pre-Feasibility Study | 18 Sept 23 |
| 17.3 | Production
of Lithium Hydroxide |
125 |
| 17.4 | Packaging
of Lithium Hydroxide |
126 |
| 17.5 | Projected
Energy, Water, and Raw Material Requirements |
126 |
| 18 | Project
Infrastructure |
128 |
| 18.1 | Brine
Supply Wells Infrastructure |
128 |
| 18.1.1 | Well
Field |
128 |
| 18.2 | Central
Processing Facility Infrastructure |
131 |
| 18.2.1 | Fresh
Water Supply and Distribution |
132 |
| 18.2.2 | Steam
Supply |
133 |
| 18.2.3 | Power
Supply |
133 |
| 18.2.4 | Compressed
Air |
133 |
| 18.2.5 | Compressed
Nitrogen |
133 |
| 18.2.6 | Sour
Gas Transfer |
133 |
| 18.2.7 | Chemicals
and Reagents |
134 |
| 18.2.8 | Auxiliary
Facilities |
134 |
| 18.3 | Effluent
Brine/Process Water Injection Wells Network Infrastructure |
135 |
| 18.3.1 | Well
Field |
135 |
| 18.3.2 | Pipelines |
138 |
| 19 | Market
Studies And Contracts |
139 |
| 19.1 | Background |
139 |
| 19.2 | Lithium
Hydroxide Price |
142 |
| 20 | Environmental
Studies, Permitting, and Social or Community Impact |
145 |
| 20.1 | Introduction |
145 |
| 20.2 | Environmental
Considerations |
145 |
| 20.3 | Permitting |
146 |
| 20.3.1 | Overview |
146 |
| 20.3.2 | Clean
Water Act Section 404 Permitting |
147 |
| 20.3.3 | Air
Emissions Permitting |
148 |
| 20.3.4 | Water
Discharge Permitting |
149 |
| 20.4 | Brine
Supply/Disposal Well Permits |
151 |
| South West Arkansas Project Pre-Feasibility Study | 18 Sept 23 |
| 20.4.1 | Underground
Injection Control (UIC) Permitting |
151 |
| 20.4.2 | Public
Water Supply |
152 |
| 20.4.3 | Resource
Conservation Recovery Act |
152 |
| 20.4.4 | Construction
Permits, Approvals, and Plans |
153 |
| 20.5 | Social
Impact |
154 |
| 20.6 | Environmental
Management and Closure Plan |
155 |
| 21 | Capital
and Operating Expenditure Costs |
156 |
| 21.1 | Capital
Expenditure Estimate |
156 |
| 21.1.1 | Basis
of Estimate |
156 |
| 21.1.2 | General |
156 |
| 21.1.3 | Brine
Supply and Injection Well Fields |
156 |
| 21.1.4 | Brine
Supply/Return and Sour Gas Pipeline Network |
158 |
| 21.1.5 | Central
Processing Facility |
158 |
| 21.1.6 | CAPEX
Summary |
160 |
| 21.1.7 | Sustaining
Capital |
161 |
| 21.1.8 | Land
Costs |
162 |
| 21.2 | Operating
Expenditure Estimate |
163 |
| 21.2.1 | Basis
of Estimate (BOE) |
163 |
| 21.2.2 | Direct
Operational Expenditures |
163 |
| 21.2.3 | Indirect
Operational Expenditures |
169 |
| 21.2.4 | Mineral
Rights, Royalties and Land Fees |
170 |
| 21.2.5 | OPEX
Summary |
171 |
| 21.2.6 | All-In
Operating Costs |
173 |
| 21.3 | Exclusions |
173 |
| 21.4 | Upside
Production Analysis |
174 |
| 22 | Economic
Analysis |
175 |
| 22.1 | Evaluation
Criteria |
175 |
| 22.2 | Taxes &
Royalties |
176 |
| 22.2.1 | Royalties
and Lease Fees |
176 |
| 22.2.2 | Depreciation |
176 |
| South West Arkansas Project Pre-Feasibility Study | 18 Sept 23 |
| 22.2.3 | Corporate
Taxes |
176 |
| 22.2.4 | Property
Tax |
176 |
| 22.2.5 | Federal
Funding and Tax Benefits |
177 |
| 22.3 | CAPEX
Spend Schedule |
177 |
| 22.4 | Production
Revenues |
177 |
| 22.5 | Cash-Flow
Projection |
177 |
| 22.6 | Economic
Evaluation Results |
179 |
| 22.7 | Sensitivity
Analysis |
180 |
| 22.8 | Sensitivity
Analysis Conclusions |
183 |
| 22.9 | Upside
Production Scenario |
183 |
| 22.9.1 | Deviation
of Alternative Upside Scenario from Base Case |
183 |
| 23 | Adjacent
Properties |
185 |
| 24 | Other
Relevant Data and Information |
186 |
| 25 | Interpretations
and Conclusions |
187 |
| 25.1 | Exploration
Work |
187 |
| 25.2 | Process
Development Work |
187 |
| 25.3 | SWA
Pre-Feasibility Study Summary |
188 |
| 25.4 | Project
Risks |
188 |
| 26 | Recommendations |
191 |
| 27 | References |
193 |
| 28 | Certificate
of Authors |
198 |
| South West Arkansas Project Pre-Feasibility Study | 18 Sept 23 |
List of Figures
| Figure 1-1. SWA
Project 2023 Exploration Program |
3 |
| Figure 2-1. SWA Project discussed
in this Technical Report |
16 |
| Figure 4-1. SWA Project discussed
in this Technical Report |
26 |
| Figure 4-2. SWA Property Ownership
Summary |
31 |
| Figure 5-1. SWA Property with
cities/towns and access routes, including major and secondary U.S. highways and railway lines |
38 |
| Figure 5-2. Average Temperature
and Precipitation in Magnolia, AR |
39 |
| Figure 6-1. Summary of South
Arkansas Oil and Gas Production |
41 |
| Figure 6-2. Summary of South
Arkansas Brine Production |
42 |
| Figure 6-3. Regional Smackover
Formation Lithium Brine Values from the USGS National Produced Waters Database |
44 |
| Figure 6-4. Historic Smackover
Formation Lithium Brine Values Derived within, and Adjacent to, the South West Arkansas Property |
46 |
| Figure 6-5. Well Status on
the SWA Property |
48 |
| Figure 7-1. Facies Map of the
Smackover Formation, Northern Gulf Coast Basin |
51 |
| Figure 7-2. Structural Framework,
Northern Gulf Coast |
52 |
| Figure 7-3. Stratigraphic Column
of the Late Triassic to Late Jurassic Formations |
53 |
| Figure 7-4. Smackover Stratigraphic
Column |
54 |
| Figure 7-5. Smackover Structure
Map |
55 |
| Figure 7-6. Exploration Program
Wells Cross Section |
56 |
| Figure 9-1. SWA Property Concentration
Data |
62 |
| Figure 9-2. Lithium Concentration
Map Based on Data Gathered by Standard Lithium |
63 |
| Figure 10-1. Upper Smackover
Well Data Source |
65 |
| Figure 10-2. Middle Smackover
Well Data Source |
66 |
| Figure 10-3. SWA Property Exploration
Program |
68 |
| Figure 10-4. Montague 1 Type
Well |
70 |
| South West Arkansas Project Pre-Feasibility Study | 18 Sept 23 |
| Figure 13-1. SWA
Lithium Brine Project Flowsheet Schematic |
83 |
| Figure 14-1. South West Arkansas
Field Smackover Type Well, Montague 1 |
105 |
| Figure 14-2. Core Data Plot |
106 |
| Figure 14-3. Porosity Log Calibration
to Core Data Plot |
106 |
| Figure 14-4. Porosity Log Net
Pay Example |
107 |
| Figure 14-5. Stratigraphic
Cross Section, Exploration Program Wells |
108 |
| Figure 14-6. Total Upper Smackover
Net Porosity-Thickness |
109 |
| Figure 14-7. Total Middle Smackover
Net Porosity-Thickness |
110 |
| Figure 16-1. Core Data Plot
with Permeability Data Fit and Equation |
118 |
| Figure 16-2. Supply Well Process |
119 |
| Figure 17-1. Overall Block
Flow Diagram of Lithium Hydroxide Production from Smackover Formation Brine |
122 |
| Figure 18-1. Brine Supply Multi-Well
Pad Conceptual Layout |
129 |
| Figure 18-2. Central Production
Facility Conceptual Layout |
132 |
| Figure 18-3. Brine Injection
Multi-Well Pad Conceptual Layout |
136 |
| Figure 19-1. Global Li-ion
Battery Cell Demand, GWh, Base Case |
140 |
| Figure 19-2. Lithium Supply
and Demand - Historical and forecast from 2020-2030 |
141 |
| Figure 19-3. Global Weighted
Average Lithium Hydroxide |
143 |
| Figure 19-4. Global Lithium
Price Forecast |
144 |
| Figure 21-1. CAPEX Breakdown |
161 |
| Figure 21-2. OPEX Breakdown |
173 |
| Figure 22-1. NPV Post Tax Sensitivity |
182 |
| Figure 22-2. IRR Post-Tax Sensitivity |
182 |
| Figure 23-1. Arkansas Regional
Activity |
185 |
| South West Arkansas Project Pre-Feasibility Study | 18 Sept 23 |
List
of Tables
| Table 1-1. SWA
Property Geologic Factors and Indicated Lithium Resource Estimates |
4 |
| Table 1-2. SWA Property Geologic
Factors and Inferred Lithium Resource Estimates |
4 |
| Table 1-3. Capital Cost Summary |
8 |
| Table 1-4. Operating Cost Summary |
9 |
| Table 1-5. Economic Evaluation
Summary |
11 |
| Table 2-1. Qualified Persons
and Their Responsibilities |
17 |
| Table 2-2. Abbreviations |
20 |
| Table 4-1. SWA Property Ownership
Summary |
29 |
| Table 9-1. SWA Property Lithium
Concentration Data |
60 |
| Table 10-1. Types of Well Data |
64 |
| Table 10-2. Well Actions Taken
During Exploration Program |
69 |
| Table 11-1. Comparison of Field
Duplicate Samples from the 2023 Sampling Program |
76 |
| Table 12-1. Comparison of Verification
Samples from the 2023 Sampling Program |
79 |
| Table 13-1. Representative
Brine Analyses and LiCl Product |
86 |
| Table 14-1. SWA Property Geologic
Factors and Indicated Lithium Resource Estimates |
111 |
| Table 14-2. SWA Property Geologic
Factors and Inferred Lithium Resource Estimates |
112 |
| Table 17-1. Raw Material Requirements |
127 |
| Table 18-1. Power Consumption
for the Brine Supply Well Facilities |
130 |
| Table 18-2. Estimated Brine
Supply and Sour Gas Pipeline Details |
131 |
| Table 18-3. Estimated Sour
Gas Disposal Pipeline Details |
134 |
| Table 18-4. Power Consumption
for the Brine Injection Well Facilities |
137 |
| Table 18-5. Estimated Effluent
Brine Pipeline Details |
138 |
| Table 20-1. Applicable Permits
and Schedule for SWA Project |
154 |
| South West Arkansas Project Pre-Feasibility Study | 18 Sept 23 |
| Table 21-1. Pipeline
Material Summary |
158 |
| Table 21-2. SWA Project Capital
Expenditure Cost Estimate |
160 |
| Table 21-3. Sustaining Capital |
162 |
| Table 21-4. Well Facilities
and Central Processing Plant Land Costs |
163 |
| Table 21-5. Manpower Cost Summary |
164 |
| Table 21-6. Annual Electrical
Use and Cost |
165 |
| Table 21-7. Average Annual
Reagents Cost For 30,000 Tonnes Lithium Hydroxide Per Year Production |
166 |
| Table 21-8. Natural Gas Use |
167 |
| Table 21-9. Maintenance &
Servicing Costs |
168 |
| Table 21-10. Solids Disposal |
169 |
| Table 21-11. TETRA Brine Lease
Agreement Summary |
171 |
| Table 21-12. Annual OPEX Summary |
172 |
| Table 22-1. Annual Operating
Cost Summary |
178 |
| Table 22-2. Economic Evaluation
– Case 1 (Base Case) Summary |
179 |
| Table 22-3. Sensitivity Analysis |
181 |
| Table 22-4. Economic Evaluation
– Case 2 (Alternative Upside Scenario) Summary |
184 |
| South West Arkansas Project Pre-Feasibility Study | 18 Sept 23 |
This Technical
Report has been commissioned by, and completed for, Standard Lithium Ltd. (Standard Lithium, or the Company); a public company with its
corporate headquarters in Vancouver, B.C. This report focuses on Standard Lithium’s greenfield development in southwest Arkansas
referred to as the South West Arkansas Project (SWA Project), which considers extraction of lithium produced from brine associated with
mineral leases acquired by TETRA Technologies Inc. (TETRA) under which Standard Lithium has an option agreement for the lithium.
This report outlines
Standard Lithium’s plans for the SWA Project, including how the lease acreage could be unitized in compliance with the Arkansas
Brine Statute (AR Code § 15-76-301) to facilitate production from the underlying Smackover Formation brine aquifer in conjunction
with the preparation of a Pre-Feasibility Study (PFS). This Technical Report updates and refines the findings and recommendations presented
in the 2021 Preliminary Economic Assessment (PEA). This PFS also outlines and updates the proposed method of extraction of the brine
from the resource while also presenting a more refined flowsheet to extract and purify the lithium to produce a marketable product.
| 1.2 | Property
Location and Ownership |
The center of the
SWA Project is located approximately 24 km (15 miles) west of the City of Magnolia in Lafayette County, southwestern Arkansas, United
States. The SWA Property encompasses Townships 16-17 South and Ranges 22-24 West of the 5th Meridian and lies wholly within
Lafayette and Columbia counties.
The SWA Property
is comprised of 489 land tracts containing 851 individual leases and eight salt water (brine) deeds that covers 27,066 net mineral acres
(10,953 net mineral hectares). The proposed unitized SWA Property encompasses 36,839 gross mineral acres (14,908 gross mineral hectares)
and forms the updated 2023 resource and project area.
The leases and
deeds are held by TETRA. TETRA began acquiring brine deeds and/or brine leases in 1992 and added additional brine leases in 1994, 2006
and 2017. Standard Lithium acquired the SWA Project brine production rights to lithium directly from TETRA through an option agreement
providing that Standard Lithium makes annual payments. At the time of writing, Standard Lithium is up to date with all required payments.
As of the date of this report, the process of unitization has not commenced and neither Standard Lithium nor TETRA have developed the
SWA Project brine leases and deeds for production of brine minerals.
| South West Arkansas Project Pre-Feasibility Study | 18 Sept 23 |
| 1.3 | Geology
and Mineralization |
The SWA Property
lithium deposit is a confined brine deposit in the form of a lithium-bearing brine contained within the porosity of the Smackover Formation
within the SWA Property boundaries. The Smackover Formation in southern Arkansas is commonly subdivided into three intervals, the Reynolds
Member Oolite (predominantly oolitic limestone), referred to in this report as the Upper Smackover, the Middle Smackover (a burrowed
pellet packstone), and the Brown Dense (dark, dense limestone), referred to in this report as the Lower Smackover. The lithium brine
resource, as reported, is contained within the Upper and Middle Members of the Smackover Formation (which underlie the entire Project
area). The Lower Smackover does not contribute to the resource estimates in this report, but is a future target for exploration.
The depth of the
top of the Smackover in the Property area generally dips from north-northeast to south-southwest and varies in depth from approximately
7,600 feet (2,316 meters) subsea to approximately 9,100 feet (2,773 meters) subsea. Brine has been extracted commercially from the Smackover
in southern Arkansas for approximately 60 years and is well understood.
The volume of in-place
lithium is proportional to the product of the brine-saturated pore volume and the lithium concentration, both of which are known with
reasonable accuracy, based on the drilling, logging, coring, and sampling data obtained throughout the property area. The data used to
estimate and model the resource were gathered from the five project specific wells described in Section 1.4 along with 424 existing
and suspended oil and gas production wells on or adjacent to the SWA Project and surface seismic information.
From February to
July in 2023 Standard Lithium conducted a five-well exploration program at the SWA Property. The exploration program design and
execution was supported by the QP’s Brush and Williams, including choice of well locations, data gathering plans, monitoring well
progress, advising on coring targets and procedures, and interpretation of results. This program included re-entry into three existing
abandoned wells (Taylor, Beulah et al 1, International Paper Co. 1, and Carter Moore 1) and drilling two all-new wells (Speer 1
and Montague 1). These five well locations were chosen to maximize the description of the geologic properties and lithium concentrations
within the Property. Figure 1-1 depicts the locations of those five wells and the observed maximum and average lithium concentrations.
In support of further project definition, up to three additional wells will be considered for the next phase to provide in-fill data
in support of a reserve classification.
| South West Arkansas Project Pre-Feasibility Study | 18 Sept 23 |
Figure 1-1. SWA
Project 2023 Exploration Program

| 1.5 | Updated
Mineral Resource Estimation |
The resource present
in the Smackover Formation below the SWA Project was updated based on the proposed unitized area encompassing 36,839 gross mineral acres
(14,908 gross mineral hectares). Using a conversion factor of 5.323 kg of lithium carbonate equivalent (LCE) per kg of lithium, the Indicated
Resource value corresponds to an estimate of 1,430 thousand metric tonnes LCE. For the Inferred Resource, the estimate is 392 thousand
metric tonnes LCE; see Table 1-1 and Table 1-2 below for more detail.
| South West Arkansas Project Pre-Feasibility Study | 18 Sept 23 |
Table 1-1. SWA
Property Geologic Factors and Indicated Lithium Resource Estimates
| | |
| Indicated
Resource | |
| Smackover
Formation | |
| North
Upper | | |
| South
Upper | | |
| Total
Upper | |
| Gross
Volume, km3 | |
| 4.69 | | |
| 2.80 | | |
| 7.49 | |
| Net
Volume, km3 | |
| 3.17 | | |
| 1.93 | | |
| 5.11 | |
| Average
Porosity | |
| 11.7 | % | |
| 11.9 | % | |
| 11.8 | % |
| Average
Lithium Concentration, mg/L | |
| 408 | | |
| 507 | | |
| 446 | |
| Indicated
Lithium Resource, Thousand Tonnes | |
| 152 | | |
| 116 | | |
| 269 | |
| LCE,
Thousand Tonnes | |
| 810 | | |
| 620 | | |
| 1,430 | |
Table 1-2. SWA
Property Geologic Factors and Inferred Lithium Resource Estimates
| | |
| Inferred
Resource | |
| Smackover
Formation | |
| North
Middle | | |
| South
Middle | | |
| Total
Middle | |
| Gross
Volume, km3 | |
| 6.04 | | |
| 2.98 | | |
| 9.02 | |
| Net
Volume, km3 | |
| 1.60 | | |
| 0.46 | | |
| 2.06 | |
| Average
Porosity | |
| 9.0 | % | |
| 8.1 | % | |
| 8.8 | % |
| Average
Lithium Concentration, mg/L | |
| 379 | | |
| 508 | | |
| 405 | |
| Inferred
Lithium Resource, Thousand Tonnes | |
| 55 | | |
| 19 | | |
| 74 | |
| LCE,
Thousand Tonnes | |
| 291 | | |
| 100 | | |
| 392 | |
| South West Arkansas Project Pre-Feasibility Study | 18 Sept 23 |
Notes
for Table 1-1 and Table 1-2:
1. Mineral
resources are not mineral reserves and do not have demonstrated economic viability. There is no guarantee that all or any part of the
mineral resource will be converted into a mineral reserve. The estimate of mineral resources may be materially affected by geology, environment,
permitting, legal, title, taxation, socio-political, marketing, or other relevant issues.
2. Numbers
may not add up due to rounding to the nearest 1,000 unit.
3. A
minimum lithium concentration cutoff was not applied in this analysis because the entirety of the SWA Property exceeds the previously
used 100 mg/L cutoff value.
4. The
resource estimate was developed and classified in accordance with guidelines established by the Canadian Institute of Mining and Metallurgy.
The associated Technical Report was completed in accordance with the Canadian Securities Administration’s National Instrument 43-101
and all associated documents and amendments. As per these guidelines, the resource was estimated in terms of metallic (or elemental)
lithium.
5. In
order to describe the resource in terms of ‘industry standard’ lithium carbonate equivalent, a conversion factor of 5.323
was used to convert elemental lithium to LCE.
The average lithium
concentrations used in the indicated resource calculation are 507 mg/L and 408 mg/L, for the South and North resource areas, respectively.
The updated 2023
SWA Project resource is 52% larger than the 2021 PEA resource estimate. The resource increase is primarily related to the higher concentration
of lithium, which increased in concentration from an overall average of 255 mg/L to 437 mg/L. Higher lithium concentrations offset a
reduction in brine volume associated with tightened and enhanced reservoir definition.
The resource will
be extracted using a network of brine supply wells and injection wells (which are required for pressure maintenance and are standard
throughout the Arkansas brine industry). The configuration of this well field has been determined using a finite difference computer
model based on the eight-layer geologic model developed for the resource categorization. The preliminary results of this model indicate
the SWA Property appears to be capable of producing greater than 30,000 metric tonnes per annum (tpa) of lithium hydroxide monohydrate
(the commercially sold form, also referred to as lithium hydroxide or hydroxide) for 20 years or more, and that production rates greater
than 35,000 metric tpa are probable with modifications to the assumed production and injection well count and configuration, given the
current understanding of the SWA Property’s geology and distribution of lithium.
| 1.7 | Recovery
Method and Mineral Processing |
Standard Lithium
have operated a Demonstration Plant, exclusively processing Smackover brine, since May 2020. This has provided a valuable source
of knowledge in regards to the behavior of the brine, testing of various flowsheet elements directly, and providing a test bed for operator
training. In addition, the Demonstration Plant has facilitated an ability to produce lithium chloride samples along with brine samples
from various stages of the flowsheet to support bench scale metallurgical testing, mini-pilot plant testing and vendor testing in support
of equipment design and process guarantees. The Demonstration Plant is located about 40 km (25 miles) east of the SWA Project and it
is the Company’s intent to continue to use the information obtained from the Demonstration Plant to aid in flowsheet development,
optimize lithium extraction and lithium chloride purification and to develop operations capability.
| South West Arkansas Project Pre-Feasibility Study | 18 Sept 23 |
The development
plan considered for the SWA Project PFS demonstrates production of battery-quality lithium hydroxide averaging 30,000 tpa over a 20-year
operating life. The Project will pump brine from the Smackover Formation aquifer via production wells, extract lithium from the brine,
convert it to a saleable product, and then reinject the effluent brine via injection wells to maintain pressure in the reservoir.
The PFS assumes
a network of 21 brine supply wells will be completed in the Smackover Formation, producing approximately 1,800 m3/hr or 7,925
US gallons per minute(gpm). Twenty-two injection wells will support pressure maintenance in the Smackover aquifer to maintain long-term
production.
Brine from the
supply wells will be routed to a lithium extraction and lithium hydroxide production facility by a network of underground fiberglass
pipelines. The brine entering the production facility will be pre-treated and then processed via Koch Technology Solutions’ Lithium
Selective Sorption (“LSS”) Direct Lithium Extraction (DLE) process. The lithium chloride extracted by the DLE has a significantly
higher relative concentration of lithium chloride relative to the other naturally occurring salts in the brine and is subsequently purified
and concentrated using industry proven and commercially established processes prior to conversion to lithium hydroxide via a modified
chlor-alkali process.
After lithium extraction,
the lithium-depleted, effluent brine will be returned to the resource area by a pipeline system to the network of brine injection wells.
The further concentrated
and purified lithium chloride solution will be processed by electrolyzers to form a high-purity lithium hydroxide solution. The Company
evaluated several technologies at laboratory and pilot scale testing to support the selection of electrolysis as the core technology
for conversion of lithium chloride to lithium hydroxide.
The testing undertaken
during the PFS phase produced battery-quality lithium hydroxide from Smackover brines processed through the Demonstration Plant, confirming
the viability of the process. The output solution from electrolysis will be crystalized into a solid, battery-quality lithium hydroxide
using standard, proven processes.
| South West Arkansas Project Pre-Feasibility Study | 18 Sept 23 |
The base case development
for the project as proposed will produce, on average, 30,000 tonnes of battery-quality lithium hydroxide per year, over a 20-year timeframe
with an upside production scenario of 35,000 tpa of lithium hydroxide production that was identified in July 2023 as a result of
the exploration assessment and resource evaluation outlined in Sections 9, 10, 14 and 16.
Although the potential
for further upside will be assessed further in the Feasibility Study phase, this PFS addresses the identified 35,000 tpa assessed as
a probable upside economic case.
| 1.8 | Capital
and Operating Cost Estimates |
| 1.8.1 | Capital
Expenditure Costs |
At full build-out,
with estimated average production over 20 years of 30,000 tpa of lithium hydroxide, the direct capital costs are estimated to be US$845
million, with indirect costs of US$218 million. A contingency of 20% was applied to direct costs (US$211 million) to yield an estimated
all-in capital cost of US$1.3 billion. A summary of the capital costs is provided in Table 1-3.
| South West Arkansas Project Pre-Feasibility Study | 18 Sept 23 |
Table
1-3. Capital Cost Summary
| Description | |
Direct
Costs Million US$[1] | | |
Indirect
Costs Million US$[2] | |
| Extraction
and Injection Well Field[3] | |
| 234.6 | | |
| 2.2 | |
| Pipelines[3] | |
| 60.5 | | |
| 7.1 | |
| Receiving/Pre-Treatment | |
| 118.4 | | |
| 48.2 | |
| Direct Lithium Extraction (LSS) | |
| 110.3 | | |
| 28.8 | |
| Purification & Concentration | |
| 110.8 | | |
| 42.8 | |
| Lithium Hydroxide Unit | |
| 121.5 | | |
| 36.8 | |
| Chemical Storage, Handling & Utilities | |
| 74.0 | | |
| 50.1 | |
| Plant Buildings | |
| 6.8 | | |
| 1.8 | |
| Sub-Total | |
| 837.0 | | |
| 217.9 | |
| Freight | |
| 8.0 | | |
| - | |
| Contingency | |
| 211.0 | [4] | |
| - | |
| CAPEX TOTAL | |
| US$1.27
billion | | |
| | |
Notes:
1. Direct costs were estimated using
either vendor-supplied quotes, and/or engineer estimated pricing (based on recent experience) for all major equipment. Major equipment
prices were scaled using appropriate AACE Class 4 Direct Cost Factors to derive all direct equipment costs.
2. Indirect costs were estimated using
AACE Class 4 Indirect Cost Factors. Indirect costs include all contractor costs (including engineering), indirect labor costs, and
Owner’s Engineer costs.
3. Exceptions to above costing estimate
methodology were the well field and pipelines, which were based on HGA’s recent project experience in the local area.
4. AACE Class 4 estimate includes
20% contingency on direct capital costs.
| 1.8.2 | Operating Expenditure Costs (OPEX) |
The operating cost estimate includes both direct
costs and indirect costs, as well as allowances for mine closure (see Table 1-4). The majority of the operating cost comprises electricity
usage including conversion to lithium hydroxide, as well as reagent usage required to extract the lithium from the brine. The all-in
operating cost is $5,229 per tonne of lithium hydroxide.
| South West Arkansas Project Pre-Feasibility Study | 18 Sept 23 |
Table 1-4. Operating Cost Summary
| Description | |
Operating
Cost US$/tonne Lithium Hydroxide[1] | |
| Workforce[2] | |
| 371 | |
| Electrical
Power[3] | |
| 1,291 | |
| Reagents
and Consumables[4] | |
| 1,158 | |
| Natural
Gas[5] | |
| 15 | |
| Maintenance/Waste
Disposal/Misc[6] | |
| 1,073 | |
| Indirect
Operational Costs[7] | |
| 168 | |
| Royalties[8] | |
| 741 | |
| Sustaining
Capital[9] | |
| 415 | |
| All-in OPEX Total | |
| 5,229 | |
Notes:
1. Operating costs are calculated based
on average annual production of 30,000 tonnes of lithium hydroxide.
2. Approximately 91 full time equivalent
(FTE) positions.
3. Approximately 30% of electrical
energy consumed by well field and pipelines; 70% by the processing facilities.
4. Majority of reagent costs are comprised
of sodium hydroxide and soda ash. Other reagents and consumables are air, hydrochloric acid, sodium metabisulfite, lime, membrane replacement,
nitrogen, and scale inhibitors for pumps/wellheads.
5. Assumes that all of the natural
gas is purchased from open market and none is co-produced at the wellheads.
6. Includes all maintenance and workover
costs and is based on experience in similar-sized electrochemical facilities, brine processing facilities, and Smackover Formation brine
production well fields.
7. Indirect costs (insurance, environmental
monitoring, etc.) are factored from other capital and operational costs, except for mine closure, which is based on known well-abandonment
costs.
8. Based on agreed royalties and expected
future lease costs. Does not include future lease-fees-in-lieu-of-royalties which are still to be determined and subject to regulatory
approval (lease-fees-in-lieu-of-royalties have been determined for bromine and certain other minerals in the State of Arkansas, but have
not yet been determined for lithium extraction).
9. Major equipment refurbishment and
replacement is categorized as sustaining capital. Sustaining Capital is shown included in the OPEX here to present an all-in annual operating
cost.
| South West Arkansas Project Pre-Feasibility Study | 18 Sept 23 |
The results for internal rate of return (IRR)
and net present value (NPV) from the assumed Capital Expenditure (CAPEX), Operating Expenditure (OPEX) and price scenario at full Base
Case production, are presented in Table 1-5.
In addition, the upside case of 35,000 tpa production
was assessed. To support this assessment, CAPEX costs are scaled based on a capacity factored estimate considering the increased production,
resulting in an estimated upside case CAPEX estimate of US$1.36 billion.
Operating costs were evaluated in two categories,
fixed and variable. Manpower was assumed to be a fixed cost based on the incremental sizing of the facility. Variable costs including
reagents, consumables and electrical usage were scaled linearly for the increased consumption. Other costs including maintenance and
miscellaneous costs were automatically adjusted as a percentage of the increased CAPEX resulting in an average annual OPEX cost of US$3,964/tonne.
The economic analysis for this upside scenario is presented in Table 1-5.
| South West Arkansas Project Pre-Feasibility Study | 18 Sept 23 |
Table 1-5. Economic Evaluation Summary
| Description | |
Units | |
Base
Case | | |
Upside
Case | |
| Average Annual Production
of Lithium Hydroxide | |
tpa[1] | |
| 30,000 | [2] | |
| 35,000 | [2] |
| Plant Operating Life | |
years | |
| 20 | | |
| 20 | |
| Total Capital Expenditures | |
Million US$ | |
| 1,274 | [3,4] | |
| 1,360 | [3,4] |
| Average Annual Operating Cost | |
US$/t | |
| 4,073 | | |
| 3,964 | |
| Average Annual All-in Operating
Cost | |
US$/t | |
| 5,229 | [5,6] | |
| 5,060 | [5,6] |
| Selling Price | |
US$/t | |
| 30,000 | [7] | |
| 30,000 | [7] |
| Discount Rate | |
% | |
| 8.0 | | |
| 8.0 | |
| Net Present Value (NPV) Pre-Tax | |
Million US$ | |
| 4,473 | | |
| 5,367 | |
| Net Present Value (NPV) After-Tax | |
Million US$ | |
| 3,090 | [8] | |
| 3,736 | [8] |
| Internal Rate of Return (IRR)
Pre-Tax | |
% | |
| 41.3 | | |
| 44.4 | |
| Internal Rate of Return (IRR)
After-Tax | |
% | |
| 32.8 | | |
| 35.4 | |
Notes: All model outputs are expressed
on a 100% project ownership basis with no adjustments for project financing assumptions.
1. Metric tonnes (1,000 kg) per annum.
2. Resource modelling work indicates
the SWA Property appears to be capable of producing more than 30,000 tpa of lithium hydroxide for 20 years or more, and that production
rates greater than 35,000 tpa are probable.
3. Capital Expenditures include 20%
contingency on total installed costs.
4. No inflation or escalation has
been carried for the economic modelling.
5. Includes all operating expenditures,
ongoing land costs, royalties, and sustaining capital.
6. Brine lease fees in-lieu-of-royalties
(to be approved by the Arkansas Oil and Gas Commission) have not been defined and are not currently included in the economic modelling.
7. Selling price of battery-quality
lithium hydroxide based on a flatline price of $30,000/t over total project lifetime.
8. Assumes a U.S. Federal tax rate
of 21% and State of Arkansas Tax rate of 5.1%, as well as variable property taxes.
A sensitivity analysis for the project indicates
that the economics remain robust even under the downside scenarios of a 20% increased CAPEX, a 20% reduced product selling price, a 5,000
tpa reduced production output, or a 20% increased OPEX.
| South West Arkansas Project Pre-Feasibility Study | 18 Sept 23 |
Standard Lithium successfully executed a five-well
exploration program that significantly improved the geologic description of the target Smackover Formation. The program addressed the
three key factors that determine the quality of the resource: the total volume of brine based on core and log porosity data, the brine’s
lithium concentration based on the analysis of multiple brine samples from the wells, and the productivity of the formation based on
the core permeability data collected. Both QP Brush and QP Williams were closely involved with all aspects of the exploration program,
including selecting the well locations; designing the coring, logging, and sampling programs; attending the coring and sampling of the
wells; and analyzing the resulting data. In the opinion of QP Brush and QP Williams, the resulting data and analyses fully support the
conclusion that the inferred and indicated resources present at the SWA Property are of sufficient quality to justify pursuit of a lithium
extraction project at the site.
| 1.10.2 | Mineral Processing work |
Because continuous start-to-finish DLE (without
the use of evaporation ponds) is not yet commercially proven, test work becomes especially critical to reduce process and scale-up risks.
The test work needs to be conducted over a reasonable period of time and at a suitable scale-up factor. The Demonstration Plant operation
has achieved both these objectives. In addition, the equipment operated in the Demonstration Plant has shown reliability in terms of
having the required availabilities for stable process operation. The process control and chemical analysis applied in the Demonstration
Plant have provided a solid foundation for reliable results.
The LSS DLE process has been run over many months,
demonstrating consistency of results and its applicability for the SWA project. For further effective optimization and applicability
for the Definitive Feasibility Study (DFS), the LSS DLE process needs to be run on actual SWA brine for a long-term, continuous test.
The conversion of a lithium chloride solution
to a lithium hydroxide solution using electrolysis has been shown to be the process route with the least process risk, mainly because
it is based, to a large extent, on the commercially proven chlor-alkali process. The approach taken by Standard Lithium to develop this
process route has been appropriate for the PFS stage of the project. During the DFS, Standard Lithium should focus on further reducing
the process risk. This can be accomplished by longer testing and by larger scale testing.
| South West Arkansas Project Pre-Feasibility Study | 18 Sept 23 |
| 1.11 | Key Study Recommendations |
The recommended next steps for Standard Lithium
to elevate the SWA Project to a higher level of resource classification and project definition are to:
| · | Further
develop the reservoir model in support of development of an optimized well plan and brine
production profile. |
| · | Develop
and optimize the flowsheet using the Demonstration Plant with a target of additional optimization.
For example, review and optimize the process such that the reagent usage can be minimized
and solid-waste generation from the process can be substantially reduced or eliminated. |
| · | Continue
optimization of the LSS DLE to improve the quality of the raw LiCl solution by elimination
of impurities, including testing of new sorbents and adjustments to operating parameters. |
| · | Conduct
all additional necessary engineering and feasibility studies (i.e. FEED level engineering
definition) to integrate the project development findings into an updated resource classification
and DFS. |
| · | Continue
testing of electrolytic conversion of lithium chloride to lithium hydroxide in support of
development of engineering inputs for design. |
| · | Undertake
a logistics study to assess road versus rail for supply of reagents and for export of products
during the next project phase. |
| · | Complete
any necessary process equipment vendor testing for lithium hydroxide concentration and evaporation/crystallization
to a battery-quality product. |
| · | Identify
long lead items that impact project schedule and develop procurement packages and strategy
to facilitate potential opportunity for early purchasing in support of optimizing the project
execution schedule. |
| · | Engage
with AOGC to support definition of royalty for lithium production from brine in Arkansas
in support of detailed understanding of project economics. |
| · | Continue
to engage with the local electrical supplier Southwest Arkansas Electric Cooperative to continue
to work through the interconnection requirements and ensure timeliness of power availability
for the project. |
| · | The
project as it is currently envisaged does not trigger a National Environmental Policy Act
(NEPA) process, however the NEPA process would be triggered if federal funds are obtained
for the project. It is recommended to pro-actively assess NEPA requirements and initiate
key activities to facilitate flexibility in project financing. |
| · | Drill
additional test wells targeting the Upper, Middle, and Lower Smackover to provide: |
| South West Arkansas Project Pre-Feasibility Study | 18 Sept 23 |
| o | Long term production test information to
estimate well rates, the number of wells needed, facility rates, and the completion plans
for those wells; |
| o | Information regarding the potential extent
of a Lower Smackover development target; and, |
| o | Information regarding the benefit of well
stimulation to well productivity. |
| o | Monitor the test wells for salt precipitation,
evaluate the potential effect of salt precipitation on production operations, identify remediation
options. |
| o | Conduct long term production tests on one
or more of the 2023 exploration program wells; decide on scope of these tests based on the
results of the new test wells. |
| · | Update
the geologic description. |
| · | Revise
and adjust the categories of the resource estimates. |
| · | Revise
the simulation model input geologic description and optimize the SWA Property development
plan, brine flow rate, well count, and well configuration. |
| South West Arkansas Project Pre-Feasibility Study | 18 Sept 23 |
This Technical Report has been commissioned by,
and completed for, Standard Lithium Ltd. (Standard Lithium, or the Company); a public company with its corporate headquarters in Vancouver,
B.C. Standard Lithium is focused on unlocking the lithium potential from brine. As such, Standard Lithium has established ‘brine
access agreements’ with historically/presently permitted and active brine operators that include:
| · | TETRA
Technologies Inc. (TETRA) and National Chloride Company of America (National Chloride) in
the Mojave Desert of California (Standard Lithium’s Bristol and Cadiz Dry Lakes play
lithium-brine projects). |
| · | Lanxess
Corporation (Lanxess) in the Smackover Formation of south-central Arkansas (Standard Lithium’s
LANXESS Project Phase 1A). |
| · | TETRA
in the Smackover Formation of southwestern Arkansas (Standard Lithium’s South West
Arkansas (SWA) Project and the focus of this Technical Report). |
The center of the SWA Property is located approximately
24 km (15 miles) west of the City of Magnolia in Lafayette County, Arkansas, United States (Figure 2-1). The SWA Property encompasses
Townships 16-17 South and Ranges 22-24 West of the 5th Meridian.
The SWA Property comprises 851 brine leases and
8 salt water (brine) deeds from private mineral owners covering 27,066 net mineral acres (10,953 net mineral hectares).
At the SWA Project, which is the focus of this
report, Standard Lithium has outlined how it could unitize the underlying Smackover Formation brine aquifer in conjunction with the preparation
of a PFS. This Technical Report updates the 2021 Preliminary Economic Assessment report and applies a gross acreage with 100% brine ownership
that is consistent with unitization within the Arkansas Brine Statute. This PFS also outlines a proposed method of extraction of the
brine from the resource, a proposed flowsheet to extract and purify the lithium to potentially produce a marketable product, as well
as other necessary SWA Project information.
| South West Arkansas Project Pre-Feasibility Study | 18 Sept 23 |
Figure 2-1. SWA Project discussed in this Technical
Report

Consequently, this Technical Report provides
an updated 2023 mineral resource estimate at the SWA Project in accordance with the Canadian Securities Administration’s (CSA’s)
National Instrument 43-101 (NI 43-101) with the mineral resource being estimated using the CIM “Estimation of Mineral Resources
and Mineral Reserves Best Practice Guidelines” dated November 29th, 2019, the CIM “Definition Standards for
Mineral Resources and Mineral Reserves” amended and adopted May 10th, 2014 and the CIM "Leading Practice Guidelines
for Mineral Processing" adopted November 25th, 2022. The effective date of this Technical Report is August 8, 2023.
| South West Arkansas Project Pre-Feasibility Study | 18 Sept 23 |
| 2.2 | Technical Report Authors and Personal
Inspection of Property |
Table 2-1 presents the list of Qualified Persons
(QPs) for the Technical Report and their responsibilities.
Table 2-1. Qualified Persons and Their Responsibilities
| Qualified Person | |
Company | |
Sections | |
| Frank Gay, P.E. | |
HGA | |
1-6,
18-19, 22-27 | |
| Marek Dworzanowski, EUR ING, CEng | |
N/A | |
1,
13, 17, 18, 21-22, 25, 26 | |
| Randal M. Brush, P.E. | |
Cobb & Associates | |
1,
7-12, 14, 16 | |
| Robert E. Williams, P.G., CPG | |
Cobb & Associates | |
1,
7-12, 14, 16 | |
| Caleb Mutschler, P.E. | |
HGA | |
17.1-17.3,
17.5 | |
| Dutch Johnson, P.E. | |
HGA | |
17.4 | |
| Charles Campbell, P.E. | |
Alliance Technical Group | |
20 | |
Notes:
1. N/A denotes not applicable.
2. Marek Dworzanowski operates as an independent
contractor.
In accordance with the CIM Best Practice Guidelines
for Resource and Reserve Estimation for Lithium Brines (1 November 2012), this lithium-brine PFS has been prepared by a multi-disciplinary
team that includes geologists, hydrogeologists, chemical, process and civil engineers with relevant experience in the lithium-brine confined
aquifer type deposits, Smackover Formation geology and brine processing.
Mr. Caleb Mutschler (HGA) and Mr. Marek
Dworzanowski visited the existing Standard Lithium Demonstration Plant in El Dorado, AR on October 27, 2022 and November 14-15,
2022 respectively to inspect the LSS equipment in service and verify the process conditions and technology. Mr. Dworzanowski also
inspected the electrolysis process on January 18-19, 2023 at Electrosynthesis Company, Inc. in Lancaster, NY.
| South West Arkansas Project Pre-Feasibility Study | 18 Sept 23 |
Mr. Robert Williams (Cobb & Associates)
visited the Standard Lithium Project site April 19, May 23, and June 1, 2023, and participated in sampling three different
wells (Taylor, Beulah et al 1, Carter Moore 1, and International Paper Company 1, respectively).
Randal Brush (Cobb & Associates) visited
the Standard Lithium Project site on July 24, 2023, and inspected the Montague 1 well and the International Paper Co. 1 well.
All authors are independent of Standard Lithium
(and TETRA) and are QPs as defined by the CSA’s NI 43-101.
| 2.3 | Sources of Information |
This Technical Report is based, in part, on internal
company technical reports, maps, company letters, memoranda, public disclosure, and public information, as listed in the NI 43-101 Technical
Report Preliminary Economic Assessment of Southwest Arkansas Smackover Project (Eccles, et al., 2019).
This Technical Report is a compilation of publicly
available information, as well as information obtained from the 2018 and 2023 exploration programs. The 2018 exploration program included
core analysis and brine analytical test programs conducted by Standard Lithium at the SWA Property. The 2023 exploration program included
gathering and analyzing log data, core samples, pressure data, and brine samples from five wells: three were existing wells that were
re-entered; two were new wells drilled by Standard Lithium.
References in this Technical Report are made
to publicly available reports that were written prior to implementation of NI 43-101, including government geological publications. All
reports are cited in Section 27, References.
Government reports include those that provide:
| · | Smackover
Formation stratigraphic information; |
| · | Arkansas
policy and regulation; |
| · | Produced
water geochemistry; and, |
| · | Oil,
gas, and brine production statistics (e.g., Dickinson, 1968; Arkansas Code, 2016 a to f;
Blondes et al., 2018; Arkansas Geological Survey, 2018; AOG Commission, 2021 & 2022
a to b). |
Miscellaneous journal articles were used to set
the geological setting of southern Arkansas (e.g., Bishop, 1967; Alkin and Graves, 1969; Bishop, 1971a and b; Buffler et al., 1981; Moore
and Druckman, 1981; Moore, 1984; Harris and Dodman, 1987; Salvador, 1991a and b; Troell and Robinson, 1987; Kopaska-Merkel et al., 1992;
Moldovanyi and Walter, 1992; Zimmerman, 1992; Heydari and Baria, 2005; Mancini et al., 2008). Company information and news releases were
used to reference any historical mineral exploration work at the SWA Property (e.g., Standard Lithium Ltd., 2018a and b).
| South West Arkansas Project Pre-Feasibility Study | 18 Sept 23 |
Geochemical data collected in 2018 presented
in the previous revision of this Technical Report were analyzed at independent and accredited laboratories: ALS-Houston Environmental
Services (ALS-Houston) in Houston, Texas, and Western Environmental Testing Laboratory (WetLab) in Sparks, Nevada. Geochemical data collected
in 2023 presented in this Technical Report were analyzed at WetLab. Historical Smackover Formation brine geochemical data from a peer
reviewed journal were also used (Moldovanyi and Walter, 1992).
Historic well log data and well status information
used to create the layered geologic model was obtained from TGS and IHS, two companies that supply well log and well status information
to the petroleum and bromine industry. Historical geotechnical data presented in this Technical Report include core reports that were
prepared by independent petroleum laboratories and engineering firms that include:
| · | Core
Laboratories Inc. in Dallas, TX and Shreveport, LA; |
| · | Delta
Core Analysts in Shreveport, LA; |
| · | All
Points Inc. in Houston, TX; |
| · | Thigpen
Core Laboratories, Inc. in Shreveport, LA; |
| · | O’Malley
Laboratories, Inc. in Natchez, Miss; and |
| · | Bell
Core Laboratories in Shreveport, LA. |
The geotechnical data collected in the 2023 exploration
program include core reports prepared by these independent petroleum laboratories and engineering firms:
| · | Intertek
Westport Technology Center in Houston, TX; and, |
| · | Delta
Core Analysts in Shreveport, LA. |
The laboratories and engineering firms are independent
and certified third-party consultants and/or include certified Professional Geologists or Engineers. The geochemical laboratories for
the brine samples collected in 2018 and 2023 cite National and State accreditations (e.g., ISO/IEC 17025:2005; 2009 TNI Environmental
Testing Laboratory Standard; DoD Environmental Laboratory Accreditation Program (DoD ELAP); ISO/IEC Guide 25-1990; NAC 445A). Historical
brine analytical data originated from a peer reviewed journal (American Association of Petroleum Geologist Bulletin) and is considered
a reputable source of information (Moldovanyi and Walter, 1992).
| South West Arkansas Project Pre-Feasibility Study | 18 Sept 23 |
| 2.4 | Units of Measure, Currency, and
Acronyms |
With respect to units of measure and currency,
unless otherwise stated, this Report uses:
| · | Abbreviated
shorthand consistent with the International System of Units (International Bureau of Weights
and Measures, 2006); |
| · | ‘Bulk’
weight is presented in both metric and imperial units. Metric is presented as tonnes and
is equivalent to 1,000 kg or 2,204.6 lbs. Imperial is United States short tons which is presented
as tons and is equivalent to 2,000 lbs or 907.2 kg; |
| · | Geographic
coordinates projected in the Universal Transverse Mercator (UTM) system relative to Zone
15 of the North American Datum (NAD) 1983; |
| · | Currency
in U.S. dollars (USD$), unless otherwise specified (e.g., Canadian dollars, CDN$; Euros,
€); |
| · | Key
well field dimensions such as well depth, reservoir depth and casing sizes will be presented
using standard oil field units as the primary unit of measure with SI units in brackets;
and, |
| · | Brine
leases and surface leases are presented in acres to maintain consistency with Arkansas brine
leases and property legal descriptions. |
| · | Lithium
hydroxide or hydroxide refer to lithium hydroxide monohydrate which is the commercially sold
form of lithium. |
Table 2-2 describes the various abbreviations
used in the Technical Report.
Table 2-2. Abbreviations
| Abbreviation | |
Description |
| mm | |
Micrometers |
| AACE | |
American Association of Cost
Engineers |
| ADEE | |
Arkansas Department of Energy
and Environment |
| ADEE-AOGC | |
Arkansas Department of Energy
and Environment Arkansas Oil & Gas Commission |
| ADEE-DEQ | |
Arkansas Department of Energy
and Environment Division of Environmental Quality |
| ADH | |
Arkansas Department of Health |
| AOGC | |
Arkansas Oil and Gas Commission |
| ASTM | |
American Society for Testing
and Materials |
| South West Arkansas Project Pre-Feasibility Study | 18 Sept 23 |
| Abbreviation | |
Description |
| BFD | |
Block Flow Diagram |
| BOE | |
Basis of Estimate |
| CAPEX | |
Capital Expenditure |
| CIM | |
Canadian Institute of Mining |
| CIT | |
Corporate Income Tax |
| CPF | |
Central Processing Facility |
| CSA | |
Canadian Securities Administration |
| DCF | |
Discounted Cash Flow |
| DLE | |
Direct Lithium Extraction |
| EA | |
Environmental Assessment |
| EPA | |
Environmental Protection
Agency |
| ESP | |
Electric Submersible Pump |
| ESS | |
Energy Storage Systems |
| EVs | |
Electric Vehicles |
| GPM | |
US Gallons per Minute |
| GWh | |
Gigawatt-hour |
| H2S | |
Hydrogen Sulfide |
| HDPE | |
High Density Polyethylene |
| HPRO | |
High Pressure Reverse Osmosis |
| ICE | |
Internal Combustion Engine |
| ICP-OES | |
Inductively Coupled Plasma
Optical Emission Spectroscopy |
| IRR | |
Internal Rate of Return |
| ISBL | |
Inside Boundary Limit |
| South West Arkansas Project Pre-Feasibility Study | 18 Sept 23 |
| Abbreviation | |
Description |
| IX | |
Ion Exchange |
| LCE | |
Lithium Carbonate Equivalent |
| Li2CO3 | |
Lithium Carbonate |
| Li2O | |
Lithium Oxide |
| LiOH | |
Lithium Hydroxide |
| LiOH.H2O | |
Lithium Hydroxide Monohydrate |
| LiSTR | |
Lithium Stirred Tank Reactor |
| LSS | |
Lithium Selective Sorption |
| m3 | |
Cubic Meter |
| MCC | |
Motor Control Center |
| mD | |
Millidarcies |
| mg/L | |
Milligrams per litre |
| MKP | |
McKamie-Patton |
| MMBTU | |
Million British Thermal Units |
| MW | |
Megawatts |
| MWh | |
Megawatt-hour |
| NAD | |
North American Datum |
| NI 43-101 | |
National Instrument 43-101 |
| NPDES | |
National Pollutant Discharge
Elimination System |
| NPV | |
Net Present Value |
| OARO | |
Osmotically Assisted Reserve
Osmosis |
| OPEX | |
Operating Expenditure |
| PEA | |
Preliminary Economic Assessment |
| South West Arkansas Project Pre-Feasibility Study | 18 Sept 23 |
| Abbreviation | |
Description |
| PFD | |
Process Flow
Diagram |
| PFS | |
Pre-Feasibility Study |
| ppm | |
Parts Per Million |
| psi | |
Pounds per square inch |
| QA/QC | |
Quality Assurance/Quality
Control |
| QP(s) | |
Qualified Person(s) |
| RCRA | |
Resource Conservation and
Recovery Act |
| RO | |
Reverse Osmosis |
| ROW | |
Right-of-Way |
| RPD | |
Relative Percentage Difference |
| SM | |
Standard Methods |
| SX | |
Solvent Extraction |
| TDS | |
Total Dissolved Solids |
| TEC | |
Total Equipment Cost |
| TIC | |
Total Installed Cost |
| TPC | |
Total Plant Cost |
| UIC | |
Underground Injection Control |
| USACE | |
U. S. Army Corps of Engineers |
| USGS | |
United States Geological
Survey |
| UTM | |
Universal Transverse Mercator |
| WetLab | |
Western Environmental Testing
Laboratory |
|
| South West Arkansas Project Pre-Feasibility Study | 18 Sept 23 |
| 3 | Reliance on Other Experts |
The authors are not qualified to provide an opinion
or comment on issues related to legal agreements and royalties. They have relied entirely on background information and details regarding
the nature and extent of TETRA’s Land Titles. The author has not reviewed the approximately 851 leases and 8 salt water (brine)
deeds owned by TETRA or the transactional agreement between Standard Lithium and TETRA (and/or the agreement between TETRA and the underlying
landowners) to obtain mineral brine production rights. The legal and survey validation of the leases and brine rights is not in our expertise,
and we are relying on Standard Lithium and TETRA’s land-persons and lawyers.
The QP of Section 4 has no reason to question
the validity or good standing of the TETRA leases and brine deeds through which Standard Lithium is gaining access to brine for process
test work.
QP Frank Gay has not visited the South West Arkansas
Property, and is relying on the QPs of the sections relevant to the Property and the testing work having made site visits.
| South West Arkansas Project Pre-Feasibility Study | 18 Sept 23 |
| 4 | Property Description and Location |
| 4.1 | Property Description and Location |
The SWA Property encompasses Townships 16-17
South and Ranges 22-24 West of the 5th Meridian. The center of SWA Project is located approximately 24 km (15 miles) west
of the City of Magnolia in Lafayette and Columbia Counties, Arkansas, United States. Coordinates for the Property center are:
| · | Latitude
33.2843 and Longitude -93.5135; or |
| · | Universal
Transverse Mercator 452185.15 Easting, 3682922.78 Northing, Zone 15N, North American Datum
83 (Figure 4-1). |
The SWA Property consists of 27,066 net mineral
acres (10,953 net mineral hectares) and covers a surface area of approximately 110 km2 (42 square miles) and is comprised
of 489 land tracts containing 851 individual leases and 8 salt water (brine) deeds from private mineral owners, as illustrated in Figure
4-2. The proposed unitized area encompasses the individual leases and consists of 36,839 gross mineral acres (14,908 gross mineral hectares)
(see Table 4-1).
| 4.2 | Lithium-Brine Mineral Production
Rights |
Standard Lithium acquired the SWA Project brine
rights to produce lithium from TETRA through an option agreement. As part of the agreement between Standard Lithium and TETRA, Standard
Lithium owns the ‘lithium-brine’ production rights within the SWA Property brine lease holding. The Standard Lithium-TETRA
agreement and a summary of the leases and deeds are discussed in more detail in the following sub-sections.
| South West Arkansas Project Pre-Feasibility Study | 18 Sept 23 |
Figure 4-1. SWA Project discussed in this Technical
Report
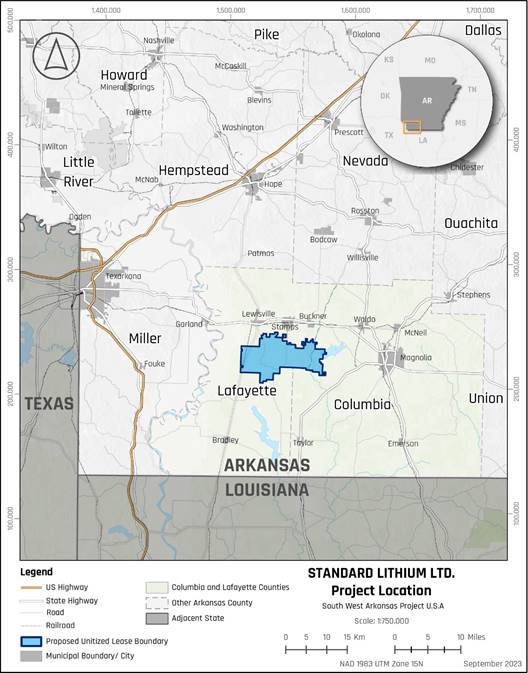
| 4.2.1 | Summary of the Standard Lithium
– TETRA Agreement |
Standard Lithium owns the rights to produce lithium
from TETRA’s brine leasehold for a period of 10-years (the exploratory period) through an option agreement providing that Standard
Lithium makes annual payments on the annual anniversary of the effective date (December 29, 2017) of the agreement with TETRA, as
follows:
| South West Arkansas Project Pre-Feasibility Study | 18 Sept 23 |
| · | US$500,000
before January 28, 2018 (paid) |
| · | An
additional US$600,000 on or before December 29, 2018 (paid) |
| · | An
additional US$700,000 on or before December 29, 2019 (paid) |
| · | An
additional US$750,000 on or before December 29, 2020 (paid) |
| · | Years
4-5: $1,000,000 per year (paid) |
| · | Years
6-10: $1,000,000 per year |
As of the writing of this report, the option
agreement is still in place and all required payments have been fulfilled. When Standard Lithium commences production of lithium or exercises
the option, Standard Lithium will pay TETRA a 2.5% royalty on gross revenue, and not less than $1,000,000 in any year, starting on the
date that Standard Lithium exercises the option.
| 4.2.2 | Summary of Salt Water (Brine)
Deeds |
In 1992, TETRA acquired the rights to 2,045 acres
in the form of eight salt water (Brine) Deeds. The brine deeds are a 35-year term conveyance of brine within the Smackover Formation
limestone. The initial brine deeds were executed from March 23 to April 29, 1992 and will expire in 2027 unless the term is
extended by agreement.
The Brine Deeds permit TETRA or its assignee
to produce brine attributable to its Grantor’s interest in the covered lands without royalty becoming due. Thus, with respect to
those Grantors’ brine interests, no delay rental or brine royalty payment is required, and no additional royalty will become due
upon commercial extraction of lithium. Instead, TETRA is obligated to make annual promissory note installment payments of $79,125, in
the aggregate, on promissory notes executed by TETRA in favor of the Grantor and its related parties. These notes provide for 35 annual
installments, coinciding with the term of the Brine Deed.
In 1994, TETRA implemented a brine leasing strategy
and added additional brine leases in 2006 and 2017-2018 bringing their total lease holdings to 802 leases at the Effective Date of the
PEA. Except for 3 leases with five-year terms dated 26 September 2018, representing 240 acres, each lease has a 25-year term, and
there is an attempt to renew or extend the leases prior to the expiration of the original 25-year term. Since the publishing of the PEA,
a campaign to maintain and increase the lease acreage in line with TETRA’s obligation under the option agreement was implemented
and the number of leases was increased to 934.
| South West Arkansas Project Pre-Feasibility Study | 18 Sept 23 |
Subsequently, 83 leases totaling 196 net mineral
acres have lapsed leaving a total of 851 leases at the effective date of this report. A summary of the leases in place at the effective
date of this report can be found in Table 4-1 and shown in Figure 4-2.
The SWA Property brine leases have yet to be
developed for production of brine minerals.
| 4.2.4 | Mineral Brine Right Distribution on Individual Leases |
In some instances, the property encompassed by
an individual brine lease may be very small, less than one acre, or much larger, up to several hundred acres. The percentage of brine
rights ownership varies from section to section. In some instances, the percentage of the area leased within an individual brine lease
may be small, less than 10%, or up to 100% ownership within any arbitrary section.
Overall, the lease ownership is complex, however,
Standard Lithium has conducted a due diligence compilation of the percentage ownership of the individual brine leases on a section-by-section
basis. That is, Standard Lithium engaged third-party firm R&J Land Services, LLC (R&J Land) of Bossier City, Louisiana to conduct
due diligence of TETRA title of the brine leases and salt water (brine) deeds.
Standard Lithium also retained Arkansas attorney,
Mr. Robert Honea, of Hardin, Jesson & Terry PLC of Fort Smith, AR regarded as having expertise in Arkansas State brine
as well as oil and gas law. Mr. Honea issued an opinion letter to Standard Lithium, prior to Standard Lithium signing the Option
Agreement with TETRA, after reviewing R&J Land’s review into the documentation of title to TETRA leasehold, confirming his
professional opinion that the title due diligence performed by R&J Land was reasonable. In July 2023, Tetra provided an updated
status report for the validity of leases. Standard Lithium engaged third-party firm R&J Land Services, LLC (R&J Land) of Bossier
City, Louisiana to review the original brine leases and the revised listing was subsequently confirmed as part of project specific due
diligence. The updated list from Tetra was confirmed to be valid and the leases identified as being in good-standing.
The resulting section-based mineral brine lease
percentage compilation is presented in Table 4-1 and Figure 4-2. To simplify the brine ownership for the purpose of reporting, TETRA
has amassed a mineral brine rights ownership that encompasses approximately 73% of the total mineral brine rights at the SWA Property,
of which, Standard Lithium has acquired the corresponding lithium-brine production rights as described in Section 4.2, Lithium Brine
Mineral Production Rights.
| South West Arkansas Project Pre-Feasibility Study | 18 Sept 23 |
Table 4-1. SWA Property Ownership Summary
| Township | | |
Range | | |
Section | | |
Net Acres
Leased | | |
Total Gross
acres
within Section | | |
Percentage
leased | |
| | 16 | | |
| 22 | | |
| 31 | | |
| 37.815 | | |
| 200 | | |
| 19 | % |
| | 16 | | |
| 23 | | |
| 19 | | |
| 80 | | |
| 80 | | |
| 100 | % |
| | 16 | | |
| 23 | | |
| 24 | | |
| 40 | | |
| 50 | | |
| 80 | % |
| | 16 | | |
| 23 | | |
| 25 | | |
| 80 | | |
| 80 | | |
| 100 | % |
| | 16 | | |
| 23 | | |
| 26 | | |
| 20 | | |
| 80 | | |
| 25 | % |
| | 16 | | |
| 23 | | |
| 29 | | |
| 192.5 | | |
| 195 | | |
| 99 | % |
| | 16 | | |
| 23 | | |
| 30 | | |
| 213.84 | | |
| 516.34 | | |
| 41 | % |
| | 16 | | |
| 23 | | |
| 31 | | |
| 610 | | |
| 640 | | |
| 95 | % |
| | 16 | | |
| 23 | | |
| 32 | | |
| 511.34 | | |
| 545 | | |
| 94 | % |
| | 16 | | |
| 23 | | |
| 33 | | |
| 267.013 | | |
| 335.36 | | |
| 80 | % |
| | 16 | | |
| 23 | | |
| 34 | | |
| 255.33 | | |
| 296.6 | | |
| 86 | % |
| | 16 | | |
| 23 | | |
| 35 | | |
| 192.58 | | |
| 499.33 | | |
| 39 | % |
| | 16 | | |
| 23 | | |
| 36 | | |
| 160 | | |
| 640 | | |
| 25 | % |
| | 16 | | |
| 24 | | |
| 25 | | |
| 586.66 | | |
| 640 | | |
| 92 | % |
| | 16 | | |
| 24 | | |
| 26 | | |
| 566.71 | | |
| 640 | | |
| 89 | % |
| | 16 | | |
| 24 | | |
| 27 | | |
| 36.67 | | |
| 40 | | |
| 92 | % |
| | 16 | | |
| 24 | | |
| 34 | | |
| 136.67 | | |
| 160 | | |
| 85 | % |
| | 16 | | |
| 24 | | |
| 35 | | |
| 593.68 | | |
| 640 | | |
| 93 | % |
| | 16 | | |
| 24 | | |
| 36 | | |
| 613.33 | | |
| 640 | | |
| 96 | % |
| | 17 | | |
| 22 | | |
| 5 | | |
| 407.5 | | |
| 640 | | |
| 64 | % |
| | 17 | | |
| 22 | | |
| 6 | | |
| 473.09 | | |
| 640 | | |
| 74 | % |
| | 17 | | |
| 22 | | |
| 7 | | |
| 640 | | |
| 640 | | |
| 100 | % |
| | 17 | | |
| 22 | | |
| 8 | | |
| 160 | | |
| 160 | | |
| 100 | % |
| | 17 | | |
| 22 | | |
| 17 | | |
| 276 | | |
| 280 | | |
| 99 | % |
| | 17 | | |
| 22 | | |
| 18 | | |
| 560 | | |
| 640 | | |
| 88 | % |
| | 17 | | |
| 22 | | |
| 19 | | |
| 320.5 | | |
| 320.5 | | |
| 100 | % |
| | 17 | | |
| 22 | | |
| 20 | | |
| 357.5 | | |
| 400 | | |
| 89 | % |
| | 17 | | |
| 23 | | |
| 1 | | |
| 31.27 | | |
| 640 | | |
| 5 | % |
| | 17 | | |
| 23 | | |
| 2 | | |
| 405 | | |
| 640 | | |
| 63 | % |
| | 17 | | |
| 23 | | |
| 3 | | |
| 556.92 | | |
| 640 | | |
| 87 | % |
| | 17 | | |
| 23 | | |
| 4 | | |
| 270.64 | | |
| 640 | | |
| 42 | % |
| | 17 | | |
| 23 | | |
| 5 | | |
| 351.5 | | |
| 640 | | |
| 55 | % |
| | 17 | | |
| 23 | | |
| 6 | | |
| 554.17 | | |
| 640 | | |
| 87 | % |
| | 17 | | |
| 23 | | |
| 7 | | |
| 498.83 | | |
| 640 | | |
| 78 | % |
| | 17 | | |
| 23 | | |
| 8 | | |
| 541.04 | | |
| 640 | | |
| 85 | % |
| | 17 | | |
| 23 | | |
| 9 | | |
| 429.51 | | |
| 640 | | |
| 67 | % |
| | 17 | | |
| 23 | | |
| 10 | | |
| 308.19 | | |
| 640 | | |
| 48 | % |
| South West Arkansas Project Pre-Feasibility Study | 18 Sept 23 |
| Township | | |
Range | | |
Section | | |
Net Acres
Leased | | |
Total Gross
acres
within Section | | |
Percentage
leased | |
| | 17 | | |
| 23 | | |
| 11 | | |
| 140 | | |
| 640 | | |
| 22 | % |
| | 17 | | |
| 23 | | |
| 12 | | |
| 315 | | |
| 640 | | |
| 49 | % |
| | 17 | | |
| 23 | | |
| 13 | | |
| 450 | | |
| 640 | | |
| 70 | % |
| | 17 | | |
| 23 | | |
| 14 | | |
| 573.8 | | |
| 600 | | |
| 96 | % |
| | 17 | | |
| 23 | | |
| 15 | | |
| 368.32 | | |
| 478.32 | | |
| 77 | % |
| | 17 | | |
| 23 | | |
| 16 | | |
| 409.38 | | |
| 640 | | |
| 64 | % |
| | 17 | | |
| 23 | | |
| 17 | | |
| 585.46 | | |
| 640 | | |
| 91 | % |
| | 17 | | |
| 23 | | |
| 18 | | |
| 570.83 | | |
| 640 | | |
| 89 | % |
| | 17 | | |
| 23 | | |
| 19 | | |
| 207.497 | | |
| 640 | | |
| 32 | % |
| | 17 | | |
| 23 | | |
| 24 | | |
| 125 | | |
| 165 | | |
| 76 | % |
| | 17 | | |
| 23 | | |
| 31 | | |
| 14.92 | | |
| 40 | | |
| 37 | % |
| | 17 | | |
| 24 | | |
| 1 | | |
| 561.489 | | |
| 640 | | |
| 88 | % |
| | 17 | | |
| 24 | | |
| 2 | | |
| 548.634 | | |
| 640 | | |
| 86 | % |
| | 17 | | |
| 24 | | |
| 3 | | |
| 457.951 | | |
| 640 | | |
| 72 | % |
| | 17 | | |
| 24 | | |
| 4 | | |
| 453.345 | | |
| 640 | | |
| 71 | % |
| | 17 | | |
| 24 | | |
| 5 | | |
| 562.46 | | |
| 640 | | |
| 88 | % |
| | 17 | | |
| 24 | | |
| 8 | | |
| 397.95 | | |
| 640 | | |
| 62 | % |
| | 17 | | |
| 24 | | |
| 9 | | |
| 416.025 | | |
| 640 | | |
| 65 | % |
| | 17 | | |
| 24 | | |
| 10 | | |
| 594.76 | | |
| 640 | | |
| 93 | % |
| | 17 | | |
| 24 | | |
| 11 | | |
| 627.58 | | |
| 640 | | |
| 98 | % |
| | 17 | | |
| 24 | | |
| 12 | | |
| 623.87 | | |
| 640 | | |
| 97 | % |
| | 17 | | |
| 24 | | |
| 13 | | |
| 638 | | |
| 638 | | |
| 100 | % |
| | 17 | | |
| 24 | | |
| 14 | | |
| 525.48 | | |
| 640 | | |
| 82 | % |
| | 17 | | |
| 24 | | |
| 15 | | |
| 535.78 | | |
| 640 | | |
| 84 | % |
| | 17 | | |
| 24 | | |
| 16 | | |
| 582.5 | | |
| 640 | | |
| 91 | % |
| | 17 | | |
| 24 | | |
| 17 | | |
| 640 | | |
| 640 | | |
| 100 | % |
| | 17 | | |
| 24 | | |
| 20 | | |
| 290.846 | | |
| 640 | | |
| 45 | % |
| | 17 | | |
| 24 | | |
| 21 | | |
| 441.53 | | |
| 640 | | |
| 69 | % |
| | 17 | | |
| 24 | | |
| 22 | | |
| 498 | | |
| 640 | | |
| 78 | % |
| | 17 | | |
| 24 | | |
| 23 | | |
| 614.3 | | |
| 640 | | |
| 96 | % |
| | 17 | | |
| 24 | | |
| 24 | | |
| 452.71 | | |
| 640 | | |
| 71 | % |
| | 17 | | |
| 24 | | |
| 25 | | |
| 20 | | |
| 40 | | |
| 50 | % |
| | 17 | | |
| 24 | | |
| 26 | | |
| 206.39 | | |
| 320 | | |
| 64 | % |
| | 17 | | |
| 24 | | |
| 35 | | |
| 240 | | |
| 240 | | |
| 100 | % |
| | 17 | | |
| 24 | | |
| 36 | | |
| 40 | | |
| 640 | | |
| 6 | % |
| | Total | | |
| 27,065.61 | | |
| 36,839.45 | | |
| 73.469 | % |
| South West Arkansas Project Pre-Feasibility Study | 18 Sept 23 |
Figure 4-2. SWA Property Ownership Summary

| 4.3 | Surface (and Mineral) Rights in Arkansas |
The definition of minerals is established by
Arkansas Code Title 15, Natural Resources and Economic Development § 15-56-301 (the Brine Statue), which has been amended to include
salt water, or brine, “whose naturally dissolved components or solutes are used as a source of raw material for Bromine and
other products derived therefrom." The mineral interest owner has the inherent right to develop the minerals and the right to
lease the minerals to others for development. When a company desires to develop the mineral resources in an area, the company will need
to secure mineral lease agreements from the mineral owners. The mineral lease is a legal binding contract between the mineral owner (Lessor)
and an individual or company (Lessee), which allows for the exploration and extraction of the minerals covered under the lease.
| South West Arkansas Project Pre-Feasibility Study | 18 Sept 23 |
Payments made to the Lessor for production of
brine are known as “in lieu” royalty payments because the payments are made annually based on a statutory rate, as opposed
to a true royalty based on the amount of the produced brine. The statutory in lieu royalty payment is increased or decreased annually
based on changes in the Producer Price Index.
The Brine Deeds permit TETRA or its assignee
to produce brine attributable to its Grantor’s interest in the covered lands without royalty becoming due. Thus, with respect to
those Grantors’ brine interests, no delay rental or brine royalty payment is required, and no additional royalty will become due
upon commercial extraction of Lithium. Instead, TETRA is obligated to make annual promissory note installment payments of $79,125, in
the aggregate, on promissory notes executed by TETRA in favor of the Grantor and its related parties. These notes provide for 35 annual
installments, coinciding with the term of the Brine Deed. TETRA is also required to pay annual rental of $100 each to the two surface
owners who leased the surface right of ingress and egress to TETRA in documents called “Landowner Agreements.”
With respect to surface rights, Arkansas law
allows the severance of the surface estate from the mineral estate by proper grant or reservation, thereby creating separate estates.
Under the laws of conservation in the State of Arkansas, however, the mineral rights are dominant over the surface rights. In some cases,
when the mineral owner leases the right to produce oil, gas and/or brine, the Lessee succeeds to the mineral owner’s right of surface
use, subject to lease restrictions. Authority of the mineral estate over the surface is a crucial legal concept for the mineral owner
and Lessee because ownership of subsurface minerals without the right to use the surface to explore for and produce them would be practically
worthless. If a Lessor does not want the land surface disturbed a “No Surface Operations Clause” may be negotiated with the
Lessee and included in the mineral Lease agreement. This clause may be used to limit or restrict the use of the property for drilling
activity or long-term production operations. Conflicts arising between the Lessee and surface owner can be avoided by creating Lease
agreements that clearly identify the scope of surface use rights.
| South West Arkansas Project Pre-Feasibility Study | 18 Sept 23 |
The Lessee holding the Lease has a legal authority
to enter the property for exploration and production even if the non-mineral owning surface owner objects to the intrusion on the property.
That does not mean the surface owner will be without compensation. The amount and type of compensation is strictly a matter of negotiation
between the surface owner and the company entering the property. If mutual agreement cannot be reached, the surface owner always has
the right to seek the advice of an attorney and relief through the court system.
In the State of Arkansas when a person sells
a piece of property the mineral rights automatically transfer with the surface rights, unless otherwise stated in the deed.
The Arkansas Brine Statute (AR Code § 15-76-301)
was adopted by the Arkansas General Assembly in 1979 in response to expanding brine operations in southern Arkansas. Under the statute,
the AOGC can authorize brine production units that contain one or more production/injection wells within a set amount of acreage to 1)
provide a more efficient regulatory structure for the production of brine, 2) to protect the correlative rights of all mineral interest
owners in the unit, and 3) to insulate brine operators from claims of trespass from adjacent mineral interest owners. Under the Brine
Statute, brine owners are paid an annual amount known as an “in lieu royalty” based on a specific formula in the Brine Statute
which is subject to annual adjustments under the applicable Producer Price Index.
Standard Lithium has contemplated how it might
approach unitizing the underlying Smackover Formation brine aquifer in conjunction with the preparation of this PFS report. The unitized
SWA Property encompasses 36,839 gross mineral acres (14,908 gross mineral hectares) and forms the updated resource and project area.
NOTE, Standard Lithium has NOT
commenced the unitization process; the exercise described herein is an attempt to estimate the potential integrated lithium brine resource
if Standard Lithium’s existing project leasehold area were to be unitized in the future for production, as it would need to be.
In order to unitize a contiguous area of acreage
for brine production, the brine operator must file an application with the Commission supported by the following evidence:
| · | A
description of the proposed brine unit. |
| · | A
proposed plan of development and operation. |
| South West Arkansas Project Pre-Feasibility Study | 18 Sept 23 |
| · | Geological
and engineering data supporting the feasibility of the proposed plan and the efficacy of
the boundary lines of the proposed unit. |
| · | A
plat of the proposed unit indicating the tracts or parcels included in the unit and the proposed
location of production and injection wells. |
| · | A
list of owners within the unit. |
| · | Evidence
that the applicant has valid brine leases covering at least 75% of the net mineral acreage
within the entire area of the unit. |
| · | Evidence
that the operator has made reasonable efforts to lease all of the acreage within the proposed
unit. |
| 4.5 | Potential Future Royalty Payments to Lessors |
The AOGC, in accordance with Arkansas law, has
established ‘drilling units’ that consist of a set amount of acreage to protect correlative rights and ensure all mineral
owners receive proper payment of production royalties (in the case of oil and gas production), and statutory in lieu royalty payments
(in the case of brine production). Given that future brine production from the Project would be derived from a common aquifer in the
Smackover Formation, the establishment of a unit(s) with defined boundaries would ensure that all mineral owners potentially impacted
by the producing well(s) would receive proper compensation.
The AOGC was given the jurisdiction and authority
to form brine production units in Ark. Code §§ 15-76-301 et seq. (the Brine Statute). The AOGC's rules and regulations
are available on-line at: www.aogc.state.ar.us/ along with its hearing schedule and production data from 1992 forward. Pertinent
provisions of the Brine Statute include:
| · | §15-76-308
which identifies who may make application for the establishment of brine production units
and states that a brine production unit may consist of no fewer that 1,280 contiguous surface
acres (Arkansas Code, 2016a); |
| · | §15-76-309
which prescribes what information must be provided in a petition to form a brine production
unit (Arkansas Code, 2016b); |
| · | §15-76-312
which permits the owner of an interest in a tract of land that is adjacent to a brine production
unit and is not included in the unit, to petition for inclusion within the unit (Arkansas
Code, 2016c); |
| · | §15-76-314
which requires each owner of an unleased interest in an established production unit to elect
within 60 days from the effective date of the order to either participate affirmatively in
the operation or to transfer his interest in the brine to the participating producers; and |
| · | §
15-76-315, which provides as follows: |
| South West Arkansas Project Pre-Feasibility Study | 18 Sept 23 |
(c) (1)
In addition to any other amounts due and owing by the producer or producers of any unit to the owners therein, the producer or producers
shall account separately and on a fair and equitable basis to each owner in the unit for all substances which are found by the commission
to be profitably extracted from brine by a producer and which were not extracted by a producer on January 1, 1979.
(2) Whether or not any such substance
is extracted profitably shall be determined by the Oil and Gas Commission on the basis of the value at the time of extraction, without
interest, after deducting all costs of producing and recovering the same.
It is the expectation of the AOGC that entities
desiring to drill and operate an oil, gas, or brine well in Arkansas will attempt in good faith to negotiate a satisfactory mineral lease
with mineral owners before resorting to the integration provisions of Arkansas law. In the case of brine production, the operator will
negotiate a per acre bonus consideration to be paid upon signing of the lease. Under the Brine Statute, the AOGC will approve a unit
for a brine operator when the operator files an application supported by the elements described in Section 4.3.1.
Moreover, pursuant to Ark. Code Ann. § 15-76-315(c) (as
quoted above), the AOGC must approve the royalty rate for any “additional substance” profitably extracted from brine produced
by an operator of a brine unit.
| 4.6 | Property Environmental Liabilities and Permitting |
Environmental and cultural impact studies pertaining
to the possible future extraction of the Smackover Formation brine resource on the SWA Project are presented in Section 20.
Several Federal and State permits and approvals
are required for brine production in Arkansas, for example:
| · | Clean
Water Act Section 404 permitting through the USACE; |
| · | Air
emissions permitting through the Arkansas Department of Energy and Environment-Division of
Environmental Quality (ADEE-ADEQ); |
| · | Water
discharge permitting through the ADEE-DEQ; |
| · | Well
drilling and operating permits through the Arkansas Department of Energy and Environment-Arkansas
Oil & Gas Commission (ADEE-AOGC); |
| · | Underground
Injection Control permitting through the ADEE-AOGC and the ADEE-DEQ; and, |
| · | Public
water supply permit through the Arkansas Department of Health (ADH). |
| South West Arkansas Project Pre-Feasibility Study | 18 Sept 23 |
Currently there is no brine production occurring
on the SWA Project for the express purpose of mineral extraction. Brine is produced from the Smackover Formation across and immediately
adjacent to the property as a normal part of oil and gas extraction operations, but any brine produced is removed and disposed of as
per normal oilfield activities. Albemarle produces brine to the east of the SWA property.
If Smackover Formation brine from the SWA Project
is to be used in the future for process testing work, some on-site pre-treatment may be required to remove dissolved hydrogen sulfide
(H2S), and all necessary permitting should be implemented accordingly.
| 4.7 | Risks and Uncertainties |
As with any development project there exists
potential risks and uncertainties. Standard Lithium will attempt to reduce risk/uncertainty through effective project management, engaging
technical experts and developing contingency plans.
The following risks and uncertainties have been
identified at this stage of project development:
| · | Lithium
brine royalty assessment by the AOGC is not completed in a timely manner and/or the royalty
rates overly impact project economics. |
| · | Unitization
in-lieu royalty payments, which are meant to be to fair and equitable as determined by the
Commission, are subject to annual adjustments under the applicable Producer Price Index and
such changes may influence the economics of the project. |
| South West Arkansas Project Pre-Feasibility Study | 18 Sept 23 |
| 5 | Accessibility,
Climate, Local Resources, Infrastructure, and Physiography |
The SWA Project area spans across Lafayette and
Columbia counties, with the majority of the acreage located in Lafayette County. The proposed Central Processing Facility will be located
approximately 11 km (7 miles) south of Lewisville. The largest nearby city is Magnolia, located about 34 km (21 miles) to the east. Magnolia
is the County Seat of Columbia County and has a population of approximately 11,200. Magnolia is also the location of the main campus
for the Southern Arkansas University and houses a student population of approximately 4,600. The combined population of Lafayette and
Columbia Counties is estimated at approximately 29,000 based on census data from 2020.
The largest cities in the region are Shreveport-Bossier
City, LA and Texarkana, TX. Shreveport is approximately 60 miles south and has a population of 393,000, and Texarkana is approximately
30 miles west with a population of 147,000.
The nearest airport is Magnolia Municipal Airport,
located immediately to the east of the SWA Project, and approximately 5 km (3 miles) south-east of Magnolia in Columbia County.
The nearest commercial airports are Texarkana
Regional Airport, approximately 30 miles west and Shreveport Regional Airport, approximately 60 miles to the south.
In addition, there are two airports, one commercial
and a small general aviation airport, located in Union County near the city of El Dorado. El Dorado is approximately 55 km (34 miles)
east of Magnolia.
There is existing rail access just to the west
and across Hwy 29 from the proposed Central Processing Facility location.
The area has an extensive all-season secondary
road network. Access is provided by U.S. and Arkansas state highways. U.S. Highway 82 links the cities of Lewisville, Stamps, and Magnolia,
running west-to-east, and U.S. Highway 371 runs just southeast of the property (Figure 5-1). Arkansas State Highways 29, 53, 313, and
several improved county roads provide access to every section of the property.
| South West Arkansas Project Pre-Feasibility Study | 18 Sept 23 |
Figure 5-1. SWA Property with cities/towns
and access routes, including major and secondary U.S. highways and railway lines

| South West Arkansas Project Pre-Feasibility Study | 18 Sept 23 |
The project area climate is generally humid with
average temperature and precipitation of 23.6ºC (74.4ºF) and 126.7 cm, respectively (49.8 inches; Figure 5-2). Annual rainfall
is evenly distributed throughout the year. The wettest month of the year is December with an average rainfall of 12.7 cm (5 inches).
The warmest month of the year is July with an average maximum temperature of 34ºC (93ºF), while the coldest month of the
year is January with an average minimum temperature of -2ºC (30ºF).
Figure 5-2. Average Temperature and Precipitation
in Magnolia, AR
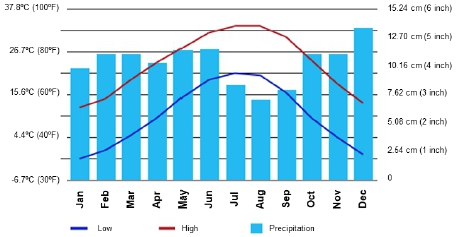
| 5.3 | Local Resources and Infrastructure |
Oil and gas extraction related infrastructure
are present across the SWA Project area, particularly in the northern and southern parts of the property. This infrastructure consists
of wellheads, collection facilities for various fluids, batteries, gas processing plant and associated pipelines, and cleared easements.
Much of the infrastructure is variably in use by junior operators, and the operation thereof can be cyclical depending on hydrocarbon
market conditions.
Lafayette County has a total area of 1,430 km2
(545 square miles), of which 1,386 km2 is land-based (528 square miles) and 44 km2 is water-based (17 square
miles). Columbia County has a total area of 1,996 km2 (767 square miles), of which 1,984 km2 is land-based (766
square miles), and 12 km2 is water-based (0.7 square miles).
The terrain consists of rolling hills with large
timber farms and is sparsely populated by rural private residences.
In Arkansas, the West Gulf Coastal Plain covers
the southern portions of the state along the border of Louisiana. This lowland area of Arkansas is characterized by pine forests and
farmlands. Natural resources include natural gas, petroleum deposits, and bromine-rich brine resources. The lowest point in the state
is found on the Ouachita River approximately 90 km (56 miles) east of the property in the West Gulf Coastal Plain of Arkansas.
| South West Arkansas Project Pre-Feasibility Study | 18 Sept 23 |
| 6.1 | Introduction
To Brine Production |
The brine production industry in southern Arkansas
currently recovers bromine as its chief product. Bromine is one of two elements that are liquid at room temperature and found principally
as dissolved species in seawater, evaporitic (salt) lakes and underground brine. The primary uses for bromine compounds include flame
retardants, intermediates and industrial uses, drilling fluids, and water treatment. The United States is one of four leading bromine
producers in the world, along with China, Israel, and Jordan. U.S. production and sold/used bromine values are withheld to avoid
disclosing company proprietary data (USGS, 2016). Excluding the United States, total world bromine production is 345,000 tpa.
Some historical production of bromine occurred
from ocean water, but since 1969, all U.S. bromine has been produced from subsurface brine in southern Arkansas. The first commercial
recovery of bromine from brine in Arkansas occurred in 1957 in Union County. Since then, bromine production in Union County by Lanxess
and in Columbia County by Albemarle has been continuous via a process in which the bromine-bearing brine is produced using production
wells, the bromine is recovered through an exchange reaction with chlorine in surface facilities, and the bromine-free brine (effluent
brine) is returned underground into the production formation via Class V injection wells that are regulated by the AOGC. Brine was
initially encountered as a result of drilling for oil, which was first discovered in south Arkansas at the Hunter No. 1 well in
Ouachita County in 1920, and first produced from the Busey No. 1 well in Columbia County in 1921. Oil and gas production has since
increased, peaked, and is now in decline, as shown by Figure 6-1. The brine encountered with the oil and gas was initially considered
a worthless by-product of production.
Over time, the oil and gas industry realized
that the Smackover Formation brine contained elevated concentrations of elements, such as bromine in addition to hydrocarbons. For example,
brine samples obtained by Standard Lithium within the SWA Property contain approximately 3,100 to 6,500 mg/L of bromine; compared
to 65 mg/L in seawater (WetLab analyses of 2023 exploration program brine samples). Accordingly, the commercial potential of bromine
gradually became apparent (McCoy, 2014). The large-scale development of this bromine-bearing brine resource has resulted in annual brine
production volumes of between 150 million and 300 million barrels over the last 40 years (Figure 6-2). This brine production results
from the Lanxess and Albemarle Smackover Formation bromine brine production projects in Union and Colombia Counties, respectively, the
two principal bromine production projects in the United States. Their prolific and long-lived production projects clearly demonstrate
the viability of brine production and processing from the Smackover formation in South Arkansas.
| South West Arkansas Project Pre-Feasibility Study | 18 Sept 23 |
Figure 6-1. Summary of South Arkansas Oil and
Gas Production

Source: AOGC, 2023
| South West Arkansas Project Pre-Feasibility Study | 18 Sept 23 |
Figure 6-2. Summary of South Arkansas Brine
Production

Source: AOGC, 2023
The brine characteristics and productivity of
these nearby Smackover properties resulted in Standard Lithium carrying out a data collection program on the subject SWA Property that
has provided the information needed to describe the geologic characteristics, productivity and brine content of the Smackover Formation
underlying the SWA Property, as described in Sections 9, 10, and 14.
| 6.2 | Regional Assessment of the Lithium Potential of the Smackover Formation Brine |
Note: (The discussion presented in this section
extends beyond the boundary of the SWA Property.)
Adjacent properties have verified lithium-brine
mineralization within the Smackover Formation. Accordingly, this discussion of lithium-brine information occurring near or adjacent to
the Property is not necessarily indicative of the mineralization on the Property.
| South West Arkansas Project Pre-Feasibility Study | 18 Sept 23 |
Brine aquifers have different characteristics
than traditional mineral deposits, such as precious and base metal deposits. Any given aquifer can have enormous sub-surface dimensions;
therefore, the scale of the Smackover Formation brine aquifer (i.e., the nature and extent of the lithium-brine potential of the Smackover
Formation), is important background information.
The USGS National Produced Waters Geochemical
Database v2.3, contains geochemical information collected from wells across the United States. The database includes 114,943 produced
water samples that were collected between 1905 and 2014 (Blondes et al., 2018). In addition to the major element data, the database contains
trace elements, isotope and time-series data that provide spatial coverage from specific formations and/or aquifers. Quality control
of the database must be performed by culling the data, based on geochemical criteria (Blondes et al., 2018). For this sub-section, and
because the adjacent Property information is disclaimed as being not necessarily indicative of the mineralization on the Property, the
QPs have not filtered any data and have included lithium-brine results directly from the USGS National Produced Waters Geochemical Database.
Figure 6-3 shows that lithium-enriched brine,
specific to the database-searched: “Smackover,” “Upper Smackover,” or “Reynolds Member of the Smackover,”
occurs throughout southern Arkansas within Union, Columbia, and Lafayette Counties. The highest recorded lithium-brine in this USGS-compiled
database occurs within the Union County (1,700 mg/L lithium), followed by a sample with 1,430 mg/L lithium in Columbia County and
740 mg/L in northern Union County. Brine analyses between 300 mg/L and 500 mg/L lithium occur predominantly in Columbia County,
with two recorded samples in Lafayette County. Brine yielding 100 to 300 mg/L lithium occurs across all three counties.
| South West Arkansas Project Pre-Feasibility Study | 18 Sept 23 |
Figure 6-3. Regional Smackover Formation Lithium
Brine Values from the USGS National Produced Waters Database

Source:
Blondes et al., 2018
Moldovanyi and Walter (1992), whose brine geochemical
data are included in the USGS National Produced Waters Geochemical Database, conducted a regional brine chemical study where Smackover Formation
brine samples were collected and analyzed from 87 wells, which were producing from 45 Smackover Formation oil and natural gas reservoirs
in southwest Arkansas, east Texas, and northern Louisiana. The study allowed these authors to hypothesize/conclude the following points
with respect to the regional distribution of the elevated Smackover Formation lithium-brine:
| · | Boron
(B) and alkali metal lithium (Li), potassium (K), and rubidium (Rb) concentrations in
the Smackover Formation water exhibit coherent geochemical relations across the southwest
Arkansas shelf. |
| · | In
general, the concentration of these elements is greater and more heterogeneous in hydrogen
sulfide (H2S)-rich brine than in H2S-free brine (see the H2S-rich
polygon shown in Figure 6-2). |
| South West Arkansas Project Pre-Feasibility Study | 18 Sept 23 |
| · | Regional
concentration gradients in H2S, B, Li, K, and Rb suggest fluids enriched in these
elements may have migrated into the Smackover Formation reservoirs from large-scale circulation
of deep-seated waters along segments of the South Arkansas and Louisiana State Line graben
fault system (Moldovanyi and Walter, 1992). |
With respect to the SWA Project, the Moldovanyi
and Walter (1992) dataset includes four brine analyses within the boundaries of the Property, as shown in Figure 6-4. Based on these
data, lithium-brine values range from 132 mg/L lithium (Purser 2) to 432 mg/L lithium (Cornelius 2), with an average of 278 mg/L lithium.
The latest concentration data gathered by Standard Lithium in 2023 demonstrates significantly higher lithium concentrations within much
of the SWA Project area, and supersedes, to a large part, the Moldovanyi and Walter (1992) data, as will be discussed in the following
sections.
| South West Arkansas Project Pre-Feasibility Study | 18 Sept 23 |
Figure 6-4. Historic Smackover Formation Lithium
Brine Values Derived within, and Adjacent to, the South West Arkansas Property

Source:
Blondes et al., 2018
| South West Arkansas Project Pre-Feasibility Study | 18 Sept 23 |
| 6.3 | SWA
Property Historical Infrastructure Summary |
Several Smackover
Formation oil fields were located on the SWA Property and included: Lewisville, McKamie-Patton, McKamie NE, Mars Hill, Mt. Vernon, and
Kress City (AOGC, 2016). Currently only the McKamie-Patton field is operating, and the other fields were abandoned. Prior to Standard
Lithium’s activities 95 wells had been drilled by oil companies to a depth greater than 7,000 feet (2,133 meters) on the SWA Property
during exploration of the Smackover Formation (Figure 6-5). Four of those wells are shut-in Smackover producers, three are completed
in non-Smackover formations, and the remainder are plugged and abandoned.
The McKamie Patton
oil and natural gas field is adjacent to and over-laps the south-central portion of the SWA Property. The status of 115 total wells drilled
to greater than 7,000 feet (2,133 meters) within the McKamie-Patton field is as follows:
| · | 66
wells are plugged and abandoned (four within the SWA Property) |
| · | 29
wells are active producers in the Smackover formation (none within the SWA Property) |
| · | 13
wells are active producers in non-Smackover formations (none within the SWA Property) |
| · | 3
wells are injection wells (none within the SWA Property) |
| · | 4
wells are currently shut-in Smackover producers (all within the SWA Property) |
The oil and natural
gas collected from the McKamie Patton oil field is directed by a gathering system of pipelines to the Dorcheat gas plant. The process
facility owned by Mission Creek Resources, LLC (Mission Creek), the McKamie Gas Processing Facility, is located south of the SWA Property
and is currently mothballed.
| South West Arkansas Project Pre-Feasibility Study | 18 Sept 23 |
Figure 6-5. Well
Status on the SWA Property

Note:
Only wells with total depth greater than 7,000 feet are shown.
| South West Arkansas Project Pre-Feasibility Study | 18 Sept 23 |
| 7 | Geological
Setting and Mineralization |
Two Qualified Professionals
(Brush and Williams) have reviewed in detail the prior evaluations of the Project, including the “Amended Geological Introduction
and Maiden Inferred Resource Estimate for Standard Lithium Ltd.’s Tetra Smackover Lithium-Brine Property in Arkansas, United States”,
effective date 28 February 2019 (MIRE) (Eccles, et al, APEX, 2019) and the “Preliminary Economic Assessment of SW Arkansas
Lithium Project”, effective date 20 November 2021 (PEA) (Eccles, et. al, APEX, 2021), and will note where its descriptions,
results, or conclusions are adopted by this report. In particular, the extensive description of the geologic setting is accurate and
is adopted here, and is summarized below.
The Smackover Formation
is Upper Jurassic in age and was named after the Smackover Field, Union County, Arkansas, which first produced oil in 1922 (Schneider
1924). The Smackover Formation extends from the panhandle of Florida through Alabama, Mississippi, Louisiana, and Arkansas to Texas as
shown in Figure 7-1. The portion of the Smackover generally known to contain significant bromine and lithium salts is found between the
Jurassic Gulf Coast basin-bounding faults to the north-northwest of the Property and the “State Line” fault system to the
south-southeast near the Arkansas-Louisiana border, shown in Figure 7-2.
Stratigraphically,
the Smackover Formation is bounded on the top by the Buckner Formation and on the bottom by the Norphlet Formation (Figure 7-3). The
lithium brine-bearing Upper Smackover Interval is overlain by the Buckner Formation, which in Arkansas is dominated by red shale in the
upper part and anhydrite in the lower part above the Smackover carbonates, and, because of its low permeability, acts as a geologic seal
which traps oil and gas. The dense, low-permeability carbonate of the Lower Smackover Interval is underlain by the clastic section of
the Norphlet Formation. The Norphlet Formation is comprised of red and gray clays with varying amounts of intercalated sands and occasional
gravels.
As shown in Figure
7-4 the Smackover Formation in southern Arkansas is commonly subdivided into three intervals, the Reynolds Member Oolite (referred to
in this report as the Upper Smackover), the Middle Smackover, and the Brown Dense (referred to in this report as the Lower Smackover).
The Upper Smackover is a predominantly oolitic limestone, and the Middle Smackover is a burrowed pellet packstone. The Lower Smackover
(which does not contribute to the resource estimates in this report but is a future target for exploration) is largely composed of dark,
dense limestone with argillaceous bands (Imlay 1940). As will be discussed later, the Lower Smackover has been found to contain porous
and permeable intervals. The entire Smackover Formation has been dolomitized to varying degrees.
| South West Arkansas Project Pre-Feasibility Study | 18 Sept 23 |
As described in
more detail in Section 14, the authors have subdivided the Upper and Middle Smackover Intervals into eight layers based on geologic
characteristics and lateral correlations. The upper five layers comprise the Upper Smackover while the lower three layers comprise the
Middle Smackover. To quantify the amount of porous and permeable Smackover Formation present within the SWA Property, the available core
and log data was evaluated to determine the reservoir’s structure, porosity, gross layer thickness, net pay thickness (that portion
of the gross layer thickness expected to be productive because it exceeded a 6.0 percent minimum porosity value) and net pay thickness
to gross layer thickness ratio (equal to the fraction of the layer at a given location that was estimated to be productive) for each
layer at each well location. Some wells did not drill deep enough to penetrate all layers, so only penetrated layers with data were used
in the mapping effort at those locations.
| South West Arkansas Project Pre-Feasibility Study | 18 Sept 23 |
Figure 7-1. Facies
Map of the Smackover Formation, Northern Gulf Coast Basin

Source: BEG, 1981
| South West Arkansas Project Pre-Feasibility Study | 18 Sept 23 |
Figure 7-2. Structural
Framework, Northern Gulf Coast

Source: BEG,1981
| South West Arkansas Project Pre-Feasibility Study | 18 Sept 23 |
Figure 7-3. Stratigraphic
Column of the Late Triassic to Late Jurassic Formations of the Northern Gulf Coast

Source:
Heydari and Baria, 2005
| South West Arkansas Project Pre-Feasibility Study | 18 Sept 23 |
Figure 7-4. Smackover
Stratigraphic Column

Source:
Heydari and Baria, 2005
The focus of this
resource assessment is the South West Arkansas Property’s Smackover Formation. The lithium bearing Smackover reservoir is continuous
across the SWA Property and extends beyond the SWA Property discussed in this Technical Report. The lithium concentration exhibited by
the Smackover Formation brine varies throughout the Property, as described in Section 9.3. The depth of the top of the Smackover
in the Property area generally dips from north-northeast to south-southwest (Figure 7-5) and varies in depth from approximately 7,600
feet (2,316 meters) subsea to approximately 9,100 feet (2,773 meters) subsea. The reservoir structure is not by itself an important factor
in brine production because the similar density of injected and produced brines minimizes the influence of gravity on fluid flow in the
reservoir. As shown on Figure 7-5, there is an east-west fault near the center of the SWA Property (the Brown Fault) and three more east-west
faults along the southern edge of the SWA Property. The presence of these faults has been accounted for in the example development plan
described in later Sections.
| South West Arkansas Project Pre-Feasibility Study | 18 Sept 23 |
Figure 7-5. Smackover
Structure Map

The lithium brine-bearing
Upper Smackover Interval is overlain by the Buckner Formation, which in Arkansas is dominated by red shale in the upper part and anhydrite
in the lower part above the Smackover carbonates, and, as a result of its low permeability, acts as a geologic seal which traps oil and
gas. The dense, low-permeability carbonate of the Lower Smackover Interval is underlain by the clastic section of the Norphlet Formation.
The Norphlet Formation is comprised of red and gray clays with varying amounts of intercalated sands and occasional gravels. The relationship
between the Smackover Formation, the Buckner Formation, and the Norphlet Formation as shown in a cross-section through the Standard Lithium
Exploration Wells, Figure 7-6.
| South West Arkansas Project Pre-Feasibility Study | 18 Sept 23 |
Figure 7-6. Exploration
Program Wells Cross Section

| South West Arkansas Project Pre-Feasibility Study | 18 Sept 23 |
Lithium is extracted
today from either mineral deposits (often from pegmatite deposits containing the lithium-rich mineral spodumene) or brine deposits. Brine
deposits can either be unconfined in salars, where lithium has been concentrated by the surface evaporation of water from lithium-bearing
brine (found in arid regions of countries such as in Bolivia, Chile, Argentina, and China) or confined in underground brine-bearing formations.
The SWA Property lithium deposit is a confined brine deposit in the form of a lithium-bearing brine contained within the porosity of
the Smackover Formation within the SWA Property boundaries. The Smackover formation in southern Arkansas has proven to be a prolific
source of mineral resources, beginning with oil and gas, then transitioning to bromine, with lithium now an attractive development target.
Bromine brine production from the Smackover Formation is extensive in Union and Columbia counties, to the east of the SWA Property.
The volume of in-place
lithium is proportional to the product of the brine-saturated pore volume in the SWA Property and the lithium concentration, both of
which are known with reasonable accuracy, based on the drilling, logging, coring, and sampling data obtained throughout the property.
The geological model for the Smackover Formation is described in detail in Sections 9 and 14, and the lithium distribution is described
in Section 9. The geologic characteristics of the reservoir and its lithium content estimates are based on the whole of the geologic
data set and the results of recent well testing in the Upper and Middle Smackover. All this data provides the basis upon which to estimate
the resource and to plan this lithium extraction Project.
| South West Arkansas Project Pre-Feasibility Study | 18 Sept 23 |
| 9.1 | Subsurface
data review |
This Technical
Report incorporates the new lithium concentration data gathered by Standard Lithium from its 2023 five-well exploration program, along
with the 2018 sampling program data. This new 2023 lithium concentration data has significantly improved the description of the lithium
distribution within the SWA Property.
| 9.2 | 2018
and 2023 Lithium Concentration Data Sampling program |
The lithium concentration
data used in this Technical Report resulted from brine samples collected by Standard Lithium in two sampling programs. In 2018 Standard
Lithium gathered two samples from each of two McKamie Patton wells, MKP-20, and MKP-21, on the southwest boundary of the SWA Property.
The McKamie Patton brine sampling program is discussed in detail in Section 9.2 of the PEA (Eccles, et. al, APEX, 2021).
In 2023, Standard
Lithium gathered a total of 21 samples from the three re-entry wells (Taylor, Beulah et al 1, International Paper Co. 1, Carter
Moore 1) and two new wells (Montague 1, Speer 1) comprising the exploration program. Four additional samples were gathered from three
of those wells by Robert Williams, QP as confirmation samples. All 29 samples from the 2018 and 2023 data gathering programs were analyzed
by Western Environmental Testing Laboratory (WetLab), 475 E Greg Street, Suite 119, Sparks, Nevada 89431.
The 2023 five-well
exploration program is described in detail in Section 10. The resulting lithium concentration values have greatly improved the description
of the distribution of lithium within the Smackover Formation within the SWA Property, demonstrating higher levels of lithium concentration
throughout much of the SWA Property than previously estimated. The resulting lithium concentration map was combined with the drilling
data described in Section 10 to prepare the layered geologic model and resulting Resource estimates described in Section 14.
Table 9-1 summarizes
the lithium concentration data used in this Technical Report. Each well’s test values were averaged by tested interval to obtain
the single Average Test concentration values for each tested interval. For wells with multiple tested intervals the Average Test values
were combined based on each test interval’s fraction of the total estimated porosity-thickness (using a 6.0 percent porosity cutoff)
for the well, resulting in each well’s Porosity Thickness-Weighted Concentration value. These values were used to map the distribution
of lithium throughout the SWA Property. Figure 9-1 is a map showing the locations of the resulting concentration data.
| South West Arkansas Project Pre-Feasibility Study | 18 Sept 23 |
Note the following:
| · | Test
5 for the Taylor, Beulah et al 1 well was excluded, because the apparent low permeability
of the zone resulted in low flow rates which prevented the brine composition from stabilizing,
resulting in an artificially-low lithium concentration value |
| · | The
Ford zone test in the Carter Moore 1 well was excluded as a non-Smackover test. |
| South West Arkansas Project Pre-Feasibility Study | 18 Sept 23 |
Table 9-1. SWA
Property Lithium Concentration Data
| Well | |
Test | |
Smackover
Zone Sampled | |
Porosity
Thickness
> 6% | | |
Standard
Lithium
Sample
Li, mg/L | | |
Standard
Lithium
Duplicate
Sample
Li, mg/L | | |
Williams
Sample
Li, mg/L | | |
Williams
Duplicate
Sample
Li, mg/L | | |
Average
Test Li,
mg/L | | |
Porosity
Thickness-
Weighted Lithium
Concentration,
mg/L | |
| Taylor, Beulah et al 1 | |
1 | |
Upper | |
| 8.34 | | |
| 531 | | |
| 569 | | |
| 515 | | |
| - | | |
| 538 | | |
| - | |
| Taylor, Beulah et al 1 | |
2 | |
Upper | |
| 2.84 | | |
| 574 | | |
| 581 | | |
| - | | |
| - | | |
| 578 | | |
| - | |
| Taylor, Beulah et al 1 | |
3 | |
Upper | |
| 0.16 | | |
| 570 | | |
| - | | |
| - | | |
| - | | |
| 570 | | |
| - | |
| Taylor, Beulah et al 1 | |
4 | |
Middle | |
| 0.71 | | |
| 551 | | |
| - | | |
| - | | |
| - | | |
| 551 | | |
| - | |
| Taylor, Beulah et al 1 | |
5 | |
Middle (Incomplete Test, Not Used) | |
| NA | | |
| 263 | | |
| - | | |
| - | | |
| - | | |
| - | | |
| - | |
| Taylor, Beulah et al 1 | |
Avg. 1-4 | |
Upper/Middle | |
| 12.06 | | |
| - | | |
| - | | |
| - | | |
| - | | |
| - | | |
| 549 | |
| Carter Moore 1 | |
1 | |
Ford (Not Used) | |
| NA | | |
| 199 | | |
| 206 | | |
| - | | |
| | | |
| - | | |
| | |
| Carter Moore 1 | |
2 | |
Upper/Middle | |
| 9.33 | | |
| 163 | | |
| 150 | | |
| 156 | | |
| | | |
| 156 | | |
| 156 | |
| International Paper Company 1 | |
1 | |
Upper | |
| 14.56 | | |
| 472 | | |
| 447 | | |
| 478 | | |
| 442 | | |
| 460 | | |
| - | |
| South West Arkansas Project Pre-Feasibility Study | 18 Sept 23 |
| Well | |
Test | |
Smackover
Zone Sampled | |
Porosity
Thickness
> 6% | | |
Standard
Lithium
Sample
Li, mg/L | | |
Standard
Lithium
Duplicate
Sample
Li, mg/L | | |
Williams
Sample
Li, mg/L | | |
Williams
Duplicate
Sample
Li, mg/L | | |
Average
Test Li,
mg/L | | |
Porosity
Thickness-
Weighted Lithium
Concentration,
mg/L | |
| International Paper Company
1 | |
2.3 | |
Middle High Porosity | |
| 6.39 | | |
| 282 | | |
| 289 | | |
| - | | |
| - | | |
| 286 | | |
| - | |
| International Paper Company 1 | |
2.2 | |
Base Upper+Middle Low Porosity | |
| 1.08 | | |
| 420 | | |
| 432 | | |
| - | | |
| - | | |
| 426 | | |
| - | |
| International Paper Company 1 | |
Avg. All | |
Upper/Middle | |
| 22.02 | | |
| - | | |
| - | | |
| - | | |
| - | | |
| - | | |
| 408 | |
| Speer 1 | |
1 | |
Upper/top of Middle | |
| 16.61 | | |
| 597 | | |
| 581 | | |
| - | | |
| - | | |
| 589 | | |
| 589 | |
| Montague 1 | |
1 | |
Upper | |
| 3.80 | | |
| 542 | | |
| 568 | | |
| - | | |
| - | | |
| 555 | | |
| 555 | |
| McKamie Patton 20 | |
| |
Upper | |
| | | |
| 347 | | |
| 352 | | |
| - | | |
| - | | |
| 350 | | |
| 350 | |
| McKamie Patton 21 | |
| |
Upper | |
| | | |
| 461 | | |
| 439 | | |
| - | | |
| - | | |
| 450 | | |
| 450 | |
| South West Arkansas Project Pre-Feasibility Study | 18 Sept 23 |
Figure 9-1. SWA
Property Concentration Data

| 9.3 | Exploration
Results and Interpretation |
The 2018 and 2023
lithium concentration data gathered by Standard Lithium (Table 9-1) was the basis for a map of the lithium concentrations in the SWA
Property, Figure 9-2. To prevent unwarranted extrapolation of the concentration data the maps contours are limited to 95 percent of the
minimum value and 105 percent of the maximum value. This map was used in the estimation of SWA Property lithium resources, as described
in Section 14. The quantity and areal distribution of that lithium concentration data within the SWA Property now justifies the
creation of this contoured concentration map, instead of the PEA’s two-value concentration map, which had a step-change in concentration
occurring at the Brown Fault (PEA Figure 14-1, (Eccles, et. al, APEX, 2021)). The 2023 data demonstrate a significant change in the lithium
concentrations from the prior map, with higher concentrations present both south and north of the Brown Fault, indicating the presence
of a significant development target throughout most of the SWA Property. Generally high and uniform lithium concentrations were measured
throughout most of the SWA Property (408 mg/L to 589 mg/L), except for the concentration measured at the Carter Moore 1 well (156 mg/L).
As will be described in Section 14, the geologic character of the Smackover Formation at the Carter Moore 1 location differs from
that observed at the well locations to the east and south, which may be related to the lower lithium concentration measured at the well.
Additional delineation of the lithium concentrations in the SWA Property is one of the recommendations of this study.
| South West Arkansas Project Pre-Feasibility Study | 18 Sept 23 |
Figure 9-2. Lithium
Concentration Map Based on Data Gathered by Standard Lithium

| South West Arkansas Project Pre-Feasibility Study | 18 Sept 23 |
The layered geologic
model as described in Section 14 is based on the well logs and core data obtained from 424 wells drilled in the Geologic Study Area
that exceeded 7,000 feet (2,100 meters) in depth. These wells were drilled by operators exploring the area for hydrocarbons, along with
the five wells either drilled or re-entered as part of the 2023 Standard Lithium exploration program, described in Section 10.1,
below. Table 10-1 provides a breakdown of the types of data gathered from the wells. Figure 10-1 depicts the geologic study area and
identifies the locations where these data were collected in the Upper Smackover. Figure 10-2 provides the same information for the data
collected in the Middle Smackover. Both Figures highlight the five wells comprising the Standard Lithium exploration program.
Table 10-1. Types
of Well Data
| Well
Data | |
Wells
Inside
SWA Property | | |
Wells
Outside
SWA Property | | |
Total
Wells | |
| Wells greater than 7000'
within Geologic Study Area | |
| 98 | | |
| 326 | | |
| 424 | |
| Wells that penetrated top of Smackover
marker | |
| 97 | | |
| 322 | | |
| 419 | |
| Wells that penetrated Middle Smackover
marker | |
| 32 | | |
| 99 | | |
| 131 | |
| Digital Logs | |
| 41 | | |
| 39 | | |
| 80 | |
| Raster Logs | |
| 96 | | |
| 325 | | |
| 421 | |
| Porosity Logs | |
| 36 | | |
| 34 | | |
| 70 | |
| Core Data | |
| 12 | | |
| 23 | | |
| 38 | |
Two categories
of geologic data were obtained from the wells drilled in the geologic study area that includes the SWA Property: well logs (either raster
or digital) and core data. Some well logs provided structural data, while others provided porosity data. The core data provided porosity
and permeability data. The structural data was obtained from 419 wells with log data that included at least the top of Smackover Formation,
while the porosity data originated in two forms: the porosity logs (density porosity, sonic porosity, and neutron porosity logs) obtained
from 70 wells, and the core samples obtained from 38 wells. The logs and cores were gathered for a number of different operators by contractors
using industry-standard procedures, and typically experienced in their respective specialties.
| South West Arkansas Project Pre-Feasibility Study | 18 Sept 23 |
Figure 10-1.
Upper Smackover Well Data Source

| South West Arkansas Project Pre-Feasibility Study | 18 Sept 23 |
Figure 10-2.
Middle Smackover Well Data Source

The log data was
used to establish correlations for structural control, to identify zone boundaries, to define gross interval thickness for each Smackover
zone, to identify net pay intervals, and to estimate the porosity values for those net pay intervals. The well log data included varying
combinations of the following logs: spontaneous potential (SP), gamma ray (GR), resistivity (EL, ISFL, DIL, etc.), MicroLog,
and various porosity logs (acoustic, neutron, and density). The by-zone gross thickness values obtained from the logs were used to constrain
net reservoir thickness and to relate porosity to the established zone correlations. The primary source of log porosity data, the density
porosity logs, were calibrated using the core porosity values, supplemented with the sonic porosity and neutron porosity logs, eliminating
any significant systematic error or bias in the resulting porosity value estimates.
| South West Arkansas Project Pre-Feasibility Study | 18 Sept 23 |
The east-to-west fault system present in the
southern portion of the SWA Property was previously identified and described in the PEA (Eccles, et. al, APEX, 2021). The seismic data
used to create that interpretation was evaluated and confirmed by Robert Williams, QP, resulting in a similar fault configuration with
minor modifications to the southeast fault traces to conform to the data provided by the new Standard Lithium Speer 1 well.
The resulting layered geologic model, discussed
in Section 14, formed the basis for the geologic description of the brine-containing reservoir used for resource estimates. The
geologic description was also used in the reservoir simulation model which provided an understanding of the potential for lithium recovery
from the SWA Property, described in Section 16.
| 10.1 | Standard
Lithium exploration program |
From February to July in 2023 Standard
Lithium conducted a five-well exploration program at the SWA Property. QPs Brush and Williams worked with Standard Lithium and the drilling
contractor to help design and execute the exploration program, including choice of well locations, data gathering plans, monitoring well
progress, advising on coring targets and procedures, and interpretation of results. This program included re-entry into three existing
abandoned wells (Taylor, Beulah et al 1, International Paper Co. 1, and Carter-Moore 1) and drilling two all-new wells (Speer 1
and Montague 1). These five well locations were chosen to maximize the description of the geologic properties and lithium concentrations
within the Property. Figure 10-3 depicts the locations of those five wells.
| South West Arkansas Project Pre-Feasibility Study | 18 Sept 23 |
Figure 10-3. SWA Property Exploration Program

Each of the five wells collected well log data
which was used to identify the zones in each well over which production tests were completed and brine samples collected during the exploration
program. Both whole core and sidewall coring programs were complete in several of the wells. Table 10-2 summarizes actions taken at each
well as part of the exploration program, including the well depths, sampling targets, amount of whole core, number of rotary sidewall
cores, and the brine volumes obtained. Each well successfully tested the high-porosity interval in the Upper Smackover which is considered
the SWA Property’s main pay zone. Additional productive pay was encountered and successfully tested at various depths in the Middle
Smackover. In one case porous and permeable formation was identified in the Lower Smackover. During each production test the physical
and chemical characteristics of the brine were monitored. Once those characteristics stabilized, samples were taken and shipped to the
outside laboratory, WetLab, for compositional analysis.
| South West Arkansas Project Pre-Feasibility Study | 18 Sept 23 |
Table 10-2. Well Actions Taken During Exploration
Program
| Well | |
Actions | |
Original
Measured
Depth
(Feet) | | |
Final
Measured
Depth
(Feet) | | |
Smackover
Zones
Sampled | |
Interval
Where Whole
Core Collected,
Measured
Depth
(Feet) | |
Total
Interval
Cored
(Feet) | | |
Amount
of
Core
Recovered
(Feet) | | |
Number
of
Rotary
Sidewall
Core
Samples
Collected | | |
Total
Volume of
Brine
Produced
(m3) | |
| Taylor,
Beulah et al 1 | |
Re-entry, deepen into
Middle Smackover | |
8,690 | | |
8,940 | | |
Upper, Middle | |
8,679.50 to 8,830.50 | |
| 151.00 | | |
142.00 | | |
12 | | |
54 | |
| Carter Moore
1 | |
Re-entry, deepen into Upper and
Middle Smackover | |
8,545 | | |
8,915 | | |
Upper, Middle | |
None | |
| None | | |
None | | |
None | | |
80 | |
| International
Paper Company 1 | |
Re-entry | |
8,800 | | |
8,950 | | |
Upper, Middle | |
None | |
| None | | |
None | | |
26 | | |
237 | |
| Montague
1 | |
New well | |
Not
Applicable | | |
9,655 | | |
Upper | |
9,053.00 to 9,388.00 | |
| 335.00 | | |
235.45 | | |
None | | |
149 | |
| Speer 1 | |
New well | |
Not
Applicable | | |
9,550 | | |
Upper, Middle | |
8,909.55 to 9,019.30 | |
| 109.75 | | |
86.15 | | |
26 | | |
44 | |
Figure 10-4 presents as a type well the Montague
1 well log, indicating the primary well log data, the cored interval, the intervals tested, the core permeabilities (shaded green where
permeability is greater than 0.5 mD), and the intervals meeting the 6.0 percent porosity net pay cutoff (highlighted with the orange
“Net Phi 6 Cobb” flag and shaded green where log porosity, “PhiND CC” is greater than 6.0 percent). Each well
test is described in the following sections.
| South West Arkansas Project Pre-Feasibility Study | 18 Sept 23 |
Figure 10-4. Montague 1 Type Well
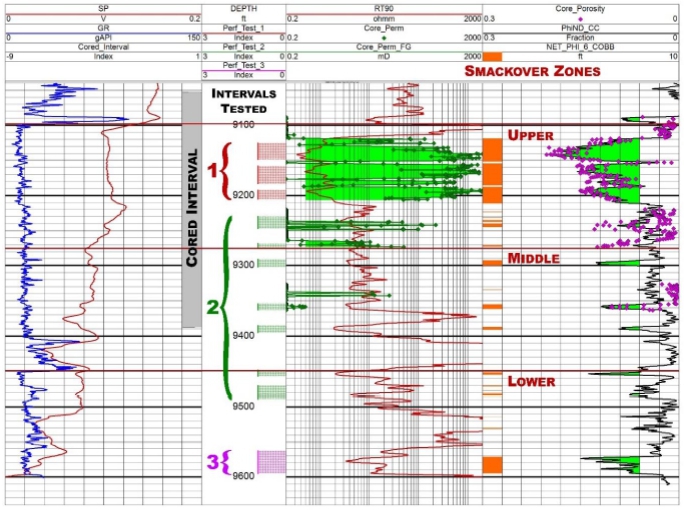
| 10.1.1 | Taylor,
Beulah et al 1 Well Re-entry |
The Taylor, Beulah et al 1 well was originally
drilled in 1982 to near the base of the Upper Smackover formation. The well was re-entered, deepened, cored, and logged. Whole core was
taken over the Middle Smackover formation as part of the deepening, and rotary sidewall cores were taken over the previously-drilled
Upper Smackover following logging. The well was then cased. Test intervals were chosen based on the combination of porosity values exceeding
6.0 percent (indicative of net pay) or resistivity values less than 6.0 ohm-meters, indicating the presence of conductive brine (the
same criteria were applied to the remaining four wells). Five intervals were sequentially perforated and tested, starting with two in
the Middle Smackover followed by three in the Upper Smackover. The lowest interval flowed small volumes of brine, the remaining four
flowed significant volumes of brine.
| South West Arkansas Project Pre-Feasibility Study | 18 Sept 23 |
| 10.1.2 | International
Paper Company 1 Well Re-entry |
The International Paper Company 1 well originally
was drilled in 1978 to near the base of the Middle Smackover. The well was re-entered, deepened into the Lower Smackover, and logged,
followed by gathering rotary sidewall cores and casing the well. Three successful tests were conducted in the Middle and Upper Smackover.
The lower-porosity pay in the Middle Smackover and bottom of the Upper Smackover flowed following an acid stimulation. Those intervals
were then isolated and a high-porosity zone in the Middle Smackover was successfully perforated and tested. Finally, the high-porosity
main pay interval in the Upper Smackover was successfully perforated and tested. The Lower Smackover was found to be non-productive at
this location.
| 10.1.3 | Carter-Moore
1 Well Re-entry |
The Carter-Moore 1 well originally was drilled
in 1976 into the Ford Zone, a porous and productive zone immediately above the Upper Smackover. The well was re-entered and the original
perforations were used to sample the Ford Zone. Those perforations were then cement squeezed and the well was deepened to the top of
the Lower Smackover. Core data was not obtained in this well because the limited diameter of the deepened portion of the well below the
Ford Zone was insufficient to allow coring operations. The deepened portion of the well, which covered the Upper and Middle Smackover,
was logged, and then tested and sampled open hole.
The Speer 1 well was drilled into the Lower Smackover
with core recovered in portions of the Upper and Middle Smackover. The well was cased and the net pay targets in the Upper Smackover
and Middle Smackover were successfully perforated and tested.
| 10.1.5 | Montague
1 New Well |
The Montague 1 well was drilled into the Lower
Smackover, with whole core recovered in the Upper and Middle Smackover. The high-porosity main pay target of the Upper Smackover was
successfully tested and sampled. Results from the deeper zones were not obtained in time for this report. Therefore, the Upper Smackover
main pay target lithium concentration value was used in the preparation of this Technical Report.
| South West Arkansas Project Pre-Feasibility Study | 18 Sept 23 |
| 11 | Sample
Preparation, Analyses, and Security |
Standard Lithium’s 2018 sampling program
for the two McKamie Patton wells is described in detail in Section 11.1 of the PEA (Eccles, et. al, APEX, 2021). QPs Brush and Williams
have reviewed that description and have found the procedures described reasonable and appropriate.
QPs Brush and Williams worked with Standard Lithium,
the drilling contractor, and the other technical personnel to help design and implement the sampling procedures used at each of the five
2023 exploration program wells. Robert Williams, QP participated in the 2023 brine sampling programs at the Taylor, Beulah et al 1, Carter
Moore 1, and International Paper Co. 1 wells, carefully observing the procedures, completing the sample log, and monitoring the WetLab
analysis confirmations for the samples. The samples were collected in a consistent and secure manner, with a clear chain of custody from
the sample collection point to the shipment to the laboratory.
| 11.2 | Sample
Preparation, Analyses And Security |
| 11.2.1 | Brine
Sample Collection |
Brine samples were collected from three re-entered
abandoned wells and two new wells (Section 10). A critical step to sampling brine for geochemical analysis is to ensure that the
brine collected is considered a “fresh” representative of Upper or Middle Smackover Formation.
During the 2023 sampling programs conducted by
Standard Lithium, the sample collection methodology included:
| · | For
the three wells that were re-entered, the well construction schematic was reviewed, the target
depth identified and the need for deepening the well was determined. Once deepened the logs
were run and test intervals identified. For the two new wells logs were run once each well
was drilled and the test intervals were identified. |
| · | For
each test interval a cast iron bridge plug was set above the prior test interval (except
for the first test), the test interval was perforated, a pressure gauge was set and the swabbing
assembly was run in the well, including a packer assembly immediately above the perforated
zone to isolate the testing horizon. New production tubing was also installed in the well.
All the work was completed by a workover rig. |
| South West Arkansas Project Pre-Feasibility Study | 18 Sept 23 |
| · | After
the test interval was perforated, brine was removed from the well by swabbing the production
tubing. Swabbing involves lowering swab cups on steel wireline inside the production tubing
from above the perforations. Once the wireline and swab cups were lowered to the desired
depth through a fluid column of approximately 1000 feet (300 m) they were raised, and the
entire 1000 feet (300 m) column of brine was brought to wellhead, conveyed through a piping
system to a three-stage fluid/gas separator and then to a mud tank for storage. The volume
of fluid removed from the well was measured with flow meters, and also calculated based upon
the volume measured at regular intervals in the mud tank. |
| · | Field-measured
parameters were collected and analyzed onsite by a Standard Lithium representative to assess
brine density, electrical conductivity, pH, and temperature from brine on every swab run.
Field measured parameters were compared to known values of the Smackover Formation. For example,
the formation has a brine density of about 1.20 grams/cubic centimeter (10.2 lbs/gallon).
Swabbing of the well continued until field-measured parameters had stabilized. |
| · | Brine
established to be from the Smackover Formation (based on density, electrical conductivity,
and pH) was collected by filling two 1,000 L (250 US gallon) intermediate bulk containers
(IBCs) from a valve installed at the three-stage separator. Safety protocols were exercised
on site due to the hydrogen sulfide (H2S) gas content associated with the produced
Smackover Formation fluids. A new 4-litre carboy container was filled from the IBC to allow
oil and brine to separate if oil was present. In all cases no oil was observed in the carboys
attesting to the high brine to oil ratio. |
| · | The
physical attributes of the brine sample were recorded (e.g., color, smell, contaminants, etc.).
The sampling process was completed by recording any comments that might be significant to
the sampling site, the sample collection, or the sample itself. |
| · | New
laboratory-supplied sample containers with screw-on caps were labelled using Standard Lithium’s
label procedure that includes recording the sample identification, date and time of sample
collection, and sampler’s initials. |
| · | Three
sample containers were collected from the 4-liter carboy container by Standard Lithium: 1-liter
plastic, 500 ml plastic preserved with nitric acid (HNO3) and 250 ml glass preserved
with phosphoric acid (H3PO4) for geochemical analysis at Western Environmental
Testing Laboratory (WetLab), an independent laboratory. |
| · | The
sample containers were checked to verify that all sample label information was correct, and
the sample container was properly closed. All sample containers were then stored in coolers
for shipping to the laboratories. |
| South West Arkansas Project Pre-Feasibility Study | 18 Sept 23 |
Coolers holding the sample containers were taken
from the field to a secured location to double check the sample IDs and make sure all containers are in good condition prior to shipment
to the laboratory. Chain of Custody forms for the respective laboratories were filled out and included with the sample cooler. The cooler
was taped closed and hand-delivered to the local courier company (Fed-Ex in El Dorado, AR) for delivery to the WetLab laboratory in Sparks,
NV. The laboratory was instructed to confirm receipt of the samples and provide a statement pertaining to the condition of the samples
upon receipt. The samples were then coded into the respective laboratories sample stream for analysis.
| 11.2.3 | Analytical
Methodology |
Standard Lithium has prepared its own internal
analytical protocols for the independent laboratories to follow. These include the following analytical work (with the associated American
Society for Testing and Materials (ASTM), Standard Methods (SM) and Environmental Protection Agency (EPA) international and national
method code): “Expanded Lithium Brine Analytical Suite”.
| · | General
chemistry: density, pH, temperature, carbonate, bicarbonate, total dissolved solids, total
organic carbon (ASTM 1963, SM 4500-H+B, SM 2550B, SM 2320B, SM 2540C and SM 5310B). |
| · | Anions
by Ion Chromatography: chloride, sulfate, bromide, fluoride (EPA 300.0) |
| · | Sample
preparation: trace metal digestion (EPA 200.2) |
| · | Trace
metals by Inductively Coupled Plasma Optical Emission Spectroscopy (ICP-OES): Li, Al, Sb,
As, Ba, Be, B, Cd, Ca, Cr, Co, Cu, Ga, Fe, Pb, Mg, Mn, Mo, Ni, P, K, Sc, Se, silicon, silica,
Ag, Na, Sr, Sn, Ti, V and Zn (EPA 200.7) |
WetLab completed these analyses using the following
corresponding methods: sample preparation by EPA 200.2; density by gravimetric; pH by SM 4500-H+B; temperature at pH by SM 2550B, carbonate
and bicarbonate by SM 2320B; chloride and sulfate by EPA 300.0; total dissolved solids by SM 2540C; anions by ion chromatography by EPA
300.0; trace metal digestion by EPA 200.2; and trace metals by ICP-OES by EPA 200.7.
| South West Arkansas Project Pre-Feasibility Study | 18 Sept 23 |
| 11.3 | Quality
Control/Quality Assurance |
| 11.3.1 | Field
Duplicate Samples |
A field duplicate sample was collected for every
sampling event. The field duplicate sample was taken at the same time as the original sample (i.e., back-to-back samples from the brine
sample spigot). Random identifiers were given to the duplicate sample and duplicate field samples were never in sequential order and
randomly presented to the laboratory.
A total of 12 primary brine samples were collected
from the five newly completed wells and each well had multiple completion zones. In addition to the 12 primary samples, 9 duplicates
samples were collected. Thus, representing almost one duplicate per primary brine sample. The lithium results of the duplicate sample
analyses are presented in Table 11-1. The duplicate sample relative percentage difference (RPD) for WetLab was 1.2 % to 8.3 %. It should
be noted that any result with an RPD less than 20% is considered acceptable.
| South West Arkansas Project Pre-Feasibility Study | 18 Sept 23 |
Table 11-1. Comparison
of Field Duplicate Samples from the 2023 Sampling Program
| Lithium Concentrations |
| Well Name | |
Smackover
Zone | |
| Primary
Sample
(mg/L) | | |
| Duplicate
Sample
(mg/L) | | |
| RPD1
Percentage | |
| Taylor,
Beulah et. al 1 | |
Upper | |
| 531 | | |
| 569 | | |
| 6.9 | |
| |
Upper | |
| 581 | | |
| 574 | | |
| 1.2 | |
| Carter-Moore
1 | |
Ford | |
| 206 | | |
| 199 | | |
| 3.5 | |
| |
Upper | |
| 163 | | |
| 150 | | |
| 8.3 | |
| International
Paper Company 1 | |
Upper | |
| 472 | | |
| 447 | | |
| 5.4 | |
| |
Middle | |
| 432 | | |
| 420 | | |
| 2.8 | |
| |
Middle | |
| 282 | | |
| 289 | | |
| 2.5 | |
| Montague
1 | |
Upper | |
| 542 | | |
| 568 | | |
| 4.7 | |
| Speer
1 | |
Upper | |
| 597 | | |
| 581 | | |
| 2.7 | |
Note: 1. RPD denotes relative percentage difference.
| 11.4 | Other
Data: Core Reports |
Historical core reports include pertinent information
on Upper and Middle Smackover formations core measurements conducted by independent engineering consultants (Core Laboratories Inc. in
Dallas, TX and Shreveport, LA; Delta Core Analysts in Shreveport, LA; All Points Inc. in Houston, TX; Thigpen Laboratories, Inc.
in Shreveport, LA: O’Malley Laboratories, Inc. in Natchez, MS; and Bell Core Laboratories in Shreveport, LA). These reports
included core measurements that included porosity (%) and permeability (mD) from throughout and immediately surrounding the SWA Project.
Some of the core report data also included: data for oil% in pore space; water% in pore space; bulk oil%; bulk gas%; bulk water%; and
vertical permeability.
| South West Arkansas Project Pre-Feasibility Study | 18 Sept 23 |
These analytical brine and core report data were
prepared by independent and accredited third-party companies. The resulting quantitative data are used to make inferences on the brine
analytical values and hydrogeological characteristics of the Upper and Middle Smackover formations. The analytical methods carried out
by the laboratories are standard and routine in the field of lithium brine geochemical analytical and petrophysical core characterization
test work.
The author has reviewed the adequacy of the sample
preparation, security and analytical procedures and found no significant issues or inconsistencies that would cause one to question the
validity of the data. The QA/QC protocol adopted by Standard Lithium helped the authors to evaluate and validate the laboratory data
as discussed in Section 12, Data Verification.
| South West Arkansas Project Pre-Feasibility Study | 18 Sept 23 |
| 12.1 | Verification
of Lithium Concentration Data |
Randal Brush, QP and Robert Williams, QP verified
the lithium concentration data four different ways:
| · | Reviewed
the choice of analytical laboratory |
| · | Reviewed
the overall scatter in each well’s lithium concentration data |
| · | Compared
concentration results between samples independently taken and verified by Robert Williams,
QP to those by Standard Lithium |
| · | Compared
concentration results between known standards and reported concentrations |
The four comparisons confirmed the choice of
WetLab, the consistency of the data, the close match between the independently-gathered samples and those of Standard Lithium, and the
reasonable match between standard concentrations and test results.
In 2021 Standard Lithium conducted an extensive
comparison test of four laboratories known for brine analysis. That study’s results indicate that WetLab is the appropriate choice
for the range of lithium concentrations encountered in this Technical Report. Randal Brush, QP has reviewed the supporting documentation
of that study and agrees with its conclusions. As a result, the WetLab-reported lithium concentration data is used throughout this Technical
Report.
To verify the Standard Lithium test results,
three wells were independently sampled by Robert Williams, QP, who independently followed the sampling procedures outlined in Section 11.
Table 12-1 summarizes the results of that verification. The small relative percentage difference values, 0.1 percent to 6.4 percent,
between the Williams samples and the SLL samples confirms the consistency of the Standard Lithium report concentrations with the independently
gathered samples in the well sampling dataset.
| South West Arkansas Project Pre-Feasibility Study | 18 Sept 23 |
Table 12-1. Comparison of Verification Samples
from the 2023 Sampling Program
| Well | |
Test | | |
Smackover
Zone
Sampled | |
Standard
Lithium
Sample
Li, mg/L | | |
Standard
Lithium
Duplicate
Sample
Li, mg/L | | |
Williams
Sample
Li, mg/L | | |
Williams
Duplicate
Sample
Li, mg/L | | |
Relative
Percentage
Difference,
Williams to SLI
Samples | |
| Taylor, Beulah et al 1 | |
| 1 | | |
Upper | |
| 531 | | |
| 569 | | |
| 515 | | |
| - | | |
| 4.3 | % |
| Carter Moore 1 | |
| 2 | | |
Upper/Middle | |
| 163 | | |
| 150 | | |
| 156 | | |
| - | | |
| 0.2 | % |
| International
Paper Company 1 | |
| 1 | | |
Upper | |
| 472 | | |
| 447 | | |
| 478 | | |
| 442 | | |
| 0.1 | % |
The four historic on-property lithium concentration
data depicted in Figure 6-3 (Blondes, et al. 2018) were not used in this Technical Report for these reasons:
| · | The
testing methodologies employed in the Cornelius 1 and Cornelius 2 wells were unknown, even
though the reported values were similar to the values measured by Standard Lithium at the
nearby McKamie Patton wells. |
| · | The
Purser 2 and Haberyan 1 wells’ values appear to have been taken from the Ford zone
immediately above the Upper Smackover, and are not representative of Smackover lithium concentrations.
One of this Technical Report’s recommendations is to gather additional Smackover Formation
lithium concentration data, including in the area of these two wells. |
| 12.2 | Verification
of Well Logs and Core Data |
The well log and core data used to create the
geologic model meets the standard of reliability required by this report. This data was taken by independent vendors in a manner meeting
industry standards, consistent with the identical data collection procedures used in dozens of projects evaluated by QPs Brush and Williams.
Importantly, this data was obtained for a purpose unrelated to the estimation of lithium resources. Therefore, it was not subject to
any biases related to that estimation process.
| 12.3 | Qualified
Persons Opinion |
The data from each of the 98 wells in the SWA
Property and 326 wells outside of the SWA Property but within the geologic study area, including the data from the five Standard Lithium
wells, have been reviewed and the data was found suitable for this evaluation. The location of the different sources of data is summarized
in Table 10-1 and depicted in Figure 10-1 and Figure 10-2. The lithium concentration, well log, core, and test data used in the preparation
of this Technical Report meets the highest standards for the evaluation of the brine deposit. Any limitations present in the data are
the unavoidable limitations present in all field measurements. Standard Lithium and the petroleum companies have exerted industry-standard
efforts in gathering high-quality data on and around the SWA Property. Standard Lithium’s data gathering program has been thorough,
and results directly in a high-quality database for use in this evaluation of the SWA Property’s lithium resources.
| South West Arkansas Project Pre-Feasibility Study | 18 Sept 23 |
| 13 | Mineral
Processing and Metallurgical Testing |
Standard Lithium Limited has developed a process
flowsheet to selectively extract lithium from Smackover Formation brine and produce battery-quality lithium chemicals at the Company’s
projects in southern Arkansas. The mineral processing and hydrometallurgical flowsheet for the SWA Project consists of six main process
areas:
| 1. | Brine
production from multiple wells targeting specific zones of the Smackover Formation followed
by primary three-phase separation of the produced brine at the wellhead to remove associated
sour gas and crude oil from the brine and then pipelining of the brine to a Central Processing
Facility (CPF). These processes are proven and industry-standard for handling produced water
from oil and gas fields and have been used for over 60 years for handling Smackover brines
for bromine production in Southern Arkansas and, therefore, require no process adaptations. |
| 2. | Pre-treatment
of the produced Smackover brine at the SWA CPF to remove dissolved gases and suspended solids
prior to lithium extraction. These processes are also industry standard and have been used
on Smackover brines for 60 years as part of the bromine production process. |
| 3. | Selective
extraction of lithium from the pre-treated brine using a proprietary Direct Lithium Extraction
(DLE) technology to produce a purified lithium chloride (LiCl) solution. |
| 4. | Further
purification and concentration of the LiCl solution using softening and salt removal processes
that are industry standard processes for water and wastewater treatment. |
| 5. | Conversion
of the purified and concentrated LiCl solution to a lithium hydroxide solution by an electrolysis
process which is proven in the chlor-alkali industry, followed by evaporation, crystallization
and drying to produce a high-purity lithium hydroxide crystal product. |
| 6. | Disposal
of the lithium-depleted, effluent brine back into the Smackover Formation via multiple re-injection
wells maintaining a controlled aquifer pressure throughout the area of the Smackover Formation.
Pressure maintenance through brine reinjection is a common industry standard process. |
With regards to Process Areas 1 and 6, the SWA
Project is located in a region with abundant oil, gas and brine operations, and as such, there are multiple service providers who can
effectively support installation of the well field for production and separation of the brine prior to delivery into the CPF. Therefore,
no additional technology development or proof of concept work has been undertaken for this part of the project.
| South West Arkansas Project Pre-Feasibility Study | 18 Sept 23 |
With respect to Process Areas 2, 3 and 4, Standard
Lithium has been continuously running a pre-commercial Demonstration Plant at the Lanxess South bromine production facility near El Dorado
since May 2020. As a result, significant data has been gathered regarding the performance of the various unit processes for pre-treatment
of Smackover brine and operation of the DLE technology on the brine. The Demonstration Plant has produced significant quantities of purified
and concentrated LiCl solution and has converted it, on site, to battery-grade lithium carbonate.
With respect to Process Area 5, Standard Lithium
is relying on a combination of project specific laboratory-scale testing and previous hydrometallurgical and commercial scale electrochemical
test work completed by NORAM Electrolysis Systems Inc (NESI) on multiple actual and synthetic lithium brines for over 1,000 hours each
to produce battery-quality lithium hydroxide solutions.
Conversion of the purified and concentrated lithium
hydroxide solution to battery-quality solid lithium hydroxide material will be done using proven crystallization technologies from globally
recognized vendors. Large scale test production of lithium hydroxide from LiCl solution produced at Standard Lithium’s Demonstration
Plant will be undertaken during the DFS phase in support of vendor guarantees.
The intent of this Section is to discuss
the South West Arkansas Project specific lithium-brine mineral processing test work in accordance with CIM Leading Practice Guidelines
for Mineral Processing (2022). The level of definition is appropriate to the confidence categories of mineral resources being supported
and the current stage of project development.
| 13.1.1 | Process
Selection Rationale |
Standard Lithium’s SWA Project has several
unique aspects that support flowsheet development centered around a DLE approach to lithium recovery. The factors which affect the selected
approach include the following:
| · | A
well-understood and industry-friendly regulatory framework for brine operations, |
| · | Existing
brine processing businesses (Lanxess and Albemarle bromine plants) provide a local workforce
well versed in pumping, processing, and reinjecting very large volumes of brine, |
| · | Effluent-brine
reinjection into the Smackover Formation is required to maintain aquifer pressurization.
Evaporation of Smackover brine using solar evaporation (with no recovery of condensate) would
not provide sufficient brine for reinjection and would negatively affect the water balance
in the Smackover Formation beneath the Project area, resulting in a reduction in the reservoir
pressure and a resultant reduction in productivity at the wells, |
| South West Arkansas Project Pre-Feasibility Study | 18 Sept 23 |
| · | Access
to abundant fresh water, |
| · | Access
to stable, high capacity and relatively inexpensive electricity, |
| · | Access
to low-cost, readily available, chemical reagents (acids, bases etc.), and |
| · | Access
to low-cost natural gas. |
As discussed above, the production of lithium-bearing
brine from production wells and separation of the brine from sour natural gas and crude oil will use industry-standard techniques, similar
to those already used at large scale in southern Arkansas at the active brine processing facilities (e.g. at Lanxess or Albemarle’s
operations), or as part of produced-water management associated with oil and gas production in the region.
Pretreatment of the brine to remove dissolved
gases and suspended solids will use proven standard processes in the brine, oilfield produced water and wastewater treatment industries.
Standard Lithium expects to use a well tested
proprietary DLE technology (discussed further in Section 13.3.3) to extract lithium from the lithium-bearing Smackover brine and
produce a concentrated and purified LiCl solution. Much of the flowsheet has been in pre-commercial operation and optimization since
May 2020 at the Company’s Demonstration Plant. The specific lithium extraction technology described in the PFS has been operated
consistently on a 24hr / 7 day per week basis at the Demonstration Plant since October 2022. This technology has been sufficiently
tested and validated such that it can be used for commercial operation in the SWA Project.
The conversion of the purified and concentrated
LiCl solution into a lithium hydroxide solution using an electrochemical process is based on technology developed and tested by NORAM
at their testing facilities in Richmond, BC, and further supported by project specific testing with Electrosynthesis Company, Inc.
(Electrosynthesis or ESC) in Lancaster, NY. Final concentration, crystallization of lithium hydroxide (LiOH·H2O)
will use industry standard equipment and process technology.
Figure 13-1 is a simplified schematic showing
the main process steps proposed for the SWA Project.
| South West Arkansas Project Pre-Feasibility Study | 18 Sept 23 |
Figure 13-1. SWA Lithium Brine Project Flowsheet
Schematic

It is the opinion of the author preparing this
section, that the discussion includes an objective level of reasonableness and demonstrates competence and due care in the execution
of the metallurgical test work and lithium-brine recovery process steps.
To the best of the author’s knowledge,
no historical testing regarding lithium recovery from brine leases associated with the SWA Project has been performed. All testing discussed
below was performed for Standard Lithium as part of the current development program.
| 13.3 | Demonstration
Plant Testing |
Considering the factors outlined in Section 13.1.1,
alternative methods to those commercially proven in lithium recovery from salar based brines are required to continuously extract and
purify lithium from the Smackover brines. Standard Lithium has been assessing and testing technologies with a specific focus on direct
lithium extraction which to date is relatively unproven at a commercial scale. The evaluation at the Demonstration Plant includes extensive
testing of two separate DLE technologies:
| 1. | Lithium
Stirred Tank Reactor (LiSTR), a proprietary DLE technology developed, owned, and patented
by Standard Lithium, which directly extracts lithium from high total dissolved solids (TDS)
brines using a high-capacity, lithium selective, solid sorbent based on lithium titanate,
in a continuous stirred tank reactor configuration (operating from May 2020 through
to October 2022); and, |
| 2. | Lithium
Selective Sorption (LSS, a key component of Li-ProTM), an alternate Koch Technology
Solutions (KTS) owned proprietary DLE technology that has been co-developed under a Joint
Development Agreement between Standard Lithium and Koch Technology Solutions (Operating since
October 2022). The LSS uses a fixed bed of commercially available alumina based sorbent. |
| South West Arkansas Project Pre-Feasibility Study | 18 Sept 23 |
The large-scale Demonstration Plant was designed
and constructed in Ontario, Canada in 2019 by Zeton, Inc. The Demonstration Plant was designed to continuously process a slipstream
of the effluent-brine produced by the Lanxess South bromine facility with a focus on developing and confirming the operation of an integrated
DLE flowsheet to allow the design of a future commercial production facility. The two DLE processes operated in the Demonstration Plant
have been adjusted and optimized over time to allow integration into the full flowsheet. At the Demonstration Plant, the lithium-barren
effluent brine, added process water and the LiCl not used for testing are continuously transferred back to the Lanxess brine disposal
system.
The Demonstration Plant, which consisted of 18
modules, was dismantled and transported to its current location at Lanxess’ South Plant bromine facility in Union County. It was
erected within the existing fence line of the bromine plant on a 1-acre site. The site was levelled, foundations were poured, and all
process, utility and power connections installed to ready the Demonstration Plant for operation in late 2019. The plant was installed/connected
and enclosed in late 2019/early 2020 and underwent commissioning in early 2020. Early commissioning was delayed by the COVID-19 pandemic
and associated lockdowns and the official start-date for the plant was during the second week of May 2020.
The Demonstration Plant initially comprised brine
pre-treatment, LiSTR DLE and purification equipment for removal of calcium, magnesium, and silica. Process modifications to address scalability
for commercialization were made in December 2020 and an osmotically-assisted reverse osmosis (OARO) unit was installed at the plant
in August 2021 (the membrane concentration operation had, until that point, been completed off-site as an occasional batch process).
Further modifications were implemented in September and October 2022 to further prove out an additional DLE process (LSS).
The Demonstration Plant has a dedicated team
of engineers, chemists, and operators who run the plant on a 24/7 basis and it has operated continuously apart from shutdowns for maintenance,
process improvements and supply outages caused by interruptions to Lanxess brine operations feeding the Demonstration Plant. The plant
includes a dedicated analytical laboratory equipped to complete all on-site process control assays. The plant has been operating continuously
to extract lithium from Smackover Formation brine over a 3-year period. The plant’s abundant process instrumentation and extensive
program of sampling and analysis have generated large amounts of data. The data collection underpins the assessment in this report.
| South West Arkansas Project Pre-Feasibility Study | 18 Sept 23 |
The Demonstration Plant processes both effluent
brine from Lanxess and Smackover Brine that has not been through the bromine extraction process. Testing of brine samples from across
the entire Smackover brine field in southern Arkansas has proven the consistency of the resource in terms of key elements and relative
ratios of chloride salts. Learnings from the Demonstration Plant are therefore considered to be directly applicable to both the Commercial
Lithium Extraction Plant Project at Lanxess South Plant and SWA Projects. Representative analyses of two feed brines and the Demonstration
Plant raw lithium chloride (Raw LiCl) solutions from the two DLE processes are provided in Table 13-1.
The LiCl Product along with brine from various
stages of the Demonstration Plant flowsheet have been used to support vendor testing in support of equipment design and process guarantees.
The LiCl product has been converted to battery-quality lithium carbonate and lithium hydroxide both on site at the Demonstration Plant
and offsite by vendor testing.
| South West Arkansas Project Pre-Feasibility Study | 18 Sept 23 |
Table
13-1. Representative Brine Analyses and LiCl Product
| | |
Brine
feed to
Demonstration
Plant from
Lanxess1,2 | | |
SWA
Project
feed
brine1,3 | | |
Raw
LiCl
from LiSTR
DLE1,4,5 | | |
Raw
LiCl
from LSS
DLE1,4,6 | | |
Polished
LiCl
from
Demonstration
Plant1,4,7 | |
| Lithium | |
| 237 | | |
| 542 | | |
| 1,427 | | |
| 301 | | |
| 4,917 | |
| Sodium | |
| 61,136 | | |
| 87,398 | | |
| 2,217 | | |
| 817 | | |
| 28,896 | |
| Calcium | |
| 31,793 | | |
| 37,033 | | |
| 3,423 | | |
| 620 | | |
| 0.5 | |
| Magnesium | |
| 2,682 | | |
| 2,852 | | |
| 169 | | |
| 56 | | |
| 0 | |
| Potassium | |
| 2,385 | | |
| 9,577 | | |
| N/A | | |
| 30 | | |
| 672 | |
| Strontium | |
| 1,932 | | |
| 2,716 | | |
| N/A | | |
| 35 | | |
| 0 | |
| Boron | |
| 189 | | |
| 399 | | |
| N/A | | |
| 37 | | |
| 0 | |
| Silicon | |
| 10 | | |
| 16 | | |
| 26 | | |
| 4 | | |
| 0 | |
Notes:
1. All units are mg/L
2. Demonstration Plant brine supply
composition is average sample data collected in the Demonstration Plant from 4th May to 30th June 2023 to reflect
the period when Sr was regularly measured.
3. SWA Lithium Project brine is average
analytical results of four samples from the Upper Smackover from the 2023 resource evaluation program conducted in support of the SWA
Project PFS. This approach differs from that presented in Section 9 on the basis that it is expected to present a higher grade scenario
where high grade zones of the Smackover are targeted preferentially for production with injection in the lower grade zones. This is intended
to ensure a robust design envelope given the Demonstration Plant currently processes a lower grade and is not intended to be reflective
of project economics. It should be noted that the elements detected are materially the same, which is indicative of the consistency of
the Smackover resource and the resultant applicability of the testing.
4. All LiCl compositional data is
based on data collected during normal operation of the Demonstration Pant. The results from the on-site laboratory have been regularly
validated by independent testing by WetLabs, NV, over the period of May 2020 through to June 2023.
5. The data from LiSTR is based on
compositional averages of approximately 6,000 hours of operation from March 2021 through to November 2021. During this period, B, K,
and Sr were not measured, but data from Wetlabs samples indicates typical values of 100, 67, and 221 respectively. Following November
2021, a sorbent development and optimization program was initiated to assess the performance of bespoke sorbents and target specific
operating parameters and long term continuous operation was discontinued in support of shorter duration testing.
| South West Arkansas Project Pre-Feasibility Study | 18 Sept 23 |
6. The LSS data is based on compositional
averages of a 1,200 hour period of continuous operation in Q2 2023.
7. The LiCl Product from the Demonstration
Plant is based on the average of bulk samples sent for NaCl crystallization in support of electrolysis testing. The samples were produced
in the Demonstration Plant by LSS DLE with subsequent IX processes for removal of bivalent cation and boron followed by OARO for concentration
suitable for testing of NaCl crystallization planned in support of the Feasibility Study phase of the project.
It should be noted that although the SWA brine
is materially similar to the brine tested in the Demonstration Plant in that it is a chloride-based brine with the same major constituents,
the proposed brine feed does vary sufficiently (higher lithium concentration, higher boron, etc.) that its effect on lithium loading,
and selectivity will need to be independently confirmed. This is planned as part of the Feasibility Study phase of the project and this
PFS phase is relying on a combination of Demonstration Plant results and laboratory testing of synthetic brines.
The brine that is provided by Lanxess to the
Demonstration Plant is de-brominated (by Lanxess) during normal operations. However, there have been several periods when bromine extraction
has not occurred (for Lanxess’ operational reasons), and the Demonstration Plant has received brine with >4,000 mg/L bromide;
this is relevant for assessing how the SWA Project brines may behave through the integrated DLE flowsheet. It has been observed that
both of the DLE processes (LiSTR and LSS) are not adversely impacted by dissolved bromide, and that the bromides are largely rejected
with the waste brine stream and do not pass through into the LiCl product stream in significant amounts.
As of the end of Q2 2023, the Demonstration Plant
has processed approximately 55,500 m³ (approximately 14,655,990 US gallons) of
brine.
Operations within the Demonstration Plant can
be systematically varied, and as such, the effect of changing operating parameters on performance metrics such as degree of lithium recovery
from the incoming brine, rejection of impurities, reagent usage and water balance have all been studied in a controlled manner. As with
any industrial process, there are many competing factors, and the optimal operation has been proven to be a trade-off between the various
inputs. For reference, representative LiCl analyses generated by the two flowsheets tested in the Demonstration Plant are provided in
Table 13-1, though these can be modified by varying the processes in the Demonstration Plant.
| South West Arkansas Project Pre-Feasibility Study | 18 Sept 23 |
| 13.3.2 | Brine Pre-Treatment Testing |
As part of operating the pre-commercial Demonstration
Plant at the Lanxess South Plant facility, several of the proposed pre-treatment processes have been demonstrated as part of normal operations
at the facility. These include all wellhead operations to remove non-aqueous phases (oil, gas, other non-aqueous fluids) and removal
of residual dissolved hydrogen sulfide (H2S) by vacuum degassing (by Lanxess), and bulk pH control, temperature adjustment,
and final filtration (at the Demonstration Plant) prior to lithium extraction, using either pressurized membrane units or multi-media
filtration.
Based on the Demonstration Plant findings, no
additional pre-treatment testing is required for specifically assessing the SWA Project.
Key findings and outcomes from the Demonstration
Plant testing are:
| · | Pre-treatment
of the incoming brine is necessary to remove naturally occurring dissolved gasses such as
methane and hydrogen sulfide, non-aqueous phases (oils and gas condensates), and suspended
solids; |
| · | Real
brines processed on a continuous basis are significantly more complex than synthetic brines
based on the same underlying chloride matrix. Continuous, long-term (greater than two years)
field testing of equipment is crucial in ensuring sufficient design inputs to support reliable
scale-up; and, |
| · | The
behaviors of potential fouling agents (transition metals, dissolved silica, alkaline-earth
metals, non-halide anions, etc.) are complex and affected by subtle changes in pH, oxidation-reduction
potential (ORP), pressure, temperature and reagent addition induced chemical reactions. The
behavior of problematic elements is difficult to predict from either modelling, batch operation
or short term (less than one year) operation. |
| 13.3.3 | DLE Testing at the Demonstration
Plant |
As identified in Section 13.3.1, the Demonstration
Plant has been used to conduct coincident testing of two different DLE processes, LiSTR and LSS as described below.
The LiSTR DLE method is a proprietary process
designed, patented, and owned by Standard Lithium. It uses a high-capacity lithium titanate-based sorbent (meta-titanic acid in its active
form) for selective extraction of lithium from the brine stream using stirred tank reactors and a conventional counter current decantation
(CCD) circuit. The LiSTR technology was initially developed in 2017 and went through two main scale-ups (each approximately a 100×
scale-up) during 2018 and 2019, resulting in operation in the Demonstration Plant in May 2020.
| South West Arkansas Project Pre-Feasibility Study | 18 Sept 23 |
LiSTR was originally commissioned and operated
using a commercially produced sorbent. Standard Lithium has maintained a continued, dedicated sorbent development program over the past
three years with the aim to develop improved parameters for lithium capacity, separation efficiency and physical/chemical robustness.
The pre-commercial operation in the Demonstration
Plant has proven high selectivity for lithium, high recovery of lithium from the brine, and long-term reliability. Test work is currently
on-going to optimize the sorbent characteristics to facilitate improved mechanical separation and to minimize or obviate the CCD circuit,
reduce water consumption and sorbent inventory.
Key findings and outcomes from the Demonstration
Plant testing are:
| · | Continuous
and accurate pH control in the loading and stripping reactors is critical to good performance
and sorbent stability, |
| · | Loading
efficiency (lithium extraction efficiency) is a direct function of sorbent capacity and mass
flux vs brine flow in the loading reactors – this is a variable that can be controlled.
Lithium extraction during loading can exceed 90% when a two-stage counter-current loading
configuration is used (the maximum sustained extraction efficiency was in excess of 95%), |
| · | Contaminant
(Ca, Mg, K and Na) rejection efficiencies for most contaminants are consistently observed
within the Demonstration Plant to be well over 98%, |
| · | Submerged
membranes can be used effectively in the loading reactors to remove effluent (lithium-free)
brine, but their utility is limited at very high solids concentrations in the sorption slurries, |
| · | The
lithium-specific titanate-based sorbent has demonstrated excellent chemical and physical
stability and has undergone several hundred loading and stripping cycles (each full loading
and stripping/regeneration cycle lasts approximately one day in the Demonstration Plant), |
| · | Lithium
loading capacity of fresh sorbent stabilizes during the initial cycles and then remains constant
with no further capacity loss over hundreds of operating cycles, |
| · | The
stripping performance of the sorbent is sensitive to temperature and pH and long-term operation
under stable conditions is required to optimize performance, |
| · | Industry-standard
CCD circuits can be used to wash the sorbent in either loaded or stripped (reactivated) state, |
| South West Arkansas Project Pre-Feasibility Study | 18 Sept 23 |
| · | Bulk
properties and settling characteristics of the sorbent are key for proper product separation
and recovery, |
| · | Bulk
quantities of sorbent have been produced by an independent 3rd party with pilot
scale equipment to demonstrate that sorbent can be produced at a commercial scale, and |
| · | LiSTR
requires continuous addition of acid/base during loading and stripping and as a result, is
more sensitive to reagent pricing than LSS. |
The LSS DLE is a Koch Technology Solutions proprietary
technology for which Standard Lithium have a Joint Development Agreement and Smackover regional exclusivity agreement in place. This
process uses a fixed bed adsorption using a selective solid sorbent based on aluminum hydroxide copolymer, a sorbent material with elution
by fresh water rather than the acid strip used in LiSTR. The core of the technology was originally developed by a consultant to Standard
Lithium and purchased by Koch Technology Solutions. The synergies associated with the relationship between Standard Lithium, various
Koch Industries businesses and the process inventor led to an opportunity to operate and develop this process in parallel to LiSTR in
the Demonstration Plant.
The LSS DLE process has been in operation at
the Demonstration Plant since October 2022 and extensive work has been undertaken to prove scale-up and reliable operation. The
LSS columns have been run for well in excess of 6,000 cycles at the time of this Technical Report. Process refinement is on-going at
the Demonstration Plant and is aiming to optimize the process control steps to determine the best balance for lithium recovery, impurity
rejection, water usage and lithium concentration that can be achieved.
To date, LSS has shown significant promise in
reducing reagent use, excess water addition and simplifying the process due to lower equipment counts. It has the additional benefit
of independent 3rd party process guarantees and has therefore been recommended as the core technology for Standard Lithium’s
development of their Commercial Lithium Extraction Plant Project and consequently will also form the basis for the SWA Project. In support
of project definition, the LSS has also been tested specifically for the SWA Project using a synthetic brine based on the major constituents
identified as part of the resource evaluation and well sampling program identified in Section 9 and as discussed further in Section 13.3.4.
As detailed elsewhere in this section, it is understood that ‘real brines’ exhibit different behavior from synthetic brines
and therefore further project specific testing is recommended.
| South West Arkansas Project Pre-Feasibility Study | 18 Sept 23 |
This process will continue to be developed and
optimized in parallel with the project execution.
Key findings and outcomes from the Demonstration
Plant testing are:
| · | Lithium
extraction efficiencies of greater than 95% have consistently been observed in the Demonstration
Plant; similarly, contaminant (Ca, Mg, Na and K) rejection efficiencies for most contaminants
are consistently observed within the Demonstration Plant to be well over 99%; |
| · | The
key benefit of the LSS process over LiSTR is the reduced excess water which potentially allows
better control and maintenance of the Smackover Formation; |
| · | The
fixed bed resin can be sensitive to high solids in the feed so proper feed quality control
is critical; |
| · | LSS
operation has shown that fine control of key set points can be used to easily adjust and
optimize the different elements affecting performance including lithium recovery and impurity
rejection. This facilitates easy tuning for different brines of similar constituencies such
as the Lanxess brine compared to the SWA brine; and, |
| · | The
commercially available sorbent tested in the Demonstration Plant has performed well as can
be seen by the performance shown in Table 13-1, however, the development team believe that
better performance can be achieved in terms of selectivity of lithium and rejection of impurities.
In support of this, continued optimization is on-going in the Demonstration Plant including
testing of alternate sources of sorbent/resin including KTS developed sorbents. |
Both DLE processes show high selectivity for
lithium extraction from the Smackover Formation brine to produce a LiCl solution in which the ratio of lithium to other components has
been increased materially from <0.005:1 (i.e. 237 mg/L Lithium relative to the combined impurities at ~95,000 mg/L Na/K/Ca/Mg) to
closer to a 0.2:1 (301mg/L lithium relative to ~1,500 mg/L). In addition, both lithium extraction processes are not measurably affected
by the presence or absence of bromide in the incoming brine.
| 13.3.4 | LSS Laboratory Testing |
Laboratory testing of a synthetic brine, similar
to the SWA brine identified in Table 13-1, was undertaken by KTS in support of evaluation of LSS. This validated the expected performance
parameters identified for a comparative Demonstration Plant synthetic brine indicating that the differences in brine characteristics
associated with differences in constituent ratios do not materially impact the performance. This testing in concert with the proven ‘real
brine’ performance of LSS in the Demonstration Plant validates the selection for the SWA Project. However, further specific testing
on ‘real brine’ from the SWA Project area is planned in the DFS to further validate this understanding of consistent LSS
performance based on the underlying constituent make-up being more important than the constituent concentrations.
| South West Arkansas Project Pre-Feasibility Study | 18 Sept 23 |
| 13.4 | Demonstration Plant LiCl Purification
and Concentration |
Downstream of the DLE processes, the LiCl solution
is processed by various different technologies to remove unwanted impurities (e.g. calcium, magnesium, boron and silica) and to concentrate
the purified solution by HPRO/OARO. The Demonstration Plant has shown a proven ability to produce LiCl solutions suitable as feedstock
for offsite NaCl crystallization in preparation for both electrochemical processing and direct to carbonation process.
Key findings and outcomes from the Demonstration
Plant testing are:
| · | The
Demonstration Plant has consistently produced a polished LiCl product with the following
parameters: |
| o | LiCl greater than 4,000 mg/L lithium; |
| o | Rejection of boron, magnesium, silicon and
strontium to below detection limits; |
| o | Rejection of Calcium to less than 1 mg/L in
the concentrated stream; |
| · | The
raw LiCl solution from DLE can be efficiently purified via standard (off the shelf) ion exchange
(IX) resins; |
| · | In
addition, traditional chemical softening has also been proven to work reliably down to low
levels of both calcium (< 2mg/L) and magnesium (not detectable) potentially reducing the
load on IX and the associated reagent usage; |
| · | Boron
has been shown to be easily removed from the concentrated LiCl solution by third party work
using process equipment vendor industry standard IX technology (< 1 mg/L); and, |
| · | The
final LiCl concentrate is suitable for further conversion and has been converted to battery
quality lithium chemicals including lithium carbonate and lithium hydroxide. |
| South West Arkansas Project Pre-Feasibility Study | 18 Sept 23 |
| 13.5 | Additional LiCl Purification and
Concentration Testing |
The PEA flowsheet envisaged the LiCl produced
by DLE to undergo additional purification (by IX) and concentration (by reverse osmosis and thermal/evaporation) prior to being converted
to lithium hydroxide. These processes have been tested extensively in the Demonstration Plant along with several other processes in order
to evaluate the best fit technology for this project. All of the technologies are widely proven in industry, particularly wastewater
treatment and have been shown to work reliably at the Demonstration Plant. The key technologies that have been evaluated include:
| · | Chemical
softening using ion exchange (IX), |
| · | Chemical
softening using lime and soda ash (to reduce IX operating costs due to cheaper reagents and
lower fresh water demands), |
| · | Chemical
softening using carbon dioxide (minimize introduction of additional impurities), |
| · | Chemical
softening for Boron removal, |
| · | Silica
removal by pH adjustment, |
| · | Silica
removal using a proprietary IX approach, |
| · | Concentration
using seawater RO (SWRO), and |
| · | Concentration
using Osmotically Assisted RO (OARO). |
Based on the outcome of testing, the learnings
from the Demonstration Plant and the LANXESS Project Phase 1A design work along with the SWA Project design work, the flowsheet for the
PFS phase has been modified to comprise of; SWRO, chemical softening, boron IX, OARO/HPRO, IX polishing and salt crystallization
to process the DLE output stream to a quality suitable for electrolysis.
Additional offsite pilot testing work is ongoing
with SGS Lakefield to assess solvent extraction (SX) which was not complete at the time of publishing of this report. Whilst the proposed
flowsheet is robust, it is recommended that a detailed analysis is conducted to evaluate the results of the SX pilot testing in support
of a trade-off study for technology selection for commercialization.
| 13.6 | LiCl Conversion Testing |
Several technologies were evaluated and tested
for conversion of lithium chloride solution to lithium hydroxide solution, these technologies being:
| · | Bi-polar
membrane electrodialysis (BPMED); and, |
| · | Direct
Lithium Hydroxide Conversion (DLC). |
| South West Arkansas Project Pre-Feasibility Study | 18 Sept 23 |
The process of wet liming for lithium hydroxide
production from lithium carbonate is well understood and proven in commercial operation and has therefore not been tested specifically
for the SWA Project. Wet liming remains a potential fallback option in the event that the continued testing and evaluation of the above
listed technologies prove to not be technically or commercially viable. The key reason for not pursuing wet liming as the base case is
that it is expected that the existing premium for the sale of lithium hydroxide over lithium carbonate will be eroded over the project
execution timeline undermining the process economics. In addition, the wet liming process has the following drawbacks:
| · | Large
recycle streams are required to minimize product losses; |
| · | Product
purity control is more difficult requiring extensive operating experience; and, |
| · | Lots
of solid waste is generated which offsets a key project benefit for reinjection of waste
streams into the aquifer. |
This section of the report addresses the project
specific testing to convert LiCl solution to lithium hydroxide that has been undertaken in support of the SWA Project.
The electrolysis process for conversion of LiCl
is fundamentally the same as the electrolysis process used extensively in the chlor-alkali industry for conversion of NaCl to NaOH and
HCl. In order to confirm the suitability for lithium operation and specifically for LiCl from real brines, Standard Lithium commissioned
a 100 hour test using LiCl produced from Smackover brine using the DLE processes at the Demonstration Plant.
The tested electrolysis process is based on NESI’s
NORSCAND® electrolysis cell and LiCl process and utilizes a membrane electrolysis cell configured specifically for LiCl electrolysis.
This produces a high purity lithium hydroxide solution whilst co-producing hydrogen and chlorine which can be reacted to produce concentrated
HCl. This acid can then be utilized in the process or sold as a by-product dependent on the reagent usage and overall chemical balance.
NORAM’s wholly owned subsidiary, NORAM
Electrolysis Systems Inc. (NESI) has supported Standard Lithium in development of both the PEA and PFS phases of the SWA Project and
their technology therefore forms the basis for the evaluation of the suitability of Electrolysis for processing lithium brines from the
Smackover Formation. NESI in turn have a long-term working relationship with Electrosynthesis Inc. for testing, with the laboratory scale
testing preferentially undertaken in Lancaster. The 100 hour laboratory scale test of NESI’s electrochemical cell, was therefore
undertaken at Electrosynthesis’ laboratory in Lancaster, NY.
A sample of LiCl produced by the Demonstration
Plant was processed for purification and sent to Lancaster for conversion in the NS-01 cell from NESI (~150 cm²). The cell is a
similar design to a commercial electrolyzer, using a DSA-Cl2 anode, SS316 cathode and S-2301 (AGC, Japan) a commercially-available perfluorinated
cation exchange membrane. Testing was undertaken over the course of 146 hours. A portion of the lithium hydroxide solution produced was
crystallized via a double crystallization to produce a battery-quality sample of lithium hydroxide.
| South West Arkansas Project Pre-Feasibility Study | 18 Sept 23 |
The testing confirmed the efficacy of electrolysis
indicating that a commercial system could be expected to operate around 4.5V and 75% current efficiency for the production of a 2 Molar
lithium hydroxide (LiOH) solution and producing a battery quality lithium hydroxide product meeting a typical high purity grade. Testing
of conversion of the co-produced hydrogen and chlorine gas to HCl was not undertaken on the basis that this is well proven, commercially
available technology that is in widespread use.
The testing validates the applicability of the
electrolysis as a viable technology for converting LiCl from Smackover brines to lithium hydroxide.
In addition to the SWA Project specific testing,
NESI have conducted several previous laboratory programs (including testing on multiple actual and synthetic lithium brines for over
1,000 hours each) in a scalable electrolyzer for other prospective lithium producers where similar LiOH conversion flowsheets have been
tested, further providing confidence in the technology application. NESI has also confirmed the cell test performance at commercial electrode
sizes.
Standard Lithium has undertaken project specific
laboratory scale testing and have already commissioned full-height cell testing and 1,000-hour operational testing to be undertaken in
H2 2023 as part of the DFS phase.
| 13.6.2 | Bi-polar Membrane Electrodialysis
(BPMED) |
Electrosynthesis bipolar membrane electrodialysis
testing is similar to the testing of the NORAM cell. A 100-hour test was undertaken for bipolar membrane electrodialysis using the same
feedstock as the electrolysis testing in order to facilitate a like-for-like comparison and understand the magnitude of the potential
benefits and downsides relative to each other. Similar to the electrolysis testing undertaken in Lancaster, a portion of the lithium
hydroxide solution was subsequently crystallized to produce a battery-quality sample of lithium hydroxide.
The three-compartment experiments were carried
out in an Eur-2C electrodialysis cell which comprises of five cells each with an area of 200 cm2 (the membranes used for these
tests were from Neosepta/Astom). The 100 hour test proved the use of bipolar membrane electrodialysis as successful in the production
of lithium hydroxide and hydrochloric acid from LiCl. The tests showed good efficiency for producing 1.5 Molar lithium hydroxide and
2.5 Molar HCl with an estimated average energy consumption of about 2,000 kWh/tonne of lithium hydroxide (100% LiOH.H2O) for the electrodialysis
cells. A key downside identified was the large quantity (approximately 9,500 L) of low grade acid (~5% HCl) containing at least 100 ppm
of LiCl that would also be produced per tonne of lithium hydroxide. Without recycle, this represents a potential loss of lithium.
| South West Arkansas Project Pre-Feasibility Study | 18 Sept 23 |
Whilst the testing validated the applicability
of BPMED for Smackover brines, the large volume of low grade acid, potential lithium losses and larger maintenance burden due to the
substantial number of membranes required, results in this technology not being recommended for the Standard Lithium flowsheet.
| 13.6.3 | Direct Lithium Conversion |
Direct Lithium Hydroxide Conversion (DLC) is
a proprietary process developed by Suez Water Technologies & Solution (now Veolia Water Technologies) and uses a simulated moving
bed to convert the LiCl to LiOH using NaOH – a pilot plant was installed at the Demonstration Plant site in October 2022 and
commissioned and run continuously for 8 months using pre-treated Smackover brines directly from the Demonstration Plant. The simulated
moving bed has been used elsewhere for LiCl extraction, with the development in this space to facilitate direct conversion of a purified
LiCl stream to lithium hydroxide.
The pilot plant was proven to generate a suitable
battery-quality product and is a viable technology for consideration on future projects. Although the simulated moving bed is commercially
proven for other applications, this type of application is novel and it is recommended to pilot at larger scale prior to commercialization
due to being first-of-a-kind.
| 13.6.4 | Further Development |
Electrolysis is deemed to be the most reliable,
proven, and lowest risk of the technologies assessed to take through to commercialization. The key advantages over BPMED are:
| · | Electrolysis
achieves an almost complete separation of the lithium and chloride, |
| · | Higher
purity LiOH stream containing less chloride; |
| · | The
high purity hydrogen and chlorine that are produced can be easily converted to high grade
HCl that can be reused more easily in the process or sold commercially; |
| · | No
lithium losses in the hydrochloric acid stream; |
| · | An
electrolysis cellhouse of similar capacity will have a smaller footprint than a bi-polar
membrane electrodialysis cell house; and, |
| · | Fewer
membranes and resultant lower maintenance requirements. |
It is recommended that electrolysis be the core
technology for further flowsheet development with further testing for long term operation and for scaled-up operation undertaken to support
design development and project de-risking.
| South West Arkansas Project Pre-Feasibility Study | 18 Sept 23 |
| 13.7 | Crystallization and Packaging |
For commercial development, the lithium hydroxide
solution produced by the electrolysis plant will be concentrated to saturation and lithium hydroxide crystals formed in the evaporator-crystallizer
will be separated, dried, re-sized (if required) and packaged in an inert atmosphere.
It should be noted that the final concentration
and evaporation-crystallization of lithium hydroxide is an industry-standard process and is practiced extensively at a commercial scale.
| 13.8 | Process Testing QA/QC |
During the operation of the Demonstration Plant,
routine daily chemical analysis is conducted in the internal Standard Lithium laboratory using standard solution analysis instrumental
techniques; principally, Inductively Coupled Plasma – Optical Emission Spectroscopy (ICP-OES). For more important determinations,
duplicate samples are submitted to SGS Canada Inc. (SGS) for analysis using their standard ISO 9000 compliant protocols (principally
ICP-OES), developed based on their experience working on numerous lithium projects. Additional brine and solid samples are also periodically
sent to other third-party analytical laboratories (principally WetLabs) in order to provide suitable independent verification of data
generated by the Demonstration Plant.
Other instrumentation in the Demonstration Plant
undergoes a rigorous maintenance schedule to ensure accurate collection of data from the plant.
Throughout the process test work described, the
author has had the following interactions:
| · | Visited
the Demonstration Plant and observed all unit operations currently being tested there; |
| · | Witnessed
the 100 hour electrolysis test work at ESC in Lancaster, NY; |
| · | Participated
in weekly video meetings throughout the entire operating period of the PFS Project Phase;
and, |
| · | Received
daily data summaries regarding the operation of the Demonstration Plant and all analytical
output. |
| South West Arkansas Project Pre-Feasibility Study | 18 Sept 23 |
As noted above, the pre-treatment portion of
the flowsheet is industry standard technology and is already in use at commercial scale in the southern Arkansas region. As such no scale-up
risk is envisaged for this unit operation.
The selected LSS DLE process has now operated
continuously for approximately 10 months at a pre-commercial Demonstration Plant scale and has been developed to FEED (DFS) level in
support of the LANXESS Project Phase 1A and pre-FEED (PFS) level for the South West Arkansas Project and it has been confirmed that all
of the operations involved in the DLE process can be reasonably scaled-up. Scale-up will occur by the addition of multiple standard size
LSS columns operating in parallel with the number required determined based on brine flowrate and lithium concentration. Scale-up from
the Demonstration Plant to prove commercialization as part of the Lanxess Project Phase 1A will be a 60:1 scale-up based on flowrate
with subsequent scale-up to SWA Project capacity requiring a 2.5:1 scale-up based on flowrate.
The purification and concentration elements of
the flowsheet are already in widespread use in similar industries and at larger scale than required for the SWA Project and is not deemed
an area of risk for scale-up. Similarly the product crystallizer and product handling equipment is not deemed an area of risk.
Based on input from NORAM, referencing other
lithium and sodium chemistries and test data, no significant issues are envisaged for scale-up of the electrochemical conversion and
evaporation/crystallization of lithium hydroxide.
To date, no issues with process scale-up have
been identified. It is feasible, and should not present any processing challenges, to divide the large flows into smaller parallel flows,
should that be required for the full-scale plant.
| 13.10 | Process Technical Risks and Mitigation
Measures |
Similar to all lithium brine processing projects
(including those using ‘conventional’ evaporation ponds), there exist several risks that will need to be addressed or resolved
as the project moves through the usual development stages:
| · | Effect
of varying feed composition on lithium selectivity – to date, the Demonstration Plant
at the Lanxess facility has been operated with the Lanxess South Plant brine feed (as shown
in Table 13-1) which is materially similar to the SWA brine. However, the proposed brine
feed does vary sufficiently (higher lithium concentration, higher boron, etc.) that
its effect on lithium loading, and selectivity should be confirmed. Whilst the LSS has been
tested for synthetic brines, similar to the SWA feed brine, it is understood that ‘real
brines’ exhibit different behavior, therefore project specific testing is recommended.
Large volume brine samples have already been collected from the South West Arkansas brine
leases during the recent drilling campaign and it is planned to test these directly in the
LSS process in support of the Feasibility Study phase of the project; and, |
| South West Arkansas Project Pre-Feasibility Study | 18 Sept 23 |
| · | Lithium
chloride to hydroxide conversion – whilst the technology required to convert lithium
chloride to lithium hydroxide is well understood, and analogous chlor-alkali technology has
been operated at very large commercial scale for many decades, there are still likely hydrometallurgical
and electrochemical subtleties that will need to be fully worked through for the Project’s
specific feed composition. As such, a rigorous pilot program to test this part of the flowsheet
using real LiCl solutions from the DLE process has been commenced with 100-hour testing and
will be further developed with full height cell testing and 1,000-hour testing in support
of the Feasibility Study phase of the project. |
| 13.11 | Conclusions and Recommendations |
Standard Lithium has completed substantial test
work, and many aspects of the proposed flowsheet at the SWA Project are either normal industrial processes, have been demonstrated at
substantial pre-commercial scale, or have been verified by pilot scale work on similar solutions. As such, it is felt by the author that
sufficient test work has been completed to support the flowsheet proposed for the SWA Project at this stage of evaluation.
Recommendations are:
| · | Continue
to operate and collect data from the existing Demonstration Plant; |
| · | Continue
to optimize the LSS DLE to improve the quality of the Raw LiCl by elimination of impurities,
including testing of new sorbents and adjustments to operating parameters; |
| · | Leverage
the design development learnings form Standard Lithium’s Commercial Lithium Extraction
Plant Project currently targeted to be in operation in 2026; |
| · | Process
volumes of feed brine from the SWA Project location through the DLE; |
| · | Complete
the SX testing and evaluate pros and cons relative to the currently proposed flowsheet; |
| · | Continue
to execute the planned testing program using real LiCl solutions from the Demonstration Plant
to obtain the key design parameters for lithium chloride to lithium hydroxide conversion
for input to engineering design; and, |
| · | Complete any necessary process equipment vendor testing for lithium
hydroxide concentration and evaporation/crystallization to a battery-quality product., |
| South West Arkansas Project Pre-Feasibility Study | 18 Sept 23 |
| 14 | Mineral
Resource Estimates |
This section describes the preparation of the
lithium resource estimates for the SWA Property, based on the volume of porous rock as estimated by the geologic model and the estimated
lithium concentrations present in the brines stored within the Upper and Middle Smackover formations on the Property. The resource estimates
associated with the Upper Smackover have been upgraded in this Technical Report from the Inferred category, PEA (Eccles, et. al, APEX,
2021), to the Indicated category based on the extensive geologic data and lithium concentration data gathered by Standard Lithium’s
2023 exploration program on the SWA Property. This new information demonstrates the presence of a porous and permeable Smackover reservoir
containing brine with significant lithium concentrations. This upgrading of the resource estimates is described in more detail in Section 14.3.
This resource estimate has been prepared in accordance
with the CIM Definition Standards for Mineral Resources and Mineral Reserves (CIM 2014). Mineral Resources are sub-divided, in order
of increasing geological confidence, into inferred, indicated, and measured categories. An Inferred Mineral Resource has a lower level
of confidence than that applied to an Indicated Mineral Resource. An Indicated Mineral Resource has a higher level of confidence than
an Inferred Mineral Resource but has a lower level of confidence than a Measured Mineral Resource.
An Inferred Mineral Resource is that
part of a Mineral Resource for which quantity and grade or quality are estimated on the basis of limited geological evidence and sampling.
Geological evidence is sufficient to imply but not verify geological and grade or quality continuity.
An Indicated Mineral Resource is that
part of a Mineral Resource for which quantity, grade or quality, densities, shape, and physical characteristics are estimated with sufficient
confidence to allow the application of Modifying Factors in sufficient detail to support mine planning and evaluation of the economic
viability of the deposit.
A Measured Mineral Resource is that
part of a Mineral Resource for which quantity, grade or quality, densities, shape, and physical characteristics are estimated with confidence
sufficient to allow the application of Modifying Factors to support detailed mine planning and final evaluation of the economic viability
of the deposit.
The estimation of resources in this report have
been carried out in conformance with NI 43-101 and have been estimated using the CIM “Estimation of Mineral Resources and Mineral
Reserves Best Practice Guidelines” (23 November 2003), CIM “Definition Standards for Mineral Resources and Mineral Reserves”
(amended and adopted 10 May 2014), and “CIM Best Practice Guidelines for Resource and Reserve Estimation for Lithium Brine”
(1 November 2012).
| South West Arkansas Project Pre-Feasibility Study | 18 Sept 23 |
The Best Practice Guidelines (CIM, 2012) have
been adapted for the specific conditions present at this Property. Unlike a brine-bearing salar, the SWA Property’s brine accumulation
exists in a well-defined porous geologic formation at depth, the Smackover Formation. This extensive brine accumulation is bounded vertically
by impermeable formations and laterally by the SWA Property boundaries. Also unlike a salar, the brine recovery from the Smackover is
the result of rich brine (brine containing the original concentration of lithium) displacement by injected lean brine (brine that has
had the lithium extracted in the processing plant). This brine-on-brine displacement mechanism is efficient, with all of the lithium-bearing
brine in a given reservoir volume that is contacted by the injected brine being fully displaced. For this reason, the Guidelines’
use of Specific Yield for estimating resources, which assumes some remaining content of lithium in the subject formation, has been replaced
here with the calibrated log or measured core porosity of the formation. In future evaluations the estimation of the overall fraction
of the resources that will be recovered by the project (the recovery factor, equal to the estimated reserves divided by the estimated
resource for the SWA Project area) will be done using a reservoir simulation incorporating the available geologic and fluid description
data.
This approach to the estimation of resources
using a detailed layered geologic model fully captures the factors that affect the content and quality of brine and the associated lithium
in this porous underground formation.
| 14.1 | Geologic Model Description |
In order to understand and quantify the Smackover
Formations’ structure, geometry, and the location of the porous and permeable zones within the formation, a multi-layer geologic
model of the SWA Property was constructed as the basis of the resource estimates in this Technical Report using industry-standard software
and procedures. Beginning with the structural understanding of the overall Smackover Formation developed through analysis of the well
data and seismic data, the next level of detail was added to the geologic description by separating the Smackover Formation into eight
separate layers and evaluating the geologic characteristics of each layer. This geologic mapping effort covered the SWA Property and
the surrounding area (the Geologic Study Area) as depicted in Figure 10-1. The procedures followed in creating this multi-layer geologic
model relate to well log and core data analysis, net pay estimation, the mapping procedures, and the estimation of in-place volumes.
This geologic modeling exercise is significantly more detailed and rigorous than that carried out for the PEA, thanks to the large amount
of new data provided by the Standard Lithium exploration program.
| South West Arkansas Project Pre-Feasibility Study | 18 Sept 23 |
The following steps were carried out to construct
the multi-layer geologic model:
| 1. | The Smackover Formation was divided into
eight layers, with five in the Upper Smackover zone and three in the Middle Smackover zone,
based on their distinct geologic characteristics. These divisions are identified in the Montague
1 well type log, Figure 14-1. Included on the log is the interval cored, the measured core
permeabilities (shaded green where permeability is greater than 0.5 mD), the intervals meeting
the 6.0 percent porosity net pay cutoff (highlighted with the orange “Net Phi 6 Cobb”
flag and shaded green where log porosity, “PhiND CC” is greater than 6.0 percent).
The zone and layer picks were recorded for each of the 97 well logs within the SWA Property
and 322 well logs outside the SWA Property, to the extent allowed by the depth encountered
for each well. |
| 2. | Core data, obtained from whole cores and
from rotary sidewall cores taken in 15 wells within the SWA Property and 23 wells outside
the SWA Property, is the starting point for quantifying the amount of porous Smackover Formation
in the SWA Property. The core data from both the prior wells and the 2023 Standard Lithium
exploration program wells was compiled and reviewed. Figure 14-2 is a cross plot of the permeability
values against the porosity values for this body of data. This evaluation demonstrates there
is a large fraction of the core data with moderate to high permeability values (between 0.5
and 6,000 mD), which is important in a brine displacement process such as that used at the
SWA Property to recover the target lithium. |
| 3. | The Smackover Formation core porosity
data was compared to the log porosity data and a calibration function relating the log porosity
data to the core porosity data (which is considered the most accurate measure of porosity)
was created (see Figure 14-3). Each porosity well log was then calibrated using that equation.
The type well (Figure 14-1) demonstrates the close relationship between the calibrated porosity
log (PhiND_CC) and the Core Porosity data values in the Upper Smackover main pay zone from
9,120 feet to 9,220 feet (2,780m to 2,810m). |
| 4. | Consistent with the use of the most accurate
data available, for those wells with both log and core porosity data, the core porosity data
was used whenever available, with the calibrated log porosity curve used elsewhere. This
resulting calibrated best estimate of formation porosity is labeled the “COBB Porosity”
curve on Figure 14-4. |
| 5. | A 6.0 percent minimum porosity cutoff
was applied to each well’s calibrated porosity values. This cutoff value corresponds
to approximately a 0.1 mD permeability, the minimum permeability expected to contain mobile
brine. |
| South West Arkansas Project Pre-Feasibility Study | 18 Sept 23 |
| 6. | The resulting net pay intervals were evaluated
to determine for each of the eight layers the net pay thickness (the productive thickness
of the layer exceeding the minimum porosity cutoff), the average porosity for that net pay
interval, and the ratio of net pay thickness to gross thickness. Gross thickness values were
also estimated for wells with only resistivity logs (which permitted layer boundary selection),
but net pay thickness was only calculated when porosity data was available. |
| 7. | An example of this process is shown in
Figure 14-4. The layer picks result in the gross pay values, the application of the 6.0 percent
porosity cutoff results in the net pay values, the ratio of those two values provides the
net to gross ratio, and the average porosity over each layer’s net pay intervals results
in the average porosity of the net pay for that layer. |
| 8. | With regard to the software employed,
each of the 98 wells within the SWA Property and 326 wells outside the SWA Property had their
geologic data (location, wireline well logs) imported into Petra® Software. Available
digital porosity data were imported into PowerLog ® Software database, calibrated to
core porosity, and exported for inclusion in the Petra® Software. The top of Smackover
Formation depths picks, along with the by-layer gross thickness, net to gross ratio, and
porosity data were evaluated using the Petra® Software. |
| 9. | A 500 ft by 500 ft (152.4 m by 152.4 m)
mapping grid was established, and the well geologic data was contoured using two Petra gridding
options: |
| a. | The Highly Connected Features
option applied a least-squares gridding algorithm that is well-suited to both structure maps
and the smoothly-changing petrophysical data present here. The “grid flexing”
option, appropriate for this type of well-behaved data, was used to regularize the maps’
contour lines. |
| b. | The Directional Bias option was
used, with a direction of 95 degrees. This directional bias was applied to capture the regional
strike direction of the Smackover Formation, corresponding to the orientation of the oolite
bars as they were deposited. |
| 10. | Following the gridding and contouring
process, bounding limits were applied to the gross thickness, porosity, and net thickness
to gross thickness ratio grids. The gross thickness, porosity, and net thickness to gross
grids were constrained to between 95 percent of the minimum observed value and 105 percent
of the maximum observed value to prevent the mapping algorithm from extrapolating to unreasonable
values. Additionally, porosity values were limited to no lower than the 6.0 percent cutoff
for net pay. The net thickness to gross thickness ratio grids were further constrained between
0.0 and 1.0, corresponding to the physical limits of that ratio. |
| South West Arkansas Project Pre-Feasibility Study | 18 Sept 23 |
| 11. | The net pay grid for each of the individual
layers was calculated by multiplying the gross thickness grid by the net thickness to gross
grid. Similarly, the pore-thickness grids for each layer were calculated by multiplying the
calculated net pay grids by that layer’s porosity grids. |
| 12. | The resulting layer grids for structure,
porosity, gross pay, and net pay were then summed as appropriate to create maps of gross
pay, net to gross ratio, net pay, average porosity, and pore-thickness for the Upper Smackover
and the Middle Smackover zones. |
Figure 10-1 depicts the locations of the 98 wells
within the SWA Property and 326 wells outside the SWA Property containing structure, porosity, or core data relevant to the description
of one or more of the eight layers. Figure 7-5 presents the structure map for the top of the Smackover Formation. Figure 14-5 is a porosity
cross section through the five 2023 exploration program wells. It uses as a datum the top of Upper Smackover, and illustrates the thick,
continuous nature of the high-porosity net pay (shaded in green, yellow, orange, or red) Upper Smackover Formation, in comparison to
the thinner, less-continuous Middle Smackover Formation net pay.
The net porosity-thickness (also known as Phi-H)
maps for the Upper and Middle Smackover zones are presented in Figure 14-6 and Figure 14-7. Net porosity thickness is a direct indicator
of the amount of brine below any location on the SWA Property. The greater the mapped pore-feet, the greater the volume of brine. Each
porosity-thickness map is multiplied by the lithium concentration map, then integrated over the SWA Project area to obtain the in-place
lithium resource estimates for each zone.
| South West Arkansas Project Pre-Feasibility Study | 18 Sept 23 |
Figure 14-1. South West Arkansas Field Smackover
Type Well, Montague 1

| South West Arkansas Project Pre-Feasibility Study | 18 Sept 23 |
Figure 14-2. Core Data Plot

Figure 14-3. Porosity Log Calibration to Core
Data Plot

| South West Arkansas Project Pre-Feasibility Study | 18 Sept 23 |
Figure 14-4. Porosity Log Net Pay Example

| South West Arkansas Project Pre-Feasibility Study | 18 Sept 23 |
Figure 14-5. Stratigraphic Cross Section, Exploration
Program Wells

| South West Arkansas Project Pre-Feasibility Study | 18 Sept 23 |
Figure 14-6. Total Upper Smackover Net Porosity-Thickness

| South West Arkansas Project Pre-Feasibility Study | 18 Sept 23 |
Figure 14-7. Total Middle Smackover Net Porosity-Thickness
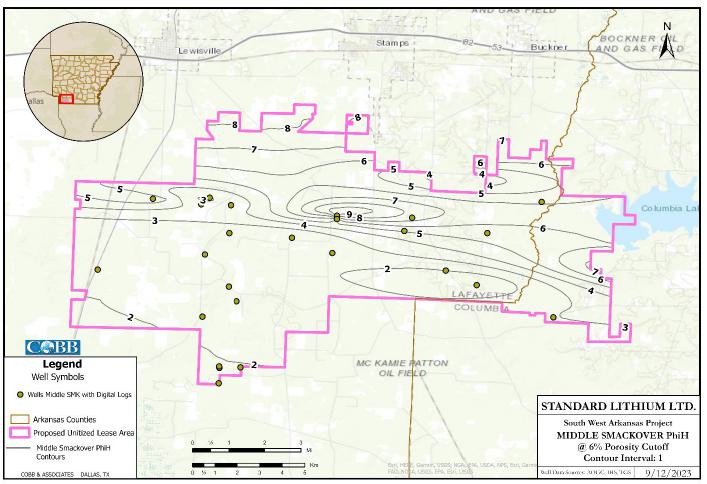
| 14.2 | Lithium Resource Estimates |
To obtain the in-place lithium resource estimates
for Upper Smackover and Middle Smackover zones the corresponding net porosity-thickness map (Figure 14-6 and Figure 14-7) has been multiplied
by the lithium concentration map (Figure 9-2), then integrated over the SWA Project area. The resulting estimated average geologic properties,
average lithium concentrations and the estimated indicated (Upper Smackover) and inferred (Middle Smackover) lithium resource values
for the total SWA Property Area are presented in Table 14-1 and Table 14-2. The distinction between North and South Areas, separated
by the Brown Fault, has been retained to allow comparison to prior studies.
Using a conversion factor of 5.323 kg of lithium
carbonate equivalent (LCE) per kg of lithium, the Indicated Resource value corresponds to an estimate of 1.43 million metric tonnes LCE.
For the Inferred Resource, the estimate is 392 thousand metric tonnes LCE.
| South West Arkansas Project Pre-Feasibility Study | 18 Sept 23 |
The lithium resource estimates presented in Table
14-1 and Table 14-2, effective August 8, 2023, do not consider a minimum lithium concentration cutoff because the entirety of the
SWA Property exceeds the previously-used 100 mg/L cutoff value, which is still considered an appropriate cutoff point for assessing project
viability. In addition, it is important to note that mineral resources are not mineral reserves and do not have demonstrated economic
viability. There is no guarantee that all or any part of the mineral resource will be converted into a mineral reserve. The estimate
of mineral resources may be materially affected by geology, environment, permitting, legal, title, taxation, socio-political, marketing,
or other relevant issues.
Table 14-1. SWA Property Geologic Factors and
Indicated Lithium Resource Estimates
| | |
Indicated
Resource | |
| Smackover Formation | |
North
Upper | | |
South
Upper | | |
Total
Upper | |
| Gross
Volume, km3 | |
| 4.69 | | |
| 2.80 | | |
| 7.49 | |
| Net
Volume, km3 | |
| 3.17 | | |
| 1.93 | | |
| 5.11 | |
| Average Porosity | |
| 11.7 | % | |
| 11.9 | % | |
| 11.8 | % |
| Average Lithium Concentration, mg/L | |
| 408 | | |
| 507 | | |
| 446 | |
| Indicated Lithium Resource, Thousand Tonnes | |
| 152 | | |
| 116 | | |
| 269 | |
| LCE, Thousand Tonnes | |
| 810 | | |
| 620 | | |
| 1,430 | |
| South West Arkansas Project Pre-Feasibility Study | 18 Sept 23 |
Table 14-2. SWA Property Geologic Factors and
Inferred Lithium Resource Estimates
| | |
Inferred
Resource | |
| Smackover Formation | |
North
Middle | | |
South
Middle | | |
Total
Middle | |
| Gross
Volume, km3 | |
| 6.04 | | |
| 2.98 | | |
| 9.02 | |
| Net
Volume, km3 | |
| 1.60 | | |
| 0.46 | | |
| 2.06 | |
| Average Porosity | |
| 9.0 | % | |
| 8.1 | % | |
| 8.8 | % |
| Average Lithium Concentration, mg/L | |
| 379 | | |
| 508 | | |
| 405 | |
| Inferred Lithium Resource, Thousand Tonnes | |
| 55 | | |
| 19 | | |
| 74 | |
| LCE, Thousand Tonnes | |
| 291 | | |
| 100 | | |
| 392 | |
Notes for Table 14-1 and Table 14-2:
1. Numbers may not add up due to rounding
to the nearest 1,000 unit
2. The resource estimate was developed
and classified in accordance with guidelines established by the Canadian Institute of Mining and Metallurgy. The associated Technical
Report was completed in accordance with the Canadian Securities Administration’s National Instrument 43-101 and all associated
documents and amendments. As per these guidelines, the resource was estimated in terms of metallic (or elemental) lithium.
3. In order to describe the resource
in terms of ‘industry standard’ lithium carbonate equivalent, a conversion factor of 5.323 was used to convert elemental
lithium to LCE.
The resource category associated with the Upper
Smackover Formation has been changed from the Inferred Resource category in the PEA (Eccles, et. al, APEX, 2021) to Indicated Resource
in this Technical Report. This reclassification is based on the large amount of geologic and sample composition data collected within
the SWA property by the 2023 exploration program. This body of data has clearly demonstrated the presence, volume, and quality (permeability)
of the porous reservoir, and the high lithium content of the associated brine. The test program has demonstrated the ability of the Upper
Smackover intervals to produce that brine. The lithium associated with the Middle Smackover has been maintained as an Inferred Resource,
awaiting further testing and delineation.
| South West Arkansas Project Pre-Feasibility Study | 18 Sept 23 |
The entirety of the SWA Property exceeds the
100 mg/L minimum concentration cutoff value appropriate for this project. The resource estimates have been determined on the basis of
100 percent of the Upper and Middle Smackover within the proposed unitized boundary for the SWA Property. This is consistent with the
AOGC approach to unitization and brine production. The application of the geologic data and the associated production that can be achieved
from the resource are outlined in Section 16, with those production rates setting the basis for the PFS flowsheet development and
project cost estimates and underlying economic viability.
| South West Arkansas Project Pre-Feasibility Study | 18 Sept 23 |
| 15 | Mineral
Reserve Estimates |
No mineral reserves estimates were made.
| South West Arkansas Project Pre-Feasibility Study | 18 Sept 23 |
| 16.1 | Lithium Recovery Process |
Recovery of a portion of the SWA Property’s
lithium resources described above will employ the same brine displacement process already in use throughout southern Arkansas for the
recovery of bromine. This process incorporates brine production wells with down-hole pumps, surface flowlines, brine processing facilities,
and effluent brine injection wells. Once the lithium is extracted from the produced brine in the processing facilities the resulting
effluent brine will be injected into the Smackover Formation using the injection wells. For the purposes of reservoir evaluation, effluent
brine with the lithium extracted is referred to as lean brine and is used to differentiate the reinjected brine from the in-situ lithium
rich brine, specifically to allow the observation of break through where lean brine starts to be produced at a specific well resulting
in a drop-off in lithium production. This production and injection process from a deep Smackover Formation brine reservoir is conducted
at the adjacent Albemarle bromine project and the Lanxess bromine project further to the east and incorporates the production and injection
technology and underground displacement mechanisms proved up by both those two projects for over 60 years and by the petroleum industry
in thousands of oil field waterflood projects world-wide.
The brine recovery process applied at the SWA
Property has as its basis the displacement of rich brine to the production wells by the injected lean brine. Three factors will determine
the overall lithium recovery rate from this process: total brine throughput, rich brine recovery efficiency, and lithium extraction efficiency
(discussed in Section 17, Recovery Methods).
The total brine throughput, which equates to
the rate at which brine is processed by the facility, is determined by the number of production or injection wells and the average production
or injection rate per well, which is a function of well operation and geologic characteristics (thickness and permeability) of the Smackover
Formation at the well locations. Total production and injection rates will be nearly identical, both as a result of the small volume
changes associated with the lithium extraction process and with the requirement that the produced brine volume needs to be replaced with
a similar volume of injected brine (net reservoir voidage approximately zero) in order to maintain the average reservoir pressure at
a nearly constant level. Brine-filled reservoirs are relatively incompressible, and are, therefore, sensitive to any significant mis-match
in net reservoir voidage. Large pressure changes could potentially result from significant positive or negative net voidage. Total brine
throughput can be increased by drilling more wells, but there are both the financial costs and the effect on produced lithium concentrations
to consider.
| South West Arkansas Project Pre-Feasibility Study | 18 Sept 23 |
The rich brine recovery efficiency, a number
that starts at zero and increases over time, with a maximum value of one, is equal to the volumetric sweep efficiency of the injected
lean brine and is equal to the fraction of the total brine volume occupied by injected lean brine at a particular time. Up until lean
brine breakthrough the rich brine recovery efficiency is equal to the cumulative injected lean brine volume divided by the total pore
volume. Following lean brine breakthrough, the rich brine recovery efficiency is equal to the net cumulative injected lean brine volume
(the cumulative injected lean brine volume minus the cumulative produced lean brine volume) divided by the total pre volume.
The rich brine recovery efficiency is affected
by the speed and extent of lean brine breakthrough in the production wells. In brine recovery projects such as this, the injected lean
brine moves through the geologic formation, displacing the rich brine to the production wells. The speed and extent of lean brine breakthrough
for a given injection-production well configuration is determined by the degree of geologic heterogeneity of the Smackover Formation
and the distance between the injection and production wells (also known as well spacing). This heterogeneity consists of the varying
permeability of the formation, ranging from near zero to several thousand millidarcies, as observed in the core data (Figure 14-2). If
additional wells are drilled the distance between injection and production wells typically decreases, resulting in higher brine throughput
but faster breakthrough of injected lean brine. The Merlin simulation model described below will be used to both estimate reserves and
to optimize the configuration of the injection and production wells, including the well spacing and alignment, in order to design an
economic long-lived (20-year lifespan) project.
This report’s eight-layer geologic model,
described in Section 14 and used to estimate the resource values, was also used to provide the geologic inputs for a finite difference
computer simulation model used to estimate the timing and amount of brine production from the SWA Property. The only difference between
the geologic description used for the resource estimates and that used for the simulation model was the application of a more-stringent
nine percent porosity cutoff. This higher porosity cutoff further restricted the simulation model’s net pay to that portion of
the reservoir with sufficient permeability for brine to be displaced and produced over the expected distances between injection and production
wells.
| South West Arkansas Project Pre-Feasibility Study | 18 Sept 23 |
The Merlin reservoir simulation model, an industry-standard
finite-difference simulation model created by Gemini Solutions, Inc., was used to model brine movement and lithium recovery.
The Merlin simulation model was loaded with the
by-layer geologic model maps, which were re-gridded by the Merlin software to conform to the model’s gridding scheme. The model
covers an area of approximately 17.9 miles by 11.9 miles (28.8 km by 19.2 km). The model grid dimensions are 101 cells in the east-west
direction, 67 cells in the north-south direction, and eight model layers, resulting in 54,136 cells in the model. An equation to calculate
permeability as a function of porosity was developed based on the core permeability and porosity data, Figure 16-1, and was applied to
each layers’ porosity data, resulting in variable permeability values for each cell in the model. This technique captures a large
part of the permeability heterogeneity present in the Smackover Formation and its impact on brine movement.
The Merlin model has the capability of tracking
different brines using a tracer element. This capability was used to initialize the model with lithium concentrations across the model
area equal to the mapped lithium concentrations described in Section 9.2. The model then tracked the lithium concentration in the
rich brine within the reservoir and in the brine produced in each well, as well as the injected lean brine (with lithium removed), and
its movement through the reservoir during a 20-year proposed development.
The initial well count and locations resulted
in brine production and injection rates sufficient for a 30,000 tonne per year facility capacity. This preliminary well field layout
was used to estimate project well costs. Based on pressure profiles in the reservoir and the absence of significant predicted lean brine
break through, this initial production and injection well configuration can be further optimized during the Feasibility Study phase of
the SWA Project.
While preliminary, the model’s initial
results indicate the SWA Property appears to be capable of producing greater than 30,000 metric tpa of lithium hydroxide for 20 years
or more, and that production rates greater than 35,000 metric tpa are probable with modifications to the assumed production and injection
well count and configuration, given our current understanding of the SWA Property’s geology and distribution of lithium. Quantifying
the reserves associated with the SWA Property will be a goal for the next phase of evaluation, with the model description updated with
additional geologic and concentration data. These further revisions to the well configuration will help optimize field lithium recovery
and development economics.
| South West Arkansas Project Pre-Feasibility Study | 18 Sept 23 |
Figure 16-1. Core Data Plot with Permeability
Data Fit and Equation

Based on the outputs of the Merlin modelling
described in Section 16.2, a network of brine supply wells will produce from the Smackover Formation. For the purpose of the PFS,
the number of supply wells is estimated to be 21, however this will be optimized in subsequent project development phases. The brine
supply wells will produce between 200 m3/day and 2,100 m3/day with an average rate of 1,715 m3/day.
The average brine production rate will be 1,800 m3/hr (7,925 US gpm) during the 8,000 hours in the operational year. The supply
wells, as modelled, have been located on the unoptimized modelling parameters and without consideration for surface locations and therefore
can be expected to change somewhat prior to commercial operations.
To support commercialization, the wells will
be grouped into multi-well pad facilities based on the desired bottom hole locations and the distance from the drilling pad achievable
for well bores of this size and depth. This has resulted in well pads with facilities for 2, 3, 4 or 5 wells. Multiple wells per pad
is advantageous in minimizing initial capital expenditure and improving long-term maintainability. Brine from the supply facilities will
be routed from the six (current estimate) multi-well pads to the single processing facility by a network of underground fiberglass pipelines
totaling approximately 23.1 km (14.35 miles) in length. After processing, the lithium-depleted brine will be returned by a pipeline system
41.8 km (26 miles) in length to a network of brine injection wells completed in the Smackover Formation. For the purpose of the PFS,
the number of injection wells is estimated to be 22, and it is expected that this will be optimized in subsequent project development
phases. As with the supply wells, the injection wells are proposed to be grouped into nine (current estimate) multi-well pad facilities.
All extraction and reinjection will occur in the single unitized area to maintain reservoir pressures.
| South West Arkansas Project Pre-Feasibility Study | 18 Sept 23 |
| 16.4 | Well Field Configuration |
The brine supply wells will extract the raw brine
from the Smackover Formation on a continuous, 24-hour, 365 days per year operation. Operational up time has been estimated to be 8,000
hours per year to account for ongoing maintenance, system upsets, weather outages, etc. The brine supply wells will be conventional
brine wells similar to those used through-out the Smackover and will be equipped with an 800 HP electric submersible pump (ESP) that
will pump the brine to the surface through 7 inch tubing (~178mm) as depicted below in Figure 16-2.
Figure 16-2. Supply Well Process
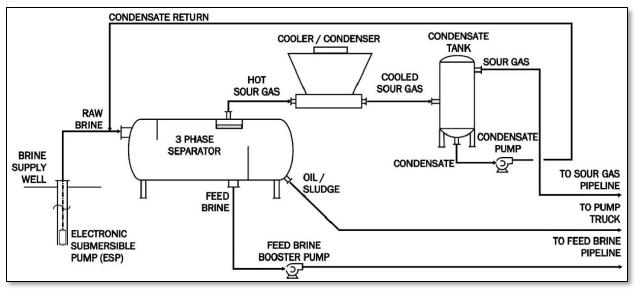
As the brine is pumped to the surface, naturally
occurring gas (usually sour in the project area) will evolve out of the brine as the pressure drops. The brine, sour gas, and trace amounts
of oil and solids will be separated from one another at the well pads using three-phase separators.
| South West Arkansas Project Pre-Feasibility Study | 18 Sept 23 |
The brine and sour gas streams produced will
be sent from the separators in dedicated pipelines, with the production from each well at the well pad comingled prior to pumped delivery
by pipeline to the main processing facility.
Fluid flow from each well pad will be further
comingled to minimize the number of pipelines feeding the CPF. This has the added benefit of reducing the impact of brine compositional
variability by mixing all the brine streams at the well pads and from all the well pads in the brine supply pipelines. Brine pumped from
production wells and well pads through the brine pipeline is discharged to a large capacity brine receiving tank at the main processing
facility.
The oil phase that is separated from the brine
will be stored in tanks on the well pad and periodically removed via a pump truck for further processing at a local refinery or by a
3rd party.
The sour gas evolving from the brine containing
light hydrocarbons such as methane and ethane in addition to hydrogen sulfide, carbon dioxide and water vapor is separated from the brine
in the three-phase separators and cooled to condense out higher boiling point condensable hydrocarbons and water. The liquids (condensate)
will be separated and returned to the three-phase separator feed to facilitate capture and separation with the oil phase. The resultant
non-condensable sour gas from all of the brine supply wells is subsequently delivered to the central processing facility (CPF) by the
motive force of the ESP pumped pressure. At the CPF, the sour gas will be compressed for delivery into an existing sour natural gas gathering
pipeline, where it may be diverted for reinjection or sent to the nearby Mission Creek Dorcheat Gas Plant where it will be sweetened
for beneficial re-use.
Once the lithium is removed from the produced
brine, effluent brine (or lithium-free brine) is then disposed of through the injection wells. A network of pipelines connects the CPF
to the injection (or disposal) wells. Similar to the supply wells, the injection wells will be grouped into multi-well well pad facilities.
Effluent brine is delivered from the main processing facility by brine pumps to the well pads. The effluent brine is then pumped down
through the injection wells, which are similar in nature to the supply wells without the ESP’s, into the Smackover Formation. The
reinjection of the effluent brine is necessary to maintain the pressure in the Smackover Formation aquifer and to displace the rich brine
to the production wells and is standard practice in Smackover brine operations.
| South West Arkansas Project Pre-Feasibility Study | 18 Sept 23 |
Standard Lithium will produce battery-quality
lithium hydroxide from Smackover Formation brine. Lithium-containing brine will be produced from brine supply wells, as discussed in
Section 16. The produced brine will be pipelined to the Central Processing Facility (CPF) for recovery of lithium and for further
processing to the final product. Base case lithium hydroxide production will be 30,000 tonnes/year over a 20-year operating lifetime.
The lithium recovery from the brine into the final product is estimated to be approximately 92% based on the performance of the LSS DLE
and associated lithium losses in other parts of the process. Optimization of the process during future design phases is expected to result
in higher lithium recovery. This in turn would result in increased production or lower CAPEX costs. The production process includes the
following major unit processes:
| · | Brine
pre-treatment; |
| · | Lithium
chloride extraction from the brine by Direct Lithium Extraction (DLE); |
| · | Lithium
chloride purification and concentration; |
| · | Lithium
chloride electrolysis to convert to lithium hydroxide; and, |
| · | Lithium
hydroxide crystallization, drying and packaging. |
The overall process Block Flow Diagram (BFD)
is shown in Figure 17-1 and described in additional detail below.
| South West Arkansas Project Pre-Feasibility Study | 18 Sept 23 |
Figure 17-1. Overall Block Flow Diagram of
Lithium Hydroxide Production from Smackover Formation Brine

| South West Arkansas Project Pre-Feasibility Study | 18 Sept 23 |
| 17.1 | Brine Production and Delivery |
Brine will be delivered from the brine production
well field via fiberglass pipelines to the brine receiving tank at the CPF as discussed in Section 16.
| 17.2 | Production of Purified Lithium
Chloride Solution |
The first step in producing lithium hydroxide
in the CPF will be pretreatment of the brine, including pH adjustment, H2S removal, and filtration to remove suspended solids.
Next, lithium chloride will be selectively recovered from the pretreated brine using a Direct Lithium Extraction (DLE) technology. Then,
the lithium chloride solution from the DLE process will be purified and concentrated, preparing it for electrolysis.
| 17.2.1 | Pretreatment of the Feed Brine |
Based on the average of the on-lease samples
taken during the 2018 and 2023 sampling programs (see Figure 9-1), the blended produced brine delivered to the CPF is estimated to have
a lithium concentration in the order of 437 mg/L as lithium. The brine will be hot (>70°C), highly saline (TDS of about 340,000
mg/L), low in sulfate, and will have a specific gravity of about 1.2. Sodium and calcium chlorides are the main constituents of the brines.
Prior to lithium extraction, the brine will be
pre-treated to remove suspended solids, dissolved gas (including H2S), and crude oil. The brine will be treated with hydrochloric
acid to lower its pH to ensure the sulfur components are in the sulfide form, and then vacuum-degassed to remove dissolved gases. Dissolved
gases include hydrogen sulfide (H2S), carbon dioxide (CO2), low-boiling-point hydrocarbons such as methane (CH4),
and inert gases such as nitrogen (N2). Gases separated from the brine in the vacuum-degassing process will be compressed and
combined with the sour gas from the production wells and pipelined to the Mission Creek Dorcheat Gas Plant (or reinjected).
The degassed brine will then be treated with
caustic soda to raise the pH to be slightly basic prior to filtration. The brine will then be passed through a walnut filter to remove
residual dissolved oil and a pressurized ultrafiltration membrane filter to remove fine particulates including precipitated silica. The
membrane brine filter will be backwashed periodically to remove captured solids. The captured solids and the backwash will be redissolved
with acid (if required) and sent to the effluent brine stream for disposal.
| South West Arkansas Project Pre-Feasibility Study | 18 Sept 23 |
| 17.2.2 | Lithium Extraction Process |
The key unit process for the production of lithium
chloride solution is the Direct Lithium Extraction process, the lithium selective sorption (LSS) process outlined in Section 13.
The LSS equipment is a Koch Technology Solutions
proprietary technology for which Standard Lithium have a Joint Development Agreement and Smackover exclusivity agreement in place. The
process will be a fixed bed, selective adsorption process that favors lithium chloride. Lithium-rich brine will be pumped through the
fixed bed of sorbent, loading the sorbent with both lithium and chloride ions, and discharging a raffinate that is barren of lithium.
The loading will be stopped at the point that lithium breakthrough occurs. After displacing remaining raffinate from the sorbent bed,
the sorbent will be eluted with water, releasing the lithium and chloride, and producing an eluate that is higher in lithium concentration
and much lower in other undesirable ions such as sodium, potassium, calcium, and magnesium. Remaining eluate will then be displaced from
the column and the cycle will be repeated.
After the LSS DLE process, the eluate or raw
lithium chloride solution will contain approximately 620 mg/L of lithium at ~95% recovery and will have rejected in excess of 98% of
the major contaminants for sodium, calcium, magnesium, and potassium. This raw lithium chloride solution will then be sent to the first
of two seawater reverse osmosis (SWRO) systems for preliminary concentration. The SWRO permeate will be recycled to the DLE process to
minimize the freshwater consumption of the process and the retentate will pass to raw lithium chloride storage prior to further purification
and concentration in preparation for processing by electrolysis.
Given the large volumes required to produce 30,000
tonnes per annum of lithium hydroxide product, the LSS unit will comprise of multiple columns (up to 36), and it is planned that these
will be operating in various stages of loading and elution, smoothing out the semi-batch operation.
| 17.2.3 | Lithium Barren Brine Disposal |
The raffinate or lithium-barren brine from the
DLE will be pumped to the effluent brine tank where other process waste streams such as filter backwash and resin regeneration streams
are combined prior to pH adjustment to achieve a final discharge pH of between 4.5 and 5.5. This pH is required to:
| · | Avoid
any precipitation issues in the brine injection wells; and, |
| · | Meet
best-practice guidelines for reinjection of effluent brine into the Smackover Formation. |
| South West Arkansas Project Pre-Feasibility Study | 18 Sept 23 |
Effluent brine from the lithium extraction process
will be pumped via pipelines to a dedicated set of brine injection wells for disposal back into the Smackover aquifer. The disposal of
brine to the aquifer is important for management of the brine resource. Twenty-two brine injection wells are proposed to be used for
disposal of lithium barren effluent brine (see Section 16).
| 17.2.4 | Raw Lithium Chloride Purification and Concentration |
The raw lithium chloride from raw lithium chloride
storage will pass through a lithium chloride specific SWRO system to continue concentrating the solution. The retentate stream will then
undergo removal of residual divalent ions, including calcium (Ca+2) and magnesium (Mg+2), using a lime and soda
ash softening system followed by industry-standard ion exchange treatment.
After removal of divalent ions, the lithium chloride
solution will pass through an industry-standard boron ion exchange resin for removal of residual boron.
Following ion exchange, the purified lithium
chloride solution will be further concentrated to produce a lithium chloride concentrate with a range of lithium concentration over 80,000
mg/L. The first concentration step uses an ultra-high pressure reverse osmosis process. The second step uses an evaporator-crystallizer
to remove water and precipitate sodium chloride and potassium chloride crystals. The evaporated water will be condensed and recycled
to the process water system for reuse in the upstream process. Sodium chloride and potassium chloride crystallized out of the lithium
chloride solution will be separated by centrifuging, then will be redissolved in the effluent brine for disposal. Lithium chloride concentrate
from the evaporator-crystallizer will pass through a final ion exchange system for polishing to remove the remaining calcium and magnesium
that will have been concentrated during the previous two steps.
The final purification step passes the lithium
chloride concentrate through a cold debromination system to remove residual bromides from the solution. The debromination system has
been considered for the PFS phase to ensure flexibility of design in advance of completion of longer term testing of electrolysis. Initial
results from the Demonstration Plant indicate that this may not be required for electrolysis operation or for product quality. The purified
lithium chloride concentrate will be considered ultrapure and will then be pumped to the lithium hydroxide process facility.
| 17.3 | Production of Lithium Hydroxide |
The ultrapure lithium chloride from the purification
and concentration process will be sent to the electrolyzer where the lithium chloride will be converted to lithium hydroxide using a
modified chlor-alkali type process. The lithium chloride along with any residual sodium chloride and potassium chloride will be converted
to their hydroxide forms by the electrolyzer using lithium specific membranes. The electrolyzer will also produce the by-products of
chlorine and hydrogen gas. These by-product gases will be sent to a hydrochloric acid synthesis unit where high purity hydrochloric acid
will be produced for use in the upstream process with any excess sold commercially as a by-product.
| South West Arkansas Project Pre-Feasibility Study | 18 Sept 23 |
The lithium hydroxide solution will then be sent
to an evaporator-crystallizer for production of lithium hydroxide crystals. Water evaporated in the crystallizer will be condensed and
returned to the catholyte loop of the electrolyzer. Excess condensate will be recycled to the process water system for use in the upstream
process. The lithium hydroxide crystals will be separated from the caustic solution using a centrifuge. The caustic liquid discharge
from the centrifuge will be recycled to the upstream process for recovery of residual lithium content and for pH adjustment. The lithium
hydroxide solids discharged from the centrifuge will be sent to a final product drier to remove residual moisture. The dried lithium
hydroxide product will finally be routed to the packaging system under a nitrogen blanket to prevent degradation.
The lithium hydroxide production process is shown
in the BFD presented in Figure 17-1.
| 17.4 | Packaging of Lithium Hydroxide |
The dried lithium hydroxide product will be a
bulk dry granule packaged in 910 kg (2,000 lb) supersacks. The packaging equipment will include a day silo for bulk lithium hydroxide
storage prior to bag filling. lithium hydroxide finished product is metered through a rotary valve to an automated bag filling station.
The bag filling station will include a nitrogen purge and bag sealer to keep carbon dioxide from contacting the product after crystallization
and through to packaging. The filled supersack will then be conveyed on a pallet to a hooding or stretch wrap station for final preparation
for storage and transport.
| 17.5 | Projected Energy, Water, and Raw Material Requirements |
The total projected energy usage is estimated
to be 433 GWh per annum. The Central Processing Facility total usage is approximately 306 GWh per annum and accounts for 71% of the total
demand, with the lithium hydroxide electrolysis plant being the largest consumer at almost 60% of the CPF load, or 176 GWh per annum.
The brine supply and injection systems will account for the remaining 29% of the total projected energy usage with the supply well field
and injection well field accounting for approximately 92 GWh per annum and 35 GWh per annum, respectively.
The Central Processing Facility will utilize
several freshwater wells to meet the water requirements of the process. The total freshwater consumption is approximately 413 m3/hr.
Approximately 292 m3/hr of the freshwater will be utilized as make-up water to the RO water system. Approximately 95% of the
RO water will be used for the elution of lithium and chloride from the sorbent beds in the DLE process, while the remaining 5% will be
utilized in the demineralized water system. The balance of freshwater will provide raw water, potable water, and cooling water makeup
for use in the Central Processing Facility.
| South West Arkansas Project Pre-Feasibility Study | 18 Sept 23 |
Raw materials used in the process consist primarily
of reagents for the control of pH. 50% Sodium Hydroxide (NaOH) solution will be the preferred base used to raise the pH and 32% Hydrochloric
Acid (HCl) will be the preferred acid used to lower the pH. The HCl usage in the process (3,165 kg/tonne of lithium hydroxide) will be
almost entirely offset by the production capacity in the HCl Synthesis unit (3,102 kg/tonne of lithium hydroxide). This substantially
reduces the quantity of fresh HCl that will need to be purchased and received at the facility each year. Other reagents that will be
used in the process are lime and soda ash for softening, corrosion and scale inhibitors, and various chemicals for the cleaning of filter
and RO membranes. The estimated raw material requirements for the process are summarized in Table 17-1 below.
Table 17-1. Raw Material Requirements
| Description | |
Consumption
per
Tonne of Lithium
Hydroxide Produced | | |
Total Annual
Consumption | |
| Well field | |
| | | |
| | |
| - Corrosion Inhibitors | |
| 0.
245 L | | |
| 7,350
L | |
| - Scale Inhibitors | |
| 0.
397 L | | |
| 11,920
L | |
| Central Processing Facility | |
| | | |
| | |
| - Hydrochloric Acid (HCl) - 32%
Concentration | |
| 63
kg | | |
| 1,893
tonnes | |
| - Sodium Hydroxide (NaOH) - 50% Concentration | |
| 1256
kg | | |
| 37,693
tonnes | |
| - Soda Ash | |
| 774
kg | | |
| 23,225
tonnes | |
| - Lime | |
| 14
kg | | |
| 418
tonnes | |
| - Sodium Metabisulfite | |
| 72
kg | | |
| 2,156
tonnes | |
| - Citric Acid | |
| 1
kg | | |
| 29
tonnes | |
| - HEDP | |
| 0.3
kg | | |
| 11
tonnes | |
| South West Arkansas Project Pre-Feasibility Study | 18 Sept 23 |
The infrastructure required to construct and operate the proposed
project is described below.
| 18.1 | Brine Supply Wells Infrastructure |
The brine well field development – comprising
well locations, well pads, and pipelines, for the PFS phase – is based on resource modeling for the Smackover aquifer using the
best data available at time of publishing. The resource definition will continue to be developed following the completion of this PFS
and during the DFS phase, resulting in improved definition of the aquifer, updating of the reservoir model, and potential adjustments
to the well field development plan. The information presented herewith should be considered indicative for the purposes of evaluating
project costs and associated economic analysis of the SWA Project.
Brine used for recovery of lithium will be extracted
from the Smackover Formation via a network of 21 brine supply wells located throughout the resource area of the SWA Project. The well
field will utilize directional drilling technology to provide an optimal well field design that consolidates the surface locations of
the wells into six multi-well pad locations. By grouping multiple supply wells into a common well pad, this will allow above ground utilities
and infrastructure to be shared among the wells – see Figure 18-1. This will both minimize capital costs and improve ongoing operating
costs. One of these multi-well pads is currently envisaged to also host injection wells.
| South West Arkansas Project Pre-Feasibility Study | 18 Sept 23 |
Figure 18-1. Brine Supply Multi-Well Pad Conceptual
Layout

Each of the brine supply wells will be equipped with a multi-stage,
electric submersible pump (ESP). The ESPs will pump the brine from the Smackover Formation to the surface where a three-phase gravity
separator will remove sour gas and crude oil from the brine before it is pumped into the brine supply network for distribution to the
Central Processing Facility.
| South West Arkansas Project Pre-Feasibility Study | 18 Sept 23 |
| 18.1.1.1 | Water Supply and Distribution |
Each of the well pad facilities will be equipped
with a water well to provide approximately 10 m3/hr (45 US gpm) of water for drilling and routine well maintenance operations.
The well pad facilities for the brine supply
wells will require approximately 12 megawatts (MW) of electric power for operating the ESPs and for routine operations of the facilities
as outlined below in Table 18-1.
Table 18-1. Power Consumption for the Brine
Supply Well Facilities
| Facility No. | |
Supply
Well Count | | |
Operating
Power
(kW) | | |
Annual
Electrical
Consumption (MWh) | |
| Brine Supply Facility No. 1 | |
| 3 | | |
| 1,685 | | |
| 13,136 | |
| Brine Supply Facility No. 2 | |
| 4 | | |
| 2,226 | | |
| 17,465 | |
| Brine Supply Facility No. 3 | |
| 3 | | |
| 1,685 | | |
| 13,136 | |
| Brine Supply Facility No. 4 | |
| 4 | | |
| 2,226 | | |
| 17,465 | |
| Brine Supply Facility No. 5 | |
| 5 | | |
| 2,767 | | |
| 21,794 | |
| Combined Well Facility | |
| 2 | | |
| 1,526 | | |
| 11,868 | |
| Total | |
| 21 | | |
| 12,115 | | |
| 94,865 | |
Each of the well pad facilities will include
a prefabricated Motor Control Center (MCC) building, medium voltage drives for the ESPs, utility power supplies, and a capacitor bank
for power factor correction. The power supply to each facility will be from the Southwest Arkansas Electric Cooperative power grid. New
substations and transmission lines will likely be required for the facilities and are addressed as part of the cost of service.
Compressed air will be supplied via an air compressor
installed inside the MCC building on each well pad. Compressors are expected to be identical at each well pad with spare parts kept at
a central maintenance warehouse.
| South West Arkansas Project Pre-Feasibility Study | 18 Sept 23 |
| 18.1.1.4 | Chemicals and Reagents |
Chemicals and reagents required for operation
and maintenance of the brine supply wells and well pad facilities will be stored within the equipment containment areas at each well
pad facility. These include, but are not limited to, anti-scalant and anti-corrosion chemicals.
| 18.1.1.5 | Auxiliary Infrastructure |
The following auxiliary infrastructure will be
required for each well pad facility.
| · | Access
roads to the facility; |
| · | Communication
(internet to the site, whether that be ethernet or cellular service); |
| · | Medium
voltage electrical power supply, including new powerlines and substations; |
| · | Metering
stations for sour gas and brine; and, |
| · | Crude
oil storage tank and truck loading facility. |
Brine will be transported via fiberglass pipelines,
along pipeline right-of-way corridors, from booster pumps at each well pad facility to the CPF. Sour gas removed from the brine by the
three-phase separators at the well facilities will be transported to the CPF via high density polyethylene plastic (HDPE) pipelines,
following the same pipeline corridors. The estimated pipeline quantities and details are detailed below in Table 18-2.
Table 18-2. Estimated Brine Supply and Sour
Gas Pipeline Details
| Description | |
Material
Type | |
Diameter
– DN (NPS) | |
Length |
| Brine Supply | |
Fiberglass NOV Green Thread HP25 | |
250 (10”), 350 (14”), 450
(18”), 500 (20”), 600 (24”) | |
23.09 km (14.35 miles) |
| Sour Gas | |
HDPESDR-11/ PE3408 | |
80 (3”), 125 (5”), 150 (6”), 200 (8”) | |
23.09 km (14.35 miles) |
| Total | |
- | |
- | |
46.18 km (28.7 miles) |
| 18.2 | Central Processing Facility Infrastructure |
A proposed location for the CPF is approximately
11 km (7 miles) south of the intersection of Highway 29 and Highway 82 in Lewisville, AR. Road access to the CPF will be via Highway
29. A conceptual layout showing the process areas and auxiliary facilities is provided below in Figure 18-2.
| South West Arkansas Project Pre-Feasibility Study | 18 Sept 23 |
Figure 18-2. Central Production Facility Conceptual
Layout

| 18.2.1 | Fresh Water Supply and Distribution |
Six fresh water supply wells will be installed
with one spare to provide water to the CPF. The fresh water supply wells will be drilled to a depth of approximately 300 feet (100 m)
below grade and designed to supply 477 m3/hr (2,100 US gpm) of fresh water to the facility. Water will be delivered to the
well water/fire suppression storage tank with a storage capacity of 4,920 m3 (1.3 million gallons) of fresh water. Water that
will be used for the CPF includes:
| South West Arkansas Project Pre-Feasibility Study | 18 Sept 23 |
| · | Fire
Water – Fire water will be obtained directly from the tank. |
| · | Process
Water – Process water will be obtained directly from the tank without further processing
for general plant use. |
| · | High
Purity Process Water/Potable Water – Purified water for process and potable use will
be generated onsite using a reverse osmosis (RO) treatment unit. |
| · | Ultra-high
Purity Water – Ultra-high purity water will be generated onsite using a demineralizer
system. |
The CPF will be equipped with a natural-gas-fired
boiler unit to provide approximately 1,200 kg/hr. (2,650 lb/h) of medium pressure steam to the plant. The steam will primarily be used
in the electrolysis unit but will also be required in the sodium chloride evaporator/crystallizer, lithium hydroxide evaporator/crystallizer,
and debromination units for startup, trim heat, and various periodic maintenance activities.
The CPF will require a power supply of approximately
38 megawatts (MW).
The power supply to the CPF will be from the
Southwest Arkansas Electric Cooperative power grid. A new substation and transmission line from the power utility will be required for
the facilities.
Compressed air will be supplied by multiple air
compressors with a refrigeration dryer system to control moisture content.
| 18.2.5 | Compressed Nitrogen |
Compressed nitrogen for use in product packaging
and tank blanketing will be supplied by a pressure swing generator.
Sour gas gathered at the CPF will be compressed
onsite for transfer via a dedicated high-density polyethylene (HDPE) pipeline tying into an existing Mission Creek pipeline for either
reinjection or treatment (sweetening and separation of gas and liquids) at the nearby Mission Creek Dorcheat Gas Plant and then delivered
either back to the CPF or to market. The estimated pipeline quantities and details are provided below in Table 18-3. An emergency flare
system will be put in place to allow for safe handling of sour gas in the event of a downstream interruption.
| South West Arkansas Project Pre-Feasibility Study | 18 Sept 23 |
Table 18-3. Estimated Sour Gas Disposal Pipeline
Details
| Description | |
Material
Type | |
Diameter | |
Length |
| Sour Gas Disposal | |
HDPESDR-11/ PE3408 | |
20.32cm (6”) | |
14.0 km (8.71
miles) |
| 18.2.7 | Chemicals and Reagents |
Chemicals and reagents required for operation
and maintenance of the CPF will be received via truck unloading stations and stored within containment areas, segregated as required
to avoid adverse mixing in common drains. These include, but are not limited to:
| § | Sodium
Hydroxide (NaOH) – delivered as 50% |
| § | Hydrochloric
Acid (HCl) – delivered as 32% |
| § | Chlorine
(Cl2) – delivered as anhydrous |
| § | Flocculant
(specifics TBD) |
| § | Calcium
Hydroxide (Ca(OH)2) – lime |
| § | Sodium
Carbonate (Na2CO3) – soda ash |
| § | Sodium
Metabisulfite (Na2S2O5) – delivered as 39% |
| 18.2.8 | Auxiliary Facilities |
The CPF will include the following auxiliary
infrastructure facilities:
| § | Access/Security
Checkpoint |
| § | Perimeter
Fencing and Gates |
| § | Communication
(telephone, cellular telephone, internal plant radio, security, and internet) |
| § | Electrical
Substation and Power Distribution Lines |
| § | Natural
Gas Metering Station and Distribution Lines |
| § | Sanitary
Wastewater Treatment and Disposal System |
| o | Administrative Office, Control Room, and
Laboratory including a centralized control room for well field |
| o | Warehouse(s) |
| South West Arkansas Project Pre-Feasibility Study | 18 Sept 23 |
| o | Workshop(s) |
| o | Process Buildings for selected equipment |
| o | Shipping and Receiving |
| 18.3 | Effluent Brine/Process Water Injection
Wells Network Infrastructure |
The CPF will generate effluent brine including
process wastewater. The effluent brine will be pumped from the CPF to a network of 22 brine injection wells located throughout the resource
area of the SWA Property. This well field will use the same drilling technology used in the supply field to consolidate the surface facilities
of the wells into nine multi-well pads. As stated in 18.1.1, well field development is based on the best data available at time of publishing
and should be considered appropriate for the purpose of economic analysis of the SWA Project.
The arrangement of the brine injection well facilities
will follow the same approach as the brine supply facilities by assembling multiple brine injection wells at each location to consolidate
their individual surface facilities to minimize footprint, upfront cost and improve operations and maintenance (see Figure 18-3). Additionally,
two of the injection wells are currently envisaged to be co-located with supply wells at one of the multi-well pads described in Section 18.1.1.
| South West Arkansas Project Pre-Feasibility Study | 18 Sept 23 |
Figure 18-3. Brine Injection Multi-Well Pad
Conceptual Layout

Each brine injection well will be equipped with
a booster pump to reinject the effluent brine down through the injection well and into the Smackover Formation.
| 18.3.1.1 | Water Supply and Distribution |
Similar to the supply well pads, each of the
brine injection well pad facilities will be equipped with a water well that will provide approximately 10m3/hr (45 US gpm)
of water for drilling and routine well and well pad facilities maintenance operations.
The injection well pad facilities will require
approximately 4.1 MW total for routine operations of the facilities as shown below in Table 18-4.
| South West Arkansas Project Pre-Feasibility Study | 18 Sept 23 |
Table 18-4. Power Consumption for the Brine
Injection Well Facilities
| Facility
No. | |
Injection
Well
Count | | |
Operating
Power
(kW) | | |
Annual
Electrical
Consumption (MWh) | |
| Brine Injection Facility
No. 1 | |
| 4 | | |
| 804 | | |
| 6,214 | |
| Brine Injection Facility No. 2 | |
| 2 | | |
| 421 | | |
| 3,152 | |
| Brine Injection Facility No. 3 | |
| 2 | | |
| 421 | | |
| 3,152 | |
| Brine Injection Facility No. 4 | |
| 2 | | |
| 421 | | |
| 3,152 | |
| Brine Injection Facility No. 5 | |
| 3 | | |
| 612 | | |
| 4,683 | |
| Brine Injection Facility No. 6 | |
| 2 | | |
| 421 | | |
| 3,152 | |
| Brine Injection Facility No. 7 | |
| 3 | | |
| 612 | | |
| 4,683 | |
| Brine Injection Facility No. 8 | |
| 2 | | |
| 421 | | |
| 3,152 | |
| Combined Well Facility | |
| 2 | | |
| - | [1] | |
| - | [1] |
| Total | |
| 22 | | |
| 4,133 | | |
| 31,341 | |
Note: 1. Operating power and consumption for
the Combined Well Facility is provided in Table 18-1.
Each of the brine injection well pad facilities
will include a prefabricated MCC building, medium voltage drives for the booster pumps and utility power supplies, and a capacitor bank.
The power supply to each facility will be from the Southwest Arkansas Electric Cooperative power grid. New substations and transmission
lines will likely be required for the facilities.
Similar to the supply well pads, compressed air
will be supplied via a single compressor at each well pad facility. The compressors will be located within the MCC buildings.
| 18.3.1.4 | Auxiliary Infrastructure |
The following auxiliary infrastructure items
will be required at each facility:
| · | Access
roads to the facility. |
| · | Communication
(Internet to the site whether that be ethernet or cellular service.) |
| South West Arkansas Project Pre-Feasibility Study | 18 Sept 23 |
| · | Medium
voltage electrical power supply, including new powerlines and substations. |
| · | Metering
stations for brine. |
Effluent brine will be pumped via fiberglass
pipelines from the CPF to the booster pumps at each brine injection well pad and then pumped down each individual injection well back
to the Smackover Formation. The estimated pipeline quantities and details are detailed below in Table 18-5.
Table 18-5. Estimated Effluent Brine Pipeline
Details
| Description | |
Material
Type | |
Diameter
– DN (NPS) | |
Length |
| Effluent Brine | |
Fiberglass NOV Green
Thread HP25 | |
200 (8”),
250 (10”), 350 (14”), 500 (20”), 600 (24”) | |
41.8 km (25.99 miles) |
| South West Arkansas Project Pre-Feasibility Study | 18 Sept 23 |
| 19 | Market Studies And Contracts |
Two independent market studies were commissioned
in support of forecasting Lithium market trends and pricing. These reports were executed by Benchmark Minerals Intelligence and Global
Lithium. The key findings are summarized below.
When LCE demand reaches one million metric tonnes
by the middle of this decade, it will have taken over 60 years to achieve that volume. The second million tonnes is expected to only
take approximately four years as the energy transition in both transportation and Energy Storage Systems (ESS) for solar and wind power
gains traction. Lithium is the most critical of battery metals required in the energy transition. Lithium-ion batteries can be made without
nickel, cobalt, or manganese but all cathode technologies depend on either lithium carbonate or lithium hydroxide as the lithium source.
The Global Lithium report concludes that in 2010,
global demand for lithium chemicals was less than 100K metric tonnes (MT) of lithium carbonate equivalents (LCEs) with sales spread across
multiple market segments including glass, grease, pharmaceuticals, synthetic rubber, and lithium-ion batteries primarily used in mobile
phones and other portable electronics.
By 2020, the demand had grown to over 300K MT
LCE, with battery-related use approximately 60% of the market, primarily due to growing demand for electric transportation (EVs, buses, etc.).
By 2030, demand may exceed 3,000K MT with battery-related
use forecasted to be over 90%. The main use of lithium is expected to be related to lithium-ion batteries in both electric transportation
and energy storage. A key component of this change is the phasing out of internal combustion engine (ICE) vehicles in favor of electric
vehicles (EVs), and increased use of lithium-ion batteries in energy storage systems (ESS) for renewable power from wind and solar. The
lithium industry is not adequately prepared for this transition. New lithium resources and improved technology for lithium extraction
will be required to satisfy the coming exponential growth. Demand for traditional non battery applications will continue to grow at low
single digit rates. Based on the time it takes greenfield lithium projects to be developed and come into production, it is doubtful that
the supply response will be equal to demand growth for the remainder of the decade.
A McKinsey forecast, shown in Figure 19-1 expects
Lithium-ion battery cell demand to grow from approximately 700GWh in 2022 to approximately 1,700GWh in 2025, and approximately 4,700GWh
in 2030 due to gradual global transition away from fossil fuels which will be replaced by increased use of renewable energy. Each terawatt
hour (1,000GWh) requires a minimum of 800K MT of lithium carbonate equivalents (LCEs).
| South West Arkansas Project Pre-Feasibility Study | 18 Sept 23 |
Figure 19-1. Global Li-ion Battery Cell Demand,
GWh, Base Case

Lithium used in batteries is a specialty chemical
as opposed to a commodity, which, due to the complexity of production, makes keeping up with demand even more challenging. Many lithium
operations in production today were based on industrial demand for lithium, which required a product with much less stringent specifications
than the battery industry.
The demand forecast provided by Global Lithium
shows a lower demand than the consensus average of other lithium market forecasts such as the one shown above. Nevertheless, the forecast
by Global Lithium LLC (shown in Figure 19-2) projects sustained lithium pricing strength over the next several years and, based on the
demand growth and increasingly stringent quality standards, the lithium industry will struggle to supply in adequate volume to meet this
growing demand. Although the supply line appears in relative balance with demand in some years, the reality of the supply chain will
mean a portion of consumers may have difficulty sourcing qualified product in adequate volumes maintaining upward price pressure.
| South West Arkansas Project Pre-Feasibility Study | 18 Sept 23 |
Figure 19-2. Lithium Supply and Demand - Historical
and forecast from 2020-2030

Note: Used with permission from Global
Lithium LLC
The two fastest growing lithium chemicals will
be battery quality hydroxide and carbonate through the remainder of this decade. These chemicals are produced primarily from two types
of resources: hard rock (spodumene) and brines, although there may be production from sedimentary assets (also referred to as clay) later
in this decade. Lithium chemical supply from recycling is not expected to be even 10% of supply until sometime in the 2030s.
Lithium hydroxide is primarily used in longer
range EV batteries requiring high nickel content while carbonate is favored in lower capacity, less expensive EV batteries, electric
buses, and energy storage systems. Although it is difficult to accurately forecast the exact future mix of cathode materials and whether
carbonate or hydroxide will be required, the diversity of the battery market will likely result in a continued tight market for both
forms of lithium chemicals into the next decade. Figure 19-2 shows a relatively even balance of carbonate and hydroxide demand in 2030.
Asia will remain the largest market for lithium
chemicals for the remainder of the decade. China currently has 70% of lithium-ion battery cell production capacity and will remain the
largest single market for EVs into the next decade. Korea and Japan are also significant battery producers. North America is expected
to become the second-largest market for lithium chemicals by the end of the decade. US President Joe Biden has taken several steps to
support growth of the domestic EV market and a North American battery supply chain which makes US-based lithium projects more attractive.
| South West Arkansas Project Pre-Feasibility Study | 18 Sept 23 |
The American Jobs Plan proposed $174 billion
of investment to support development of the US EV market including the following incentives:
| · | Providing
tax credits for EVs worth up to $7,500 for a new EV and $3,750 for a used EV. |
| · | Expanding
access to charging stations with a goal of installing 500,000 new EV chargers by 2030. |
| · | Setting
an ambitious goal of 50% of US auto sales being EVs by 2030. |
The European Union (EU) is supporting the growth
of lithium-ion batteries through their “Green Deal” with programs similar to those in the US and a stated objective of making
Europe the first carbon neutral continent by 2050.
Lithium supply is likely to become the critical
path for EV adoption based on the fact it can take up to a decade to bring a greenfield lithium project online and takes only two to
three years to build a battery gigafactory.
| 19.2 | Lithium Hydroxide Price |
Over the past few years, the price of lithium
has been volatile. In 2017, the price of lithium hydroxide peaked at almost $30,000/tonne before several hard rock mines in Western Australia
came online during 2018 and 2019 leading to a temporary oversupply situation where price fell below $10,000/tonne in some markets. In
late 2020, EV growth in China and Europe moved the market back to a shortage situation. Global average price from 2016 to early 2023
by month is shown in Figure 19-3. The China spot market saw lithium hydroxide price exceed $80,000/tonne briefly before moderating. Spot
pricing in China was very volatile in late 2022 through Q1 2023, while contract prices in Korea remained in the $70,000/tonne range through
April 2023.
| South West Arkansas Project Pre-Feasibility Study | 18 Sept 23 |
Figure 19-3. Global Weighted Average Lithium
Hydroxide

Global Lithium LLC estimates that average large
ex China contract pricing will remain between $50,000 and $60,000/tonne through 2030 based on the assumption that demand will exceed
battery quality supply until at least the early 2030s. The price forecast in Figure 19-4 shows multiple price scenarios including an
average of the price forecasts of three major investment banks, the projection of China spot price by Benchmark Mineral Intelligence,
along with what price would be if there was an oversupply situation and price dropped to the high marginal cost of production.
| South West Arkansas Project Pre-Feasibility Study | 18 Sept 23 |
Figure 19-4. Global Lithium
Price Forecast

Notes:
GL Contract average is the ex-China
average price per Global Lithium LLC estimates.
GL Cost Curve reflects the China hard
rock converter cost.
IB Average is the ex-China price average
from three major investment banks.
BMI China spot is per Benchmark’s
report to Standard dated March 2023.
Presently, the high end of the cost curve is
independent Chinese lithium chemical converters that source spodumene concentrate from offshore – mostly Australia, but also to
a limited extent from other countries. As long as the spodumene price remains over $2,500/MT, the converter cost curve will be over $25,000/MT.
Presently, spodumene prices are significantly higher than $2,500/MT yielding a cost curve price above $40,000/MT. Should spodumene price
drop significantly, vertically integrated lepidolite production in China will replace independent spodumene converters as the high cost
production, keeping the high end of the cost curve in the $30,000/MT range.
For purposes of estimating new project future
cash flows, Global Lithium recommends a conservative approach using the forecast high end of the cost curve based on the Ex-China contract
pricing through to 2030 and China’s spodumene sourcing and lepidolite production dynamics keeping conservative prices around the
$30,000/MT price point. Although global lithium forecasts global pricing well above the green line in Figure 19-4, using a conservative
price is recommended in case of unforeseen market circumstances. The economic evaluations of the project are therefore based on a $30,000/MT
Lithium Hydroxide flat forecast price.
| South West Arkansas Project Pre-Feasibility Study | 18 Sept 23 |
| 20 | Environmental Studies, Permitting, and Social or Community
Impact |
Standard Lithium is proposing to build the SWA
Project for lithium hydroxide production by processing brine with naturally occurring lithium found in the Smackover Formation. Standard
Lithium will process the brine to form lithium chloride solution and then convert to lithium hydroxide. The proposed SWA Project includes
construction of a Central Processing Facility (CPF) and brine supply and brine injection well fields, and pipelines. The brine supply
wells and ancillary equipment will provide the CPF with brine while the injection wells will be used to inject tail-brine (lithium-depleted
brine) and associated process water back into the Smackover Formation for pressure maintenance. This section of the report will focus
on the listed components of Section 20 of a PFS for a new Standard Lithium facility near Magnolia, Arkansas. These components are
as follows:
| · | Environmental
Considerations |
| · | Surface
Water Discharge Permits |
| · | Brine
Supply and Disposal Well Drilling Permits |
| · | Underground
Injection Control (UIC) Permits |
| · | Public
Water Supply Permit |
| · | Resource
Conservation and Recovery Act Subtitle C Treatment, Storage and Disposal Permit |
| · | Environmental
Management and Closure Plan |
| 20.2 | Environmental Considerations |
Construction and operational emissions to air,
surface waters, and subsurface waters, and proper management/disposal of solid wastes are regulated by the Federal and State agencies
to protect the environment while allowing responsible development of the lithium resources. These are specifically addressed in Section 20.3.
Further to this, activities that contain a Federal nexus (Federal funding, Federal permitting decision, or the activity is conducted
by a Federal Agency) would trigger the National Environmental Policy Act (NEPA). The purpose of the NEPA process is to assess environmental
impacts resulting from the project and can include 1) Categorical Exclusions, 2) Environmental Assessments (EA), 3) Finding of No Significant
Impact (FONSI), and 4) Environmental Impact Statements (EIS). The first three options are relatively fast processes while the EIS can
take more than a year to complete. Each process ends in a decision regarding environmental impacts; whether the project is approved or
not; and if approved, any conditions required for implementation of the project.
| South West Arkansas Project Pre-Feasibility Study | 18 Sept 23 |
The project as it is currently envisaged, would
not qualify as a Federal undertaking but may require a Federal permitting decision through the U.S. Army Corps of Engineers (USACE).
For typical permitting decisions, the USACE conducts an Environmental Assessment (EA) in house. The USACE will either determine no significant
impacts would result from the project and issue a FONSI or determine the project may have significant impacts and conduct an EIS. The
USACE does not list numerical thresholds that would trigger a significant impact requiring an EIS; however, it is not a common practice
for typical projects with under 10 acres of wetland impacts. Therefore, the project could be expected to require EA under this route.
The NEPA process would also be triggered if federal
funds are obtained for the project. The level of effort would be dependent on the requirements of the Federal Agency from which funds
are received. The typical process would be to evaluate whether a categorical exclusion exists for the activity. If no categorical exclusions
exist, then an EA would be necessary resulting in a FONSI or decision to conduct an EIS. The Federal Agency may have numerical thresholds
that automatically trigger an EIS. The EIS is typically conducted by a third party directly contracted by the Federal Agency at the expense
of the permittee. Given that the project as it is currently envisaged is not considering federal funding, it is not expected to trigger
an EIS.
Irrespective of whether federal funding is used
or not, the proposed project will require multiple permits for air, water, waste, resource extraction, and underground injection. Permit
application approvals in some cases will take more than a year from submission dates. The anticipated timeline for requisite permits
is described in the respective categories of Section 20.3.
The SWA Project will require permits to be completed
prior to construction and operation of the facility. The permits will require review and approval from the Arkansas Department of Health
(ADH), the Arkansas Department of Energy and Environment (ADEE), and potentially, the USACE.
The ADH regulates construction of potable water
supplies and sanitary waste treatment/disposal facilities.
| South West Arkansas Project Pre-Feasibility Study | 18 Sept 23 |
The ADEE is the permitting agency for both the
environmental permits and resource extraction for the facility through two Divisions, the Division of Environmental Quality (ADEE-DEQ)
and the Arkansas Oil & Gas Commission (ADEE-AOGC). The ADEE-DEQ oversees the air, National Pollutant Discharge Elimination System
(NPDES), Office of Water Quality No-Discharge, Solid Waste permits, and shares authorization for underground injection control (UIC)
permits with the ADEE-AOGC. The ADEE-AOGC has sole permitting authority for extraction of the brine resource from drilled/completed supply
wells and disposal of the lithium-depleted effluent brine to the Smackover Formation by deep well injection into UIC Class V wells.
Public notice of each individual permit proposed
for issuance by the ADEE-DEQ and a thirty-day period for receipt of comments precedes final authorization of the specific permit. ADEE-DEQ
may or may not conduct public meetings prior to their final approval.
The USACE is the permitting authority for construction
activities impacting waters of the U. S. (WOTUS), and the SWA Project is within the jurisdiction of the USACE Vicksburg District. The
USACE issues two types of authorizations, nationwide permits for certain categories of activities with minimal impacts to WOTUS, and
an individual permit for all other activities.
| 20.3.2 | Clean Water Act Section 404
Permitting |
Section 404 of the Clean Water Act established
a statutory mechanism for control of dredged or fill material into WOTUS, including wetlands. The USACE has final administrative authority
to determine the status of land surface as WOTUS. Currently, certain land characteristics are scientifically used as indicators of WOTUS
through a process known as a Jurisdictional Determination (JD). Private entities commonly prepare and submit JD reports to the USACE
to expedite their decision-making process and in some cases, the USACE will conduct a site survey to confirm the private JD or absent
a private submittal, to provide the basis for the agency’s permitting decision.
USACE authorizes impacts to WOTUS through nationwide
or individual Section 404 permits. Nationwide permits are structured for specific activities and minimal impacts, usually limited
to less than one acre, and do not require lengthy agency review. The current list of fifty-nine nationwide permits was issued by the
USACE in 2021. The nationwide permits potentially applicable to the SWA Project are:
| · | NWP
7 – Outfall Structures and Associated Intake Structures |
| · | NWP
12 – Oil or Natural Gas Pipeline Activities |
| · | NWP
14 – Linear Transportation Projects |
| · | NWP
18 – Minor Discharges |
| South West Arkansas Project Pre-Feasibility Study | 18 Sept 23 |
| · | NWP
39 – Commercial and Institutional Developments |
| · | NWP
43 – Stormwater Management Facilities |
| · | NWP
57 – Electric Utility Line and Telecommunications Activities |
| · | NWP
58 – Utility Line Activities for Water and Other Substances |
An individual permit is required for activities
not eligible for nationwide permits or those the USACE deems in the public interest. An individual Section 404 permit may require
a year for issuance by the USACE and like nationwide permits, will mandate compensatory mitigation for impacts to WOTUS. Once the Section 404
permitting process is initiated, the USACE will institute a review of threatened/endangered species and cultural resources that may be
impacted by the SWA Project.
Construction of the SWA Project CPF, well field
(supply and disposal), pipelines, roads, and utilities is considered a singular project by USACE when evaluating eligibility for nationwide
or an individual Section 404 permit. A preliminary scientific survey of the proposed project site and desktop review of the brine
supply and injection well system, and pipelines indicate a Section 404 permit most likely will be necessary due to the magnitude
of WOTUS impacted exceeding the nationwide permit disturbance thresholds.
| 20.3.3 | Air Emissions Permitting |
A single permit will be issued by ADEE-DEQ for
construction and operation of the lithium extraction/processing facility. The permit must be in place prior to initiating construction,
including preparation of foundations for any air emission source. The permit could take up to a year for approval depending on the level
of pollutant emissions from the facility. The three levels of air permits available under the ADEE-DEQ air permitting program are directly
tied to the annual total emissions of specific pollutants the plant will produce. Operational considerations to minimize potential emissions
will be a factor in the CPF design phase, but systems such as closed-loop brine cooling to limit particulate emissions will be employed
where practical. Initial calculations of likely annual emissions indicate the SWA Project should be permitted at the lowest permit tier.
The lowest permit tier is a minor source permit and for the new facility will require approximately six to nine months for approval by
ADEE-DEQ.
Design phase information will be utilized to
determine the emissions rates for the minor source permit application. The calculations will take into consideration the production throughput,
chemical reactions, and type of air emission controls used at the facility.
| South West Arkansas Project Pre-Feasibility Study | 18 Sept 23 |
| 20.3.4 | Water Discharge Permitting |
ADEQ-ADEE issues multiple NPDES permit variations
for discharge of pollutants to surface waters depending on the activity associated with the permit request. The NPDES permits applicable
to the SWA Project all may be categorized as general permits. These permits include:
| · | NPDES
Construction General Permit (Stormwater) – The ADEE-DEQ, Office of Water Quality
has issued a general permit for discharges of storm water runoff from construction (earthmoving)
activities. General permits are developed for multiple facilities that have similar activities
and limitations. The objective of permit ARR150000 is to eliminate or reduce the transport
of sediments and construction-related contaminants from earthmoving and construction activities
that disturb one acre or more area. As the Standard Lithium facility development will exceed
five acres, a Storm Water Pollution Prevention Plan specific to the construction site must
be prepared and submitted to ADEE-DEQ along with a Notice of Intent for coverage under the
general NPDES permit. The Storm Water Pollution Prevention Plan includes management practices
and physical controls to minimize sediment/contaminant transport off the construction area
as a result of precipitation events. Once authorized, the permit is in effect until the disturbed
area is stabilized after construction is completed. The current permit ARR150000 was effective
November 1, 2021, and expires October 31, 2026. |
| · | NPDES
Operational General Permits (Stormwater, Non-contact Wastewater, and Sanitary Wastewater)
– General permits have been issued by ADEE-DEQ for stormwater discharges from industrial
operations and common industrial non-contact effluents such as boiler blowdown, cooling tower
overflow, and steam condensate. Discharges of treated sanitary wastes less than 1,500 gallons
per day are also authorized using a general permit. |
| o | Operational Industrial Stormwater
– Stormwater runoff discharges from certain industrial categories are regulated by
the ADEE-DEQ Office of Water Quality in the NPDES program using a multi-sector general permit.
The SWA Project lithium extraction and processing facility is included in Sector C: Chemicals
and Allied Products. The industrial general permit ARR000000 for stormwater runoff discharges
from industrial sites has requirements similar to the general permit for construction stormwater
discharges (ARR150000) that emphasizes pollution prevention and best management practices.
Likewise, a Stormwater Pollution Prevention Plan must be prepared specific to the operational
site. Discharges of stormwater runoff from the area of industrial activity must be sampled
and analyzed annually. ADEE-DEQ has established benchmark concentrations for various parameters
based on the industrial category; those parameters are assessed and reported annually to
ADEE-DEQ. The benchmark concentrations are established to alert facilities and the ADEE-DEQ
of potential exposure to industrial materials or processes, and to provide the facility opportunity
to implement new or amend existing management practices to reduce the parameter of concern. |
| South West Arkansas Project Pre-Feasibility Study | 18 Sept 23 |
| o | Cooling Tower Blowdown, Boiler Blowdown,
Steam Condensate – Certain non-process contact wastewaters are regulated by the
ADEE-DEQ by NPDES General Permit ARG250000. The maximum allowable daily discharge for general
permit eligibility is 0.5 million gallons per day. Preliminary information on wastes to be
generated by the SWA Project include cooling tower and boiler blowdown totaling less than
0.5 million gallons per day, thus making those effluents subject to the ARG250000. The general
permit ARG250000 includes numeric discharge concentration limits for Chemical Oxygen Demand,
Total Suspended Solids, Oil and Grease, pH, and Temperature with monitoring frequency set
at twice per month. |
| o | Sanitary Wastewater – Treated
domestic (sanitary) wastewater is authorized for discharge by two potential permitting paths.
The discharge of treated sanitary wastewater to a surface stream is regulated by the ADEE-DEQ
and if the maximum daily discharge is less than 1,500 gallons per day, subject to NPDES General
Permit ARG550000. Additionally, the treatment system used must be selected from an approved
list developed by ADEE-DEQ. Permit ARG550000 includes discharge limitations for Biochemical
Oxygen Demand (Five-Day), Total Suspended Solids, Dissolved Oxygen, Fecal Coliform Bacteria,
and pH. Monitoring frequency is once per six months. |
Alternatively, if the
sanitary wastewater is discharged subsurface using infiltration trenches based on a professional soil assessment and design, the system
must be approved by the ADH. The ADH permit process is initiated by a professional soil classifier registered with ADH to design infiltration
systems using data collected from the site of the proposed CPF. There are no monitoring or reporting requirements associated with a ADH-permitted
subsurface discharge of treated sanitary wastes.
| South West Arkansas Project Pre-Feasibility Study | 18 Sept 23 |
| 20.4 | Brine Supply/Disposal Well Permits |
Authorization to drill and operate brine resource
and/or injection wells is issued by the ADEE-AOGC. ADEE-AOGC has a Brine Production Regulatory Program that defines the requirements
for establishing Brine Production Units that must be in place before an application to drill a supply or injection well is submitted
by an operator or producer. Once a Brine Production Unit (or units) is created by ADEE-AOGC Commission Order and after a public hearing,
drilling permit applications for new wells will be considered by the Agency. A petition to create a Brine Production Unit must include:
| 1. | A description of the proposed brine production
unit or brine expansion unit. |
| 2. | A statement of the plan of development
and operation of the brine production unit or brine expansion unit. |
| 3. | All geological and engineering data necessary
for the Oil and Gas Commission to be fully advised of the feasibility of the proposed plan. |
| 4. | A statement detailing all costs and expenses
chargeable to the proposed brine production unit or a brine expansion unit and a statement
of all credits due against costs and expenses. |
| 5. | A plat of each proposed brine production
unit or brine expansion unit which indicates the tracts or parcels of land included in the
plat and the location of each well then located within the proposed unit for the production
of brine and the injection or disposal of effluent and the proposed location of each well
that is proposed to be drilled for production and injection or disposal purposes. |
| 6. | A list of owners within the unit, including
the brine, interest, and last known address of each such owner. |
| 7. | A statement that the petitioner has valid
and subsisting leases or otherwise owns or controls the right to produce brine from not less
than seventy-five percent (75%) of the entire area of the proposed brine production unit
or brine expansion unit. |
Note: The petitioner may not combine
its leases or other rights to produce brine, relative to an adjacent brine production unit or brine expansion unit, with leases or other
rights to produce brine necessary to achieve the seventy-five-percent lease requirement to form a separate brine production unit or brine
expansion unit.
| 20.4.1 | Underground Injection Control
(UIC) Permitting |
There are two potential paths for management
of waste (effluent) brine from the CPF. One is returning the brine to the Smackover Formation using UIC Class V injection wells.
Class V injection wells are authorized by the ADEE-AOGC and do not require a lengthy permitting process as they have been used by
bromine extraction operations in Arkansas for almost seventy years. Class V well authorizations do not expire until a well is permanently
plugged and abandoned.
The Standard Lithium SWA Project will only utilize
Class V injection wells for disposal of effluent brine at this stage of the project. Nevertheless, the other option for disposal
of effluent brine is in UIC Class I Nonhazardous wells that inject the waste into subsurface formations other than the Smackover.
Class I wells are strictly regulated under the Resource Conservation and Recovery Act (RCRA), and the Safe Drinking Water Act (SDWA)
through permits issued by ADEE-DEQ. Class I permits are issued with ten-year terms and applications for renewal must be submitted
prior to the expiration date. If the brine disposal scenario changes and a UIC Class I disposal permit is required, the time for
ADEE-DEQ review and approval of a UIC Class I non-hazardous well permit application is approximately twelve to eighteen months.
| South West Arkansas Project Pre-Feasibility Study | 18 Sept 23 |
ADEE-DEQ also requires a State No-Discharge Permit
for above-ground equipment, tanks, pumps, pipelines, etc. connected to either UIC Class I or V injection well systems. This
permit may require nine months to one year for issuance by ADEE-DEQ.
| 20.4.2 | Public Water Supply |
The ADH issues approvals for Public Water Systems
serving non-municipal potable water. The Standard Lithium SWA Project will require fresh water sources to support the lithium extraction
process and provide potable water for personnel use. The most likely source of fresh water will be extracted from the underground Sparta
Aquifer. Fresh water produced by the well(s) will be disinfected, stored, and distributed following ADH rules. Following submission
of engineering design and construction plans and specifications that meet Department standards, the ADH will issue a Noncommunity Public
Water System permit for the non-transient, non-municipal water system supplying potable water to the Standard Lithium facility.
| 20.4.3 | Resource Conservation Recovery
Act |
A Resource Conservation and Recovery Act (RCRA)
Hazardous Waste Permit is required of any facility that performs treatment, storage (greater than ninety days), or disposal of waste
meeting the criteria to be classified as hazardous. The SWA Project is not anticipated to conduct any of the activities requiring a RCRA
permit authorization. Process wastes generated by the facility are not expected to meet the hazardous classification. Small quantities
of universal wastes (batteries, pesticides, mercury-containing equipment, lamps, electronics, and aerosol cans) may be generated by the
operation and maintenance of the site. Title 40 Code of Federal Regulations, Part 273 provides an alternative set of management
standards for universal wastes in lieu of regulation as hazardous waste.
| South West Arkansas Project Pre-Feasibility Study | 18 Sept 23 |
| 20.4.4 | Construction Permits, Approvals,
and Plans |
Engineering plans sufficient to allow calculation
of probable emission levels will be requisite for preparation of the applications. The engineering details will be used in all permitting
applications. Each permit will require its own permitting package and drawings. Depending on the permit and degree of complexity, the
time necessary to complete the permit application package ranges from four to nine months and must be considered in addition to the permit
processing time by the specific Agency when determining the overall permit timeline.
The regulatory actions and permits discussed
have been identified as required or probable for construction and operation of the Standard Lithium SWA Project. Table 20-1 provides
the anticipated schedule for obtaining the necessary authorizations for the facility once permit applications are submitted to the respective
agencies.
| South West Arkansas Project Pre-Feasibility Study | 18 Sept 23 |
Table 20-1. Applicable Permits and Schedule
for SWA Project
| Agency |
Permitted
Activity |
Expected
Permit Issuance Time |
| ADEE-DEQ |
Major
Source Air Permit for Commercial Facility (CPF) |
6-9
months |
| ADH
|
Fresh
Water Supply for Potable Water (CPF) |
9
months |
| ADEE-DEQ |
NPDES
General Permit for Construction Stormwater (CPF, Well Field, Pipelines) |
1
month |
| ADEE-DEQ |
NPDES
General Permit for Cooling Tower and Boiler Blowdown (CPF) |
1
month |
| ADEE-DEQ
(Alt to ADH Subsurface Disposal Permit) |
NPDES
General Permit for Treated Sanitary Wastewater (CPF) |
1
month |
| ADH
(Alt to ADEE-DEQ General Permit) |
Sanitary
Waste Subsurface Disposal System (CPF) |
1
month |
| ADEE-DEQ |
NPDES
General Permit for Storm Water Discharges from A Categorical Industry (CPF) |
1
month |
| ADEE-DEQ |
State
No-Discharge Permit to Construct/Operate Surface Facility for New Class V Injection Wells (CPF, Well Field) |
9
months |
| ADEE-DEQ |
UIC
Permit to Construct/Operate New Class I Nonhaz Injection Well(s) |
Not
planned |
| ADEE-AOGC |
Construct
Brine Supply and UIC Class V Disposal Wells (Well Field) |
1
month after brine production unit approved |
| USACE |
Section 404
Permit for Impacts To WOTUS (CPF, Well Field, Pipelines, Roads, Utilities) |
1
year |
A formal social impact study has not been completed
for this project. It is likely that public meetings will be required as a part of the overall permitting process. The region around the
proposed facility is predominantly agricultural or silvicultural land uses in a sparsely populated area of the state. There is an opportunity
for a positive social impact on the surrounding communities. The community will benefit from the construction phase because the project
will require skilled labor and many contractors to complete. The community will also benefit with the additional opportunities for a
labor market skilled in similar operations once the facility has been constructed. Local businesses that supply goods and services to
the SWA Project facility may also be uplifted by the influx of capital associated with construction and operation of the facility.
| South West Arkansas Project Pre-Feasibility Study | 18 Sept 23 |
A preliminary review of the SWA Project footprint
has been conducted to identify any potential cultural/archeological resources impact from the project. The review included all documented
historical sites as well as the likelihood of incurring undocumented cultural locations within the project area. The findings did not
identify any cataloged sites that will conflict with the SWA Project plan and expressed the potential for encountering cultural materials
as low due to the soil classifications of the project area. However, one site considered eligible for listing on the National Register
of Historic Places (Red River remnant of the AN/FPS-133 Air Force Space Surveillance System) is in the preliminary project area. The
site was operational from 1961 until 2013. If an adverse impact is possible from construction of the SWA Project, avoidance or mitigative
action at the eligible site will be required.
| 20.6 | Environmental Management and Closure
Plan |
Environmental Management Plans to guide compliance
with the various regulatory programs and requirements will be developed following receipt of applicable construction and/or operating
permits from the State agencies. The Plans will address the various aspects of the design, construction, commissioning, and operation
phases of the project, identify the key environmental issues from the various project phases, and provide plans and actions that will
be undertaken to manage them effectively.
A Closure Plan addresses how a project will be
decommissioned with minimal need of further maintenance and minimal impact to the environment, as well as address any reclamation or
rehabilitation effort that is required if a facility permanently ceases operation. A Closure Plan specific to the Class I UIC wells,
if constructed will be submitted to and approved by the ADEE-DEQ through the permit application process. All other operations of the
Standard Lithium SWA Project facility are not subject to any State or Federal formal Closure Plan requirement. Nevertheless, Standard
Lithium will function in an environmentally responsible manner should operations cease in the future. Process feedstock, liquids in vessels,
reagents, finished products, and ancillary materials will be removed to a proper use, recycling, or disposal facility. Solid residuals
and non-hazardous solid wastes will be transported off-site to an appropriate permitted recycling or disposal facility. Small quantities
of regulated hazardous wastes/universal wastes accumulated during the operation and site termination activities will be transported to
an authorized facility.
| South West Arkansas Project Pre-Feasibility Study | 18 Sept 23 |
| 21 | Capital and Operating Expenditure
Costs |
The capital expenditure (CAPEX) cost estimate
and operating expenditure (OPEX) cost estimate were prepared under the general provisions for a Class 4 Estimate, as defined in
the American Association of Cost Engineers (AACE) International Recommended Practice No. 18R-97 Cost Estimate Classification System
as Applied in Engineering, Procurement, and Construction for The Process Industries. The AACE classification system uses a 1 to 5 scale,
where a “Class 1 Estimate” is the most accurate and a “Class 5 Estimate” is the least accurate.
An AACE Class 4 estimate is used for project
screening and determination of feasibility. The estimate is suitable for detailed strategic planning and business development, as well
as analyzing project alternatives before proceeding to the next stage.
It is the QP’s view that the quantity and
quality of engineering along with the level of quotes obtained for equipment results in a level of accuracy appropriate for a Pre-Feasibility
Study. The estimate includes a 20% contingency.
| 21.1 | Capital Expenditure Estimate |
The basis of estimate (BOE) for the base case
development CAPEX is a work breakdown of the project’s individual components. These components and the basis for their specific
areas are broken down and further described below.
Project execution includes the construction of
one (1) commercial scale production facility and the necessary brine production gathering and injection facilities.
| · | Design
is for a facility that produces battery-quality lithium hydroxide product. |
| · | Lithium
hydroxide production by the facility is based on an average brine grade of 437 mg/L of lithium. |
| · | Equipment
size and related cost were developed based on an annual production rate of 30,000 metric
tonnes of lithium hydroxide. |
| · | Estimated
costs are based on budget quotations from selected vendors and contractors, and current North
American pricing from established cost databases. |
| 21.1.3 | Brine Supply and Injection Well
Fields |
The following items are included in the brine
supply and injection well field estimate.
| · | The
brine gathering system consists of 5 supply well pad facilities that will be comprised (as
a whole) of 2 vertical wells and 17 directional wells. An additional combined well facility
will host two (2) directional supply wells along with injection wells. |
| South West Arkansas Project Pre-Feasibility Study | 18 Sept 23 |
| · | Effluent
brine disposal system consists of 8 injection well pad facilities that will be comprised
(as a whole) of 4 vertical wells and 16 directional wells. The combined well facility will
host 2 directional injection wells. |
| · | Capital
cost estimates for the wells were completed in cooperation with an experienced drilling contractor.
The drilling cost estimates are based on the updated brine supply and injection well field
modeling and layout developed in accordance with methodology outlined in Section 16.
Well pad locations and drilling methodologies were identified based on down hole location
and proximity to group the wells as efficiently as possible. A “typical” drilling
plan model was established and priced for the two drilling methods detailed below: |
| · | The
well sites are expected to be drilled on a continuous schedule from start to finish. This
is expected to accrue certain cost savings for reduced mobilization costs, overhead, etc.
over the course of this effort. A “Drilling Efficiencies Factor” of 5% has been
included in the well field cost for the variable (daily) drilling expenses to account for
these anticipated cost savings. |
| · | Cost
estimates for the electrical submersible pumps (ESP) are based on an 800 horsepower, high
flow rate pump. ESP sizing is based on historical pump sizing for similar wells in the region.
The pump sizing and costs are subject to change depending on the requirements set forth in
the final well field design. Further analysis should be conducted to better define the pump
sizing requirements for the well field as the costs for these pumps vary significantly with
size. |
| · | Cost
estimates associated with surface facilities equipment at each facility are based on historical
pricing for installation and budgetary equipment costs in Aspen In-Plant Cost Estimator SoftwareTM,
Version 12. |
| · | Costs
associated with the site preparation and auxiliary infrastructure to be installed at each
well pad facility are based on budgetary contractor estimates. |
| · | Indirect
Costs for the well field developments are factored at 15% of Direct Costs to account for
Owner’s Engineering and other miscellaneous costs. |
| South West Arkansas Project Pre-Feasibility Study | 18 Sept 23 |
| 21.1.4 | Brine Supply/Return and Sour
Gas Pipeline Network |
The following items are included in the brine
supply, brine return and sour gas disposal pipeline estimate.
| · | Sour
gas will be separated from the brine at the supply well facilities and delivered to the production
facility in pipelines alongside the brine feedstock. |
| · | Anticipated
brine feedstock flow to the production facility is approximately 1,800 m3/hour
(7,925 gpm). |
| · | Pipeline
cost estimates are based on material quotes received from suppliers – detailed below
in Table 21-1 along with installation and land costs from previous projects. |
| · | Survey
and land costs were estimated based on budgetary pricing developed by HGA. |
| · | Installation
and environmental services were also based on budgetary pricing from local companies familiar
with executing this type of work. |
| · | Indirect
cost estimates, such as those for engineering and inspection, are based on similar sized
projects. |
Table 21-1. Pipeline
Material Summary
| Service | |
| Type | | |
Quantity |
| Brine Supply Pipelines | |
| Fiberglass | | |
23.19 km (14.41 miles) |
| Effluent Brine (Injection) Pipelines | |
| Fiberglass | | |
42.0 km (26.1 miles) |
| Sour Gas Pipelines | |
| HDPE | | |
34.30 km (21.31 miles) |
| Total | |
| - | | |
99.49 km (61.82 miles) |
| 21.1.5 | Central Processing Facility |
The basis of estimate for the Central Processing
Facility (CPF) is as follows.
| · | The
CPF includes the following processing units/areas: |
| o | Brine receiving unit for degassing, solids
removal, and storage of pre-treated brine prior to its introduction into DLE; |
| o | Sour gas receiving and disposal unit to receive
sour gas from the brine supply well system and the degassing system in the brine receiving
area. Sour gas is expected to be metered and delivered to a nearby Mission Creek sour gas
gathering pipeline feeding the Mission Creek Dorcheat Gas Plant; |
| South West Arkansas Project Pre-Feasibility Study | 18 Sept 23 |
| o | DLE unit produces lithium chloride (LiCl)
solution with significantly reduced impurities; |
| o | Purification and concentration for removal
of residual impurities and concentration of the LiCl suitable for electrolytic conversion; |
| o | Lithium hydroxide crystallization; |
| o | Packaging unit to pack the dried lithium hydroxide
product into 2,000 lb. supersacks in a nitrogen purged environment; |
| o | Shipping and receiving unit for the storage
and truck loading of the finished lithium hydroxide, and |
| o | Utilities equipment to provide medium pressure
steam, water, cooling water, demineralized water, RO-filtered water, nitrogen, and compressed
air for use in the process equipment and general plant needs. |
| · | Lithium
hydroxide unit produces 30,000 metric tpa; |
| · | Annual
production is based on approximately 91.3% availability per year (8,000 hours); and, |
| · | Lang
Factors were used as the primary method to estimate the cost for the inside boundary limit
(ISBL) areas of the production facility. The Lang Factor is one of the factored estimating
techniques recommended by AACE International for Class 4 and Class 5 estimates.
This method uses a formula that contains a set of factors multiplied by the total equipment
cost (TEC) to obtain the total plant cost (TPC). |
| o | Equipment lists were prepared based on preliminary
process flow diagrams (PFDs); |
| o | The equipment was priced based on formal budgetary
pricing, informal vendor pricing, and historical pricing for the major pieces of equipment
at the facility; and, |
| o | AACE percentage factors were then applied
to equipment costs to estimate installation and indirect costs. Much of the equipment will
either be packaged or require very little auxiliary equipment support. The AACE factors have
been refined accordingly to reflect the level of pre-fabrication and modularization associated
with each major equipment item. |
| South West Arkansas Project Pre-Feasibility Study | 18 Sept 23 |
The total capital cost for the project is detailed
below in Table 21-2 and a breakdown of the CAPEX costs by area (not including freight or contingency) is shown in Figure 21-1.
Table 21-2. SWA Project Capital Expenditure
Cost Estimate
| Description | |
Equipment Cost
US$ | | |
Factored Cost
US$ | |
| Well Field | |
| Included | | |
$ | 236,751,000 | |
| Pipelines | |
| Included | | |
$ | 67,601,000 | |
| Brine Receiving/Pre-Treatment | |
$ | 44,783,522 | | |
$ | 166,627,000 | |
| Direct Lithium Extraction Unit | |
$ | 55,606,237 | | |
$ | 139,123,000 | |
| Purification & Concentration | |
$ | 66,020,375 | | |
$ | 153,645,000 | |
| Lithium Hydroxide Unit | |
$ | 72,007,009 | | |
$ | 158,354,000 | |
| Chemical Storage, Handling, & Utilities | |
$ | 30,052,094 | | |
$ | 124,229,000 | |
| Plant Buildings | |
| Included | | |
$ | 8,604,000 | |
| Freight | |
| Included | | |
$ | 8,054,000 | |
| Contingency (20%) | |
| Included | | |
$ | 210,987,000 | |
| Total
Factored Cost | |
| | | |
$ | 1,273,975,126 | |
| South West Arkansas Project Pre-Feasibility Study | 18 Sept 23 |
Figure 21-1. CAPEX Breakdown

Note: $1.05B total does not include
freight and contingency.
Major equipment refurbishment and replacement
is categorized as sustaining capital. The total sustaining capital cost for the 20-year project life is $248,721,000. These items are
detailed below in Table 21-3.
| South West Arkansas Project Pre-Feasibility Study | 18 Sept 23 |
Table 21-3. Sustaining Capital
| Description | |
Replacement/Refurbishment
Cost (US$) | | |
Frequency
(years) | |
| LSS Media | |
$ | 13,500,000 | | |
| 3 | |
| Calcium/Magnesium Resin | |
$ | 1,648,000 | | |
| 3 | |
| Boron IX Resin | |
$ | 3,705,000 | | |
| 3 | |
| ESP Workover Cost | |
$ | 630,000 | | |
| 2 | |
| ESP Replacement Cost | |
$ | 9,122,400 | | |
| 4 | |
| Filter Membrane | |
$ | 3,570,000 | | |
| 3 | |
| Electrolysis Unit (Anode & Membrane Service) | |
$ | 7,460,000 | | |
| 3 | |
| Reverse Osmosis Membranes | |
$ | 667,500 | | |
| 1 | |
| Sour Gas Compressor Overhaul | |
$ | 1,080,000 | | |
| 6 | |
| 21.1.8.1 | Well Facilities and Central
Processing Plant |
The brine supply and injection well facilities
will require approximately 320 acres of surface area for the facility arrangements detailed in Sections 18.1.1 and 18.3.1.
The CPF is proposed to be located on a 120-acre
property described in Section 18.2. These costs have been included in the assessment based on an assumed purchase price of US$5,000
per acre plus 20% for property acquisition related fees (US$6,000 /Acre) as described below in Table 21-4.
| South West Arkansas Project Pre-Feasibility Study | 18 Sept 23 |
Table 21-4. Well
Facilities and Central Processing Plant Land Costs
| Description | |
Quantity | | |
Unit | |
Units Cost
US$ | | |
Total Cost
US$ | |
| Supply Well Facilities (6 @ 16.73 Acres Each,
including Combined Well Facility) | |
| 100.38 | | |
Acres | |
$ | 6,000 | | |
$ | 602,124 | |
| Injection Well Facilities (8 @ 12.63 Acres Each) | |
| 101.04 | | |
Acres | |
$ | 6,000 | | |
$ | 606,446 | |
| Central Processing Facility | |
| 120.00 | | |
Acres | |
$ | 6,000 | | |
$ | 720,000 | |
| Total | |
| 321.42 | | |
Acres | |
| - | | |
$ | 1,928,570 | |
| 21.1.8.2 | Pipeline
Right-of-Way |
Approximately 38
km (31.2 miles) of Right-of-Way (ROW) will be required for the pipelines detailed in Sections 18.1.1.6, 18.2.6, and 18.3.2. It is assumed
that the ROW’s will be purchased between years 2 and 3 of the project, after preliminary engineering and property negotiations
are complete. The assessment includes an average cost of $189,819 per km ($118,637 per mile) of ROW which includes the ROW and labor/acquisition
related costs for a total cost of $3,701,000.
| 21.2 | Operating
Expenditure Estimate |
| 21.2.1 | Basis
of Estimate (BOE) |
The BOE for the
OPEX of the SWA Project is a breakdown of the project’s individual operating expenditures. The operating costs presented herein
are for 30,000 metric tpa lithium hydroxide production over the 20-year life of the SWA Project.
| 21.2.2 | Direct
Operational Expenditures |
The following cost
elements have been taken into account for the direct OPEX estimation.
Labor manning levels
are based on experience and reported data from facilities operating in the region. A cost summary of manpower in all categories is provided
below in Table 21-5.
| South West Arkansas Project Pre-Feasibility Study | 18 Sept 23 |
Table 21-5. Manpower
Cost Summary
| Category | |
Full
Time
Employees (FTE) | | |
Average
Annual
Salary US$ | | |
Total
Annual
Cost US$ | |
| Management Personnel | |
| 6 | | |
$ | 141,667 | | |
$ | 850,000 | |
| Administration Personnel | |
| 3 | | |
$ | 56,667 | | |
$ | 170,000 | |
| Security Personnel | |
| 4 | | |
$ | 55,000 | | |
$ | 220,000 | |
| Production Personnel | |
| 40 | | |
$ | 75,500 | | |
$ | 3,473,000 | |
| Shipping & Receiving Personnel | |
| 6 | | |
$ | 50,000 | | |
$ | 300,000 | |
| Maintenance Personnel | |
| 26 | | |
$ | 76,154 | | |
$ | 2,277,000 | |
| QC & Lab Personnel | |
| 6 | | |
$ | 64,167 | | |
$ | 385,000 | |
| Total | |
| 91 | | |
$ | 84,431 | | |
$ | 7,675,000 | |
Salary and wage
estimates are based on published data for various trades prevailing in the City of El Dorado, Arkansas. El Dorado is a similar population
center to Magnolia with comparable industry. A 15% overtime allowance was applied to production and maintenance personnel. Manpower overheads
(benefits) are included in the OPEX summary as 45% of manpower costs.
Electrical energy
will be delivered to the sites from the Southwest Arkansas Electric Cooperative power grid. The electrical costs were provided by Southwest
Arkansas Electric Cooperative based on the estimated electric consumption and capital costs. These costs are combined into an all-in
rate estimate for years 1-5 and years 6-20 following capital recovery. The electrical energy cost is summarized below in Table 21-6.
| South West Arkansas Project Pre-Feasibility Study | 18 Sept 23 |
Table 21-6. Annual Electrical
Use and Cost
| Description | |
Quantity
(kWh) | | |
Unit Cost
(US$/kWh) | | |
Average Annual
Cost US$[1] | |
| Years 1-5 | |
| | | |
| | | |
| | |
| Well Field | |
| 126,205,328 | | |
$ | 0.106 | | |
$ | 13,406,893 | |
| Central Processing Facility | |
| 306,456,000 | | |
$ | 0.106 | | |
$ | 32,555,066 | |
| Annual Total (Years 1-5) | |
| | | |
| | | |
$ | 45,961,959 | |
| Years 6-20 | |
| | | |
| | | |
| | |
| Well Field | |
| 126,205,328 | | |
$ | 0.084 | | |
$ | 10,595,467 | |
| Central Processing Facility | |
| 306,456,000 | | |
$ | 0.084 | | |
$ | 25,728,268 | |
| Annual Total (Years 6-20) | |
| | | |
| | | |
$ | 36,323,736 | |
Note: 1. Annual consumption and cost figures are based on an average
annual lithium hydroxide production rate of 30,000 tonnes.
The largest consumer
of electrical power at the Central Processing Facility is the Electrolysis Plant, accounting for 57% of the CPF consumption at a cost
of US$14,775,939/year (capital recovery costs excluded).
| 21.2.2.3 | Reagents
and Consumables |
Reagents and consumables
are the various additions required for the production process of lithium hydroxide.
Quantities for
each item are estimated based on preliminary process flow calculations for the plant. The costs for the reagents and chemicals are based
on pricing received from local suppliers as shown below in Table 21-7.
| South West Arkansas Project Pre-Feasibility Study | 18 Sept 23 |
Table
21-7. Average Annual Reagents Cost For 30,000 Tonnes Lithium Hydroxide Per Year Production
| Description | |
Average
Annual
Consumption | | |
Unit
Cost US$ | | |
Average
Annual
Cost US$[1] | |
| Well Field | |
| | |
| | |
| |
| Scale Inhibitors | |
| 11.9
m3 | | |
| $12,728
/ m3 | | |
$ | 152,000 | |
| Corrosion Inhibitors | |
| 7.35
m3 | | |
| $19,905
/ m3 | | |
$ | 146,000 | |
| Subtotal | |
| - | | |
| - | | |
$ | 298,000 | |
| Central Processing Facility | |
| | | |
| | | |
| | |
| Sodium Hydroxide – 50% | |
| 37,693
tonnes | | |
| $542
/ tonne | | |
$ | 20,442,000 | |
| Hydrochloric Acid – 32% | |
| 1,893
tonnes | | |
| $221
/ tonne | | |
$ | 419,000 | |
| Soda Ash | |
| 23,225
tonnes | | |
| $485
/ tonne | | |
$ | 11,265,000 | |
| Sodium Metabisulfite | |
| 2,156
tonnes | | |
| $860
/ tonne | | |
$ | 1,854,000 | |
| Lime | |
| 418
tonnes | | |
| $170
/ tonne | | |
$ | 71,000 | |
| Nitrogen | |
| 2,015
tonnes | | |
| $189
/ tonne | | |
$ | 382,000 | |
| Subtotal | |
| - | | |
| - | | |
$ | 34,432,000 | |
| Grand Total | |
| - | | |
| - | | |
| $34,730,
000 | |
Note: 1. Annual consumption and cost
figures are based on an annual lithium hydroxide production rate of 30,000 tonnes.
Water wells will
be installed at each of the well facilities and CPF. Operating costs for the wells are included in the electrical power and maintenance,
and servicing portions of this OPEX breakdown.
Natural gas will
be required as fuel gas for the 17,640 W (1,800 boiler hp) boiler at the CPF, as detailed below in Table 21-8.
| South West Arkansas Project Pre-Feasibility Study | 18 Sept 23 |
Table
21-8. Natural Gas Use
| Description | |
Average
Annual
Consumption | | |
Unit
Cost US$ | | |
Average
Annual
Cost US$ | |
| Natural Gas Consumption | |
| 36,500
MMbtu | | |
$4.25
/ MMbtu | | |
$ | 155,125 | |
| Minimum Demand Charge all years | |
| 1,095,000
MMbtu | | |
$0.2441
/ MMbtu | | |
$ | 267,290 | |
| Interconnection CAPEX | |
| (5
year recovery) | | |
$367,000 | | |
$ | 73,400 | |
| Grand Total (Years 1-5) | |
| - | | |
- | | |
$ | 495,815 | |
| Grand Total (Years 6-20) | |
| - | | |
- | | |
$ | 422,415 | |
Note: Annual consumption and cost figures are based on an annual lithium
hydroxide production rate of 30,000 tonnes.
The estimated cost
of natural gas includes the requirement for transportation infrastructure to serve the CPF location. The infrastructure costs will be
paid back over the first 5 years. The unit cost rate of natural gas used is provided by a potential gas supplier. The minimum demand
charge is greater than the actual demand but has been set to ensure preferential supply. No credit is provided for any natural gas that
may be co-produced with the brine.
| 21.2.2.6 | Maintenance
and Servicing |
Routine maintenance
and servicing activities are required for efficient operation of the well field, pipelines, and central processing facility. Estimated
maintenance costs are provided below in Table 21-9.
| South West Arkansas Project Pre-Feasibility Study | 18 Sept 23 |
Table 21-9. Maintenance &
Servicing Costs
| Description | |
Basis / Frequency | |
Average
Annual Cost
US$ | |
| Well Field Surface Equipment/Site Servicing | |
3% Direct Cost Less Drilling & Equipment
Costs | |
$ | 1,068,000 | |
| Pipelines ROW | |
3% of Direct Cost | |
$ | 2,028,000 | |
| Central Processing Facility Equipment | |
4% Equipment Costs | |
$ | 10,739,000 | |
| Central Processing Facility Infrastructure | |
3% of Direct Costs | |
$ | 258,000 | |
| Total | |
- | |
$ | 14,093,000 | |
The estimated cost
for the well field maintenance and servicing activities is based on historical pricing and factors used on similar well facilities in
south Arkansas. Routine maintenance activities for the pipeline Right-of-Way (ROW) do not include major pipeline overhauls or repairs
as the service life for the pipelines are expected to be greater than the service life of the project. A 4% factor was used to estimate
the maintenance and servicing costs for equipment at the CPF. A 3% factor was used to estimate the general maintenance costs associated
with the site/infrastructure upkeep at the facility.
| 21.2.2.7 | Product
Transport |
All reagent pricing
includes transportation to site. The lithium hydroxide cost in the model is considered over the fence pricing, with all freight and other
costs to be borne by the purchaser.
Solids disposal
costs are shown below in Table 21-10. It is assumed that two pump-outs will be required annually to remove the solids from the three-phase
separators on each of the supply wells. The cost per pump out is based on historical pricing for a pump truck. Disposal will also be
required for pre-treatment solids and softening sludge produced at the CPF. This pricing is based on the expected solids production rate
and an estimated cost provided by a solid waste handling and disposal company. Given the CPF solids quantity and associated disposal
cost, it is recommended that process optimization work be completed as part of the DFS phase to significantly reduce or eliminate CPF
solid waste generation.
| South West Arkansas Project Pre-Feasibility Study | 18 Sept 23 |
Table
21-10. Solids Disposal
| Process
Area | |
Qty. | | |
Unit
Cost US$ | | |
Total
Annual Cost US$ | |
| Brine Supply Well
Separators | |
| 42
/ year (2 pump outs per year for 21 separators) | | |
$ | 1,750.00 | | |
$ | 73,500.00 | |
| CPF Solids Disposal | |
| 4,329
/year | | |
$ | 3,764.14 | | |
$ | 16,294,962 | |
| Grand Total | |
| - | | |
| - | | |
$ | 16,368,462 | |
| 21.2.2.2 | Miscellaneous
Costs |
Miscellaneous operating
costs include costs that are anticipated but cannot be accurately estimated at this stage of the project. These costs are estimated at
1.5% of the other direct costs or $1,696,000.
| 21.2.3 | Indirect
Operational Expenditures |
The following indirect
cost elements are included for the OPEX estimation.
Insurance during
the operation phase will cover property, general liability, and the risk of business interruption. The annual insurance premium has been
estimated at 0.5% of direct CAPEX or $4,190,000.
| 21.2.3.2 | Sales,
Marketing, and Customers Relations |
The annual cost
of sales, marketing, and customer relations is estimated at 0.15% of direct OPEX or $172,145.
Federal, state,
and county taxes have been considered and are included in the economic model.
| 21.2.3.4 | Environmental
Monitoring |
Environmental monitoring
contains the annual cost of environmental assessment and monitoring including air emissions, water discharges, waste disposal, noise
emission, and changes to the environment. The annual cost for environmental monitoring is estimated at 0.5% of direct OPEX or $573,816.
| South West Arkansas Project Pre-Feasibility Study | 18 Sept 23 |
| 21.2.3.5 | Mine
Closure Fund |
Each well will
need to be plugged and capped at the end of operations. A $35,000 allowance has been included for each brine supply and injection well
to cover the cost to plug and cap the wells. These costs will be incurred as a one-time cost at the end of operations. A surety bond
will be secured prior to operation of the plant to provide the necessary assurances that the mine closure funds will be available at
or prior to the conclusion of operations of the facilities. The surety bond principal is assumed to be a one-time 3% fee of the total
closure fund amount payable on the 1st year of operations of the plant.
| 21.2.4 | Mineral
Rights, Royalties and Land Fees |
The following cost
elements are taken into account for the mineral rights, royalties and land costs.
| 21.2.4.1 | Mineral
Rights & Royalty Fees |
As detailed in
Section 4, Standard Lithium have executed an option agreement with TETRA Technologies Inc. (TETRA) to acquire the rights to conduct
exploration, production, and lithium extraction activities on brine leases in southern Arkansas, USA. Standard Lithium maintain the option
agreement through a series of annual payments that will switch to royalty payments due when production commences. The terms of this agreement
are summarized in Table 21-11, and the payments and royalties have been included in the project economic modeling.
| South West Arkansas Project Pre-Feasibility Study | 18 Sept 23 |
Table 21-11.
TETRA Brine Lease Agreement Summary
| Description |
Total
Amount
US$ |
Remarks |
| Initial
Payment |
$500,000 |
Paid
Prior to Year 1 (2021) of Project. |
| -
30 Day Payment after Agreement |
$500,000 |
| -
Payment 1 Year after Agreement |
$600,000 |
| -
Payment 2 Years after Agreement |
$700,000 |
| -
Payment 3 Years after Agreement |
$750,000 |
-
Annual Payments Starting 4 Years after Agreement through 10 Years After Agreement |
$1,000,000 |
Years
4 & 5 Paid |
| Royalties |
|
|
| -
Initial US$1M Annual Payments |
$4,000,000 |
During
Project Development & Startup |
| -
Royalties – 2.5% of Gross Revenue |
$21,160,714 |
Average
Annual Payments |
| $444,375,000 |
Total
Amount Paid for Life of Plant |
The annual operating
cost summary is given in Table 21-12 and a breakdown of the OPEX costs by area is shown in Figure 21-2.
| South West Arkansas Project Pre-Feasibility Study | 18 Sept 23 |
Table
21-12. Annual OPEX Summary
| Description | |
Total
Average Annual Cost
US$ | | |
Total
Average Cost
US$ per Tonne Lithium
Hydroxide | |
| Direct Operational Expenditures | |
| | |
| |
| -
Manpower | |
$ | 11,130,000 | | |
$ | 371 | |
| -
Electrical Power | |
$ | 38,730,000 | | |
$ | 1,291 | |
| -
Reagents & Consumables | |
$ | 34,730,000 | | |
$ | 1,158 | |
| -
Natural Gas | |
$ | 440,000 | | |
$ | 15 | |
| -
Maintenance | |
$ | 14,090,000 | | |
$ | 470 | |
| -
Solids Disposal | |
$ | 16,370,000 | | |
$ | 546 | |
| -
Miscellaneous Costs | |
$ | 1,700,000 | | |
$ | 57 | |
| Subtotal | |
$ | 117,190,000 | | |
$ | 3,906 | |
| Indirect Operational Expenditures | |
| | | |
| | |
| -
Insurance | |
$ | 4,190,000 | | |
$ | 140 | |
| -
Sales, Marketing & Customers Relations | |
$ | 172,000 | | |
$ | 6 | |
| -
Environmental Monitoring | |
$ | 574,000 | | |
$ | 19 | |
| -
Well Closure Fund | |
$ | 80,000 | | |
$ | 3 | |
| Subtotal | |
$ | 5,010,000 | | |
$ | 167 | |
| Total | |
$ | 122,202,000 | | |
$ | 4,073 | |
Note: LSS technology licensing fees
have not been identified as an OPEX cost as these are expected to be paid as a one-off, up-front payment and are considered to be included
in the factored CAPEX costs.
| South West Arkansas Project Pre-Feasibility Study | 18 Sept 23 |
Figure 21-2.
OPEX Breakdown

| 21.2.6 | All-In
Operating Costs |
In order to provide
an indication of the expected day-to-day costs to allow continuous, reliable operation of the Project facilities, a nominal “all-in”
Operating Cost has been defined. This all-in operating cost includes the OPEX costs presented above, the sustaining capital costs and
the royalties payable to TETRA. The “all-in” Operating Cost has been calculated to be $5,229/tonne of LiOH produced over
the life of the facility.
Note that sustaining
capital is variable and the electrical and natural gas costs over the first five years include the cost of capital recovery, therefore
this cost represents an annual average over the lifespan of the project.
In order to limit
unreasonable distortions to the base case Discounted Cash Flow (DCF) model, this estimate does not include allowances for escalation
of equipment, materials, and labor costs. Similarly, no allowances have been made for product or reagent price inflation and revenue
escalation. In addition, the following are excluded from the current CAPEX and OPEX estimates during the PFS phase but should be considered
during more detailed future phases.
| · | Feasibility
study fees |
| · | Sunk
and legal costs |
| · | Interest
and financing costs |
| · | Start-up
costs beyond those specifically included in the current estimate. |
| South West Arkansas Project Pre-Feasibility Study | 18 Sept 23 |
| 21.4 | Upside
Production Analysis |
As identified in
Section 14, the assessment of the resource using the lease area data collected as part of the PFS exploration program resulted in
a 52% increase in the resource. This in turn resulted in the identification of a potential upside production case of 35,000 tonnes/year
for 20 years as noted in Section 16. This section outlines the methodologies applied to support an independent economic analysis
of this scenario.
CAPEX costs are
scaled based on a capacity factored estimated considering the increased production. The estimated upside case CAPEX estimate is $1,360
million.
Operating costs
were evaluated in two categories, fixed and variable. Manpower was assumed to be a fixed cost based on the incremental sizing of the
facility. Variable costs including reagents, consumables and electrical usage were scaled linearly for the increased consumption. Other
costs including maintenance and miscellaneous costs were automatically adjusted as a percentage of the increased CAPEX as described above.
The resulting average annual OPEX cost was determined to be $3,964/tonne.
Inclusive of royalties
and sustaining capital, the all-in operating cost is $5,060/tonne.
Note that the $/tonne
costs are lower for increased production due to the impact of the fixed OPEX costs.
| South West Arkansas Project Pre-Feasibility Study | 18 Sept 23 |
The objective of
the economic analysis for this Project is to determine if the Project is financially viable. The analysis was prepared using a discounted
cash flow economic model, showing both pre- and post-tax results, to evaluate the project. Capital (CAPEX) and Operational (OPEX) Expenditures
presented in Section 21 have been used in this analysis. The model includes all taxes, government, and lease royalties/payments.
It does not include future lease-fees-in-lieu-of-royalties which are still to be determined and subject to regulatory approval for lithium
extraction. The results include Net Present Value (NPV) for an 8% discount rate, Internal Rate of Return (IRR), and sensitivity
analysis of key inputs.
This section presents
a comprehensive breakdown of the discounted cash flow model for the proposed SWA Project development.
The following criteria
have been used to develop the economic model:
| · | CAPEX:
Capital investment for the 30,000 tpa of battery-quality lithium hydroxide, including
equipment, materials, indirect costs, and contingencies at 20%, is estimated to be US$1,274
Million. This total excludes interest expenses. Additionally, property fees (for Well Facilities,
Production Facility, and TETRA Royalties) have been considered in the cash flow model, resulting
in an overall CAPEX of US$1,279 Million. |
| · | OPEX:
The yearly operating cost for the Project is estimated at around US$122 Million (no royalties
considered in this number). The full breakdown of the OPEX costs are provided in Section 21.
83% of the OPEX costs are derived from the four (4) cost categories as shown below. |
| o | Electrical
Power – 30% |
| o | Reagents &
Consumables – 28% |
| o | Solid
Disposal – 13% |
| o | Maintenance
– 12% |
The remaining components
of the operating costs have a significantly lower impact on the overall economics.
| · | Escalation:
In order to limit unreasonable distortions to the base case DCF model, this estimate
does not include allowances for escalation of equipment, materials, and labor costs. Similarly,
no allowances have been made for product or reagent price inflation and revenue escalation. |
| · | Cash
Flow: Cash flow includes a ramp-up phase (75% of production for the first 12 months of
production) at 85% of OPEX. |
| South West Arkansas Project Pre-Feasibility Study | 18 Sept 23 |
| · | Early
Detailed Engineering: Early engineering and permitting will commence in 2024. |
| · | Engineering,
Procurement & Construction: Total engineering and construction time of the project
is estimated at 27 months to completion for both the well field and the CPF. |
| · | Operating
Life: The plant is expected to operate for a period of no less than 20 years from the
start of production. |
| · | Commodity
Pricing: Pricing for battery-quality lithium hydroxide is as per the conclusions in Section 19
Market Studies and Contracts assumed at a price of US$30,000/tonne flat over the operating
life of the project. |
| · | Discounted
Cash Flow (DCF): The DCF model has been based on an 8% discount ratio. |
| · | Equity
Basis: It has been assumed that 100% of capital expenditures, including pre-production
expenses, are financed with Owners’ equity for the purposes of the project DCF evaluation. |
| · | Pre-Construction
Expenses: Pre-construction expenses other than land purchase are treated as sunk costs
and not included in the DCF analysis. |
The following royalties
and taxes have been applied to the economic analysis of the Project.
| 22.2.1 | Royalties
and Lease Fees |
Yearly Lease Royalty
payments of 2.5% of Gross Revenue are considered, which accumulates to Royalty payments of US$444 Million over the 20 years of Operating
Life. Additional property fees, well facilities, production facility, and mineral lease fee accumulate to US$5.9 Million.
A yearly depreciation
of 5% (facility evenly depreciated over 20 years of Operating Life) is used for this analysis.
Sustaining capital
items are depreciated over the life span of the specific capital item.
The US Federal
Corporate Income Tax (CIT) rate of 21%, and the State Arkansas CIT rate of 5.1%, are used for this analysis.
For the Property
Tax calculation, the “Assessed Value” of the Development Capital Expenditure is calculated as 80% of TIC (CAPEX incl. Property
Fees). The Property Taxes are then calculated as 20% of the “Assessed Value” times the Property Tax rate of 4.18%.
| South West Arkansas Project Pre-Feasibility Study | 18 Sept 23 |
| 22.2.5 | Federal
Funding and Tax Benefits |
The DCF analysis
does not include any allowances for Federal funding for battery critical minerals projects or associated tax benefits. This will be reviewed
during the Feasibility Study Phase of the project.
The economic model
assumes that capital investment disbursements inclusive of the early engineering activities will be spread over 33 months.
Full production
of lithium hydroxide (30,000 tpa) will be achieved after a 12-month ramp-up period (ramp-up period assumes 75% of production, 85% of
variable OPEX).
Production revenues
have been estimated based on the price scenario for a lithium hydroxide product ($30,000 flat over project lifetime), as identified in
Section 19 Market Studies and Contracts.
Table 22-1 summarizes the Discounted
Cash Flow (DCF) for the assumed Base Case (Case 1) price and production level scenario.
| South West Arkansas Project Pre-Feasibility Study | 18 Sept 23 |
Table 22-1. Annual
Operating Cost Summary
| Economic
Model |
|
|
|
|
|
|
|
|
|
|
|
|
|
|
|
|
|
|
|
|
|
|
|
|
|
|
| YEAR |
|
2023 |
2024 |
2025 |
2026 |
2027 |
2028 |
2029 |
2030 |
2031 |
2032 |
2033 |
2034 |
2035 |
2036 |
2037 |
2038 |
2039 |
2040 |
2041 |
2042 |
2043 |
2044 |
2045 |
2046 |
2047 |
| Period |
|
0 |
1 |
2 |
3 |
4 |
5 |
6 |
7 |
8 |
9 |
10 |
11 |
12 |
13 |
14 |
15 |
16 |
17 |
18 |
19 |
20 |
21 |
22 |
23 |
24 |
| Total
Months (Cumulative) |
|
0 |
12 |
24 |
36 |
48 |
60 |
72 |
84 |
96 |
108 |
120 |
132 |
144 |
156 |
168 |
180 |
192 |
204 |
216 |
228 |
240 |
252 |
264 |
276 |
288 |
| Engineering
Duration (Months) |
12 |
- |
6 |
6 |
- |
- |
- |
- |
- |
- |
- |
- |
- |
- |
- |
- |
- |
- |
- |
- |
- |
- |
- |
- |
- |
- |
| Construction
Duration (Months) |
21 |
- |
- |
6 |
12 |
3 |
- |
- |
- |
- |
- |
- |
- |
- |
- |
- |
- |
- |
- |
- |
- |
- |
- |
- |
- |
- |
| Inflation
Factors |
|
|
|
|
|
|
|
|
|
|
|
|
|
|
|
|
|
|
|
|
|
|
|
|
|
|
| LHM
Cost |
0.00% |
1.00 |
1.00 |
1.00 |
1.00 |
1.00 |
1.00 |
1.00 |
1.00 |
1.00 |
1.00 |
1.00 |
1.00 |
1.00 |
1.00 |
1.00 |
1.00 |
1.00 |
1.00 |
1.00 |
1.00 |
1.00 |
1.00 |
1.00 |
1.00 |
1.00 |
| O&M
Costs |
0.00% |
1.00 |
1.00 |
1.00 |
1.00 |
1.00 |
1.00 |
1.00 |
1.00 |
1.00 |
1.00 |
1.00 |
1.00 |
1.00 |
1.00 |
1.00 |
1.00 |
1.00 |
1.00 |
1.00 |
1.00 |
1.00 |
1.00 |
1.00 |
1.00 |
1.00 |
| Production
(Tonnes per Year) |
|
|
|
|
|
|
|
|
|
|
|
|
|
|
|
|
|
|
|
|
|
|
|
|
|
|
| Running
Plant % of year |
|
0% |
0% |
0% |
0% |
75% |
100% |
100% |
100% |
100% |
100% |
100% |
100% |
100% |
100% |
100% |
100% |
100% |
100% |
100% |
100% |
100% |
100% |
100% |
100% |
25% |
| Ramp
up period |
|
0% |
0% |
0% |
0% |
75% |
25% |
0% |
0% |
0% |
0% |
0% |
0% |
0% |
0% |
0% |
0% |
0% |
0% |
0% |
0% |
0% |
0% |
0% |
0% |
0% |
| LHM |
|
- |
- |
- |
- |
16,875 |
28,125 |
30,000 |
30,000 |
30,000 |
30,000 |
30,000 |
30,000 |
30,000 |
30,000 |
30,000 |
30,000 |
30,000 |
30,000 |
30,000 |
30,000 |
30,000 |
30,000 |
30,000 |
30,000 |
7,500 |
| Sale
Price (USD $ per Tonne) |
|
|
|
|
|
|
|
|
|
|
|
|
|
|
|
|
|
|
|
|
|
|
|
|
|
|
| LHM |
|
- |
- |
- |
- |
30,000 |
30,000 |
30,000 |
30,000 |
30,000 |
30,000 |
30,000 |
30,000 |
30,000 |
30,000 |
30,000 |
30,000 |
30,000 |
30,000 |
30,000 |
30,000 |
30,000 |
30,000 |
30,000 |
30,000 |
30,000 |
| Revenues
(USD $) |
|
|
|
|
|
|
|
|
|
|
|
|
|
|
|
|
|
|
|
|
|
|
|
|
|
|
| LHM |
|
- |
- |
- |
- |
506,250,000 |
843,750,000 |
900,000,000 |
900,000,000 |
900,000,000 |
900,000,000 |
900,000,000 |
900,000,000 |
900,000,000 |
900,000,000 |
900,000,000 |
900,000,000 |
900,000,000 |
900,000,000 |
900,000,000 |
900,000,000 |
900,000,000 |
900,000,000 |
900,000,000 |
900,000,000 |
225,000,000 |
| Gross
Revenue (USD $) |
0 |
0 |
0 |
0 |
506,250,000 |
843,750,000 |
900,000,000 |
900,000,000 |
900,000,000 |
900,000,000 |
900,000,000 |
900,000,000 |
900,000,000 |
900,000,000 |
900,000,000 |
900,000,000 |
900,000,000 |
900,000,000 |
900,000,000 |
900,000,000 |
900,000,000 |
900,000,000 |
900,000,000 |
900,000,000 |
225,000,000 |
| Operating
Expenses (USD $) |
|
|
|
|
|
|
|
|
|
|
|
|
|
|
|
|
|
|
|
|
|
|
|
|
|
|
| Royalties |
|
- |
- |
- |
- |
12,656,250 |
21,093,750 |
22,500,000 |
22,500,000 |
22,500,000 |
22,500,000 |
22,500,000 |
22,500,000 |
22,500,000 |
22,500,000 |
22,500,000 |
22,500,000 |
22,500,000 |
22,500,000 |
22,500,000 |
22,500,000 |
22,500,000 |
22,500,000 |
22,500,000 |
22,500,000 |
5,625,000 |
| Operating
& Maintenance Costs |
|
- |
- |
- |
2,782,188 |
90,650,656 |
125,519,415 |
129,405,703 |
129,405,703 |
129,405,703 |
119,694,080 |
119,694,080 |
119,694,080 |
119,694,080 |
119,694,080 |
119,694,080 |
119,694,080 |
119,694,080 |
119,694,080 |
119,694,080 |
119,694,080 |
119,694,080 |
119,694,080 |
119,694,080 |
119,694,080 |
39,775,083 |
| Operating
Expenses |
- |
- |
- |
2,782,188 |
103,306,906 |
146,613,165 |
151,905,703 |
151,905,703 |
151,905,703 |
142,194,080 |
142,194,080 |
142,194,080 |
142,194,080 |
142,194,080 |
142,194,080 |
142,194,080 |
142,194,080 |
142,194,080 |
142,194,080 |
142,194,080 |
142,194,080 |
142,194,080 |
142,194,080 |
142,194,080 |
45,400,083 |
| Operating
EBITDA (USD $) |
- |
- |
- |
(2,782,188) |
402,943,094 |
697,136,835 |
748,094,297 |
748,094,297 |
748,094,297 |
757,805,920 |
757,805,920 |
757,805,920 |
757,805,920 |
757,805,920 |
757,805,920 |
757,805,920 |
757,805,920 |
757,805,920 |
757,805,920 |
757,805,920 |
757,805,920 |
757,805,920 |
757,805,920 |
757,805,920 |
179,599,917 |
| Taxable
Expenses / Income (USD $) |
|
|
|
|
|
|
|
|
|
|
|
|
|
|
|
|
|
|
|
|
|
|
|
|
|
|
| Total
Capital Expenditure |
(1,528,624,330) |
(1,720,000) |
(114,876,169) |
(406,681,686) |
(605,500,673) |
(151,125,168) |
(7,446,833) |
(18,476,833) |
(12,008,033) |
(12,008,033) |
(18,476,833) |
(7,446,833) |
(12,008,033) |
(23,038,033) |
(7,446,833) |
(7,446,833) |
(23,038,033) |
(12,008,033) |
(7,446,833) |
(18,476,833) |
(12,008,033) |
(12,008,033) |
(18,476,833) |
(7,446,833) |
(12,008,033) |
- |
| Depreciation |
5.00% |
- |
- |
- |
- |
(63,995,185) |
(63,995,185) |
(63,995,185) |
(63,995,185) |
(63,995,185) |
(63,995,185) |
(63,995,185) |
(63,995,185) |
(63,995,185) |
(63,995,185) |
(63,995,185) |
(63,995,185) |
(63,995,185) |
(63,995,185) |
(63,995,185) |
(63,995,185) |
(63,995,185) |
(63,995,185) |
(63,995,185) |
(63,995,185) |
|
| Depreciation
of Sustaining Capital |
|
|
|
|
|
- |
(7,446,833) |
(11,123,500) |
(12,263,800) |
(13,404,100) |
(13,404,100) |
(13,404,100) |
(13,404,100) |
(13,404,100) |
(13,404,100) |
(13,404,100) |
(13,404,100) |
(13,404,100) |
(13,404,100) |
(13,404,100) |
(13,404,100) |
(13,404,100) |
(13,404,100) |
(13,404,100) |
(13,404,100) |
- |
| Taxable
Expenses |
- |
- |
- |
- |
(63,995,185) |
(71,442,018) |
(75,118,685) |
(76,258,985) |
(77,399,285) |
(77,399,285) |
(77,399,285) |
(77,399,285) |
(77,399,285) |
(77,399,285) |
(77,399,285) |
(77,399,285) |
(77,399,285) |
(77,399,285) |
(77,399,285) |
(77,399,285) |
(77,399,285) |
(77,399,285) |
(77,399,285) |
(77,399,285) |
- |
| Net
Taxable Income |
- |
- |
- |
(2,782,188) |
338,947,909 |
625,694,817 |
672,975,612 |
671,835,312 |
670,695,012 |
680,406,635 |
680,406,635 |
680,406,635 |
680,406,635 |
680,406,635 |
680,406,635 |
680,406,635 |
680,406,635 |
680,406,635 |
680,406,635 |
680,406,635 |
680,406,635 |
680,406,635 |
680,406,635 |
680,406,635 |
179,599,917 |
| US
Federal Corp. Income Tax |
21.0% |
- |
- |
- |
- |
(71,179,061) |
(131,395,912) |
(141,324,878) |
(141,085,415) |
(140,845,952) |
(142,885,393) |
(142,885,393) |
(142,885,393) |
(142,885,393) |
(142,885,393) |
(142,885,393) |
(142,885,393) |
(142,885,393) |
(142,885,393) |
(142,885,393) |
(142,885,393) |
(142,885,393) |
(142,885,393) |
(142,885,393) |
(142,885,393) |
(37,715,983) |
| State
Arkansas Corp. Income Tax |
5.1% |
- |
- |
- |
- |
(17,286,343) |
(31,910,436) |
(34,321,756) |
(34,263,601) |
(34,205,446) |
(34,700,738) |
(34,700,738) |
(34,700,738) |
(34,700,738) |
(34,700,738) |
(34,700,738) |
(34,700,738) |
(34,700,738) |
(34,700,738) |
(34,700,738) |
(34,700,738) |
(34,700,738) |
(34,700,738) |
(34,700,738) |
(34,700,738) |
(9,159,596) |
| Property
Tax |
- |
|
(11,503) |
(779,795) |
(3,499,682) |
(7,549,271) |
(8,559,996) |
(8,559,996) |
(8,559,996) |
(8,559,996) |
(8,559,996) |
(8,559,996) |
(8,559,996) |
(8,559,996) |
(8,559,996) |
(8,559,996) |
(8,559,996) |
(8,559,996) |
(8,559,996) |
(8,559,996) |
(8,559,996) |
(8,559,996) |
(8,559,996) |
(8,559,996) |
(8,559,996) |
(8,559,996) |
| Profit
after Taxes and Royalties |
(1,720,000) |
(114,887,672) |
(407,461,481) |
(611,782,543) |
91,808,066 |
453,828,474 |
488,768,981 |
487,926,299 |
487,083,618 |
494,260,507 |
494,260,507 |
494,260,507 |
494,260,507 |
494,260,507 |
494,260,507 |
494,260,507 |
494,260,507 |
494,260,507 |
494,260,507 |
494,260,507 |
494,260,507 |
494,260,507 |
494,260,507 |
494,260,507 |
124,164,343 |
| |
|
|
|
|
|
|
|
|
|
|
|
|
|
|
|
|
|
|
|
|
|
|
|
|
|
|
| Net
Cash Flow |
(1,720,000) |
(114,887,672) |
(407,461,481) |
(611,782,543) |
155,803,251 |
517,823,659 |
545,410,833 |
552,177,251 |
552,474,869 |
553,182,959 |
564,212,959 |
559,651,759 |
548,621,759 |
564,212,959 |
564,212,959 |
548,621,759 |
559,651,759 |
564,212,959 |
553,182,959 |
559,651,759 |
559,651,759 |
553,182,959 |
564,212,959 |
559,651,759 |
124,164,343 |
| Discounted
Cash Flow (DCF) - Pre-Tax |
8.00% |
(1,720,000) |
(106,366,823) |
(348,663,997) |
(482,874,546) |
185,093,693 |
469,391,426 |
459,782,765 |
429,499,265 |
397,684,504 |
369,848,612 |
347,561,443 |
319,859,930 |
291,786,437 |
275,905,479 |
255,468,036 |
231,629,481 |
217,691,294 |
202,798,764 |
185,016,386 |
172,810,368 |
160,009,600 |
146,871,972 |
138,021,431 |
127,020,779 |
28,322,788 |
| Discounted
Cash Flow (DCF) - Post-Tax |
8.00% |
(1,720,000) |
(106,377,474) |
(349,332,546) |
(485,652,707) |
114,520,041 |
352,422,081 |
343,701,341 |
322,190,122 |
298,484,981 |
276,729,204 |
261,339,768 |
240,025,047 |
217,865,249 |
207,459,934 |
192,092,532 |
172,948,459 |
163,357,014 |
152,489,245 |
138,433,498 |
129,678,064 |
120,072,282 |
109,892,974 |
103,781,618 |
95,317,248 |
19,580,635 |
| Cummulated
DCF |
|
(1,720,000) |
(108,097,474) |
(457,430,020) |
(943,082,727) |
(828,562,686) |
(476,140,605) |
(132,439,264) |
189,750,858 |
488,235,839 |
764,965,043 |
1,026,304,812 |
1,266,329,858 |
1,484,195,107 |
1,691,655,041 |
1,883,747,572 |
2,056,696,031 |
2,220,053,045 |
2,372,542,289 |
2,510,975,788 |
2,640,653,852 |
2,760,726,134 |
2,870,619,108 |
2,974,400,726 |
3,069,717,974 |
3,089,298,609 |
| |
|
|
|
|
|
|
|
|
|
|
|
|
|
|
|
|
|
|
|
|
|
|
|
|
|
|
| Internal
Rate of Return (IRR) |
|
Net
Present Value (NPV) |
|
|
|
|
|
|
|
|
|
|
|
|
|
|
|
|
|
|
|
|
| Pre-Tax |
41.270% |
|
NPV
- Pre-Tax |
$4,472,449,000 |
|
|
|
|
|
|
|
|
|
|
|
|
|
|
|
|
|
|
|
|
| Post-Tax |
32.833% |
|
NPV
- Post-Tax |
|
$3,089,299,000 |
|
|
|
|
|
|
|
|
|
|
|
|
|
|
|
|
|
|
|
|
| South West Arkansas Project Pre-Feasibility Study | 18 Sept 23 |
| 22.6 | Economic
Evaluation Results |
The Project economics
resulting from the assumed price scenario at full production, which was used in the economic model, are presented in Table 22-2. Values
of NPV were also calculated for a discount rate of 8%.
Table 22-2. Economic
Evaluation – Case 1 (Base Case) Summary
| Overview | |
Units | |
Values | |
| Production | |
Tonnes / Year | |
| 30,000 | |
| Plant Operation | |
Years | |
| 20 | |
| Capital Cost (CAPEX) | |
US$ | |
| 1,273,975,000 | |
| Annual Operating Cost (OPEX) | |
US$ | |
| 122,202,000 | |
| Selling Price | |
US$ / Tonne | |
| 30,000 | |
| Annual Revenue at full production | |
US$ | |
| 900,000,000 | |
| Discount Rate | |
% | |
| 8 | |
| Net Present Value (NPV) Post-Tax | |
US$ | |
| 3,089,299,000 | |
| Net Present Value (NPV) Pre-Tax | |
US$ | |
| 4,472,449,000 | |
| Internal Rate of Return (IRR) Post-Tax | |
% | |
| 32.8 | |
| Internal Rate of Return (IRR) Pre-Tax | |
% | |
| 41.3 | |
| Payback period | |
Years | |
| 4 | |
Notes:
| 1. | In
order to limit unreasonable distortions to the base case DCF model, this estimate does not
include allowances for escalation of equipment, materials, and labor costs. Similarly, no
allowances have been made for product or reagent price inflation and revenue escalation. |
| 2. | The
economic analysis does not include future lease-fees-in-lieu-of-royalties which are still
to be determined and subject to regulatory approval for lithium extraction. |
| 3. | Lithium
hydroxide pricing is considered to be ex-works with the buyer taking responsibility for transport. |
| South West Arkansas Project Pre-Feasibility Study | 18 Sept 23 |
A sensitivity analysis
methodology, using one-factor-at-a-time (OAT), involves changing one input variable, keeping others at their baseline (nominal) values,
and then returning the variable to its nominal value. This is repeated for each of the other inputs in the same way.
OAT sensitivity
analysis was conducted to illustrate the impact of changes on the corresponding values of NPV and IRR for the following project key variables;
| · | CAPEX
(+/- 20%), |
| · | OPEX
(+/- 20%), |
| · | Selling
Price (+/- 20%), |
| · | Production
(+/- 5,000 tonnes per annum) |
The results of
the sensitivity analysis, with NPVs at an 8% discount rate, are presented in Table 22-3, and Figure 22-1 and Figure 22-2.
Sensitivity of
NPV and IRR to the product selling price increase and decrease by 20%, OPEX increase and decrease by 20%, CAPEX increase and decrease
by 20%, and production output increase and decrease by 5,000 tonnes/year is shown in Table 22-3. For the Sensitivity of the CAPEX Variation,
the OPEX has been kept at the baseline (nominal) value.
| South West Arkansas Project Pre-Feasibility Study | 18 Sept 23 |
Table 22-3. Sensitivity
Analysis
| | |
After-Tax
NPV (US$
millions) | | |
After-Tax
IRR (%) | |
| Base Case | |
$ | 3,089 | | |
| 32.8 | % |
| -20% Lithium Hydroxide Price | |
$ | 2,121 | | |
| 26.3 | % |
| +20% Lithium Hydroxide Price | |
$ | 4,058 | | |
| 38.9 | % |
| +20% Operating Costs | |
$ | 2,950 | | |
| 31.9 | % |
| -20% Operating Costs | |
$ | 3,229 | | |
| 33.7 | % |
| +20% Capital Costs | |
$ | 2,892 | | |
| 28.3 | % |
| -20% Capital Costs | |
$ | 3,287 | | |
| 39.1 | % |
| -5,000 tonnes/year production | |
$ | 2,282 | | |
| 27.4 | % |
| +5,000 tonnes/year production | |
$ | 3,897 | | |
| 37.9 | % |
Tornado charts
were created to show the sensitivity of NPV and IRR to changes in the key variables. Sensitivity of Post-Tax NPV at 8% discount rate
to the changes in the CAPEX, OPEX, Selling Price, and Production output is illustrated in the tornado chart in Figure 22-1.
| South West Arkansas Project Pre-Feasibility Study | 18 Sept 23 |
Figure 22-1.
NPV Post Tax Sensitivity

Sensitivity of
Post-Tax IRR to the changes in the CAPEX, OPEX, Selling Price, and Production is illustrated in Figure 22-2.
Figure 22-2.
IRR Post-Tax Sensitivity

| South West Arkansas Project Pre-Feasibility Study | 18 Sept 23 |
| 22.8 | Sensitivity
Analysis Conclusions |
The sensitivity
analysis of the project indicates that the economics remain robust even under the downside scenarios of a 20% increased CAPEX, a 20%
reduced product selling price, a 5,000 tpa reduced production output, or a 20% increased OPEX.
| 22.9 | Upside
Production Scenario |
As identified in
Section 16 the exploration program and resource evaluation undertaken during the PFS phase have confirmed the capacity of the resource
to support a project producing 30,000 tpa lithium hydroxide. In addition, it was noted that due to the higher lithium grades detected
during the PFS sampling program, the resource could be expected to produce up to 35,000 tpa. The potential impact of this was assessed
by factoring the CAPEX based on plant capacity and linearly increasing reagent, power and natural gas demands as per the methodology
outlined in Section 21.4.
This evaluation
varies from the sensitivity analysis presented above in that rather than being a one-factor-at-a-time approach, this is more representative
of a true project execution for increased production.
| 22.9.1 | Deviation
of Alternative Upside Scenario from Base Case |
| · | CAPEX:
The CAPEX estimate to account for an increase in production from 30,000 tonnes lithium hydroxide
to 35,000 tonnes is US$1,360 million. |
| · | OPEX:
The yearly operating cost for the Project is estimated at around US$139 Million. This figure
includes Plant Manpower (including Overheads), Electrical Power, Reagents and Consumables,
Natural Gas, Maintenance, Solids Disposal, Miscellaneous Costs, Insurance, Sales and
Customers Relations, Plant Optimizations and Development, Environmental Monitoring, Natural
Gas Interconnection Cost, Electrical Infrastructure Cost, and Mine Closure Fund. Royalties
exclusive of lease-fees-in-lieu-of-royalties are included and have been adjusted in line
with plant production increases. |
The results of
the economic evaluation of the upside production case are shown in Table 22-4. All other Evaluation Criteria are maintained as described
under Paragraph 22.1.
| South West Arkansas Project Pre-Feasibility Study | 18 Sept 23 |
Table
22-4. Economic Evaluation – Case 2 (Alternative Upside Scenario) Summary
| Overview | |
Units | |
Values | |
| Production | |
Tonnes / Year | |
| 35,000 | |
| Plant Operation | |
Years | |
| 20 | |
| Capital Cost (CAPEX) | |
US$ | |
| 1,360,426,585 | |
| Annual Operating Cost (OPEX) | |
US$ | |
| 138,756,440 | |
| Selling Price | |
US$ / Tonne | |
| 30,000 | |
| Annual Revenue at full production | |
US$ | |
| 1,050,000,000 | |
| Discount Rate | |
% | |
| 8 | |
| Net Present Value (NPV) Post-Tax | |
US$ | |
| 3,735,499,000 | |
| Net Present Value (NPV) Pre-Tax | |
US$ | |
| 5,366,652,000 | |
| Internal Rate of Return (IRR) Post-Tax | |
% | |
| 35.4 | |
| Internal Rate of Return (IRR) Pre-Tax | |
% | |
| 44.4 | |
| Payback period | |
Years | |
| 4 | |
Notes:
| 1. | In
order to limit unreasonable distortions to the base case DCF model, this estimate does not
include allowances for escalation of equipment, materials, and labor costs. Similarly, no
allowances have been made for product or reagent price inflation and revenue escalation. |
| 2. | The
economic analysis does not include future lease-fees-in-lieu-of-royalties which are still
to be determined and subject to regulatory approval for lithium extraction. |
| 3. | Lithium
hydroxide pricing is considered to be ex-works with the buyer taking responsibility for transport. |
| South West Arkansas Project Pre-Feasibility Study | 18 Sept 23 |
Several companies
have significant stake-holdings to the North, South and East of the SWA Property as illustrated below in Figure 23-1 and further discussed
in the sections that follow.
Figure 23-1.
Arkansas Regional Activity

The authors have
not verified the information associated with adjacent properties, and the information associated with these adjacent properties may not
be indicative of mineralization that may exist on, or the potential for similar development at, the SWA Project.
Albemarle Corporation
Albemarle Corporation
is one of the largest producers of bromine and lithium related resources / products world-wide with bromine operations in Arkansas (U.S.)
and Jordan and lithium operations in Chile, Australia, Germany and Clayton Valley, Nevada (U.S.). Albemarle exclusively operates using
conventional lithium extraction technologies at their commercial facilities but have invested significant resources into DLE research.
To QP’s knowledge, no lithium has been commercially produced to date by Albemarle at either of their facilities in South Arkansas.
| South West Arkansas Project Pre-Feasibility Study | 18 Sept 23 |
Albemarle Corporation
operates two (2) brine-based bromine extraction plants near Magnolia, AR. Albemarle's Magnolia North and South plants are fed by
a network of brine production wells in Columbia County. During 2021, Albemarle Corporation processed approximately 20 million cubic meters
(125. million U.S. Barrels) of brine to produce approximately 74,000 tons of bromine at its Magnolia facilities (Albemarle Corporation,
2021). In 2021, Albemarle announced the company will double capacity for brine extraction by 2025. The well field that supports Albemarle’s
Magnolia operations directly abuts sections of the SWA Property on the northern and eastern boundaries.
Lanxess Corporation
Lanxess operates
three brine-based bromine extraction plants near El Dorado, AR (U.S.). The well-field that supports the Lanxess El Dorado Plants is sub-divided
into three contiguous ‘units’ based on the three unitized areas of shared bromine operation: South, Central, and West unit
areas.
During 2021, Lanxess
processed approximately 13.3 million cubic meters (83.7 million U.S. Barrels) of brine to support their South Arkansas Bromine Operations.
In addition to bromine, Lanxess entered the battery chemistry business with electrolyte production for lithium-ion batteries in Leverkusen,
Germany (Lanxess, 2021) and is actively working with Standard Lithium for operation of their Demonstration Scale Lithium Pilot Plant
and development of their first commercial plant, the LANXESS Project Phase 1A, both located at the Lanxess South Plant.
Saltwerx (Subsidiary
to Galvanic, LLC)
Saltwerx, LLC (Subsidiary
to Galvanic Energy) has ownership of 120,000 gross acres of resource claims in the Smackover Formation. Saltwerx has completed well testing,
reservoir modeling, and inferred mineral resource estimations on their lithium-brine prospect in southern Arkansas. They estimate that
this acreage could contain 4 million tons of lithium carbonate equivalent (Saltwerx, 2021). The property is located directly south of
the TETRA Property.
TETRA Technologies
In September 2022,
TETRA completed a maiden inferred bromine and lithium brine resource estimation report for its leased acreage in the Smackover Formation.
The brine resource underlying the approximately 5,000 gross acres where TETRA holds lithium mineral rights that are not subject to the
lithium option agreement with Standard Lithium is estimated to contain an inferred resource of 212,000 tonnes of lithium carbonate equivalent
(Tetra, 2022). In June 2023, TETRA filed an application to establish a unitized brine unit on this property and indicated an increase
in the acreage to approximately 6,000 acres (Tetra, 2023). No further information was published on an increase to the inferred resource
estimate.
| 24 | Other
Relevant Data and Information |
Not used.
| South West Arkansas Project Pre-Feasibility Study | 18 Sept 23 |
| 25 | Interpretations
and Conclusions |
Standard Lithium
successfully executed a five-well exploration program that significantly improved the geologic description of the target Smackover Formation.
The program addressed the three key factors that determine the quality of the resource: the total volume of brine based on core and log
porosity data, the brine’s lithium concentration based on the analysis of multiple brine samples from the wells, and the productivity
of the formation based on the core permeability data collected. Both QP Brush and QP Williams were closely involved with all aspects
of the exploration program, including selecting the well locations; designing the coring, logging, and sampling programs; attending the
coring and sampling of the wells; and analyzing the resulting data. In the opinion of QP Brush and QP Williams, the resulting data and
analyses fully support the conclusion that the inferred and indicated resources present at the SWA Property are of sufficient quality
to justify pursuit of a lithium extraction project at the site.
| 25.2 | Process
Development Work |
Because continuous
start-to-finish DLE (without the use of evaporation ponds) is not yet commercially proven, test work becomes especially critical to reduce
process and scale-up risks. The test work needs to be conducted over a reasonable period of time and at a suitable scale-up factor. The
Demonstration Plant operation has achieved both these objectives. In addition, the equipment operated in the Demonstration Plant has
shown reliability in terms of having the required availabilities for stable process operation. The process control and chemical analysis
applied in the Demonstration Plant have provided a solid foundation for reliable results.
The LSS DLE process
has been run over many months, demonstrating consistency of results and its applicability for the SWA project. For further effective
optimization and applicability for the DFS, the LSS DLE process needs to be run on actual SWA brine for a long-term, continuous test.
The conversion
of a lithium chloride solution to a lithium hydroxide solution using electrolysis has been shown to be the process route with the least
process risk, mainly because it is based, to a large extent, on the commercially proven chlor-alkali process. The approach taken by Standard
Lithium to develop this process route has been appropriate for the PFS stage of the project. During the DFS, Standard Lithium should
focus on further reducing the process risk. This can be accomplished by longer testing and by larger scale testing.
| South West Arkansas Project Pre-Feasibility Study | 18 Sept 23 |
| 25.3 | SWA
Pre-Feasibility Study Summary |
The engineering
work to develop the flowsheet undertaken in support of this Pre-Feasibility Study is considered appropriate for the level of development
and the associated de-risking of the project. Although the flowsheet identifies a robust process, it is acknowledged that the design
can be further optimized to better integrate the various elements of the flowsheet to target higher lithium recovery and more efficient
conversion with reduced waste disposal requirements. To support this optimization, it is recommended that the engineering design work
continue to leverage the learnings from the Demonstration Plant, off-site equipment and process testing results and vendor engagement.
In the opinion of QP Frank Gay, the engineering definition and level of quoted equipment supports the CAPEX and OPEX basis which in turn
supports the conclusion that the SWA Project can reasonably be expected to result in economic extraction of lithium with robust, reliable,
and mostly proven, commercially available flowsheet elements.
The project risks
identified, and an assessment of their potential impacts are presented below.
| · | If
the brine production rate or lithium concentrations on which the PFS is based are unavailable
throughout the life of the project, the economics of the project could be impacted. Standard
Lithium has carried out additional well testing and reservoir modeling specific to the project
brine leases during the PFS to further prove the anticipated lithium values. This process
has identified lithium concentrations higher than those used as the basis for the PEA, resulting
in potential upside production. This in turn validates the PFS base case of 30,000 tonnes
of annual production of lithium hydroxide. As a result, downside economics associated with
lack of understanding of the resource is seen as a low risk. |
| · | Changes
to the key operating parameters of the DLE process on which the PFS is based could result
in higher OPEX and/or CAPEX costs due to additional purification and concentration equipment
requirements. To reduce this risk and optimize the process design, Standard Lithium continues
to undertake extended testing, technology selection, and process optimization at their El
Dorado, AR, Demonstration Plant. Based on this continued work, a reduction in DLE performance
for the commercial operations is seen as a low risk. |
| · | If
the electrochemical and associated lithium hydroxide conversion process does not perform
as expected, it could result in higher OPEX and/or CAPEX costs. The technology is based on
existing chlor-alkali industry technology and specific experience with lithium solutions,
and Standard Lithium has successfully conducted testing of electrochemical cells using Smackover
brines processed by the Demonstration Plant. Based on this experience, this is seen as a
low risk. However, continued testing is recommended in support of scale-up, process optimization,
and improved process understanding to provide inputs to engineering and further mitigate
the process risk. |
| South West Arkansas Project Pre-Feasibility Study | 18 Sept 23 |
| · | If
the market price of lithium hydroxide drops, project economics will be negatively affected.
Standard Lithium has commissioned two independent market studies during the PFS that both
showed continued, strong demand for lithium hydroxide throughout the project life. Based
on the results of these studies and the current lithium market, the lithium hydroxide price
used for the economic analysis is deemed to be conservative and any negative impact to project
economics is seen as a low risk. |
| · | Global
supply chain shortages and/or delays have been ongoing since the onset of the 2020 COVID-19
pandemic. These could negatively influence the project schedule and CAPEX. This is seen as
a medium risk. To mitigate this risk, it is recommended that the long lead items be identified
during the feasibility study phase and orders be executed in support of maintaining project
schedule. |
| · | Natural
disasters such as a tornado or earthquake in the project area could result in a loss of production.
The likelihood of these events is understood based on local meteorological and geological
data. The facilities will be designed to withstand the anticipated events based on their
likelihood, and this is not cited as a cause of loss of production by other operators in
the area. This is seen as a low risk. |
| · | If
an unknown infringement of an existing process patent occurs, this could result in licensing
claims which could affect the OPEX costs. Standard Lithium has a Joint Development Agreement
in place with Koch Technologies for the DLE and the remaining process units are open art
technologies, so this is seen as a low risk. |
| · | Construction
costs and/or schedule overruns could impact the CAPEX costs. To mitigate this risk, a 20%
contingency has been included in the current CAPEX and sensitivity analysis shows favorable
economics for a higher CAPEX cost. Standard Lithium will work with experienced EPC contractors
and issue lump sum turnkey contracts where possible, and the feasibility study will provide
increased cost confidence. This risk is inherent in any project and with the proper mitigations
is seen as a low risk. |
| · | Lithium
brine-lease-fee-in-lieu-of-royalty assessment has not yet been completed by the Arkansas
Oil and Gas Commission. This is an established process most recently completed for calcium
chloride and magnesium chloride. Dependent on the determined rates, this could overly impact
project economics. Based on Standard Lithium’s engagement with stakeholders in this
process, this is seen as a low risk. |
| South West Arkansas Project Pre-Feasibility Study | 18 Sept 23 |
| · | The
process for unitization of the leases into a production unit has not commenced. This is an
established AOGC process, that has been undertaken in the past for Lanxess, and TETRA, with
the most recent application by TETRA for their Evergreen Unit which was deferred due to insufficient
information. Given the learnings from this process and on-going engagement with AOGC, the
risk of delay to Standard Lithium is considered to be a moderate risk. It is recommended
that Standard Lithium commence this process as soon as practical to mitigate this risk. |
| · | Potential
geologic risks include unexpected reservoir heterogeneity, which could include: |
| o | The
presence of high permeability pathways between injection and production wells which could
reduce the displacement efficiency of the injected lean brine and lead to early breakthrough
of the injected lean brine; |
| o | Insufficient
productivity resulting from lower-than-expected formation permeability; |
| o | Discontinuity
of the porous formation resulting in a smaller brine volume accessible from the project wells;
and, |
| o | Unexpected
faulting resulting in barriers to flow. |
These
risks will be addressed in part during the DFS data gathering program and can also be addressed through adjustments to the injection
and production well configuration if these factors are encountered during the project development. One such adjustment would be to drill
additional injection and/or production wells to maintain the desired plant throughput.
There
is also the potential that an optimized project could include additional wells and facilities to achieve a higher production level, but
this is more of an opportunity than it is a risk.
It
should be noted that all reservoirs are heterogeneous, and that this report fully incorporates the observed heterogeneity in its analysis
and conclusions. Also, the Smackover Formation in the SWA Project area is similar to that underlying the successful brine recovery projects
immediately to the east of the Project area.
| South West Arkansas Project Pre-Feasibility Study | 18 Sept 23 |
The recommended
next steps for Standard Lithium to elevate the SWA Project to a higher level of resource classification and project definition are to:
| · | Further
develop the reservoir model in support of development of an optimized well plan and brine
production profile. (US$1 million) |
| · | Develop
and optimize the flowsheet using the Demonstration Plant with a target of lower lifecycle
cost. For example, review and optimize processes such that the reagent usage can be optimized
and solids waste generation from the overall process can be substantially reduced or eliminated. |
| · | Continue
optimization of the LSS DLE to improve the quality of the Raw LiCl by elimination of impurities,
including testing of new sorbents and adjustments to operating parameters. |
| · | Conduct
all additional necessary engineering and feasibility studies (i.e. FEED level engineering
definition) to integrate the project development findings into an updated resource classification
and DFS. (US$12 million) |
| · | Continue
testing of electrolytic conversion of Smackover brine to convert LiCl to LiOH in support
of development of engineering inputs for design. (US$0.5 million) |
| · | Undertake
a logistics study to assess road versus rail for supply of reagents and for export of products
during the next project phase. |
| · | Complete
any necessary process equipment vendor testing for lithium hydroxide concentration and evaporation/crystallization
to a battery-quality product. (US$0.4 million) |
| · | Identify
long lead items that impact project schedule and develop procurement packages and strategy
to facilitate potential opportunity for early purchasing in support of optimizing the project
execution schedule. |
| · | Engage
with AOGC to support definition of royalty for lithium production from brine in Arkansas
in support of detailed understanding of project economics. |
| · | Continue
to engage with the local electrical supplier Southwest Arkansas Electric Cooperative to continue
to work through the interconnection requirements and ensure timeliness of power availability
for the project. |
| · | The
project as it is currently envisaged does not trigger a NEPA process, however the NEPA process
would be triggered if federal funds are obtained for the project. It is recommended to pro-actively
assess NEPA requirements and initiate key activities to facilitate flexibility in project
financing. |
| South West Arkansas Project Pre-Feasibility Study | 18 Sept 23 |
| · | Drill
additional test wells (US$8.5 million) targeting the Upper, Middle, and Lower Smackover in
areas not tested by the 2018 and 2023 data gathering programs, such as in the areas of the
Cornelius 1 and Haberyan 1 wells, to provide: |
| o | Long
term production test information to estimate well rates, the number of wells needed, facility
rates, and the completion plans for those wells; |
| o | Information
regarding the potential extent of a Lower Smackover development target; and, |
| o | Information
regarding the benefit of well stimulation to well productivity. |
| · | Monitor
the test wells for salt precipitation, evaluate the potential effect of salt precipitation
on production operations, identify remediation options. |
| · | Conduct
long term production tests on one or more of the 2023 exploration program wells; decide on
scope of these tests based on the results of the new test wells. |
| · | Update
the geologic description. |
| · | Revise
and adjust the categories of the resource estimates and quantify the reserves in support
of the commercialization of the project. |
| · | Revise
the simulation model input geologic description and optimize the SWA Property development
plan, including offtake rate, well count, and well configuration. |
The authors recommend
Standard Lithium approaches accomplishing these tasks over a two-year period. The estimated cost of the recommended work is US$22.4 million.
| South West Arkansas Project Pre-Feasibility Study | 18 Sept 23 |
Alkin, R.H.
and Graves, R.W. (1969): Reynolds oolite of southern Arkansas; The American Association of Petroleum Geologists, Bulletin v. 53,
no. 9, p. 1909-1922.
APEX Geoscience, Ltd.,
2018. Geological Introduction and Maiden Inferred Resource Estimate for Standard Lithium, Ltd’s Smackover Lithium-Brine Property
in Arkansas, United States, prepared for Standard Lithium, Ltd., Calgary, Alberta, Canada, November 19.
APEX Geoscience, Ltd.,
2022. Apex, Maiden Inferred Bromine- and Lithium-Brine Resource Estimations for Tetra Technologies, Inc.’s Tetra Property
in Arkansas, United States.
Arkansas Code
(2016a): § 15-76-308. Formation of a Brine Unit; Title 15 – Natural Resources and Economic Development, Subtitle 6 –
Oil, Gas and Brine, Chapter 76 – Brine, Subchapter 3 – Brine Production, https://law.justia.com/codes/arkansas/2016/title-15/subtitle-6/chapter-76/subchapter-3/section-15-76-308/.
Arkansas Code
(2016b): § 15-76-309. Petition for formation of a brine production unit or a brine expansion unit; Title 15 – Natural
Resources and Economic Development, Subtitle 6 – Oil, Gas and Brine, Chapter 76 – Brine, Subchapter 3 – Brine Production,
https://law.justia.com/codes/arkansas/2016/title-15/subtitle-6/chapter-76/subchapter-3/section-15-76-309/.
Arkansas Code
(2016c): § 15-76-312. Unlawful drainage -- Unit inclusion or accounting; Title 15 – Natural Resources and Economic Development,
Subtitle 6 – Oil, Gas and Brine, Chapter 76 – Brine, Subchapter 3 – Brine Production, https://law.justia.com/codes/arkansas/2016/title-15/subtitle-6/chapter-76/subchapter-3/section-15-76-312/.
Arkansas Code
(2016d): § 15-76-314. Participation by owners and royalties; Title 15 – Natural Resources and Economic Development, Subtitle
6 – Oil, Gas and Brine, Chapter 76 – Brine, Subchapter 3 – Brine Production, https://law.justia.com/codes/arkansas/2016/title-15/subtitle-6/chapter-76/subchapter-3/section-15-76-314/.
Arkansas Code
(2016e): § 15-76-315. Valuation of brine; Title 15 – Natural Resources and Economic Development, Subtitle 6 – Oil,
Gas and Brine, Chapter 76 – Brine, Subchapter 3 – Brine Production, https://law.justia.com/codes/arkansas/2016/title-15/subtitle-6/chapter-76/subchapter-3/section-15-76-315/.
| South West Arkansas Project Pre-Feasibility Study | 18 Sept 23 |
Arkansas Code
(2016f): § 15-76-318. Drilling permits – fees; Title 15 – Natural Resources and Economic Development, Subtitle 6
– Oil, Gas and Brine, Chapter 76 – Brine, Subchapter 3 – Brine Production, https://law.justia.com/codes/arkansas/2016/title-15/subtitle-6/chapter-76/subchapter-3/section-15-76-318/.
Arkansas Geological
Survey (2018): Brine Resources; Arkansas Geological Survey, http://www.geology.ar.gov/energy/brine_resources.htm.
Arkansas Oil &
Gas Commission, 2021. Production by Field – 2021. Accessed May 4, 2023, https://www.aogc.state.ar.us/annual/HistBrine.aspx?HYr=2021.
Arkansas Oil &
Gas Commission, 2022a. South Arkansas Oil Production, 1970-2020. Accessed December 9, 2022, https://www.aogc.state.ar.us/annual/HistProduction.aspx?HYr=2020.
Arkansas Oil &
Gas Commission, 2022b. Brine Production-Injection Data, 2017-2022. Accessed May 4, 2023, https://www.aogc.state.ar.us/data/querybuild.aspx
and https://www.aogc.state.ar.us/welldata/production.aspx.
Bishop, 1967.
Petrology of Upper Smackover Limestone in North Haynesville Field, Claiborne Parish, Louisiana, American Association of Petroleum
Geologists Bulletin Vol. 52, No. 1
Bishop, W. F.
(1968): Petrology of upper Smackover limestone in North Haynesville field, Claiborne Parish, Louisiana. American Association of Petroleum
Geologists Bulletin, v. 52, p. 92–128.
Bishop, W. F.
(1971a): Geology of a Smackover stratigraphic trap. American Association of Petroleum Geologists Bulletin, v. 55, p. 51–63.
Bishop, W. F.
(1971b): Geology of upper member of Buckner Formation, Haynesville Field area, Claiborne Parish, Louisiana. American Association
of Petroleum Geologists Bulletin, v. 55, p. 566–580.
Bishop, W. F.
(1973): Late Jurassic contemporaneous faults in north Louisiana and south Arkansas. American Association of Petroleum Geologists
Bulletin, v. 57, p. 566–580.
Blondes, M.S.,
Gans, K.D., Engle, M.A., Kharaka, Y.K., Reidy, M.E., Saraswathula, V., Thordsen, J.J., Rowan, E.L., and Morrissey, E.A., 2018. U.S.
Geological Survey National Produced Waters Geochemical Database (ver. 2.3, January 2018): U.S. Geological Survey data release, https://doi.org/10.5066/F7J964W8.
Bradley, D.,
Munk, L., Jochens, H., Hynek, S. and Labay, K (2006): A Preliminary Deposit Model for Lithium Brines; USGS Open-File Report 2013–1006.
| South West Arkansas Project Pre-Feasibility Study | 18 Sept 23 |
Bradley, D.C.,
Stillings, L.L., Jaskulka, B.W., Munk, L. and McCauley, A.D. (2017): Lithium; In: Chapter K of Critical Mineral Resources of the
United States—Economic and Environmental Geology and Prospects for Future Supply, K.J. Schulz, J.H. DeYoung, Jr., R.R. Seal
II, and D.C. Bradley (Eds.), USGS Professional Paper 1802-K.
Budd, D. A.
and Loucks, R. G. (1981): Smackover and lower Buckner formations, south Texas. Depositional systems on a carbonate ramp. Bureau of
Economic Geology, The University of Texas at Austin, Report of Investigations.
Buffler, R.T.
(1991): Early evolution of the Gulf of Mexico basin; In: D. Goldthwaite, (ed.), An Introduction to Central Gulf Coast Geology, New
Orleans: New Orleans Geological Society, p. 1-15.
Buffler, R.T.,
Shaub, F.J., Huerta, R., Ibrahim, A.B.K. and Watkins, J.S. (1981): A model for the early evolution of the Gulf of Mexico; Oceanologica
Acta, No. SP, p 129-136.
Canadian Institute
of Mining, Metallurgy and Petroleum, 2003. “Best Practice Guidelines for Potash,”; https://mrmr.cim.org/en/best-practices/estimation-of-mineral-resources-mineral-reserves/
Canadian Institute
of Mining, Metallurgy and Petroleum, 2012. “CIM Best Practice Guidelines for Resource and Reserve Estimation for Lithium
Brines”; https://mrmr.cim.org/media/1041/best-practice-guidelines-for-reporting-of-lithium-brine-resources-and-reserves.pdf
Canadian Institute
of Mining, Metallurgy and Petroleum, 2014. “CIM Definition Standards for Mineral Resources & Mineral Reserves”;
https://mrmr.cim.org/media/1128/cim-definition-standards_2014.pdf
Canadian Institute
of Mining, Metallurgy and Petroleum, 2019. CIM Estimation of Mineral Resources and Mineral Reserves Best Practice Guidelines,
prepared by the Canadian Institute of Mining, Metallurgy, and Petroleum, CIM Mineral Resources & Mineral Reserve Committee,
Westmount, QC, Canada. https://mrmr.cim.org/media/1146/cim-mrmr-bp-guidelines_2019_may2022.pdf
Dickinson, K.A.
(1968); Upper Jurassic stratigraphy of some adjacent parts of Texas, Louisiana and Arkansas; U.S. Geol. Survey Prof. Paper, 594E.
Enverus, 2023.
Drilling Info, https://app.drillinginfo.com/production/#/default.
Harris, P. M.
and Dodman, C. A. (1987): Jurassic evaporites of the U.S. Gulf Coast: the Smackover-Buckner contact; Society of Economic Paleontologists
and Mineralogists, Depositional and Diagenetic Spectra of Evaporites (CW3), p. 174–192.
| South West Arkansas Project Pre-Feasibility Study | 18 Sept 23 |
Heydari, E.
and Baria, L. (2005): A microbial Smackover Formation and the dual reservoir–seal system at the Little Cedar Creek Field in
Conecuh County of Alabama; Gulf Coast Association of Geological Societies Transactions, v. 55, p. 294-320.
IHS S&P
Global, 2023. Well log data, https://my.ihs.com/Energy/Products
Kalbacher, K.,
and A. A. Sartin (1986): Diagenetic study of the Upper Member of the Smackover Formation (Upper Jurassic), Columbia County, Arkansas:
Gulf Coast Association of Geological Societies Transactions, v. 36, p. 191-199.
Kopaska-Merkel,
D.C., Mann, S.D. and Tew, B.H. (1992): Geological setting, petrophysical characteristics, and regional heterogeneity patterns of
the Smackover in southwest Alabama; Geological Survey of Alabama, Contract No. DE-FG22-89BC14425, 215 p.
Mancini, E.
A., Mink, R. M., Tew, B. H., and Bearden, B. L. (1990): Natural gas plays in Jurassic reservoirs of southwestern Alabama and the
Florida panhandle area; Gulf Coast Association of Geological Societies Transactions, v. 40, p. 513-519.
Mancini, E.A.,
Aharon, P., Goddard, D.A., Horn, M. and Barnaby, R. (2008): Basin analysis and petroleum system characterization and modelling, interior
salt basins, central and eastern Gulf of Mexico, Part 3: tectonic / depositional history, resource assessment; Adapted from Final
Report, issued June 30, 2008, for period May 1, 2003 to April 30, 2008, prepared for U.S. Department of Energy, for DOE
Award Number DE-FC26-03NT15395 and available at Texas A&M University (http://berg-hughes.tamu.edu/research/sedimentary-basin-analysis-studies).
Moldovanyi,
E.P. and L.M. Walter, 1992. Regional trends in water chemistry, Smackover Formation, southwest Arkansas: Geochemical and physical
controls; The American Association of Petroleum Geologists, Bulletin, v. 76, no. 6., p. 864-894.
Moore, C.H.
and Druckman (1981): Burial diagenesis and porosity evolution, Upper Jurassic Smackover, Arkansas and Louisiana; The American Association
of Petroleum Geologists, 1981, p. 597-628.
Moore, C. H.
(1984): The upper Smackover of the Gulf rim: depositional systems, diagenesis, porosity evolution and hydrocarbon production; In:
W. P. S. Ventress, D. G. Bebout, B. F. Perkins, and C. H. Moore (eds.), The Jurassic of the Gulf rim: Gulf Coast Section SEPM, 3rd
Annual Research Symposium, Program and Abstracts, p. 283–307.
NORAM, 2021.
Preliminary Economic Assessment of SW Arkansas Lithium Project, prepared for Standard Lithium, 25 November 2021.
| South West Arkansas Project Pre-Feasibility Study | 18 Sept 23 |
Saltwerx, 2021:
Saltwerx Secures 100,000-Acre Brine Prospect in Southern Arkansas, 1 July 2021, https://www.saltwerx.com/news/saltwerx-secures-100-000-acre-brine-prospect-in-southern-arkansas.
Salvador, A.
(1987): Late Triassic-Jurassic paleography and origin of Gulf of Mexico basin; AAPG Bulletin, v. 71, p. 419-451.
Salvador, A.
(1990): Triassic-Jurassic; In: Salvador, A., (ed.), The Geology of North America, v. J., The Gulf of Mexico Basin; Boulder, Geological
Society of America, p. 131–180.
Salvador, A.
(1991a): The Gulf of Mexico Basin: Decade of North American geology; v. DNAG, v. J: Boulder, Colorado, GSA, 568 p.
Salvador, A.
(1991b): Triassic-Jurassic; In: A. Salvador, (ed.), The Gulf of Mexico Basin, Boulder, Colorado, GSA, p. 131-180.
Standard Lithium
Ltd. (2018a): Standard Lithium to Acquire Lithium Brine Exploration and Production Rights; Standard Lithium Press Release, August 7,
2017, https://standardLithium.com/2017/08/02/standard-Lithium-acquire-Lithium-brine-exploration-production-rights/.
Standard Lithium
Ltd. (2018b): Standard Lithium Commences Resource Definition in Southern Arkansas; Standard Lithium Press Release, January 30,
2018, https://standardLithium.com/2018/01/30/standard-Lithium-commences-resource-definition-southern-arkansas/.
Tetra, 2022.
Tetra Technologies, Inc. Announces Maiden Inferred Resources Of 5.25 Million Tons Of Elemental Bromine and 234,000 Tons Of Lithium
Carbonate Equivalent, 21 September 2022, https://www.prnewswire.com/news-releases/tetra-technologies-inc-announces-maiden-inferred-resources-of-5-25-million-tons-of-elemental-bromine-and-234-000-tons-of-lithium-carbonate-equivalent-301630186.html.
Tetra, 2023.
Tetra Technologies, Inc. and Saltwerx, LLC Enter Into A Memorandum Of Understanding Regarding A Proposed Brine Production Unit
In The Smackover Formation, 26 June 2023, https://ir.tetratec.com/2023-06-26-TETRA-TECHNOLOGIES,-INC-AND-SALTWERX,-LLC-ENTER-INTO-A-MEMORANDUM-OF-UNDERSTANDING-REGARDING-A-PROPOSED-BRINE-PRODUCTION-UNIT-IN-THE-SMACKOVER-FORMATION
>.
TGS, 2023.
Well log and well status data, https://www.tgsr360.com
Troell, A. R.
and Robinson, J. D. (1987): Regional stratigraphy of the Smackover limestone (Jurassic) in south Arkansas and north Louisiana, and
the geology of Chalybeat Springs oil field. Gulf Coast Association of Geological Societies Transactions, v. 37, p. 225–262.
| South West Arkansas Project Pre-Feasibility Study | 18 Sept 23 |
Worley, 2019.
NI 43-101 Technical Report Preliminary Economic Assessment of Smackover Project, Document No.: 207036-00088-00-PM-REP-0002, prepared
for Standard Lithium, Saskatoon, Saskatchewan, Canada, August 1, 230p.
Zimmerman, R.
K. (1992): Fractured Smackover limestone in northeast Louisiana; Implications for hydrocarbon exploitation; AAPG Datapages/Archives,
GCAGS Transactions, v. 42, p. 401-412.
Note the following
pages are placeholders for QP Certificates.
I, Frank Gay, P. Eng., do hereby certify that:
| 1. | I am a Managing Technical Professional with
Hunt, Guillot, & Associates LLC, 8401 New Trails Drive, Suite 175, The Woodlands,
Texas 77381. |
| 2. | I graduated with a Bachelor of Science Degree
in Chemical Engineering from Massachusetts Institute of Technology, Cambridge Massachusetts
in 1979 and Master’s Degree in Chemical Engineering Practice from Massachusetts Institute
of Technology in 1979. |
| 3. | I am a registered Professional Engineer in
North Carolina. |
| 4. | I have practiced as a Professional Engineer
for 35 years in project management, engineering management, and general management in the
petrochemical and petroleum industries. |
| 5. | I have read the definition of “qualified
person” set out in the National Instrument 43-101 (“NI 43-101”) and certify
that, by reason of my education, affiliation with a professional association (as defined
in NI 43-101), and past relevant work experience, I fulfill the requirements to be a
“Qualified Person” for the purposes of NI 43-101. |
| 6. | I oversaw the preparation and am responsible
for Sections 1-6, 18-19, & 22-27 of the technical report titled “NI 43-101
Technical Report; South West Arkansas Project Pre-Feasibility Study; Lewisville, Lafayette
County AR”, with an effective date of August 8, 2023 (the “Technical Report”). |
| 7. | I visited the Demonstration Plant in El Dorado
in November, 2021, but I have not visited the South West Arkansas Property. |
| 8. | I am not aware of any scientific or technical
information with respect to the subject matter of the Technical Report that is not reflected
in the Technical Report, the omission to disclose which makes the Technical Report misleading. |
| 9. | I am independent of the Issuer as per NI 43-101
and successfully pass the independence requirements of the Guidance of Independence test
in item 1.5 of the Companion Policy to NI 43-101. I am not an employee, insider, director,
or partner of the Issuer and do not hold any securities or direct/indirect interests related
to the Issuer or the property and/or adjacent properties that is the subject of this Technical
Report. |
| 10. | I have read NI 43-101 and Form 43-101F1,
and the Technical Report has been prepared in compliance with that instrument and form. |
| 11. | I consent to the filing of the Technical
Report with any stock exchange and other regulatory authority and any publication by them
for regulatory purposes, including electronic publication in the public company files or
their websites. |
| /s/ Frank
Gay |

|
| Frank Gay, P. Eng., |
Effective Date: August 8, 2023
Signature Date: September 18, 2023
The Woodlands, Texas, United States
|
I, Marek Dworzanowski, EUR ING, CEng, do hereby certify that:
| 1. | I am an independent consulting metallurgical
engineer based at 975 Route du Plateau, Trejouls, 82110, France. |
| 2. | I graduated with a Bachelor of Science Degree
(with honours) in Mineral Processing from the University of Leeds, United Kingdom, in 1980. |
| 3. | I am a registered European Engineer and I
am a registered Chartered Engineerinthe United Kirgdom. |
| 4. | I have practiced metallurgical engineering
for 42 years, with 35 years as a registered Professional Engineer, in the global mining industry. |
| 5. | I am a Honorary Life Fellow of the Southern
African Institute of Mining and Metallurgy and I am a Fellow of the Institute of Materials,
Minerals and Mining. |
| 6. | I have read the definition of "qualified
person" set out in the National Instrument 43-101 ("NI 43-101") and certify
that, by reason of my education, affiliation with a professional association (as defined
in NI 43-101), and past relevant work experience, I fulfill the requirements to be a "Qualified
Person" for the purposes of NI 43-101. |
| 7. | I oversaw the preparation and am responsible
for Sections 1, 13, 17, 18, 21, 22, 25 and 26 of the technical report titled "NI 43-101Technical
Report; South West Arkansas Project Pre-Feasibility Study; Lewisville, Lafayette County AR",
with an effective date of August 8, 2023 (the "Technical Report"). |
| 8. | I visited the Demonstration Plant in El Dorado
during 14 & 15 November, 2022, but I have not visited the South West Arkansas Property. |
| 9. | I am not aware of any scientific or technical
information with respect to the subject matter of the Technical Report that is not reflected
in the Technical Report, the omission to disclose which makes the Technical Report misleading. |
| 10. | I am independent of the Issuer as per NI
43-101 and successfully pass the independence requirements of the Guidance of Independence
test in item 1.5 of the Companion Policy to NI 43-101. I am not an employee, insider, director,
or partner of the Issuer and do not hold any securities or direct/indirect interests related
to the Issuer or the property and/or adjacent properties that is the subject of this Technical
Report. |
| 11. | I have read NI 43-101 and Form 43-101F1,
and the Technical Report has been prepared in compliance with that instrument and form. |
| 12. | I consent to the filing of the Technical
Report with any stock exchange and other regulatory authority and any publication by them
for regulatory purposes, including electronic publication in the public company files or
their websites. |
| /s/
Marek Dworzanowski |
|
| Marek Dworzanowski, EUR ING, CEng |
|
| |
|
| Effective Date: August 8, 2023 |
|
| Signature Date: September 18, 2023 |
|
| Trejouls, France |
|
I, Randal M. Brush, PE, as a co-author of the
technical report titled NI 43-101 Technical Report – South West Arkansas Project – Pre-Feasibility Study (the “Technical
Report”), effective date August 8, 2023, do hereby certify that:
| ● | I am
currently employed as President of William M. Cobb & Associates, Inc. with
an office at 12770 Coit Road, Suite 907, Dallas, Texas, 75251. |
| ● | I
hold a Master of Science degree in petroleum engineering from Stanford University and a Bachelor
of Science degree in chemical engineering from Rice University. |
| ● | I
am a member in good standing of the Society of Petroleum Engineers, a constituent organization
within the AIME, the American Institute of Mining, Metallurgical and Petroleum Engineers
(Member # 0515460). I am also a member of the Society of Petroleum Evaluation Engineers. |
| ● | I am
and have been a professional engineer, registered in Texas (License #85165), since 1999. |
| ● | As
a professional engineer, I have over 42 years of experience in evaluating the injection
and production of water, brines, and other fluids into and out of porous formations like
the Smackover. This includes 10 years of evaluating brine recovery at a nearby Smackover
field. These tasks have included the following: |
| ○ | Using engineering analysis, mathematical
modeling, and appropriate data collection and analysis techniques to evaluate the injection
of gases, water, brine, and steam into underground geologic formations, and the recovery
of oil, gas, water, and brine from those formations. |
| ○ | Specializing in reservoir evaluation,
management, and simulation studies to estimate hydrocarbon (crude oil, condensate, and natural
gas) and non-hydrocarbon (e.g., bromine, lithium, CO2, and helium) reserves and
inventories; provide ultimate recovery estimates by predicting reservoir performance under
alternate development plans; and evaluate the performance of gas and CO2 storage
reservoirs in response to internal and external operational factors. |
| ● | As
a result of my education, qualifications, affiliation with a professional association, and
experience, I fulfil the requirements to be a “Qualified Person” as defined
in National Instrument 43-101 (“NI 43-101”). |
| ● | I am
independent of Standard Lithium Ltd. applying all the tests in Section 1.5 of the Companion
Policy to NI 43-101. |
| ● | I am
responsible for Sections 7–12, 14, and 16 of this Technical Report. |
| ● | I have
not had prior involvement with the property that is the subject of the Technical Report. |
| ● | Under
my supervision from William M. Cobb & Associates, Inc. was Tor Meling, reservoir
engineer. |
| ● | My
most recent personal inspection of the Property was on July 24, 2023. |
| ● | I
have read NI 43-101, Form 43-101F1, and the Technical Report for which I am responsible,
and the document has been prepared in compliance with NI 43-101. |
| ● | As
of the date of this certificate, to the best of my knowledge, information, and belief, this
Technical Report contains all of the scientific and technical information that is required
to be disclosed to make the Technical Report not misleading. |
| ● | I
consent to the filing of this Technical Report with any stock exchange, provided that the
Technical Report complies with the framework of that regulatory exchange, and other regulatory
authority or publication by them for regulatory purposes, including electronic publication
in the public company files on their websites accessible by the public. |
Signed in Dallas, Texas, September 18th,
2023
| /s/
Randal M. Brush |
 |
Randal
M. Brush, PE
William
M. Cobb & Associates, Inc.
|
I, Robert E. Williams, Jr., PG, CPG, as
a co-author of the technical report titled NI 43-101 Technical Report – South West Arkansas Project – Pre-Feasibility
Study (the “Technical Report”), effective date August 8, 2023, do hereby certify that:
| ● | I am currently employed as a Senior
Geologist of William M. Cobb & Associates 12770 Coit Road Suite 907, Dallas
Texas, 75251. |
| ● | I am a graduate of Oklahoma State University and earned a degree
Bachelor of Science in Geology in 1991. |
| ● | I am a professional geologist registered with Texas Board of
Professional Geoscientists #3964, awarded August 31, 2003. |
| ● | I am a member in good standing of
the American Institute of Professional Geologists (AIPG) Certification #12158, awarded January 9,
2023. |
| ● | As a Senior Geologist with over
three decades of experience in the petroleum and mineral industry, I have worked extensively
across various regions in North and South America. Notably, I have dedicated more than
10 years to the Smackover formation, conducting projects spanning from Alabama to Texas.
Throughout my career, my role has involved a diverse range of responsibilities, prominently
focused on the detailed mapping of geologic subsurface attributes. This mapping process has
played a fundamental role in evaluating reservoir volumetrics and accurate reserve estimates. |
| ● | As
a result of my education, qualifications, affiliation with a professional association, and
experience, I fulfil the requirements to be a “Qualified Person” as defined
in National Instrument 43-101 (“NI 43-101”). |
| ● | I am independent of Standard Lithium applying all the tests
in Section 1.5 of the Companion Policy to NI 43-101. |
| ● | I am responsible for Sections
7–12, 14, and 16 of this Technical Report. |
| ● | I have had no prior involvement with the property that is the
subject of the Technical Report. |
| ● | Under my supervision from William M. Cobb & Associates, Inc.
was Don Bailey, geologist. |
| ● | My most recent personal inspection of the Property was on June 1,
2023. |
| ● | I have read NI 43-101 and Form 43-101
and the Technical Report for which I am responsible, and the document has been prepared in
compliance with NI 43-101. |
| ● | As of the date of this certificate,
to the best of my knowledge, information, and belief, this Technical Report contains all
of the scientific and technical information that is required to be disclosed to make
the Technical Report not misleading. |
| ● | I consent to the filing of this
Technical Report with any stock exchange, provided that the Technical Report complies with
the framework of that regulatory exchange, and other regulatory authority or publication
by them for regulatory purposes, including electronic publication in the public company files
on their websites accessible by the public. |
Signed in Dallas, Texas, September 18th,
2023.
| /s/
Robert E. Williams, Jr. |
 |
Robert
E. Williams, Jr., PG, CPG
William
M. Cobb & Associates, Inc.
|
I, Caleb Mutschler, P. Eng., do hereby certify that:
| 1. | I am a Managing Technical Professional with Hunt, Guillot, & Associates
LLC, 8401 New Trails Drive, Suite 175, The Woodlands, Texas 77381. |
| 2. | I graduated with a Bachelor of Science Degree in Engineering with a Chemical Concentration
from Calvin College, Grand Rapids, Michigan in 2011. |
| 3. | I am a registered Professional Engineer in Texas, Louisiana, and Arkansas. |
| 4. | I have practiced as a Professional Engineer for 7 years in the oil refining, chemicals, and
midstream oil and gas industries. |
| 5. | I have read the definition of "qualified person" set out in the National Instrument
43-101 ("NI 43-101") and certify that, by reason of my education, affiliation with a professional association (as
defined in NI 43-101), and past relevant work experience, I fulfill the requirements to be a "Qualified Person"
for the purposes of NI 43-101. |
| 6. | I oversaw the preparation and am responsible for Sections 17-17.3 & 17.5 of the technical
report titled "NI 43-101 Technical Report; South West Arkansas Project Pre-Feasibility Study; Lewisville, Lafayette County
AR", with an effective date of August 8, 2023 (the "Technical Report"). |
| 7. | I visited the Demonstration Plant in El Dorado in October, 2022, to observe the test facilities
but have not visited the South West Arkansas Project site. |
| 8. | I am not aware of any scientific or technical information with respect to the subject matter
of the Technical Report that is not reflected in the Technical Report, the omission to disclose which makes the Technical
Report misleading. |
| 9. | I am independent of the Issuer as per NI 43-101 and successfully pass the independence requirements
of the Guidance of Independence test in item 1.5 of the Companion Policy to NI 43-101. I am not an employee, insider, director,
or partner of the Issuer and do not hold any securities or direct/indirect interests related to the Issuer or the property
and/or adjacent properties that is the subject of this Technical Report. |
| 10. | I have read NI 43-101 and Form 43-101F1, and the Technical Report has been prepared in compliance
with that instrument and form. |
| 11. | I consent to the filing of the Technical Report with any stock exchange and other regulatory
authority and any publication by them for regulatory purposes, including electronic publication in the public company files
or their websites. |
| /s/
Caleb Mutschler |
 |
Caleb Mutschler, P. Eng.,
Effective Date: August 8, 2023
Signature Date: September 18, 2023
The Woodlands, Texas, United States
|
I, Dutch Johnson, P. Eng., do hereby certify
that:
| 12. | I am a Directing Technical Professional with
Hunt, Guillot, & Associates LLC, 400 Texas Street, Third Floor, Suite 300,
Shreveport, Louisiana 71101. |
| 13. | I graduated with a Bachelor of Science Degree
in Mechanical Engineering from Louisiana Tech University, Ruston, Louisiana in 2003. |
| 14. | I am a registered Professional Engineer in
Louisiana, Texas, and Arkansas. |
| 15. | I have practiced as a Professional Engineer
for 19 years in various industries. |
| 16. | I have read the definition of “qualified
person” set out in the National Instrument 43-101 (“NI 43-101”) and certify
that, by reason of my education, affiliation with a professional association (as defined
in NI 43-101), and past relevant work experience, I fulfill the requirements to be a
“Qualified Person” for the purposes of NI 43-101. |
| 17. | I oversaw the preparation and am responsible
for Section 17.4 of the technical report titled “NI 43-101 Technical Report; South
West Arkansas Project Pre-Feasibility Study; Lewisville, Lafayette County AR”, with
an effective date of August 8, 2023 (the “Technical Report”). |
| 18. | I have not visited the South West Arkansas
Property. |
| 19. | I am not aware of any scientific or technical
information with respect to the subject matter of the Technical Report that is not reflected
in the Technical Report, the omission to disclose which makes the Technical Report misleading. |
| 20. | I am independent of the Issuer as per NI
43-101 and successfully pass the independence requirements of the Guidance of Independence
test in item 1.5 of the Companion Policy to NI 43-101. I am not an employee, insider, director,
or partner of the Issuer and do not hold any securities or direct/indirect interests related
to the Issuer or the property and/or adjacent properties that is the subject of this Technical
Report. |
| 21. | I have read NI 43-101 and Form 43-101F1,
and the Technical Report has been prepared in compliance with that instrument and form. |
| 22. | I consent to the filing of the Technical
Report with any stock exchange and other regulatory authority and any publication by them
for regulatory purposes, including electronic publication in the public company files or
their websites. |
| /s/
Dutch Johnson |
 |
Dutch
Johnson, P. Eng.,
Effective
Date: August 8, 2023
Signature Date: September 18, 2023
Shreveport, Louisiana, United
States
|

I, Charles Daniel Campbell,
P. Eng., do hereby certify that:
| 1. | I retired as Senior Managing Consultant on June 30, 2023, from Alliance
Technical Group, LLC, 219 Brown Lane, Bryant, Arkansas 72022. |
| 2. | Alliance Technical Group, LLC has contractually retained my technical and engineering services
post-retirement. |
| 3. | I graduated with a Bachelor of Science Degree in Petroleum Engineering from Louisiana Tech
University, Ruston, Louisiana in 1983. |
| 4. | I am a registered Professional Engineer in Arkansas. |
| 5. | I have practiced as a Professional Engineer for 35 years in project management, engineering
management, and general management in the environmental and petroleum industries. |
| 6. | I have read the definition of "qualified person" set out in the National Instrument
43-101 ("NI 43-101") and certify that, by reason of my education, affiliation with a professional association (as
defined in NI 43-101), and past relevant work experience, I fulfill the requirements to be a "Qualified Person"
for the purposes of NI 43-101. |
| 7. | I oversaw the preparation and am responsible for Section 20 of the technical report titled
"NI 43-101 Technical Report; South West Arkansas Project Pre-Feasibility Study; Lewisville, Lafayette County AR",
with an effective date of September 18, 2023 (the "Technical Report 09/2023"). |
| 8. | I visited the Demonstration Plant in El Dorado, Arkansas in February 2022, and the South West
Arkansas Property in May 2023. |
| 9. | I am not aware of any scientific or technical information with respect to the subject matter
of the Technical Report 09/2023 that is not reflected in the Technical Report 09/2023, the omission to disclose which makes
the Technical Report 09/2023 misleading. |
| 10. | I am independent of the Issuer as per NI 43-101 and successfully pass the independence requirements
of the Guidance of Independence test in item 1.5 of the Companion Policy to NI 43-101. I am not an employee, insider, director,
or partner of the Issuer and do not hold any securities or direct/indirect interests related to the Issuer or the property
and/or adjacent properties that is the subject of this Technical Report. |
| 11. | I have read NI 43-101 and Form 43-101F1, and the Technical Report has been prepared in compliance
with that instrument and form. |
| 12. | I consent to the filing of the Technical Report with any stock exchange and other regulatory
authority and any publication by them for regulatory purposes, including electronic publication in the public company files
or their websites. |
| /s/
Charles Daniel Campbell |
 |
Charles
Daniel Campbell, P. Eng.,
Effective
Date: August 8, 2023
Signature Date: September 18, 2023
Bryant, Arkansas, United States
|
CORPORATE
OFFICE
255 Grant St. SE, Suite 600
Decatur, AL 35601
256.351.0121
www.alliancetechnicalgroup.com
Exhibit 99.3

Caleb
Mutschler
Professional
Engineer
8401
New Trails Drive, Suite 175
The
Woodlands, Texas 77381
CONSENT
of QUALIFIED PERSON
I,
Caleb Mutschler,
consent to the public filing of the technical report
titled South West
Arkansas Project Pre-Feasibility
Study and dated 18th September 2023 (the "Technical
Report 09/2023")
by Standard Lithium Ltd and any extracts from or a summary
of the Technical Report 09/2023.
I
ce11ify that I have read the press release dated 8th August 2023
issued by Standard Lithium Ltd, (the
"Disclosure") in which the findings of Technical Report 09/2023
are disclosed. The Disclosure
fairly and accurately represents the information in the Sections of the Technical Report 09/2023
for which I am responsible.
Dated
18th September 2023.

| Signature of Caleb Mutschler, Professional Engineer |
|
Caleb Mutschler, Professional
Engineer

Ruston,LA
I Shreveport,LA
I BatonRouge,
LA I Lake Charles,LA
Houston,TX
I Fort Worth,TX
I Midland,TX
I El Dorado,
AR I Blnningharn,AL
Delivering on
commitments. 8111/dlng long-term relationships.
Exhibit 99.4

CONSENT of QUALIFIED PERSON
I, Charles Daniel
Campbell, P. E., consent to the public filing of the technical report titled South West Arkansas Project Pre-Feasibility Study and dated
18th September 2023 (the 'Technical Report 09/2023")
by Standard Lithium Ltd and any extracts from or a summary of the Technical Report 09/2023.
I certify that
I have read the press release dated 8th August 2023
issued by Standard Lithium Ltd, (the "Disclosure") in which the findings of Technical Report 09/2023 are disclosed.
The Disclosure fairly and accurately represent the information in the Sections of
the Technical Report 09/2023 for which I am responsible.
|
Dated this 18th September 2023.
Charles Darnel Campbell, P. E. |
 |
|
CORPORATE OFFICE
255 Grant St SE, Suite 600
Decatur, AL 35601
256.351.0121
www.alliancetechnicalgroup.com |
 |
Exhibit 99.5

Dutch
Johnson
Professional Engineer
400
Texas Street, Third Floor, Suite 300
Shreveport, Louisiana 71101
CONSENT
of QUALIFIED PERSON
I,
Dutch Johnson, consent to the public filing of the technical report titled South West Arkansas Project Pre-Feasibility Study and dated
18th September 2023 (the “Technical Report 09/2023”)
by Standard Lithium Ltd and any extracts from or a summary of the Technical Report 09/2023.
I
certify that I have read the press release dated 8th August 2023 issued by Standard Lithium Ltd, (the "Disclosure")
in which the findings of Technical Report 09/2023 are disclosed. The Disclosure fairly and accurately represents the information in the
Sections of the Technical Report 09/2023 for which I am responsible.
Dated
18th September 2023.

| Signature of Dutch Johnson, Professional Engineer |
|
Dutch
Johnson, Professional Engineer

Exhibit 99.6

Frank
Gay
Professional
Engineer
8401
New Trails Drive, Suite 175
The
Woodlands, Texas 77381
CONSENT
of QUALIFIED PERSON
I,
Frank Gay, consent to the public filing of the technical report titled South West Arkansas Project Pre-Feasibility Study and dated 18th
September 2023 (the “Technical Report 09/2023”) by Standard Lithium Ltd and any extracts
from or a summary of the Technical Report 09/2023.
I
certify that I have read the press release dated 8th August 2023 issued by Standard Lithium Ltd, (the "Disclosure")
in which the findings of Technical Report 09/2023 are disclosed. The Disclosure fairly and accurately represents the information in the
Sections of the Technical Report 09/2023 for which I am responsible.
Dated
18th September 2023.
 |
 |
Signature of Frank Gay, Professional Engineer
Frank Gay, Professional Engineer
|

Exhibit 99.7
Marek
Dworzanowski
Independent
Consulting Metallurgical Engineer
975
Route du Plateau, Trejouls, 82110, France
CONSENT
of QUALIFIED PERSON
I, Marek Dworzanowski,
consent to the public filing of the technical report titled South West Arkansas Project Pre-Feasibility Study and dated 18th
September 2023 (the “Technical Report 09/2023”) by Standard Lithium Ltd and any extracts
from or a summary of the Technical Report 09/2023.
I certify that I have
read the press release dated 8th August 2023 issued by Standard Lithium Ltd, (the "Disclosure") in which the findings
of Technical Report 09/2023 are disclosed. The Disclosure fairly and accurately represent the information in the Sections of the Technical
Report 09/2023 for which I am responsible.
Dated this 18th
September 2023.

Signature of Qualified
Person
MAREK DWORZANOWSKI
Name of Qualified Person
Exhibit 99.8
William
M. Cobb & Associates, Inc.
Worldwide
Petroleum Consultants
| 12770 Coit Road, Suite 907 |
(972) 385-0354 |
| Dallas, Texas 75251 |
Fax: (972) 788-5165 |
CONSENT
of QUALIFIED PERSON
I, Randal M. Brush,
consent to the public filing of the technical report titled South West Arkansas Project Pre-Feasibility Study and dated 18th
September 2023 (the “Technical Report 09/2023”) by Standard Lithium Ltd and any extracts
from or a summary of the Technical Report 09/2023.
I certify that I have
read the press release dated 8th August 2023 issued by Standard Lithium Ltd, (the "Disclosure") in which the findings
of Technical Report 09/2023 are disclosed. The Disclosure fairly and accurately represent the information in the Sections of the Technical
Report 09/2023 for which I am responsible.
Dated this 18th
September 2023.
 |
 |
|
Signature of Qualified Person
Randal M Brush, PE
Name of Qualified Person
|
|
Exhibit 99.9
William
M. Cobb & Associates, Inc.
Worldwide
Petroleum Consultants
| 12770 Coit Road, Suite 907 |
(972) 385-0354 |
| Dallas, Texas 75251 |
Fax: (972) 788-5165 |
CONSENT
of QUALIFIED PERSON
I, Robert E. Williams,
Jr., consent to the public filing of the technical report titled South West Arkansas Project Pre-Feasibility Study and dated 18th
September 2023 (the “Technical Report 09/2023”) by Standard Lithium Ltd and any extracts
from or a summary of the Technical Report 09/2023.
I certify that I have
read the press release dated 8th August 2023 issued by Standard Lithium Ltd, (the "Disclosure") in which the findings
of Technical Report 09/2023 are disclosed. The Disclosure fairly and accurately represent the information in the Sections of the Technical
Report 09/2023 for which I am responsible.
Dated this 18th
September 2023.
 |
 |
|
Signature
of Qualified Person
Robert
E. Williams, Jr., PG, CPG
Name of Qualified Person
|
|
Standard Lithium (AMEX:SLI)
Historical Stock Chart
From Apr 2024 to May 2024

Standard Lithium (AMEX:SLI)
Historical Stock Chart
From May 2023 to May 2024
