Three ETFs For An Iranian Crisis - ETF News And Commentary
February 15 2012 - 6:01AM
Zacks
Although the economy may be rebounding, some significant risks
to global growth remain. Beyond a debt crisis, arguably one of the
biggest stems from ultra-high oil prices which could be brought on
by more tensions in the Middle East, specifically from Iran. The
Islamic Republic, which is boxed in by the U.S. and its allies on
multiple sides, appears unwilling to back down from its development
of nuclear materials, despite the protests from many in the
West.
Sanctions and boycotts of Iran’s main export, crude oil, have
had little impact in getting Iran to change its course and now some
fear that more drastic measures may be taken in order to stop Iran
from joining the club of nuclear powers. In fact, many analysts are
predicting that Israel could strike at Iran’s nuclear facilities in
order to prevent the regime from developing the capabilities to
utilize an atomic weapon. If this happens, all bets are off as Iran
could lash out and attempt to disrupt vital oil routes that are at
the country’s doorstep in the Gulf, potentially throwing a wrench
into the global economic recovery (see Inside The Forgotten Energy
ETFs).
Given these rising tensions, some investors may want to position
their portfolios accordingly or at least be aware of some possible
winners if events with the country take a turn for the worse. With
this in mind, we have highlighted three ETFs that could make for
solid choices should the crisis with Iran reach a fevered
pitch:
United States Brent Oil Fund (BNO)
Iran is currently one of the top five producers of oil and the
third biggest exporter of the crucial commodity on the world stage.
Beyond the key production from Iran, the country has threatened to
close off the Strait of Hormuz if attacked, potentially crippling
the global oil trade in the process. That is because nearly 20% of
the world’s oil goes through the narrow pass, with fuel from many
of the key oil producing Gulf nations traversing through this zone.
In fact, by some estimates, close to 17 million barrels per day
travels the Strait over every 24 hour period, or nearly the
equivalent that is used by the United States on a daily basis.
If Iran’s massive oil production is bottled up thanks to
embargos, and if the country retaliates by shutting down the
Strait, oil prices will likely skyrocket in the process. While the
ability of Iran to hold onto the zone for an extended period of
time is certainly in question, any sort of delay in the flow of oil
from this region could boost prices around the world. If this
happens, a variety of oil-based ETFs will likely be huge winners
but none as much as BNO (see Forget WTI, Play Crude With This Oil
ETF).
This fund could be the big winner thanks to its focus on Brent
oil futures as opposed to USO’s focus on WTI crude futures. WTI is
more of a benchmark for American prices while BNO and Brent serve
as a similar index for Europe and the Near East instead. Since
Western Hemisphere production will not be impacted by an Iranian
event, BNO is definitely the way to go for those seeking to make an
oil play related to tensions in the region (read Time To Consider
The Small Cap Oil ETF).
S&P Oil & Gas Exploration & Production ETF
(XOP)
For investors who believe that there is going to be a bull
market in oil thanks to the reasons outlined above, a closer look
at the exploration and production sector could be warranted. If the
worst happens in the Middle East it will only further spur
investors to develop new fuel sources in friendlier and more stable
nations, boosting demand for exploration and production equipment
and services. This could turn out to be especially good news over
the long term for those in the exploration side of the business as
finding new fields will be of utmost importance although ways to
increase production immediately will also be vital to the global
economy, suggesting the broad sector will benefit. While there are
currently three ETFs in the sector—IEO, PXE, and XOP—we have chosen
to focus on XOP for this article as the fund is by far the most
liquid and widely held with over one billion in total AUM (read A
Closer Look At The Canadian Energy Income ETF).
The SPDR product tracks an index of all oil and gas companies
that are in the S&P Total Markets Index, using a modified equal
weight method to achieve exposure. This produces a fund of about 76
holdings in total with a gross expense ratio of a pretty low 35
basis points. Production firms make up about 75% of the total
basket although refining & marketing (15.3%), and integrated
oil & gas firms (8.5%) also receive decent weightings as well.
In terms of individual holdings, Cobalt International
Energy (CIE) takes the top spot, but it is closely trailed
by Western Refining (WNR), Hollyfrontier
(FTO), and CVR Energy (CVI)
Dow Jones U.S Aerospace & Defense Index Fund
(ITA)
While there are two other quality options in the defense
space—PPA and XAR—many investors focus in on ITA for its higher
levels of liquidity and AUM. As a result, we will focus on this
iShares fund for this article, although either of the other two
funds in the space could provide similar exposure. In fact, all
three could see increased interest if tensions continue to ratchet
up with Iran and more military spending seems to be on the horizon.
The prospect of increased purchases by a variety of governments
could help to reverse the trend that many had built into the prices
in some of these securities, potentially giving assets in this
industry a nice pop should Iranian worries continue (read Three
Industrial ETFs For A Manufacturing Revival).
The iShares fund tracks the Dow Jones U.S. Select Aerospace
& Defense Index which consists of about 34 securities from
across the broad industry. Currently, the product is tilted
towards aerospace firms although pure defense companies comprise
nearly 42% of the assets as well. In terms of individual holdings,
United Technologies (UTX) takes the top spot and
is closely followed by Boeing (BA) although seven
other firms make up at least 4% of the total assets in ITA. The
product charges investors 47 basis points a year in fees but it
does pay out a decent 1.1% 30-Day SEC Yield.
Want the latest recommendations from Zacks Investment Research?
Today, you can download 7 Best Stocks for the Next 30
Days. Click to get this free report >>
Disclosure: Author is long ITA
BOEING CO (BA): Free Stock Analysis Report
COBALT INTL EGY (CIE): Free Stock Analysis Report
UTD TECHS CORP (UTX): Free Stock Analysis Report
To read this article on Zacks.com click here.
Zacks Investment Research
Want the latest recommendations from Zacks Investment Research?
Today, you can download 7 Best Stocks for the Next 30 Days. Click
to get this free report
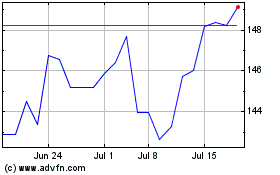
SPDR S&P Oil and Gas Exp... (AMEX:XOP)
Historical Stock Chart
From Oct 2024 to Nov 2024

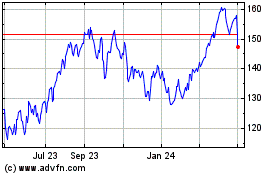
SPDR S&P Oil and Gas Exp... (AMEX:XOP)
Historical Stock Chart
From Nov 2023 to Nov 2024
