UNITED STATES
SECURITIES AND EXCHANGE COMMISSION
Washington, D.C. 20549
FORM 6-K
REPORT OF FOREIGN PRIVATE ISSUER
PURSUANT TO RULE 13a-16 OR 15d-16
OF THE SECURITIES EXCHANGE ACT OF 1934
For the month of February 2024
Commission File Number: 001-41225
VIZSLA SILVER CORP.
(Registrant)
Suite 1723, 595 Burrard Street
Vancouver, British Columbia V7X 1J1 Canada
(Address of Principal Executive Offices)
Indicate by check mark whether the Registrant files or will file annual reports under cover of Form 20-F or Form 40-F.
Form 20-F ☐ Form 40-F ☒
Indicate by check mark if the Registrant is submitting the Form 6-K in paper as permitted by Regulation S-T Rule 101(b)(1): ☐
Indicate by check mark if the Registrant is submitting the Form 6-K in paper as permitted by Regulation S-T Rule 101(b)(7): ☐
SIGNATURES
Pursuant to the requirements of the Securities Exchange Act of 1934, the registrant has duly caused this report to be signed on its behalf by the undersigned, thereunto duly authorized.
| |
VIZSLA SILVER CORP. |
| |
(Registrant) |
| |
|
|
| Date: February 20, 2024 |
By |
/s/ Michael Konnert |
| |
|
Michael Konnert |
| |
|
Chief Executive Officer |
EXHIBIT INDEX

Technical Report
On The
Updated Mineral Resource Estimate for the
Panuco Ag-Au-Pb-Zn Project, Sinaloa State,
Mexico
NAD83 UTM Zone 13, 404200 m E; 2588000 m N
LATITUDE 23° 25' N, LONGITUDE 105° 56' W
Prepared for:
Vizsla Silver Corp.
595 Burrard Street, Suite 1723
Vancouver, B.C., Canada, V7X 1J1
Report Date: February 12, 2024
Effective Date: September 1, 2023
| Qualified Persons |
Company |
| Allan Armitage, Ph. D., P. Geo., |
SGS Geological Services ("SGS") |
| Ben Eggers, B.Sc.(Hons), MAIG, P.Geo. |
SGS Geological Services ("SGS") |
| Peter Mehrfert, P.Eng. |
Ausenco Engineering Canada ULC ("Ausenco") |
| |
|
| SGS Project # 20000-01 |
|

| Technical Report – Updated Mineral Resource Estimate - Panuco Ag-Au-Pb-Zn Project, Mexico |
Page i |
| |
|
| TABLE OF CONTENTS |
PAGE |
| TABLE OF CONTENTS |
i |
| LIST OF FIGURES |
iii |
| LIST OF TABLES |
v |
| 1 SUMMARY |
7 |
| 1.0 Property Description, Location, Access, and Physiography |
7 |
| 1.1 History of Exploration, Drilling |
8 |
| 1.2 Geology and Mineralization |
10 |
| 1.3 Mineral Processing, Metallurgical Testing and Recovery Methods |
11 |
| 1.4 Mineral Resource Estimate |
12 |
| 1.4.1 Panuco Project Updated Mineral Resource Estimate Notes: |
14 |
| 1.5 Recommendations |
15 |
| 2 INTRODUCTION |
17 |
| 2.1 Sources of Information |
17 |
| 2.2 Site Visit |
18 |
| 2.2.1 2023 Site Visits |
18 |
| 2.3 Units of Measure |
19 |
| 2.4 Effective Date |
19 |
| 2.5 Units and Abbreviations |
19 |
| 3 Reliance on Other Experts |
21 |
| 4 PROPERTY DESCRIPTION AND LOCATION |
22 |
| 4.1 Location |
22 |
| 4.2 Land Tenure and Mining Concessions |
22 |
| 4.3 Underlying Agreements |
27 |
| 4.3.1 Canam Alpine Ventures Ltd. |
27 |
| 4.3.2 Silverstone Resources S.A. de C.V. |
27 |
| 4.3.3 Minera Rio Panuco S.A. de C.V. |
27 |
| 4.3.4 Strategic Investment in Prismo Metals |
28 |
| 4.3.5 Royalty Spin Out |
28 |
| 4.4 Surface Rights |
28 |
| 4.4.1 Canam and Ejido Panuco |
29 |
| 4.4.2 Silverstone Resources S.A. de C.V., Canam, and Ejido Platanar de los Ontiveros |
29 |
| 4.4.3 Canam and Comunidad Copala |
29 |
| 4.4.4 Canam and El Habal Ejido |
30 |
| 4.4.5 Short-Term Ejido Agreements |
30 |
| 4.5 Permits |
30 |
| 4.6 Environmental Considerations |
30 |
| 4.7 Other Relevant Factors |
31 |
| 5 ACCESSIBILITY, CLIMATE, LOCAL RESOURCES, INFRASTRUCTURE, AND PHYSIOGRAPHY |
32 |
| 5.1 Accessibility |
32 |
| 5.2 Local Resources and Infrastructure |
32 |
| 5.3 Climate |
32 |
| 5.4 Physiography |
32 |
| 5.5 Vegetation and Wildlife |
32 |
| 6 HISTORY |
33 |
| 6.1 Previous Mineral Resource Estimates |
34 |
| 6.2 Maiden Mineral Resource Estimate, March 2022 |
34 |
| 6.3 Updated Mineral Resource Estimate, January 2023 |
36 |
| 7 GEOLOGICAL SETTING AND MINERALIZATION |
39 |
| 7.1 Regional Geology |
39 |
| 7.2 Property Geology |
43 |
| 7.3 Mineralization |
47 |
| 7.3.1 Animas-Refugio Corridor |
49 |
| 7.3.2 Cordon del Oro Corridor |
52 |
| 7.3.3 Cinco Señores and Napoleon Corridor |
53 |
| Technical Report – Updated Mineral Resource Estimate - Panuco Ag-Au-Pb-Zn Project, Mexico |
Page ii |
| |
|
| 7.3.4 Other Mineralized Structures |
59 |
| 7.4 Structural Controls |
61 |
| 7.5 Alteration |
61 |
| 7.6 Mineral Petrology |
62 |
| 8 DEPOSIT TYPES |
64 |
| 8.1 Epithermal Systems |
64 |
| 9 EXPLORATION |
67 |
| 9.1 Geological Mapping |
67 |
| 9.2 2019-2021 Rock and Soil Geochemistry |
68 |
| 9.3 Geophysics |
69 |
| 9.4 2023 LiDAR Survey |
71 |
| 9.5 2022 Surface Sampling |
72 |
| 9.6 2023 Surface Sampling |
73 |
| 10 DRILLING |
76 |
| 10.1 2019 Drilling |
77 |
| 10.2 2020 Drilling |
78 |
| 10.3 2021 Drilling |
81 |
| 10.4 2022 Drilling |
85 |
| 10.5 2023 Drilling |
86 |
| 11 SAMPLE PREPARATION, ANALYSES, AND SECURITY |
88 |
| 11.1 2019 – 2023 Rock Sampling (Vizsla Silver) |
89 |
| 11.2 2019 – 2023 Drilling Programs (Vizsla Silver) |
89 |
| 11.2.1 Sample Preparation and Security |
89 |
| 11.2.2 Sample Analyses |
91 |
| 11.2.3 Bulk Density |
91 |
| 11.2.4 Data Management |
91 |
| 11.2.5 Quality Assurance/Quality Control |
91 |
| 11.2.6 Certified Reference Material |
92 |
| 11.2.7 Blank Material |
103 |
| 11.2.8 Duplicate Material |
105 |
| 11.2.9 Umpire Laboratory |
110 |
| 11.3 Sample Storage and Security |
113 |
| 11.4 QP’s Comments |
113 |
| 12 DATA VERIFICATION |
114 |
| 12.1 Drill Sample Database |
114 |
| 12.2 Site Visit |
114 |
| 12.2.1 2023 Site Visits |
114 |
| 12.3 Conclusion |
115 |
| 13 MINERAL PROCESSING AND METALLURGICAL TESTING |
116 |
| 13.1 The following is a summary of results of metallurgical testing completed on core from the Project as of the effective date of this report. Preliminary Metallurgical Testing on the Napoleon Deposit |
116 |
| 13.1.1 Sample Origin and Sample Characteristics |
117 |
| 13.1.2 Metallurgical Testing |
119 |
| 13.1.3 Additional Metallurgical Testing |
121 |
| 13.1.4 Conclusions |
122 |
| 13.2 Preliminary Metallurgical Testing on the Tajitos Deposit |
124 |
| 13.2.1 Sample Origin and Sample Characteristics |
124 |
| 13.2.2 Metallurgical Testing |
126 |
| 13.2.3 Conclusions |
129 |
| 13.3 Metallurgical Testing on the Copala Deposit |
130 |
| 13.3.1 Sample Origin and Sample Characteristics |
130 |
| 13.3.2 Metallurgical Testing |
132 |
| 13.3.3 Conclusions |
136 |
| 14 MINERAL RESOURCE ESTIMATES |
138 |
| 14.1 Introduction |
138 |
| 14.2 Drill Hole Database |
138 |
| Technical Report – Updated Mineral Resource Estimate - Panuco Ag-Au-Pb-Zn Project, Mexico |
Page iii |
| |
|
| 14.3 Mineral Resource Modelling and Wireframing |
140 |
| 14.4 Bulk Density |
143 |
| 14.5 Compositing |
144 |
| 14.6 Grade Capping |
149 |
| 14.7 Block Model Parameters |
151 |
| 14.8 Grade Interpolation |
154 |
| 14.9 Mineral Resource Classification Parameters |
157 |
| 14.10 Reasonable Prospects of Eventual Economic Extraction |
158 |
| 14.11 Mineral Resource Statement |
159 |
| 14.12 Model Validation and Sensitivity Analysis |
168 |
| 14.12.1 Sensitivity to Cut-off Grade |
170 |
| 14.13 Comparison of the current MRE to the January 2023 MRE |
174 |
| 14.14 Disclosure |
175 |
| 15 MINERAL RESERVE ESTIMATE |
176 |
| 16 MINING METHODS |
177 |
| 17 RECOVERY METHODS |
178 |
| 18 PROJECT INFRASTRUCTURE |
179 |
| 19 MARKET STUDIES AND CONTRACTS |
180 |
| 20 ENVIRONMENTAL STUDIES, PERMITTING AND SOCIAL OR COMMUNITY IMPACT. 181 |
181 |
| 21 CAPITAL AND OPERATING COSTS |
182 |
| 22 ECONOMIC ANALYSIS |
183 |
| 23 ADJACENT PROPERTIES |
184 |
| 24 OTHER RELEVANT DATA AND INFORMATION. 185 |
185 |
| 25 INTERPRETATION AND CONCLUSIONS |
186 |
| 25.1 Diamond Drilling |
186 |
| 25.2 Metallurgy |
188 |
| 25.3 Mineral Resource Estimate |
189 |
| 25.3.1 Panuco Project Updated Mineral Resource Estimate Notes: |
190 |
| 25.4 Risk and Opportunities |
191 |
| 25.4.1 Risks |
192 |
| 25.4.2 Opportunities |
192 |
| 26 RECOMMENDATIONS |
192 |
| 27 REFERENCES |
195 |
| 28 DATE AND SIGNATURE PAGE |
199 |
| 29 CERTIFICATES OF QUALIFIED PERSONS |
200 |
LIST OF FIGURES
| Figure 4-1 Property Location Map |
22 |
| Figure 4-2 Mining Concessions (WGS 84 UTM Zone 13N) |
23 |
| Figure 4-3 Location of Ejidos and Outline of Panuco Project |
29 |
| Figure 7-1 Metallogenic Setting Map. Illustrates Geological Setting of Western Mexico with Main Porphyry and Epithermal Deposits of the Sierra Madre Occidental |
40 |
| Figure 7-2 Regional Geologic Setting Map. Illustrates Regional Geological Central Sierra Madre Occidental |
41 |
| Figure 7-3 Regional Geology Map |
42 |
| Figure 7-4 Stratigraphic Column for the Project Area |
43 |
| Figure 7-5 Property Geology Map Showing Claim Outline and Known Mineralized Structures |
45 |
| Figure 7-6 Schematic Cross-Section of Panuco Veining Illustrating that Veins May Be Listric Faults Developed from Reactivated Laramide Thrust Faults (Starling 2019) |
46 |
| Figure 7-7 Panuco Project Claims Showing Known Veins, Including the Four Resource Areas Comprising Eleven Veins Included in the Mineral Resource Estimate |
48 |
| Figure 7-8 Animas-Refugio Geology and Silver Geochemistry (Section A-A' Shown in Figure 7-10) |
50 |
| Figure 7-9 Animas-Refugio Geology and Gold Geochemistry (Section A-A' Shown in Figure 7-10) |
51 |
| Figure 7-10 Animas-Refugio Vein Cross-Section Looking Northwest |
52 |
| Figure 7-11 Cordon del Oro Geology and Silver Geochemistry |
53 |
| Technical Report – Updated Mineral Resource Estimate - Panuco Ag-Au-Pb-Zn Project, Mexico |
Page iv |
| |
|
| Figure 7-12 Cinco Señores-Napoleon Geology and Silver Geochemistry |
54 |
| Figure 7-13 Cinco Señores-Napoleon Geology and Gold Geochemistry |
55 |
| Figure 7-14 Descubridora Mine Geology and Geochemistry |
56 |
| Figure 7-15 Drill-hole intercepts showing tilted-mineralization on Napoleon main vein |
57 |
| Figure 7-16 Panuco Project Area with Veins |
59 |
| Figure 8-1 Genetic model for epithermal deposits |
65 |
| Figure 8-2 Schematic of Alteration and Mineralization in Low Sulphidation Precious Metal Deposits |
66 |
| Figure 9-1 Panuco Property Mapped Areas at 1:1,000 Scale as of September 2023 |
67 |
| Figure 9-2 Surface sampling at Panuco Project between 2019 and 2022 |
69 |
| Figure 9-3 Airborne Magnetics RTP from 2016 with Known Veining and Possible Fault Offset Shown in Diorite |
70 |
| Figure 9-4 Results from 2021 Airborne Magnetics RTP Geophysical Survey Over the Napoleon Area |
71 |
| Figure 9-5 Surface Sampling at Panuco Project in 2022 |
73 |
| Figure 9-6 Surface Sampling at Panuco Project in 2023 |
75 |
| Figure 10-1 Resource Models and Location of Drill Holes on the Panuco Project from 2019-2023 |
77 |
| Figure 10-2 Resource Models and Location of 2019 - 2020 Drill Holes on the Panuco Project |
78 |
| Figure 10-3 Resource Models and Location of Drill Holes on the Panuco Project from 2021 |
81 |
| Figure 10-4 Resource Models and Location of Drill Holes on the Panuco Project from 2022 |
85 |
| Figure 10-5 Resource Models and Location of Drill Holes on the Panuco Project from 2023 (to September 1, 2023) |
87 |
| Figure 11-1 Vizsla Silver Core-Logging Facility in Concordia, Sinaloa. Left: Core logging area; Right: Long-Term, Covered and Fenced, Core Storage Area |
90 |
| Figure 11-2 CRM Control Chart for Silver for the 2020 Drill Program |
95 |
| Figure 11-3 CRM Control Chart for Gold for the 2020 Drill Program |
96 |
| Figure 11-4 CRM Control Chart for Lead for the 2020 Drill Program |
96 |
| Figure 11-5 CRM Control Chart for Zinc for the 2020 Drill Program |
97 |
| Figure 11-6 CRM Control Chart for Silver for the 2021 Drill Program |
97 |
| Figure 11-7 CRM Control Chart for Gold for the 2021 Drill Program |
98 |
| Figure 11-8 CRM Control Chart for Lead for the 2021 Drill Program |
98 |
| Figure 11-9 CRM Control Chart for Zinc for the 2021 Drill Program |
99 |
| Figure 11-10 CRM Control Chart for Silver for the 2022 Drill Program |
99 |
| Figure 11-11 CRM Control Chart for Gold for the 2022 Drill Program |
100 |
| Figure 11-12 CRM Control Chart for Lead for the 2022 Drill Program |
100 |
| Figure 11-13 CRM Control Chart for Zinc for the 2022 Drill Program |
101 |
| Figure 11-14 CRM Control Chart for Silver for the 2023 Drill Program |
101 |
| Figure 11-15 CRM Control Chart for Gold for the 2023 Drill Program |
102 |
| Figure 11-16 CRM Control Chart for Lead for the 2023 Drill Program |
102 |
| Figure 11-17 CRM Control Chart for Zinc for the 2023 Drill Program |
103 |
| Figure 11-18 Blank Sample Chart for Silver for the 2020 Drill Program |
104 |
| Figure 11-19 Blank Sample Chart for Silver for the 2021 Drill Program |
104 |
| Figure 11-20 Blank Sample Chart for Silver for the 2022 Drill Program |
105 |
| Figure 11-21 Blank Sample Chart for Silver for the 2023 Drill Program |
105 |
| Figure 11-22 Plot of Field Duplicate Samples for Silver from the 2019-2023 Drill Program |
106 |
| Figure 11-23 Plot of Field Duplicate Samples for Gold from the 2019-2023 Drill Program |
107 |
| Figure 11-24 Plot of Field Duplicate Samples for Lead from the 2019-2023 Drill Program |
107 |
| Figure 11-25 Plot of Field Duplicate Samples for Zinc from the 2019-2023 Drill Program |
108 |
| Figure 11-26 Plot of Pulp Duplicate Samples for Silver from the 2019-2023 Drill Program |
108 |
| Figure 11-27 Plot of Pulp Duplicate Samples for Gold from the 2019-2023 Drill Program |
109 |
| Figure 11-28 Plot of Pulp Duplicate Samples for Lead from the 2019-2023 Drill Program |
109 |
| Figure 11-29 Plot of Pulp Duplicate Samples for Zinc from the 2019-2023 Drill Program |
110 |
| Figure 11-30 Plot of SGS Umpire Check Samples for Silver Assayed in 2022 |
111 |
| Figure 11-31 Plot of SGS Umpire Check Samples for Gold Assayed in 2022 |
112 |
| Figure 11-32 Plot of SGS Umpire Check Samples for Silver Assayed in 2023 |
112 |
| Figure 11-33 Plot of SGS Umpire Check Samples for Gold Assayed in 2023 |
113 |
| Technical Report – Updated Mineral Resource Estimate - Panuco Ag-Au-Pb-Zn Project, Mexico |
Page v |
| |
|
| Figure 14-1 Plan View: Distribution of Surface Drill Holes on the Property (WGS 84), on Topography |
139 |
| Figure 14-2 Isometric View Looking Northwest: Distribution of Surface Drill Holes in the Copala-Napoleon-Cruz-Luisa Area (WGS84) |
140 |
| Figure 14-3 Plan View: Property Mineral Resource Models |
142 |
| Figure 14-4 Isometric View Looking Northeast: Property Mineral Resource Models |
142 |
| Figure 14-5 Isometric View Looking Northwest: Property Mineral Resource Models, Copala-Napoleon-Luisa Areas |
143 |
| Figure 14-6 Plan View: Distribution of Mineral Resource Block Models and Mineralization Domains |
152 |
| Figure 14-7 Isometric View looking NW: Distribution of Mineral Resource Block Models and Mineralization Domains on the Property |
153 |
| Figure 14-8 Isometric View looking NW: Distribution of Mineral Resource Block Models and Mineralization Domains in the Napoleon-Copala Areas |
153 |
| Figure 14-9 Plan View: Mineral Resource Block Grades and Block Class for the Copala-Cristiano-Tajitos Deposit Area |
162 |
| Figure 14-10 Isometric View Looking West: Mineral Resource Block Grades and Block Class for the Copala-Cristiano-Tajitos Deposit Area |
163 |
| Figure 14-11 Isometric View Looking NNE: Mineral Resource Block Grades and Block Class for the Copala-Cristiano-Tajitos Deposit Area |
164 |
| Figure 14-12 Plan View: Mineral Resource Block Grades and Block Class for the Napoleon, Cruz, Josephine and Luisa Areas |
165 |
| Figure 14-13 Isometric View Looking Northwest: Mineral Resource Block Grades and Block Class for the Napoleon, Cruz, Josephine and Luisa Areas |
166 |
| Figure 14-14 Isometric View Looking NNE: Mineral Resource Block Grades and Block Class for the Napoleon, Cruz, Josephine and Luisa Areas |
167 |
| Figure 14-15 Comparison of ID3, ID2 & NN Models for the Napoleon-Josephine-Cruz Deposit Area |
169 |
| Figure 14-16 Comparison of ID3, ID2 & NN Models for the Copala-Cristiano Deposit Area |
170 |
| Figure 26-1 Plan Map of the Panuco District Highlighting Primary 2024 Exploration Targets Relative to Mapped and Sampled Mineralized Veins: |
194 |
LIST OF TABLES
| Table 1-1 Panuco Project Mineral Resource Estimate, September 1, 2023 |
13 |
| Table 1-2 Panuco Project Mineral Resource Estimate by Area, September 1, 2023 |
14 |
| Table 2-1 List of Abbreviations |
20 |
| Table 4-1 Property Mineral Concessions held 100% By Vizsla |
23 |
| Table 6-1 2022 Panuco Mineral Resource Estimate Summary by Resource Classification (150 g/t AgEq Cut-Off Grade), March 1, 2022 (Maunula and Murray, 2022) |
35 |
| Table 6-2: Panuco Mineral Resource Estimate Summary by Vein (150 g/t AgEq Cut-Off Grade), March 1, 2022 (Maunula and Murray, 2022) |
35 |
| Table 6-3: Cut-Off Grade Sensitivity (AgEq Cut-Off Grade), March 1, 2022 (Maunula and Murray, 2022) |
36 |
| Table 6-4 Panuco Project Mineral Resource Estimate, January 19, 2023 |
37 |
| Table 6-5 Panuco Project Mineral Resource Estimate by Zone, January 19, 2023 |
37 |
| Table 7-1 General Description of Estimated Veins Included in the Mineral Resources Estimate for the Panuco Project |
47 |
| Table 9-1 Summary of Surface and Underground Rock and Soil Geochemistry Samples between 2019 and 2021 |
68 |
| Table 9-2 Panuco Project Surface Samples in 2022 |
72 |
| Table 9-3 Selected High-Grade Samples Taken During 2022 Surface Exploration |
72 |
| Table 9-4 Panuco Project Surface Samples in 2023 |
74 |
| Table 9-5 Selected High-Grade Samples Taken During 2023 Surface Exploration |
74 |
| Table 10-1: Summary Drilling Conducted by Vizsla Silver on the Panuco Project, to September 2023 |
76 |
| Table 10-2 Highlights of the 2021 Drilling |
82 |
| Table 10-3 Highlights of the 2022 Drilling (to September) |
86 |
| Table 10-4 Highlights of the 2023 Drilling (to September) |
87 |
| Technical Report – Updated Mineral Resource Estimate - Panuco Ag-Au-Pb-Zn Project, Mexico |
Page vi |
| |
|
| Table 11-1 Summary of Drilling Samples Included in the MRE by Year |
88 |
| Table 11-2 Summary of Drill Core Analytical Labs and Analysis Methods 2019 - 2023 |
88 |
| Table 11-3 QC Sample Statistics for Vizsla Core Sampling 2019 - 2023 |
92 |
| Table 11-4 CRM Sample Silver Performance for the 2019-2023 Drill Programs |
93 |
| Table 11-5 CRM Sample Gold Performance for the 2019-2023 Drill Programs |
94 |
| Table 11-6 CRM Sample Lead Performance for the 2019-2023 Drill Programs |
94 |
| Table 11-7 CRM Sample Zinc Performance for the 2019-2023 Drill Programs |
95 |
| Table 11-8 Average Relative Error of Duplicate Samples from 2019-2023 |
106 |
| Table 11-9 Relative Bias - SGS Umpire Check Samples from 2019-2023 |
110 |
| Table 11-10 Average Relative Error - SGS Umpire Check Samples from 2019-2023 |
111 |
| Table 13-1 Chemical Content Summary (ALS, 2021) |
118 |
| Table 13-2 Mineral Content Summary (ALS, 2021) |
118 |
| Table 13-3 Gold and Silver Recovery/Extraction Summary (ALS, 2022A) |
123 |
| Table 13-4 Master Composite Head Assay Summary |
125 |
| Table 13-5 Master Composite Mineral Content Summary |
125 |
| Table 13-6 Potential Flowsheet Comparison (ALS, 2022B) |
130 |
| Table 13-7 Head Assay Summary (ALS, 2023) |
131 |
| Table 13-8 Mineral Content Summary (ALS, 2023) |
131 |
| Table 13-9 Master Composite 1 Whole Feed Cyanidation Vs. Flotation - Cyanidation |
137 |
| Table 14-1 Project Drill Hole Totals |
139 |
| Table 14-2 Property Domain Descriptions |
141 |
| Table 14-3 Statistical Analysis of the Drill Assay Data from Within the Deposit Mineral Domains - by Area |
144 |
| Table 14-4 Statistical Analysis of the 1.5 M Composite Data from Within the Deposit Mineral Domains - by Area |
147 |
| Table 14-5 Composite Capping Summary - by Domain/Deposit Area |
150 |
| Table 14-6 Deposit Block Model Geometry |
151 |
| Table 14-7 Grade Interpolation Parameters by Area and Domain |
154 |
| Table 14-8 Parameters used for Underground Cut-off Grade Calculation |
159 |
| Table 14-9 Panuco Project Mineral Resource Estimate, September 1, 2023 |
159 |
| Table 14-10 Panuco Project Mineral Resource Estimate by Area, September 1, 2023 |
160 |
| Table 14-11 Comparison of Average Composite Grades with Block Model Grades |
168 |
| Table 14-12 Underground Mineral Resource Estimate at Various AgEq Cut-off Grades, September 1, 2023 |
171 |
| Table 14-13 Comparison of the January 2023 MRE to the September 2023 MRE for the Project |
174 |
| Table 25-1 Highlights of the 2023 Drilling (to September 1, 2023) |
188 |
| Table 25-2 Panuco Project Mineral Resource Estimate, September 1, 2023 |
189 |
| Table 25-3 Panuco Project Mineral Resource Estimate by Area, September 1, 2023 |
190 |
1 SUMMARY
SGS Geological Services Inc. ("SGS") was contracted by Vizsla Silver Corp., ("Vizsla" or the "Company") to complete an updated Mineral Resource Estimate ("MRE") for the Panuco Ag-Au Project ("Panuco" or "Project") in Sinaloa, Mexico, and to prepare a National Instrument 43-101 ("NI 43-101") Technical Report written in support of the updated MRE. The Project is considered an early-stage exploration project.
Vizsla Silver Corp. was incorporated as Vizsla Capital Corp. under the Business Corporations Act (British Columbia) on September 26, 2017. On March 8, 2018, the Company changed its name to Vizsla Resources Corp. On February 5, 2021, the Company changed its name to Vizsla Silver Corp. The Company's principal business activity is the exploration of mineral properties. The Company currently conducts its operations in Mexico and Canada. It is trading on the TSX Venture Exchange ("TSXV") under the symbol VZLA.
On January 21, 2022, Vizsla Silver Corp was listed on the NYSE American exchange and commenced trading under the symbol "VZLA".
The current report is authored by Allan Armitage, Ph.D., P. Geo., ("Armitage") and Ben Eggers, MAIG, P.Geo. ("Eggers") of SGS (collectively, the "Authors"). The Authors are independent Qualified Persons as defined by NI 43-101 and are responsible for all sections of this report. The updated MRE presented in this report was estimated by Armitage.
The reporting of the updated MRE complies with all disclosure requirements for Mineral Resources set out in the NI 43-101 Standards of Disclosure for Mineral Projects. The classification of the updated MRE is consistent with the 2014 Canadian Institute of Mining, Metallurgy and Petroleum (CIM) Definition Standards (2014 CIM Definitions) and adhere to the 2019 CIM Estimation of Mineral Resources & Mineral Reserves Best Practice Guidelines (2019 CIM Guidelines).
The current Technical Report will be used by Vizsla in fulfillment of their continuing disclosure requirements under Canadian securities laws, including National Instrument 43-101 - Standards of Disclosure for Mineral Projects ("NI 43-101"). This Technical Report is written in support of an updated MRE completed for Vizsla.
1.0 Property Description, Location, Access, and Physiography
The Panuco Project is in the Panuco-Copala mining district (the Property; the Project) in the municipality of Concordia, southern Sinaloa state, along the western margin of the Sierra Madre Occidental physiographic province in western Mexico. The Project is centred at 23 25' north latitude and 105 56' west longitude on map sheets F13A-37.
The Project comprises 117 approved mining concessions in nineteen blocks, covering a total area of 5,869.87 ha, and two mineral concessions covering 1,321.15 ha. The mineral concessions are held 100% by Vizsla Silver. The concessions are valid for 50 years, provided semi-annual property tax payments are made in January and July each year and if minimum annual investment requirements are met, or if there is minimum annual production equal to the amount of the annual investment requirement. The concession owner may apply for a second 50-year term. Annual payments of 2.03 million Mexican Pesos were made in January of 2023 and 2.03 million Pesos were made in July of 2023 by Vizsla.
The Panuco Project area is accessed from Mazatlán via Federal Highway 15 to Villa Union, then on Highway 40 for 56 km (one-hour drive) (Figure 4-1). Highway 40 crosscuts the Project area and most of the vein structures. Toll Highway 40D also crosses the Project. In addition, local dirt roads provide access to most of the workings, but some require repairs or are overgrown, and four-wheel-drive vehicles are recommended in the wet season.
The Project is in the Concordia municipality, which has a population of approximately 27,000 inhabitants. Public services, including health clinics and police, are in the town of Concordia. Residents provide an experienced mine labour force. Contractors in Durango and Hermosillo have a strong mining tradition and provide the Project with a local source of knowledgeable labour and contract mining services. Drilling companies and mining contractors are available in Mazatlán, Durango, Hermosillo, Zacatecas, Fresnillo, and other areas of Mexico. The Project area is also used for cattle grazing, with limited agricultural use.
Two power lines connecting Durango and Mazatlán cross the Project, with 400 kV and 240 kV capacities.
Vizsla Silver owns the 500 tonnes per day Coco mill on its property. In addition, there are some mineral processing plants held by third parties in the district that range from 200 to 700 tonnes per day in capacity.
1.1 History of Exploration, Drilling
Capitan Francisco de Ibarra founded Concordia in 1565, and gold and silver veins in Panuco and Copala were first exploited in the centuries that followed Sim (2008) and Robinson (2019). Although production has been carried out on the Panuco Project over the last 460 years, no production records are available to Vizsla.
The first recorded modern mining activity commenced late in the 20th century. The Mineral Resources Council (Consejo de Recursos Minerales [CRM], the predecessor of the Mexican Geological Service [SGM]) carried out 1:50,000 scale mapping on map sheet F13-A37 and fine-fraction stream sediment sampling in 1999. In 2003, the CRM published additional 1:50,000 scale mapping on map sheet F13-A36, and fine-fraction stream sediment sampling (Polanco-Salas et al., 2003). In 2019 the SGM conducted 1:50,000 scale geological mapping and fine-fraction stream sediment sampling on map sheet F13-A46.
In 1989 the CRM optioned and sold several mineral concessions in the district, including to Grupo Minera Bacis (Bacis) in 1989. Bacis subsequently acquired claims from other parties active in the area, including Minas del Oro y del Refugio S.A. de C.V. Bacis drilled 19 holes totalling 2,822.8 m along the Animas-Refugio corridor, but only collar and survey records exist of this work.
From 1999 to 2001, Minera Rio Panuco S.A. de C.V. (Rio Panuco) explored the Animas-Refugio and Cordon del Oro structures culminating in 45 holes for 8,358.6 m. No geological drill logs, downhole survey data, downhole sample data, or geochemical assay data have been preserved. Graphic drill-hole sections are available, with limited downhole geology and geochemical data.
Capstone Mining Corp. (Capstone) optioned the Bacis concessions in 2004 and carried out geologic mapping and sampling of the Animas-Refugio and Cordon del Oro structures. In 2005, Capstone drilled 15,374 m in 131 holes on down-dip extensions of the Clemens and El Muerto mines on the Animas-Refugio vein. In 2007, Capstone explored the La Colorada structure with surface mapping and sampling, followed by 6,659 m of drilling in 64 holes.
Also, in 2007, Capstone transferred the claims of the Copala, Claudia, Promontorio, Montoros, and Martha projects to Silverstone Corp. (Silverstone). Capstone and Silverstone completed 21,641 m of drilling in 200 holes from 2005 to 2008.
Silverstone merged with Silver Wheaton Ltd. (Silver Wheaton) in 2009, and Silver Wheaton subsequently sold the shares of concession owner Silverstone to Mexican owners. The Silverstone owners mined out a portion of the Mineral Resource defined in 2008 over the next decade. Silverstone mined parts of the Clemens, El Muerto, La Pipa, Mariposa, El 40, and San Martin ore shoots until mining encountered the water table, preventing further mining. Silverstone or unauthorized mining activity in the intervening years exploited most of the Mineral Resources estimated by Christopher and Sim (2008).
MRP contracted Geophysical Surveys S.A. de C.V. of Mexico City in 2016 to conduct an airborne magnetics survey. However, no data are available, and no survey or flight specifications are included in the report. The survey was flown in two blocks.
Since acquiring the Property in November 2019, Vizsla has conducted a number of significant drill campaigns in the Napoleon, Copala-Tajitos, Animas and San Antonio areas. Up to September 2023 (data cut-off date for the current MRE), Vizsla has completed 822 surface diamond drill holes totalling 302,931 m and collected 47,694 assay intervals representing 55,368 m of drilling. Vizsla has continued to drill at the Project since the data cut off for the Mineral Resource estimate of September 1, 2023.
In November 2019, Vizsla began drilling on the Panuco Project on the Animas-Refugio corridor near the La Pipa and Mariposa mine areas. A total of 820.50 m in three drill holes was completed in 2019. The three drill holes targeted the La Pipa structure to test below the old historic ore shoot. Results showed low-grade and narrow widths, and no further test work was carried out.
Drill holes AMS-19-01A and AMS-19-02 were drilled to test the downdip extension of the La Pipa ore shoot that has seen extensive mining. The first hole intersected historic workings and a footwall vein over 5.5 m at 135.0 m downhole. Deeper in the hole a 2.0 m wide quartz-amethyst vein was intersected at 241.5 m downhole. The second hole was completed 77 m down dip on the same section and intersected a shallow hanging wall vein with 3 m grading 125.3 g/t Ag and 0.59 g/t Au and a zone of low-grade veinlets in the projection of the Animas Vein.
Drilling for 2020 totaled 28,643.42 m in 129 drill holes. The four main corridors of Napoleon, Cinco Senores, Cordon del Oro, and Animas-Refugio were tested.
In January 2020, drilling resumed at the Mariposa mine area, another historically mined area. Other targets in the Animas-Refugio corridor included, from south to north, Mojocuan, San Carlos, Paloma, and Honduras veins.
Drilling at the Napoleon corridor began in June 2020. A total of 64 drill holes tested the Napoleon structure, for 12,546.02 m. Targets were in the central part of the north-south-trending structure, below old mine workings, and 650 m north in the Papayo area.
At the Cordon del Oro corridor, drilling totalled 6,432.05 m in 28 drill holes. The drilling targeted the Mojocuan, San Carlos, and Peralta mine areas, in addition to the Aguita Zarca vein.
Cinco Senores corridor saw 2,927.10 m of drilling in 14 drill holes. The Tajitos vein was the drilling target, and previously unknown workings were encountered in the first four holes.
Drilling at the Panuco Project in 2021 totalled 100,242.55 m in 318 drill holes. The drilling focussed along the Napoleon and Tajitos vein areas, with 54,759.15 m in 180 drill holes and 34,769.35 m in 102 drill holes, respectively (Table 10-1). Additionally, 4,438.50 m in 14 drill holes were drilled in the Animas-Refugio corridor, and 6,275.55 m in 22 drill holes in the Cordon del Oro corridor. Highlights of the 2021 drilling are presented below.
At Napoleon, infill and delineation drilling focussed on denser drilling to inform the Mineral Resource estimate and expand the structure's strike length. The Josephine vein, a subparallel system to Napoleon which was identified initially as an electromagnetic geophysical target, was first intersected in Hole NP-21-132, leading to additional targeting in the area and its inclusion in the Mineral Resource estimate. Further drill testing included the Cruz Negra and Alacran vein areas.
Drilling at the Tajitos vein area focussed on delineation and infilling, with additional exploration drilling to the north. The Tajitos resource drilling led to the discovery of the Copala vein -- a relatively thick sub horizontal structure on the Tajitos northeastern extent. Other exploration drilling along the Cinco Senores corridor included the Cinco Senores and Colorada veins to the north of Tajitos.
In the Animas-Refugio corridor, drilling tested the Rosarito segment included in the Mineral Resource estimate, in addition to the Peralta and Cuevillas veins.
Drilling at the Cordon del Oro corridor targeted the San Antonio structure included in the Mineral Resource estimate, in addition to exploration near the Aguita Zarca vein.
Drilling for 2022 totalled 113,487 m in 271 drill holes. The four main corridors of Napoleon, Cinco Senores, Cordon del Oro, and Animas-Refugio were tested.
Drilling at the Napoleon corridor included 106 drill holes tested the Napoleon structure, for 52,306.40 m. At the Cordon del Oro corridor, drilling totalled 4,251.8 m in 19 drill holes. Drilling at the Copala/Tajitos veins included 135 drill holes for 52,045.10 m. Additionally, 4,883.70 m in 11 drill holes were drilled in the Animas-Refugio corridor.
The bulk of 2022 drilling was centred on the western portion of the district, focused on upgrading and expanding resources at the Copala and Napoleon areas. At Copala, mineralization has now been traced over 1,150 meters along strike, 400 m down dip, and remains open to the north and southeast.
At Napoleon, drilling throughout 2022 successfully expanded mineralization along strike and down plunge to the south, several vein splays were identified in the hanging wall and footwall of the main structure.
Other notable discoveries include the Cristiano Vein; marked by high precious metal grades up to 1,935 g/t Ag and 15.47 g/t Au over 1.46 m, located immediately adjacent to Copala; and La Luisa Vein, located ~700 m west of Napoleon which continues to display similar silver and gold zonation as that seen at Napoleon.
Drilling for 2023 (to September) totalled 60,432.95 m in 103 drill holes. The main Napoleon and Cinco Senores corridors were tested.
Drilling at the Napoleon corridor included 44 drill holes testing the Napoleon structure, for 25,298.30 m. Drilling at the Copala/Tajitos veins included 59 drill holes for 35,134.65 m.
The 2023 drilling was centred on the western portion of the district, focused on upgrading and expanding resources at the Copala and Napoleon areas. At Copala, mineralization has now been traced over 1,700 m along strike and to depths of 450 to 550 m and remains open to the north and southeast.
At Napoleon, drilling throughout 2023 successfully expanded mineralization along strike and down plunge/dip to the south, several vein splays were identified in the hanging wall and footwall of the main structure.
1.2 Geology and Mineralization
The Project is on the western margin of the Sierra Madre Occidental (SMO), a high plateau and physiographic province that extends from the U.S.A.-Mexico border to the east-trending Trans-Mexican Volcanic Belt. The SMO is a Large Igneous Province (LIP) recording continental magmatic activity from the Late Cretaceous to the Miocene in three main episodes. The first episode, termed the Lower Volcanic Complex (LVC), comprises a suite of intrusive bodies, including the Sonora, Sinaloa, and Jalisco batholiths and andesitic volcanic rock units with minor dacite and rhyolite tuffs and ignimbrites that are correlative with the Tarahumara Formation in Sonora of Late Cretaceous to Eocene age. The second magmatic episode is dominated by rhyolitic ignimbrites and tuffs that built one of the earth's largest silicic volcanic provinces and has been termed the Upper Volcanic Supergroup (UVS). These dominantly rhyolitic units were extruded in two episodes, from about 32 to 28 Ma and 24 to 20 Ma. These two periods of magmatic activity are associated with the subduction of the Farallon plate under North America and the Laramide orogeny that occurred between the Upper Cretaceous - Paleocene and the Eocene. The third episode comprises post-subduction alkali basalts and ignimbrites associated with the opening of the Gulf of California between the late Miocene and Pleistocene - Quaternary.
The western part of the SMO in Sonora and Sinaloa is cut by north-northwest-trending normal fault systems developed during the opening of the Gulf of California between 27 and 15 Ma. The normal fault systems favoured the formation of elongated basins that were subsequently filled with continental sedimentary rocks. The basins occur in a north-northwest-trending belt extending from western Sonora to most of Sinaloa.
The basement to the SMO is locally exposed in northern Sinaloa, near Mazatlan and on small outcrops within the project area. It comprises folded metasedimentary and metavolcanic rocks, deformed granitoids, phyllitic sandstones, quartzites, and schists of the Tahue terrane of Jurassic to Early Cretaceous age (Montoya-Lopera et al., 2019, Sedlock et al., 1993 and Campa and Coney 1982).
In the broader Project area, the LVC comprises granite, granodiorite, and diorite intrusive phases correlative with the Late Cretaceous to Early Paleocene San Ignacio and Eocene Piaxtla batholiths in San Dimas district. The andesite lavas, rhyolite-dacite tuffs, and ignimbrites are locally intruded by the Late Cretaceous to Early Paleocene intrusive phases and younger Eocene-Oligocene felsic dikes and domes. Northwest trending intermontane basins filled with continental conglomerates and sandstones incise the UVS and LVC in the Project area. The Oligocene age ignimbrites of the UVS occur east of the property towards Durango state.
The structure of the Project area is dominated by north-northwest-trending extensional and transtensional faults developed or reactivated during the Basin and Range tectonic event (~28 to 18 Ma). The extensional belt is associated with aligned rhyolite domes and dikes and Late Oligocene to Middle Miocene grabens.
Mineralization on the Panuco Property comprises several epithermal quartz veins. Previous workers and recent mapping and prospecting works conducted by Vizsla's geologists determined a cumulate length of veins traces of 86 km. Individual vein corridors are up to 7.6 km long, and individual veins range from decimetres to greater than 10 m wide. Veins have narrow envelopes of silicification, and local argillic alteration, commonly marked by clay gouge. Propylitic alteration consisting of chlorite-epidote in patches and veins affecting the andesites and diorite are common either proximal or distal to the veins.
The primary mineralization along the vein corridors comprises hydrothermal quartz veins and breccias with evidence of four to five different quartz stages: generally white, grey, and translucent and varying grain size from amorphous-microcrystalline-coarse. A late stage of amethyst quartz is also observed in some veins. The grey colour in quartz is due to the presence of fine-grained disseminated sulphides, believed to be mainly pyrite and acanthite. Vizsla Silver has delineated several hydrothermal breccias with grey quartz occurring more commonly at lower levels of the vein structures. Barren to low grade, quartz is typically white and is more common in the upper parts of the veins and breccias. Locally, mineralized structures are cut by narrow, banded quartz veins with thin, dark argentite/acanthite, sphalerite, galena, and pyrite bands. Bladed and lattice quartz pseudomorphs after calcite have been noted at several locations within the veins and indicate boiling conditions during mineral deposition. Later quartz veinlets cut all the mineralized zones with a mix of white quartz and purple amethyst. The amethyst is related to mixing near-surface waters as the hydrothermal system is collapsing, as has been noted in the nearby San Dimas district (Montoya-Lopera et al., 2019).
The Mineral Resource includes ten mineralized vein systems: the Napoleon, Napoleon hanging wall, Josephine, and Cruz Negra veins; the Copala, Cristiano, Tajitos and Copala 2 veins; the San Antonio vein; and the Rosarito vein. These trends are west to east within the Napoleon, Cinco Senores, Cordon del Oro, and Animas-Refugio corridors. The bulk of the resource veins strike north-northwest to north-northeast, with thicknesses varying from 1.5 m to over 10 m.
1.3 Mineral Processing, Metallurgical Testing and Recovery Methods
Preliminary metallurgical test programs have been completed on each of the 3 main deposits that form the Panuco resource. All test programs were conducted at ALS Metallurgy in Kamloops, BC, Canada.
The Napoleon test program was conducted in 2021 on samples obtained from 7 drill holes in the 2020 and 2021 drill programs. The selected intervals ranged from depths of 46 to 201 meters down the drill holes.
The Tajitos test program was conducted in 2022 on samples from 22 drill holes in the 2020 and 2021 drill programs. The selected intervals ranged from depths of 51 to 345 meters down the drill holes.
The Copala test program was conducted in 2023 on samples from 8 drill holes in the 2022 drill program. The selected intervals ranged from depths of 111 to 385 meters down the drill holes.
The sample selections covered a range of identified lithologies. Master composites were assembled to obtain feed grades that were similar to the expected average resource grades, variability composites were assembled to cover ranges of grades and lithologies. The majority of the testing was completed on the master composites of each deposit.
Comminution testing was completed which suggested that the materials were somewhat hard with respect to both impact and attrition breakage. Drop Weight tests (SMC) were only conducted on the Copala samples and returned an average Axb value of 33. Bond ball mill tests conducted on samples from all three deposits measured ball mill work index (BMWi) values ranging from 16.4 to 18.9 kWhr/tonne.
Mineralogical assessments on the feed samples using QEMSCAN indicated that the host rock was primarily quartz and feldspars. Quartz contents ranged from 55 to 86%. The samples contained generally low levels of sulphide minerals, with pyrite as the most abundant sulphide mineral. The Napoleon samples contained elevated levels of galena and sphalerite, these base metal mineral contents were generally quite low in the Tajitos and Copala samples. Analyses on the Tajitos and Copala samples indicated that silver was mostly present in the form of a silver sulphide mineral acanthite, although small amounts were present in silver-copper sulphides. Detailed analyses on the Copala samples indicated a significant portion of the silver bearing sulphide minerals were quite fine grained and poorly liberated, suggesting that somewhat fine primary grind sizes may be required to achieve high silver recoveries.
Froth flotation tests were conducted on all samples, investigating the potential to sequentially float lead and zinc, as well as simply recovering a bulk sulphide concentrate. Open circuit cleaner testing on the Napoleon master composite demonstrated that production of lead and zinc concentrates that meet typical marketing grade targets would be possible using typical processing conditions. In this flowsheet, about 70 and 80 percent of the silver and gold, respectively, would report to the lead concentrate. The zinc concentrates contained approximately 0.4% cadmium, which may be of concern for marketing, otherwise no other deleterious elements were measured at penalty levels.
Lead-zinc sequential flotation was only investigated in rougher flotation protocols on the Tajitos and Copala samples, distributions of silver and gold to the rougher concentrates were similar to the Napoleon material. Bulk sulphide flotation on all three deposits indicated that bulk sulphide concentrates containing 50-60 g/t gold could be generated on each material, silver concentrations ranged from 1500 to over 8000 g/t depending on the sulphide mineral contents in the feed. In general, about 80-90% of the silver and gold reported to bulk rougher concentrates at the primary grind sizes tested, recoveries to cleaner concentrates were not confirmed as tests were only conducted in open circuit.
Cyanide leaching of the rougher flotation tails was investigated on the Tajitos and Copala samples. Approximately 60-70% of the silver and 80-85% of the gold remaining in the rougher tails could be extracted in tests conducted over 48 and 72 hours. Leaching of rougher flotation concentrates was investigated on all deposits, but most extensively on the Copala samples. Silver extractions ranged from 85 to 98% and gold extractions ranged from 93 to 97% after 48 hours of leaching the concentrates, depending on the level of regrinding applied.
Whole feed leaching was investigated on samples from all deposits, which indicated that about 83-86% of the silver and 90-94% of the gold could be extracted after 96 hours of leaching. These tests were conducted at primary grind sizes ranging from 63 to 100µm P80.
1.4 Mineral Resource Estimate
Completion of the updated MREs for the Napoleon-Luisa and Copala-Tajitos deposit areas involved the assessment of an updated drill hole database, which included all data for surface drilling completed between November 2019 and September 2023. The MREs for the Animas and San Antonio deposit areas included data for surface drilling completed between November 2019 and September 2022; there has been no new drilling on the Animas and San Antonio deposit areas and these MREs previously published are considered current. Completion of the MREs also included the assessment of updated three-dimensional (3D) mineral resource models (resource domains), 3D topographic surface models, 3D models of historical underground workings, and available written reports.
The Inverse Distance Squared ("ID2") calculation method restricted to mineralized domains was used to interpolate grades for Ag (g/t), Au (g/t), Pb (ppm) and Zn (ppm) into block models for all deposit areas.
Indicated and Inferred mineral resources are reported in the summary tables in Section 14.11. The MREs presented below take into consideration that all deposits on the Property may be mined by underground mining methods.
The reporting of the updated MRE complies with all disclosure requirements for Mineral Resources set out in the NI 43-101 Standards of Disclosure for Mineral Projects. The classification of the updated MRE is consistent with the 2014 Canadian Institute of Mining, Metallurgy and Petroleum (CIM) Definition Standards (2014 CIM Definitions) and adheres as best as possible to the 2019 CIM Estimation of Mineral Resources & Mineral Reserves Best Practice Guidelines (2019 CIM Guidelines).
The updated MRE for the Project is presented in Table 1-1 and Table 1-2.
Highlights of the Project Mineral Resource Estimate are as follows:
-
Indicated Mineral Resources are estimated at 9.48 Mt grading 289 g/t silver, 2.41 g/t gold, 0.27% lead, and 0.84% zinc (511 AgEq). The current MRE includes indicated mineral resources of 88.2 Moz of silver, 736 koz of gold, 56 Mlbs of lead, and 176 Mlbs of zinc (155.8 Moz AgEq).
-
Inferred Mineral Resources are estimated at 12.19 Mt grading 239 g/t silver, 1.93 g/t gold, 0.29% lead, and 1.03% zinc (433 g/t AgEq). The current MRE includes inferred mineral resources of 93.7 Moz of silver, 758 koz of gold, 78 Mlbs of lead, and 276 Mlbs of zinc (169.6 Moz AgEq).
Table 1-1 Panuco Project Mineral Resource Estimate, September 1, 2023
| Resource Class |
Tonnes
(MT) |
Grade |
Total Metal |
| Au g/t |
Ag g/t |
Pb % |
Zn % |
AgEq
(g/t) |
Au
(koz) |
Ag
(koz) |
Pb
(Mlbs) |
Zn
(Mlbs) |
AgEq*
(koz) |
| Indicated |
9.48 |
2.41 |
289 |
0.27 |
0.84 |
511 |
736 |
88,192 |
56.0 |
176.1 |
155,841 |
| Inferred |
12.19 |
1.93 |
239 |
0.29 |
1.03 |
433 |
758 |
93,653 |
78.1 |
276.2 |
169,647 |
* AgEq = Ag ppm + (((Au ppm x Au price/gram) + (Pb% x Pb price/t) + (Zn% x Zn price/t))/Ag price/gram) with price assumptions of $24.00/oz Ag, $1800/oz Au, $1.10/lb Pb and $1.35/lb Zn
Table 1-2 Panuco Project Mineral Resource Estimate by Area, September 1, 2023
Copala Area: Copala, Tajitos and Cristiano
| Area |
Resource
Class |
Tonnes
(MT) |
Grade |
Total Metal |
| Au g/t |
Ag g/t |
Pb % |
Zn % |
AgEq
(g/t) |
Au
(koz) |
Ag (koz) |
Pb
(Mlbs) |
Zn
(Mlbs) |
AgEq
(koz) |
| Copala |
Indicated |
4.52 |
2.46 |
380 |
0.08 |
0.15 |
573 |
358 |
55,201 |
8.2 |
15.3 |
83,270 |
| Inferred |
3.16 |
1.77 |
332 |
0.12 |
0.20 |
476 |
179 |
33,722 |
8.2 |
13.6 |
48,320 |
| Tajitos |
Indicated |
0.63 |
2.24 |
358 |
0.12 |
0.21 |
538 |
46 |
7,295 |
1.6 |
2.9 |
10,953 |
| Inferred |
1.04 |
2.04 |
365 |
0.22 |
0.39 |
540 |
69 |
12,260 |
5.2 |
8.9 |
18,140 |
| Cristiano |
Indicated |
0.21 |
3.37 |
581 |
0.25 |
0.43 |
858 |
23 |
3,961 |
1.1 |
2.0 |
5,851 |
| Inferred |
0.72 |
2.54 |
443 |
0.15 |
0.29 |
650 |
59 |
10,213 |
2.4 |
4.5 |
14,974 |
| Total |
Indicated |
5.37 |
2.48 |
385 |
0.09 |
0.17 |
580 |
427 |
66,457 |
11 |
20 |
100,074 |
| Inferred |
4.92 |
1.94 |
355 |
0.15 |
0.25 |
515 |
307 |
56,195 |
16 |
27 |
81,434 |
Napoleon Area: Napoleon, Cruz, Josephine and Luisa
| Area |
Resource
Class |
Tonnes
(MT) |
Grade |
Total Metal |
| Au g/t |
Ag g/t |
Pb % |
Zn % |
AgEq
(g/t) |
Au
(koz) |
Ag
(koz) |
Pb
(Mlbs) |
Zn
(Mlbs) |
AgEq
(koz) |
| Luisa |
Indicated |
0.27 |
2.56 |
177 |
0.39 |
2.01 |
459 |
22 |
1,556 |
2.3 |
12.1 |
4,027 |
| Inferred |
2.04 |
2.13 |
159 |
0.30 |
1.51 |
386 |
139 |
10,439 |
13.3 |
67.9 |
25,326 |
| Cruz/Negra |
Indicated |
0.03 |
2.01 |
144 |
0.37 |
1.71 |
373 |
2 |
153 |
0.3 |
1.2 |
396 |
| Inferred |
0.31 |
3.75 |
170 |
0.31 |
1.48 |
519 |
37 |
1,698 |
2.1 |
10.1 |
5,169 |
| Josephine |
Indicated |
0.07 |
2.88 |
221 |
0.39 |
1.11 |
492 |
6 |
491 |
0.6 |
1.7 |
1,092 |
| Inferred |
0.22 |
2.05 |
161 |
0.33 |
1.00 |
364 |
15 |
1,161 |
1.6 |
4.9 |
2,618 |
| Napoleon_HW(4) |
Indicated |
0.43 |
1.72 |
164 |
0.42 |
1.53 |
365 |
24 |
2,259 |
4.0 |
14.4 |
5,029 |
| Inferred |
0.85 |
2.17 |
220 |
0.59 |
2.02 |
479 |
59 |
5,976 |
10.9 |
37.6 |
13,027 |
Napoleon+
Splays |
Indicated |
3.31 |
2.39 |
162 |
0.52 |
1.73 |
425 |
255 |
17,276 |
37.8 |
126.5 |
45,223 |
| Inferred |
3.18 |
1.64 |
137 |
0.45 |
1.76 |
342 |
168 |
14,045 |
31.8 |
123.2 |
35,063 |
| Total |
Indicated |
4.12 |
2.34 |
164 |
0.50 |
1.72 |
421 |
309 |
21,735 |
45 |
156 |
55,767 |
| Inferred |
6.60 |
1.97 |
157 |
0.41 |
1.68 |
383 |
418 |
33,319 |
60 |
244 |
81,203 |
San Antonio Area: Generales and Animas Area: Cuevillas and Rosarito
| Area |
Resource
Class |
Tonnes
(MT) |
Grade |
Total Metal |
| Au g/t |
Ag g/t |
Pb % |
Zn % |
AgEq
(g/t) |
Au
(koz) |
Ag
(koz) |
Pb
(Mlbs) |
Zn
(Mlbs) |
AgEq
(koz) |
| San Antonio |
Inferred |
0.28 |
1.30 |
226 |
0.01 |
0.03 |
325 |
12 |
2,038 |
0.1 |
0.2 |
2,936 |
| Animas |
Inferred |
0.39 |
1.68 |
169 |
0.29 |
0.60 |
327 |
21 |
2,101 |
2.5 |
5.2 |
4,074 |
1.4.1 Panuco Project Updated Mineral Resource Estimate Notes:
- The classification of the Updated Mineral Resource Estimate into indicated and inferred mineral resources is consistent with current 2014 CIM Definition Standards for Mineral Resources and Mineral Reserves. The effective date for the Updated Mineral Resource Estimate is September 1, 2023.
-
All figures are rounded to reflect the relative accuracy of the estimate and numbers may not add due to rounding.
-
All mineral resources are presented undiluted and in situ, constrained by continuous 3D wireframe models, and are considered to have reasonable prospects for eventual economic extraction.
-
Mineral resources are not mineral reserves. Mineral resources which are not mineral reserves, do not have demonstrated economic viability. An Inferred Mineral Resource has a lower level of confidence than that applying to an Indicated Mineral Resource and must not be converted to a Mineral Reserve. It is reasonably expected that the majority of Inferred Mineral Resources could be upgraded to Indicated Mineral Resources with continued exploration.
-
The database comprises a total of 822 drill holes for 302,931 m of drilling completed by Vizsla Silver between November 2019 and September 2023.
-
The mineral resource estimate is based on 28 three-dimensional ("3D") resource models, constructed in Leapfrog, representing the Napoleon area (15 wireframes), the Copala area (7 wireframes), Tajitos (1 wireframe), Animas (5 wireframes) and San Antonio (1 wireframe).
-
Silver, gold, lead, and zinc were estimated for each mineralization domain in the Panuco Project. Blocks within each mineralized domain were interpolated using 1.5 m capped composites assigned to that domain. To generate grade within the blocks, the inverse distance squared (ID2) interpolation method was used for all domains. All estimates are based on variable block dimensions (by deposit area) and estimation search parameters (by domain).
-
Average density values were assigned per zone based on 1,919 samples analysed by ALS in Zacatecas, Mexico or inhouse with 5% checks by ALS.
-
It is envisioned that the Panuco Project deposits may be mined using underground mining methods. Mineral resources are reported at a base case cut-off grade of 150 g/t AgEq. The mineral resource grade blocks were quantified above the base case cut-off grade, below surface and within the constraining mineralized wireframes.
-
The base-case AgEq Cut-off grade considers metal prices of $24.00/oz Ag, $1800/oz Au, $1.10/lb Pb and $1.35/lb Zn and considers metal recoveries of 93% for silver, 90% for gold, 94% for Pb and 94% for Zn.
-
The base case cut-off grade of 150 g/t AgEq considers a mining cost of US$45.00/t rock and processing, treatment and refining, transportation, and G&A cost of US$50.00/t of mineralized material.
-
The Updated Mineral Resource Estimate may be materially affected by environmental, permitting, legal, title, taxation, socio-political, marketing, or other relevant issues.
1.5 Recommendations
The Deposits of the Panuco Project contain underground Indicated and Inferred Mineral Resources that are associated with well-defined mineralized trends and models. All deposits are open along strike and at depth.
Armitage considers that the Project has potential for delineation of additional Mineral Resources and that further exploration is warranted. Given the prospective nature of the Panuco Property, it is the opinion of Armitage that the Property merits further exploration and that a proposed plan for further work by Vizsla is justified.
Armitage is recommending Vizsla conduct further exploration, subject to funding and any other matters which may cause the proposed exploration program to be altered in the normal course of its business activities or alterations which may affect the program as a result of exploration activities themselves.
For 2024, the company plans to drill ~65,000 m on current resource areas, priority targets proximal to current resources in the west, as well as on other high-priority targets in the eastern portion of the district.
Resource Extension Targets
-
The Copala structure remains open along strike to the north and down dip to the south. In 2024, Vizsla plans to continue 1) upgrading inferred resources in south Copala and 2) continue expanding Copala and its footwall splays down dip.
-
At Napoleon, Vizsla plans to upgrade inferred resources and to conduct resource expansion drilling along the hanging wall-4 vein (HW4) to the east, as well as to explore three potential vein feeders along the main Napoleon structure at depth.
Proximal Targets
-
At La Luisa, the team plans to continue expanding the footprint of the high-grade shoot on the south and infill drilling the recently defined 400 m gap between the northern most drill-hole intercepts and the high-grade shoot on the south.
-
The EL Molino Vein reported significant silver and gold grades close to surface, and Vizsla plans to explore the vein along strike and at depth to add additional high-grade resources close to planned infrastructure in 2024.
-
Vizsla plans to drill-test a conceptual target at the projected northern intersection of the Copala fault with the Napoleon vein system near La Estrella area.
District Targets
New mapping efforts completed in 2023 have highlighted an abundance of historic workings in the northeastern portion of the district. This new area named "Camelia" is marked by serval high-grade surface samples grading up to 400 g/t Ag and 5.0 g/t Au. Given, the overall density of veins mapped on surface and the abundance of surface samples related to historic workings this has become a high priority district target in the east.
Bulk Sample / Test Mine
Vizsla has received permits to develop and operate a test mine program at its Panuco project to extract a combined 25,000 tonne bulk sample from the Copala and Napoleon structures. Initial engineering for the bulk sample test mine has already begun with plans to begin underground development in early 2024.
Key objectives for 2024:
-
Deliver an updated MRE for the project in January 2024
-
Deliver maiden PEA in H1 2024
-
Complete updated metallurgical testing in H2 2024
-
Advance Bulk Sample / Test Mine program
-
Complete +65,000 meters of resource/discovery focused drilling
-
Complete a ~1,100 line-kilometre EM survey and acquire high-resolution multispectral satellite imagery for the whole district.
The total cost of the planned work program by Vizsla is estimated at ~CAD$25.0 million.
2 INTRODUCTION
SGS Geological Services Inc. ("SGS") was contracted by Vizsla Silver Corp., ("Vizsla" or the "Company") to complete an updated Mineral Resource Estimate ("MRE") for the Panuco Ag-Au Project ("Panuco" or "Project") in Sinaloa, Mexico, and to prepare a National Instrument 43-101 ("NI 43-101") Technical Report written in support of the updated MRE. The Project is considered an advanced-stage exploration project.
Vizsla Silver Corp. was incorporated as Vizsla Capital Corp. under the Business Corporations Act (British Columbia) on September 26, 2017. On March 8, 2018, the Company changed its name to Vizsla Resources Corp. On February 5, 2021, the Company changed its name to Vizsla Silver Corp. The Company's principal business activity is the exploration of mineral properties. The Company currently conducts its operations in Mexico and Canada. It is trading on the TSX Venture Exchange ("TSXV") under the symbol VZLA.
On January 21, 2022, Vizsla Silver Corp was listed on the NYSE American exchange and commenced trading under the symbol "VZLA".
The head office and principal address of the Company is located at #1723-595 Burrard St., Vancouver, B.C. V7X 1J1.
The current report is authored by Allan Armitage, Ph.D., P. Geo., ("Armitage") and Ben Eggers, MAIG, P.Geo. ("Eggers") of SGS (collectively, the "Authors"). The Authors are independent Qualified Persons as defined by NI 43-101 and are responsible for all sections of this report. The updated MRE presented in this report was estimated by Armitage.
The reporting of the updated MRE complies with all disclosure requirements for Mineral Resources set out in the NI 43-101 Standards of Disclosure for Mineral Projects. The classification of the updated MRE is consistent with the 2014 Canadian Institute of Mining, Metallurgy and Petroleum (CIM) Definition Standards (2014 CIM Definitions) and adhere to the 2019 CIM Estimation of Mineral Resources & Mineral Reserves Best Practice Guidelines (2019 CIM Guidelines).
The current Technical Report will be used by Vizsla in fulfillment of their continuing disclosure requirements under Canadian securities laws, including National Instrument 43-101 - Standards of Disclosure for Mineral Projects ("NI 43-101"). This Technical Report is written in support of an updated MRE completed for Vizsla.
2.1 Sources of Information
In preparing the current updated MRE and the current technical report, the Authors utilized a digital database, provided to the Authors by Vizsla, and technical reports provided by Vizsla. All background information regarding the Property has been sourced from previous technical reports and revised or updated as required.
-
The Property was the subject of a NI 43-101 technical report by Allan Armitage, Ben Eggers and Yann Camus of SGS in 2023 titled "Mineral Resource Estimate Update for the Panuco Ag-Au-Pb-Zn Project, Sinaloa State, Mexico" for Vizsla Silver Corp. Dated: March 10, 2023, and with an Effective Date: January 19, 2023. (Posted on SEDAR+ under Vizsla's profile).
-
The Property was the subject of a NI 43-101 technical report by Tim Maunula, P.Geo. and Kevin Murray, P.Eng. in 2022 titled "National Instrument 43-101 Technical Report for the Panuco Project Mineral Resource Estimate, Concordia, Sinaloa, Mexico" for Vizsla Silver Corp. Dated: April 7, 2022 and with an Effective Date: March 1, 2022. (Posted on SEDAR+ under Vizsla's profile).
-
The Property was the subject of a NI 43-101 technical report by Stewart Harris, P.Geo. in 2020 titled "Technical Report On The Panuco Silver-Gold Project Concordia, Sinaloa, Mexico" Vizsla Resources Corp. Dated: June 15, 2020, with an Amended Effective Date: June 15, 2020. (Posted on SEDAR+ under Vizsla's profile).
- The Property was the subject of a NI 43-101 technical report by M. Robinson, M.A.Sc., P.Eng. in 2019 titled "Technical Report On The Panuco-Copala Project Concordia, Sinaloa, Mexico" Vizsla Resources Corp. Dated: November 6, 2019, with an Effective Date: October 22, 2019. (Posted on SEDAR+ under Vizsla's profile).
Information regarding the Property accessibility, climate, local resources, infrastructure, and physiography, exploration history, previous mineral resource estimates, regional property geology, deposit type, recent exploration and drilling, metallurgical test work, and sample preparation, analyses, and security for previous drill programs (Sections 5-13) have been sourced from the recent internal technical reports and updated where required. The Authors believe the information used to prepare the current Technical Report is valid and appropriate considering the status of the Project and the purpose of the Technical Report.
2.2 Site Visit
2.2.1 2023 Site Visits
Armitage conducted a site visit to the Project on May 29, 2023, accompanied by Martin Dupuis, COO, Jesus Velador, VP of Exploration and Steve Mancell, Director of Mineral Resources, of Vizsla Silver. During the site visit, Armitage inspected the core logging and core sampling facilities and core storage areas in the City of Concordia. The following facilities were inspected:
-
Office Area
-
Area used for the geologists to log core.
-
Area used to make pictures of the core with controlled light (core both wet and dry)
-
Area used to measure density (by drying, measuring unwaxed weight, waxed weight and weight in water)
-
Area for cutting the core.
-
Area for sampling the core.
-
Area to update geological sections on paper.
-
Core storage area
During the site visit Armitage examined several selected mineralized core intervals from recently completed (2019-2022) diamond drill holes from the Property. Armitage examined accompanying drill logs and assay certificates and assays were examined against the drill core mineralized zones. The author reviewed current core sampling, QA/QC and core security procedures. Core boxes for drill holes reviewed are properly stored in the warehouse, easily accessible and well labelled. Sample tags are present in the boxes, and it was possible to validate sample numbers and confirm the presence of mineralization in witness half-core samples from the mineralized zones.
As drilling and core logging was in progress during the time of the site visit, Armitage had the opportunity to review and discuss the entire path of the drill core, from the drill rig to the logging and sampling facility and finally to the laboratory. Armitage is of the opinion that current protocols in place, as have been described and documented by Vizsla, is adequate.
The Author participated in a field tour of the Property area including visits to several outcrops to review the local Geology, the drill, and recent drill sites. All areas were easily accessible by road.
Armitage conducted a second site visit to the Project on November 6 to November 8, 2023, accompanied by Henri Gouin, Mining Engineer with SGS, and Martin Dupuis, Fernando Martínez, Director of Projects, Hernando Rueda, Country Manager and Steve Mancell, of Vizsla Silver. During the second site visit, Armitage again inspected the core logging and core sampling facilities and core storage areas in the City of Concordia.
Armitage examined several selected mineralized core intervals from recently completed (2023) diamond drill holes from the Property. Armitage examined accompanying drill logs and assay certificates and assays were examined against the drill core mineralized zones. The author reviewed current core sampling, QA/QC and core security procedures. Core boxes for drill holes reviewed are properly stored in the warehouse, easily accessible and well labelled. Sample tags are present in the boxes, and it was possible to validate sample numbers and confirm the presence of mineralization in witness half-core samples from the mineralized zones.
As drilling and core logging was in progress during the time of the second site visit, Armitage had the opportunity to review and discuss the entire path of the drill core, from the drill rig to the logging and sampling facility and finally to the laboratory. Armitage is of the opinion that current protocols in place, as have been described and documented by Vizsla, is adequate.
The Author participated in a field tour of the Property area including visits to several outcrops to review the local Geology, the drill, and recent (2023) drill sites.
As a result of the two site visits, Armitage was able to become familiar with conditions on the Property. Armitage was able to observe and gain an understanding of the geology and various styles mineralization, which helped guide the current mineral resource modeling, was able to verify the work done and, on that basis, can review and recommend to Vizsla an appropriate exploration program.
Armitage considers the site visit completed in November 2023 as current, per Section 6.2 of NI 43-101CP. To the Authors knowledge there is no new material scientific or technical information about the Property since that personal inspection. The technical report contains all material information about the Property.
2.3 Units of Measure
Units used in the report are metric units unless otherwise noted. Monetary units are in United States dollars (US$) unless otherwise stated.
2.4 Effective Date
The Effective Date of the current MRE is September 1, 2023.
2.5 Units and Abbreviations
All units of measurement used in this technical report are in metric. All currency is in US dollars (US$), unless otherwise noted.
Table 2-1 List of Abbreviations
| $ |
Dollar sign |
m2 |
Square metres |
| % |
Percent sign |
m3 |
Cubic meters |
| ° |
Degree |
masl |
Metres above sea level |
| °C |
Degree Celsius |
mm |
millimetre |
| °F |
Degree Fahrenheit |
mm2 |
square millimetre |
| µm |
micron |
mm3 |
cubic millimetre |
| AA |
Atomic absorption |
Moz |
Million troy ounces |
| Ag |
Silver |
MRE |
Mineral Resource Estimate |
| AgEq |
Silver equivalent |
Mt |
Million tonnes |
| Au |
Gold |
NAD 83 |
North American Datum of 1983 |
| Az |
Azimuth |
mTW |
metres true width |
| CAD$ |
Canadian dollar |
NI |
National Instrument |
| CAF |
Cut and fill mining |
NN |
Nearest Neighbor |
| cm |
centimetre |
NQ |
Drill core size (4.8 cm in diameter) |
| cm2 |
square centimetre |
NSR |
Net smelter return |
| cm3 |
cubic centimetre |
oz |
Ounce |
| Cu |
Copper |
OK |
Ordinary kriging |
| DDH |
Diamond drill hole |
Pb |
Lead |
| ft |
Feet |
ppb |
Parts per billion |
| ft2 |
Square feet |
ppm |
Parts per million |
| ft3 |
Cubic feet |
QA |
Quality Assurance |
| g |
Grams |
QC |
Quality Control |
| GEMS |
Geovia GEMS 6.8.3 Desktop |
QP |
Qualified Person |
| g/t or gpt |
Grams per Tonne |
RC |
Reverse circulation drilling |
| GPS |
Global Positioning System |
RQD |
Rock quality designation |
| Ha |
Hectares |
SD |
Standard Deviation |
| HQ |
Drill core size (6.3 cm in diameter) |
SG |
Specific Gravity |
| ICP |
Induced coupled plasma |
SLS |
Sub-level stoping |
| ID2 |
Inverse distance weighting to the power of two |
t.oz |
Troy ounce (31.1035 grams) |
| ID3 |
Inverse distance weighting to the power of three |
Ton |
Short Ton |
| kg |
Kilograms |
Zn |
Zinc |
| km |
Kilometres |
Tonnes or T |
Metric tonnes |
| km2 |
Square kilometre |
TPM |
Total Platinum Minerals |
| kt |
Kilo tonnes |
US$ |
US Dollar |
| m |
Metres |
μm |
Micron |
| |
|
UTM |
Universal Transverse Mercator |
3 RELIANCE ON OTHER EXPERTS
Final verification of information concerning Property status and ownership, which are presented in Section 4 below, have been provided to the Author by Steve Mancell for Vizsla, by way of E-mail on January 16 and 17, 2024. The Author only reviewed the land tenure in a preliminary fashion and has not independently verified the legal status or ownership of the Property or any underlying agreements or obligations attached to ownership of the Property. However, the Author has no reason to doubt that the title situation is other than what is presented in this technical report (Section 4). The Author is not qualified to express any legal opinion with respect to Property titles or current ownership.
4 PROPERTY DESCRIPTION AND LOCATION
4.1 Location
The Panuco Project is in the Panuco-Copala mining district in the municipality of Concordia, southern Sinaloa state, along the western margin of the Sierra Madre Occidental physiographic province in western Mexico. The Project is centred at 23⁰ 25' north latitude and 105⁰ 56' west longitude on map sheets F13A-37. The Project location is shown in Figure 4-1.
4.2 Land Tenure and Mining Concessions
The Project comprises 117 approved mining concessions in nineteen blocks, covering a total area of 5,869.87 ha, and two mineral concessions covering 1,321.15 ha. The mineral concessions are held 100% by Vizsla Silver. The mineral concessions are presented in Figure 4-2 and Table 4-1. The concessions are valid for 50 years, provided semi-annual property tax payments are made in January and July each year and if minimum annual investment requirements are met, or if there is minimum annual production equal to the amount of the annual investment requirement. The concession owner may apply for a second 50-year term. Annual payments of 2.03 million Mexican Pesos were made in January of 2023 and 2.03 million Pesos were made in July of 2023 by Vizsla.
Figure 4-1 Property Location Map

Figure 4-2 Mining Concessions (WGS 84 UTM Zone 13N)

Table 4-1 Property Mineral Concessions held 100% By Vizsla
| Title Name |
Title Number |
Issue Date |
Expiry Date |
Area (ha) |
| San Carlos* |
151204 |
26-Mar-69 |
25-Mar-69 |
98 |
| Amp. a la Casualidad* |
153220 |
30-Jul-20 |
29-Jul-70 |
14 |
| La Esmeralda* |
158378 |
29-Mar-23 |
28-Mar-73 |
2.9728 |
| Mazatlan* |
158416 |
30-Mar-23 |
29-Mar-73 |
23.7804 |
| Clemens* |
165452 |
18-Oct-79 |
17-Oct-29 |
11.6195 |
| Nuevo Refugio III* |
187494 |
5-Jul-90 |
4-Jul-40 |
171.3344 |
| Amp. de San Carlos* |
189601 |
5-Dec-90 |
4-Dec-40 |
62.2643 |
| Cordon del Oro* |
191792 |
19-Dec-91 |
18-Dec-41 |
100 |
| Nuevo Refugio II* |
192134 |
19-Dec-91 |
18-Dec-41 |
49.7339 |
| Nuevo Refugio IV* |
195406 |
14-Sep-92 |
13-Sep-42 |
33 |
| Liliana* |
203370 |
19-Jul-96 |
18-Jul-46 |
12.7018 |
| Laura* |
205215 |
8-Jul-97 |
7-Jul-47 |
28 |
| San Carlos Dos* |
212112 |
29-Aug-00 |
30-Aug-50 |
16 |
| Ampl. Cordon del Oro* |
218164 |
11-Oct-02 |
10-Oct-52 |
117.631 |
| Title Name |
Title Number |
Issue Date |
Expiry Date |
Area (ha) |
| Nuevo Refugio I* |
220409 |
25-Jul-03 |
24-Jul-53 |
110.5006 |
| Nueva Argentita* |
221598 |
4-Mar-04 |
3-Mar-54 |
32.8499 |
| Nueva Argentita Fracc. I* |
221599 |
4-Mar-04 |
3-Mar-54 |
5.2532 |
| Cordon del Oro Sur* |
221995 |
27-Apr-04 |
26-Apr-54 |
96 |
| San Carlos Tres* |
221994 |
27-Apr-04 |
26-Apr-54 |
7.3847 |
| Nueva Sierrita* |
223402 |
10-Dec-04 |
9-Dec-54 |
96.3188 |
| Nuevo Remedios* |
223419 |
14-Dec-04 |
13-Dec-54 |
38.2786 |
| La Olvidada* |
223599 |
21-Jan-05 |
20-Jan-55 |
0.6176 |
| Nuevo Remedios Fracc. 1* |
223600 |
21-Jan-05 |
20-Jan-55 |
0.7091 |
| Nuevo Remedios Fracc. 2* |
223601 |
21-Jan-05 |
20-Jan-55 |
0.2533 |
| Nuevo Remedios Fracc. 3* |
223602 |
21-Jan-05 |
20-Jan-55 |
0.0667 |
| El Trece Sur* |
223675 |
2-Feb-05 |
1-Feb-55 |
330 |
| Ampl. La Reforma* |
211301 |
28-Apr-00 |
27-Apr-50 |
43.8826 |
| Fracc. Ampl. La Reforma* |
211302 |
28-Apr-00 |
27-Apr-50 |
13.3141 |
| La Providencia* |
213860 |
2-Jul-01 |
2-Jul-51 |
112.2468 |
| Dos en Uno* |
214169 |
9-Aug-01 |
9-Aug-51 |
43.1376 |
| Dos en Uno Fraccion* |
214170 |
9-Jul-01 |
9-Aug-51 |
94.8158 |
| La Esperanza* |
214099 |
9-Aug-01 |
9-Aug-51 |
42.6467 |
| La Sencilla* |
215960 |
1-Apr-02 |
1-Apr-52 |
80.723 |
| San Jose de la Plata* |
220134 |
12-Jun-03 |
11-Jun-53 |
701.4589 |
| San Jose del Refugio* |
220676 |
12-Sep-03 |
11-Sep-53 |
146.0569 |
| La Fortuna* |
223005 |
30-Sep-04 |
29-Sep-54 |
288.4859 |
| El Brillante* |
225120 |
22-Jul-05 |
21-Jul-55 |
9.9325 |
| El Brillante Fracc. 1 |
225121 |
22-Jul-05 |
21-Jul-55 |
0.3259 |
| 3 en 1* |
225149 |
26-Jul-05 |
25-Jul-55 |
9.677 |
| 3 en 1 Fracc. 1* |
225150 |
26-Jul-05 |
25-Jul-55 |
12.2476 |
| 3 en 1 Fracc. 2* |
225151 |
26-Jul-05 |
25-Jul-55 |
0.0786 |
| 3 en 1 Fracc. 3* |
225152 |
26-Jul-05 |
25-Jul-55 |
2.735 |
| Santa Rosa* |
225353 |
24-Aug-05 |
23-Aug-55 |
33.6247 |
| El Encino* |
226404 |
13-Jan-06 |
12-Jan-56 |
14.0066 |
| El Encino Fracc. 1* |
226405 |
13-Jan-06 |
12-Jan-56 |
0.9327 |
| Sta. Angela* |
228412 |
10-Nov-06 |
9-Nov-56 |
50 |
| Nueva Argentita Fracc. II* |
228634 |
15-Dec-06 |
14-Dec-56 |
0.5647 |
| El Coco |
231563 |
7-Mar-08 |
6-Mar-58 |
354.9912 |
| El Trece* |
232588 |
10-Sep-08 |
9-Sep-58 |
265.9922 |
| Carlos IV* |
232777 |
21-Oct-08 |
20-Oct-58 |
11.3962 |
| La Guasima |
234647 |
24-Jul-09 |
23-Jul-59 |
24.3958 |
| Unificacion Refugio* |
224409 |
4-May-05 |
3-May-55 |
39.9221 |
| Guayanera* |
224507 |
17-May-05 |
16-May-55 |
19.3092 |
| Nueva Reforma* |
225075 |
12-Jul-05 |
11-Jul-55 |
18.9332 |
| La Guasimita* |
236389 |
18-Jun-10 |
17-Oct-60 |
16.9601 |
| Purpura |
236551 |
9-Jul-10 |
8-Jul-60 |
0.6882 |
| Title Name |
Title Number |
Issue Date |
Expiry Date |
Area (ha) |
| Purpura Fraccion II |
236553 |
9-Jul-10 |
8-Jul-60 |
0.1966 |
| Purpura Fraccion I |
236552 |
9-Jul-10 |
8-Jul-60 |
0.5832 |
| El Tesoro |
237106 |
29-Oct-10 |
28-Oct-60 |
6.5443 |
| Ariana |
241544 |
19-Dec-12 |
18-Dec-62 |
5.0017 |
| Minillas* |
242946 |
2-Apr-14 |
1-Apr-64 |
86.7828 |
| Panuco Num. Dos |
172867 |
29-Jun-84 |
28-Jun-34 |
71.9225 |
| Panuco Numero Tres |
172852 |
29-Jun-84 |
28-Jun-34 |
99.861 |
| Panuco No. 4 |
172844 |
29-Jun-84 |
28-Jun-34 |
90.6725 |
| Panuco No. 5 |
172841 |
29-Jun-84 |
28-Jun-34 |
100 |
| Panuco Seis |
172866 |
29-Jun-84 |
28-Jun-34 |
20 |
| San Jose de Panuco |
172847 |
29-Jun-84 |
28-Jun-34 |
77 |
| Nueva Sorpresa |
172846 |
29-Jun-84 |
28-Jun-34 |
14 |
| El Siglo |
172848 |
29-Jun-84 |
28-Jun-34 |
16 |
| Nueva Constancia |
172850 |
29-Jun-84 |
28-Jun-34 |
47.8548 |
| San Francisco |
172853 |
29-Jun-84 |
28-Jun-34 |
40 |
| San Jorge |
172868 |
29-Jun-84 |
28-Jun-34 |
84 |
| Nueva Luisa |
172845 |
29-Jun-84 |
28-Jun-34 |
50 |
| La Bomba |
172842 |
29-Jun-84 |
28-Jun-34 |
8 |
| Luz |
209797 |
9-Aug-99 |
8-Aug-49 |
19.9682 |
| La Angelita |
172869 |
29-Jun-84 |
28-Jun-34 |
1.5 |
| Patricia |
172872 |
29-Jun-84 |
28-Jun-34 |
28.1437 |
| Alma Rosa |
172873 |
29-Jun-84 |
28-Jun-34 |
13.6864 |
| Santa Elena lll |
172851 |
29-Jun-84 |
28-Jun-34 |
9 |
| Los Remedios |
172843 |
29-Jun-84 |
28-Jun-34 |
30 |
| Montana 3 |
172870 |
29-Jun-84 |
28-Jun-34 |
28.5563 |
| Montana 4 |
180372 |
24-Mar-87 |
24-Mar-37 |
9.172 |
| Montana 5 |
172876 |
29-Jun-84 |
28-Jun-34 |
0.4159 |
| Montana 6 |
172875 |
29-Jun-84 |
28-Jun-34 |
3.786 |
| Montana 7 |
172871 |
29-Jun-84 |
28-Jun-34 |
10.0165 |
| La Galeana |
218529 |
5-Nov-02 |
4-Nov-52 |
20 |
| La Galeana lV |
236390 |
18-Jun-10 |
17-Jun-60 |
27.3181 |
| La Fortuna |
221292 |
20-Jan-04 |
19-Jan-54 |
26.1068 |
| La Fortuna Fraccion |
221293 |
20-Jan-04 |
19-Jan-54 |
1.9765 |
| San Dimas ll |
217636 |
6-Aug-02 |
5-Aug-52 |
80 |
| El Nacaral |
157062 |
21-Jun-22 |
20-Jun-72 |
20 |
| Diego |
238129 |
29-Jul-11 |
28-Jul-61 |
9 |
| El Mojocuan 2 |
240508 |
12-Jun-12 |
11-Jun-62 |
19.6224 |
| Nueva Santa Rosa |
165454 |
18-Oct-79 |
17-Oct-29 |
37.8867 |
| Oro Fino |
165455 |
18-Oct-79 |
19-Oct-29 |
8 |
| Sandra |
209591 |
3-Aug-99 |
2-Aug-49 |
23.4924 |
| Diego l |
246778 |
23-Nov-18 |
22-Nov-68 |
19.5869 |
| Los Cristos |
243378 |
12-Sep-14 |
11-Sep-64 |
11.424 |
| Title Name |
Title Number |
Issue Date |
Expiry Date |
Area (ha) |
| La Galeana ll |
229457 |
24-Apr-07 |
23-Apr-57 |
41.935 |
| Napoleon |
172874 |
29-Jun-84 |
28-Jun-84 |
6 |
| Nuevo San Dimas |
193647 |
19-Dec-91 |
18-Dec-41 |
11 |
| Constancia Dos |
172849 |
29-Jun-84 |
28-Jun-34 |
22.014 |
| Constancia Uno |
183577 |
17-Nov-88 |
16-Nov-38 |
12.234 |
| Mojocuan 22 |
222623 |
30-Jun-04 |
30-Jun-54 |
4.591 |
| El Lucero |
226834 |
3-Oct-06 |
3-Oct-56 |
145.3505 |
| San Antonio |
165456 |
18-Oct-79 |
17-Oct-29 |
7.2862 |
| La Cruz Negra |
203895 |
26-Nov-96 |
25-Nov-46 |
11.3079 |
| La Cruz Negra 2 |
244858 |
16-Feb-16 |
15-Feb-66 |
3.444 |
| Maria Chuchena |
243075 |
30-May-14 |
29-May-64 |
54.9574 |
| Los Compadres |
184684 |
22-Nov-89 |
20-Nov-39 |
36.90 |
| Jesusita |
195136 |
25-Aug-92 |
24-Aug-42 |
5.2081 |
| Nuestra Señora del Rosario |
223582 |
18-Jan-05 |
17-Jan-55 |
21.679 |
| El Oregano |
224762 |
7-Jun-05 |
6-Jun-55 |
20.50 |
| El Oregano 2 |
231966 |
23-May-08 |
22-May-58 |
129.19 |
| Panuco Num Uno |
185871 |
14-Dec-89 |
13-Dec-39 |
85.81 |
| Santa Lucia |
211013 |
15-Mar-00 |
14-Mar-50 |
27.00 |
| Santa Maria |
223583 |
18-Jan-05 |
17-Jan-55 |
33.6334 |
| Sub-Total: Mining Concessions |
|
|
|
5,869.87 |
| Libertad (Pending) |
E-095-15204 |
|
|
633 |
| La Galeana III (Pending) |
E-095-12796 |
|
|
688.1488 |
| Sub-Total: Mineral Concessions |
|
|
|
1,321.15 |
| Total |
|
|
|
7,191.02 |
*Concession has 3% NSR to Compania Minera Bacis, S.A. de C.V. Vizsla has the right to buy back 1.5% of the 3% NSR for $1,900,000 USD
4.3 Underlying Agreements
4.3.1 Canam Alpine Ventures Ltd.
On November 6, 2019, Vizsla Silver closed a share purchase agreement to purchase Canam Alpine Ventures Ltd. (Canam) for CAD$45,000 and 6.0 million common shares and 12.0 million common shares of Vizsla Silver on the occurrence of milestone events as follows:
- Milestone event 1: 6.5 million shares upon exercise of any defined options Milestone event 2: 5.5 million shares upon definition of a resource greater than 200,000 gold-equivalent ounces (AuEq oz)
The payment shares are subject to voluntary pooling restrictions, with 12.5% released each quarter.
Further, a finder's fee of 750,000 shares is payable by Vizsla Silver to Doug Seaton of Nakusp, British Columbia (B.C.) in the following increments:
-
250,000 shares on signing
-
250,000 shares upon the occurence of milestone event 1 as stated above.
-
250,000 shares the occurence of milestone event 2 as stated above.
4.3.2 Silverstone Resources S.A. de C.V.
On July 20, 2021, Vizsla Silver Corp announced that it had executed a binding option exercise notice ("Copala Exercise Notice") with Silverstone Resources. The executed agreement constituted accelerating and exercising the Company's option to acquire 100% of the Copala silver-gold district.
Upon closing of the transactions contemplated by the Copala Amending Agreement, Vizsla Silver acquired a 100% ownership interest in the Copala Property (comprising 64 mining concessions with a combined surface area of 5,547 ha) in consideration for:
-
A cash payment of US$9,500,000 was paid to Copala upon the completion of the transfer of the Copala Property on August 3, 2021 (paid); and
-
The issuance to Copala of 4,944,672 common shares of Vizsla Silver priced at C$2.44 per share upon the completion of the transfer of the Copala Property (issued).
4.3.3 Minera Rio Panuco S.A. de C.V.
On July 21, 2021, Vizsla Silver Corp. announced that it had signed an agreement with Minera Rio Panuco (MRP). Upon closing, Vizsla Silver acquired a 100% ownership interest in the Property (comprising 43 mining concessions with a combined surface area of 3,839 ha and the "El Coco" mill (the Mill) in consideration for:
-
A cash payment of US$4,250,000 was paid to MRP upon signing of the Amending Agreement
-
The issuance to MRP of 6,245,902 common shares of Vizsla Silver priced at C$2.44 per share (for a total value of US$12,000,000)
-
A cash payment of US$6,100,000 on February 1, 2022, following the refurbishment and transfer of ownership of the mill, which is to occur on January 31, 2022. US$250,000 was paid on August 19, 2021, and US$850,000 was paid on February 1, 2022, for the mineral claims around the Coco mill. US$5,000,000 was paid for the receipt of the mill in good standing.
4.3.4 Strategic Investment in Prismo Metals
On January 9, 2023, Vizsla closed a strategic investment into Prismo Metals Inc. (Prismo). Under the Strategic Investment, the Company acquired 1) a right of first refusal to purchase the Palos Verdes project from Prismo, and 2) 4,000,000 units of Prismo, for aggregate consideration of $2,000,000. The consideration for the Strategic Investment consisted of a cash payment of C$500,000 and 1,000,000 common shares of Vizsla. In connection with the Strategic Investment, Prismo and Vizsla formed a technical committee to pursue district-scale exploration of the Panuco silver-gold district.
4.3.5 Royalty Spin Out
On January 17, 2024, Vizsla announced its intention to spin out the shares of Vizsla Royalties Corp, a wholly owned subsidiary of Vizsla Silver, to the Company's shareholders. Vizsla Royalties currently holds, indirectly, a net smelter royalty (the "Royalty") on any potential future mineral production at Vizsla Silver's flagship, 100% owned Panuco silver-gold project located in Sinaloa, Mexico.
The Royalty consists of: (i) a 2.0% net smelter return royalty on certain unencumbered concessions comprising the Project; and (ii) a 0.5% net smelter return royalty on certain encumbered concessions comprising the Project, which have a pre-existing 3.0% net smelter return royalty (the "Underlying Royalty").
Vizsla Silver is also expected to: (i) transfer to Vizsla Royalties the right to purchase one-half of the 3% Underlying Royalty; (ii) grant Vizsla Royalties the right to acquire a royalty on any future projects acquired by Vizsla Silver in the 24-month period after completion of the Spinout, which right would automatically terminate upon a change of control of Vizsla Royalties or Vizsla Silver and (iii) make a cash injection into Vizsla Royalties.
4.4 Surface Rights
Most of the surface rights in the municipality of Concordia are owned by ejidos, which are areas of communal land used for agriculture. Community members individually farm designated parcels and collectively maintain communal holdings comprising the ejido. Ejidos are registered with Mexico's National Agrarian Registry (Registro Agrario Nacional).
Surface rights to most of the land underlying the Project area are owned by six ejidos (Figure 4‑3). Mining concession owners have the right to obtain the expropriation, temporary occupancy, or creation of land easements required to complete exploration and mining work, including the deposit of rock dumps, tailings, and slag. Both MRP and Silverstone have surface-access agreements. Material terms of the surface-access agreements are summarized below.
Figure 4-3 Location of Ejidos and Outline of Panuco Project
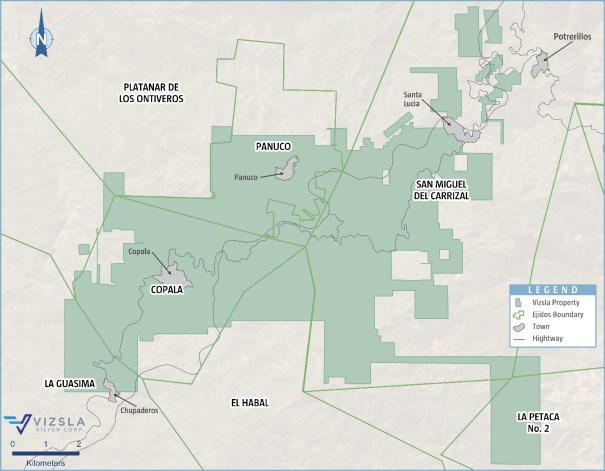
4.4.1 Canam and Ejido Panuco
A 30-year agreement was executed February 13, 2022, between Canam and Ejido Panuco with the right to an additional 30-year extension. The exploration, Mining and Operation activities are included in the occupancy agreement. The total area is 960.9653 hectares in the Ejido area with additional rights to extend areas for consideration per hectare.
4.4.2 Silverstone Resources S.A. de C.V., Canam, and Ejido Platanar de los Ontiveros
A 30-year agreement was executed January 22, 2023, between Canam and Ejido Platanar de los Ontiveros with the right to an additional 30-year extension. The exploration, Mining and Operation activities are included in the occupancy agreement. The total area is 500.00 hectares in the Ejido area with additional rights to extend areas for consideration per hectare.
4.4.3 Canam and Comunidad Copala
A 30-year term agreement with the right to an additional 30-year extension between Canam and Comunidad Copala with anticipated termination as convenient to Canam was established on December 12, 2021. The agreement outlines rights for Exploration, Mining, and Operation activities included in the occupancy agreement. The area is 1,942.3490 hectares out of 2,227.6341961 hectares of total Ejido area, with a right to extend the area as required by Canam with the same consideration per hectare.
4.4.4 Canam and El Habal Ejido
A 30-year agreement was executed on September 12, 2021, between Canam and El Habal Ejido with rights to an additional 30-year extension and anticipated termination as convenient to Canam. The rights are to Exploration, Mining and Operation activities. The area is 427.8756 hectares out of 4,395 hectares of total Ejido area, with a right to extend the area as required by Canam with the same consideration per hectare.
4.4.5 Short-Term Ejido Agreements
Vizsla has further agreements and ongoing negotiations with Ejido San Miguel Del Carrizal.
Since June 2020, the Ejido San Miguel Del Carrizal community has granted 2-month reoccurring land access for exploration. The access is to 19,973.9529 hectares of ejido lands where Vizsla owns mining concessions. There is no sign or evidence of any complication or negative outcome for such execution of the 2-month permits. An assembly for approval of the 30-year term agreement has been scheduled with the ejido authorities, and shall include exploration, and operation activities.
4.5 Permits
Exploration and mining activities in Mexico are regulated by the General Law of Ecological Equilibrium and Environmental Protection (Ley General de Equilibrio Ecologico y Proteccion al Ambiente [LGEEPA]), and the Regulations Environmental Impact Assessment [REIA]. Laws pertaining to mining and exploration activities are administered by SEMARNAT and the Federal Attorney for Environmental Protection (Procuraduria Federal de Proteccion al Ambiente [PROFEPA]) enforces SEMARNAT laws and policy.
Activities that exceed specified limits require authorization from SEMARNAT and comprise the presentation of an environmental impact assessment (Manifestación de Impacto Ambiental [MIA]). SEMARNAT authorizes activities that fall below the specified threshold under Article 31 of the LGEEPA and require the submission report known as an Informe Preventivo.
Exploration activities that are expected to generate impacts to the physical or social environment that are assessed as potentially of low significance by the regulators are regulated under Norma Oficial Mexicana-120-SEMARNAT-1997 (NOM-120-SEMARNAT-1997), and its subsequent modifications.
The Project is not included within any specially protected, federally designated, ecological zones known as Áreas Naturales Protegidas (ANP).
An Informe Preventivo is in force for the area of the Panuco ejido that permits drilling activities according with official notice DF/145/2.1. 1/0053/2020. 0060 dated January 21, 2020, issued by the Ministry of Environmental and Natural Resources to Minera Canam S.A. de C.V.
4.6 Environmental Considerations
The Panuco Project is within the Panuco-Copala mining district and has been subject to extensive historical mining since approximately 1565. The mineralized bodies and the enclosing host rocks are anomalous in base and precious metals and have generated elevated metal values in sediments that extend well beyond known workings. The mineralized veins are characteristically low or intermediate sulphidation but may have the potential for acid rock drainage (ARD) and subsequent metal leaching. Vizsla's Coco Mill and tailings storage facility are located on the Property; the mill is currently idle, and the associated tailings storage facility is at capacity. The El Arco (aka Manuel Hernández) and Santa Rosa plants are also located on the Property but are not under the control of Vizsla Silver. Other old mine workings, excavations, and dumps are on and adjacent to the Property. Some of the previously referenced disturbance is on mining lands held by Vizsla Silver, while others are on lands held by third parties.
Environmental impacts within the Project site result from historical activities and through current and intermittent operations of surrounding mines by third parties, and by informal and unauthorized miners working when companies are inactive. Under the Mexican environmental and regulatory system, these impacts due to historical activities are considered pre-existing environmental liabilities deemed not significant and acknowledged by regulators.
4.7 Other Relevant Factors
The Project has no outstanding environmental liabilities from prior mining activities. The Author is unaware of any other significant factors and risks that may affect access, title, or the right, or ability to perform exploration work recommended for the Property.
5 ACCESSIBILITY, CLIMATE, LOCAL RESOURCES, INFRASTRUCTURE, AND PHYSIOGRAPHY
5.1 Accessibility
The Panuco Project area is accessed from Mazatlán via Federal Highway 15 to Villa Union, then on Highway 40 for 56 km (one-hour drive) (Figure 4-1). Highway 40 crosscuts the Project area and most of the vein structures. Toll Highway 40D also crosses the Project. In addition, local dirt roads provide access to most of the workings, but some require repairs or are overgrown, and four-wheel-drive vehicles are recommended in the wet season.
5.2 Local Resources and Infrastructure
The Project is in the Concordia municipality, which has a population of approximately 27,000. Public services, including health clinics and police, are in the town of Concordia. Residents provide an experienced mine labour force. Contractors in Durango and Hermosillo have a strong mining tradition and provide the Project with a local source of knowledgeable labour and contract mining services. Drilling companies and mining contractors are available in Mazatlán, Durango, Hermosillo, Zacatecas, Fresnillo, and other areas of Mexico. The Project area is also used for cattle grazing, with limited agricultural use.
Two power lines connecting Durango and Mazatlán cross the Project, with 400 kV and 240 kV capacities.
Vizsla Silver owns the 500 tonnes per day Coco mill on its property. In addition, there are some mineral processing plants held by third parties in the district that range from 200 to 700 tonnes per day in capacity.
5.3 Climate
The climate is subtropical, with heavy rain in June through September. Summer temperatures reach 40°C, and the minimum winter temperature is approximately 10°C. The average rainfall is around 1,100 millimetres (mm), with the majority falling in the June to September rainy season. The area has sufficient water for exploration and mining purposes. Work on the Property, including drilling, can be conducted year-round.
5.4 Physiography
The Project area is in the Barranca sub-province of the Sierra Madre Occidental Physiographic province; mountain ranges characterize the province's topography up to 1,640 m, cut by steep gorges. Historic mine workings and mineralized structures on the Project generally occur between 500 and 1,000 m above sea level (asl). The principal drainages are the northerly trending Rio Baluarte east of the Property and the northeasterly trending Rio Presidio to the north. Dendritic intermittent streams feed the rivers. Project vegetation is mainly dry tropical forest comprising tropical bushes and shrubs at lower elevations and oak and pine forest at higher elevations.
5.5 Vegetation and Wildlife
Most of the vegetation in the Project area is classified as "selva baja caducifolia", which is characterized mainly by trees less than 15 meters tall. Typical plant species include tepemezquite, ebano, tepehuaje, huanacaxtle, berraco, amapa, apomo, cedro, nacario and garabato. At higher elevations, the temperatures are cooler, and vegetation is characterized as "bosque templado" (temperate forest). Plants typical of the higher areas are encino, madroño, chicle, palo cuate, arrancillo, vainillo, maguey and guasima. Animals in the Project area include jaguars, squirrels, rabbits, coyotes, rats, foxes, deer, bats, tejónes, guacamayas, rattlesnakes and iguanas.
6 HISTORY
Capitan Francisco de Ibarra founded Concordia in 1565, and gold and silver veins in Panuco and Copala were first exploited in the centuries that followed, Sim (2008) and Robinson (2019). Although production has been carried out on the Panuco Project over the last 460 years, no production records are available to Vizsla.
The first recorded modern mining activity commenced late in the 20th century. The Mineral Resources Council (Consejo de Recursos Minerales [CRM], the predecessor of the Mexican Geological Service [SGM]) carried out 1:50,000 scale mapping on map sheet F13-A37 and fine-fraction stream sediment sampling in 1999 (Avila-Ramirez, 1999). In 2003, the CRM published additional 1:50,000 scale mapping on map sheet F13-A36, and fine-fraction stream sediment sampling (Polanco-Salas et al., 2003). In 2019 the SGM conducted 1:50,000 scale geological mapping and fine-fraction stream sediment sampling on map sheet F13-A46 (Rosendo-Brito et al., 2019).
In 1989 the CRM optioned and sold several mineral concessions in the district, including to Grupo Minera Bacis (Bacis) in 1989. Bacis subsequently acquired claims from other parties active in the area, including Minas del Oro y del Refugio S.A. de C.V. Bacis drilled 19 holes totalling 2,822.8 m along the Animas-Refugio corridor, but only collar and survey records exist of this work.
From 1999 to 2001, Minera Rio Panuco S.A. de C.V. (Rio Panuco) explored the Animas-Refugio and Cordon del Oro structures culminating in 45 holes, for 8,358.6 m. No geological drill logs, downhole survey data, downhole sample data or downhole geochemical assay data have been preserved. Graphic drill-hole sections are available, with limited downhole geology and geochemical data. The Rio Panuco drill data cannot be relied upon, as material data are unavailable for hole deviation, core recovery, assaying, or quality assurance/quality control (QA/QC).
Capstone Mining Corp. (Capstone) optioned the Bacis concessions in 2004 and carried out geologic mapping and sampling of the Animas-Refugio and Cordon del Oro structures. In 2005, Capstone drilled 15,374 m in 131 holes on down-dip extensions of the Clemens and El Muerto mines on the Animas-Refugio vein. In 2007, Capstone explored the La Colorada structure with surface mapping and sampling followed by 6,659 m of drilling in 64 holes.
Also, in 2007, Capstone transferred the claims of the Copala, Claudia, Promontorio, Montoros, and Martha projects to Silverstone Corp. (Silverstone). Capstone and Silverstone completed 21,641 m of drilling in 200 holes from 2005 to 2008 (Christopher and Sim, 2008).
Christopher and Sim (2008) prepared two Mineral Resource estimates on the property for Silverstone on October 16, 2008. The Mineral Resource estimates were prepared for the La Colorada vein-manto and the La Pipa, El Muerto and Clemens portions of the Animas-Refugio Vein.
Silverstone merged with Silver Wheaton Ltd. (Silver Wheaton) in 2009 and Silver Wheaton subsequently sold the shares of concession owner Silverstone to Mexican owners. The Silverstone owners mined out a portion of the Mineral Resource defined in 2008 over the next decade. Silverstone mined parts of the Clemens, El Muerto, La Pipa, Mariposa, El 40, and San Martin ore shoots until mining encountered the water table, preventing further mining. Local unauthorized miners are currently extracting the pillars in those ore shoots. Silverstone or unauthorized mining activity in the intervening years exploited most of the Mineral Resources estimated by Christopher and Sim (2008).
MRP contracted Geophysical Surveys S.A. de C.V. of Mexico City in 2016 to conduct an airborne magnetics survey. However, no data are available, and no survey or flight specifications are included in the report. The survey was flown in two blocks.
In 2019, Silverstone and MRP optioned their mineral concessions to Canam.
6.1 Previous Mineral Resource Estimates
6.2 Maiden Mineral Resource Estimate, March 2022
On March 1, 2022, Vizsla announced a maiden MRE for the Property. The MRE was based on a total drill database of 445 holes (124,915 meters) completed by Vizsla between November 2019 and December 2021. The independent Qualified Person for the Resource Estimate is Tim Maunula, P.Geo. Principal, T. Maunula & Associates Consulting Inc. (Maunula and Murray, 2022). The MRE was reported at a base case cut-off grade 150 g/t AgEq and has an effective date of March 1, 2022 (Table 6-1 to Table 6-3).
The 2022 Maiden MRE was superseded by the updated MRE presented below and subsequently superseded by the MRE presented in Section 14.
Highlights of the Maiden Resource Estimate:
-
Indicated Mineral Resources are estimated at 5.0 million tonnes ("Mt") grading 191 grams per tonne ("g/t") silver, 2.08 g/t gold, 0.26% lead, and 0.50% zinc (383 g/t silver equivalent("AgEq")). The Resource Estimate includes indicated resources of 30.5 million ounces ("Moz") of silver, 331.1 thousand ounces ("koz") of gold, 13 kilo tonnes ("kt") of lead, and 24.6 kt of zinc (61.1 Moz AgEq).
-
Inferred Mineral Resources are estimated at 4.1 Mt grading 187 g/t silver, 1.79 g/t gold, 0.13% lead, and 0.30% zinc (345 g/t AgEq). The Resource Estimate includes inferred resource of 24.7 Moz of silver, 235.8 koz of gold, 5.3 kt of lead, and 12.4 kt of zinc (45.6 Moz AgEq).
Note: AgEq = Capped Ag ppm + (((Capped Au ppm x Au price/gram) + (Capped Pb% x Pb price/t) + (Capped Zn% x Zn price/t))/Ag price/gram). Metal price assumptions are $20.70/oz silver, $1,655/oz gold, $1,902/t lead, $2,505/t zinc.
MRE Notes:
-
The Resource Estimate encompasses a total of 13 sub-vertical precious metals rich domains each defined by individual wireframes with a minimum true thickness of 2.0 m for Napoleon (2 wireframes) and Tajitos (3 wireframes), and 1.5 m thickness for the six other structures (8 wireframes).
-
Samples were composited within the mineralized domains into 1.50 m length composites.
-
High grade capping was done on composite data and established using a statistical analysis on a per-zone basis for silver, gold, lead, and zinc.
-
Cut-off grade of 150 g/t AgEq was used based on costs from mines with similar mineralization Assumed costs $45 mining, $30/tonne processing $20/tonnes G&A and recoveries of 93% for silver, 90% for gold, 94% for both lead and zinc.
-
Average density values were assigned per zone based on 256 samples analysed by ALS in Zacatecas, Mexico and ranged from 2.55 to 2.64.
-
Inverse Distance Squared (ID2) interpolation was utilized at for all structures. All estimates are based on a block dimension of 2 m * 10 m * 5 m and estimation search parameters determined by variography.
-
The Resource Estimate is categorized into indicated and inferred categories as follows:
-
The Indicated mineral resource category is defined by areas where drill spacing is generally less than 50 m, blocks are informed by a minimum of two drill holes, and reasonable geological and grade continuity is shown. Copala, Tajitos HW, Rosarito and San Antonio veins defined Indicated mineral resource based on drill spacing less than 30 m.
-
The Inferred mineral resource category is defined by areas where drill spacing is less than 100 m, blocks are informed by a minimum of two drill holes, and reasonable, but not verified, geological and grade continuity is observed. Copala, Tajitos HW, Rosarito and San Antonio veins defined Inferred mineral resource based on drill spacing less than 60 m.
- The Inferred Mineral Resource in this estimate has a lower level of confidence than that applied to an Indicated Mineral Resource and must not be converted to a Mineral Reserve. It is reasonably expected that the Inferred Mineral Resource could be upgraded to an Indicated Mineral Resource with continued exploration.
Table 6-1 2022 Panuco Mineral Resource Estimate Summary by Resource
Classification (150 g/t AgEq Cut-Off Grade), March 1, 2022 (Maunula and Murray, 2022)
| Classification |
Tonnes
(Mt) |
Average Grade |
Contained Metal |
Ag
(g/t) |
Au
(g/t) |
Pb
(%) |
Zn
(%) |
AgEq
(g/t) |
Ag
(koz) |
Au
(koz) |
Pb
(kt) |
Zn
(kt) |
AgEq
(koz) |
| Indicated |
5.0 |
191 |
2.08 |
0.26 |
0.50 |
383 |
30,501 |
331.1 |
13.0 |
24.6 |
61,137 |
| Inferred |
4.1 |
187 |
1.79 |
0.13 |
0.30 |
345 |
24,704 |
235.8 |
5.3 |
12.4 |
45,555 |
Table 6-2 Panuco Mineral Resource Estimate Summary by Vein (150 g/t AgEq Cut-Off
Grade), March 1, 2022 (Maunula and Murray, 2022)
| Classification |
Tonnes
(Mt) |
Average Grade |
Contained Metal |
Ag
(g/t) |
Au
(g/t) |
Pb
(%) |
Zn
(%) |
AgEq
(g/t) |
Ag
(koz) |
Au
(koz) |
Pb
(kt) |
Zn
(kt) |
AgEq
(koz) |
| Indicated |
|
|
|
|
|
|
|
|
|
|
|
| Napoleon |
2.5 |
144 |
2.41 |
0.39 |
0.68 |
373 |
11,612 |
194.4 |
9.7 |
17.2 |
30,126 |
| *Includes Gallinero |
0.6 |
278 |
4.19 |
0.40 |
0.63 |
648 |
5,708 |
86.0 |
2.6 |
4.0 |
13,307 |
| Josephine |
0.2 |
194 |
2.16 |
0.29 |
0.71 |
402 |
1,440 |
16.0 |
0.7 |
1.6 |
2,983 |
| Napoleon HW |
0.4 |
131 |
1.17 |
0.19 |
0.49 |
249 |
1,585 |
14.2 |
0.7 |
1.8 |
3,007 |
| NP Area Total |
3.1 |
146 |
2.24 |
0.36 |
0.66 |
360 |
14,637 |
224.6 |
11.1 |
20.6 |
36,116 |
| Tajitos |
1.1 |
289 |
1.77 |
0.12 |
0.23 |
443 |
9,766 |
59.8 |
1.3 |
2.5 |
14,963 |
| Copala |
0.4 |
285 |
2.16 |
0.04 |
0.08 |
461 |
3,936 |
29.9 |
0.2 |
0.3 |
6,379 |
| Tajitos Vein 3 |
0.2 |
251 |
1.65 |
0.09 |
0.23 |
395 |
1,770 |
11.6 |
0.2 |
0.5 |
2,777 |
| TJ Area Total |
1.7 |
283 |
1.85 |
0.09 |
0.19 |
441 |
15,472 |
101.3 |
1.6 |
3.3 |
24,120 |
| Rosarito |
0.1 |
75 |
1.13 |
0.19 |
0.54 |
191 |
281 |
4.3 |
0.2 |
0.6 |
719 |
| San Antonio |
0.0 |
128 |
1.01 |
0.01 |
0.02 |
210 |
111 |
0.9 |
0.0 |
0.0 |
183 |
| Total Indicated |
5.0 |
191 |
2.08 |
0.26 |
0.50 |
383 |
30,501 |
331.1 |
13.0 |
24.6 |
61,137 |
| Inferred |
|
|
|
|
|
|
|
|
|
|
|
| Napoleon |
0.9 |
91 |
2.29 |
0.23 |
0.50 |
300 |
2,750 |
69.3 |
2.2 |
4.7 |
9,066 |
| Josephine |
0.2 |
235 |
2.34 |
0.30 |
0.71 |
457 |
1,803 |
17.9 |
0.7 |
1.7 |
3,501 |
| Napoleon HW |
0.6 |
110 |
1.21 |
0.17 |
0.45 |
228 |
1,990 |
21.7 |
0.9 |
2.5 |
4,120 |
| NP Area Total |
1.7 |
117 |
1.95 |
0.22 |
0.51 |
298 |
6,543 |
108.9 |
3.9 |
8.9 |
16,687 |
| Tajitos |
0.6 |
234 |
1.40 |
0.12 |
0.25 |
359 |
4,409 |
26.4 |
0.7 |
1.5 |
6,761 |
| Copala |
1.4 |
259 |
1.89 |
0.03 |
0.07 |
414 |
11,651 |
84.8 |
0.4 |
1.0 |
18,593 |
| Tajitos HW3 |
0.3 |
208 |
1.39 |
0.07 |
0.21 |
329 |
1,764 |
11.8 |
0.2 |
0.6 |
2,788 |
| TJ Area Total |
2.2 |
247 |
1.70 |
0.06 |
0.14 |
390 |
17,824 |
122.9 |
1.3 |
3.0 |
28,142 |
| Classification |
Tonnes
(Mt) |
Average Grade |
Contained Metal |
Ag
(g/t) |
Au
(g/t) |
Pb
(%) |
Zn
(%) |
AgEq
(g/t) |
Ag
(koz) |
Au
(koz) |
Pb
(kt) |
Zn
(kt) |
AgEq
(koz) |
| Rosarito |
0.1 |
78 |
1.06 |
0.18 |
0.52 |
188 |
230 |
3.1 |
0.2 |
0.5 |
553 |
| San Antonio |
0.0 |
115 |
0.87 |
0.01 |
0.03 |
186 |
107 |
0.8 |
0.0 |
0.0 |
173 |
| Total Inferred |
4.1 |
187 |
1.79 |
0.13 |
0.30 |
345 |
24,704 |
235.8 |
5.3 |
12.4 |
45,555 |
Table 6-3 Cut-Off Grade Sensitivity (AgEq Cut-Off Grade), March 1, 2022 (Maunula
and Murray, 2022)
Classification
Cut-off Grade AgEq |
Tonnes
(Mt) |
Average Grade |
Contained Metal |
Ag
(g/t) |
Au
(g/t) |
Pb
(%) |
Zn
(%) |
AgEq
(g/t) |
Ag
(koz) |
Au
(koz) |
Pb
(kt) |
Zn
(kt) |
AgEq
(koz) |
| Indicated |
|
|
|
|
|
|
|
|
|
|
|
| >=300 ppm |
2.2 |
305 |
3.28 |
0.27 |
0.49 |
594 |
22,068 |
237.2 |
6.1 |
11.0 |
42,927 |
| >=250 ppm |
2.8 |
273 |
2.94 |
0.27 |
0.49 |
535 |
24,232 |
260.4 |
7.5 |
13.6 |
47,394 |
| >=200 ppm |
3.7 |
232 |
2.50 |
0.27 |
0.49 |
458 |
27,253 |
294.2 |
9.8 |
18.0 |
53,848 |
| >=150 ppm |
5.0 |
191 |
2.08 |
0.26 |
0.50 |
383 |
30,502 |
331.1 |
13.0 |
24.6 |
61,138 |
| >100 ppm |
6.9 |
153 |
1.65 |
0.24 |
0.49 |
310 |
33,938 |
365.8 |
16.8 |
33.5 |
68,785 |
| Inferred |
|
|
|
|
|
|
|
|
|
|
|
| >=300 ppm |
1.7 |
296 |
2.78 |
0.13 |
0.30 |
533 |
16,464 |
154.6 |
2.3 |
5.2 |
29,661 |
| >=250 ppm |
2.1 |
272 |
2.54 |
0.13 |
0.30 |
490 |
18,142 |
169.1 |
2.7 |
6.2 |
32,661 |
| >=200 ppm |
3.0 |
226 |
2.13 |
0.13 |
0.29 |
411 |
21,473 |
202.2 |
3.8 |
8.7 |
39,036 |
| >=150 ppm |
4.1 |
187 |
1.79 |
0.13 |
0.30 |
345 |
24,704 |
235.8 |
5.3 |
12.4 |
45,609 |
| >100 ppm |
5.8 |
150 |
1.43 |
0.13 |
0.31 |
280 |
28,076 |
268.1 |
7.8 |
18.0 |
52,415 |
(1) Values in these tables reported above and below the base-case cut-off 150 g/t AgEq for underground Mineral Resources should not be misconstrued with a Mineral Resource Statement. The values are only presented to show the sensitivity of the block model estimates to the selection of the base case cut-off grade.
6.3 Updated Mineral Resource Estimate, January 2023
On January 24, 2023, Vizsla announced an updated MRE for the Property. The updated MRE was based on a total of 644 drill holes for 202,709 m of drilling completed by Vizsla between November 2019 and September 2022. The independent Qualified Person for the 2023 updated MRE was Allan Armitage of SGS Geological Services. (Armitage et al., 2023). The MRE was reported at a base case cut-off grade 150 g/t AgEq and has an effective date of January 12, 2023 (Table 6-4 to Table 6-5).
The 2023 updated MRE is superseded by the MRE presented in Section 14.
Highlights of the Maiden Resource Estimate:
-
Indicated Mineral Resources are estimated at 7.5 million tonnes ("Mt") grading 243 grams per tonne ("g/t") silver, 2.12 g/t gold, 0.23% lead, and 0.71% zinc (437 g/t silver equivalent ("AgEq")). The Updated Mineral Resource Estimate includes indicated mineral resources of 58.3 million ounces ("Moz") of silver, 508 thousand ounces ("koz") of gold, 17.0 kilo tonnes ("kt") of lead, and 53.3 kt of zinc (104.8 Moz AgEq).
-
Inferred Mineral Resources are estimated at 7.2 Mt grading 304 g/t silver, 2.14 g/t gold, 0.19% lead, and 0.54% zinc (491 g/t AgEq). The Updated Mineral Resource Estimate includes inferred mineral resources of 70.7 Moz of silver, 496 koz of gold, 13.6 kt of lead, and 39.3 kt of zinc (114.1 Moz AgEq).
Table 6-4 Panuco Project Mineral Resource Estimate, January 19, 2023
| Classification |
Tonnes |
Average Grade |
Contained Metal |
| Ag |
Au |
Pb |
Zn |
AgEq |
Ag |
Au |
Pb |
Zn |
AgEq |
| (Mt) |
(g/t) |
(g/t) |
(%) |
(%) |
(g/t) |
(koz) |
(koz) |
(kt) |
(kt) |
(koz) |
| Updated Mineral Resource Estimate1 |
| Indicated |
7.5 |
243 |
2.12 |
0.23 |
0.71 |
437 |
58,330 |
508 |
17.0 |
53.3 |
104,793 |
| Inferred |
7.2 |
304 |
2.14 |
0.19 |
0.54 |
491 |
70,672 |
496 |
13.6 |
39.3 |
114,113 |
(1) AgEq = Ag ppm + (((Au ppm x Au price/gram) + (Pb% x Pb price/t) + (Zn% x Zn price/t))/Ag price/gram) with price assumptions of $24.00/oz Ag, $1800/oz Au, $1.10/lb Pb and $1.35/lb Zn
Table 6-5 Panuco Project Mineral Resource Estimate by Zone, January 19, 2023
| Classification |
Tonnes |
Average Grade |
Contained Metal |
| Ag |
Au |
Pb |
Zn |
AgEq |
Au Eq |
Ag |
Au |
Pb |
Zn |
AgEq |
AuEq |
| (Mt) |
(g/t) |
(g/t) |
(%) |
(%) |
(g/t) |
(g/t) |
(koz) |
(koz) |
(kt) |
(kt) |
(koz) |
(koz) |
| Indicated |
| Napoleon |
3.3 |
135 |
1.99 |
0.41 |
1.39 |
351 |
4.68 |
14,186 |
209 |
13.5 |
45.2 |
36,814 |
491 |
| Napoleon HW |
0.3 |
151 |
1.45 |
0.22 |
0.79 |
298 |
3.97 |
1,407 |
14 |
0.6 |
2.3 |
2,767 |
37 |
| Josephine |
0.1 |
179 |
5.13 |
0.33 |
0.94 |
610 |
8.13 |
519 |
15 |
0.3 |
0.8 |
1,766 |
24 |
| NP Area Total |
3.6 |
138 |
2.02 |
0.40 |
1.33 |
353 |
4.71 |
16,112 |
237 |
14.4 |
48.3 |
41,347 |
551 |
| Copala |
3.1 |
343 |
2.22 |
0.06 |
0.12 |
516 |
6.88 |
33,999 |
220 |
1.9 |
3.6 |
51,106 |
681 |
| Tajitos |
0.6 |
329 |
2.09 |
0.10 |
0.17 |
496 |
6.62 |
6,197 |
39 |
0.6 |
1.0 |
9,337 |
124 |
| Cristiano |
0.2 |
414 |
2.54 |
0.08 |
0.19 |
614 |
8.19 |
2,022 |
12 |
0.1 |
0.3 |
3,003 |
40 |
| Copala Area Total |
3.8 |
344 |
2.21 |
0.07 |
0.13 |
517 |
6.89 |
42,218 |
271 |
2.6 |
4.9 |
63,446 |
846 |
| Total Indicated |
7.5 |
243 |
2.12 |
0.23 |
0.71 |
437 |
5.83 |
58,330 |
508 |
17.0 |
53.3 |
104,793 |
1,397 |
| Inferred |
| Napoleon |
1.7 |
149 |
1.59 |
0.29 |
1.06 |
318 |
4.24 |
8,129 |
87 |
4.9 |
18.1 |
17,393 |
232 |
| Napoleon HW |
0.4 |
176 |
1.58 |
0.23 |
1.00 |
341 |
4.54 |
2,025 |
18 |
0.8 |
3.6 |
3,910 |
52 |
| Josephine |
0.2 |
110 |
3.28 |
0.24 |
0.67 |
389 |
5.19 |
817 |
24 |
0.5 |
1.6 |
2,891 |
39 |
| Cruz |
0.4 |
123 |
2.62 |
0.24 |
1.16 |
371 |
4.95 |
1490 |
32 |
0.9 |
4.4 |
4,514 |
60 |
| NP Area Total |
2.7 |
145 |
1.88 |
0.27 |
1.03 |
335 |
4.46 |
12,461 |
161 |
7.2 |
27.6 |
28,708 |
383 |
| Copala |
2.8 |
433 |
2.31 |
0.11 |
0.21 |
617 |
8.23 |
38,838 |
207 |
3.2 |
5.7 |
55,409 |
739 |
| Tajitos |
0.7 |
340 |
2.08 |
0.20 |
0.32 |
514 |
6.85 |
7,740 |
47 |
1.4 |
2.3 |
11,713 |
156 |
| Cristiano |
0.4 |
604 |
3.82 |
0.18 |
0.32 |
908 |
12.11 |
7,494 |
47 |
0.7 |
1.2 |
11,273 |
150 |
| Copala Area Total |
3.9 |
433 |
2.42 |
0.14 |
0.24 |
627 |
8.36 |
54,072 |
302 |
5.3 |
9.3 |
78,395 |
1,045 |
| San Antonio |
0.3 |
226 |
1.30 |
0.01 |
0.03 |
325 |
4.33 |
2,038 |
12 |
0.0 |
0.1 |
2,936 |
39 |
| *Animas |
0.4 |
169 |
1.68 |
0.29 |
0.60 |
327 |
4.37 |
2,101 |
21 |
1.1 |
2.3 |
4,074 |
54 |
| Total Inferred |
7.2 |
304 |
2.14 |
0.19 |
0.54 |
491 |
6.55 |
70,672 |
496 |
13.6 |
39.3 |
114,113 |
1,521 |
2023 update MRE Notes:
- The classification of the current Mineral Resource Estimate into Indicated and Inferred Mineral Resources is consistent with current 2014 CIM Definition Standards - For Mineral Resources and Mineral Reserves. The effective date for the Resource Estimate is January 19, 2023.
- All figures are rounded to reflect the relative accuracy of the estimate and numbers may not add due to rounding.
- All Mineral Resources are presented undiluted and in situ, constrained by continuous 3D wireframe models, and are considered to have reasonable prospects for eventual economic extraction.
- Mineral Resources, which are not mineral reserves, do not have demonstrated economic viability. An Inferred Mineral Resource has a lower level of confidence than that applying to an Indicated Mineral Resource and must not be converted to a Mineral Reserve. It is reasonably expected that the majority of Inferred Mineral Resources could be upgraded to Indicated Mineral Resources with continued exploration.
- The database comprises a total of 644 drill holes for 202,709 m of drilling completed by Vizsla Silver between November 2019 and September 2022.
- The mineral resource estimate is based on 21 three-dimensional ("3D") resource models, constructed in Leapfrog, representing the Napoleon area (10 wireframes), the Copala area (4 wireframes), Tajitos (1 wireframe), Animas (5 wireframes) and Generales (1 wireframe).
- Silver, gold, lead and zinc were estimated for each mineralization domain in the Panuco Project. Blocks within each mineralized domain were interpolated using 1.5 m capped composites assigned to that domain. To generate grade within the blocks, the inverse distance squared (ID2) interpolation method was used for all domains. All estimates are based on variable block dimensions (by deposit area) and estimation search parameters (by domain).
- Average density values were assigned per zone based on 400 samples analysed by ALS in Zacatecas, Mexico.
- It is envisioned that the Panuco Project deposits may be mined using underground mining methods. Mineral Resources are reported at a base case cut-off grade of 150 g/t AgEq. The Mineral Resource grade blocks were quantified above the base case cut-off grade, below surface and within the constraining mineralized wireframes.
- The base-case AgEq Cut-off grade considers metal prices of $24.00/oz Ag, $1800/oz Au, $1.10/lb Pb and $1.35/lb Zn and considers metal recoveries for Ag, Au, Pb and Zn including 93% for silver, 90% for gold, 94% for Pb and 94% for Zn.
- The base case cut-off grade of 150 g/t AgEq considers a mining cost of US$45.00/t rock and processing, treatment and refining, transportation, and G&A cost of US$50.00/t mineralized material.
- The estimate of Mineral Resources may be materially affected by environmental, permitting, legal, title, taxation, socio-political, marketing, or other relevant issues.
7 GEOLOGICAL SETTING AND MINERALIZATION
7.1 Regional Geology
The Project is on the western margin of the Sierra Madre Occidental (SMO), a high plateau and physiographic province that extends from the U.S.A.-Mexico border to the east-trending Trans-Mexican Volcanic Belt (Figure 7-1). The SMO is a Large Igneous Province (LIP) recording continental magmatic activity from the Late Cretaceous to the Miocene in three main episodes. The first episode, termed the Lower Volcanic Complex (LVC), comprises a suite of intrusive bodies, including the Sonora, Sinaloa, and Jalisco batholiths and andesitic volcanic rock units with minor dacite and rhyolite tuffs and ignimbrites that are correlative with the Tarahumara Formation in Sonora of Late Cretaceous to Eocene age. The second magmatic episode is dominated by rhyolitic ignimbrites and tuffs that built one of the earth's largest silicic volcanic provinces and has been termed the Upper Volcanic Supergroup (UVS). These dominantly rhyolitic units were extruded in two episodes, from about 32 to 28 Ma and 24 to 20 Ma. These two periods of magmatic activity are associated with the subduction of the Farallon plate under North America and the Laramide orogeny that occurred between the Upper Cretaceous - Paleocene and the Eocene. The third episode comprises post-subduction alkali basalts and ignimbrites associated with the opening of the Gulf of California between the late Miocene and Pleistocene - Quaternary.
The western part of the SMO in Sonora and Sinaloa is cut by north-northwest-trending normal fault systems developed during the opening of the Gulf of California between 27 and 15 Ma. The normal fault systems favoured the formation of elongated basins that were subsequently filled with continental sedimentary rocks. The basins occur in a north-northwest-trending belt extending from western Sonora to most of Sinaloa.
The basement to the SMO is locally exposed in northern Sinaloa, near Mazatlan and on small outcrops within the project area. It comprises folded metasedimentary and metavolcanic rocks, deformed granitoids, phyllitic sandstones, quartzites, and schists of the Tahue terrane of Jurassic to Early Cretaceous age (Montoya-Lopera et al., 2019, Sedlock et al., 1993 and Campa and Coney 1982).
In the broader Project area, the LVC comprises granite, granodiorite, and diorite intrusive phases correlative with the Late Cretaceous to Early Paleocene San Ignacio and Eocene Piaxtla batholiths in San Dimas district. The andesite lavas, rhyolite-dacite tuffs, and ignimbrites are locally intruded by the Late Cretaceous to Early Paleocene intrusive phases and younger Eocene-Oligocene felsic dikes and domes. Northwest trending intermontane basins filled with continental conglomerates and sandstones incise the UVS and LVC in the Project area. The Oligocene age ignimbrites of the UVS occur east of the property towards Durango state.
The structure of the Project area is dominated by north-northwest-trending extensional and transtensional faults developed or reactivated during the Basin and Range tectonic event (~28 to 18 Ma). The extensional belt is associated with aligned rhyolite domes and dikes and Late Oligocene to Middle Miocene grabens (Figure 7-2). Figure 7-3 shows the regional geology of the area.
Figure 7-1 Metallogenic Setting Map. Illustrates Geological Setting of Western Mexico with Main Porphyry and Epithermal Deposits of the Sierra Madre Occidental

Figure 7-2 Regional Geologic Setting Map. Illustrates Regional Geological Central Sierra Madre Occidental

Source: adapted from Montoya-Lopera et al., 2019
Figure 7-3 Regional Geology Map

Source: Vizsla Silver Corp, January 2024
7.2 Property Geology
The stratigraphic column in the Project consists predominantly of intrusive, volcanic and volcaniclastic rocks of intermediate to felsic composition of the LVC that have been intruded by younger domes and dikes of rhyolite and basalt compositions of the UVS. An approximately 9 by 3 km pluton of diorite to quartz diorite composition and lavas and tuffs of andesite composition are the district's main host lithologies of the epithermal veins. The rhyolites and dacites on top of the andesite (upper part of the LVS) host vein mineralization in a minor proportion. Fieldwork and interpretations conducted in the Project, indicate that the andesites of the LVC units are correlative with the Tarahumara formation of Sonora, and the ~77 to 69 Ma Socavon, Buelna and Portal members described in San Dimas. The rocks of the LVC in San Dimas are intruded by the Piaxtla batholith, dated at 49 to 44 Ma, whereas the age of epithermal mineralization has been constrained there between 41 and 37.8 (Enriquez et al, 2018 and Montoya et al, 2019). The diorite to quartz diorite pluton in Panuco has not been dated, but it is interpreted to be older than the Piaxtla intrusive, and correlative with the 64 Ma San Ignacio batholith dated by Montoya et al, (2019) in a locality west of San Dimas. Dating of two adularia samples by the 40Ar/39Ar method, from each of Napoleon and Copala, resolved Late Oligocene age for epithermal mineralization in Panuco. The rhyolite-dacite dome in the Animas zone, adjacent to the El Muerto mine shows strong silicification and quartz veining as well, suggesting post-dome emplacement hydrothermal activity in the area. A stratigraphic column is in Figure 7-4.
Figure 7-4 Stratigraphic Column for the Project Area

Additionally, the Jurassic - Early Cretaceous basement (Tahue terrane), comprised of metasediments (phyllites and sandstones) has been recognized through tectonic/erosional "windows" into the LVS and in some drill holes. The basement rocks are unconformably overlain by the LVC andesites and felsic rocks of the Tarahumara Formation and are subsequently intruded by the diorite-granodiorite and granite plutons centered in the Panuco project. Locally, the diorite intrusion has been observed to contain clasts of the andesite in contact-breccias. Another intrusive phase of granodiorite to quartz-monzonite composition that may be coeval with the main diorite pluton, has been mapped in the footwall of the Animas-Refugio structure (Henry, 2003). The granite intrusion has a reported K/Ar age of 57 Ma (McDowell and Kayzer 1977), it outcrops around the Panuco town and has been observed to contain clasts of diorite. Granodiorite porphyry in Malpica located 30 km southeast of the Project area was dated at 54.2 Ma by K/Ar (Henry, 1975). Following the deposition of the Tarahumara andesites, a quiescence period in volcanism, concomitant with uplift and erosion, favoured the formation of lakes and deposition of water-lain hyaloclastites and volcaniclastics composed of alternating rhyolite and andesite tuffs of Eocene age. These volcaniclastic units are believed to be correlative with the Productive andesite member in San Dimas. The unit is hundreds of metres thick and has been intruded also by felsic stocks, plugs and dikes of the UVS.
The project area has recorded multiple deformation events associated with the subduction of the Farallon plate under North America and the opening of the Gulf of California from the Cretaceous to the Miocene. Starling (2019) recognized five main deformation episodes spanning the Laramide orogeny and Basin and Range and younger post-Miocene extension events:
-
D1 - early Laramide ENE compression and fold-thrust deformation (~80-60 Ma),
-
D2 - late Laramide NNE compression and contractional deformation (~60-40 Ma),
-
D3 - early post-Laramide N-S to NNE extension (~38-28 Ma)
-
D4 - main stage Basin and Range ENE extension (~28 - 18 Ma)
-
D5 - WNW extension in central and southern Mexico (~12 - 0 Ma)
According to Starling, the Laramide deformation is quite subtle but likely created some of the initial major structures that underlie the geometry of the later vein systems. Analysis of kinematic indicators in the Project conducted by Starling (2019), determined that epithermal mineralization occurred during a phase of north-northeast to northeast-southwest regional extension, which favored the development of the following mineralized trends:
-
WNW (~120°N) extensional/normal faults orthogonal to D3 extension but also likely to have originated as shears under D1 and D2 compression (e.g., Animas, Cordon de Oro),
-
NNW to N-S (~160-180°N) sinistral shears that helped to accommodate D3 extension (e.g., San Carlos, Napoleon) and conjugate with
-
ENE (~060°N) dextral shears (e.g., San Antonio), and
-
NNE (~020-040°N) steep tear faults formed sub-parallel to D3 extension.
Similarly, structural studies done in San Dimas Horner and Enriquez (1999), report three major deformational events developing east-west, northeast-southwest and north-south sub-vertical structures carrying epithermal silver-gold mineralization. Major north-northwest-trending post-mineralization normal-faults, developed during the last deformation event, defined blocks tilted to the east-northeast or west-southwest (Horner J. T. and Enriquez E., 1999). The fault-tilted blocks are interpreted to be the result of a northeast-southwest extension like that observed in Panuco in D4.
The extensional event in Panuco was probably accompanied by significant hydrothermal activity that formed the district's epithermal veins. The hydrothermal activity must have been sufficiently strong and long-lived to develop veins with multiple orientations in Panuco. Pebble dikes, suggestive of extensive hydrothermal activity are present, although the paragenesis of the dykes with respect to mineralization has not been established. However, the pebble dykes appear to be concomitant with the widespread dissemination of fine-grained pyrite into the volcanic units. A late event of magmatism and extension favored the emplacement of post-mineralization rhyolite dikes along some of the mineralized structures. The rhyolite dikes appear to be synchronous with D4 extensional deformation, as they are locally dissected and/or necked. Finally, post-mineralization andesite dykes intruded the whole column; these dikes do not show evidence of faulting and are recognized as the youngest expression of magmatic activity in the Project.
It is interpreted that north-northeast extension developed a series of west-northwest-trending veins (Figure 7-5). Starling (2019) also noted that the low dipping angle of some of these veins and the observed tilting of rhyolites in the hanging wall of the Animas-Refugio structure, resulted from reactivated Laramide thrust-faults into listric faults, as seen in Figure 7-6. This geometry indicates the potential for multiple second-order, subparallel veins in the hanging walls of these west-northwest-trending veins. The mineralized shoots associated with these listric normal faults will tend to be subhorizontal to depth. The western part of the Project is characterized by the tilting of the volcanic sequence to the southwest, leading to the veins in the central part of the project having been more deeply eroded. Also, veins in the west portion of the district show shallower levels of exposure on surface consistent with weaker surface anomalies (e.g. La Luisa). Recent mapping works on the northeastern side of the property, at high-topographic elevation, indicate the veins are exposed to shallow levels and the recorded presence of kaolinite in at least a couple of vein outcrops suggests proximity to the paleosurface. Late- to post-mineral north-northwest, north-northeast, and east-northeast steep faults have partitioned the structural corridors, and the geometry and locations of economic shoots in each block may be distinct from neighboring blocks.
Figure 7-5 Property Geology Map Showing Claim Outline and Known Mineralized Structures

Figure 7-6 Schematic Cross-Section of Panuco Veining Illustrating that Veins May Be Listric Faults Developed from Reactivated Laramide Thrust Faults (Starling 2019)

7.3 Mineralization
Mineralization on the Panuco Property comprises several epithermal quartz veins. Previous workers and recent mapping and prospecting works conducted by Vizsla's geologists determined a cumulate length of veins traces of 86 km. Individual vein corridors are up to 7.6 km long and individual veins range from decimetres to greater than 10 m wide. Veins have narrow envelopes of silicification, and local argillic alteration, commonly marked by clay gouge. Propylitic alteration consisting of chlorite-epidote in patches and veins affecting the andesites and diorite are common either proximal or distal to the veins.
The primary mineralization along the vein corridors comprises hydrothermal quartz veins and breccias with evidence of four to five different quartz stages: generally white, grey and translucent and varying grain size from amorphous-microcrystalline-coarse. A late stage of amethyst quartz is also observed in some veins. The grey color in quartz is due to the presence of fine-grained disseminated sulfides, believed to be mainly pyrite and acanthite. Vizsla Silver has defined several hydrothermal breccias with grey quartz occurring more commonly at lower levels of the vein structures. Barren to low grade, quartz is typically white and is more common in the upper parts of the veins and breccias. Locally, mineralized structures are cut by narrow, banded quartz veins with thin, dark argentite/acanthite, sphalerite, galena, and pyrite bands. Bladed and lattice quartz pseudomorphs after calcite have been noted at several locations within the veins and indicate boiling conditions during deposition. Later quartz veinlets cut all the mineralized zones with a mix of white quartz and purple amethyst. The amethyst is related to mixing near-surface waters as the hydrothermal system is collapsing, as has been noted in the nearby San Dimas district (Montoya-Lopera et al., 2019).
The Mineral Resource includes eleven mineralized vein systems: the Napoleon, Napoleon hanging wall, Josephine, and Cruz Negra veins; the Copala, Cristiano, Tajitos and Copala 2 veins; the San Antonio vein; and the Rosaritos and Cuevillas veins. These trends are west to east within the Napoleon, Cinco Senores, Cordon del Oro, and Animas-Refugio corridors. Table 7-1 presents a general description of the geometry of the seven veins comprising the bulk of the mineralization. The bulk of the resource veins strike north-northwest to north-northeast, with thicknesses varying from 1.5 m to over 10 m. Figure 7-7 shows the location of the veins included in the Mineral Resource Estimate.
Table 7-1 General Description of Estimated Veins Included in the Mineral Resources Estimate for the Panuco Project
| Name |
Orientation |
Dimension |
| Strike (°) |
Dip (°) |
Thickness |
Strike |
Dip |
| (m) |
(m) |
(m) |
| Napoleon |
350 |
80-85 |
3.00 to 3.50 |
2,500 |
550 |
| Josephine |
355 |
75-85 |
1.50 to 2.50 |
1,500 |
500 |
| Napoleon HW |
350 |
60-65 |
2.00 to 3.00 |
2,000 |
250 |
| Tajitos |
20 |
70-75 |
2.00 to 3.00 |
1,500 |
400 |
| Copala |
15 |
35-55 |
2.00 to 35.00 |
950 |
400 |
| Copala 2 |
355 |
45-55 |
1.00 to 2.00 |
400 |
300 |
| Cristiano |
330 |
80-90 |
0.50 to 3.00 |
500 |
300 |
| San Antonio |
105 |
55-65 |
1.50 to 7.00 |
650 |
300 |
| Rosaritos |
125 |
50-55 |
1.50 to 5.50 |
180 |
130 |
| Cruz Negra |
325 |
75-85 |
0.50 to 2.50 |
400 |
200 |
| Cuevillas |
30 |
80-55 |
0.40 to 1.80 |
200 |
200 |
Figure 7-7 Panuco Project Claims Showing Known Veins, Including the Four Resource Areas Comprising Eleven Veins Included in the Mineral Resource Estimate

7.3.1 Animas-Refugio Corridor
The Animas-Refugio structural corridor is a significant fault zone central in the Project area; it hosts the largest number of historical and current workings (Figure 7-8 and Figure 7-9) and includes the Rosarito and Cuevillas veins reported in the current MRE. Overall, the corridor trends northwest-southeast and dips moderately southwest. Typically, the fault zone that defines this corridor has a clay fault-gouge contact in either the hanging wall and or the footwall contact and ranges from a few metres to over 20 m wide. It has a strike length of over 7.2 km and extends from the San Carlos mine in the southeast to the claim boundary in the northwest. Historical references note that the corridor continues to the southeast of the San Carlos mine. Ten main mineralized shoots have been exploited along this corridor; from southeast to northwest these are San Carlos, Clemens, El Muerto, La Pipa, Mariposa, El 40, San Martin, El 150, El 200, Rosarito, and La Bomba. The oldest workings date back to the 1500s. Rosarito and Cuevillas in the northwest sector of Animas are included in the MRE in the Inferred Mineral Resource category. In addition to the main, moderately dipping, mineralized zone there are numerous secondary mineralized structures, including a hanging wall splay at the Mariposa mine and the Paloma vein.
The Animas-Refugio structural corridor was first drilled by Minera Bacis in the late 1990s, but no details of this work are available. MRP subsequently drilled the corridor between 1999 and 2001, and Silverstone between 2007 and 2008.
The hanging wall of the fault zone is composed of a package of water-lain volcanic rocks with interlayered andesite tuffs and flows and rhyolite tuffs higher up in the sequence. Quenched textures in andesite tuffs, like those observed in hyaloclastites, support deposition in aqueous environment. A fine-grained diorite has been observed at lower levels within the hanging wall section. The footwall package consists of fine- to medium-grained diorite to granodiorite.
The Animas-Refugio corridor is a reactivated northwest- to west-northwest-trending normal fault that dips to the southwest, likely reactivated from a Laramide-age thrust fault with its dip shallowing at depth Starling 2019. The structure is steeper in high topographies where the structure has preserved the upper portions of the system. The normal fault defining the Animas-Refugio corridor is interpreted as the east side of a graben structure, with the Cordon del Oro trend comprising the west side of the graben. The graben structure has been cut by north-northeast- and north-northwest-trending subvertical faults that accommodated extension during the main mineralizing phase. Slickensides on these cross faults show a shallow to moderate dip to the southwest, with minimal offset. The fault splays accommodate extension along the fault and do not offset the main trend of the Animas-Refugio structure. These cross faults appear to have provided local boundaries within the fault zone that control the intrusion of post-mineral andesite dykes.
Related to the Animas-Refugio corridor are a series of hanging-wall splays, such as the San Martin splay near the Mariposa mine, the Paloma vein proximal to the Rosarito and Cuevillas veins, and Nieves coming off La Bomba. These splays are near vertical, and subparallel to the Animas-Refugio trend, and their possible intersection zones with the main structure are attractive exploration targets. These veins vary from narrow 1 m-wide to over 4 m-wide structures and have been mined extensively down to the 575 m.a.s.l. level.
Rosarito is a re-brecciated vein consisting of white quartz cemented by white silica with minor and variable amounts of grey quartz patches and fine-grained sulfides. The vein strikes to the southeast, dipping 35° to the southwest, and is traceable 200 m on surface. The vein pinches and swells between 2 and 25 m with average width determined through mapping of 4 m. Drilling reported intervals with estimated true width of 2.13 m in average. Figure 7-10 shows a section with drilling intercepts of note for the Animas-Refugio vein.
Figure 7-8 Animas-Refugio Geology and Silver Geochemistry (Section A-A' Shown in Figure 7-10)

Figure 7-9 Animas-Refugio Geology and Gold Geochemistry (Section A-A' Shown in Figure 7-10)

Figure 7-10 Animas-Refugio Vein Cross-Section Looking Northwest

7.3.2 Cordon del Oro Corridor
The Cordon del Oro structural corridor is an east-dipping normal fault zone in the west-central portion of the Project area that trends roughly north-northwest and dips moderately to the east (Figure 7-11). The mineral resource estimate contains the San Antonio structure, within the Cordon del Oro corridor, in the Inferred Mineral Resource categories.
The Cordon del Oro structure has a small number of historical workings. The fault typically has clay fault-gouge contacts that range from metre scale to over 15 m wide. To date, the structure has been traced with mapping for approximately 7.6 km from the Anonal mine in the southeast to the Santa Rosa plant in the northwest. It is interpreted that Cordon del Oro is the west side of a graben, with the Animas structure defining the east margin. Only five mineralized shoots have been exploited along the main Cordon del Oro corridor; from the southeast to the northwest, these are Peralta, La Cobriza, Mojocuan 1, 2, and Mojocuan 4. Four additional mineralized shoots occur along the San Antonio vein Los Generales, Coralillo, San Antonio, and La Venada.
The Cordon del Oro corridor is not known to have been drilled, and mining completed to date occurred in the last century, with workings of less than 100 m in length. Most mining extended only about 10 to 30 m below the surface, and the deepest of the historical mining appears to have reached about 60 m below the surface. Only the Coralillo mine has more than one level of development and was mined to a depth of about 60 m and approximately 150 m along strike.
At lower elevations, the Cordon del Oro structure cuts a fine-grained diorite that is weakly to strongly magnetic and corresponds with a magnetic anomaly in regional airborne magnetic surveys. The structure cuts dacite and granodiorite in the Mojocuan 1 and Mojocuan 2 mine areas (Figure 7-11). In the central part of the vein corridor and along the San Antonio splay, the structure cuts a series of shallowly west-dipping rhyolite tuffs and andesite flows at higher elevations. Local rhyolite and andesite dykes intrude on the host rocks and along the mineralized structure. A quartz porphyry and granite porphyry are noted in underground workings at the Mojocuan 1 and Mojocuan 2 mines.
The Cordon del Oro structure is interpreted as a north- to north-northwest-trending normal fault on the west side of a graben subjected to repeated movement and later cross-faulting (Starling, 2019). The San Antonio structure is an east-west-trending set of subparallel faults that dip mainly to the south and is interpreted as a hanging wall splay of the main Cordon del Oro structure.
The San Antonio vein is an east striking, moderately dipping structure with 325 m of interpreted strike length and 300 m of down-dip extension. The average width is generally 1.5 to 3 m, with pinching and swelling between 1 and 7.5 m. Vizsla has completed 31 drill-holes along the San Antonio vein between 2020 and 2022, 19 of those holes were completed in 2022.
Figure 7-11 Cordon del Oro Geology and Silver Geochemistry

7.3.3 Cinco Señores and Napoleon Corridor
The Cinco Señores and Napoleon structural corridors comprise two subparallel, mineralized fault-zones in the western portion of the Project area that trend north-northwest, at sub-vertical dip angles (Figure 7-12 and Figure 7-13). Cinco Señores has a strike length of around 2.6 km, from the El Tajito mine in the southeast to El Cajon in the northwest. Twelve mineralized structures are included in the Cinco Señores corridor: Copala, Tajitos, Cristiano, Copala 2, La Colorada, La Tlacoacha, Santa Ana, Descubridora, Cinco Señores 01, Cinco Señores 03, La Manzanilla, and El Cajon. Copala, Tajitos, Cristiano and Copala 2 contain over 50% of the global resource in Panuco project. The Cinco Señores structure comprises a single, narrow fault zone with quartz veining approximately 1 m to 2 m wide. One moderately northeast-dipping notable splay of Cinco Señores was mined out at La Descubridora, west of the town of Copala (Figure 7-14).
The Napoleon corridor contains the Napoleon Main, Napoleon Hanging wall, Josephine, Cruz Negra, and other minor vein splays in southern Napoleon at the Ojo de Agua area. Together they constitute a significant portion of the Mineral Resources. Moreover, the current Mineral Resource estimate includes the Cinco Senores veins of Copala, Tajitos, Cristiano and Copala 2 structures. The Cinco Señores and Napoleon structural corridors host the second-largest concentration of historical workings on the property, some of which date to the 1500s.
The Napoleon and Cinco Señores structural corridors are interpreted as north- to north-northwest-trending strike-slip faults that have been reactivated, mineralized, and later subjected to cross-faulting (Starling, 2019). Later cross-faulting, likely related to the basin and range extension, imposed an effect of post-mineralization dextral trans tensional displacement across the east-west- to west-northwest-trending reactivated faults. Vein mineralization is hosted predominantly by two lithologies, a fine-grained, weakly to strongly magnetic diorite at lower elevations and a series of shallowly west-dipping rhyolite tuffs and andesite flows at high elevations.
Figure 7-12 Cinco Señores-Napoleon Geology and Silver Geochemistry

Figure 7-13 Cinco Señores-Napoleon Geology and Gold Geochemistry

Figure 7-14 Descubridora Mine Geology and Geochemistry

Note: Sample Widths are Estimated at 65% to 100% of True Widths.
The Napoleon vein comprises a fissure vein with subparallel vein splays and faults about 20 m apart that host quartz cemented breccias. Dilational fault jogs and cymoid loops are developed by some faults. At least 13 main mineralized shoots have been exploited along the Napoleon corridor. From south to north they are: Napoleon Sur (Ojo de Agua), El Gallinero, Napoleon 07, Napoleon 05, Napoleon 04, El Hundido, La Higuera, Limoncito, Los Rieles, El Papayo, El Agua Prieta, Aguajes, and La Estrella. The subparallel faults and dilational jogs are more common in the southern portion of the structure; the northern part comprises a single fissure vein for the most part. Moreover, local horsetail splays are a common occurrence in southern Napoleon at the Ojo de Agua area. Mineralization in the Napoleon vein is traced along 2,500 m of strike length and approximately 550 m of depth. The system is tilted 20° to 25° to the south which favored the exposure on the surface of base metals-rich vein mineralization in the north and low base metals plus low Ag/Au ratios in the south at the Ojo de Agua area. This tilting condition is also responsible for the lower silver values and thinner widths to the south on the surface, and therefore points to a high elevation in the vein system (Figure 7-15).
Figure 7-15 Drill-hole intercepts showing tilted-mineralization on Napoleon main vein

The Napoleon Main, Josephine, Napoleon Hanging Wall, Cruz Negra veins and vein splays in Ojo de Agua form the Napoleon vein corridor and constitute the bulk of the Mineral Resource contained herein. Josephine is a sub-vertical vein west and subparallel to the Napoleon Main vein and was discovered in 2021 in drill hole NP-21-132. Josephine widths are generally between 1 and 3 m, with semi-massive sulphide mineralization indicating higher grades. Josephine is traced 1.5 km along strike and has been tested roughly 500 m down dip. The Napoleon hanging wall vein runs subparallel to Napoleon Main to the east at a moderate dip and is generally 2 to 3 m wide. The Cruz Negra Vein, located 250 m west of the Napoleon resource area, is a northwest striking vein-breccia dipping steeply to the northeast. The vein breccia consists of quartz veining and quartz cement bearing disseminated sphalerite and galena. Drilling to date has tested Cruz Negra along ~400 m of strike and 300 m to depth in proximity to the Josephine Vein. Mineralized intercepts at Cruz Negra, highlight a range of estimated true widths from 0.65-3.10 m with grades ranging from 265 to 3,499 g/t AgEq, at the mineralized elevation.
The Copala, Tajitos, Cristiano, and Copala 2 vein structures are within the Cinco Senores corridor and amount to over 50% of the Mineral Resource estimate given in this Technical Report. The Copala structure strikes north-northwest and is situated east and on the hangingwall side of the Tajitos vein. Initial drilling during 2020 intersected the structure with maximum true width of 82 m and based on mineralized intercepts we estimate an average true width of 10 m. Due to its exceptional width and high grade, Copala has seen the fastest growth in terms of Indicated and Inferred Mineral Resources and is the single structure with the largest global resource (Indicated and Inferred) at the Panuco project. The structure pinches and swells from approximately 2 m to 82 m, has an average dip of 46° with variable dip angles of ~35° in the north, close to the Copala town, to a maximum of ~55° in its southern extent. Copala consists typically of crackle and hydrothermal breccias, stockworks and vein zones with banded and massive quartz ubiquitous rhodochrosite, rhodonite and calcite. Other gangue minerals include adularia and white phylosilicates (illite, illite-smectite, and montmorillonite).
Drilling at Copala has now traced mineralization along approximately 1,770 m of strike length and approximately 400 m down dip. High-grade silver-gold mineralization remains open to the north and southeast. On the west, Copala is bounded by the high-grade Cristiano vein and to the east, it is bounded by a northwest-trending post-mineralization fault. Holes CS-22-202, CS-22-207 and CS-22-219, drilled across the fault, indicate an uplifted block of basement metasediments in fault contact with andesites and diorite on the east side of Copala.
The Tajitos epithermal vein is traced over 1.5 km of strike and has been tested 500 m down dip. The vein pinches and swells from sub-metre to 10 m widths, but generally the width is between 2 m and 3 m. The vein is composed of massive white quartz to locally banded quartz, usually brecciated and sealed by white quartz. Locally there are distinct hydrothermal breccias with grey quartz in the matrix and clasts, typically carrying higher grades. Bladed quartz textures, indicative of extensive fluid boiling (Drummond and Ohmoto, 1985), a well-known mechanism for gold deposition, are also observed in the Tajitos vein. Amethyst quartz and rhodochrosite are also present in high-grade zones. Amethyst quartz is believed to represent the mixing of hydrothermal fluids with Fe-rich meteoric waters.
The Cristiano Vein is a precious metals-rich structure located at the southwestern margin of the Copala structure. Cristiano is marked by a quartz-carbonate epithermal vein striking N25°W that dips sub-vertical (85°) to the NE. Drill holes intersecting Cristiano to date, highlight a high-grade zone plunging to the NW, with a vertical extent of 300 m and an approximate strike length of 600 m with a thickness ranging from 0.7 m to 3.5 m. The Cristiano Vein was initially discovered while targeting the Tajitos-Copala veins, where drilling intercepted the well-mineralized, NW-SE trending fault. Ongoing drilling has now led to new observations and interpretations allowing Vizsla geologists to plan drill holes specifically designed to explore Cristiano along strike and to depth. To the northwest, Cristiano intersects and offsets the Tajitos Vein, suggesting Cristiano post-dates Tajitos mineralization, thus creating a drill target on the footwall of Tajitos.
7.3.4 Other Mineralized Structures
Numerous other structures on the Panuco claims are actively being explored. The following subsections outline the geology of a few of these earlier-stage prospective structures. Figure 7-16 shows the location of the prospects described below, among others.
Figure 7-16 Panuco Project Area with Veins

7.3.4.1 La Colorada
The La Colorada silver and gold deposit is about 1 km northwest of the village of Copala. Christopher and Sim (2008) described the geology of La Colorada as a manto-and-feeder vein system hosted in andesite, overlying a large diorite intrusive. The manto is cut by a north-striking rhyolite dyke that may be associated with a rhyolite flow dome on the northwest flank of the manto. The veins and manto in the La Colorada area are bounded by northwest-striking faults. A keel marking the thickest manto development strikes north, parallel to felsic dyking in this area. This north-south trend was interpreted as the result of a combination of strike-slip movements on northwest- and northeast-striking orthogonal faults.
The La Colorada vein system occurs along a pronounced northwest-striking lineament that bisects the largest of a series of circular features that Christopher and Sim (2008) interpret as caldera margins.
7.3.4.2 Copala Town Area
Mapping in 2020 identified several vein and manto-type structures around the town of Copala (Agua Zarca, Cuernavaca, Huaco). Historic mining underneath the town, along those structures, is believed to have occurred to estimated depths of 100 m below surface. Some of the old shafts in the middle of the town have been backfilled or built over, thus limiting the access to the underground workings. Four main structures trending northwest have been mapped thus far, although further mapping is likely impossible due to the presence of the town. These structures, along with Copala, appear to be part of the low-angle Copala-Colorada-Pajaros vein structural corridor. Cerrillo vein on the east side of the town is another example of northwest-trending and shallowly northeast-dipping vein. The El Estadio vein is a vertical structure to the north of Cerrillo that shows potential for drill testing. Mapping has identified other veins near Cerrillo and El Estadio that have minimal exposure; their extent and orientation are speculative.
7.3.4.3 El Batel Corridor
The El Batel mine area is in the northeast portion of the Vizsla Silver claim block at elevations between 1,100 and 1,400 masl. It is composed of a central northwest-trending vein 2 to 4 m wide, dipping moderately to the northeast, and hosted in a package of andesitic tuffs. There is minimal outcrop, and most of the samples collected in the area are from hanging wall splays. A series of hanging wall splays are also of low angle, subparallel to the main vein, suggesting a tension release-style vein.
7.3.4.4 Broche del Oro
The Broche de Oro Corridor is a northeast-trending vein system in the northeast portion of the Vizsla Silver claim block. Currently, the structure has been traced over about 4,300 m of strike length; however, only 40% of it is on Vizsla Silver-controlled claims. The longest segment held by Vizsla Silver, at 980 m, is the Broche de Oro area. The old Broche de Oro mine is at the bottom of a deep canyon with over 300 vertical metres of andesite and dacite tuffs overlying a diorite intrusive. The diorite is likely different from the main microdiorite as the microdiorite is magnetic, and the Broche de Oro area is in a magnetic low. At the old mine level, the vein is still hosted in the andesitic tuffs and shows widths from 2 to 4 m. The dip of the central segment of the vein is to the southeast, while several other subparallel veins have dips to the northwest, suggesting there may be a small horst block in that area, or that the other veins are remnant footwall splays. The Manteada vein is another perpendicular structure in that area that underwent considerable past mining to the north of Broche de Oro. The Manteada vein has been mapped for 1,300 m north-northwest from the Broche de Oro workings, dipping moderately to the west, and widths from 2 to over 5 m. It appears to have been mined near its northern end, where it either changes strike or intersects the northeast-trending San Ramon vein. The Manteada vein textures are massive white quartz with very little sulfide, and local patches of bladed calcite psuedomorphed with silica. Many outcrops show a brecciated vein, while only a few exhibits the massive white silica with bladed calcite. Vizsla completed seven drill-holes during 2021 at the Broche de Oro zone but no significant mineralization was intercepted at the time.
7.3.4.5 La Galeana
The Galeana vein is likely a significant splay structure off the longer San Francisco-Broche de Oro-Nacaral vein system that trends north-northeast some 1,400 m to the southwest of the Nacaral mine. The vein saw three different past workings spread out over 80 m of vertical relief. The principal working was the upper one, where a shaft was sunk directly on the vein, but has since collapsed. Several small splays (1 to 10s of metres long) come off the main vein here, with the main one being only 1 to 2 m wide. A broader, subparallel, 4- to 5 m-wide vein was some 140 m to the northeast of the collapsed shaft area.
7.4 Structural Controls
Mineralized structures in Panuco resulted from a long history of deformation accompanied by multiple hydrothermal-mineralization events spanning from the late-Laramide orogeny to the Basin and Range extension. Multiple deformation events resulted in west-northwest thrusts and conjugate north-northwest to north-south dextral and east-northeast sinistral shears that were developed during the two peaks of the Laramide compressional orogeny. Some of these older structures served as well as conduits for the emplacement of porphyry type deposits in western Mexico. The Laramide age main thrust and conjugate faults were subsequently reactivated during post-Laramide extensional events during the late-Eocene, Oligocene, and Miocene. Therefore, structures like Napoleon and Copala probably originated as late-Laramide conjugate shears that were reactivated and opened to the fluid passage and epithermal mineralization during the Laramide extensional deformation D3 event. Steeply dipping structures, the conjugate components to the low angle thrust shears, were also reactivated during post Laramide extension and some of them were mineralized as well. Napoleon is interpreted to be a reactivated conjugate sinistral shear. During post Laramide extension, events D3, D4 and D5, occurred significant block faulting and tilting. Some of this faulting and tilting occurred concomitant or after mineralization, thus segmenting or tilting mineralized structures. A clear example of this tilting occurs in Napoleon, where infill and step-out (expansionary) drilling conducted during 2021, supported by geological and geochemical interpretations (alteration and metal zonation) confirmed that the Napoleon vein system is tilted to the south, with the southern extent being at the top of the mineralized horizon near surface. Copala on the other hand, is a low-angle dipping structure bounded to the west by the steep dipping Tajitos and Cristiano veins that also shows variable dip angle from shallow (35°) in the north to moderate (55°) in the south. Because there is a significant component of strike-slip displacement imposed on most structures, pinching and swelling is fairly common.
Tajitos is interpreted as a conjugate shear, and according to Starling (2019), it exhibits an early sinistral transpressional shear sense overlapped by a dextral tensional shear sense. The diorite stock emplaced along an east-northeast-trending central fault zone that likely originated during the early-Laramide deformation. Many of the structures hosted by the diorite appear to have better continuity than those hosted by the andesites and rhyolitic volcanics.
7.5 Alteration
Generally, alteration is prominent propylitic alteration, defined by chlorite and epidote that extends 50 to 100 m peripheral to main fluid conduits. Silicification, white phyllosilicates in fractures and minor quartz veinlets are present immediately adjacent to veins and fault structures. The fault structures host mineralization comprising distinct quartz veins and moderate-to-strong pervasive silicification with associated crackle breccia veining. The upper and lower boundaries of mineralized zones are occasionally within faults and are usually marked by clay gouge zones with common milled clasts. The milled clasts comprise wall rock and white quartz vein fragments, indicating that these faults experienced significant movement post-mineralization. The footwall contact of the fault zone commonly has a clay gouge contact, and local crackle brecciation and silicification that overprints earlier propylitic alteration in the diorite to granodiorite. Patchy silicification, minor quartz veinlets, and fracturing are occasionally present more proximal to the structure, and local, weakly developed argillic alteration may also be present.
In 2020, Vizsla retained the services of Scott Haley to analyze and interpret Panuco's extensive assay database. A database consisting of Over 33,400 core samples and over 3,700 rock samples was used in the analysis with the main objective of characterizing rock compositions and alteration assemblages. The main alteration mineral determined outboard the veins were albite, chlorite and sericite, whereas the main alteration minerals within the veins were adularia and sericite (Haley S. 2020, Internal report prepared for Vizsla Silver Corp.).
7.6 Mineral Petrology
In 2021 Vizsla Silver commissioned Applied Petrologic Services & Research, Wanaka, New Zealand, to carry out a petrographic and fluid inclusion study on 14 samples (one from each of Animas and Cordon del Oro, three from Tajitos, and nine from Napoleon) (Coote, 2021a). Coote's findings indicate sustained hydrothermal fluid flow evidenced by fracture-fill multi-stage silica and breccia cement due to a penetrative and long-lasting structurally focused fracturing and brecciation. Evidence of boiling conditions, an environment conducive to epithermal precious metal mineralization, is indicated by fluid inclusion assemblages in quartz. Further evidence of boiling conditions is the presence of adularia, bladed quartz pseudomorphs after calcite and colloform banding of the fracture-filled and locally brecciated vein assemblages. Bladed carbonate, ferrous, manganoan, and calcitic-rich carbonates proximal to drusy quartz also indicate a successive emplacement of later hydrothermal fluids evidencing a long-lasting system for emplacement of epithermal veins.
The following petrologic features apply to the Animas, Cordon del Oro, Cinco Senores and Napoleon vein corridors. They are important in defining base- and precious-metal mineralization of the low-sulphidation, epithermal environment:
- Sphalerite, galena, chalcopyrite, tennantite/tetrahedrite and minor amounts of bornite comprise base-metal sulphide and sulphosalt mineralogy enclosed by interstitial multi-phase, mosaic-drusy quartz and pyrite
- Very-fine to ultra-fine-grained chalcopyrite is concentrated as inclusions within sphalerite margins and partly defines internal zoning.
- Supergene chalcocite and covellite locally replace chalcopyrite, bornite, and tennantite/tetrahedrite.
Furthermore, multiple stages of base-metal sulfides and sulphosalts are present, filling cavities and fractures within brittle, deformed pyrite and mosaic-drusy quartz, which form in places cemented-to-brecciated pyrite. Galena, chalcopyrite, and tennantite-tetrahedrite solid solution (ss) are present, filling, and cementing fracturing and brecciation of coarse-grained, and locally more-voluminous sphalerite. Multiple stages of base-metal sulfides are ductile-to-brittle deformed and recrystallized in relation to tectonic and hydrothermal overprinting.
Precious-metal mineralogy as acanthite, proustite, native gold, electrum, and native silver occur in close-spatial and interpreted-temporal association with base-metal sulfides and sulphosalts. Native gold and electrum are interstitial to and occurs as inclusions in mosaic-drusy quartz. Furthermore, pyrite and base-metal sulfides and silver sulphosalts (pyrargyrite-proustite ss) occur as intergrowths with acanthite; pyrargyrite-proustite ss are best represented in the Animas, Cordon del Oro, and Cinco Senores vein corridor.
Additionally, Cinco Senores hosts acanthite, native gold and electrum occurring interstitial to fluorite and mosaic quartz in fracture-fill/breccia cement assemblages. Native silver also fills cavities and microfractures within mosaic quartz. Native gold is also relict as intergrowths and inclusions within pyrite altered to supergene goethite and hematite in rock from Cinco Senores.
Coote (2021b) also conducted a fluid inclusion study using microthermometric data from the Animas, Cordon del Oro, Cinco Senores, and Napoleon vein corridors. The homogenization temperatures determined from fluid-inclusion microthermometry on quartz minerals within fracture-fill/breccia cement, are consistent with epithermal temperatures reported for other deposits elsewhere in Mexico. Furthermore, salinities calculated from freezing temperatures are low, consistent with diluted fluids and typical of epithermal precious-metal deposits. The temperatures and salinities determined for quartz-hosted fluid inclusions associated with silver and gold mineralization in Panuco range from 196°C to 293°C and 1.9 to 3.1 wt% NaCl eq. Temperature and salinity ranges, gangue mineralogy (adularia-quartz) and hydrothermal alteration in Panuco veins are consistent with typical low- to intermediate-sulfidation epithermal types of deposits. Contrasting concentrations of base metals (moderate to very low) and silver/gold ratios (<100 - >150) between Napoleon and Copala, point to distinct fluid compositions; intermediate sulfidation for Napoleon and low sulfidation for Copala.
8 DEPOSIT TYPES
Mineralization in Panuco occurs in veins and mantos with mineralogical characteristics, alteration assemblages, temperature, and salinities typical of low to intermediate sulfidation epithermal deposits. Because of the region's long and complex deformation and hydrothermal history, the Panuco Project has the potential to host other deposit styles. Late Cretaceous to Paleocene batholiths that intrude the Tarahumara Formation rocks in Panuco, are prospective for porphyry copper and molybdenum deposits elsewhere in the SMO. Late Cretaceous - Eocene plutons that intrude basement metasediments and limestones are prospective for gold-rich and polymetallic skarns and replacement deposits. However, the mineralized structures that are exposed and that have been explored to date in the property are only the epithermal silver and gold veins that were developed or reactivated during the extensional tectonics of the SMO volcanic arc.
8.1 Epithermal Systems
Epithermal deposits form at depths of 1.0 to 1.5 km in volcanic-hydrothermal and geothermal environments. They define a spectrum with two end members, low and high sulfidation (Hedenquist et al., 2000). Figure 8-1 shows the genetic model for epithermal deposits proposed by Hedenquist et al., (2000). Low and Intermediate sulfidation deposits form part of the epithermal spectrum. Their genesis is complex due to the participation of fluids with meteoric and magmatic origin during their formation and the fluid evolution during water-rock interactions. According to several authors, the fluids that formed the Mexican epithermal deposits represent a mixture of fluids with diverse origins varying from meteoric to magmatic (Simmons et al., 1988; Benton, 1991; Norman et al., 1997; Simmons, 1991; Albinson et al., 2001; Camprubí et al., 2006; Camprubí and Albinson, 2007). Mineral deposits in Panuco exhibit characteristics of the low-to-intermediate sulphidation types of deposits.
Epithermal deposits typically consist of fissure veins and disseminations with gold, silver, and base metals concentrations. Most low sulfidation epithermal deposits form as open-space filling of faults and fractures resulting in vein deposits. Some gold deposits occur as replacements or disseminations in permeable host rocks, particularly the high-sulfidation types. Epithermal deposits are more common in extensional settings in volcanic island and continent margin arcs. Due to its relatively shallow deposition level within the Earth's crust, most epithermal deposits are preserved in Tertiary or younger volcanic rocks. Mineral deposition in the epithermal environment occurs due to complex fluid boiling and mixing processes that involve cooling, decompression, and degassing. Veins in Panuco contain adularia and colloform banded quartz, representing strong evidence of fluid boiling during mineral deposition.
Historically, epithermal gold and silver deposits are an important part of the world's precious metal budget. Approximately 6% and 16% of the world's gold and silver have been produced from epithermal deposits. These deposits are significant in Mexico. Mineable epithermal vein deposits range from 50,000 to more than 2,000,000 tonnes in size, with typical grades ranging from 1 to 20 g/t Au and 10 to 1,000 g/t Ag. Locally exceptional, or "bonanza" grades above 20 g/t Au can be important contributors to many gold deposits. Lead and zinc are also important contributors to epithermal deposits' low- and intermediate-sulphidation classes. Veins that host mineralization are about several kilometres long; however, economic mineralization is present in plunging ore shoots with dimensions of tens of metres to hundreds of metres or more. Single veins commonly host multiple ore shoots. The wide range of tonnage and grade characteristics make these deposits attractive targets for small and large mining companies.
Quartz veins are typical hosts for low and intermediate sulphidation mineralization, and these veins have characteristic alteration assemblages that indicate temperatures of deposition between 100°C and 300°C. These alteration assemblages include quartz, carbonates, adularia white phyllosilicates, and barite in the veins; illite, adularia, smectite, mixed-layer clays, and chlorite proximal to the vein walls; and distal chlorite, calcite, epidote, and pyrite more peripherally. Also, unmineralized but related, steam-heated argillic alteration and silica sinters may be present above, or above and laterally from, the veins.
Vein textures are also important guides for targeting low-and intermediate-sulphidation mineralization. Quartz commonly occurs with cockade and comb textures, as breccias; as microcrystalline, chalcedonic, and colloform banded quartz; and as bladed or lattice quartz. Bladed or lattice quartz forms by replacing bladed calcite formed from a boiling fluid and is a diagnostic indication of the level of boiling in a vein.
Ore minerals include pyrite, electrum, gold, silver, argentite, acanthite, silver sulphosalts, sphalerite, galena, chalcopyrite, and/or selenide minerals. In alkalic host rocks, tellurides, vanadium mica (roscoelite), and fluorite may be abundant, with lesser molybdenite. These mineralized systems have strong geochemical signatures in rocks, soils, and sediments and Au, Ag, Zn, Pb, Cu, As, Sb, Ba, F, Mn, Te, Hg, and Se may be used to vector to mineralization.
Figure 8-2 shows the associated alteration components of epithermal systems and mineralization.
Figure 8-1 Genetic model for epithermal deposits

Source: after Hedenquist et. al., 2000
Figure 8-2 Schematic of Alteration and Mineralization in Low Sulphidation Precious Metal Deposits

Source: after Hedenquist et al., 2000
9 EXPLORATION
Vizsla commenced exploration on the Project in July 2019. Surface exploration to date has included geological mapping, rock geochemical sampling, geophysical surveys, and diamond drilling (see section 10).
9.1 Geological Mapping
Geological mapping and prospecting are key ongoing process in exploring and understanding the geology of the Panuco Property. Mapping is conducted on a reconnaissance scale with detailed scale testing. Mappers generally use a 1:1,000 scale and, in notable outcrops 1:500 scale. The 1:1,000 scale geological mapping completed as of December 2023 is shown in Figure 9-1. This mapping of the Property amounts to 4,330 hectares mapped out of a total of 7,074 hectares held by the company, which represents 61.4% of the total area mapped.
Figure 9-1 Panuco Property Mapped Areas at 1:1,000 Scale as of September 2023

9.2 2019-2021 Rock and Soil Geochemistry
Rock and soil sampling is usually conducted in conjunction with geological mapping and prospecting. Geologists take chip, float, outcrop samples (including channels), and underground sampling where it is safe to do so. Table 9-1 outlines the rock and soil geochemistry sampling done by Vizsla Silver up to 2022 The locations of these samples are shown in Figure 9-2.
Overall, 3,777 rock samples were collected from surface and underground exposures. The lithology, alteration, and structure of outcrop and underground exposures are mapped to determine controls on mineralization. To the degree possible, samples were oriented perpendicular to mineralized structures and variations in mineralization and are sampled separately. At least one sample on either side of the mineralized structure was also collected. Samples are collected as continuous chip channel, with minimum sample lengths ranging from 30 cm to 1.5 m. The sample length and the width of the chipped channel, typically 10 to 15 cm, are recorded along with the sample's estimated true width.
Sampling can be carried out by geologists or trained field assistants under the direct supervision of a geologist. All the chips of the channel sample are collected on a tarp. Once the sample has been collected, the sample is mixed by folding the tarp in half in four different directions, rolling the material over itself and thus homogenizing the sample material. One-quarter of homogenized sample is poured into a labelled sample bag containing the uniquely labelled sample ticket. In the case of field duplicates, a second quarter of that sample (from the opposite quadrant) is then poured into a second labelled sample bag with a uniquely labelled sample ticket. Bags are sealed with a plastic cinch cable tie, and sample bags are transported to Vizsla Silver's secured warehouse.
Table 9-1 Summary of Surface and Underground Rock and Soil Geochemistry Samples between 2019 and 2021
|
|
Sample Type
|
Sample Count
|
|
Surface
|
Chip
|
100
|
|
Float
|
46
|
|
Mine Outcrop
|
156
|
|
Channel
|
2,686
|
|
Total surface
|
2,988
|
|
Underground
|
Underground
|
789
|
|
Total
|
|
3,777
|
Figure 9-2 Surface sampling at Panuco Project between 2019 and 2022

9.3 Geophysics
Geophysics has been a tool to help identify targets on the Panuco Property. Silverstone flew helicopter airborne magnetics in 2016, and Vizsla Silver has conducted airborne and ground surveys since 2019.
Silverstone conducted an airborne magnetic survey over Panuco property in 2016. The main magnetic high corresponded well with the mapped micro-diorite and showed a potential offset. The micro-diorite is the main host rock in the Napoleon area but is covered by an andesite-to-rhyolitic tuff package in the other vein areas. Figure 9-3 shows the airborne reduced-to-pole (RTP) magnetic survey results from 2016 with interpreted offset in the micro-diorite.
In April of 2021 Vizsla conducted a trial ground Fixed Loop Electromagnetic survey (FLEM) or ground EM and a drone Magnetic Survey over the Napoleon - Cinco Señores corridor. FLEM detects massive sulphide mineralization by running a current through a large loop of wire laid on the ground to induce a magnetic field in the earth. As the weakening magnetic field moves through the earth it sets up a circulating electrical field in the shape of any massive sulphide bodies that it passes through. This new electrical field in turn weakens, setting up a secondary magnetic field that is measured on surface. Geophysicists with modern computer programs can back calculate (inverse modelling) the shape of the conducting massive sulphide and model a 3D "plate" representing the source of the anomaly.
The results showed that EM plates fit with mineralization drilled at the Napoleon discovery and culminated with the discovery of the Josephine vein located west of Napoleon. In addition, five new priority conductive trends were modelled along with many more subtle anomalies.
The drone survey was conducted over 205-line km, at 50 m line spacings and a nominal height of 50 m (Figure 9-4). The test area was over the Napoleon trend, and thus the line orientation was chosen to be at 45° to try and intersect the vein corridor orthogonally.
Four different products were delivered from the drone magnetic survey: an RTP map, an analytical signal (AS) map, a residual-signal (RES) map and a first vertical derivative (1D) map. The results from the RTP fit well with Vizsla mapping of the micro-diorite. While the concept of the Napoleon vein being in a magnetic low trend is not completely clear in the RTP data, it becomes more apparent in the AS data, as those tend to plot the magnetic features clearly over their source regions.
In addition to the magnetic surveys, Vizsla has been collecting magnetic susceptibility readings from most of the drill core. These data have been compiled in Excel tables, and each drill hole has a downhole graph of the susceptibility readings. These graphs have been included in the compilation of the drilling cross-sections and are often very useful in distinguishing rock types.
Figure 9-3 Airborne Magnetics RTP from 2016 with Known Veining and Possible Fault Offset Shown in Diorite

(Maunula and Murray, 2022)
Figure 9-4 Results from 2021 Airborne Magnetics RTP Geophysical Survey Over the Napoleon Area

(Maunula and Murray, 2022)
9.4 2023 LiDAR Survey
The LiDAR survey was completed by Eagle Mapping out of Langly, BC, in June of 2022. Vizsla received the data in August of 2022. A LiDAR survey covering ~6,200 Ha of the property to be utilized in geologic-resource modelling and future planning of mine and plant infrastructure. Additionally, these high-resolution products (elevation model and orthophotos) are being used to support lithology and structural mapping activities, and as a prospecting tool to find vein outcrops and old mine workings covered by vegetation.
9.5 2022 Surface Sampling
Surface sampling at Panuco in 2022 totalled 1,202 rock samples (Table 9-2 and Table 9-3). The location of these samples are shown in Figure 4-1. The sampling follows the same procedure outlined in Section 9.2.
Of these samples, 838 were analyzed at ALS Minerals laboratory by Au-AA23 and ME-ICP61 multi-element package and provided to the Authors in Excel format. Overlimits used Ag-OG62 and GRA21. Sampling followed standard best practice procedures, including the insertion of control samples. Assays ranged from below detection limit to 31 g/t gold and 1,660 g/t silver.
A further 364 samples were analyzed at an SGS laboratory by Au-GE-FAA30V5 and GE-CP40Q12 multi-element package and provided to the Authors in Excel format. Overlimits used Ag-GO-FAG37V. Assays ranged from below detection limit to 4.35 g/t gold and 399 g/t silver. The results from this testing helped guide subsequent drill targeting.
Table 9-2 Panuco Project Surface Samples in 2022
|
Panuco Project 2022 Surface Sample Type
|
|
Sample Type
|
Number of Samples
|
|
Float Grab
|
24
|
|
Outcrop Channel
|
1,157
|
|
Outcrop Grab
|
1
|
|
Mine Channel
|
6
|
|
Mine Dump
|
6
|
|
Mine Outcrop
|
8
|
|
Total
|
1,202
|
Table 9-3 Selected High-Grade Samples Taken During 2022 Surface Exploration
|
Panuco Project 2022 Surface Sample Highlights
|
|
Sample_ID
|
Au g/t
|
Ag g/t
|
Pb ppm
|
Zn ppm
|
Sample Type
|
|
E958352
|
3.24
|
594
|
1,170
|
1,155
|
Outcrop Channel
|
|
E958366
|
2.79
|
575
|
6190
|
1,435
|
Outcrop Channel
|
|
E958312
|
3.79
|
29.8
|
49,000
|
21,700
|
Outcrop Channel
|
|
E958507
|
7.72
|
26
|
10
|
42
|
Outcrop Channel
|
|
E958822
|
8.16
|
510
|
113
|
66
|
Outcrop Channel
|
|
E958286
|
4.25
|
244
|
398
|
911
|
Outcrop Channel
|
|
E958951
|
8.99
|
342
|
168
|
58
|
Outcrop Channel
|
|
E959024
|
4.28
|
576
|
576
|
784
|
Outcrop Channel
|
|
E959027
|
2.80
|
1,420
|
1,955
|
2,860
|
Mine Dump
|
|
E959262
|
31.0
|
54.2
|
1,100
|
838
|
Mine Outcrop
|
|
E959271
|
4.43
|
307
|
268
|
513
|
Outcrop Channel
|
|
E959272
|
2.52
|
399
|
1,997
|
768
|
Float Grab
|
Figure 9-5 Surface Sampling at Panuco Project in 2022

Ageq =Ag*0.93+Au*0.9*1800/24+Pb*0.94*1.1*31.1035/453.592/24+Zn*0.94*1.35*31.1035/453.592/24)
9.6 2023 Surface Sampling
Surface sampling at Panuco in 2023 totalled 638 rock samples (Table 9-4 and Table 9-5). The locations of these samples are shown in Figure 9-6. The sampling follows the same procedure outlined in Section 9.2.
These samples were analyzed at ALS Minerals laboratory by Au-AA23 and ME-ICP61 multi-element package and provided to the Authors in Excel format. Overlimits used Ag-OG62. Sampling followed standard best practice procedures, including the insertion of control samples. Assays ranged from below detection limit to 5.9 g/t gold and 939 g/t silver. The results from this testing helped guide subsequent drill targeting.
Table 9-4 Panuco Project Surface Samples in 2023
|
Panuco Project 2023 Surface Sample Type
|
|
Sample Type
|
Number of Samples
|
|
Float Grab
|
10
|
|
Outcrop Channel
|
613
|
|
Outcrop Grab
|
3
|
|
High Grade Grab
|
1
|
|
Mine Dump
|
7
|
|
Mine Outcrop
|
4
|
|
Total
|
638
|
Table 9-5 Selected High-Grade Samples Taken During 2023 Surface Exploration
|
Panuco Project 2023 Surface Sample Highlights
|
|
Sample_ID
|
Au g/t
|
Ag g/t
|
Pb ppm
|
Zn ppm
|
Sample Type
|
|
E959649
|
4.731
|
939
|
409
|
320
|
Outcrop Channel
|
|
E959743
|
1.783
|
539
|
1067
|
980
|
Outcrop Channel
|
|
E959806
|
2.426
|
777
|
696
|
985
|
Outcrop Channel
|
|
E959809
|
1.537
|
428
|
11100
|
4510
|
Float Grab
|
|
G562569
|
0.833
|
392
|
136
|
464
|
Outcrop Channel
|
|
G562571
|
1.589
|
383
|
91
|
60
|
Outcrop Channel
|
|
G562578
|
4.991
|
771
|
300
|
490
|
Outcrop Channel
|
|
G562584
|
1.551
|
307
|
1598
|
2144
|
Mine Dump
|
|
G562586
|
1.349
|
340
|
280
|
620
|
Mine Dump
|
|
G562587
|
5.187
|
184
|
310
|
354
|
Mine Outcrop
|
|
G562667
|
4.092
|
111
|
88
|
129
|
Outcrop Channel
|
|
G562668
|
5.913
|
55
|
18
|
19
|
Outcrop Channel
|
|
G562671
|
2.977
|
939
|
589
|
997
|
Outcrop Channel
|
|
G562882
|
6.06
|
396
|
61
|
183
|
Outcrop Channel
|
|
G562940
|
2.073
|
83
|
5374
|
493
|
Outcrop Channel
|
|
G562964
|
1.546
|
720
|
8510
|
17000
|
Mine Outcrop
|
|
G566549
|
4.282
|
405
|
185
|
126
|
Outcrop Channel
|
|
G566567
|
3.191
|
238
|
2629
|
3810
|
Mine Dump
|
|
G566568
|
2.054
|
99
|
3897
|
7133
|
Mine Dump
|
|
G566619
|
0.062
|
323
|
200
|
175
|
Outcrop Channel
|
Figure 9-6 Surface Sampling at Panuco Project in 2023
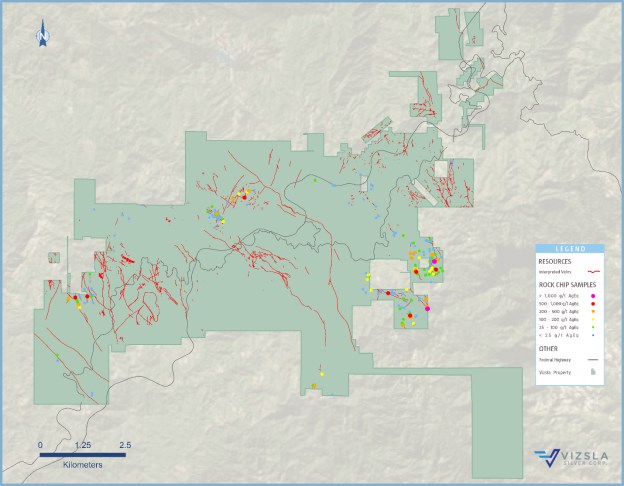
Ageq =Ag*0.93+Au*0.9*1800/24+Pb*0.94*1.1*31.1035/453.592/24+Zn*0.94*1.35*31.1035/453.592/24)
10 DRILLING
Since acquiring the Property in November 2019, Vizsla has conducted several significant drill campaigns in the Napoleon, Copala-Tajitos, Animas and San Antonio areas. Up to September 2023 (data cut-off date for the MRE), Vizsla has completed 824 drill holes (Table 10-1) (Figure 10-1) totaling 303,626.42 m and collected 47,694 assays. Vizsla has continued to drill at the Project since the data cut off for the Mineral Resource estimate.
Drill holes are generally oriented to test structures perpendicular to their strike. Holes are typically HQ diameter, with reduction to NQ diameter when ground conditions necessitate it. Drill-hole collars are surveyed by Trimble differential GPS and Total Station. Downhole orientations of drill-hole azimuth, inclination, and total magnetic field are recorded by a Devico survey instrument every 50 m downhole. A magnetic declination of 7° was used for correcting drill-hole azimuths. Drill-hole geology is recorded for lithology, alteration, mineralization, structures, and veins. Furthermore, drill-hole recovery and RQD are recorded for all drilled intervals.
Table 10-1 Summary Drilling Conducted by Vizsla Silver on the Panuco Project, to September 2023
|
Year
|
Drill-Hole Start
|
Drill-Hole Finish
|
Drill-Hole Count
|
Target Corridor
|
Length Drilled
(m)
|
|
2019
|
AM-19-1,1A
|
AM-19-2
|
3
|
Animas
|
820.50
|
|
2019 Total
|
|
3
|
|
820.50
|
|
2020
|
AM-20-3
|
AM-20-25
|
23
|
Animas
|
6,738.25
|
|
2020
|
CO-20-01
|
CO-20-28
|
28
|
Cordon del Oro
|
6,432.05
|
|
2020
|
CS-20-01
|
CS-20-14
|
14
|
Cinco Señores
|
2,927.10
|
|
2020
|
NP-20-01
|
NP-20-63
|
64
|
Napoleon
|
12,546.02
|
|
2020 Total
|
|
129
|
|
28,643.42
|
|
2021
|
AM-21-26
|
AM-21-39
|
14
|
Animas
|
4,438.50
|
|
2021
|
CO-21-29
|
CO-21-50
|
22
|
Cordon del Oro
|
6,275.55
|
|
2021
|
CS-21-15
|
CS-21-117
|
102
|
Cinco Señores
|
34,769.35
|
|
2021
|
NP-21-64
|
NP-21-242
|
180
|
Napoleon
|
54,759.15
|
|
2021 Total
|
|
318
|
|
100,242.55
|
|
2022
|
AM-22-40
|
AM-22-50
|
11
|
Animas
|
4,883.70
|
|
2022
|
CO-22-51
|
CO-22-69
|
19
|
Cordon del Oro
|
4,251.80
|
|
2022
|
CS-22-118
|
CS-22-253
|
135
|
Cinco Señores
|
52,045.10
|
|
2022
|
NP-22 243
|
NP 22-351
|
106
|
Napoleon
|
52,306.40
|
|
2022 Total
|
|
271
|
|
113,487.00
|
|
2023
|
CS-23-254
|
CS-23-312
|
59
|
Cinco Señores
|
35,134.65
|
|
2023
|
NP-23-352
|
NP-23-396
|
44
|
Napoleon
|
25,298.30
|
|
2023 Total
|
|
103
|
|
60,432.95
|
|
Total
|
|
|
824
|
|
303,626.42
|
Figure 10-1 Resource Models and Location of Drill Holes on the Panuco Project from 2019-2023

10.1 2019 Drilling
In November 2019, Vizsla began drilling on the Panuco Project on the Animas-Refugio corridor near the La Pipa and Mariposa mine areas. A total of 820.50 m in three drill holes was completed in 2019. The three drill holes targeted the La Pipa structure to test below the old historic ore shoot. Results showed low-grade and narrow widths, and no further testwork was carried out.
Drill holes AMS-19-01A and AMS-19-02 were drilled to test the downdip extension of the La Pipa ore shoot that has seen extensive mining. The first hole intersected historic workings and a footwall vein over 5.5 m at 135.0 m downhole. Deeper in the hole a 2.0 m wide quartz-amethyst vein was intersected at 241.5 m downhole. The second hole was completed 77 m down dip on the same section and intersected a shallow hanging wall vein with 3 m grading 125.3 g/t Ag and 0.59 g/t Au and a zone of low-grade veinlets in the projection of the Animas Vein.
10.2 2020 Drilling
Drilling for 2020 totalled 28,643.42 m in 129 drill holes (Figure 10-2). The four main corridors of Napoleon, Cinco Senores, Cordon del Oro, and Animas-Refugio were tested.
In January 2020, drilling resumed at the Mariposa mine area, another historically mined area. Other targets in the Animas-Refugio corridor included, from south to north, Mojocuan, San Carlos, Paloma, and Honduras veins.
Drilling at the Napoleon corridor began in June 2020. A total of 64 drill holes tested the Napoleon structure, for 12,546.02 m. Targets were in the central part of the north-south-trending structure, below old mine workings, and 650 m north in the Papayo area.
At the Cordon del Oro corridor, drilling totalled 6,432.05 m in 28 drill holes. The drilling targeted the Mojocuan, San Carlos, and Peralta mine areas, in addition to the Aguita Zarca vein.
Cinco Senores corridor saw 2,927.10 m of drilling in 14 drill holes. The Tajitos vein was the drilling target, and previously unknown workings were encountered in the first four holes.
Highlights of the 2019-2020 drilling are presented below.
Figure 10-2 Resource Models and Location of 2019 - 2020 Drill Holes on the Panuco Project

Drilling Highlights - 2020
AM-20-16
- 231.0 g/t silver and 2.19 g/t gold over 6.75 m from 286.40 m including;
CO-20-13
CS-20-01
CS-20-02
- 812.5 g/t silver and 4.59 g/t gold over 1.15 m from 110.0 m
CS-20-06
- 536 g/t silver and 4.35 g/t gold over 13.5 m from 96.0 m including;
-
946.8 g/t silver and 7.68 g/t gold over 7.55m from 96.0 m including
-
1,870.0 g/t silver and 15.00 g/t gold over 1.5m from 99.0 m
CS-21-20
- 350.9 g/t silver and 4.52 g/t gold over 4.48 mTW from 124.0 m including,
NP-20-02
NP-20-03
-
453.8 g/t silver and 9.20 g/t gold over 2.5 m from 76.0 m. And,
-
309.3 g/t silver and 8.00 g/t gold, 2.22% lead and 4.75% zinc over 5.1 m from 102.4 m including;
NP-20-07
- 1,808.2 g/t silver, 66.8 g/t gold, 2.99% lead and 3.30 % zinc over 6.0 m from 69.0 including;
-
2,889.2 g/t silver, 107.9 g/t gold, 4.80% lead and 4.56 % zinc over 3.7 m from 69.5 m including;
-
2,240.0 g/t silver, 199.0 g/t gold, 12.85% lead and 3.27% zinc over 0.85 m from 72.35 m
NP-20-05
- 134.3 g/t silver, 1.34 g/t gold, 0.49% lead and 0.91% zinc over 10.65 m from 112.35m including;
NP-20-08
- 494.9 g/t silver, 2.52 g/t gold, 0.51% lead and 1.10% zinc over 4.5 m from 173.5 m including;
NP-20-09
NP-20-18
- 689.5 g/t silver, 3.76 g/t gold, 0.25% lead and 0.63% zinc over 2.5 m from 141.5 m including;
NP-20-25
-
254.7 g/t silver, 2.02 g/t gold, 0.31% lead and 0.61% zinc over 15.3 mTW from 124.7 m including;
-
2790.0 g/t silver, 17.0 g/t gold, 1.88% lead and 3.88% zinc over 0.70 mTW from 127.5 m and,
-
1915.0 g/t silver, 18.2 g/t gold, 1.15% lead and 1.57% zinc over 0.73 mTW downhole from 145.2 m
NP-20-27
-
869.9 g/t silver, 8.70 g/t gold, 0.85% lead and 2.02% zinc over 2.58 mTW from 116.55 m including:
-
415.0 g/t silver, 2.90 g/t gold, 2.01% lead and 2.07% zinc over 2.01 mTW from 106.35 m including:
NP-20-42
- 180.1 g/t silver, 2.27 g/t gold, 0.44% lead and 1.31% zinc over 11.02 m mTW from 149.15 m including;
NP-20-31
- 181.2 g/t silver, 3.75 g/t gold, 0.59% lead and 1.52% zinc over 3.54 mTW from 47.05 m
NP-20-13
- 262.3g/t silver, 2.57 g/t gold, 1.26% lead and 2.0% zinc over 3.23 mTW from 130.35 m
NP-20-50
- 198.0 g/t silver, 0.96 g/t gold, 1.43% lead, and 4.53% zinc over 1.91 mTW from 132.4 m including;
NP-20-36
- 144.3 g/t silver, 1.21 g/t gold, 0.75% lead, and 2.41% zinc over 2.46 mTW from 184.5 m
NP-20-54
NP-20-49
-
63.0 g/t silver, 1.54 g/t gold, 0.23% lead and 1.24% zinc over 6.0 mTW from 163.3 m including;
-
215.9 g/t silver, 5.80 g/t gold, 0.30% lead and 3.95% zinc over 1.45 mTW from 168.75 m
10.3 2021 Drilling
Drilling at the Panuco Project in 2021 totalled 100,242.55 m in 318 drill holes (Figure 10-3). The drilling focused along the Napoleon and Tajitos vein areas, with 54,759.15 m in 180 drill holes and 34,769.35 m in 102 drill holes, respectively (Table 10-1). Additionally, 4,438.50 m in 14 drill holes were drilled in the Animas-Refugio corridor, and 6,275.55 m in 22 drill holes in the Cordon del Oro corridor. Highlights of the 2021 drilling are presented below.
At Napoleon, infill and delineation drilling focused on denser drilling to inform the Mineral Resource estimate and expand the structure's strike length. The Josephine vein, a subparallel system to Napoleon which was identified initially as an electromagnetic geophysical target, was first intersected in Hole NP-21-132, leading to additional targeting in the area and its inclusion in the Mineral Resource estimate. Further drill testing included the Cruz Negra and Alacran vein areas.
Drilling at the Tajitos vein area focused on delineation and infilling, with additional exploration drilling to the north. The Tajitos resource drilling led to the discovery of the Copala vein -- a relatively thick subhorizontal structure on the Tajitos northeastern extent. Other exploration drilling along the Cinco Senores corridor included the Cinco Senores and Colorada veins to north of Tajitos.
In the Animas-Refugio corridor, drilling tested the Rosarito segment included in the Mineral Resource estimate, in addition to the Peralta and Cuevillas veins.
Drilling at the Cordon del Oro corridor targeted the San Antonio structure included in the Mineral Resource estimate, in addition to exploration near the Aguita Zarca vein.
Figure 10-3 Resource Models and Location of Drill Holes on the Panuco Project from 2021
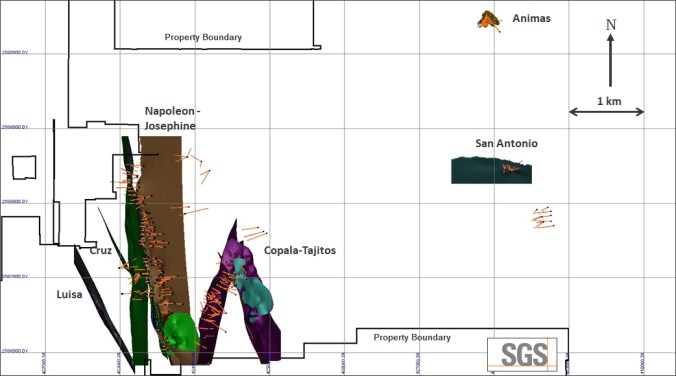
Table 10-2 Highlights of the 2021 Drilling
|
Drillhole
|
FROM
(m)
|
To
(m)
|
Down Hole
Length
(m)
|
Est. true
width
(m)
|
Gold
(g/t)
|
Silver
(g/t)
|
Lead
(%)
|
Zinc
(%)
|
|
Napoleon Trend
|
|
NP-21-84
|
238.50
|
248.20
|
9.70
|
7.58
|
1.06
|
58
|
0.47
|
1.28
|
|
Inc.
|
246.00
|
246.85
|
0.85
|
0.66
|
2.89
|
235
|
1.26
|
3.03
|
|
NP-21-89
|
92.00
|
108.80
|
16.80
|
10.30
|
3.13
|
356
|
0.80
|
0.81
|
|
Inc.
|
94.80
|
95.15
|
0.35
|
0.21
|
1.66
|
398
|
20.00
|
4.49
|
|
And
|
100.05
|
100.50
|
0.45
|
0.28
|
21.00
|
1,070
|
0.43
|
4.14
|
|
And
|
106.75
|
107.60
|
0.85
|
0.52
|
13.95
|
3,150
|
0.76
|
1.33
|
|
NP-21-90
|
192.30
|
194.75
|
2.45
|
1.92
|
7.28
|
106
|
0.70
|
2.87
|
|
Inc.
|
192.30
|
194.15
|
1.85
|
1.45
|
9.39
|
131
|
0.76
|
3.15
|
|
NP-21-91
|
248.40
|
250.50
|
2.10
|
1.61
|
1.10
|
110
|
1.29
|
2.19
|
|
NP-21-93
|
63.25
|
64.90
|
1.65
|
1.09
|
2.09
|
85
|
0.15
|
0.36
|
|
NP-21-94
|
221.90
|
228.70
|
6.80
|
4.46
|
19.99
|
890
|
0.71
|
1.76
|
|
inc.
|
225.10
|
226.50
|
1.40
|
0.92
|
91.91
|
3,804
|
1.50
|
3.48
|
|
NP-21-95
|
56.10
|
60.50
|
4.40
|
1.67
|
1.17
|
132
|
0.12
|
0.25
|
|
NP-21-99
|
247.35
|
259.80
|
12.45
|
6.15
|
5.14
|
87
|
0.38
|
1.37
|
|
Incl.
|
249.75
|
251.00
|
1.25
|
0.62
|
31.70
|
113
|
0.44
|
1.86
|
|
NP-21-102
|
319.10
|
328.85
|
9.75
|
3.93
|
1.93
|
41
|
0.80
|
3.10
|
|
Incl.
|
320.65
|
321.55
|
0.90
|
0.36
|
7.53
|
113
|
5.46
|
21.50
|
|
NP-21-104
|
209.20
|
213.40
|
4.20
|
3.45
|
25.97
|
1,275
|
0.75
|
3.00
|
|
Incl.
|
209.60
|
211.60
|
2.00
|
1.64
|
49.26
|
2,374
|
0.86
|
3.50
|
|
incl.
|
210.20
|
211.00
|
0.80
|
0.66
|
88.20
|
5,410
|
1.02
|
1.95
|
|
NP-21-105
|
71.65
|
74.60
|
2.95
|
1.61
|
2.16
|
354
|
0.39
|
2.35
|
|
NP-21-107
|
237.70
|
242.35
|
4.65
|
3.73
|
2.85
|
105
|
0.67
|
1.44
|
|
Incl.
|
240.00
|
241.50
|
1.50
|
1.20
|
4.71
|
156
|
0.65
|
1.79
|
|
NP-21-110
|
128.30
|
131.70
|
3.40
|
2.62
|
5.51
|
476
|
1.49
|
1.06
|
|
Incl.
|
130.80
|
131.70
|
0.90
|
0.69
|
14.40
|
1,545
|
1.23
|
2.67
|
|
NP-21-112
|
142.55
|
155.05
|
12.50
|
8.36
|
5.58
|
372
|
0.24
|
0.94
|
|
Incl.
|
142.55
|
146.00
|
3.45
|
2.31
|
18.88
|
1,306
|
0.73
|
2.07
|
|
Incl.
|
142.55
|
144.55
|
2.00
|
1.34
|
31.93
|
2,243
|
1.23
|
3.53
|
|
NP-21-114
|
259.85
|
263.70
|
3.85
|
2.94
|
2.06
|
47
|
0.62
|
1.76
|
|
NP-21-115
|
99.55
|
100.00
|
0.45
|
|
2.24
|
590
|
0.97
|
4.99
|
|
NP-21-116
|
164.25
|
184.90
|
20.65
|
11.34
|
3.11
|
88
|
0.26
|
2.13
|
|
Incl.
|
164.75
|
165.55
|
0.80
|
0.44
|
7.04
|
118
|
1.76
|
2.69
|
|
And
|
169.10
|
170.40
|
1.30
|
0.71
|
12.85
|
36
|
0.47
|
2.17
|
|
And
|
178.90
|
180.50
|
1.60
|
0.88
|
9.57
|
618
|
0.43
|
1.21
|
|
NP-21-116
|
202.55
|
213.00
|
10.45
|
5.24
|
4.43
|
67
|
1.30
|
1.13
|
|
NP-21-117
|
205.85
|
208.50
|
2.65
|
1.00
|
0.76
|
127
|
0.21
|
1.25
|
|
NP-21-118
|
150.20
|
158.65
|
8.45
|
4.87
|
3.70
|
112
|
0.35
|
1.52
|
|
Incl.
|
150.55
|
151.15
|
0.60
|
0.35
|
28.90
|
226
|
1.95
|
7.32
|
|
And
|
155.25
|
156.00
|
0.75
|
0.43
|
6.13
|
234
|
0.71
|
4.16
|
|
Drillhole
|
FROM
(m)
|
To
(m)
|
Down Hole
Length
(m)
|
Est. true
width
(m)
|
Gold
(g/t)
|
Silver
(g/t)
|
Lead
(%)
|
Zinc
(%)
|
|
NP-21-129
|
63.00
|
64.65
|
1.65
|
|
0.84
|
1,210
|
0.25
|
0.70
|
|
Incl.
|
64.35
|
64.65
|
0.30
|
|
4.58
|
5,750
|
1.34
|
3.67
|
|
NP-21-133
|
248.25
|
250.60
|
2.35
|
1.46
|
10.74
|
188
|
1.27
|
3.47
|
|
NP-21-135
|
322.00
|
324.10
|
2.10
|
1.26
|
0.61
|
126
|
0.06
|
1.66
|
|
NP-21-142
|
289.50
|
295.70
|
6.20
|
3.01
|
3.62
|
40
|
0.80
|
3.98
|
|
NP-21-145
|
328.40
|
333.25
|
4.85
|
3.40
|
3.10
|
110
|
1.20
|
1.11
|
|
NP-21-148
|
339.20
|
340.60
|
1.40
|
|
6.49
|
114
|
0.78
|
8.02
|
|
Incl.
|
340.00
|
340.30
|
0.30
|
0.11
|
25.20
|
365
|
2.71
|
22.90
|
|
NP-21-149
|
210.45
|
218.60
|
8.15
|
5.93
|
11.35
|
185
|
0.49
|
2.25
|
|
Incl.
|
211.85
|
214.45
|
2.60
|
1.89
|
33.78
|
344
|
1.17
|
6.30
|
|
NP-21-150*
|
65.25
|
68.15
|
2.90
|
|
3.95
|
34
|
|
|
|
Incl.
|
66.50
|
67.70
|
1.20
|
|
6.77
|
41
|
|
|
|
NP-21-153*
|
83.55
|
85.25
|
1.70
|
|
6.87
|
55
|
|
|
|
Incl.
|
83.55
|
84.40
|
0.85
|
|
9.14
|
86
|
|
|
|
NP-21-154
|
165.45
|
169.55
|
4.10
|
2.37
|
0.31
|
27
|
0.20
|
0.70
|
|
NP-21-155
|
248.00
|
257.00
|
9.00
|
6.33
|
1.79
|
52
|
0.17
|
1.14
|
|
Incl.
|
253.00
|
256.55
|
3.55
|
2.50
|
3.03
|
64
|
0.24
|
2.42
|
|
Incl.
|
256.00
|
256.55
|
0.55
|
0.39
|
6.21
|
58
|
0.50
|
3.05
|
|
NP-21-157
|
391.50
|
401.60
|
10.10
|
3.96
|
1.79
|
82
|
0.76
|
5.22
|
|
NP-21-164
|
354.00
|
362.65
|
8.65
|
6.96
|
2.12
|
74
|
0.40
|
2.10
|
|
Incl.
|
354.90
|
358.15
|
3.25
|
2.62
|
3.50
|
104
|
0.21
|
3.95
|
|
NP-21-167
|
351.15
|
360.02
|
8.87
|
4.37
|
1.26
|
111
|
0.96
|
3.02
|
|
Incl.
|
351.15
|
359.75
|
8.60
|
2.77
|
1.78
|
165
|
1.30
|
4.21
|
|
Incl.
|
353.30
|
353.60
|
0.30
|
0.15
|
7.96
|
988
|
1.63
|
15.95
|
|
NP-21-168
|
292.25
|
306.25
|
14.00
|
5.76
|
0.81
|
56
|
0.84
|
2.55
|
|
NP-21-172
|
362.75
|
370.50
|
7.75
|
7.32
|
1.34
|
114
|
0.21
|
0.77
|
|
Incl.
|
369.00
|
370.50
|
1.50
|
1.42
|
2.56
|
458
|
0.14
|
0.50
|
|
NP-21-173
|
108.50
|
112.20
|
3.70
|
|
6.80
|
99
|
0.20
|
1.83
|
|
Incl.
|
108.50
|
109.40
|
0.90
|
|
26.00
|
263
|
0.28
|
5.40
|
|
And
|
136.05
|
141.30
|
5.25
|
1.83
|
2.57
|
277
|
0.27
|
3.70
|
|
Incl.
|
136.05
|
136.80
|
0.75
|
0.26
|
13.95
|
1,430
|
0.66
|
23.30
|
|
NP-21-176
|
167.45
|
169.50
|
2.05
|
1.06
|
0.66
|
64
|
4.37
|
3.18
|
|
And
|
176.90
|
177.35
|
0.45
|
|
18.75
|
1,090
|
4.18
|
8.19
|
|
And
|
216.00
|
217.50
|
1.50
|
|
2.41
|
71
|
0.36
|
1.02
|
|
NP-21-178
|
228.15
|
241.25
|
13.10
|
10.69
|
1.21
|
220
|
0.41
|
0.77
|
|
Incl.
|
237.00
|
241.25
|
4.25
|
3.47
|
2.81
|
469
|
0.66
|
1.17
|
|
NP-21-181
|
462.00
|
463.10
|
1.10
|
0.74
|
1.72
|
9
|
0.21
|
0.26
|
|
NP-21-183
|
275.55
|
276.95
|
1.40
|
|
3.57
|
24
|
1.32
|
1.57
|
|
NP-21-184
|
358.85
|
363.25
|
4.40
|
1.63
|
2.69
|
34
|
0.19
|
2.16
|
|
NP-21-191
|
545.20
|
547.90
|
2.70
|
0.80
|
0.29
|
148
|
0.25
|
3.44
|
|
NP-21-192A
|
143.60
|
145.50
|
1.90
|
1.14
|
4.75
|
128
|
1.20
|
2.53
|
|
Drillhole
|
FROM
(m)
|
To
(m)
|
Down Hole
Length
(m)
|
Est. true
width
(m)
|
Gold
(g/t)
|
Silver
(g/t)
|
Lead
(%)
|
Zinc
(%)
|
|
NP-21-194
|
113.65
|
114.30
|
0.65
|
0.39
|
7.76
|
286
|
1.68
|
3.42
|
|
NP-21-198
|
85.25
|
88.50
|
3.25
|
2.90
|
0.76
|
210
|
2.22
|
1.84
|
|
Tajitos Vein*
|
|
CS-21-37*
|
207.30
|
209.20
|
1.90
|
1.34
|
7.94
|
960
|
|
|
|
Incl.
|
207.30
|
208.50
|
1.20
|
0.85
|
12.05
|
1,465
|
|
|
|
And
|
223.20
|
223.90
|
0.70
|
|
4.16
|
2,082
|
|
|
|
Incl.
|
223.20
|
223.50
|
0.30
|
|
9.01
|
4,590
|
|
|
|
CS-21-41*
|
226.65
|
229.50
|
2.85
|
2.15
|
1.09
|
188
|
|
|
|
CS-21-44*
|
261.25
|
263.10
|
1.80
|
1.38
|
2.83
|
527
|
|
|
|
Incl.
|
261.25
|
262.00
|
0.75
|
0.57
|
3.17
|
639
|
|
|
|
Incl.
|
313.60
|
314.70
|
1.10
|
|
1.78
|
418
|
|
|
|
CS-21-49*
|
176.05
|
184.50
|
8.45
|
|
2.56
|
304
|
|
|
|
Incl.
|
179.45
|
181.00
|
1.55
|
|
8.27
|
816
|
|
|
|
CS-21-50*
|
251.40
|
254.30
|
2.85
|
1.99
|
2.46
|
615
|
|
|
|
Incl.
|
251.40
|
252.40
|
1.00
|
0.70
|
6.45
|
1,640
|
|
|
|
CS-21-52*
|
291.75
|
293.00
|
1.25
|
0.86
|
3.37
|
315
|
|
|
|
CS-21-60*
|
334.50
|
345.20
|
10.70
|
6.82
|
1.40
|
201
|
|
|
|
Incl.
|
339.80
|
345.20
|
5.40
|
3.44
|
2.27
|
308
|
|
|
|
Cs-21-66*
|
175.45
|
176.80
|
1.30
|
|
2.47
|
600
|
|
|
|
And
|
348.30
|
350.50
|
2.20
|
1.50
|
9.90
|
2,607
|
|
|
|
CS-21-71*
|
201.50
|
205.50
|
4.00
|
3.84
|
3.25
|
901
|
|
|
|
Incl.
|
201.50
|
203.60
|
2.10
|
2.02
|
5.88
|
1,618
|
|
|
|
CS-21-77*
|
159.70
|
160.40
|
0.70
|
|
5.73
|
1,115
|
|
|
* No material Pb and Zn grades in Tajitos and Copala Mineralization
10.4 2022 Drilling
Drilling for 2022 totalled 113,487 m in 271 drill holes (Figure 10-4) (Table 10-3). The four main corridors of Napoleon, Cinco Senores, Cordon del Oro, and Animas-Refugio were tested.
Drilling at the Napoleon corridor included 106 drill holes tested the Napoleon structure, for 52,306.40 m. At the Cordon del Oro corridor, drilling totalled 4,251.8 m in 19 drill holes. Drilling at the Copala/Tajitos veins included 135 drill holes for 52,045.10 m. Additionally, 4,883.70 m in 11 drill holes were drilled in the Animas-Refugio corridor.
The bulk of 2022 drilling was centred on the western portion of the district, focused on upgrading and expanding resources at the Copala and Napoleon areas. At Copala, mineralization has now been traced over 1,150 meters along strike, 400 m down dip, and remains open to the north and southeast.
At Napoleon, drilling throughout 2022 successfully expanded mineralization along strike and down plunge to the south, several vein splays were identified in the hanging wall and footwall of the main structure.
Other notable discoveries include the Cristiano Vein; marked by high precious metal grades up to 1,935 g/t Ag and 15.47 g/t Au over 1.46 m, located immediately adjacent to Copala; and La Luisa Vein, located ~700 m west of Napoleon which continues to display similar silver and gold zonation as that seen at Napoleon.
Figure 10-4 Resource Models and Location of Drill Holes on the Panuco Project from 2022

Table 10-3 Highlights of the 2022 Drilling
|
Drillhole
|
From
(m)
|
To
(m)
|
down hole
length
(m)
|
Est. true
width
(m)
|
Gold
(g/t)
|
Silver
(g/t)
|
Lead
(%)
|
Zinc
(%)
|
Vein
|
|
CS-22-191*
|
370.95
|
374.85
|
3.90
|
3.28
|
14.23
|
4,804
|
|
|
Copala FW
|
|
NP-22-281
|
477.50
|
480.00
|
2.50
|
1.40
|
25.84
|
3,585
|
0.32
|
1.07
|
Napoleon HW
|
|
CS-22-161*
|
226.10
|
229.80
|
3.70
|
2.65
|
13.16
|
2,461
|
|
|
Copala
|
|
CS-22-182*
|
42.70
|
44.55
|
1.85
|
1.46
|
15.47
|
1,935
|
|
|
Cristiano
|
|
NP-22-316
|
390.00
|
391.05
|
1.05
|
1.00
|
1.6
|
2,642
|
1.87
|
4.08
|
Napoleon FW
|
|
CS-22-205*
|
283.00
|
288.50
|
5.50
|
5.30
|
9.54
|
2,101
|
|
|
Copala
|
|
CS-22-159*
|
187.70
|
192.20
|
4.50
|
2.66
|
8.6
|
2,011
|
|
|
Copala FW
|
|
CS-22-193*
|
171.40
|
184.90
|
13.50
|
10.20
|
10.94
|
1,404
|
|
|
Copala
|
|
NP-22-258
|
493.15
|
498.55
|
5.40
|
4.30
|
11.48
|
1,139
|
0.32
|
0.85
|
Napoleon
|
|
CS-22-154*
|
124.45
|
136.50
|
12.05
|
9.35
|
5.44
|
1,010
|
|
|
Copala
|
|
NP-22-300
|
347.95
|
353.85
|
5.90
|
3.90
|
5.28
|
913
|
0.15
|
0.25
|
Napoleon
|
|
CS-22-169*
|
162.95
|
188.35
|
25.40
|
20.45
|
4.23
|
780
|
|
|
Copala
|
|
CS-22-191*
|
348.20
|
363.10
|
14.90
|
12.52
|
4.93
|
706
|
|
|
Copala
|
|
CS-22-155*
|
159.00
|
174.35
|
15.35
|
14.50
|
3.89
|
667
|
|
|
Copala
|
|
CS-22-200*
|
150.00
|
166.00
|
16.00
|
14.24
|
4.3
|
632
|
|
|
Copala
|
|
CS-22-173*
|
256.15
|
270.90
|
14.75
|
14.46
|
2.9
|
663
|
|
|
Copala
|
|
NP-22-271
|
456.05
|
465.25
|
9.20
|
7.00
|
2.76
|
223
|
1.54
|
5.01
|
Napoleon HW
|
|
NP-22-271
|
508.05
|
516.25
|
8.20
|
6.24
|
2.92
|
393
|
0.40
|
0.94
|
Napoleon
|
* No material Pb and Zn grades in Tajitos and Copala Mineralization
10.5 2023 Drilling
Drilling for 2023 (to September) totalled 60,432.95 m in 103 drill holes (Figure 10‑5) (Table 10‑4). The main Napoleon and Cinco Senores corridors were tested.
Drilling at the Napoleon corridor included 44 drill holes testing the Napoleon structure, for 25,298.30 m. Drilling at the Copala/Tajitos veins included 59 drill holes for 35,134.65 m.
The 2023 drilling was centred on the western portion of the district, focused on upgrading and expanding resources at the Copala and Napoleon areas. At Copala, mineralization has now been traced over 1,700 m along strike and to depths of 450 to 550 m and remains open to the north and southeast.
At Napoleon, drilling throughout 2023 successfully expanded mineralization along strike and down plunge/dip to the south, several vein splays were identified in the hanging wall and footwall of the main structure. Other notable discoveries include the Luisa Vein and the Molino Vein. La Luisa is a high-grade structure located ~700 m west of Napoleon. To date, 44 holes completed at Luisa have traced mineralization along 1,670 m of strike length and to an average depth of 450 m. Luisa has an average with of 3.21 m and a weighted average grade of 497 g/t AgEq El Molino Vein, situated in between the Copala and Napoleon resource areas, is a near-surface vein that was discovered during preliminary condemnation drilling. El Molino is marked by high precious metal grades up to 1,552 g/t Ag and 8.37 g/t Au over 1.65 m.
Figure 10-5 Resource Models and Location of Drill Holes on the Panuco Project from 2023 (to September 1, 2023)

Table 10-4 Highlights of the 2023 Drilling (to September)
|
Drillhole
|
From
(m)
|
To
(m)
|
Down hole
length
(m)
|
Est. true width
(m)
|
Gold
(g/t)
|
Silver
(g/t)
|
Lead
(%)
|
Zinc
(%)
|
Vein
|
|
CS-23-265
|
380.6
|
388.95
|
8.35
|
5.89
|
4.24
|
1,403
|
-
|
-
|
Copala
|
|
NP-23-395
|
657.1
|
669.3
|
12.2
|
11.2
|
7.14
|
229
|
0.34
|
1.64
|
La Luisa Main
|
|
NP-23-358
|
501.3
|
513.9
|
12.6
|
5.6
|
11.13
|
257
|
0.42
|
2.03
|
La Luisa Main
|
|
CS-23-254
|
535.4
|
538.3
|
2.9
|
2.14
|
22.46
|
1,319
|
-
|
-
|
Copala
|
|
CS-23-253
|
295.4
|
297.5
|
2.1
|
2.1
|
10.91
|
1,920
|
-
|
-
|
Copala
|
|
CS-23-304
|
468
|
471.3
|
3.3
|
2.8
|
6.8
|
1,366
|
-
|
-
|
Copala
|
|
CS-23-290
|
557.8
|
588.7
|
30.9
|
5.05
|
3.48
|
565
|
-
|
-
|
Copala 2
|
|
NP-23-359
|
80
|
82.05
|
2.05
|
1.65
|
8.37
|
1,552
|
0.47
|
1.22
|
El Molino
|
|
NP-23-391
|
526.15
|
528.2
|
2.05
|
1.9
|
7.37
|
908
|
1.62
|
4.91
|
Napoleon FW2
|
|
NP-23-362
|
618.25
|
626.3
|
8.05
|
3.05
|
5.82
|
372
|
2.15
|
3.15
|
Luisa HW 2
|
* Table of Top 10 Drill Composites of 2023, ordered from highest to lowest grade AgEq (see press release dated December 19, 2023)
11 SAMPLE PREPARATION, ANALYSES, AND SECURITY
Since acquiring the Property in November 2019, Vizsla has maintained a comprehensive and consistent system for the sample preparation, analysis and security of all surface samples and drill core samples, including the implementation of an extensive QA/QC program. The current MRE is limited to drilling data collected by Vizsla since the acquisition of the Property as summarized in Table 11-1. The following describes sample preparation, analyses and security protocols implemented by Vizsla with analytical labs and analysis methods summarised in Table 11-2.
Since the beginning of drilling in 2019, all samples are shipped to ALS Limited in Zacatecas, Zacatecas, Mexico for sample preparation and for analysis at the ALS laboratory in North Vancouver, BC, Canada. The ALS Zacatecas and North Vancouver facilities are ISO 9001 and ISO/IEC 17025 certified. Silver and base metals are analyzed using a four-acid digestion with an inductively coupled plasma ("ICP") finish and gold was assayed by 30-gram fire assay with atomic absorption ("AA") spectroscopy finish. Over-limit analyses for silver, lead and zinc are re-assayed using an ore-grade four-acid digestion with an ICP finish. Samples with over-limit silver assays > 1500 ppm are fire assayed by gravimetric methods on 30 g sample pulps. Control samples comprising certified reference samples, duplicates and blank samples were systematically inserted into the sample stream and analyzed as part of the Company's QA/QC protocol. The Authors are independent of ALS Limited in Zacatecas, Zacatecas, Mexico and ALS North Vancouver, BC, Canada.
Table 11-1 Summary of Drilling Samples Included in the MRE by Year
|
Year
|
Company
|
Hole Type
|
Drillhole Start
|
Drillhole Finish
|
Drillhole Count
|
Total Samples
|
|
2019
|
Vizsla Silver
|
DDH
|
AM-19-1,1A
|
AM-19-2
|
3
|
107
|
|
2020
|
Vizsla Silver
|
DDH
|
AM-20-3
|
AM-20-25
|
23
|
961
|
|
2020
|
Vizsla Silver
|
DDH
|
CO-20-01
|
CO-20-28
|
28
|
2376
|
|
2020
|
Vizsla Silver
|
DDH
|
CS-20-01
|
CS-20-14
|
13
|
326
|
|
2020
|
Vizsla Silver
|
DDH
|
NP-20-01
|
NP-20-63
|
63
|
2519
|
|
2021
|
Vizsla Silver
|
DDH
|
AM-21-26
|
AM-21-39
|
14
|
591
|
|
2021
|
Vizsla Silver
|
DDH
|
CO-21-29
|
CO-21-50
|
22
|
2185
|
|
2021
|
Vizsla Silver
|
DDH
|
CS-21-15
|
CS-21-117
|
102
|
4935
|
|
2021
|
Vizsla Silver
|
DDH
|
NP-21-64
|
NP-21-246
|
180
|
6731
|
|
2022
|
Vizsla Silver
|
DDH
|
AM-22-40
|
AM-22-50
|
11
|
663
|
|
2022
|
Vizsla Silver
|
DDH
|
CO-22-51
|
CO-22-69
|
19
|
710
|
|
2022
|
Vizsla Silver
|
DDH
|
CS-22-118
|
CS-22-253*
|
135
|
9690
|
|
2022
|
Vizsla Silver
|
DDH
|
NP-22-243
|
NP-22-351*
|
106
|
7481
|
|
2023
|
Vizsla Silver
|
DDH
|
CS-23-254
|
CS-23-312
|
59
|
5789
|
|
2023
|
Vizsla Silver
|
DDH
|
NP-23-352
|
NP-23-396*
|
44
|
2631
|
|
Total
|
|
822
|
47,695
|
Table 11-2 Summary of Drill Core Analytical Labs and Analysis Methods 2019 - 2023
|
Year
|
Company
|
Lab & Location
|
Prep Code
|
Fire Assay Method
|
Fire Assay
Code
|
Multi-
element
Method
|
Multi-
element
Code
|
|
2019-2023
|
Vizsla Silver
|
ALS Limited Zacatecas, Mexico & North Vancouver, Canada
|
PREP-31
|
Pb fire assay 30g fusion - over-limit Ag gravimetric finish, routine Au AA finish, over-limit Au gravimetric finish
|
Ag-GRA21, Ag-CON01, Au-AA23, Au-GRA21
|
4 Acid digestion ICP-AES with ore-grade over-limit
|
ME-ICP61, OG62
|
11.1 2019 - 2023 Rock Sampling (Vizsla Silver)
Surface and underground sampling consists of chip, float, and channel samples. Samples are oriented perpendicular to mineralized structures, local variations in mineralization, and are sampled separately. At least one sample on either side of the mineralized structure is also collected. Samples are collected as continuous chip channel, with minimum sample lengths of 30 cm and maximum sample lengths of 1.5 m. The sample length and the width of the chipped channel, typically 10 to 15 cm, is recorded along with the sample's estimated true width.
In the warehouse, certified reference materials and blanks are inserted into the sample sequence of surface and underground samples. The samples are packed into large (reused rice/sugar) sacks for transport. A control file with sack number and rock sample numbers contained in each sack and the laboratory sample dispatch form accompanies the sample shipment (used to control and monitor the shipment). The control files are used to track the progress of the samples to the lab and through to receiving results. The sample shipment is delivered to the laboratory via a parcel transport company. The lab then sends a confirmation note and sample log by electronic mail to confirm sample delivery.
From 2019 to 2021 rock samples were shipped to ALS in Zacatecas, Zacatecas, Mexico for sample preparation and reduction and sample pulps were further sent to ALS in North Vancouver, BC, Canada for analysis. The ALS Zacatecas and North Vancouver facilities are ISO 9001 and ISO/IEC 17025 certified. Samples were dried, weighed, and crushed, and a 250 g split is pulverized to at least 85% passing (P85) 75 µm (ALS Method Code PREP-31).
Silver, base metals and pathfinder elements are analyzed using a four-acid digestion method with an inductively coupled plasma (ICP) finish as part of a geochemical suite (ALS Method Code ME-ICP61). Over-limit analyses for silver (>100 ppm), lead (>10,000 ppm), and zinc (>10,000 ppm) are re-assayed using an ore-grade four-acid digestion with inductively coupled plasma (ICP) finish (ALS Method Code OG62). Samples with over-limit silver assays >1500 ppm are fire assayed by gravimetric methods on 30 g sample pulps (ALS Method Code Ag-GRA21). Samples with over-limit silver assays >10,000 ppm are reanalyzed with a concentrate and bullion grade method using fire assay and gravimetric finish (ALS Method Code Ag-CON01). Gold is fire assayed with AA spectroscopy finish on 30 g sample pulps (ALS Method Code Au-AA23) and gold over-limits (>10 ppm) are reanalyzed by fire assay with gravimetric finish (ALS Method Code Au-GRA21).
Beginning in 2022, rock samples are shipped to the SGS laboratory in Durango, Mexico for sample preparation, reduction, and analysis. The SGS Durango facilities are ISO/IEC 17025 certified. The Authors and SGS Geological Services are independent of SGS Geochemistry and the Durango, Mexico laboratory.
Samples are dried, weighed, and crushed, and a 250 g split is pulverized to at least 85% passing (P85) 75 µm (SGS Method Code PUL85_CR).
Silver, base metals and pathfinder elements are analyzed using a four-acid digestion method with an inductively coupled plasma (ICP) finish as part of a geochemical suite (SGS Method Code GE_ICP40Q12). Over-limit analyses for lead (>10,000 ppm) and zinc (>10,000 ppm) are re-assayed using an ore-grade sodium peroxide digestion with inductively coupled plasma (ICP) finish (SGS Method Code GO_ICP90Q100). Samples with over-limit silver assays >100 ppm are fire assayed by gravimetric methods on 30 g sample pulps (SGS Method Code GO_FAG37V). Gold is fire assayed with AA spectroscopy finish on 30 g sample pulps (SGS Method Code GE_FAA30V5) and gold over-limits (>10 ppm) are reanalyzed by fire assay with gravimetric finish (SGS Method Code GO_FAG30V).
11.2 2019 - 2023 Drilling Programs (Vizsla Silver)
11.2.1 Sample Preparation and Security
Core is collected into boxes with lids at the drill site and marked with the drill-hole number. At the end of each core-run, the driller places the core carefully into the box and marks the down-hole depth and recovered interval on wooden blocks. When a core box is full with core, the core boxes are tightly closed and tied using raffia or rubber-band straps prior to transportation from drill-site to the core shack. Transportation of the core boxes is done by the drilling contractors.
Upon arrival at the core shack, the drill core is cleaned prior to being photographed. The drill core is logged for lithology, structure, alteration, and mineralization prior to marking out sample intervals. Lithologic and sample logging is done digitally using the Geobank software. Figure 11-1 shows the core logging facility and longer -term core storage area at the Concordia, Sinaloa facility. Sample intervals are defined to honor vein, mineralization, alteration, and lithology contacts. Suspect high-grade intervals are sampled separately. The maximum sample length is 1.5 m, and the minimum sample length is 0.20 m. Before sampling, the geologist also marks a saw line along the core axis trying to split the vein or mineralized structure into two symmetrical halves.
Figure 11-1 Vizsla Silver Core-Logging Facility in Concordia, Sinaloa. Left: Core
logging area; Right: Long-Term, Covered and Fenced, Core Storage Area

The sampler saws HQ core in half, with half being submitted for analysis and half remaining in the core box as a record. The sampler saws PQ core such that one-quarter of the core is submitted for analysis, and the remaining three-quarters remain in the core box as a record. Only one piece of core is removed from the core box at a time, and care is taken to replace the unsampled portion of the core in the core box in the original orientation. The drill-hole number and sample intervals are clearly entered into a sample book to back up the digital logging files. The geologist staples the portion of the uniquely numbered sample ticket at the beginning of the corresponding sample interval in the core box, and the sampler places one portion of the ticket in the sample bag. The sample ticket book is archived at the Concordia camp. Sample bags are sealed with a plastic strap and are stored in Vizsla Silver's secure warehouse. No directors or officers of the company are involved in sample collection or preparation.
In the warehouse, certified reference materials and blanks are inserted into the sample stream, and then the samples are bagged in sacks for transport. A control file, the laboratory sample dispatch form, includes the sack number and contained sample-bag numbers in each sack. The laboratory sample dispatch form accompanies the sample shipment and is used to control and monitor the shipment. The control files are used to keep track of the time it takes to the samples to get to the lab, and time taken to receive assay certificates, the turn around time. The sample shipment is delivered to ALS in Zacatecas via a parcel transport company. ALS sends a confirmation email with detail of samples received upon delivery.
Sample preparation and reduction is carried out at ALS in Zacatecas, Zacatecas, Mexico and sample pulps are further sent to ALS in North Vancouver, BC, Canada for analysis. The ALS Zacatecas and North Vancouver facilities are ISO 9001 and ISO/IEC 17025 certified. Samples are dried, weighed, and crushed, and a 250 g split is pulverized to at least 85% passing (P85) 75 µm (ALS Method Code PREP-31).
11.2.2 Sample Analyses
Silver, base metals and pathfinder elements are analyzed using a four-acid digestion method with an inductively coupled plasma (ICP) finish as part of a geochemical suite (ALS Method Code ME-ICP61). Over-limit analyses for silver (>100 ppm), lead (>10,000 ppm), and zinc (>10,000 ppm) are re-assayed using an ore-grade four-acid digestion with inductively coupled plasma (ICP) finish (ALS Method Code OG62). Samples with over-limit silver assays >1500 ppm are fire assayed by gravimetric methods on 30 g sample pulps (ALS Method Code Ag-GRA21). Samples with over-limit silver assays >10,000 ppm are reanalyzed with a concentrate and bullion grade method using fire assay and gravimetric finish (ALS Method Code Ag-CON01). Gold is fire assayed with AA spectroscopy finish on 30 g sample pulps (ALS Method Code Au-AA23) and gold over-limits (>10 ppm) are reanalyzed by fire assay with gravimetric finish (ALS Method Code Au-GRA21).
11.2.3 Bulk Density
Drill core samples were submitted to ALS for bulk density determinations using the water displacement method on wax-coated core (Code OA-GRA09A). To date Vizsla has obtained a total of 511 bulk density determinations for the Property. Bulk density determinations from 2020 drill core totaled 37 samples, 20 samples from Napoleon and 17 samples from Tajitos. Bulk density determinations from 2021 drill core totaled 164 samples, 81 samples from Napoleon and 83 samples from Tajitos. Bulk density determinations from 2022 drill core totaled 310 samples, 128 samples from Napoleon, 151 samples from Tajitos, and 31 samples from Cordon del Oro.
In May of 2022, Vizsla began taking bulk density measurements on site. Specific gravity testing on drill core is conducted on 10cm wide core samples using the volumetric displacement in water method. Samples are weighed using a high precision electronic scale, in air and suspended in a bucket of water. Each pair of measurements produces a specific gravity (SG) using the following equation:

The scale is calibrated with a calibrated with a certified weight. The scale is tared/zeroed before every measurement, and measurement will not proceed until the scale has stabilized at each reading.
11.2.4 Data Management
Data are verified and double-checked by senior geologists on site for data entry verification, error analysis, and adherence to strict analytical quality-control protocols.
11.2.5 Quality Assurance/Quality Control
Sampling QA/QC programs are set in place to ensure the reliability and trustworthiness of exploration data. They include written field procedures and independent verifications of drilling, surveying, sampling, assaying, data management, and database integrity. Appropriate documentation of quality-control measures and regular analysis of quality-control data are essential for the project data and form the basis for the quality-assurance program implemented during exploration.
Analytical quality control measures typically involve internal and external laboratory control measures implemented to monitor sampling, preparation, and assaying precision and accuracy. They are also essential to prevent sample mix-up and monitor the voluntary or inadvertent contamination of samples. Sampling QA/QC protocols typically involve regular duplicate and replicate assays as well as the insertion of blanks and standards (certified reference materials). Routine monitoring of quality control samples is undertaken to ensure that the analytical process remains in control and confirms the accuracy and precision of laboratory analyses. In addition to laboratory internal quality control protocols, sample batches should be evaluated for evidence of suspected cross sample contamination, certified reference material performance evaluated relative to established warning and failure limits to ensure the analytical process remains in control while maintaining an acceptable level of accuracy and precision, duplicate and replicate assay performance evaluated, and any concerns communicated to the laboratory in a timely fashion. Check assaying is typically performed as an additional reliability test of assaying results. These checks involve re-assaying a set number of rejects and pulps at a second umpire laboratory.
Vizsla Silver's QA/QC program comprises the systematic insertion of standards or certified reference materials (CRMs), blanks, field, and lab preparation pulp duplicates. QC samples are inserted into the sample sequence at a frequency of 1 sample per 20 samples for CRM and blank QC sample types and 1 sample per 40 samples for field duplicates and lab preparation pulp duplicates. Approximately 15% of samples assayed have been QC samples. In total, 2,806 CRMs, 2,981 blanks, 1,401 field duplicate pairs, and 1,368 preparation pulp duplicate pairs have been submitted (Table 11-3) for drilling included in the current MRE (Section 14). All QC samples are analyzed by the primary analytical lab (ALS).
Check assaying of umpire samples at a secondary lab (SGS Durango, Mexico) was completed in 2022 and 2023, totalling 927 pulp duplicate samples (1.9% of original samples) from drilling completed in 2020 - 2023.
Table 11-3 QC Sample Statistics for Vizsla Core Sampling 2019 - 2023
|
Original Samples
|
Standards
|
Blanks
|
Field Duplicates
|
Pulp Duplicates
|
QC Sample Total
|
QC Sample %
|
|
47,695
|
2,806
|
2,981
|
1,401 pairs
|
1,368 pairs
|
8,556
|
15.2%
|
Sample batches with suspected cross-sample contamination or certified reference materials returning assay values outside of the mean ± 3SD control limits are considered analytical failures by Vizsla, and affected batches were generally re-analyzed to ensure data accuracy.
ALS has its own internal QA/QC program, which is reported in the assay certificates, but no account is taken of this in the determination of batch acceptance or failure.
11.2.6 Certified Reference Material
A selection of sixteen CRMs have been used to-date by Vizsla in the course of the Panuco Project drill program: multi-element standards from CDN Resource Laboratories in Langley, B.C. (CDN-ME-1405, CDN-ME-1704, CDN ME 1802, CDN-ME-1803, CDN-ME-1804, CDN-ME-1806, CDN-ME-1811, CDN-ME-1901, CDN-ME-1902, CDN-ME-1903, CDN-ME-2001, CDN-ME-2003, and CDN-ME-2105), Ore Research & Exploration in Bayswater North, Australia (OREAS-601c and OREAS-602b), and gold-silver standard SN97 from Rocklabs in Auckland, New Zealand. The means, standard deviations (SD), warning, and control limits for standards are utilized as per the QA/QC program described below.
CRM performance and analytical accuracy is evaluated using the assay concentration values relative to the certified mean concentration to define the Z-score relative to sample sequence with warning and failure limits. Warning limits are indicated by a Z-score of between ±2 SD and ±3 SD, and control limits/failures are indicated by a Z-score of greater than ±3 SD from the certified mean. Sample batches with certified reference materials returning assay values outside of the mean ± 3SD control limits, or with suspected cross sample contamination indicated by blank sample analysis, are considered as analytical failures and selected affected batches are re-analyzed to ensure data accuracy.
For geochemical exploration analysis methods, laboratory benchmark standards are to achieve a precision and accuracy of plus or minus 10% (of the concentration) ±1 Detection Limit (DL) for duplicate analyses, in-house standards and client submitted standards, when conducting routine geochemical analyses for gold and base metals. These limits apply at, or greater than, 20 times the limit of detection. For samples containing coarse gold, native silver or copper, precision limits on duplicate analyses can exceed plus or minus 10% (of the concentration).
For ore grade analysis methods, laboratory benchmark standards are to achieve a precision and accuracy of plus or minus 5% (of the concentration) ± 1 DL for duplicate analyses, in-house standards and client submitted standards. These limits apply at 20 times the limit of detection. As in the case of routine geochemical analyses, samples containing coarse gold, native silver or copper are less likely to meet the expected precision levels for ore grade analysis.
Vizsla's QA/QC program from 2019 - 2023 included the insertion of CRM samples at a frequency of approximately 1 CRM sample in every 20 samples, for a total of 2,806 CRM samples.
CRM analytical results for the Vizsla drilling programs are summarized in Table 11-4 to Table 11-7 for silver, gold, lead, and zinc to evaluate analytical accuracy (bias), precision (average coefficient of variation "CVAVR%"), warning rates, and failure rates. Shewhart CRM control charts for the Vizsla drilling programs are presented in Figure 11-2 to Figure 11-17.
The combined CRM failure rates during this period were 1.4% for Ag, 4.2% for Au, 2.5% for Pb, and 2.1% for Zn. A greater frequency of failures was noted associated with CDN-ME-1901 with respect to gold values. Vizsla decided to discontinue use of this CRM in July 2021.
CRM analytical results from 2019 - 2023 confirm acceptable analytical accuracy (bias less than ±5%) and acceptable analytical precision (CVAVR% within ±5%) for Ag, Au, Pb, and Zn. Only two CRMs (CDN-ME-1811 and OREAS-601c) show a weak positive bias for Au.
Review of the Company's CRM QC program indicates that there are no significant issues with the drill core assay data.
Table 11-4 CRM Sample Silver Performance for the 2019-2023 Drill Programs
|
CRM - Ag
|
Certified Value
|
2019-2023
|
|
Mean
|
SD
|
Count
|
Mean
Ag ppm
|
Bias %
|
CVAVR%
|
Warning
# >2SD
|
Warning
% >2SD
|
Failure
# >3SD
|
Failure
% >3SD
|
|
ME-1405
|
88.8
|
3.3
|
186
|
89.8
|
1.2
|
2.3
|
7
|
3.8%
|
0
|
0.0%
|
|
ME-1704
|
11.6
|
0.65
|
179
|
11.7
|
0.6
|
3.4
|
3
|
1.7%
|
1
|
0.6%
|
|
ME-1802
|
75
|
2.2
|
128
|
75.2
|
0.3
|
2.4
|
7
|
5.5%
|
1
|
0.8%
|
|
ME-1803
|
46
|
1.5
|
191
|
45.5
|
-1.1
|
2.7
|
12
|
6.3%
|
1
|
0.5%
|
|
ME-1804
|
137
|
3.5
|
191
|
137.4
|
0.3
|
1.7
|
7
|
3.7%
|
2
|
1.0%
|
|
ME-1806
|
371
|
5
|
6
|
362.2
|
-2.4
|
1.8
|
1
|
16.7%
|
1
|
16.7%
|
|
ME-1811
|
90
|
2
|
374
|
91.7
|
1.9
|
2.4
|
50
|
13.4%
|
19
|
5.1%
|
|
ME-1901
|
373
|
8.5
|
299
|
375.8
|
0.8
|
1.5
|
11
|
3.7%
|
0
|
0.0%
|
|
ME-1902
|
349
|
8.5
|
113
|
356.9
|
2.3
|
2.1
|
14
|
12.4%
|
1
|
0.9%
|
|
ME-1903
|
180
|
5.5
|
193
|
180.6
|
0.3
|
1.6
|
3
|
1.6%
|
0
|
0.0%
|
|
ME-2001
|
582
|
9.5
|
419
|
586.9
|
0.8
|
1.4
|
30
|
7.2%
|
9
|
2.1%
|
|
ME-2003
|
108
|
3
|
14
|
109.4
|
1.3
|
2.2
|
3
|
21.4%
|
0
|
0.0%
|
|
ME-2105
|
153
|
4.5
|
191
|
158.2
|
3.4
|
2.8
|
31
|
16.2%
|
2
|
1.0%
|
|
OREAS-601c
|
50.3
|
2.31
|
44
|
51.1
|
1.5
|
2.4
|
0
|
0.0%
|
0
|
0.0%
|
|
OREAS-602b
|
119
|
4
|
177
|
120.8
|
1.5
|
1.5
|
0
|
0.0%
|
0
|
0.0%
|
|
SN-97
|
53.1
|
1.9
|
101
|
54.1
|
1.9
|
2.5
|
3
|
3.0%
|
1
|
1.0%
|
|
Total
|
|
|
2806
|
|
|
|
182
|
6.5%
|
38
|
1.4%
|
Table 11-5 CRM Sample Gold Performance for the 2019-2023 Drill Programs
|
CRM - Au
|
Certified Value
|
2019-2023
|
|
Mean
|
SD
|
Count
|
Mean
Au ppm
|
Bias %
|
CVAVR%
|
Warning
# >2SD
|
Warning
% >2SD
|
Failure
# >3SD
|
Failure
% >3SD
|
|
ME-1405
|
1.295
|
0.037
|
186
|
1.325
|
2.3
|
3.2
|
32
|
17.2%
|
8
|
4.3%
|
|
ME-1704
|
0.995
|
0.44
|
179
|
1.003
|
0.8
|
4.5
|
0
|
0.0%
|
0
|
0.0%
|
|
ME-1802
|
1.255
|
0.033
|
128
|
1.236
|
-1.5
|
2.3
|
6
|
4.7%
|
5
|
3.9%
|
|
ME-1803
|
1.308
|
0.034
|
191
|
1.312
|
0.3
|
2.3
|
15
|
7.9%
|
2
|
1.0%
|
|
ME-1804
|
1.602
|
0.046
|
189
|
1.584
|
-1.1
|
2.1
|
10
|
5.3%
|
0
|
0.0%
|
|
ME-1806
|
3.425
|
0.12
|
6
|
3.523
|
2.9
|
3.9
|
1
|
16.7%
|
0
|
0.0%
|
|
ME-1811
|
2.05
|
0.12
|
374
|
2.158
|
5.3
|
7.8
|
70
|
18.7%
|
48
|
12.8%
|
|
ME-1901
|
7.85
|
0.185
|
297
|
7.679
|
-2.2
|
3.2
|
51
|
17.2%
|
13
|
4.4%
|
|
ME-1902
|
5.38
|
0.21
|
113
|
5.242
|
-2.6
|
4.4
|
9
|
8.0%
|
9
|
8.0%
|
|
ME-1903
|
3.035
|
0.121
|
193
|
3.088
|
1.8
|
4.1
|
29
|
15.0%
|
7
|
3.6%
|
|
ME-2001
|
1.317
|
0.0695
|
419
|
1.333
|
1.2
|
5.8
|
52
|
12.4%
|
20
|
4.8%
|
|
ME-2003
|
1.301
|
0.0675
|
14
|
1.320
|
1.5
|
4.9
|
3
|
21.4%
|
0
|
0.0%
|
|
ME-2105
|
3.88
|
0.1355
|
191
|
3.865
|
-0.4
|
2.7
|
6
|
3.1%
|
1
|
0.5%
|
|
OREAS-601c
|
0.996
|
0.048
|
44
|
1.049
|
5.4
|
4.4
|
4
|
9.1%
|
1
|
2.3%
|
|
OREAS-602b
|
2.29
|
0.094
|
177
|
2.297
|
0.3
|
3.1
|
8
|
4.5%
|
3
|
1.7%
|
|
SN-97
|
9.026
|
0.2
|
101
|
8.959
|
-0.7
|
1.3
|
1
|
1.0%
|
0
|
0.0%
|
|
Total
|
-
|
-
|
2802
|
|
|
|
297
|
10.6%
|
117
|
4.2%
|
Table 11-6 CRM Sample Lead Performance for the 2019-2023 Drill Programs
|
CRM - Pb
|
Certified Value
|
2019-2023
|
|
Mean
|
SD
|
Count
|
Mean
Pb ppm
|
Bias %
|
CVAVR%
|
Warning
# >2SD
|
Warning
% >2SD
|
Failure
# >3SD
|
Failure
% >3SD
|
|
ME-1405
|
6380
|
260
|
186
|
6308
|
-1.1
|
3.1
|
6
|
3.2%
|
1
|
0.5%
|
|
ME-1704
|
490
|
15
|
179
|
486
|
-0.8
|
2.0
|
7
|
3.9%
|
0
|
0.0%
|
|
ME-1802
|
26000
|
450
|
128
|
25409
|
-2.3
|
2.1
|
28
|
21.9%
|
6
|
4.7%
|
|
ME-1803
|
12100
|
200
|
191
|
11746
|
-2.9
|
2.8
|
29
|
15.2%
|
26
|
13.6%
|
|
ME-1804
|
43300
|
950
|
191
|
42775
|
-1.2
|
1.7
|
9
|
4.7%
|
3
|
1.6%
|
|
ME-1806
|
58900
|
1350
|
6
|
59250
|
0.6
|
0.9
|
0
|
0.0%
|
0
|
0.0%
|
|
ME-1811
|
3040
|
80
|
374
|
3064
|
0.8
|
1.9
|
16
|
4.3%
|
2
|
0.5%
|
|
ME-1901
|
25600
|
550
|
299
|
25625
|
0.1
|
1.4
|
6
|
2.0%
|
1
|
0.3%
|
|
ME-1902
|
22000
|
500
|
113
|
21864
|
-0.6
|
1.6
|
1
|
0.9%
|
1
|
0.9%
|
|
ME-1903
|
10600
|
200
|
193
|
10415
|
-1.7
|
1.9
|
8
|
4.1%
|
13
|
6.7%
|
|
ME-2001
|
7800
|
155
|
419
|
7726
|
-1.0
|
2.0
|
47
|
11.2%
|
15
|
3.6%
|
|
ME-2003
|
4750
|
80
|
14
|
4776
|
0.5
|
1.9
|
3
|
21.4%
|
1
|
7.1%
|
|
ME-2105
|
3570
|
100
|
191
|
3517
|
-1.5
|
2.2
|
11
|
5.8%
|
1
|
0.5%
|
|
OREAS-601c
|
328
|
18
|
44
|
333
|
1.7
|
2.2
|
0
|
0.0%
|
0
|
0.0%
|
|
OREAS-602b
|
493
|
19
|
177
|
495
|
0.4
|
2.0
|
5
|
2.8%
|
0
|
0.0%
|
|
SN-97
|
-
|
-
|
101
|
94
|
-
|
-
|
0
|
0.0%
|
0
|
0.0%
|
|
Total
|
-
|
-
|
2806
|
|
|
|
176
|
6.3%
|
70
|
2.5%
|
Table 11-7 CRM Sample Zinc Performance for the 2019-2023 Drill Programs
|
CRM - Zn
|
Certified Value
|
2019-2023
|
|
Mean
|
SD
|
Count
|
Mean
Zn ppm
|
Bias %
|
CVAVR%
|
Warning
# >2SD
|
Warning
% >2SD
|
Failure
# >3SD
|
Failure
% >3SD
|
|
ME-1405
|
30200
|
550
|
186
|
29847
|
-1.2
|
1.3
|
9
|
4.8%
|
3
|
1.6%
|
|
ME-1704
|
8000
|
200
|
179
|
7957
|
-0.5
|
1.9
|
12
|
6.7%
|
2
|
1.1%
|
|
ME-1802
|
61100
|
1450
|
128
|
60545
|
-0.9
|
1.4
|
3
|
2.3%
|
0
|
0.0%
|
|
ME-1803
|
28200
|
500
|
190
|
27303
|
-3.2
|
2.8
|
30
|
15.8%
|
27
|
14.2%
|
|
ME-1804
|
99400
|
2200
|
188
|
98737
|
-0.7
|
1.7
|
9
|
4.8%
|
4
|
2.1%
|
|
ME-1806
|
140000
|
2100
|
6
|
140417
|
0.3
|
0.7
|
0
|
0.0%
|
0
|
0.0%
|
|
ME-1811
|
15500
|
300
|
374
|
15471
|
-0.2
|
1.4
|
19
|
5.1%
|
5
|
1.3%
|
|
ME-1901
|
28900
|
550
|
296
|
28883
|
-0.1
|
1.5
|
9
|
3.0%
|
2
|
0.7%
|
|
ME-1902
|
36600
|
1250
|
113
|
36295
|
-0.8
|
2.2
|
0
|
0.0%
|
1
|
0.9%
|
|
ME-1903
|
17500
|
350
|
193
|
17419
|
-0.5
|
1.4
|
12
|
6.2%
|
1
|
0.5%
|
|
ME-2001
|
15000
|
250
|
419
|
15133
|
0.9
|
1.5
|
47
|
11.2%
|
12
|
2.9%
|
|
ME-2003
|
10500
|
250
|
14
|
10679
|
1.7
|
1.6
|
1
|
7.1%
|
0
|
0.0%
|
|
ME-2105
|
6700
|
155
|
191
|
6737
|
0.6
|
2.0
|
18
|
9.4%
|
2
|
1.0%
|
|
OREAS-601c
|
425
|
16
|
44
|
433
|
1.9
|
2.7
|
4
|
9.1%
|
0
|
0.0%
|
|
OREAS-602b
|
764
|
24
|
177
|
772
|
1.0
|
2.2
|
7
|
4.0%
|
1
|
0.6%
|
|
SN-97
|
-
|
-
|
101
|
176
|
-
|
-
|
0
|
0.0%
|
0
|
0.0%
|
|
Total
|
-
|
-
|
2799
|
|
|
|
180
|
6.4%
|
60
|
2.1%
|
Figure 11-2 CRM Control Chart for Silver for the 2020 Drill Program

Figure 11-3 CRM Control Chart for Gold for the 2020 Drill Program

Figure 11-4 CRM Control Chart for Lead for the 2020 Drill Program

Figure 11-5 CRM Control Chart for Zinc for the 2020 Drill Program

Figure 11-6 CRM Control Chart for Silver for the 2021 Drill Program

Figure 11-7 CRM Control Chart for Gold for the 2021 Drill Program

Figure 11-8 CRM Control Chart for Lead for the 2021 Drill Program
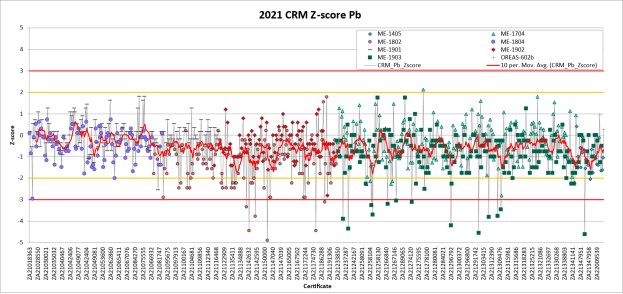
Figure 11-9 CRM Control Chart for Zinc for the 2021 Drill Program

Figure 11-10 CRM Control Chart for Silver for the 2022 Drill Program
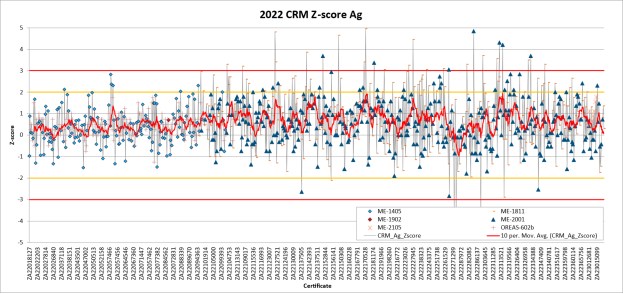
Figure 11-11 CRM Control Chart for Gold for the 2022 Drill Program

Figure 11-12 CRM Control Chart for Lead for the 2022 Drill Program

Figure 11-13 CRM Control Chart for Zinc for the 2022 Drill Program

Figure 11-14 CRM Control Chart for Silver for the 2023 Drill Program

Figure 11-15 CRM Control Chart for Gold for the 2023 Drill Program

Figure 11-16 CRM Control Chart for Lead for the 2023 Drill Program

Figure 11-17 CRM Control Chart for Zinc for the 2023 Drill Program

11.2.7 Blank Material
Blank samples comprising obsidian from sources in Jalisco were inserted into the sample stream in the field to determine the degree of sample contamination after sample collection, particularly during the sample preparation process. This material does not have certified values established by a third party through round robin lab testing. The QA/QC program from 2019 - 2023 included the insertion of blank samples at a frequency of approximately 1 blank sample in every 20 samples, for a total of 2,981 blank samples.
For blank sample values, failure is more subjective, and a hard failure ceiling value has not been set. Evaluation of blank samples using a failure ceiling for silver of 2.5 ppm (5x detection limit) indicates that the combined blank failure rate from 2019 - 2023 was 2.1%. The highest result from a blank sample was 457 g/t Ag, the second highest results was 64.1 g/t Ag, and in total ten blank samples (0.3%) returned values over 10 ppm Ag (Figure 11-18 to Figure 11-21).
The blank failure rate is considered acceptable by industry standards. Based on the low risk of cross-sample contamination and the low amounts of silver that may have contaminated blank material, it is considered unlikely that there is a contamination problem with the Project drilling data.
Figure 11-18 Blank Sample Chart for Silver for the 2020 Drill Program

Figure 11-19 Blank Sample Chart for Silver for the 2021 Drill Program

Figure 11-20 Blank Sample Chart for Silver for the 2022 Drill Program

Figure 11-21 Blank Sample Chart for Silver for the 2023 Drill Program

11.2.8 Duplicate Material
Vizsla's QA/QC program from 2019 - 2023 Vizsla included the insertion of duplicate samples inserted at a frequency of approximately 1 field duplicate and 1 preparation pulp duplicate sample in every 40 samples, for a total of 1,401 field duplicates (1/4 core) and 1,368 preparation pulp duplicate samples. Duplicate samples were analyzed at ALS to evaluate analytical precision and sampling error.
Figure 11-22 to Figure 11-29 illustrate the comparative assay results and precision of duplicate sample analyses.
To obtain a relatively accurate estimate of the sampling precision or average relative error a large number of duplicate data pairs are required. Reliably determining the base metal data precision, which typically exhibits relatively small average relative errors (such as 5%), would require 500 - 1000 duplicate data pairs, while reliable determination of gold data precision, which typically exhibits relatively large average relative errors (such as 25%), would require greater than 2500 duplicate data pairs (Stanley and Lawie, 2007).
In the case of the Panuco deposits, based on the current duplicate data set size, analysis of the precision should be considered as reliable for lead, zinc, and likely silver, while it should be considered approximate in nature only for gold until a larger dataset is available. The average Coefficient of Variation (CVAVR%) for silver, gold, lead, and zinc is shown in Table 11-8, calculated using the root mean square coefficient of variation calculated from the individual coefficients of variation.
The estimates of precisions errors (CVAVR%) for Panuco sampling indicates that the sampling precision is acceptable by industry standards for pulp duplicates for this style of mineralization (Abzalov, 2008). The precision of the field and preparation pulp duplicates should continue to be monitored as the drill program progresses and the size of the duplicate data set becomes more representative.
Table 11-8 Average Relative Error of Duplicate Samples from 2019-2023
|
Drillhole Series
|
Duplicate Type
|
Count
|
Ag CVAVR%
|
Au CVAVR%
|
Pb CVAVR%
|
Zn CVAVR%
|
|
2019-2023 Drilling
|
Field Duplicates
|
1,401 duplicate pairs
|
29.0
|
31.9
|
26.6
|
23.2
|
|
2019-2023 Drilling
|
Pulp Duplicates
|
1,368 duplicate pairs
|
15.8
|
18.4
|
10.6
|
6.5
|
Figure 11-22 Plot of Field Duplicate Samples for Silver from the 2019-2023 Drill Program

Figure 11-23 Plot of Field Duplicate Samples for Gold from the 2019-2023 Drill Program

Figure 11-24 Plot of Field Duplicate Samples for Lead from the 2019-2023 Drill Program

Figure 11-25 Plot of Field Duplicate Samples for Zinc from the 2019-2023 Drill Program

Figure 11-26 Plot of Pulp Duplicate Samples for Silver from the 2019-2023 Drill Program

Figure 11-27 Plot of Pulp Duplicate Samples for Gold from the 2019-2023 Drill Program
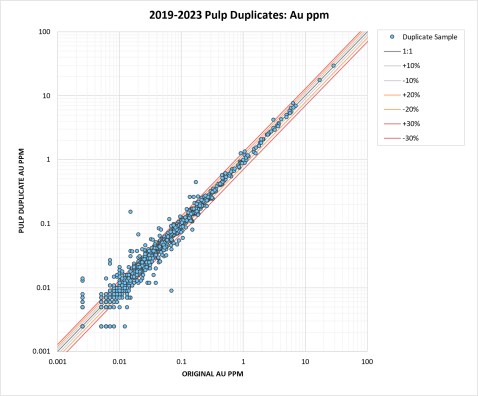
Figure 11-28 Plot of Pulp Duplicate Samples for Lead from the 2019-2023 Drill Program

Figure 11-29 Plot of Pulp Duplicate Samples for Zinc from the 2019-2023 Drill Program

11.2.9 Umpire Laboratory
The use of a third-party laboratory for routine check assays was employed by Vizsla in 2022 and 2023 as an additional QA/QC measure to confirm the accuracy of ALS assays. A selection of 209 mineralized pulp samples from the 2019-2022 drilling programs was assayed at SGS De Mexico, S.A De C.V. in Durango, Mexico in 2022 and an additional 705 mineralized pulp samples from the 2022-2023 drilling programs was assayed in 2023. In total, 714 umpire check samples have been analysed at SGS by Vizsla, matching ALS methodology as closely as possible.
Table 11-9 and Table 11-10 detail the relative bias and the average relative error of the umpire check sampling for silver and gold, and the log x-y plots in Figure 11-30 to Figure 11-33 illustrate the comparative assay results and precision of duplicate sample analyses.
The 2022 and 2023 umpire check sample results returned from SGS, with respect to the corresponding ALS analyses, indicate acceptable accuracy (relative bias) and precision (average relative error) with limited outliers.
Table 11-9 Relative Bias - SGS Umpire Check Samples from 2019-2023
|
Drillhole
Series
|
Duplicate
Type
|
Ag
Count
|
Mean Ag ppm
(ALS)
|
Mean Ag ppm
(SGS)
|
Ag Bias
%
|
Au
Count
|
Mean Au ppm
(ALS)
|
Mean Au ppm
(SGS)
|
Au Bias
%
|
|
2019-2022 Drilling
|
Pulp Duplicates
|
209
|
311.3
|
297.6
|
-4.4
|
209
|
5.2
|
5.1
|
-2.3
|
|
2022-2023 Drilling
|
Pulp Duplicates
|
705
|
402.1
|
397.4
|
-1.2
|
706
|
3.0
|
2.8
|
-7.6
|
Table 11-10 Average Relative Error - SGS Umpire Check Samples from 2019-2023
|
Drillhole Series
|
Duplicate Type
|
Count
|
Ag CVAVR%
|
Au CVAVR%
|
|
2019-2022 Drilling
|
Pulp Duplicates
|
209
|
10.0
|
12.5
|
|
2022-2023 Drilling
|
Pulp Duplicates
|
705
|
9.5
|
14.2
|
Figure 11-30 Plot of SGS Umpire Check Samples for Silver Assayed in 2022

Figure 11-31 Plot of SGS Umpire Check Samples for Gold Assayed in 2022

Figure 11-32 Plot of SGS Umpire Check Samples for Silver Assayed in 2023

Figure 11-33 Plot of SGS Umpire Check Samples for Gold Assayed in 2023

11.3 Sample Storage and Security
All exploration samples taken were collected by Vizsla Silver staff. Chain of custody (COC) of samples was carefully maintained from collection at the drill rig to delivery at the laboratories to prevent inadvertent contamination or mixing of samples and render active tampering as difficult as possible.
Drill core is stored at the core-logging facilities in Concordia under a roof to preserve its condition. The area is fenced and guarded by security. The plastic boxes containing the core boxes are properly tagged with the corresponding drilling information and stored in an organized way and under acceptable conditions.
11.4 QP's Comments
It is the Author's opinion, based on a review of all possible information, that the sample preparation, analyses and security used on the Project by the Company meet acceptable industry standards (past and current). Review of the Company's QA/QC program indicates that there are no significant issues with the drill core assay data. The data verification programs undertaken on the data collected from the Project support the geological interpretations, and the analytical and database quality, and therefore data can support resource estimation of Indicated and Inferred mineral resources.
12 DATA VERIFICATION
The following section summarises the data verification procedures that were carried out and completed and documented by the Authors for this technical report, including verification of all drill data collected by Vizsla during their 2019 to 2023 drill programs, as of the effective date of this report.
12.1 Drill Sample Database
Eggers conducted an independent verification of the assay data in the drill sample database used for the current MRE. Approximately 15% of the digital assay records were randomly selected and checked against the available laboratory assay certificate reports. Assay certificates were available for all diamond drilling completed by Vizsla. Eggers reviewed the assay database for errors, including overlaps and gapping in intervals and typographical errors in assay values. In general, the database was in good shape and no adjustments were required to be made to the assay values contained in the assay database.
Verifications were also carried out on drill hole locations, down hole surveys, lithology, SG and topography information. The database is considered of sufficient quality to be used for the current MRE.
Eggers has reviewed the sample preparation, analyses, and security (see Section 11) completed by Vizsla for the Property. Based on a review of all possible information, the sample preparation, analyses, and security used on the Project by Vizsla, including QA/QC procedures, are consistent with standard industry practices and the drill data can be used for geological and resource modeling, and resource estimation of Indicated and Inferred mineral resources.
12.2 Site Visit
12.2.1 2023 Site Visits
Armitage conducted a site visit to the Project on May 29, 2023, accompanied by Martin Dupuis, COO, Jesus Velador, VP of Exploration and Steve Mancell, Director of Mineral Resources, of Vizsla Silver. During the site visit, Armitage inspected the core logging and core sampling facilities and core storage areas in the City of Concordia. The following facilities were inspected:
-
Office Area
-
Area used for the geologists to log core.
-
Area used to make pictures of the core with controlled light (core both wet and dry)
-
Area used to measure density (by drying, measuring unwaxed weight, waxed weight and weight in water)
-
Area for cutting the core.
-
Area for sampling the core.
-
Area to update geological sections on paper.
-
Core storage area
During the site visit Armitage examined several selected mineralized core intervals from recently completed (2019-2022) diamond drill holes from the Property. Armitage examined accompanying drill logs and assay certificates and assays were examined against the drill core mineralized zones. The author reviewed current core sampling, QA/QC and core security procedures. Core boxes for drill holes reviewed are properly stored in the warehouse, easily accessible and well labelled. Sample tags are present in the boxes, and it was possible to validate sample numbers and confirm the presence of mineralization in witness half-core samples from the mineralized zones.
As drilling and core logging was in progress during the time of the site visit, Armitage had the opportunity to review and discuss the entire path of the drill core, from the drill rig to the logging and sampling facility and finally to the laboratory. Armitage is of the opinion that current protocols in place, as have been described and documented by Vizsla, is adequate.
The Author participated in a field tour of the Property area including visits to several outcrops to review the local Geology, the drill, and recent drill sites. All areas were easily accessible by road.
Armitage conducted a second site visit to the Project on November 6 to November 8, 2023, accompanied by Henri Gouin, Mining Engineer with SGS, and Martin Dupuis, Fernando Martínez, Director of Projects, Hernando Rueda, Country Manager and Steve Mancell, of Vizsla Silver. During the second site visit, Armitage again inspected the core logging and core sampling facilities and core storage areas in the City of Concordia.
Armitage examined several selected mineralized core intervals from recently completed (2023) diamond drill holes from the Property. Armitage examined accompanying drill logs and assay certificates and assays were examined against the drill core mineralized zones. The author reviewed current core sampling, QA/QC and core security procedures. Core boxes for drill holes reviewed are properly stored in the warehouse, easily accessible and well labelled. Sample tags are present in the boxes, and it was possible to validate sample numbers and confirm the presence of mineralization in witness half-core samples from the mineralized zones.
As drilling and core logging was in progress during the time of the second site visit, Armitage had the opportunity to review and discuss the entire path of the drill core, from the drill rig to the logging and sampling facility and finally to the laboratory. Armitage is of the opinion that current protocols in place, as have been described and documented by Vizsla, is adequate.
The Author participated in a field tour of the Property area including visits to several outcrops to review the local Geology, the drill, and recent (2023) drill sites.
As a result of the two site visits, Armitage was able to become familiar with conditions on the Property. Armitage was able to observe and gain an understanding of the geology and various styles mineralization, which helped guide the current mineral resource modeling, was able to verify the work done and, on that basis, can review and recommend to Vizsla an appropriate exploration program.
Armitage considers the site visit completed in November 2023 as current, per Section 6.2 of NI 43-101CP. To the Authors knowledge there is no new material scientific or technical information about the Property since that personal inspection. The technical report contains all material information about the Property.
12.3 Conclusion
All geological data has been reviewed and verified as being accurate to the extent possible, and to the extent possible, all geologic information was reviewed and confirmed. There were no significant or material errors or issues identified with the drill database. Based on a review of all possible information, Armitage is of the opinion that the database is of sufficient quality to be used for the current Indicated and Inferred MRE.
13 MINERAL PROCESSING AND METALLURGICAL TESTING
In 2021, ALS Metallurgy Kamloops ("ALS Metallurgy") was commissioned by Ausenco to conduct preliminary metallurgical testing on material from the Napoleon project on behalf of Vizsla Silver Corporation (ALS, 2021). Additional testing was completed in early 2022 (ALS, 2022A)
In 2022, ALS Metallurgy was commissioned by Ausenco to conduct preliminary metallurgical testing on material from the Tajitos project on behalf of Vizsla Silver Corporation (ALS, 2022B).
In 2023, ALS Metallurgy was commissioned by Ausenco to conduct preliminary metallurgical testing on material from the Copala deposit on behalf of Vizsla Silver Corporation (ALS, 2023).
The following is a summary of results of metallurgical testing completed on core from the Project as of the effective date of this report.
13.1 Preliminary Metallurgical Testing on the Napoleon Deposit
The objective of the testing was to characterize the material chemically, and mineralogically, as well as to test various flowsheets and methods for concentration and extraction of metals to potentially justify further exploration of the deposit. Only limited optimization of conditions was employed in this program. To achieve these objectives the following test work was completed:
-
Construct 11 variability composites from provided drill core samples and assess the chemical content through standard analytical methods as well as multielement ICP analyses.
-
Construct a "Master Composite" for metallurgical testing and a "Grindability Composite" for hardness testing from the variability composites.
-
Assess the hardness of the material from the deposits through Bond abrasion index, rod mill work index, and ball mill work index testing on select samples.
-
Assess the mineralogical characteristics of the material through a QEMSCAN Particle Mineral Analyses (PMA) completed on the Master Composite, as well as a Bulk Mineral Analyses (BMA) on a variability composite (Composite G) and the Grindability Composite, investigating the mineral content, mineral liberation, and association characteristics of copper sulphides, pyrite, and non-sulphide gangue minerals.
-
Conduct a series of sequential two to three product bulk-zinc-pyrite rougher flotation tests using the Master Composite as well as a variability composite, assessing the effect of primary grind sizing as well as the depressant dosage.
-
Conduct batch cleaner testing on the Master Composite, assess the effects of required sizing and depressant dosage on the flotation product grades and recoveries.
-
Investigate the potential for whole feed cyanidation extraction of gold and silver from the Master Composite through knelson gravity concentration and hand panning.
Additional Testing was completed in early 2022. The objectives of the additional testing were to investigate a bulk flotation circuit and the cyanidation of test products produced using Master Composite 1. To achieve these objectives the following test work was completed:
-
Conduct bulk rougher and cleaner flotation tests investigating flotation recovery of gold and silver to a bulk rougher and bulk cleaner concentrate and to assess the effects of regrinding in the circuit.
-
Conduct a series of cyanidation bottle roll leach tests on bulk concentrates produced from flotation testing. In addition, the cyanidation of a pyrite rougher concentrate produced in the testing summarized in the main report would also be investigated.
13.1.1 Sample Origin and Sample Characteristics
In total, 11 variability composites were prepared (Composite A to K), along with one "Grindability Composite" for comminution testing, and a Master Composite; in addition, bond rod mill work index test products from the Grindability Composite and the variability Composite G were prepared for potential testing but never tested. Samples for use in this testing program arrived at ALS Metallurgy Kamloops on June 16, 2021. The shipment consisted of 330 kilograms in 108, ½ HQ drill core intervals. Samples were from holes NP-20-8, 9, 12, 13, 31, 47, 59 and 89. The rationale for sample selection considered primary lithologies, spatial coverage and representation, contiguous mineralization, distribution of grade, and potential dilution. The selected mineralized drill holes were within the area of potentially minable material and are believed to be representative of the mineralization with a cut-off grade of 127 g/t Ag and 2.77 g/t Au.
A total of 40% of the composites was set aside as coarse ¾ inch material while the remaining 60% of the composite mass was crushed to minus 6 mesh (3.35 mm) for metallurgical testing and rotary split into 2-kilogram test charges.
One composite was prepared from the coarse crush material for comminution testing, this was referred to as the Grindability Composite. Bond rod mill work index tests were completed on two of the composites, the Grindability Composite and Composite G. Product from these tests was too fine for metallurgical testing but may have been useful for gravity amenability testing. As a result, this product was prepared into test charges and designated Grindability Rod Composite and Composite G Rod. About 23 kilograms of the Grindability Rod Composite and 7 kilograms of the Composite G Rod were prepared from the Bond rod mill test products.
13.1.1.1 Comminution Test Results
The Bond abrasion index test completed on the Grindability Composite measured an abrasion index of 0.599. This describes the sample as quite abrasive. Mill media and lining would be expected to have greater wear than what would be seen from less abrasive material. This was noted in metallurgical testing on Composite G and the Master Composite where the recalculated test feed mass and iron contents were higher than the measured feed as a result of the grinding of the sample in a mill.
Bond rod mill work index tests completed on the Grindability Composite and Composite G measured about 15 kWhr/tonne. This would describe the samples as of average hardness in terms of grinding in a rod mill. The 17 kWhr/tonne Bond ball work index measured for the Master Composite would describe the sample as hard in terms of grinding in a ball mill.
13.1.1.2 Composite Chemical and Mineral Content
Each of the 11 variability composites were assayed for silver, gold, and sulphur at ALS Metallurgy, along with having multi-element ICP analyses completed (Table 13-1). Composite G, the Grindability Composite, and the Master Composite were assayed at ALS Metallurgy Kamloops for base metals copper, lead, zinc, and iron as well.
Silver and gold were the primary metals of economic interest in the samples with silver assaying between 23 and 320 g/t and gold assaying between about 0.7 and 4 g/t. The Master Composite assayed about 123 and 3.1 g/t silver and gold, respectively.
Lead and zinc were present at notable levels, measuring about 1.1% each in the master composite. Copper was lower at about 0.1%; at this content and ratio to lead, it is unlikely a separate copper concentrate could be produced in sequential flotation or from separating a bulk copper-lead concentrate.
Sulphur measured between about 1.0 and 3.3% in the composites and is associated primarily with iron sulphides but also with copper, lead, and zinc sulphide minerals.
Table 13-1 Chemical Content Summary (ALS, 2021)
|
Composite
|
Assay percent or g/t
|
|
Cu
|
Pb
|
Zn
|
Fe
|
Ag
|
Au
|
S
|
|
Composite
|
A*
|
0.06
|
0.27
|
>1%
|
2.6
|
148
|
1.2
|
1.98
|
|
Composite
|
B*
|
0.1
|
0.3
|
0.94
|
3.3
|
23
|
4.05
|
2.08
|
|
Composite
|
C*
|
0.08
|
0.27
|
>1%
|
1.7
|
27
|
1.06
|
1.61
|
|
Composite
|
D*
|
0.02
|
0.4
|
0.38
|
3.3
|
183
|
0.78
|
1.46
|
|
Composite
|
E*
|
0.27
|
0.35
|
0.45
|
2.5
|
109
|
0.88
|
1.68
|
|
Composite
|
F*
|
0.2
|
0.75
|
>1%
|
3.7
|
155
|
1.88
|
3.26
|
|
Composite
|
G
|
0.07
|
0.49
|
1.23
|
2.5
|
72
|
2.4
|
1.78
|
|
Composite
|
H*
|
0.02
|
0.23
|
0.27
|
3.5
|
223
|
2.72
|
0.95
|
|
Composite
|
I*
|
0.03
|
>1%
|
>1%
|
2
|
320
|
0.71
|
2.03
|
|
Composite
|
J*
|
0.04
|
0.08
|
0.25
|
3.1
|
53
|
0.9
|
1.21
|
|
Composite
|
K*
|
0.21
|
>1%
|
>1%
|
2.3
|
208
|
3.26
|
2.72
|
|
Grindability Comp Rod
|
|
0.09
|
0.41
|
0.84
|
2.6
|
-
|
-
|
1.95
|
|
Master Composite
|
1
|
0.13
|
1.09
|
1.05
|
2.5
|
123
|
3.1
|
2.37
|
The mineral contents of the Master Composite, Composite G, and the Grindability Composite were measured using QEMSCAN Particle Mineral Analysis protocols (only mineral content was measured for the Grindability Composite and Composite G).
Sulphide minerals were primarily measured as pyrite, sphalerite, galena, and copper sulphides in order of content. The copper sulphides were measured primarily as chalcopyrite with lower amounts of chalcocite/covellite and bornite.
Between 68 and 74% of the samples were measured as quartz (Table 13-2), which likely contributes to the high abrasiveness of the material. Felspars measured between 14 and 19%, and most of the remaining non-sulphide gangue minerals were chlorite, micas, and calcium carbonates. Fluorine-bearing fluorite was detected in all samples but only quantified for the Master Composite at 0.2%.
Table 13-2 Mineral Content Summary (ALS, 2021)
|
Mineral
|
Content - %
|
|
Master Composite 1
|
Composite G
|
Grindability Composite
|
|
Copper Sulphides
|
0.3
|
0.1
|
0.3
|
|
Galena
|
1.5
|
0.5
|
0.5
|
|
Sphalerite
|
1.6
|
2
|
1.3
|
|
Pyrite
|
3.5
|
2
|
2.9
|
|
Iron Oxides
|
1.2
|
1.1
|
0.8
|
|
Quartz
|
68.1
|
74.3
|
69.2
|
|
Feldspars
|
14.2
|
15.7
|
19
|
|
Chlorite
|
3.7
|
1.3
|
2.3
|
|
Micas
|
2.2
|
1.4
|
1.3
|
|
Calcium Carbonates
|
2.3
|
0.7
|
1
|
|
Fluorite
|
0.2
|
-
|
-
|
|
Others
|
1
|
0.9
|
1.6
|
13.1.1.3 Mineralogical Fragmentation
The QEMSCAN Particle Mineral Analyses provided liberation and association characteristics for minerals within the Master Composite at the nominal 63 μm K80 primary grind sizing.
The liberation of the galena, sphalerite, and pyrite was quite high at the analyzed feed sizing, measuring 74, 64, and 69%, respectively. A much coarser flotation feed sizing of 150 μm K80 may be viable for the efficient rougher separation of the lead and zinc bearing minerals based on extrapolated liberations; however, the Particle Mineral Analysis is not capable of measuring the liberations of gold and silver bearing minerals within the sample due to low feed grades, a QEMSCAN Trace Mineral Search (TMS) would be required to assess these elements.
In the finest measured size fraction of particles with less than 20 μm diameter, the liberations for galena and sphalerite measured only about 82 and 83%, respectively. A cleaner feed liberation of about 90% would be targeted for these minerals to achieve efficient cleaner circuit separation in our experience; this indicates that a fine regrind sizing may be required to produce high-grade concentrates. Primary interlocking for these minerals in this fine fraction was measured to be with non-sulphide gangue minerals.
Exposure refers to the percentage of the surface area of a galena or sphalerite bearing particle which is exposed galena or sphalerite, respectively. About 6% of the galena and about 13% of the sphalerite were measured to be within particles with lower than 10% exposure of the respective mineral. Galena and Sphalerite within these low exposure particles would be difficult to recover and sphalerite recovery would be expected to be lower than galena recovery as a result of its lower measured exposure.
13.1.2 Metallurgical Testing
Metallurgical testing summarized in this report investigated sequential flotation, producing bulk, zinc, and pyrite concentrates. In addition, whole feed cyanidation and gravity concentration testing were completed. The following subsections discuss the results of this testing.
13.1.2.1 Rougher Testing
Primary grind sizings of between 43 and 140 μm K80 were investigated through sequential bulk-zinc-pyrite rougher flotation testing using Composite G and the Master Composite. In the primary grind, zinc sulphate and sodium cyanide were utilized as depressants for sphalerite and pyrite, while copper sulphate was used as an activator for sphalerite in the zinc circuit. The dithiophosphinate, 3418A, was used as the collector in the bulk circuit, while sodium isopropyl xanthate (SIPX) was used as the collector in the zinc/pyrite circuits, lime was used as the pH modifier, and methyl isobutyl carbinol (MIBC) was used as frother.
The primary effect of coarsening from the primary grind sizing 43 to 140 μm K80 was measured in the silver and gold recoveries. In testing on the Master Composite, about 5 to 6 % of the silver was measured in the rougher tailing at the finer tested feed sizings of 43 and 63 μm K80 which increased to about 8 and 11 % at the 93 and 140 μm K80 feed sizings. Similarly, about 5 % of the feed gold was measured in the rougher tailing at the 43 μm K80 feed sizing, increasing to 7, 12, and 16% at the 63, 93 and 140 μm K80 feed sizings, respectively. However, mass recovery did increase with decreasing primary grind sizing. Similar results were recorded for the testing using Composite G.
Lead and zinc were readily recovered to their respective concentrates at all sizings tested with minimal lead and zinc remaining for recovery by the pyrite circuit.
One test was completed at the 63 μm K80 primary grind sizing with double the sphalerite depressant in the primary grind, attempting to reduce zinc recovery to the bulk circuit. This increased dosage had a limited measurable effect on flotation performance.
13.1.2.2 Cleaner Testing
A series of batch cleaner tests were completed using the Master Composite, producing bulk and zinc cleaner concentrates. Tests were completed using a 63 μm K80 primary grind and investigated the effects of regrind sizing, depressant dosage, and circulation of the bulk cleaner scavenger tailing stream. The developed conditions would be considered preliminary and only limited optimization of conditions was pursued.
Two regrind sizings were tested for the bulk circuit along with no regrinding. With regrinding of the bulk rougher concentrate to about 19 μm K80, the bulk concentrate measured about 58% lead and about 5.7% zinc; about 83% of the lead, 68% of the silver, and 74% of the gold reported to the bulk concentrate. Increasing the depressant in the bulk regrind resulted in a slightly higher concentrate lead grade but significantly reduced silver recovery. A finer regrind would likely be required to reduce zinc content as increased depressant did not. The coarser regrind sizing of about 24 μm K80 resulted in a bulk concentrate that had a slightly lower lead grade but at higher lead recovery, and higher zinc dilution.
Regrind discharge sizings ranged between 30 and 36 μm K80 in the zinc circuit. Zinc concentrates measured about 56% zinc at the finer sizing and contained about 71% of the zinc, 7% of the silver and 10% of the gold. This was relatively unchanged at the coarser regrind sizings; however, silver and gold recoveries were reduced due to more of these metals being recovered in the bulk circuit for those tests. Circulating the bulk cleaner scavenger tailing to the zinc rougher conditioner resulted in higher zinc recoveries at a lower zinc grade. About 77% of the zinc, 10% of the silver, and 6% of the gold was recovered to the zinc concentrate which measured about 54% zinc.
Combined silver and gold recoveries to the bulk and zinc concentrates were 79 and 84% in Test 14, respectively. About 6% of the silver and 3 to 4% of the gold was recovered to the pyrite rougher concentrate across the cleaner testing while recovering between 4 to 6% of the feed mass. This product assayed about 1.8 to 2.9 g/t gold and between 124 and 210 g/t silver.
Without regrinding, high silver losses were recorded in the bulk cleaner circuit and lower concentrate grades measuring 47% lead for the bulk concentrate and 48% zinc for the zinc concentrate.
13.1.2.3 Cleaner Concentrate Quality
Concentrates from Test 13 and 14 were analyzed for additional elements of interest. Cadmium was elevated in the concentrates and appears to be associated with the sphalerite. Arsenic, antimony, mercury, fluorine, and manganese did not assay at levels of concern in the concentrates.
Silver and gold measured between 4,260 and 4,360 g/t silver and 111 and 152 g/t gold in the bulk concentrates, and between 690 and 780 g/t silver and between 11.6 and 16 g/t gold in the zinc concentrates.
Given the low copper-to-lead ratio in the bulk concentrates, it is likely that production of separate copper and lead concentrates from the bulk concentrate would not be successful.
13.1.2.4 Cyanidation Leach Testing
Two whole feed bottle roll cyanidation leach tests were completed on the Master Composite at a nominal 63 μm K80 primary grind sizing. The tests were completed over 48 hours, at pH 11, at 33 weight % solids, and with oxygen sparging at each sampling interval. The first test was completed using 2000 ppm sodium cyanide, while the second test was completed using 3000 ppm sodium cyanide and with extensive pre-aeration due to high cyanide consumptions and initial oxygen starvation in the first test.
Gold extraction was quite rapid with pre-aeration. About 90% of the gold was extracted to the leach liquor over 24 hours, increasing to about 93% after 48 hours. Silver extraction was slower, measuring about 82% after 24 hours, increasing to 87% after 48 hours.
Very little gold and silver leached in the first 6 hours without pre-aeration due to the oxygen starvation. Gold extraction had recovered by 24 hours, measuring about 91% extraction, increasing to 93% after 48 hours. Silver extraction was recorded at 72% after 24 hours and 78% after 48 hours without preparation.
Without pre-aeration, sodium cyanide consumptions were notably higher in the initial 6 hours of cyanidation. About 6.4 kilograms of sodium cyanide per tonne feed was consumed over 48 hours in the test without pre-aeration compared to 2.5 kilograms per tonne feed for the test with pre-aeration, despite a higher sodium cyanide concentration being used. Lime consumptions were lower without pre-aeration at 0.5 kg/t feed compared to 0.8 kg/t feed with pre-aeration.
Upwards of 20% of the copper in the feed appears to have also leached during the cyanidation test, with the final leach liquors assaying 101 and 111 g/t copper after 48 hours.
13.1.2.5 Gravity Testing
A single gravity concentration test was completed using a 2-kilogram charge of the Master Composite, ground to a 63 μm K80. This test was completed using a laboratory Knelson gravity concentration unit with a 100-gram cone, followed by panning of the Knelson concentrate to reduce mass recovery.
About 40% of the gold was recovered to the Knelson concentrate, and 26% was recovered to the pan concentrate. About 12% of the silver and 13% of the lead was also recovered to the pan concentrate along with 10% of the sulphur. Silver may be associated with the lead-bearing galena or may be reporting to the gravity concentrate with the galena due to similar specific gravities.
At a 0.6% mass recovery, the pan concentrate represents a larger mass recovery than is typically recorded for operating gravity circuits. Recovery would be expected to be lower at lower mass recovery.
Integration of gravity into a full flowsheet would be required to assess whether an overall improvement in silver and/or gold would result from its addition.
13.1.3 Additional Metallurgical Testing
Two rougher and two cleaner flotation tests were completed as part of the testing summarized in this report along with three cyanidation bottle roll leach tests (ALS, 2022A). The following subsections discuss the results of this testing.
13.1.3.1 Rougher Testing
Two batch rougher tests were completed using Master Composite 1 at a nominal 63 μm K80 primary grind sizing. The tests were completed at a natural pH, using sodium isopropyl xanthate (SIPX) as the collector, methyl isobutyl carbinol (MIBC) as the frother, and using copper sulphate as an activator.
In Test 18 about 94% of the silver and about 88% of the gold was recovered to a bulk rougher concentrate containing about 14% of the feed mass.
The additional collector/copper sulphate added in Test 18 as opposed to Test 17 resulted in a higher sulphur recovery, which may be a result of improved zinc/sphalerite activation. There was a slight increase in silver and mass recovery as a result but no change in gold recovery. The additional copper sulphate may have resulted in slower initial rougher performance due to a very low pulp redox potential. The combined sequential rougher recovery measured higher in mass, silver, and gold recovery compared to the bulk rougher recoveries.
13.1.3.2 Cleaner Testing
Two batch cleaner tests were completed using Master Composite 1. The tests investigated the grades and recoveries of gold and silver to a bulk concentrate and the effect of regrinding.
Without regrinding, a bulk concentrate measuring 1,742 g/t silver, 40 g/t gold, and 34% sulphur was produced, recovering 87% of the silver and 86% of the gold.
Adding a regrind resulted in an increase in grade to about 1,888 g/t silver, 45 g/t gold, and 37% sulphur. Silver recovery was slightly lower, while the gold recovery was unchanged. Sulphur recovery decreased despite additional collector being added. The finer sulphide sizing and negative discharge redox following regrinding may have slowed sulphide flotation in the cleaner circuit compared to the test with no regrind.
The overall bulk recovery values of gold and silver were similar to that measured in sequential flotation in Test 14, when about 79% of the silver and 84% of the gold were recovered to the combined bulk and zinc concentrates, with a further 6% of the silver and 4% of the gold recovered to the pyrite rougher concentrate.
13.1.3.3 Cyanidation Leach Testing
The cyanidation bottle roll leach tests were completed over 48 hours, using 3,000 ppm sodium cyanide, at pH 11, with oxygen sparging at each sampling interval, and with an 8-hour preparation step prior to cyanidation.
Without regrinding about 86% of the silver and 92% of the gold in the rougher concentrate was extracted within 48 hours; this represents about 80% of the feed silver and 8% of the feed gold. Silver extraction did not improve with regrinding, but gold extraction increased to about 96%, representing 86 % of the gold in the flotation feed. These were lower than the whole feed leach extractions of 87% of the silver and 93% of the gold but with substantially lower reagent consumptions and a far lower feed mass to the leach circuit.
The cyanidation of the pyrite rougher concentrate produced through sequential flotation resulted in an extraction of 4% of the feed silver and 3% of the feed gold. This would represent a combined flotation recovery and leach extraction of gold and silver of about 83% for silver and 87% for gold using a sequential flowsheet that produces a bulk, zinc, and pyrite concentrates with cyanidation of the pyrite concentrate.
Flotation and cyanidation conditions would not be considered optimized for any of the tested flowsheets.
13.1.4 Conclusions
A preliminary test program has been completed on material from the Napoleon deposit on behalf of Vizsla Silver Corporation (ALS, 2021). Two methods of concentration and extraction were successfully tested in this test program. Most of the testing was completed on the Master Composite sample, a lead-zinc composite with high amounts of silver and gold; the tested conditions would not yet be considered optimized.
Sequential bulk (lead)-zinc-pyrite flotation at a primary grind sizing of about 63 μm K80 produced a lead concentrate with high levels of silver, and gold, along with a high-grade zinc concentrate with notable levels of silver and gold. The pyrite concentrate, although lower in gold and silver content, may be of value with further processing.
Combined silver and gold recoveries to the bulk and zinc concentrates measured about 79 and 84%, respectively, with a further 6 % of the silver and 4% of the gold recovered to the pyrite concentrate. While doing so, about 89% of the lead was recovered to a bulk concentrate measuring 54% lead, and 77% of the zinc was recovered to a zinc concentrate measuring 54% zinc. The low copper concentrate of the bulk concentrate would likely result in an inability to produce separate copper and lead concentrates.
Whole feed cyanidation testing at a primary grind sizing of about 63 μm K80 resulted in the extraction of about 93% of the gold and 87% of the silver over 48 hours, along with about 23 hours of pre-aeration. However, sodium cyanide consumptions were relatively high for a whole feed leach, measuring about 2.5 kilograms of sodium cyanide per tonne of feed. 0.6 kilograms of lime was consumed per tonne of feed in this testing.
Additional testing was completed on the Napoleon deposit investigating a single product bulk flotation flowsheet along with the cyanidation of a bulk concentrate (ALS, 2022A).
Bulk flotation to a cleaner concentrate following two stages of dilution cleaning recovered 87% of the silver and 86% of the gold to a bulk concentrate (Table 13-3) which measured 1,742 g/t silver, 40 g/t gold, and 34% sulphur.
A lower overall silver extraction but similar gold extraction was recorded with flotation of a rougher concentrate followed by cyanidation of that concentrate.
Flotation of a sequential lead and zinc concentrate followed by cyanidation of a pyrite rougher concentrate resulted in a lower silver recovery/extraction compared to bulk flotation but a similar gold recovery/extraction. This flowsheet option also likely results in payable lead and zinc content in their respective concentrates, which other flowsheet options would not receive.
Whole feed cyanidation resulted in the highest overall gold extraction with similar silver extraction but the highest reagent consumption in cyanidation.
Table 13-3 Gold and Silver Recovery/Extraction Summary (ALS, 2022A)

13.2 Preliminary Metallurgical Testing on the Tajitos Deposit
The objective of the testing was to characterize the material chemically and mineralogically, as well as to test various flowsheets and methods for concentration and extraction of metals to potentially justify further exploration of the deposit. Only limited optimization of conditions was employed in this program. To achieve these objectives the following test work was completed:
-
23 subcomposites were constructed from provided drill core interval samples and the chemical content was assessed through standard analytical methods as well as multi-element ICP analyses.
-
Mineral content of the 23 subcomposites was assessed through QEMSCAN Bulk Mineral Analyses (BMA).
-
Three master composites were assembled representing different lithologies of the deposit for testing.
-
Grinding energy requirements of the master composites were assessed by conducting Bond ball mill work index testing.
-
A series of sequential three-product bulk-zinc-pyrite rougher flotation tests were conducted using the master composites to assess the viability of such a separation as well as the effect of primary grind sizing.
-
The potential for recovery of metals to a bulk concentrate through was investigated by conducting both batch rougher and cleaner tests.
-
The potential for whole feed cyanidation extraction of gold and silver from the master composites was investigated by conducting cyanidation bottle roll leach testing. In addition, cyanidation extraction from rougher concentrate and tailings products in flotation testing was measured.
-
The potential for gravity recovery of gold and silver from the master composites through Knelson gravity concentration and hand panning was investigated.
13.2.1 Sample Origin and Sample Characteristics
In total, 23 subcomposites composites were prepared (VAR 001 to 023), from which three Master Composites (Diorite, Andesite and Andesite - Low MnOX) were assembled for testing. A shipment of sample was received at ALS Metallurgy on January 8, 2022, in a shipment with a weight of 153 kilograms. The sample was in the form of 106 ½ HQ drill core intervals. Samples were from drill holes CS-20-01, 02, 03, 06, 08, 09, 11, 13, CS-21-16A, 17, 21B, 22A, 23, 24, 37, 41, 44, 50, 52, 59A, 60 and 62.
Each of the samples was a drill core interval which was assigned to one of 23 subcomposites. Following receipt, each of the samples was grouped into its corresponding subcomposite.
Each of the subcomposites was assayed for elements of interest to confirm the elemental content as well as each received a QEMSCAN Bulk Mineral Analysis to assess mineral content. Samples were then composited into three master composites.
13.2.1.1 Chemical and Mineral Content
Each of the 23 sub-composites and 3 master composites were assayed for elements of interest. Each subcomposite was analyzed for mineral content via QEMSCAN Bulk Mineral Analysis (BMA) protocols.
The master composites measured silver contents between 239 and 275 g/t and gold contents between about 1.2 and 2.5 g/t (Table 13-4). Silver was detected within the silver sulphides acanthite/argentite and copper/silver sulphide minerals; it is likely that silver is also present within other minerals as well.
Sulphur assayed between 0.6 and 1.3% and was primarily present as pyrite, with low levels of sphalerite, galena, and copper sulphide minerals. Only trace amounts of the sulphur were measured not to be in sulphide form.
Carbon measured between 0.1 and 1.2% and assayed as carbonate carbon, with little to no organic carbon being recorded. Carbonate minerals were primarily measured as calcium or manganese carbonates.
An effort was applied to identify and quantify manganese oxide minerals in the analyses; however, it was impossible to separate them due to the fine grains and complex interlocking between manganese oxide, carbonate, and silicate minerals.
The primary non-sulphide gangue minerals were measured as silicate minerals such as quartz, feldspars, and chlorite (Table 13-5).
Table 13-4 Master Composite Head Assay Summary
|
Composite
|
Assay percent or g/t
|
|
Cu
|
Pb
|
Zn
|
Fe
|
S
|
S(SO4)
|
C
|
TOC
|
Au
|
Ag
|
Ag (t)
|
|
Diorite MC
|
0.02
|
0.15
|
0.21
|
2.96
|
1.26
|
0.04
|
0.29
|
0.02
|
1.18
|
239
|
239
|
|
Andesite MC
|
0.008
|
0.04
|
0.11
|
2.57
|
0.63
|
0.05
|
0.11
|
0.01
|
1.37
|
242
|
242
|
|
Andesite - Low MnOx MC
|
0.021
|
0.08
|
0.16
|
2.02
|
1.14
|
0.07
|
1.17
|
0.01
|
2.46
|
275
|
275
|
Notes: a) S(SO4) - Sulphate sulphur; S(s) - sulphide sulphur; TOC - total organic carbon; CO3 - carbonate carbon
b) Silver and gold assays are displayed in g/tonne, other assays are displayed in percent.
c) Ag - Silver by aqua regia, Ag(t) - silver by multi-acid near total digestion, completed at ALS NV.
Table 13-5 Master Composite Mineral Content Summary
|
Mineral Content - %
|
Diorite
|
Andesite
|
Andesite- Low MnOx
|
|
Silver Minerals
|
<0.1
|
<0.1
|
<0.1
|
|
Copper Sulphides
|
<0.1
|
<0.1
|
<0.1
|
|
Galena
|
0.1
|
<0.1
|
0.1
|
|
Sphalerite
|
0.2
|
0.1
|
0.3
|
|
Pyrite
|
2
|
1.1
|
1.9
|
|
Quartz
|
55.2
|
65.8
|
73.2
|
|
Feldspars
|
32.5
|
25.9
|
14.9
|
|
Chlorite
|
5.2
|
3.3
|
1.5
|
|
Micas
|
1.6
|
1.1
|
0.3
|
|
Manganese Carbonate/Silicate
|
0.6
|
0.2
|
3.1
|
|
Other
|
2.5
|
2.3
|
4.5
|
13.2.1.2 Silver Assaying
Initial silver assays completed on the subcomposites were lower than client anticipated values. As a result, several different assay/digestion methods were employed to assess the silver content for several of the subcomposites.
The initial assays were completed using an aqua regia digestion which would dissolve all sulphide minerals but not more resilient silicate minerals. Silver assays were also completed by fire assay, multi-acid digestion, and through a screened metallic method. Several head samples were also assessed by ALS Geochemisty in North Vancouver using a multi-acid digest.
The silver assaying revealed that more complete digests produced higher values for the silver content in the samples, indicating silver present within non-sulphide minerals. In addition, the screened metallic assays for silver measured higher silver contents in the coarse fraction of the assays, suggesting the silver was not homogeneous within the samples, which could result in higher variation between replicate silver assays. Screened metallic assays were completed by pulverizing 500 g of feed, then screening this over a 106μm screen. The coarse material was assayed to extinction while the undersize was assayed in duplicate.
With aqua regia assays measuring lower contents than the other methods, multi-acid digests were used for analyzing test products in this program. It was understood that the resource has been developed using multi-acid digest silver assays. Should aqua regia digestions be utilized to assess test products produced from this material, results would be misleading as minerals not typically soluble in aqua regia digestions would typically be in the tailings. Thus aqua regia silver assays would record lower tailing silver grades and higher calculated recoveries.
13.2.1.3 Comminution Test Results
Bond ball work index tests were completed on each of the three master composites. The tests were completed using a 106 μm closing screen size. The work indices measured between 16.5 and 17.6 kWhr/t. These indices would describe the samples as moderately hard in terms of ball milling.
13.2.2 Metallurgical Testing
Metallurgical testing summarized in this report was preliminary and investigated bulk flotation, producing a single bulk sulphide concentrate; sequential flotation, producing bulk lead-silver, zinc, and pyrite concentrates; whole feed cyanidation; cyanidation of bulk rougher flotation products; and gravity concentration. The following subsections discuss the results of this testing.
The primary testing was completed on the Andesite and Diorite Composites. The Andesite Low MnOx Composite was lower in available mass and therefore was not as extensively tested.
Test conditions were based on those utilized in recently completed test programs for other deposits also under investigation by Vizsla (ALS, 2021 and 2022A).
13.2.2.1 Bulk Rougher Testing
Three primary grind sizings were tested using the Diorite and Andesite Master composites, while only one was tested for the Andesite Low MnOx Master Composite.
Potassium Amyl Xanthate (PAX) was used as the sulphide mineral collector and Methyl Isobutyl Carbinol (MIBC) was used as the frother. Tests were completed at natural pH. In addition, the effects of a supplemental gold collector Aerofloat 208, a phosphorodithioate collector, were also investigated.
Silver and gold recovery at the coarsest test primary grind sizings, a nominal 150 μm K80, was recorded to be the lowest, while recoveries were highest at the nominal 75 μm K80 primary grind sizing target, measuring about 84 to 85% for silver and 82 to 87% for gold. Tests completed at the nominal 100 μm K80 primary grind sizing target measured slightly lower silver and gold recovery compared to the finer test but also a lower mass recovery; it was noted that viscosity was notably higher at the finer sizing.
At 87 to 94%, sulphur recovery was notably higher than gold and silver recovery, indicating some of the gold and silver was associated with minerals which do not respond to sulphide flotation. This would reinforce that silver was not solely present in sulphide minerals, with Master Composite head assay aqua regia silver values measuring around 10% lower than multi-acid near total digestion silver assays.
13.2.2.2 Sequential Rougher Testing
The sequential tests were completed using sodium cyanide and zinc sulphate at pH 9 to depress sphalerite and pyrite in the bulk Pb-Ag circuit. A dithiophosphate collector 3418A was used in the bulk Pb-Ag circuit. The zinc circuit used copper sulphate to activate the sphalerite in the zinc conditioner, following which Sodium Isopropyl Xanthate (SIPX) was used as collector in the zinc rougher flotation. SIPX was then used again in the pyrite circuit to collect remaining sulphide minerals. All three master composites were tested at two primary grind sizing targets, a nominal 75 and 100 μm K80.
Most of the precious metals were recovered to the bulk Pb-Ag concentrate; however, recoveries were lower than to a bulk sulphide rougher concentrate at similar grind sizes, albeit at a lower mass recovery. Total recovery of precious metals to all three rougher concentrates was similar to or slightly lower than the total bulk flotation recovery at the same primary grind sizings. Higher overall recoveries of gold and silver were measured for all the tests conducted at the 75 μm K80 primary grind sizing compared to the nominal 100 μm K80 primary grind sizing.
Viscosity was visibly worse at the nominal 75 μm K80 sizing compared to the 100 μm K80 sizing. Addition of lime to the zinc conditioner made this effect substantially worse with an unmanageable froth. The zinc roughers were therefore completed at pH 10 at the 75 μm K80 primary grind sizing target.
Due to the low feed grades of the composites, the bulk rougher concentrate lead grades may make upgrading the rougher concentrate to a high-grade lead concentrate difficult and may result in poorer recoveries. A similar issue might be anticipated for zinc. If it is not possible to produce separate high-grade bulk (lead) or zinc concentrates, there may not be reason to pursue a sequential flowsheet for this material.
13.2.2.3 Cleaner Testing
Two open-circuit bulk cleaner tests were completed on each of the Diorite and Andesite Master Composites. The tests were conducted with and without regrinding. Without regrinding, the cleaner feed sized 46 and 59 μm K80, while with regrinding, the cleaner feed sized 27 and 35 μm K80; the coarser sizings were measured for the Diorite Master Composite. For the cleaner tests the pH was kept natural, and PAX was utilized as the sulphide mineral collector; MIBC was used as the frother.
Concentrates from the tests were relatively high grade, measuring over 0.6% silver and 29 g/t gold. It may be possible to sell concentrates of this grade; however, consultation with a marketing expert is recommended to confirm.
Recoveries represent open circuit performance; the measured losses to the cleaner tailings do not reflect how cleaner circuit losses would occur in an operating setting with circulation of the cleaner tailings. Testing would be required to confirm possible grades and recoveries of silver and gold when a closed-circuit flowsheet is utilized with cleaner tailings being recirculated. Additionally, losses to the flotation rougher tailings could be reduced through potential of cyanidation of the stream.
13.2.2.4 Cyanidation Leach Testing
Cyanidation bottle roll testing was completed as whole feed leaching as well as through leaching of flotation test products. In addition, diagnostic leach tests were conducted on whole feed leach residues to assess the association of unextracted gold and silver. The following subsections discuss the results of this testing.
Whole Feed Cyanidation Leach Testing
Whole feed cyanidation investigated leach duration, primary grind size, and addition of lead nitrate. All tests were completed with a 1000 ppm sodium cyanide concentration, a pH of 11, and at 33 weight % solids, with purging of the bottle headspace with oxygen ahead of each leaching stage.
Silver extractions were substantially higher for the Diorite Master Composite as compared to the other two composites, while gold extractions were slightly lower. Increasing leach time from 48 to 96 hours resulted in an average improvement in silver and gold extractions of about 9 and 3%, respectively. Employing a finer primary grind sizing of 71 to 76 μm K80 compared to 92 to 103 μm K80 resulted in an increase in 48-hour silver and gold extractions averaging about 2 and 3%, respectively.
There was not a measurable benefit to adding lead nitrate to the cyanidation leaching. Sodium cyanide and lime consumptions were moderate, measuring between 0.5 and 2.3 kg/t.
Cyanidation Leach Testing on Flotation Test Products
Rougher concentrates and tailings from bulk sulphide rougher testing were subjected to cyanidation bottle roll testing. Rougher concentrates were tested with and without regrinding2. All cyanidation leach tests were completed with a 48-hour leach duration, at 33 weight % solids, and at pH 11. Concentrates were leached using 2000ppm sodium cyanide, while tailings were leached using 1000 ppm sodium cyanide.
Without regrinding, the concentrates sized between 50 and 52 μm K80; at this sizing between 85 and 89% of the silver and between 88 and 92% of the gold in the concentrates was extracted to the leach liquors. With regrinding to between 28 and 33 μm K80 silver extractions measured between 93 and 95% while gold extractions measured 93 and 97%.
Between 55 and 65% of the silver and 78 to 85% of the gold in the rougher tailings streams were extracted in the cyanidation tests. The combined concentrate and tailing leach extractions ranged between 81 and 85% for silver and 87 and 92% for gold without concentrate regrinding. The combined extractions of silver increased by about 5 to 6%, and the combined extractions of gold increased by about 2 to 3% when the concentrates were reground prior to cyanidation.
Despite the higher cyanide concentrations in the concentrate cyanidations, the combined sodium cyanide consumptions were typically lower than with the whole feed cyanidation tests. Lime consumptions were also similar.
Diagnostic Leach Results
Cyanidation residues from the 96-hour whole feed leach tests on each of the composites were subjected to a three-stage diagnostic leach, assessing remaining extractable silver and gold, silver and gold contained within sulphide minerals, and silver and gold contained within non-sulphide gangue minerals.
Between 6 and 10% of the gold and 16 to 21% of the silver were not extracted in the initial whole feed leach. Of the silver, between 5 and 7% of the feed silver was extractable with more intensive cyanidation conditions. The remainder was split between being contained within sulphide minerals and non-sulphide gangue minerals. Almost none of the remaining gold was extracted through additional cyanidation, most of the gold in the residues was present within sulphide minerals, although 3% of the feed gold was present within non-sulphide gangue minerals.
To improve recovery/extraction of the sulphide contained gold/silver finer primary grinding or recovery through sulphide flotation would be required. Improved extraction of gold/silver contained within non-sulphide gangue minerals would likely only be achievable through finer grinding.
13.2.2.5 Gravity Testing
The amenability of gold and silver to gravity concentration within the Andesite and Diorite Master Composites was assessed through a preliminary Knelson gravity concentration test with hand panning of the Knelson Concentrate. Hand panning is completed to reduce mass recovery closer to typical operation mass recoveries.
About 9% of the silver and gold in the Diorite Master Composite was recovered to the pan concentrate, while 10 and 12% of the silver and gold, respectively, in the Andesite Master Composite was recovered to the pan concentrate. At these recoveries, it is unlikely that the inclusion of gravity concentration in the process flowsheet would benefit performance.
13.2.3 Conclusions
A preliminary test program has been completed on material from the Tajitos deposit on behalf of Vizsla Silver Corporation (ALS, 2022B). The program investigated various processing options such as bulk and sequential froth flotation, whole feed cyanidation, combined flotation and cyanidation, and gravity concentration. Testing was completed on three master composites, the Diorite Master Composite, the Andesite Master Composite, and the Andesite Low MnOx Master Composite.
The composites contained between 239 and 275 g/t silver and 1.2 to 2.5 g/t gold. Sulphur measured between 0.6 and 1.3%, mostly in sulphide form. Most of the sulphide was present as pyrite; copper, lead, and zinc, present as copper sulphides, galena, and sphalerite, were low in content.
The highest recoveries/extractions of gold and silver were recorded through a combination of rougher flotation and cyanidation of the rougher concentrates and tailings (Table 13‑6). However, there is potential for using a flowsheet with production of a salable flotation concentrate and cyanidation of the tailings. Table 13‑6 displays a summary of recoveries from the tested flotation/cyanidation flowsheet and the untested potential recoveries from the flowsheet with production of a salable concentrate and cyanidation of tailings for the Diorite and Andesite Master Composites.
Between 87 and 90% of the silver and 90 to 94% of the gold were extracted to leach liquors from the Diorite and Andesite Master Composites using a combined flotation and cyanidation flowsheet, including regrinding of the rougher concentrates. The best silver result was recorded using this flowsheet but without regrinding for the Andesite Low MnOx Master Composite. Insufficient sample mass was available to conduct the test with regrinding; results without regrinding were closer to whole feed cyanidation results.
Cleaner flotation alone without regrinding produced bulk concentrates of over 0.6% silver and 29 g/t gold. The open circuit gold recovery to these bulk cleaner concentrates was 64 and 60% for the Diorite and Andesite Master Composites, respectively, while the open circuit silver recovery measured about 70 and 73% for the Diorite and Andesite Master Composites, respectively. With the cleaner tailings recirculated to the rougher feed stream, the feed for a cyanidation leach would contain the remaining silver and gold; the displayed estimate extraction values are calculated based on the extractions from the rougher tailings leach tests, which extracted about two thirds of the remaining silver and 85% of the remaining gold. These values would require testing to confirm.
The overall combined extractions and recoveries between these two flowsheet options are similar; however, it is likely reagent consumptions would be lower, and the circuit would be simpler for the second option.
A sequential flotation flowsheet may not be appropriate for this material alone as low lead and zinc grades make the production of separate bulk (lead) and zinc concentrates difficult.
Diagnostic leach testing on the cyanidation residues from the 96-hour whole ore leach tests indicated that while gold extraction through cyanidation was complete after 96 hours, silver extraction could be improved by a further 5 to 7% through more aggressive cyanidation conditions. Further improvement in gold and silver extraction beyond that would require finer grinding as unextracted gold is encapsulated within sulphides and non-sulphide gangue minerals at the nominal 100 μm K80 primary grind target.
Table 13-6 Potential Flowsheet Comparison (ALS, 2022B)

Note: *Estimated values, testing would be required to confirm.
13.3 Metallurgical Testing on the Copala Deposit
The objective of the 2023 testing on the Copala deposit was to characterize the material chemically and mineralogically, along with testing the potential recovery and extractions of metals using various flowsheets (ALS, 2023). To achieve these objectives the following test work was completed:
-
Six variability composites were constructed from provided drill core and a master composite, representing all 6 variability composites, was constructed.
-
Comminution testing was completed on each composite, including SMC, Bond abrasion index testing on the variability composites, and Ball mill work index testing on every composite.
-
The chemical content of the composites was assessed through standard analytical techniques along with multi-element ICP analyses.
-
Mineralogical analyses were completed, including QEMSCAN Bulk Mineral Analyses (BMA) on the variability composites and a QEMSCAN Particle Mineral Analysis (PMA) on the master composite.
-
Flotation testing was completed on each composite, assessing a sequential flowsheet on the master composite and a bulk flowsheet on every composite.
-
Cyanidation extraction of silver and gold was explored through whole feed cyanidation as well as cyanidation of test products produced from flotation.
-
Gravity concentration was considered for the Master Composite, by conducting Knelson concentration and hand panning of the Knelson concentrate.
-
The nature of the silver remaining in cyanidation leach residues was assessed by QEMSCAN PMA and diagnostic leaching.
13.3.1 Sample Origin and Sample Characteristics
A shipment of sample was received at ALS Metallurgy on February 28, 2023. The shipment consisted of 78 samples of ½ HQ core weighing a total of 280 kilograms. Compositing instructions to form six variability composites for testing were provided by Ausenco. Var 1 to 6 composites were subjected to comminution testing prior to being crushed to six mesh; a single master composite (Master Composite 1) was constructed from the variability composites. Duplicate head cuts were removed from the composites. Head cuts of all six variability composites and the master composite were shipped to ALS Minerals in North Vancouver on March 1, 2023, for a 48 element ICP scan.
In total, 6 variability composites and one master composite were prepared for comminution and metallurgical testing.
13.3.1.1 Composite Chemical and Mineral Content
Silver and gold were the primary metals of economic interest in the composites with silver assaying between about 173 and 619 g/t and gold assaying between about 1.13 and 6.91 g/t (Table 13-7). Master Composite 1 assayed about 312 silver and 2.18 g/t gold. Silver was primarily measured as being present as acanthite, although some were located within silver-copper sulphide minerals.
It should be noted that in past testing of nearby deposits, an aqua regia digest was not sufficient in capturing the total silver content of streams. All silver assaying of solid test products and head cuts in this test program was done using a near total multi-acid digestion. Copper, lead, and zinc were present in low levels within copper sulphides, galena, and sphalerite, respectively. At these low levels, it would be unlikely that separate base metal concentrates could be produced efficiently.
Sulphur measured between 0.4 and 1.6% in the composites and was primarily contained within pyrite, and to a lesser extent, the base metal sulphides. Total sulphide content measured between 0.5 and 3.6%.
Between 46 and 86% of the samples measured as quartz (Table 13-8), which likely contributes to the high abrasiveness of the material. Feldspar measured between 9 and 29%, and most of the remaining non-sulphide gangue minerals were chlorite, micas, carbonates, and manganese silicates.
Table 13-7 Head Assay Summary (ALS, 2023)
|
Composite
|
Assay percent or g/t
|
|
Cu
|
Pb
|
Zn
|
Fe
|
S
|
Ag
|
Au
|
C
|
|
Var
|
1
|
0.011
|
0.03
|
0.05
|
2.4
|
0.35
|
364
|
2.94
|
1.38
|
|
Var
|
2
|
0.034
|
0.36
|
0.52
|
1.9
|
1.26
|
173
|
1.13
|
0.97
|
|
Var
|
3
|
0.007
|
0.01
|
0.05
|
1.2
|
0.38
|
266
|
1.81
|
0.32
|
|
Var
|
4
|
0.012
|
0.04
|
0.07
|
2.4
|
1.34
|
330
|
6.91
|
0.06
|
|
Var
|
5
|
0.008
|
0.02
|
0.04
|
2.2
|
1.56
|
248
|
1.36
|
0.91
|
|
Var
|
6
|
0.006
|
0.07
|
0.17
|
2.0
|
1.32
|
619
|
2.86
|
1.00
|
|
Master Composite
|
1
|
0.012
|
0.08
|
0.15
|
2.1
|
0.94
|
312
|
2.18
|
0.87
|
Table 13-8 Mineral Content Summary (ALS, 2023)
|
Mineral
|
Content - %
|
|
Master Composite 1
|
Var 1
|
Var 2
|
Var 3
|
Var 4
|
Var 5
|
Var 6
|
|
Silver Minerals
|
<0.1
|
<0.1
|
<0.1
|
<0.1
|
<0.1
|
<0.1
|
<0.1
|
|
Copper Sulphides
|
<0.1
|
<0.1
|
<0.1
|
<0.1
|
<0.1
|
<0.1
|
<0.1
|
|
Galena
|
<0.1
|
<0.1
|
0.4
|
<0.1
|
<0.1
|
0.1
|
<0.1
|
|
Sphalerite
|
0.2
|
<0.1
|
0.9
|
<0.1
|
<0.1
|
<0.1
|
0.2
|
|
Pyrite
|
1.4
|
0.5
|
2.3
|
0.6
|
2.4
|
3
|
2.1
|
|
Iron Oxides
|
1
|
0.7
|
0.3
|
0.2
|
0.3
|
0.3
|
0.1
|
|
Quartz
|
60.4
|
63.9
|
78.5
|
86
|
76.2
|
45.8
|
63
|
|
Feldspars
|
18.6
|
19.7
|
9.4
|
10
|
16.7
|
29.5
|
19.6
|
|
Carbonates
|
6.5
|
7.8
|
3.8
|
1.6
|
0.3
|
5.3
|
7.7
|
|
Micas
|
3.9
|
2.9
|
0.8
|
0.6
|
1.8
|
3.9
|
1.4
|
|
Chlorite
|
3.3
|
3
|
1.2
|
0.4
|
1.2
|
2
|
1.4
|
|
Garnet/Manganese Silicate
|
3.3
|
0.5
|
1.6
|
0.3
|
0.1
|
8.7
|
3.5
|
|
Others
|
1.1
|
0.4
|
0.4
|
0.1
|
0.2
|
0.7
|
0.4
|
13.3.1.2 Comminution Test Results
Comminution testing was completed on the variability and master composite. The A x b value derived from the SMC tests ranged from 27.9 to 37.2 which would be considered hard in terms of SAG milling in comparison to other samples tested in the JK Tech database. The bond abrasion index measured in a range of 0.39 to 0.61 which would be considered to be abrasive to very abrasive. The Bond ball work index values measured 16.4 to 18.9 kWhr/tonne which would be considered as above average to hard in terms of grinding in a ball mill.
13.3.1.3 Mineral Fragmentation
The liberation and fragmentation characteristics of key minerals within Master Composite 1 were analyzed using QEMSCAN Particle Mineral Analysis (PMA) protocols at a nominal 69 μm K80 primary grind sizing. Liberation data was estimated for a 97 μm K80 primary grind.
At the 69 μm K80 primary grind sizing, galena and sphalerite measured liberations of about 51 and 70%, respectively. Although borderline for galena, these liberations would likely be adequate for a sequential rougher flotation separation, physical interlocking between galena and sphalerite was low. Silver minerals were poorly liberated1 on their own but measured significant association with copper sulphides. Even considering the locking with other sulphides, silver sulphide liberation was low, and relatively poor silver recovery via flotation might be expected.
Overall sulphides including pyrite, galena, sphalerite, and other sulphide minerals, were well liberated from non-sulphide gangue at both the measured sizing and the estimated sizing. A high overall sulphide flotation recovery could be anticipated from a bulk flotation separation.
Exposure measures the percentage of a particle's surface area which is the target mineral, measured in 2 dimensions. For the combined sulphides, exposures were high, indicating recovery of sulphide minerals would not be hindered by sulphide minerals being locked within gangue minerals. However, silver minerals measured a poorer exposure; about 42% of located silver minerals at 69 μm K80 were measured in particles with less than 5% surface exposure. This could result in poorer flotation recovery (this would depend on the minerals the poorly exposed silver is associated with) and slower leach extraction.
13.3.2 Metallurgical Testing
Metallurgical testing completed in this program investigated whole feed cyanidation, bulk rougher testing with cyanidation of rougher concentrates and tails, gravity concentration with cyanidation of the gravity tail, and sequential flotation, producing bulk, zinc, and pyrite rougher concentrates.
Whole feed leach tests were completed on Master Composite 1 at 69 and 97 μm K80 primary grind sizings, 1000 ppm sodium cyanide concentration, pH 11, and 33 weight % solids. The tests were completed with and without pre-aeration, and between a 72-hour and 96-hour leach duration. All variability composite whole feed cyanidation tests were completed with a 96-hour leach duration, with 2 hours of pre-aeration, and targeting a nominal 100 μm K80 primary grind sizing target. Pre-aeration conditions used in this program utilized oxygen gas sparged into the slurry, then the bottle was sealed and rolled for the duration of the preaeration time period. One master composite test was completed with a preceding Knelson gravity concentration step, where the Knelson concentrate was hand panned; the Knelson and Pan tails were used as the cyanidation feed.
Bulk rougher flotation was completed using basic bulk sulphide flotation conditions, with potassium amyl xanthate (PAX) utilized as the sulphide/gold collector, methyl isobutyl carbinol (MIBC) used as the frother and with flotation completed at a natural pH. Rougher concentrates were reground to a nominal 20 μm K80 regrind discharge sizing target. Rougher concentrates were subjected to cyanidation bottle roll tests over 24 hours (48 and 72-hour leach durations were tested on Master Composite 1), with or without pre-aeration (16 hours of pre-aeration was used for the variability composites), and at 3000 ppm sodium cyanide concentration. Rougher tailings were leached without pre-aeration, at 1000 ppm sodium cyanide concentration, and over 72 hours (48-hour leach durations were also tested for Master Composite 1).
The following subsections discuss the results of this testing.
13.3.2.1 Whole Feed Leach Test Results
For Master Composite 1, the highest leach extractions of silver (86%) and gold (92%) were recorded in the test with 96 hours of leach duration, with a 1-hour pre-aeration, and at the 97 μm K80 primary grind sizing. The following comments relate to the Master Composite 1 whole feed cyanidation leach results:
-
The one test with a longer pre-aeration (16 hours) recorded faster initial kinetics, but lower final silver and gold extractions after 72 hours (76 and 87% respectively) compared to tests with no pre-aeration, but slower kinetics than the test with a shorter pre-aeration. Sodium cyanide consumptions were notably higher with no pre-aeration.
-
The highest extractions of silver and gold (82 and 91% respectively) for tests which terminated after 72 hours were recorded for the test completed at the finer 69 μm K80 primary grind sizing target.
-
Gravity concentration did not increase overall extraction (76 and 91% for silver and gold respectively) beyond the cyanidation extractions without gravity concentration. However, kinetics of silver and gold extractions were similar to tests with pre-aeration as a result of the gravity stage.
-
Silver extractions may not be complete after 96 hours. Gold extractions were mostly complete after 24 hours.
Silver extractions from the variability composites ranged from 82 to 94%, and similarly to the master composite, did not appear complete after 96 hours. Gold extractions ranged from about 83 to 95%. Sodium cyanide consumptions ranged from about 0.5 to 1.0 kg/t feed and lime consumptions ranged from about 1.1 to 3.1 kg/t feed.
13.3.2.2 Rougher Flotation and Cyanidation Results
In a kinetic bulk flotation test on Master Composite 1 (Test 5), which was performed at a primary grind sizing of 97μm K80, 79% of the silver and gold was recovered into the combined rougher concentrate at a mass pull of 3.8%. These conditions were used in subsequent flotation tests prior to cyanidation, except for changes in primary grind sizing. In these tests, rougher mass recovery ranged from 3 to 9% at the 97 μm K80 primary grind with minimal changes in silver flotation recovery; however, gold recovery to the flotation concentrate was about 5% higher at the higher mass recovery compared to the lower,
while silver recovery only changed by about 1%.
The conditions tested using Master Composite 1 explored three primary grind sizes, the effect of regrinding the rougher concentrate, pre-aeration of the rougher concentrate, and the duration of the leaching of the rougher concentrates and rougher tailings. In addition, one test investigated the effects of forwarding the residue from the rougher concentrate leach to the feed of the rougher tailing leach.
The highest overall silver extraction, as well as lowest final residue grades were measured for the test series (Tests 55/56/57) which was completed at the finer 69 μm K80 primary grind sizing. About 94% of the silver and 93% of the gold were extracted from the flotation products in these tests. The lowest overall residue silver and gold grades measured at the 97μm K80 primary grind sizing were recorded for the test where the rougher concentrate leach residue was combined with the rougher tailing cyanidation feed stream. About 91% of the silver and 94% of the gold was extracted from the flotation products in these tests. (Tests 60/61/62). It should be noted that rougher concentrate residue grades varied more than the extraction due to variations in rougher mass recovery.
The effect of regrinding the rougher concentrate from about 51 to 54 μm K80 to sizings ranging from 14 to 23 μm K80 resulted in notable decreases in the residue grades from the rougher concentrate leaching but sodium cyanide consumptions were notably higher with regrinding.
The silver grade in the residue of the rougher tailings cyanide leach was related to the primary grind sizing. After 48 hours of cyanidation, at a 69 μm K80 primary grind sizing, the rougher tailing residue silver grade measured about 19 g/t silver, this increased to 45 g/t silver at a 176 μm K80 primary grind sizing, while measuring 36 g/t at a 97 μm K80 primary grind sizing. The lower residue grades in rougher tailing leach residues at the finer primary grind sizing were a result of greater silver leach extraction, as well as recovery of additional silver to the rougher concentrate in flotation; the silver grade of the rougher concentrate leach residue did not increase, indicating the additional silver recovered to the rougher concentrate as a result of the finer grind sizing, leached in the cyanidation of that stream.
The gold grades of the rougher tailing leach residue were not as significantly impacted by the primary grind sizing; however, the lowest residue grades were measured at the finest primary grind sizing.
A small decrease in residue grades was noted from increasing the residence time from 48 to 72 hours; although the closest comparable 48 (Tests 22/23/24) and 72 (Tests 14/18/19) hour tests utilized aeration on the rougher concentrate for the 48-hour test and not the 72 hour test; leach extraction kinetics could have been slower in the 72 hour rougher concentrate leach test as a result.
13.3.2.3 Rougher Flotation and Cyanidation Results - Variability
The conditions used for the variability composites were based off the conditions used in tests 60, 61 and 62 for the Master Composite 1, but with the following changes:
-
The pre-aeration step for the rougher concentrate cyanidation was increased from 3 hours to 16 hours to minimize possible higher oxygen consumption effects.
-
The rougher concentrate cyanidation residue was not combined with the rougher tail, ahead of cyanidation. This allowed determination of extraction from the individual products. The rougher concentrate leach duration was 24 hours.
The recorded gold and silver extractions from applying this flowsheet to the six variability composites ranged from 85 to 92% for silver and from 85 to 96% for gold. Based on the silver and gold contributions to Master Composite 1, a silver extraction of about 90% and a gold extraction of 92% would be the calculated result, similar to what was recorded in testing on the Master Composite.
The combined sodium cyanide consumptions relative to the flotation feed ranged from about 0.7 to 1.8 kg/t feed across the variability composites, compared to between 0.6 and 1.4 kg/t across the Master Composite 1 tests.
13.3.2.4 Cyanidation Residue Analyses
The cyanidation residue from the whole feed leach test, Test 21, was investigated through using QEMSCAN Particle Mineral Analysis (PMA) protocols as well as through diagnostic leaching, with the aim of identifying the nature of silver which was not extracted through cyanidation.
The analyzed test 21 residue (feed to diagnostic leach) assayed about 50 g/t silver and represented about 14% of the feed silver content. Of this silver, about 42% was soluble in an intensive cyanide leach (24 hours at 20,000ppm NaCN, with 50 g/L leach aid, at pH 12).
After the HCl digest, about 6% of the remaining silver in the HCl digest residue was soluble. It should be noted that the HCl digest residue measured lower silver content than the stage 1 cyanide residue; the HCl digest residue silver content should have been higher than the stage 1 cyanide residue if the HCl digest removed carbonate minerals but not the silver itself, this indicates that some quantity of additional silver may have been solubilized by the HCl digest, been lost through filtration, or the cyanidation residue assay cut may not have been completely representative; this unaccounted for silver is grouped with carbonate minerals for this analysis.
Of the silver in the Stage 2 residue, about 86% was soluble in the aqua regia digest, indicating sulphide contained silver, and 14% was remaining in the aqua regia residue, indicating non-sulphide gangue contained silver. Relative to the Test 21 cyanide residue content, this would represent about 32% contained within sulphides and 5% contained within non-sulphide gangue minerals.
It should be noted that silver content was more than an order of magnitude below typically measured levels for QEMSCAN PMA protocols to accurately quantify, results should be taken as qualitative.
The measured silver minerals were poorly exposed, with 87% of the silver minerals measuring below 5% silver mineral exposure, in contrast to 42% within the feed. The silver minerals within this exposure class would not have been expected to respond to cyanide leaching but a notable percentage did, indicating either there may have been a greater exposure of silver minerals than what was measured in the feed or fine silver bearing particles may not have been fully captured in the feed analysis.
The diagnostic leach and mineralogical analysis results did not fully agree, as sulphide contained silver measured a significant percentage of the silver in the diagnostic leach, while the mineralogical analysis measured most of the silver as poorly exposed grains within nonsulphide gangue minerals. It is possible silver undetected by QEMSCAN exists within sulphide minerals and/or the aqua regia dissolved some of the silver containing non-sulphide material.
In addition, silver assays were performed on 3 size fractions from a cyanidation residue on the Master Composite and all 6 variability composites. The highest percentage of silver distribution was measured in the +75 μm fraction in the cyanidation residues for all samples. A finer primary grind would most likely be required to recover the silver in this size fraction.
13.3.2.5 Eliason Regrind Energy Test Results
A bulk rougher concentrate sample was generated for an Eliason regrind energy test using the same flotation conditions as those used to produce concentrate for cyanidation leaching in this program; this test produces an estimate of the regrinding energy required to grind a sample in a stirred mill. This test result is only an estimate of the regrinding specific energy requirement.
The bulk rougher concentrate was reground for four time periods in the bench-scale stirred regrind mill while measuring energy input and discharge particle sizing. The initial feed sizing of the rougher concentrate was 68 μm K80; the finest regrind discharge in the Eliason test sized at 13 μm K80. To reach the regrind discharge sizing of 20 μm K80 that was targeted for the rougher concentrate leach tests, an estimated 21 kWhr/tonne of rougher concentrate would be required.
13.3.2.6 Sequential Flotation Flowsheet
A sequential 3 product rougher flotation flowsheet was tested using Master Composite 1, producing separate bulk, zinc, and pyrite rougher concentrates. The flowsheet was tested at the 69 and 97 μm K80 primary grind sizings.
The flowsheet utilized zinc sulphate and sodium cyanide in the primary grind to depress sphalerite flotation in the bulk circuit. The bulk circuit utilized 3418A, a selective dithiophosphinate collector, to recover galena, silver, and gold at pH 9. The lead circuit was followed by the zinc conditioner, which used copper sulphate to activate the sphalerite at pH 11. Sodium isopropyl xanthate (SIPX) was used as collector in the zinc circuit. Following the zinc circuit, either potassium amyl xanthate (PAX) or SIPX was utilized to recover all remaining floatable sulphide species in the pyrite circuit. Lime was used as the pH modifier in all circuits and methyl isobutyl carbinol (MIBC) was used as the frother.
Results from the two tests indicate that production of separate bulk and zinc may be possible if the economics merit recovering the lead and zinc value. Significant further upgrading potential exists for both the lead and zinc within the respective circuits.
Production of a salable precious metal concentrate is likely possible given the silver and gold grades already present in the bulk rougher concentrate stream and the upgrading potential of this stream, if economics merit. Consultation with a concentrate marketing expert is required to confirm.
13.3.3 Conclusions
A preliminary test program has been completed on material from the Copala deposit on behalf of Vizsla Silver Corporation (ALS, 2023). Two main flowsheets were tested in this program, whole feed cyanidation, and rougher flotation followed by regrinding of the rougher concentrate to a nominal 20 μm K80, and then cyanidation of the rougher concentrate and the rougher tail. Flowsheet variables were tested on the Master Composite and selected conditions were applied to the variability composites. A sequential bulk, zinc, and pyrite flowsheet was also tested in a limited manner.
At a nominal 97 μm K80, the highest whole feed cyanidation silver and gold extractions from Master Composite 1 measured 86 and 92%, respectively. Silver extractions from the variability composites ranged between 82 and 94% while gold extractions ranged from 83 to 95%.
Using a combined flotation and cyanidation flowsheet, at a nominal 97 μm K80, overall extractions of 91% of the silver and 94% of the gold were achieved using Master Composite 1. Results from testing at a finer primary grind sizing of 69 μm K80 indicated higher extractions would be achievable with additional grinding, however the same conditions which achieved the best extractions at 97 μm K80 were not tested at the finer sizing.
Overall extractions from the variability composites using a flotation and cyanidation flowsheet ranged from 83 to 93% for silver and from 85 to 96% for gold. It should be noted the conditions that resulted in the highest extractions from Master Composite 1 were not those tested on the variability composites. The Master Composite 1 result was achieved with leaching the regrind rougher concentrate for 24 hours, then combining the residue with the rougher tailings and leaching for a further 72 hours. The reground rougher concentrate and rougher tailing were leached separately for the variability composites to determine extraction performance of both flotation products. The pre-aeration time on the rougher concentrate leach was extended from 3 to 16 hours for the rougher concentrate cyanidation tests to provide more time for potential higher oxygen and cyanide consumption samples.
With the inclusion of pre-aeration, whole feed leach sodium cyanide consumptions ranged between 0.3 and 0.6 kg/t feed for Master Composite 1 and between 0.5 and 1.0 kg/t for the variability composites. Without pre-aeration, sodium cyanide consumptions of 2.5 kg/t were recorded for Master Composite 1. The optimal pre-aeration conditions and duration were not determined.
Higher sodium cyanide consumptions were recorded for the flowsheet involving flotation and cyanidations of the reground rougher concentrate and rougher tail. In tests on Master Composite 1, between 0.6 and 1.8 kilograms of sodium cyanide was consumed per tonne of feed; while between 0.7 and 1.8 kilograms of sodium cyanide per tonne of feed was consumed for the variability composites.
Table 13-9 shows a comparison of the optimal performing whole feed cyanidation extraction and cyanide consumption versus the rougher flotation - cyanidation extraction and cyanide consumption.
The highest extractions were achieved using the bulk rougher flotation and cyanidation of the rougher concentrate and the rougher tail flowsheet. An economic analysis would need to be completed to assess whether the higher extraction offsets the higher capital and operating expenditure of this more complex flowsheet.
Table 13-9 Master Composite 1 Whole Feed Cyanidation Vs. Flotation - Cyanidation

A consideration could be made for a simple flowsheet that involves flotation of a bulk rougher concentrate that could be sold directly to a smelter. In Test 5, 79% of the gold and silver were recovered into a bulk rougher concentrate, at a 47 g/t gold grade and 7,071 g/t silver grade. Although the recovery is not as high as the float - cyanidation flowsheet, the cost of processing, and the capital costs would be much lower.
13.4 Comments on Mineral Processing and Metallurgical Testing
The metallurgical test programs completed on the three deposits provide a comprehensive preliminary assessment of metallurgical performance of the Panuco materials. The Copala materials appear to be hard with respect to impact breakage in a SAG mill, however these tests were not completed on the Napoleon and Tajitos samples. Bond ball mill work index tests were completed on all three deposits and suggest that the materials are somewhat hard with respect to ball mill grinding, with BMWi values averaging approximately 17 kWhr/tonne.
The Napoleon samples contained elevated levels of lead and zinc which would likely be sufficient for production of saleable bulk lead/silver and zinc concentrates by standard flotation techniques. The Tajitos and Copala samples contained low levels of base metals and the generation of separate lead/silver and zinc concentrates from these materials was not evaluated any further than rougher flotation testing. The generation of a single bulk sulphide concentrate was evaluated on all samples, which indicated that flotation concentrates containing 50-60 g/t gold and 1500 to over 8000 g/t silver could be produced.
The highest gold and silver recoveries were achieved with a combination of bulk flotation and separate leaching of the reground flotation concentrate and tails. Whole feed leaching was effective at extracting silver and gold, although generally finer primary grind sizes and 96 hour leach durations were generally required to acheive comparable silver extractions.
14 MINERAL RESOURCE ESTIMATES
14.1 Introduction
The following section describes updated MREs for the Napoleon-Luisa and Copala-Tajitos deposit areas, as well as MREs for the Animas and San Antonio areas previously published (Armitage et al., 2023).
Completion of the updated MREs for the Napoleon-Luisa and Copala-Tajitos deposit areas involved the assessment of an updated drill hole database, which included all data for surface drilling completed between November 2019 and September 2023. The MREs for the Animas and San Antonio deposit areas included data for surface drilling completed between November 2019 and September 2022; there has been no new drilling on the Animas and San Antonio deposit areas and these MREs previously published (Armitage et al., 2023) are considered current. Completion of the MREs also included the assessment of updated three-dimensional (3D) mineral resource models (resource domains), 3D topographic surface models, 3D models of historical underground workings, and available written reports.
The Inverse Distance Squared ("ID2") calculation method restricted to mineralized domains was used to interpolate grades for Ag (g/t), Au (g/t), Pb (ppm) and Zn (ppm) into block models for all deposit areas.
Indicated and Inferred mineral resources are reported in the summary tables in Section 14.11. The MREs presented below take into consideration that all deposits on the Property may be mined by underground mining methods.
The reporting of the updated MRE complies with all disclosure requirements for Mineral Resources set out in the NI 43-101 Standards of Disclosure for Mineral Projects. The classification of the updated MRE is consistent with the 2014 Canadian Institute of Mining, Metallurgy and Petroleum (CIM) Definition Standards (2014 CIM Definitions) and adheres as best as possible to the 2019 CIM Estimation of Mineral Resources & Mineral Reserves Best Practice Guidelines (2019 CIM Guidelines).
14.2 Drill Hole Database
To complete the current MREs for the Property, a database comprising a series of comma delimited spreadsheets containing surface diamond drill hole information was provided by Vizsla for the Napoleon-Luisa, Tajitos-Copala, Animas and San Antonio areas. The database included hole location information, down-hole survey data, assay data for all metals of interest, lithology data and density data. The data in the geochemistry/assay tables included data for the elements of interest including Ag (g/t), Au (g/t), Pb (ppm or %) and Zn (ppm or %). After review of the database, the data was then imported into GEOVIA GEMS version 6.8.3 software ("GEMS") for statistical analysis, block modeling and resource estimation. No errors were identified when importing the data. The data was validated in GEMS and no erroneous data, data overlaps or duplication of data was identified.
The database provided by Vizsla for the MREs include data for 822 surface diamond drill holes, completed on the Property, totalling 302,931 m (Table 14‑1) (Figure 14‑1 and Figure 14‑2). The database totals 47,694 assay intervals representing 55,368 m of drilling. The average assay sample length is 1.16 m.
The database was checked for typographical errors in drill hole locations, down hole surveys, lithology, assay values and supporting information on source of assay values. Overlaps and gapping in survey, lithology and assay values in intervals were checked. All assays had analytical values for Ag (g/t), Au (g/t) Pb (ppm) and Zn (ppm).
Table 14-1 Project Drill Hole Totals
|
Deposit Area
|
Drill
Holes
|
Drill Hole #
|
Total Length
(m)
|
No. of
Assays
|
Tot. Assay
Length (m)
|
Avg. Assay
Length (m)
|
|
Napoleon - Josephine - Luisa
|
393
|
NP-20-01 to NP-23-396
|
144,867
|
19,362
|
21,759
|
1.12
|
|
Copala - Tajitos
|
309
|
CS-20-01 to CS-23-312
|
124,224
|
20,740
|
24,590
|
1.19
|
|
Animas
|
51
|
AM-19-01 to AM-22-50
|
16,881
|
2,322
|
2,764
|
1.19
|
|
San Antonio
|
69
|
CO-20-01 to CO-22-69
|
16,959
|
5,270
|
6,255
|
1.19
|
|
Total:
|
822
|
|
302,931
|
47,694
|
55,368
|
|
Figure 14-1 Plan View: Distribution of Surface Drill Holes on the Property (WGS 84), on Topography

Figure 14-2 Isometric View Looking Northwest: Distribution of Surface Drill Holes in the Copala-Napoleon-Cruz-Luisa Area (WGS84)

14.3 Mineral Resource Modelling and Wireframing
For the current MREs, Vizsla provided the author with a total of 28 three-dimensional ("3D") resource models, constructed in Leapfrog Geo version 2022.1, representing the Napoleon area (13 models), including 1 model representing Cruz and 1 model representing Josephine; the Luisa area (2 models); the Copala area (7 models), including 1 model for Cristiano and 1 model for Tajitos; the Animas area (5 models); and San Antonio (Generales) (1 model) (Table 14-2) (Figure 14-3 to Figure 14-5). The author was also provided with digital elevation surface models (LiDAR) for the Napoleon-Copala, Animas and San Antonio areas. All 3D resource models were clipped to topography. The surface models were derived from data collected during a LiDAR survey completed by Eagle Mapping out of Langley, BC, in June of 2022. The data was received by Vizsla in August of 2022.
The author has reviewed the resource models on section and in the author's' opinion the models provided are well constructed and accurately represent the main structures identified on the Property and the distribution of the Ag-Au-Pb-Zn mineralization within these structures. Minor errors were identified by the author during the review process and were corrected by Vizsla before final resource estimation. All models have been extended well beyond the limits of the current drilling for the purpose of providing guidance for continued exploration. However, the extension of the mineral resource beyond the limits of drilling is limited by the search radius during the interpolation procedure (generally 100 m past drilling for most areas, 110 for Napoleon), as well as the Property boundary.
Mineralization in the Napoleon area extends for roughly 2,600 m along strike and up to 550 m vertically (main Napoleon structures) and is hosted in multiple, variably oriented structures. The main Napoleon structure and FW zones trend roughly 350° and dip east at -80⁰. The Napoleon HW zones variably trend from 315⁰ to 355⁰ to 2⁰ and dips range from -38 to -80° east. The Josephine structure trends 355° and dips to the east at roughly -75°. The Cruz zone trends roughly 330° and dips to the northeast at -85°. Mineralization in the Luisa structure extends for up to 950 m and to depths of 600 m. The Luisa models' trend 335⁰ and are near vertical.
Mineralization in the Copala structure extends for up to 1,700 m along strike and to depths of 450 to 550 m below surface, and is hosted in multiple, variably oriented structures. The main Copala structures trend 320 - 340 ° with dips ranging from -30° to -60⁰ east. The Cristiano structure trends 335° and dips -80⁰ east. The Tajitos structure trends 20° and dips to the east at -65°.
In the Animas area, mineralization extends to depths of up to 230 m and is hosted in multiple structures which trend 35° (near vertical) and 140° (dips roughly -55°).
The San Antonio structure is in the Cordon del Oro area and trends 195° and dips -55° to the south. Mineralization within the San Antonio structure extends for 650 along strike and up to 340 m below surface.
Table 14-2 Property Domain Descriptions
|
MODEL (Vizsla Models)
|
ROCK CODE
|
BLOCK ROCK CODE
|
BULK DENSITY
|
|
|
GEMS
|
|
Napoleon_Area_GM - HW3
|
HW3
|
306
|
2.86
|
|
Napoleon_Area_GM - Josephine
|
JOSEPHIN
|
312
|
2.69
|
|
Napoleon_Area_GM - Napoleon
|
NAPOLEON
|
300
|
2.69
|
|
Napoleon_Area_GM - NP FW1
|
FW1
|
301
|
2.76
|
|
Napoleon_Area_GM - NP-FW2
|
FW2
|
302
|
2.76
|
|
Napoleon_Area_GM - NP-FW3
|
FW3
|
303
|
2.76
|
|
Napoleon_Area_GM - NP-HW-1
|
HW1
|
304
|
2.86
|
|
Napoleon_Area_GM - NP-HW-4
|
HW4
|
307
|
2.86
|
|
Napoleon_Area_GM - NP-HW-5
|
HW5
|
308
|
2.86
|
|
Napoleon_Area_GM - NP-HW-6
|
HW6
|
309
|
2.86
|
|
Napoleon_Area_GM - NP-HW-7
|
HW7
|
310
|
2.86
|
|
Napoleon_Area_GM - Cruz negra
|
CRUZ
|
311
|
2.69
|
|
Napoleon_Area_GM - HW-2
|
HW2
|
305
|
2.86
|
|
Luisa_GM - luisa
|
LUISA
|
400
|
2.81
|
|
Luisa_GM - luisa_hw
|
LUISA_HW
|
401
|
2.81
|
|
TAJITOS_GM_SM - Copala_2
|
COPALA2
|
234
|
2.71
|
|
TAJITOS_GM_SM - Copala_4
|
COPALA4
|
236
|
2.71
|
|
TAJITOS_GM_SM - Copala_3
|
COPALA3
|
235
|
2.71
|
|
TAJITOS_GM_SM - Cristiano
|
CRISTIAN
|
240
|
2.71
|
|
TAJITOS_GM_SM - Tajitos
|
TAJITOS
|
250
|
2.65
|
|
TAJITOS_GM_SM - Copala_Main North
|
COPALAN
|
233
|
2.71
|
|
TAJITOS_GM_SM - Copala_Main
|
COPALA
|
243
|
2.71
|
|
TAJITOS_GM_SM - Copala_5 North
|
COPALA5N
|
247
|
2.71
|
|
TAJITOS_GM_SM - Copala_5
|
COPALA5
|
237
|
2.71
|
|
Animas - Cuevillas
|
CUEVILLA
|
101
|
2.60
|
|
Animas - Cuevillas_fw
|
CUEVFW
|
102
|
2.60
|
|
Animas - Rosarito
|
ROSARITO
|
104
|
2.60
|
|
Animas - Rosarito_splay
|
ROSARSPL
|
106
|
2.60
|
|
Animas - Rosarito_splay_hw
|
ROSARHW
|
105
|
2.60
|
|
LOS GENERALES VEIN - GENERALES_VEIN20230110
|
GENERAL
|
103
|
2.60
|
Figure 14-3 Plan View: Property Mineral Resource Models

Figure 14-4 Isometric View Looking Northeast: Property Mineral Resource Models

Figure 14-5 Isometric View Looking Northwest: Property Mineral Resource Models, Copala-Napoleon-Luisa Areas

14.4 Bulk Density
The author was provided with an updated database of 1,919 bulk density measurements for the current MREs. Samples were collected from the Napoleon (839 samples, average 2.69), Copala (1,049 samples, average 2.68) and the Animas (31 samples, average 2.51) areas.
Of the data collected, 568 samples are from mineralized material. Based on a review of the available density data, it was decided that a fixed value be used for each resource model. The average density used by domain for the current MRE are presented in Table 14-2 above.
It is recommended that Vizsla continue to collect additional density data as drilling continues, collecting samples from the various structures, representing different styles of mineralization, ranges in grade of Ag, Au, Pb and Zn and at different depths of the deposits. It is recommended that Vizsla continue the current bulk density sampling program as the drill program continues.
14.5 Compositing
The assay sample database available for the revised resource modelling totalled 47,694 samples representing 55,368 m of drilling (Table 14‑1). A statistical analysis of the assay data from within the mineralized domains, by area, is presented in Table 14‑3. There are a total of 6,516 assays within the resource domains.
Table 14-3 Statistical Analysis of the Drill Assay Data from Within the Deposit Mineral Domains - by Area
Copala Area: Copala, Tajitos and Cristiano
|
Variable
|
Ag g/t
|
Au g/t
|
Pb ppm
|
Zn ppm
|
|
|
Copala Area: Copala Main, Copala 1-5, Cristiano
|
|
Total # Assay Samples
|
2,814
|
|
Average Sample Length
|
1.11 m
|
|
Minimum Grade
|
0.25
|
0.00
|
2
|
9
|
|
Maximum Grade
|
23,058
|
205
|
104,000
|
88,800
|
|
Mean
|
237
|
1.40
|
822
|
1,613
|
|
Standard Deviation
|
890
|
5.86
|
3,483
|
4,950
|
|
Coefficient of variation
|
3.75
|
4.18
|
4.23
|
3.07
|
|
97.5 Percentile
|
1,850
|
11.15
|
6,000
|
11,550
|
|
Variable
|
Ag g/t
|
Au g/t
|
Pb ppm
|
Zn ppm
|
|
|
Tajitos
|
|
Total # Assay Samples
|
382
|
|
Average Sample Length
|
0.96 m
|
|
Minimum Grade
|
0.25
|
0.00
|
6
|
9
|
|
Maximum Grade
|
4,420
|
23.4
|
35,700
|
54,100
|
|
Mean
|
237
|
1.35
|
1,509
|
3,133
|
|
Standard Deviation
|
549
|
2.96
|
3,662
|
6,320
|
|
Coefficient of variation
|
2.32
|
2.20
|
2.43
|
2.02
|
|
97.5 Percentile
|
1,992
|
11.3
|
10,440
|
22,850
|
Napoleon Area: Napoleon, Cruz, Josephine and Luisa
|
Variable
|
Ag g/t
|
Au g/t
|
Pb ppm
|
Zn ppm
|
|
|
Napoleon_HW (4)
|
|
Total # Assay Samples
|
319
|
|
Average Sample Length
|
0.86 m
|
|
Minimum Grade
|
0.25
|
0.00
|
11
|
33
|
|
Maximum Grade
|
5,010
|
34.6
|
72,800
|
267,000
|
|
Mean
|
128
|
1.16
|
2,647
|
10,434
|
|
Standard Deviation
|
428
|
3.39
|
6,886
|
24,551
|
|
Coefficient of variation
|
3.35
|
2.93
|
2.60
|
2.35
|
|
97.5 Percentile
|
1,120
|
9.75
|
20,625
|
72,650
|
|
Variable
|
Ag g/t
|
Au g/t
|
Pb ppm
|
Zn ppm
|
|
|
Napoleon + Splays: Napoleon and NP_HW 1,2,3,5,6,7 and NP_FW1, 2, 3
|
|
Total # Assay Samples
|
2,236
|
|
Average Sample Length
|
0.96 m
|
|
Minimum Grade
|
0.25
|
0.00
|
2
|
18
|
|
Maximum Grade
|
8,050
|
199
|
210,000
|
237,000
|
|
Mean
|
122
|
1.86
|
4,496
|
13,217
|
|
Standard Deviation
|
396
|
8.69
|
13,705
|
24,703
|
|
Coefficient of variation
|
3.25
|
4.66
|
3.05
|
1.87
|
|
97.5 Percentile
|
895
|
13.85
|
25,700
|
84,650
|
|
Variable
|
Ag g/t
|
Au g/t
|
Pb ppm
|
Zn ppm
|
|
|
Cruz
|
|
Total # Assay Samples
|
50
|
|
Average Sample Length
|
0.88 m
|
|
Minimum Grade
|
3.50
|
0.03
|
49
|
81
|
|
Maximum Grade
|
2,490
|
21.0
|
12,650
|
114,500
|
|
Mean
|
217
|
3.24
|
2,432
|
14,522
|
|
Standard Deviation
|
489
|
5.26
|
3,067
|
22,557
|
|
Coefficient of variation
|
2.26
|
1.62
|
1.26
|
1.55
|
|
97.5 Percentile
|
2,158
|
20.4
|
11,950
|
98,600
|
|
Variable
|
Ag g/t
|
Au g/t
|
Pb ppm
|
Zn ppm
|
|
|
Josephine
|
|
Total # Assay Samples
|
89
|
|
Average Sample Length
|
0.99 m
|
|
Minimum Grade
|
0.25
|
0.00
|
1
|
9
|
|
Maximum Grade
|
11,413
|
100
|
36,200
|
99,000
|
|
Mean
|
219
|
2.86
|
2,758
|
9,889
|
|
Standard Deviation
|
1,247
|
12.4
|
5,684
|
18,395
|
|
Coefficient of variation
|
5.71
|
3.99
|
2.06
|
1.86
|
|
97.5 Percentile
|
2,014
|
4.33
|
20,425
|
66,300
|
|
Variable
|
Ag g/t
|
Au g/t
|
Pb ppm
|
Zn ppm
|
|
|
Luisa
|
|
Total # Assay Samples
|
248
|
|
Average Sample Length
|
1.05 m
|
|
Minimum Grade
|
0.25
|
0.00
|
15
|
87
|
|
Maximum Grade
|
11,502
|
121
|
136,000
|
277,000
|
|
Mean
|
186
|
3.05
|
4,213
|
15,623
|
|
Standard Deviation
|
825
|
12.1
|
12,893
|
34,342
|
|
Coefficient of variation
|
4.44
|
3.97
|
3.06
|
2.20
|
|
97.5 Percentile
|
1,450
|
27.6
|
30,450
|
149,250
|
Animas Area: Cuevillas and Rosarito
|
Variable
|
Ag g/t
|
Au g/t
|
Pb ppm
|
Zn ppm
|
|
|
Animas Area
|
|
Total # Assay Samples
|
145
|
|
Average Sample Length
|
1.04 m
|
|
Minimum Grade
|
0.25
|
0.00
|
8
|
8
|
|
Maximum Grade
|
4,420
|
24.3
|
55,600
|
116,000
|
|
Mean
|
119
|
1.17
|
2,343
|
6,653
|
|
Standard Deviation
|
388
|
2.43
|
6,919
|
16,955
|
|
Coefficient of variation
|
3.27
|
2.07
|
2.95
|
2.55
|
|
97.5 Percentile
|
566
|
6.71
|
18,100
|
64,400
|
San Antonio Area: Generales
|
Variable
|
Ag g/t
|
Au g/t
|
Pb ppm
|
Zn ppm
|
|
|
San Antonio Area
|
|
Total # Assay Samples
|
233
|
|
Average Sample Length
|
1.13 m
|
|
Minimum Grade
|
0.25
|
0.00
|
3
|
18
|
|
Maximum Grade
|
2,940
|
34.2
|
1,005
|
1,295
|
|
Mean
|
107
|
0.68
|
106
|
253
|
|
Standard Deviation
|
272
|
2.71
|
121
|
201
|
|
Coefficient of variation
|
2.55
|
3.99
|
1.14
|
0.79
|
|
97.5 Percentile
|
759
|
4.03
|
483
|
799
|
The average length of the assay sample intervals ranges from 0.30 to 1.65. Of the 6,516 assays, approximately 21% are 1.5 m in length; 37% of the assays are >1.25 m; 51% of the assays are > 1.00 m. To minimize the dilution and over smoothing due to compositing, a composite length of 1.50 m was chosen as an appropriate composite length for all areas, for the current MRE.
For the current MRE, composites for the Copala and Napoleon areas were generated within each domain to a nominal length of 1.5 m. Composites were normalized in each interval to create equal length composites. Tolerances of 0.25 m composite lengths were allowed. Un-assayed intervals were given a value of 0.0001 for Ag, Au, Pb and Zn. The composites were extracted to point files for statistical analysis and capping studies. The constrained composites were grouped based on the mineral domain (rock code) of the constraining wireframe model.
Composites for the Animas and San Antonio areas were generated starting from the collar of each hole. Un-assayed intervals were given a value of 0.0001 for Ag, Au, Pb and Zn. Composites were then constrained to the individual mineral domains. The constrained composites were extracted to point files for statistical analysis and capping studies. The constrained composites were grouped based on the mineral domain (rock code) of the constraining wireframe model.
A total of 5,397 composite sample points occur within the resource models. A statistical analysis of the composite data from within the mineralized domains, by area, is presented in (Table 14‑4). These values were used to interpolate grade into resource blocks.
Table 14-4 Statistical Analysis of the 1.5 M Composite Data from Within the Deposit Mineral Domains - by Area
Copala Area: Copala, Tajitos and Cristiano
|
Variable
|
Ag g/t
|
Au g/t
|
Pb ppm
|
Zn ppm
|
|
|
Copala Area: Copala Main, Copala 1-5, Cristiano
|
|
Total # Assay Samples
|
2,331
|
|
Average Sample Length
|
1.49 m
|
|
Minimum Grade
|
0.00
|
0.00
|
0
|
0
|
|
Maximum Grade
|
8,239
|
72.2
|
40,048
|
46,483
|
|
Mean
|
182
|
1.08
|
604
|
1,259
|
|
Standard Deviation
|
547
|
3.27
|
1,943
|
3,482
|
|
Coefficient of variation
|
3.00
|
3.04
|
3.22
|
2.77
|
|
97.5 Percentile
|
1,625
|
9.70
|
4,299
|
9,345
|
|
Variable
|
Ag g/t
|
Au g/t
|
Pb ppm
|
Zn ppm
|
|
|
Tajitos
|
|
Total # Assay Samples
|
312
|
|
Average Sample Length
|
1.46 m
|
|
Minimum Grade
|
0.00
|
0.00
|
0
|
0
|
|
Maximum Grade
|
2,333
|
15.0
|
24,201
|
28,567
|
|
Mean
|
184
|
1.06
|
1,047
|
2,111
|
|
Standard Deviation
|
397
|
2.25
|
2,609
|
4,380
|
|
Coefficient of variation
|
2.16
|
2.11
|
2.49
|
2.07
|
|
97.5 Percentile
|
1,548
|
8.68
|
8,712
|
13,740
|
Napoleon Area: Napoleon, Cruz, Josephine and Luisa
|
Variable
|
Ag g/t
|
Au g/t
|
Pb ppm
|
Zn ppm
|
|
|
Napoleon_HW (4)
|
|
Total # Assay Samples
|
354
|
|
Average Sample Length
|
1.46 m
|
|
Minimum Grade
|
0.00
|
0.00
|
0
|
0
|
|
Maximum Grade
|
2,279
|
17.7
|
65,447
|
204,395
|
|
Mean
|
50.7
|
0.46
|
1,139
|
4,400
|
|
Standard Deviation
|
196
|
3.55
|
4,524
|
15,499
|
|
Coefficient of variation
|
3.87
|
2.93
|
3.97
|
3.52
|
|
97.5 Percentile
|
426
|
3.84
|
9,276
|
38,576
|
|
Variable
|
Ag g/t
|
Au g/t
|
Pb ppm
|
Zn ppm
|
|
|
Napoleon + Splays: Napoleon and NP_HW 1,2,3,5,6,7 and NP_FW1, 2, 3
|
|
Total # Assay Samples
|
1,764
|
|
Average Sample Length
|
1.46 m
|
|
Minimum Grade
|
0.00
|
0.00
|
0
|
0
|
|
Maximum Grade
|
7,034
|
137
|
191,808
|
204,060
|
|
Mean
|
92.4
|
1.41
|
3,135
|
9,546
|
|
Standard Deviation
|
296
|
6.22
|
8,448
|
17,263
|
|
Coefficient of variation
|
3.20
|
4.40
|
2.70
|
1.81
|
|
97.5 Percentile
|
741
|
10.4
|
19,973
|
62,116
|
|
Variable
|
Ag g/t
|
Au g/t
|
Pb ppm
|
Zn ppm
|
|
|
Cruz
|
|
Total # Assay Samples
|
31
|
|
Average Sample Length
|
1.44 m
|
|
Minimum Grade
|
0.00
|
0.00
|
0
|
0
|
|
Maximum Grade
|
1,063
|
16.4
|
12,546
|
102,928
|
|
Mean
|
164
|
2.86
|
2,520
|
15,990
|
|
Standard Deviation
|
260
|
3.94
|
3,074
|
22,434
|
|
Coefficient of variation
|
1.58
|
1.38
|
1.22
|
1.40
|
|
97.5 Percentile
|
999
|
13.1
|
11,277
|
83,177
|
|
Variable
|
Ag g/t
|
Au g/t
|
Pb ppm
|
Zn ppm
|
|
|
Josephine
|
|
Total # Assay Samples
|
115
|
|
Average Sample Length
|
1.49 m
|
|
Minimum Grade
|
0.00
|
0.00
|
0
|
0
|
|
Maximum Grade
|
5,423
|
59.9
|
17,410
|
54,909
|
|
Mean
|
81.9
|
1.37
|
1,114
|
3,626
|
|
Standard Deviation
|
512
|
7.10
|
2,632
|
9,081
|
|
Coefficient of variation
|
6.25
|
5.19
|
2.36
|
2.50
|
|
97.5 Percentile
|
502
|
4.53
|
8,731
|
29,520
|
|
Variable
|
Ag g/t
|
Au g/t
|
Pb ppm
|
Zn ppm
|
|
|
Luisa
|
|
Total # Assay Samples
|
183
|
|
Average Sample Length
|
1.49 m
|
|
Minimum Grade
|
0.00
|
0.00
|
0
|
0
|
|
Maximum Grade
|
5,118
|
53.7
|
53,085
|
145,469
|
|
Mean
|
149
|
2.44
|
3,287
|
12,377
|
|
Standard Deviation
|
480
|
7.08
|
7,138
|
21,843
|
|
Coefficient of variation
|
3.23
|
2.90
|
2.17
|
1.76
|
|
97.5 Percentile
|
879
|
19.0
|
24,335
|
71,484
|
Animas Area
|
Variable
|
Ag g/t
|
Au g/t
|
Pb ppm
|
Zn ppm
|
|
|
Animas Area:
|
|
Total # Composite Samples
|
120
|
|
Composite Length
|
1.50 m
|
|
Minimum Grade
|
0.00
|
0.00
|
0.00
|
0.00
|
|
Maximum Grade
|
1,124
|
7.39
|
40,800
|
86,460
|
|
Mean
|
78.3
|
0.83
|
1,760
|
4,940
|
|
Standard Deviation
|
156
|
1.37
|
4,825
|
11,817
|
|
Coefficient of variation
|
2.00
|
1.65
|
2.74
|
2.39
|
|
97.5 Percentile
|
592
|
6.14
|
16,850
|
46,298
|
San Antonio Area
|
Variable
|
Ag g/t
|
Au g/t
|
Pb ppm
|
Zn ppm
|
|
|
San Antonio Area:
|
|
Total # Composite Samples
|
187
|
|
Composite Length
|
1.50 m
|
|
Minimum Grade
|
0.00
|
0.00
|
0.00
|
0.00
|
|
Maximum Grade
|
2,379
|
27.6
|
756
|
1,251
|
|
Mean
|
90.9
|
0.61
|
98.0
|
246
|
|
Standard Deviation
|
226
|
2.34
|
101
|
188
|
|
Coefficient of variation
|
2.49
|
3.86
|
1.03
|
0.76
|
|
97.5 Percentile
|
564
|
2.94
|
350
|
727
|
14.6 Grade Capping
A statistical analysis of the composite database within the resource models (the “resource” population) was conducted to investigate the presence of high-grade outliers which can have a disproportionately large influence on the average grade of a mineral deposit. High grade outliers in the composite data were investigated using statistical data (Table 14‑4), histogram plots, and cumulative probability plots of the 1.5 m composite data. The statistical analysis was completed by deposit area and was completed using GEMS.
After review, it is the opinion that capping of high-grade composites to limit their influence during the grade estimation is necessary for Ag, Au, Pb and Zn for all areas. A summary of grade capping values within the mineralized domains, by area, is presented in Table 14‑5. In the opinion of the author, the capping applied to the deposit composites has had the desired effect of limiting the influence of high-grade outliers on the global MRE. The capped composites are used for grade interpolation into the Deposit block models.
Table 14-5 Composite Capping Summary - by Domain/Deposit Area
|
|
Total # of
Composites
|
Attribute
|
Capping
Value
|
#
Capped
|
Mean of
Raw
Composites
|
Mean of
Capped
Composites
|
CoV of Raw
Composites
|
CoV of
Capped
Composites
|
|
Copalla Area
|
|
|
|
|
|
|
|
|
|
Copalla + Cristiano
|
2,331
|
Ag g/t
|
2,500
|
27
|
182
|
164
|
3.00
|
2.49
|
|
|
|
Au g/t
|
24.0
|
6
|
1.08
|
1.05
|
3.04
|
2.73
|
|
|
|
Pb ppm
|
10,000
|
23
|
604
|
542
|
3.22
|
2.42
|
|
|
|
Zn ppm
|
16,000
|
23
|
1,259
|
1,129
|
2.77
|
2.11
|
|
Tajitos
|
312
|
Ag g/t
|
1,400
|
11
|
184
|
169
|
2.16
|
1.97
|
|
|
|
Au g/t
|
10.0
|
6
|
1.06
|
1.03
|
2.11
|
1.99
|
|
|
|
Pb ppm
|
10,000
|
4
|
1,047
|
945
|
2.49
|
2.06
|
|
|
|
Zn ppm
|
12,000
|
13
|
2,111
|
1,788
|
2.07
|
1.63
|
|
Napoleon Area
|
|
|
|
|
|
|
|
|
|
Napoleon_HW and _FW
|
1,087
|
Ag g/t
|
1,200
|
8
|
65.2
|
54
|
4.54
|
2.93
|
|
|
Au g/t
|
12
|
8
|
0.64
|
0.55
|
4.08
|
2.92
|
|
|
|
Pb ppm
|
30,000
|
9
|
1,763
|
1,389
|
4.81
|
2.88
|
|
|
|
Zn ppm
|
90,000
|
6
|
5,501
|
5,332
|
2.81
|
2.63
|
|
Napoleon Main
|
1,031
|
Ag g/t
|
1,800
|
4
|
107
|
103
|
2.48
|
2.20
|
|
|
|
Au g/t
|
40
|
5
|
1.90
|
1.63
|
4.05
|
2.74
|
|
|
|
Pb ppm
|
40,000
|
7
|
3,896
|
3,751
|
1.86
|
1.62
|
|
|
|
Zn ppm
|
90,000
|
8
|
12,042
|
11,777
|
1.50
|
1.39
|
|
Cruz
|
31
|
Ag g/t
|
600
|
2
|
164
|
138
|
1.58
|
1.33
|
|
|
|
Au g/t
|
10
|
1
|
2.86
|
2.66
|
1.38
|
1.26
|
|
|
|
Pb ppm
|
10,000
|
2
|
2,520
|
2,438
|
1.22
|
1.16
|
|
|
|
Zn ppm
|
30,000
|
7
|
15,999
|
11,489
|
1.40
|
1.03
|
|
Josephine
|
115
|
Ag g/t
|
700
|
1
|
81.9
|
40.8
|
6.25
|
3.05
|
|
|
|
Au g/t
|
10
|
2
|
1.37
|
0.6
|
5.19
|
2.67
|
|
|
|
Pb ppm
|
10,000
|
2
|
1,114
|
1,049
|
2.36
|
2.19
|
|
|
|
Zn ppm
|
30,000
|
2
|
3,626
|
3,255
|
2.50
|
2.27
|
|
Luisa
|
183
|
Ag g/t
|
900
|
5
|
149
|
105
|
3.23
|
1.73
|
|
|
|
Au g/t
|
8
|
9
|
2.44
|
1.45
|
2.90
|
1.48
|
|
|
|
Pb ppm
|
10,000
|
13
|
3,287
|
2,212
|
2.17
|
1.28
|
|
|
|
Zn ppm
|
60,000
|
8
|
12,377
|
10,965
|
1.76
|
1.45
|
|
|
|
|
|
|
|
|
|
|
|
Animas Area
|
120
|
Ag g/t
|
550
|
3
|
78.3
|
70.5
|
2.00
|
1.66
|
|
|
|
Au g/t
|
4.5
|
5
|
0.83
|
0.75
|
1.65
|
1.42
|
|
|
|
Pb ppm
|
20,000
|
1
|
1,760
|
1,587
|
2.74
|
2.30
|
|
|
|
Zn ppm
|
25,000
|
5
|
4,940
|
3,753
|
2.39
|
1.68
|
|
|
|
|
|
|
|
|
|
|
|
San Antonio Area
|
187
|
Ag g/t
|
800
|
4
|
90.9
|
80.4
|
2.49
|
1.86
|
|
|
|
Au g/t
|
8
|
4
|
0.61
|
0.48
|
3.86
|
2.57
|
|
|
|
Pb ppm
|
No Cap
|
0
|
98
|
98
|
1.03
|
1.03
|
|
|
|
Zn ppm
|
No Cap
|
0
|
246
|
246
|
0.76
|
0.76
|
14.7 Block Model Parameters
The Property mineral resource domains are used to constrain composite values chosen for interpolation, and the mineral blocks reported in the estimate of the mineral resources. Separate block models, within UTM coordinate space, were created for the Napoleon, Luisa, Copala, Tajitos, San Antonio and Animas areas (Table 14-6 and Figure 14-6 to Figure 14-8). Block model dimensions, in the x (east m), y (north m) and z (level m) directions were placed over the grade shells (restricted to the Property) with only that portion of each block inside the shell recorded (as a percentage of the block) as part of the MRE (% Block Model). The block size for each block model was selected based on drillhole spacing, composite length, the geometry and shape of the mineralized domains, and the selected mining methods (underground). At the scale of the deposit models, the selected block size for each model provides a reasonable block size for discerning grade distribution, while still being large enough not to mislead when looking at higher cut-off grade distribution within the model. The models were intersected with surface topography to exclude blocks, or portions of blocks, that extend above the bedrock surface.
Table 14-6 Deposit Block Model Geometry
|
Block Model
|
Napoleon Area: Napoleon and Josephine
|
|
X (East)
|
Y (North)
|
Z (Level)
|
|
Origin (WGS 84)
|
402960
|
2585930
|
625 m
|
|
Extent (blocks)
|
510
|
542
|
185
|
|
Block Size
|
2 m
|
10 m
|
5 m
|
|
Rotation (counterclockwise)
|
0°
|
|
Block Model
|
Napoleon Area: Luisa
|
|
X (East)
|
Y (North)
|
Z (Level)
|
|
Origin (WGS 84)
|
403000
|
2585950
|
550 m
|
|
Extent (blocks)
|
120
|
230
|
180
|
|
Block Size
|
2 m
|
5 m
|
5 m
|
|
Rotation (counterclockwise)
|
30°
|
|
Block Model
|
Copala Area: Copala and Cristiano
|
|
X (East)
|
Y (North)
|
Z (Level)
|
|
Origin (WGS 84)
|
404285
|
2585930
|
635 m
|
|
Extent (blocks)
|
300
|
540
|
250
|
|
Block Size
|
3 m
|
3 m
|
3 m
|
|
Rotation (counterclockwise)
|
0°
|
|
Block Model
|
Copala Area: Tajitos
|
|
X (East)
|
Y (North)
|
Z (Level)
|
|
Origin (WGS 84)
|
404000
|
2586255
|
570 m
|
|
Extent (blocks)
|
220
|
520
|
190
|
|
Block Size
|
3 m
|
3 m
|
3 m
|
|
Rotation (counterclockwise)
|
0°
|
|
Block Model
|
San Antonio Area
|
|
X (East)
|
Y (North)
|
Z (Level)
|
|
Origin (WGS 84)
|
407550
|
2588250
|
1150 m
|
|
Extent (blocks)
|
200
|
185
|
250
|
|
Block Size
|
5 m
|
2 m
|
2 m
|
|
Rotation (counterclockwise)
|
0°
|
|
Block Model
|
Animas Area: Cuevillas and Rosarito
|
|
X (East)
|
Y (North)
|
Z (Level)
|
|
Origin (WGS 84)
|
407700
|
2590300
|
650 m
|
|
Extent (blocks)
|
150
|
120
|
100
|
|
Block Size
|
3 m
|
3 m
|
3 m
|
|
Rotation (counterclockwise)
|
0°
|
Figure 14-6 Plan View: Distribution of Mineral Resource Block Models and Mineralization Domains

Figure 14-7 Isometric View looking NW: Distribution of Mineral Resource Block Models and Mineralization Domains on the Property

Figure 14-8 Isometric View looking NW: Distribution of Mineral Resource Block Models and Mineralization Domains in the Napoleon-Copala Areas
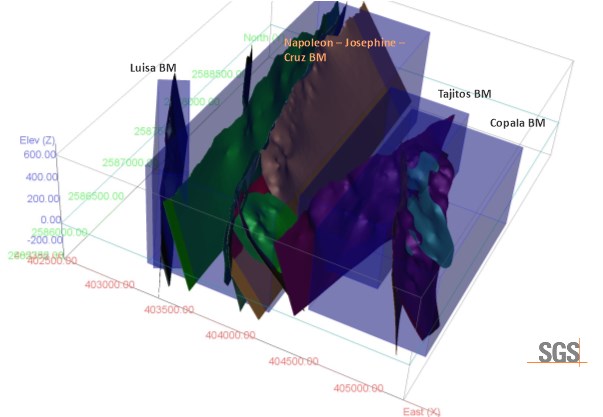
14.8 Grade Interpolation
Silver, gold, lead, and zinc as were estimated for each mineralization domain within each block model. Blocks within each mineralized domain were interpolated using composites assigned to that domain. To generate grade within the blocks, the inverse distance squared (ID2) interpolation method was used for all domains.
For all domains, the search ellipse used to interpolate grade into the resource blocks was interpreted based on orientation and size of the mineralized domains. The search ellipse axes are generally oriented to reflect the observed preferential long axis (geological trend) of the domain and the observed trend of the mineralization down dip/down plunge (Table 14‑7).
Two passes were used to interpolate grade into all the blocks in the grade shells. For Pass 1 the search ellipse size for all mineralized domains ranged from 60 x 60 x 20 to 65 x 65 x 20; for Pass 2 the search ellipse size was set at 100 x 100 x 40. Blocks were classified as Indicated if they were populated with grade during Pass 1 of the interpolation procedure and Inferred if they were populated with grade during Pass 2 of the interpolation procedure.
Grades were interpolated into blocks using a minimum of 5 and maximum of 8 composites to generate block grades during Pass 1 (maximum of 3 sample composites per drill hole), and a minimum of 3 and maximum of 8 composites to generate block grades during pass 2 (maximum of 2 sample composites per drill hole).
Table 14-7 Grade Interpolation Parameters by Area and Domain
Napoleon Area: Includes Napoleon and Josephine
|
Parameter
|
Domain - Josephine
|
Domain - Napoleon
Main
|
Domain - NAP-FW
|
Domain - NAP-HW-1
|
|
Pass 1
|
Pass 2
|
Pass 1
|
Pass 2
|
Pass 1
|
Pass 2
|
Pass 1
|
Pass 2
|
|
Indicated
|
Inferred
|
Indicated
|
Inferred
|
Indicated
|
Inferred
|
Indicated
|
Inferred
|
|
Calculation Method
|
Inverse Distance squared
|
Inverse Distance squared
|
Inverse Distance squared
|
Inverse Distance squared
|
|
Search Type
|
Ellipsoid
|
Ellipsoid
|
Ellipsoid
|
Ellipsoid
|
|
Principle Azimuth
|
85°
|
170°
|
78°
|
85°
|
|
Principle Dip
|
-72°
|
-10°
|
-80°
|
-38°
|
|
Intermediate Azimuth
|
175°
|
80°
|
348°
|
355°
|
|
Anisotropy X range
|
60
|
100
|
65
|
100
|
65
|
100
|
60
|
100
|
|
Anisotropy Y range
|
60
|
100
|
20
|
40
|
65
|
100
|
60
|
100
|
|
Anisotropy Z range
|
20
|
40
|
65
|
100
|
20
|
40
|
20
|
40
|
|
Min. Samples
|
5
|
3
|
5
|
3
|
5
|
3
|
5
|
3
|
|
Max. Samples
|
8
|
8
|
8
|
8
|
8
|
8
|
8
|
8
|
|
Min. Drill Holes
|
2
|
2
|
2
|
2
|
2
|
2
|
2
|
2
|
|
Parameter
|
Domain - NAP-HW2
|
Domain - NAP-HW3
|
Domain - NAP-HW-4
|
Domain - NAP-HW-
5,6,7
|
|
Pass 1
|
Pass 2
|
Pass 1
|
Pass 2
|
Pass 1
|
Pass 2
|
Pass 1
|
Pass 2
|
|
Indicated
|
Inferred
|
Indicated
|
Inferred
|
Indicated
|
Inferred
|
Indicated
|
Inferred
|
|
Calculation Method
|
Inverse Distance squared
|
Inverse Distance squared
|
Inverse Distance squared
|
Inverse Distance squared
|
|
Search Type
|
Ellipsoid
|
Ellipsoid
|
Ellipsoid
|
Ellipsoid
|
|
Principle Azimuth
|
45°
|
92°
|
85°
|
76°
|
|
Principle Dip
|
-63°
|
-70°
|
-55°
|
-80°
|
|
Intermediate Azimuth
|
315°
|
2°
|
355°
|
346°
|
|
Anisotropy X range
|
60
|
100
|
60
|
100
|
60
|
100
|
65
|
100
|
|
Anisotropy Y range
|
60
|
100
|
60
|
100
|
60
|
100
|
65
|
100
|
|
Anisotropy Z range
|
20
|
40
|
20
|
40
|
20
|
40
|
20
|
40
|
|
Min. Samples
|
5
|
3
|
5
|
3
|
5
|
3
|
5
|
3
|
|
Max. Samples
|
8
|
8
|
8
|
8
|
8
|
8
|
8
|
8
|
|
Min. Drill Holes
|
2
|
2
|
2
|
2
|
2
|
2
|
2
|
2
|
Napoleon Area:Luisa and Cruz
|
Parameter
|
Domain - Luisa and Luisa HW
|
Domain - Cruz
|
|
Pass 1
|
Pass 2
|
Pass 1
|
Pass 2
|
|
Indicated
|
Inferred
|
Indicated
|
Inferred
|
|
Calculation Method
|
Inverse Distance squared
|
Inverse Distance squared
|
|
Search Type
|
Ellipsoid
|
Ellipsoid
|
|
Principle Azimuth
|
65°
|
63°
|
|
Principle Dip
|
-85°
|
-85°
|
|
Intermediate Azimuth
|
335°
|
333°
|
|
Anisotropy X range
|
60
|
100
|
60
|
100
|
|
Anisotropy Y range
|
60
|
100
|
60
|
100
|
|
Anisotropy Z range
|
20
|
40
|
20
|
40
|
|
Min. Samples
|
5
|
3
|
5
|
3
|
|
Max. Samples
|
8
|
8
|
8
|
8
|
|
Min. Drill Holes
|
2
|
2
|
2
|
2
|
Copala Area: Copala and Cristiano
|
Parameter
|
Domain - Copala, Copala5
|
Domain - Copala North, Copala5
North
|
|
Pass 1
|
Pass 2
|
Pass 1
|
Pass 2
|
|
Indicated
|
Inferred
|
Indicated
|
Inferred
|
|
Calculation Method
|
Inverse Distance squared
|
Inverse Distance squared
|
|
Search Type
|
Ellipsoid
|
Ellipsoid
|
|
Principle Azimuth
|
67°
|
70°
|
|
Principle Dip
|
-54°
|
-30°
|
|
Intermediate Azimuth
|
337°
|
340°
|
|
Anisotropy X range
|
60
|
100
|
60
|
100
|
|
Anisotropy Y range
|
60
|
100
|
60
|
100
|
|
Anisotropy Z range
|
20
|
40
|
20
|
40
|
|
Min. Samples
|
5
|
3
|
5
|
3
|
|
Max. Samples
|
8
|
8
|
8
|
8
|
|
Min. Drill Holes
|
2
|
2
|
2
|
2
|
|
Parameter
|
Domain - Copala2
|
Domain - Copala 3
|
Domain - Copala4
|
Domain - Cristiano
|
|
Pass 1
|
Pass 2
|
Pass 1
|
Pass 2
|
Pass 1
|
Pass 2
|
Pass 1
|
Pass 2
|
|
Indicated
|
Inferred
|
Indicated
|
Inferred
|
Indicated
|
Inferred
|
Indicated
|
Inferred
|
|
Calculation Method
|
Inverse Distance squared
|
Inverse Distance squared
|
Inverse Distance squared
|
Inverse Distance squared
|
|
Search Type
|
Ellipsoid
|
Ellipsoid
|
Ellipsoid
|
Ellipsoid
|
|
Principle Azimuth
|
114°
|
67°
|
48°
|
66°
|
|
Principle Dip
|
-51°
|
-44°
|
-60°
|
-80°
|
|
Intermediate Azimuth
|
24°
|
337°
|
318°
|
336°
|
|
Anisotropy X range
|
60
|
100
|
60
|
100
|
60
|
100
|
60
|
100
|
|
Anisotropy Y range
|
60
|
100
|
60
|
100
|
60
|
100
|
60
|
100
|
|
Anisotropy Z range
|
20
|
40
|
20
|
40
|
20
|
40
|
20
|
40
|
|
Min. Samples
|
5
|
3
|
5
|
3
|
5
|
3
|
5
|
3
|
|
Max. Samples
|
8
|
8
|
8
|
8
|
8
|
8
|
8
|
8
|
|
Min. Drill Holes
|
2
|
2
|
2
|
2
|
2
|
2
|
2
|
2
|
Copala Area: Tajitos
|
Parameter
|
Domain - Tajitos
|
|
Pass 1
|
Pass 2
|
|
Indicated
|
Inferred
|
|
Calculation Method
|
Inverse Distance squared
|
|
Search Type
|
Ellipsoid
|
|
Principle Azimuth
|
108°
|
|
Principle Dip
|
-66°
|
|
Intermediate Azimuth
|
18°
|
|
Anisotropy X range
|
60
|
100
|
|
Anisotropy Y range
|
60
|
100
|
|
Anisotropy Z range
|
20
|
40
|
|
Min. Samples
|
5
|
3
|
|
Max. Samples
|
8
|
8
|
|
Min. Drill Holes
|
2
|
2
|
San Antonio Area
|
Parameter
|
Domain - San Antonio
|
|
Pass 1
|
Pass 2
|
|
Indicated
|
Inferred
|
|
Calculation Method
|
Inverse Distance squared
|
|
Search Type
|
Ellipsoid
|
|
Principle Azimuth
|
195°
|
|
Principle Dip
|
-55°
|
|
Intermediate Azimuth
|
105°
|
|
Anisotropy X range
|
60
|
100
|
|
Anisotropy Y range
|
60
|
100
|
|
Anisotropy Z range
|
20
|
40
|
|
Min. Samples
|
5
|
3
|
|
Max. Samples
|
8
|
8
|
|
Min. Drill Holes
|
2
|
2
|
Animas Area: Cuevillas and Rosarito
|
Parameter
|
Domain - Cuevillas
|
Domain - Rosarito
|
|
Pass 1
|
Pass 2
|
Pass 1
|
Pass 2
|
|
Indicated
|
Inferred
|
Indicated
|
Inferred
|
|
Calculation Method
|
Inverse Distance squared
|
Inverse Distance squared
|
|
Search Type
|
Ellipsoid
|
Ellipsoid
|
|
Principle Azimuth
|
135°
|
230°
|
|
Principle Dip
|
-85°
|
-55°
|
|
Intermediate Azimuth
|
40°
|
140°
|
|
Anisotropy X range
|
60
|
100
|
60
|
100
|
|
Anisotropy Y range
|
60
|
100
|
60
|
100
|
|
Anisotropy Z range
|
20
|
40
|
20
|
40
|
|
Min. Samples
|
5
|
3
|
5
|
3
|
|
Max. Samples
|
8
|
8
|
8
|
8
|
|
Min. Drill Holes
|
2
|
2
|
2
|
2
|
14.9 Mineral Resource Classification Parameters
The MREs presented in this Technical Report are disclosed in compliance with all current disclosure requirements for mineral resources set out in the NI 43-101 Standards of Disclosure for Mineral Projects (2016). The classification of the current MREs into Indicated and Inferred are consistent with current 2014 CIM Definition Standards - For Mineral Resources and Mineral Reserves, including the critical requirement that all mineral resources "have reasonable prospects for eventual economic extraction".
The current MREs are sub-divided, in order of increasing geological confidence, into the Indicated and Inferred categories. An Inferred Mineral Resource has a lower level of confidence than that applied to an Indicated Mineral Resource. An Indicated Mineral Resource has a higher level of confidence than an Inferred Mineral Resource but has a lower level of confidence than a Measured Mineral Resource. There are no Measured Mineral Resources reported.
A Mineral Resource is a concentration or occurrence of solid material of economic interest in or on the Earth's crust in such form, grade or quality and quantity that there are reasonable prospects for eventual economic extraction.
Interpretation of the word 'eventual' in this context may vary depending on the commodity or mineral involved. For example, for some coal, iron, potash deposits and other bulk minerals or commodities, it may be reasonable to envisage 'eventual economic extraction' as covering time periods in excess of 50 years. For many gold or base metal deposits, application of the concept would normally be perhaps 10 to 15 years.
The location, quantity, grade or quality, continuity and other geological characteristics of a Mineral Resource are known, estimated or interpreted from specific geological evidence and knowledge, including sampling.
Indicated Mineral Resource
An 'Indicated Mineral Resource' is that part of a Mineral Resource for which quantity, grade or quality, densities, shape and physical characteristics can be estimated with a level of confidence sufficient to allow the appropriate application of technical and economic parameters, to support mine planning and evaluation of the economic viability of the deposit.
Geological evidence is derived from adequately detailed and reliable exploration, sampling and testing and is sufficient to assume geological and grade or quality continuity between points of observation.
An Indicated Mineral Resource has a lower level of confidence than that applying to a Measured Mineral Resource and may only be converted to a Probable Mineral Reserve.
Mineralization may be classified as an Indicated Mineral Resource by the Qualified Person when the nature, quality, quantity and distribution of data are such as to allow confident interpretation of the geological framework and to reasonably assume the continuity of mineralization. The Qualified Person must recognize the importance of the Indicated Mineral Resource category to the advancement of the feasibility of the project. An Indicated Mineral Resource Estimate is of sufficient quality to support a Preliminary Feasibility Study which can serve as the basis for major development decisions.
Inferred Mineral Resource
An Inferred Mineral Resource is that part of a Mineral Resource for which quantity and grade or quality are estimated on the basis of limited geological evidence and sampling. Geological evidence is sufficient to imply but not verify geological and grade or quality continuity.
An Inferred Mineral Resource has a lower level of confidence than that applying to an Indicated Mineral Resource and must not be converted to a Mineral Reserve. It is reasonably expected that the majority of Inferred Mineral Resources could be upgraded to Indicated Mineral Resources with continued exploration.
An Inferred Mineral Resource is based on limited information and sampling gathered through appropriate sampling techniques from locations such as outcrops, trenches, pits, workings and drill holes. Inferred Mineral Resources must not be included in the economic analysis, production schedules, or estimated mine life in publicly disclosed Pre-Feasibility or Feasibility Studies, or in the Life of Mine plans and cash flow models of developed mines. Inferred Mineral Resources can only be used in economic studies as provided under NI 43-101.
There may be circumstances, where appropriate sampling, testing, and other measurements are sufficient to demonstrate data integrity, geological and grade/quality continuity of a Measured or Indicated Mineral Resource, however, quality assurance and quality control, or other information may not meet all industry norms for the disclosure of an Indicated or Measured Mineral Resource. Under these circumstances, it may be reasonable for the Qualified Person to report an Inferred Mineral Resource if the Qualified Person has taken steps to verify the information meets the requirements of an Inferred Mineral Resource.
14.10 Reasonable Prospects of Eventual Economic Extraction
The general requirement that all Mineral Resources have "reasonable prospects for economic extraction" implies that the quantity and grade estimates meet certain economic thresholds and that the Mineral Resources are reported at an appropriate cut-off grade taking into account extraction scenarios and processing recoveries. To meet this requirement, the Author considers that the deposits within the project area are amenable to underground extraction.
To determine the quantities of material offering "reasonable prospects for economic extraction" by underground mining methods, reasonable mining assumptions to evaluate the proportions of the block model (Indicated and Inferred blocks) that could be "reasonably expected" to be mined from underground are used. Based on the location, size, shape, general thickness, and orientation of the of the mineralized zones within the project area, it is envisioned that the deposits may be mined using a combination of underground mining methods including sub-level stoping (SLS) and/or cut and fill (CAF) mining. The underground parameters used, based on these potential mining methods, are summarized in Table 14-8. Underground Mineral Resources are reported at a base case cut-off grade of 150 g/t AgEq. A base case cut-off grade of 150 g/t AgEq is applied to identify blocks that will have reasonable prospects of eventual economic extraction.
The reporting of the underground resources is presented undiluted and in situ, constrained by continuous 3D wireframe models, and are considered to have reasonable prospects for eventual economic extraction. The underground mineral resource grade blocks were quantified above the base case cut-off grade, below topography and within the 3D constraining mineralized wireframes (the constraining volumes).
Table 14-8 Parameters used for Underground Cut-off Grade Calculation
|
Parameter
|
Value
|
Unit
|
|
Silver Price
|
$24.00
|
US$ per oz
|
|
Gold Price
|
$1800
|
US$ per oz
|
|
Zinc Price
|
$1.35
|
US$ per pound (US$/t)
|
|
Lead Price
|
$1.10
|
US$ per pound (US$/t)
|
|
Underground Mining Cost
|
$45.00
|
US$ per tonne mined
|
|
Processing Cost (incl. crushing)
|
$30.00
|
US$ per tonne milled
|
|
Underground General and Administrative
|
$20.00
|
US$ tonne of feed
|
|
Silver Recovery
|
93.0
|
Percent (%)
|
|
Gold Recovery
|
90.0
|
Percent (%)
|
|
Lead Recovery
|
94.0
|
Percent (%)
|
|
Zinc Recovery
|
94.0
|
Percent (%)
|
|
Mining loss/Dilution (underground)
|
10/10
|
Percent (%) / Percent (%)
|
|
Base Case Cut-off grade
|
150 g/t AgEq
|
|
14.11 Mineral Resource Statement
The updated MRE for the Project is presented in Table 14‑9 and Table 14‑10 (Figure 14‑9 to Figure 14‑14).
Highlights of the Project Mineral Resource Estimate are as follows:
-
Indicated Mineral Resources are estimated at 9.48 Mt grading 289 g/t silver, 2.41 g/t gold, 0.27% lead, and 0.84% zinc (511 AgEq). The current MRE includes indicated mineral resources of 88.2 Moz of silver, 736 koz of gold, 56 Mlbs of lead, and 176 Mlbs of zinc (155.8 Moz AgEq).
-
Inferred Mineral Resources are estimated at 12.19 Mt grading 239 g/t silver, 1.93 g/t gold, 0.29% lead, and 1.03% zinc (433 g/t AgEq). The current MRE includes inferred mineral resources of 93.7 Moz of silver, 758 koz of gold, 78 Mlbs of lead, and 276 Mlbs of zinc (169.6 Moz AgEq).
Table 14-9 Panuco Project Mineral Resource Estimate, September 1, 2023
|
Resource
Class
|
Tonnes
(MT)
|
Grade
|
Total Metal
|
|
Au g/t
|
Ag g/t
|
Pb %
|
Zn %
|
*AgEq
(g/t)
|
Au
(koz)
|
Ag
(koz)
|
Pb
(Mlbs)
|
Zn
(Mlbs)
|
AgEq
(koz)
|
|
Indicated
|
9.48
|
2.41
|
289
|
0.27
|
0.84
|
511
|
736
|
88,192
|
56.0
|
176.1
|
155,841
|
|
Inferred
|
12.19
|
1.93
|
239
|
0.29
|
1.03
|
433
|
758
|
93,653
|
78.1
|
276.2
|
169,647
|
*Ag (gpt) + [Au ppm x (Au price / Ag Price)] [Pb (%) X 2204.6 X Pb Price / Ag Price X 31.1] + [Zn (%) X 2204.6 X Zn Price / Ag Price X 31.1]. Metal price assumptions are $24.00/oz silver, $1,800/oz gold, $1.10/lb lead and $1.35/t zinc.
(1) The classification of the current Mineral Resource Estimate into Indicated and Inferred is consistent with current 2014 CIM Definition Standards - For Mineral Resources and Mineral Reserves.
(2) All figures are rounded to reflect the relative accuracy of the estimate and numbers may not add due to rounding.
(3) Mineral resources which are not mineral reserves do not have demonstrated economic viability. An Inferred Mineral Resource has a lower level of confidence than that applying to an Indicated Mineral Resource and must not be converted to a Mineral Reserve. It is reasonably expected that the majority of Inferred Mineral Resources could be upgraded to Indicated Mineral Resources with continued exploration.
(4) It is envisioned that the Project deposits may be mined using underground mining methods. Mineral resources are reported at a base case cut-off grade of 150 g/t AgEq. The mineral resource grade blocks were quantified above the base case cut-off grade, below surface and within the constraining mineralized wireframes (considered mineable shapes).
(5) Based on the size, shape, general thickness and orientation of the majority of the mineralized zones within the project area, it is envisioned that the deposits may be mined using a combination of underground mining methods including sub-level stoping (SLS) and/or cut and fill (CAF) mining.
(6) All Resources are presented undiluted and in situ, constrained by continuous 3D wireframe models, and are considered to have reasonable prospects for eventual economic extraction at the base case cut-off grade of 150 g/t AgEq.
(7) The base-case AgEq Cut-off grade considers metal prices of $24.00/oz Ag, $1800/oz Au, $1.10/lb Pb and $1.35/lb Zn and considers metal recoveries of 93% for Ag, 90% for Au, 94% for Pb and 94% for Zn.
(8) The base case cut-off grade of 150 g/t AgEq considers a mining cost of US$45.00/t and processing, treatment, refining, and transportation cost of USD$30.00/t and G&A cost of US$20.00/t of mineralized material.
(9) The estimate of Mineral Resources may be materially affected by environmental, permitting, legal, title, taxation, socio-political, marketing, or other relevant issues.
Table 14-10 Panuco Project Mineral Resource Estimate by Area, September 1, 2023
Copala Area: Copala, Tajitos and Cristiano
|
Area
|
Resource
Class
|
Tonnes
(MT)
|
Grade
|
Total Metal
|
|
Au g/t
|
Ag g/t
|
Pb %
|
Zn %
|
AgEq
(g/t)
|
Au
(koz)
|
Ag
(koz)
|
Pb
(Mlbs)
|
Zn
(Mlbs)
|
AgEq
(koz)
|
|
Copala
|
Indicated
|
4.52
|
2.46
|
380
|
0.08
|
0.15
|
573
|
358
|
55,201
|
8.2
|
15.3
|
83,270
|
|
Inferred
|
3.16
|
1.77
|
332
|
0.12
|
0.20
|
476
|
179
|
33,722
|
8.2
|
13.6
|
48,320
|
|
Tajitos
|
Indicated
|
0.63
|
2.24
|
358
|
0.12
|
0.21
|
538
|
46
|
7,295
|
1.6
|
2.9
|
10,953
|
|
Inferred
|
1.04
|
2.04
|
365
|
0.22
|
0.39
|
540
|
69
|
12,260
|
5.2
|
8.9
|
18,140
|
|
Cristiano
|
Indicated
|
0.21
|
3.37
|
581
|
0.25
|
0.43
|
858
|
23
|
3,961
|
1.1
|
2.0
|
5,851
|
|
Inferred
|
0.72
|
2.54
|
443
|
0.15
|
0.29
|
650
|
59
|
10,213
|
2.4
|
4.5
|
14,974
|
|
Total
|
Indicated
|
5.37
|
2.48
|
385
|
0.09
|
0.17
|
580
|
427
|
66,457
|
11
|
20
|
100,074
|
|
Inferred
|
4.92
|
1.94
|
355
|
0.15
|
0.25
|
515
|
307
|
56,195
|
16
|
27
|
81,434
|
Napoleon Area: Napoleon, Cruz, Josephine and Luisa
|
Area
|
Resource
Class
|
Tonnes
(MT)
|
Grade
|
Total Metal
|
|
Au g/t
|
Ag g/t
|
Pb %
|
Zn %
|
AgEq
(g/t)
|
Au
(koz)
|
Ag
(koz)
|
Pb
(Mlbs)
|
Zn
(Mlbs)
|
AgEq
(koz)
|
|
Luisa
|
Indicated
|
0.27
|
2.56
|
177
|
0.39
|
2.01
|
459
|
22
|
1,556
|
2.3
|
12.1
|
4,027
|
|
Inferred
|
2.04
|
2.13
|
159
|
0.30
|
1.51
|
386
|
139
|
10,439
|
13.3
|
67.9
|
25,326
|
|
Cruz/Negra
|
Indicated
|
0.03
|
2.01
|
144
|
0.37
|
1.71
|
373
|
2
|
153
|
0.3
|
1.2
|
396
|
|
Inferred
|
0.31
|
3.75
|
170
|
0.31
|
1.48
|
519
|
37
|
1,698
|
2.1
|
10.1
|
5,169
|
|
Josephine
|
Indicated
|
0.07
|
2.88
|
221
|
0.39
|
1.11
|
492
|
6
|
491
|
0.6
|
1.7
|
1,092
|
|
Inferred
|
0.22
|
2.05
|
161
|
0.33
|
1.00
|
364
|
15
|
1,161
|
1.6
|
4.9
|
2,618
|
|
Napoleon_HW(4)
|
Indicated
|
0.43
|
1.72
|
164
|
0.42
|
1.53
|
365
|
24
|
2,259
|
4.0
|
14.4
|
5,029
|
|
Inferred
|
0.85
|
2.17
|
220
|
0.59
|
2.02
|
479
|
59
|
5,976
|
10.9
|
37.6
|
13,027
|
|
Napoleon+
Splays
|
Indicated
|
3.31
|
2.39
|
162
|
0.52
|
1.73
|
425
|
255
|
17,276
|
37.8
|
126.5
|
45,223
|
|
Inferred
|
3.18
|
1.64
|
137
|
0.45
|
1.76
|
342
|
168
|
14,045
|
31.8
|
123.2
|
35,063
|
|
Total
|
Indicated
|
4.12
|
2.34
|
164
|
0.50
|
1.72
|
421
|
309
|
21,735
|
45
|
156
|
55,767
|
|
Inferred
|
6.60
|
1.97
|
157
|
0.41
|
1.68
|
383
|
418
|
33,319
|
60
|
244
|
81,203
|
San Antonio Area: Generales and Animas Area: Cuevillas and Rosarito
|
Area
|
Resource Class
|
Tonnes (MT)
|
Grade
|
Total Metal
|
|
Au g/t
|
Ag g/t
|
Pb %
|
Zn %
|
AgEq (g/t)
|
Au (koz)
|
Ag (koz)
|
Pb (Mlbs)
|
Zn (Mlbs)
|
AgEq (koz)
|
|
San Antonio
|
Inferred
|
0.28
|
1.30
|
226
|
0.01
|
0.03
|
325
|
12
|
2,038
|
0.1
|
0.2
|
2,936
|
|
Animas
|
Inferred
|
0.39
|
1.68
|
169
|
0.29
|
0.60
|
327
|
21
|
2,101
|
2.5
|
5.2
|
4,074
|
Figure 14-9 Plan View: Mineral Resource Block Grades and Block Class for the Copala-Cristiano-Tajitos Deposit Area


Figure 14-10 Isometric View Looking West: Mineral Resource Block Grades and Block Class for the Copala-Cristiano-Tajitos Deposit Area


Figure 14-11 Isometric View Looking NNE: Mineral Resource Block Grades and Block Class for the Copala-Cristiano-Tajitos Deposit Area


Figure 14-12 Plan View: Mineral Resource Block Grades and Block Class for the Napoleon, Cruz, Josephine and Luisa Areas


Figure 14-13 Isometric View Looking Northwest: Mineral Resource Block Grades and Block Class for the Napoleon, Cruz, Josephine and Luisa Areas


Figure 14-14 Isometric View Looking NNE: Mineral Resource Block Grades and Block Class for the Napoleon, Cruz, Josephine and Luisa Areas


14.12 Model Validation and Sensitivity Analysis
Visual checks of block grades against the composite data and assay data on vertical section showed good correlation between block grades and drill intersections.
A comparison of the average capped composite grades (≥0.001) and average assay grades by model/domain with the average grades of all the blocks in the block model at a 0.001% AgEq cut-off grade was completed and is presented in Table 14-11. The block model average grades compared well with the composite average grades.
For comparison purposes, additional grade models were generated using a varied inverse distance weighting (ID3) and nearest neighbour (NN) interpolation methods. The results of these models are compared to the chosen models (ID2) at various cut-off grades in a series of grade/tonnage graphs shown in Figure 14‑15 and Figure 14-16. In general, the ID2 and ID3 models show similar results, and both are much more conservative and smoother than the NN model. For models well-constrained by wireframes and well-sampled (close spacing of data), ID2 should yield very similar results to other interpolation methods such as ID3 or Ordinary Kriging.
Table 14-11 Comparison of Average Composite Grades with Block Model Grades
|
Domain
|
Variable
|
Ag g/t
|
Au g/t
|
Pb ppm
|
Zn ppm
|
|
Copala Area: Copala, Tajitos and Cristiano
|
|
Copalla + Cristiano
|
Assays
|
237
|
1.40
|
0.08
|
0.16
|
|
Composites Capped
|
183
|
1.17
|
0.06
|
0.13
|
|
Blocks
|
148
|
0.89
|
0.06
|
0.11
|
|
Tajitos
|
Assays
|
237
|
1.35
|
0.15
|
0.31
|
|
Composites Capped
|
215
|
1.31
|
0.12
|
0.23
|
|
Blocks
|
206
|
1.20
|
0.14
|
0.26
|
|
Napoleon Area: Napoleon, Cruz, Josephine and Luisa
|
|
Napoleon_HW and _FW
|
Assays
|
122
|
1.15
|
0.36
|
1.06
|
|
Composites Capped
|
89.3
|
0.90
|
0.23
|
0.88
|
|
Blocks
|
68.5
|
0.69
|
0.18
|
0.71
|
|
Napoleon Main
|
Assays
|
123
|
2.24
|
0.48
|
1.46
|
|
Composites Capped
|
111
|
1.75
|
0.40
|
1.27
|
|
Blocks
|
90.6
|
1.37
|
0.38
|
1.26
|
|
Cruz
|
Assays
|
217
|
3.24
|
0.24
|
1.45
|
|
Composites Capped
|
143
|
2.74
|
0.25
|
1.19
|
|
Blocks
|
148
|
3.14
|
0.29
|
1.32
|
|
Josephine
|
Assays
|
219
|
2.86
|
0.28
|
0.99
|
|
Composites Capped
|
82.3
|
1.22
|
0.21
|
0.66
|
|
Blocks
|
75.2
|
0.85
|
0.14
|
0.41
|
|
Luisa
|
Assays
|
186
|
3.05
|
0.42
|
1.56
|
|
Composites Capped
|
110
|
1.53
|
0.23
|
1.15
|
|
Blocks
|
113
|
1.55
|
0.23
|
1.19
|
|
Domain
|
Variable
|
Ag g/t
|
Au g/t
|
Pb ppm
|
Zn ppm
|
|
Animas Area: Cuevillas and Rosarito
|
|
Animas
|
Assays
|
119
|
1.17
|
0.23
|
0.67
|
|
Composites Capped
|
92.1
|
0.98
|
0.21
|
0.58
|
|
Blocks
|
98.1
|
1.03
|
0.20
|
0.44
|
|
San Antonio Area: Generales
|
|
San Antonio
|
Assays
|
107
|
0.68
|
0.01
|
0.03
|
|
Composites Capped
|
96.1
|
0.64
|
0.01
|
0.03
|
|
Blocks
|
49.2
|
0.26
|
0.01
|
0.02
|
Figure 14-15 Comparison of ID3, ID2 & NN Models for the Napoleon-Josephine-Cruz Deposit Area

Figure 14-16 Comparison of ID3, ID2 & NN Models for the Copala-Cristiano Deposit Area

14.12.1 Sensitivity to Cut-off Grade
The Project Mineral Resources have been estimated at a range of cut-off grades presented in Table 14‑12 to demonstrate the sensitivity of the resources to cut-off grades. The current Mineral Resources are reported at a base-case cut-off grade of 150 g/t AgEq (highlighted).
Note: Values in these tables reported above and below the base-case cut-off 150 g/t AgEq for underground Mineral Resources should not be misconstrued with a Mineral Resource Statement. The values are only presented to show the sensitivity of the block model estimates to the selection of the base case cut-off grade. All values are rounded to reflect the relative accuracy of the estimate and numbers may not add due to rounding.
Table 14-12 Underground Mineral Resource Estimate at Various AgEq Cut-off Grades, September 1, 2023
Copala Area: Copala, Tajitos and Cristiano
Copala
|
Resource
Class
|
Cut-off
Grade
(AgEq g/t)
|
Tonnes
(MT)
|
Grade
|
Total Metal
|
|
Au g/t
|
Ag g/t
|
Pb %
|
Zn %
|
AgEq
(g/t)
|
Au
(koz)
|
Ag
(koz)
|
Pb
(Mlbs)
|
Zn
(Mlbs)
|
AgEq
(koz)
|
|
Indicated
|
90
|
5.9
|
2.0
|
308.3
|
0.1
|
0.1
|
466
|
380
|
58,513
|
9.5
|
17.9
|
88,485
|
|
100
|
5.6
|
2.1
|
320.5
|
0.1
|
0.1
|
484
|
377
|
57,982
|
9.3
|
17.5
|
87,649
|
|
120
|
5.1
|
2.2
|
344.8
|
0.1
|
0.1
|
521
|
369
|
56,867
|
8.9
|
16.6
|
85,900
|
|
150
|
4.5
|
2.5
|
379.8
|
0.1
|
0.2
|
573
|
358
|
55,201
|
8.2
|
15.3
|
83,270
|
|
200
|
3.8
|
2.8
|
432.0
|
0.1
|
0.2
|
650
|
339
|
52,634
|
7.4
|
13.6
|
79,173
|
|
250
|
3.2
|
3.1
|
481.3
|
0.1
|
0.2
|
722
|
321
|
50,111
|
6.7
|
12.3
|
75,204
|
|
300
|
2.8
|
3.3
|
524.9
|
0.1
|
0.2
|
786
|
305
|
47,882
|
6.2
|
11.2
|
71,677
|
|
Inferred
|
90
|
4.1
|
1.4
|
272.2
|
0.1
|
0.2
|
391
|
193
|
36,264
|
9.6
|
15.8
|
52,046
|
|
100
|
4.0
|
1.5
|
282.4
|
0.1
|
0.2
|
405
|
191
|
35,865
|
9.4
|
15.4
|
51,459
|
|
120
|
3.6
|
1.6
|
303.1
|
0.1
|
0.2
|
435
|
186
|
35,002
|
8.9
|
14.6
|
50,192
|
|
150
|
3.2
|
1.8
|
332.0
|
0.1
|
0.2
|
476
|
179
|
33,722
|
8.2
|
13.6
|
48,320
|
|
200
|
2.6
|
2.0
|
379.3
|
0.1
|
0.2
|
544
|
168
|
31,389
|
7.4
|
12.3
|
45,040
|
|
250
|
2.1
|
2.3
|
422.8
|
0.1
|
0.2
|
608
|
158
|
29,172
|
6.7
|
11.1
|
41,966
|
|
300
|
1.8
|
2.6
|
472.4
|
0.2
|
0.3
|
681
|
146
|
26,777
|
6.1
|
9.9
|
38,595
|
Tajitos
|
Resource
Class
|
Cut-off Grade
(AgEq g/t)
|
Tonnes
(MT)
|
Grade
|
Total Metal
|
|
Au g/t
|
Ag g/t
|
Pb %
|
Zn %
|
AgEq
(g/t)
|
Au
(koz)
|
Ag
(koz)
|
Pb
(Mlbs)
|
Zn
(Mlbs)
|
AgEq
(koz)
|
|
Indicated
|
90
|
0.7
|
2.0
|
318.3
|
0.1
|
0.2
|
478
|
47
|
7,563
|
1.7
|
3.2
|
11,361
|
|
100
|
0.7
|
2.0
|
324.4
|
0.1
|
0.2
|
487
|
47
|
7,532
|
1.7
|
3.1
|
11,314
|
|
120
|
0.7
|
2.1
|
337.6
|
0.1
|
0.2
|
507
|
47
|
7,446
|
1.7
|
3.0
|
11,184
|
|
150
|
0.6
|
2.2
|
358.4
|
0.1
|
0.2
|
538
|
46
|
7,295
|
1.6
|
2.9
|
10,953
|
|
200
|
0.6
|
2.4
|
392.4
|
0.1
|
0.2
|
588
|
44
|
7,028
|
1.5
|
2.6
|
10,530
|
|
250
|
0.5
|
2.6
|
424.3
|
0.1
|
0.2
|
635
|
42
|
6,726
|
1.4
|
2.4
|
10,062
|
|
300
|
0.4
|
2.9
|
460.6
|
0.1
|
0.2
|
688
|
39
|
6,368
|
1.2
|
2.2
|
9,510
|
|
Inferred
|
90
|
1.3
|
1.7
|
311.0
|
0.2
|
0.4
|
462
|
72
|
12,818
|
5.9
|
10.4
|
19,051
|
|
100
|
1.2
|
1.8
|
319.8
|
0.2
|
0.4
|
475
|
71
|
12,741
|
5.8
|
10.1
|
18,923
|
|
120
|
1.2
|
1.9
|
339.0
|
0.2
|
0.4
|
503
|
70
|
12,557
|
5.5
|
9.6
|
18,617
|
|
150
|
1.0
|
2.0
|
365.2
|
0.2
|
0.4
|
540
|
69
|
12,260
|
5.2
|
8.9
|
18,140
|
|
200
|
0.9
|
2.3
|
415.4
|
0.2
|
0.4
|
611
|
65
|
11,702
|
4.5
|
7.6
|
17,199
|
|
250
|
0.7
|
2.5
|
463.1
|
0.2
|
0.4
|
677
|
61
|
11,139
|
4.0
|
6.7
|
16,279
|
|
300
|
0.6
|
2.8
|
507.6
|
0.3
|
0.4
|
741
|
58
|
10,527
|
3.7
|
6.1
|
15,375
|
Cristiano
|
Resource
Class
|
Cut-off Grade
(AgEq g/t)
|
Tonnes
(MT)
|
Grade
|
Total Metal
|
|
Au g/t
|
Ag g/t
|
Pb %
|
Zn %
|
AgEq
(g/t)
|
Au
(koz)
|
Ag
(koz)
|
Pb
(Mlbs)
|
Zn
(Mlbs)
|
AgEq
(koz)
|
|
Indicated
|
90
|
0.3
|
2.8
|
490.7
|
0.2
|
0.4
|
726
|
24
|
4,071
|
1.2
|
2.2
|
6,022
|
|
100
|
0.2
|
3.0
|
514.2
|
0.2
|
0.4
|
760
|
23
|
4,051
|
1.2
|
2.2
|
5,990
|
|
120
|
0.2
|
3.2
|
544.3
|
0.2
|
0.4
|
805
|
23
|
4,008
|
1.2
|
2.1
|
5,924
|
|
150
|
0.2
|
3.4
|
581.1
|
0.2
|
0.4
|
858
|
23
|
3,961
|
1.1
|
2.0
|
5,851
|
|
200
|
0.2
|
3.8
|
649.5
|
0.3
|
0.5
|
959
|
22
|
3,864
|
1.1
|
1.9
|
5,706
|
|
250
|
0.2
|
4.2
|
717.1
|
0.3
|
0.5
|
1,060
|
22
|
3,759
|
1.0
|
1.8
|
5,553
|
|
300
|
0.1
|
4.5
|
771.7
|
0.3
|
0.5
|
1,141
|
21
|
3,648
|
0.9
|
1.6
|
5,393
|
|
Inferred
|
90
|
0.9
|
2.1
|
365.8
|
0.1
|
0.3
|
536
|
61
|
10,703
|
2.7
|
5.3
|
15,691
|
|
100
|
0.9
|
2.2
|
379.9
|
0.1
|
0.3
|
557
|
60
|
10,614
|
2.7
|
5.2
|
15,560
|
|
120
|
0.8
|
2.3
|
411.1
|
0.1
|
0.3
|
602
|
60
|
10,431
|
2.5
|
4.8
|
15,284
|
|
150
|
0.7
|
2.5
|
443.0
|
0.1
|
0.3
|
650
|
59
|
10,213
|
2.4
|
4.5
|
14,974
|
|
200
|
0.6
|
3.0
|
509.8
|
0.2
|
0.3
|
748
|
56
|
9,721
|
2.1
|
4.0
|
14,271
|
|
250
|
0.5
|
3.4
|
584.7
|
0.2
|
0.3
|
860
|
54
|
9,212
|
1.9
|
3.6
|
13,548
|
|
300
|
0.4
|
3.8
|
633.9
|
0.2
|
0.3
|
934
|
52
|
8,866
|
1.8
|
3.3
|
13,067
|
Napoleon Area: Napoleon, Cruz, Josephine and Luisa
Napoleon + Splays
|
Resource
Class
|
Cut-off Grade
(AgEq g/t)
|
Tonnes
(MT)
|
Grade
|
Total Metal
|
|
Au g/t
|
Ag g/t
|
Pb %
|
Zn %
|
AgEq
(g/t)
|
Au
(koz)
|
Ag
(koz)
|
Pb
(Mlbs)
|
Zn
(Mlbs)
|
AgEq
(koz)
|
|
Indicated
|
90
|
4.3
|
2.0
|
136.7
|
0.4
|
1.5
|
357
|
270
|
18,712
|
42.0
|
141.7
|
48,836
|
|
100
|
4.1
|
2.0
|
140.9
|
0.5
|
1.6
|
368
|
267
|
18,500
|
41.4
|
139.6
|
48,309
|
|
120
|
3.8
|
2.2
|
149.0
|
0.5
|
1.6
|
389
|
263
|
18,056
|
40.1
|
134.9
|
47,196
|
|
150
|
3.3
|
2.4
|
162.2
|
0.5
|
1.7
|
425
|
255
|
17,276
|
37.8
|
126.5
|
45,223
|
|
200
|
2.7
|
2.8
|
186.7
|
0.6
|
1.9
|
486
|
238
|
15,943
|
32.9
|
110.5
|
41,541
|
|
250
|
2.1
|
3.2
|
212.9
|
0.6
|
2.0
|
554
|
220
|
14,471
|
28.4
|
95.0
|
37,639
|
|
300
|
1.7
|
3.7
|
239.7
|
0.6
|
2.1
|
622
|
204
|
13,096
|
24.1
|
79.7
|
33,976
|
|
Inferred
|
90
|
4.4
|
1.3
|
110.1
|
0.4
|
1.5
|
280
|
187
|
15,680
|
39.6
|
147.2
|
39,828
|
|
100
|
4.2
|
1.4
|
114.1
|
0.4
|
1.6
|
289
|
185
|
15,453
|
38.6
|
144.0
|
39,167
|
|
120
|
3.8
|
1.5
|
123.0
|
0.4
|
1.6
|
310
|
178
|
14,903
|
36.0
|
136.4
|
37,594
|
|
150
|
3.2
|
1.6
|
137.2
|
0.5
|
1.8
|
342
|
168
|
14,045
|
31.8
|
123.2
|
35,063
|
|
200
|
2.4
|
1.9
|
160.1
|
0.5
|
1.9
|
396
|
151
|
12,450
|
26.3
|
102.7
|
30,774
|
|
250
|
1.8
|
2.3
|
186.1
|
0.5
|
2.0
|
453
|
134
|
10,860
|
21.4
|
81.3
|
26,435
|
|
300
|
1.4
|
2.6
|
210.2
|
0.6
|
2.2
|
505
|
117
|
9,483
|
17.4
|
66.7
|
22,795
|
Napoleon_HW(4)
|
Resource
Class
|
Cut-off Grade
(AgEq g/t)
|
Tonnes
(MT)
|
Grade
|
Total Metal
|
|
Au g/t
|
Ag g/t
|
Pb %
|
Zn %
|
AgEq
(g/t)
|
Au
(koz)
|
Ag
(koz)
|
Pb
(Mlbs)
|
Zn
(Mlbs)
|
AgEq
(koz)
|
|
Indicated
|
90
|
0.6
|
1.4
|
136.2
|
0.3
|
1.2
|
297
|
26
|
2,592
|
4.4
|
15.7
|
5,656
|
|
100
|
0.6
|
1.4
|
139.2
|
0.3
|
1.2
|
304
|
26
|
2,559
|
4.3
|
15.6
|
5,599
|
|
120
|
0.5
|
1.6
|
150.6
|
0.4
|
1.4
|
332
|
25
|
2,417
|
4.1
|
15.0
|
5,331
|
|
150
|
0.4
|
1.7
|
164.2
|
0.4
|
1.5
|
365
|
24
|
2,259
|
4.0
|
14.4
|
5,029
|
|
200
|
0.3
|
2.0
|
189.8
|
0.5
|
1.8
|
426
|
21
|
1,989
|
3.5
|
12.9
|
4,464
|
|
250
|
0.2
|
2.4
|
239.5
|
0.6
|
2.4
|
532
|
17
|
1,663
|
3.0
|
11.4
|
3,698
|
|
300
|
0.2
|
2.7
|
267.8
|
0.7
|
2.7
|
594
|
15
|
1,498
|
2.8
|
10.4
|
3,323
|
|
Inferred
|
90
|
1.0
|
1.9
|
188.2
|
0.5
|
1.8
|
413
|
62
|
6,263
|
11.5
|
40.7
|
13,741
|
|
100
|
1.0
|
1.9
|
194.3
|
0.5
|
1.8
|
426
|
62
|
6,211
|
11.4
|
40.2
|
13,614
|
|
120
|
0.9
|
2.0
|
204.2
|
0.5
|
1.9
|
446
|
61
|
6,132
|
11.2
|
39.1
|
13,398
|
|
150
|
0.8
|
2.2
|
219.7
|
0.6
|
2.0
|
479
|
59
|
5,976
|
10.9
|
37.6
|
13,027
|
|
200
|
0.6
|
2.7
|
284.4
|
0.8
|
2.7
|
614
|
51
|
5,386
|
10.0
|
35.0
|
11,624
|
|
250
|
0.5
|
2.9
|
308.7
|
0.8
|
2.9
|
662
|
48
|
5,201
|
9.6
|
33.5
|
11,146
|
|
300
|
0.5
|
3.0
|
331.2
|
0.9
|
3.1
|
704
|
46
|
5,027
|
9.3
|
32.0
|
10,692
|
Josephine
|
Resource
Class
|
Cut-off Grade
(AgEq g/t)
|
Tonnes
(MT)
|
Grade
|
Total Metal
|
|
Au g/t
|
Ag g/t
|
Pb %
|
Zn %
|
AgEq
(g/t)
|
Au
(koz)
|
Ag
(koz)
|
Pb
(Mlbs)
|
Zn
(Mlbs)
|
AgEq
(koz)
|
|
Indicated
|
90
|
0.1
|
2.8
|
212.4
|
0.4
|
1.1
|
472
|
6
|
499
|
0.6
|
1.7
|
1,108
|
|
100
|
0.1
|
2.8
|
214.3
|
0.4
|
1.1
|
476
|
6
|
496
|
0.6
|
1.7
|
1,102
|
|
120
|
0.1
|
2.8
|
216.5
|
0.4
|
1.1
|
481
|
6
|
494
|
0.6
|
1.7
|
1,098
|
|
150
|
0.1
|
2.9
|
221.2
|
0.4
|
1.1
|
492
|
6
|
491
|
0.6
|
1.7
|
1,092
|
|
200
|
0.1
|
3.0
|
227.4
|
0.4
|
1.1
|
507
|
6
|
483
|
0.6
|
1.7
|
1,076
|
|
250
|
0.1
|
3.1
|
233.7
|
0.4
|
1.2
|
521
|
6
|
466
|
0.6
|
1.6
|
1,039
|
|
300
|
0.1
|
3.2
|
240.9
|
0.4
|
1.2
|
538
|
6
|
457
|
0.5
|
1.5
|
1,020
|
|
Inferred
|
90
|
0.3
|
1.6
|
133.0
|
0.3
|
0.8
|
293
|
16
|
1,343
|
1.9
|
5.6
|
2,963
|
|
100
|
0.3
|
1.7
|
137.0
|
0.3
|
0.8
|
305
|
16
|
1,309
|
1.9
|
5.5
|
2,913
|
|
120
|
0.3
|
1.8
|
144.4
|
0.3
|
0.9
|
326
|
16
|
1,249
|
1.8
|
5.3
|
2,819
|
|
150
|
0.2
|
2.0
|
161.1
|
0.3
|
1.0
|
364
|
15
|
1,161
|
1.6
|
4.9
|
2,618
|
|
200
|
0.2
|
2.2
|
179.8
|
0.4
|
1.1
|
402
|
13
|
1,081
|
1.5
|
4.6
|
2,418
|
|
250
|
0.2
|
2.4
|
192.8
|
0.4
|
1.2
|
427
|
12
|
1,017
|
1.4
|
4.3
|
2,253
|
|
300
|
0.1
|
2.5
|
211.2
|
0.4
|
1.2
|
456
|
11
|
930
|
1.2
|
3.7
|
2,011
|
Cruz
|
Resource
Class
|
Cut-off Grade
(AgEq g/t)
|
Tonnes
(MT)
|
Grade
|
Total Metal
|
|
Au g/t
|
Ag g/t
|
Pb %
|
Zn %
|
AgEq
(g/t)
|
Au
(koz)
|
Ag
(koz)
|
Pb
(Mlbs)
|
Zn
(Mlbs)
|
AgEq
(koz)
|
|
Indicated
|
90
|
0.0
|
1.8
|
129.7
|
0.3
|
1.5
|
336
|
2
|
163
|
0.3
|
1.3
|
421
|
|
100
|
0.0
|
1.9
|
131.2
|
0.3
|
1.5
|
340
|
2
|
160
|
0.3
|
1.3
|
416
|
|
120
|
0.0
|
1.9
|
136.7
|
0.3
|
1.6
|
353
|
2
|
158
|
0.3
|
1.3
|
409
|
|
150
|
0.0
|
2.0
|
144.5
|
0.4
|
1.7
|
373
|
2
|
153
|
0.3
|
1.2
|
396
|
|
200
|
0.0
|
2.2
|
158.8
|
0.4
|
1.9
|
407
|
2
|
143
|
0.3
|
1.2
|
366
|
|
250
|
0.0
|
2.2
|
162.3
|
0.4
|
1.9
|
418
|
2
|
136
|
0.3
|
1.1
|
349
|
|
300
|
0.0
|
2.2
|
163.8
|
0.5
|
2.0
|
423
|
2
|
137
|
0.3
|
1.1
|
354
|
|
Inferred
|
90
|
0.3
|
3.7
|
167.1
|
0.3
|
1.5
|
507
|
38
|
1,714
|
2.2
|
10.2
|
5,205
|
|
100
|
0.3
|
3.7
|
167.5
|
0.3
|
1.5
|
509
|
38
|
1,713
|
2.2
|
10.2
|
5,202
|
|
120
|
0.3
|
3.7
|
168.5
|
0.3
|
1.5
|
512
|
37
|
1,707
|
2.2
|
10.2
|
5,186
|
|
150
|
0.3
|
3.7
|
170.3
|
0.3
|
1.5
|
519
|
37
|
1,698
|
2.1
|
10.1
|
5,169
|
|
200
|
0.3
|
3.9
|
177.1
|
0.3
|
1.5
|
541
|
37
|
1,651
|
2.1
|
9.8
|
5,047
|
|
250
|
0.3
|
4.2
|
186.6
|
0.4
|
1.6
|
577
|
36
|
1,566
|
2.0
|
9.2
|
4,846
|
|
300
|
0.2
|
4.6
|
193.5
|
0.4
|
1.7
|
612
|
34
|
1,450
|
1.9
|
8.6
|
4,587
|
Luisa
|
Resource
Class
|
Cut-off Grade
(AgEq g/t)
|
Tonnes
(MT)
|
Grade
|
Total Metal
|
|
Au g/t
|
Ag g/t
|
Pb %
|
Zn %
|
AgEq
(g/t)
|
Au
(koz)
|
Ag
(koz)
|
Pb
(Mlbs)
|
Zn
(Mlbs)
|
AgEq
(koz)
|
|
Indicated
|
90
|
0.4
|
2.0
|
131.8
|
0.3
|
1.6
|
349
|
25
|
1,708
|
2.7
|
13.9
|
4,516
|
|
100
|
0.4
|
2.0
|
136.9
|
0.3
|
1.6
|
362
|
25
|
1,685
|
2.6
|
13.7
|
4,454
|
|
120
|
0.3
|
2.2
|
152.3
|
0.3
|
1.8
|
401
|
24
|
1,620
|
2.5
|
13.2
|
4,266
|
|
150
|
0.3
|
2.6
|
177.3
|
0.4
|
2.0
|
459
|
22
|
1,556
|
2.3
|
12.1
|
4,027
|
|
200
|
0.3
|
2.7
|
186.9
|
0.4
|
2.1
|
480
|
22
|
1,526
|
2.2
|
11.6
|
3,918
|
|
250
|
0.2
|
2.8
|
199.7
|
0.4
|
2.2
|
506
|
21
|
1,477
|
2.1
|
10.9
|
3,742
|
|
300
|
0.2
|
2.9
|
210.6
|
0.4
|
2.2
|
529
|
20
|
1,415
|
2.0
|
10.3
|
3,557
|
|
Inferred
|
90
|
2.6
|
1.8
|
133.5
|
0.3
|
1.4
|
330
|
151
|
11,100
|
14.9
|
77.7
|
27,452
|
|
100
|
2.5
|
1.9
|
136.8
|
0.3
|
1.4
|
338
|
149
|
11,000
|
14.7
|
76.6
|
27,194
|
|
120
|
2.3
|
2.0
|
144.2
|
0.3
|
1.4
|
355
|
146
|
10,805
|
14.3
|
74.0
|
26,594
|
|
150
|
2.0
|
2.1
|
159.3
|
0.3
|
1.5
|
386
|
139
|
10,439
|
13.3
|
67.9
|
25,326
|
|
200
|
1.7
|
2.4
|
182.8
|
0.3
|
1.6
|
435
|
128
|
9,730
|
11.6
|
58.7
|
23,175
|
|
250
|
1.3
|
2.7
|
209.4
|
0.3
|
1.7
|
487
|
115
|
8,949
|
10.1
|
49.9
|
20,824
|
|
300
|
1.1
|
3.0
|
239.3
|
0.4
|
1.8
|
544
|
100
|
8,080
|
8.6
|
42.0
|
18,356
|
14.13 Comparison of the current MRE to the January 2023 MRE
The current MRE is compared to the January 2023 MRE for the Project (Table 14-13). The main difference in the resource estimates is due to the additional drilling completed by Vizsla between September 2022 and September 2023, completed in the Napoleon and Tajitos-Copala deposit areas. The additional drilling resulted in the discovery of additional vein structures, extension of existing vein structures down dip/plunge and along strike and increased the confidence in the existing resource resulting in an increase in Indicated resources, and the expansion of known mineralized zones down dip/plunge and along strike.
Highlights:
- 48.7% increase in Indicated resources from 104.8 to 155.8 Moz AgEq
- 48.7% increase in Inferred resources from 114.1 to 169.6 Moz AgEq
- 17% increase in average Indicated resource grade from 437 to 511 g/t AgEq
Table 14-13 Comparison of the January 2023 MRE to the September 2023 MRE for the Project
|
Resource
Class
|
Tonnes
(MT)
|
Grade
|
Total Metal
|
|
Au g/t
|
Ag g/t
|
Pb %
|
Zn %
|
*AgEq
(g/t)
|
Au (koz)
|
Ag (koz)
|
Pb
(Mlbs)
|
Zn
(Mlbs)
|
AgEq
(koz)
|
|
Mineral Resource Estimate, January 19, 2023
|
|
Indicated
|
7.5
|
2.12
|
243
|
0.23
|
0.71
|
437
|
58,330
|
508
|
38.0
|
117.4
|
104,793
|
|
Inferred
|
7.2
|
2.14
|
304
|
0.19
|
0.54
|
491
|
70,672
|
496
|
30.2
|
85.7
|
114,113
|
|
Mineral Resource Estimate, September 1, 2023
|
|
Indicated
|
9.48
|
2.41
|
289
|
0.27
|
0.84
|
511
|
736
|
88,192
|
56.0
|
176.1
|
155,841
|
|
Inferred
|
12.2
|
1.93
|
239
|
0.29
|
1.03
|
433
|
758
|
93,653
|
78.1
|
276.2
|
169,647
|
*Ag (gpt) + [Au ppm x (Au price / Ag Price)] [Pb (%) X 2204.6 X Pb Price / Ag Price X 31.1] + [Zn (%) X 2204.6 X Zn Price / Ag Price X 31.1]
14.14 Disclosure
All relevant data and information regarding the Project are included in other sections of this Technical Report. There is no other relevant data or information available that is necessary to make the technical report understandable and not misleading.
The Authors are not aware of any known mining, processing, metallurgical, environmental, infrastructure, economic, permitting, legal, title, taxation, socio-political, or marketing issues, or any other relevant factors not reported in this technical report, that could materially affect the updated MRE.
15 MINERAL RESERVE ESTIMATE
There are no Mineral Reserve Estimates for the Property.
16 MINING METHODS
This section does not apply to the Technical Report.
17 RECOVERY METHODS
This section does not apply to the Technical Report.
18 PROJECT INFRASTRUCTURE
This section does not apply to the Technical Report.
19 MARKET STUDIES AND CONTRACTS
This section does not apply to the Technical Report.
20 ENVIRONMENTAL STUDIES, PERMITTING AND SOCIAL OR COMMUNITY IMPACT
This section does not apply to the Technical Report.
21 CAPITAL AND OPERATING COSTS
This section does not apply to the Technical Report.
22 ECONOMIC ANALYSIS
This section does not apply to the Technical Report.
23 ADJACENT PROPERTIES
There is no information on properties adjacent to the Property necessary to make the technical report understandable and not misleading.
24 OTHER RELEVANT DATA AND INFORMATION
There is no other relevant data or information available that is necessary to make the technical report understandable and not misleading. To the Authors' knowledge, there are no significant risks and uncertainties that could reasonably be expected to affect the reliability or confidence in the exploration information or MRE.
25 INTERPRETATION AND CONCLUSIONS
SGS Geological Services Inc. was contracted by Vizsla Silver Corp., to complete an updated Mineral Resource Estimate for the Panuco Ag-Au Project in Sinaloa, Mexico, and to prepare a NI 43-101 Technical Report written in support of the updated MRE. The Project is considered an early-stage exploration project.
Vizsla Silver Corp. was incorporated as Vizsla Capital Corp. under the Business Corporations Act (British
Columbia) on September 26, 2017. On March 8, 2018, the Company changed its name to Vizsla Resources
Corp. On February 5, 2021, the Company changed its name to Vizsla Silver Corp. The Company's principal business activity is the exploration of mineral properties. The Company currently conducts its operations in Mexico and Canada. It is trading on the TSX Venture Exchange under the symbol VZLA.
On January 21, 2022, Vizsla Silver Corp was listed on the NYSE American exchange and commenced trading under the symbol "VZLA".
The current report is authored by Allan Armitage, Ph.D., P. Geo., and Ben Eggers, MAIG, P.Geo. of SGS. The Authors are independent Qualified Persons as defined by NI 43-101 and are responsible for all sections of this report. The updated MRE presented in this report was estimated by Armitage.
The reporting of the updated MRE complies with all disclosure requirements for Mineral Resources set out in the NI 43-101 Standards of Disclosure for Mineral Projects. The classification of the updated MRE is consistent with the 2014 Canadian Institute of Mining, Metallurgy and Petroleum (CIM) Definition Standards (2014 CIM Definitions) and adhere to the 2019 CIM Estimation of Mineral Resources & Mineral Reserves Best Practice Guidelines (2019 CIM Guidelines).
The current Technical Report will be used by Vizsla in fulfillment of their continuing disclosure requirements under Canadian securities laws, including National Instrument 43-101 - Standards of Disclosure for Mineral Projects ("NI 43-101"). This Technical Report is written in support of an updated MRE completed for Vizsla.
25.1 Diamond Drilling
Since acquiring the Property in November 2019, Vizsla has conducted several significant drill campaigns in the Napoleon, Copala-Tajitos, Animas and San Antonio areas. Up to September 2023 (data cut-off date for the MRE), Vizsla has completed 822 surface diamond drill holes totalling 302,931 m and collected 47,694 assay intervals representing 55,368 m of drilling. Vizsla has continued to drill at the Project since the data cut off for the Mineral Resource estimate of September 1, 2023.
In November 2019, Vizsla began drilling on the Panuco Project on the Animas-Refugio corridor near the La Pipa and Mariposa mine areas. A total of 820.50 m in three drill holes was completed in 2019. The three drill holes targeted the La Pipa structure to test below the old historic ore shoot. Results showed low-grade and narrow widths, and no further testwork was carried out.
Drill holes AMS-19-01A and AMS-19-02 were drilled to test the downdip extension of the La Pipa ore shoot that has seen extensive mining. The first hole intersected historic workings and a footwall vein over 5.5m at 135.0m downhole. Deeper in the hole a 2.0 m wide quartz-amethyst vein was intersected at 241.5m downhole. The second hole was completed 77 m down dip on the same section and intersected a shallow hanging wall vein with 3 m grading 125.3 g/t Ag and 0.59 g/t Au and a zone of low-grade veinlets in the projection of the Animas Vein.
Drilling for 2020 totaled 28,643.42 m in 129 drill holes. The four main corridors of Napoleon, Cinco Senores, Cordon del Oro, and Animas-Refugio were tested.
In January 2020, drilling resumed at the Mariposa mine area, another historically mined area. Other targets in the Animas-Refugio corridor included, from south to north, Mojocuan, San Carlos, Paloma, and Honduras veins.
Drilling at the Napoleon corridor began in June 2020. A total of 64 drill holes tested the Napoleon structure, for 12,546.02 m. Targets were in the central part of the north-south-trending structure, below old mine workings, and 650 m north in the Papayo area.
At the Cordon del Oro corridor, drilling totalled 6,432.05 m in 28 drill holes. The drilling targeted the Mojocuan, San Carlos, and Peralta mine areas, in addition to the Aguita Zarca vein.
Cinco Senores corridor saw 2,927.10 m of drilling in 14 drill holes. The Tajitos vein was the drilling target, and previously unknown workings were encountered in the first four holes.
Drilling at the Panuco Project in 2021 totalled 100,242.55 m in 318 drill holes. The drilling focussed along the Napoleon and Tajitos vein areas, with 54,759.15 m in 180 drill holes and 34,769.35 m in 102 drill holes, respectively. Additionally, 4,438.50 m in 14 drill holes were drilled in the Animas-Refugio corridor, and 6,275.55 m in 22 drill holes in the Cordon del Oro corridor. Highlights of the 2021 drilling are presented below.
At Napoleon, infill and delineation drilling focussed on denser drilling to inform the Mineral Resource estimate and expand the structure's strike length. The Josephine vein, a subparallel system to Napoleon which was identified initially as an electromagnetic geophysical target, was first intersected in Hole NP-21-132, leading to additional targeting in the area and its inclusion in the Mineral Resource estimate. Further drill testing included the Cruz Negra and Alacran vein areas.
Drilling at the Tajitos vein area focussed on delineation and infilling, with additional exploration drilling to the north. The Tajitos resource drilling led to the discovery of the Copala vein -- a relatively thick subhorizontal structure on the Tajitos northeastern extent. Other exploration drilling along the Cinco Senores corridor included the Cinco Senores and Colorada veins to the north of Tajitos.
In the Animas-Refugio corridor, drilling tested the Rosarito segment included in the Mineral Resource estimate, in addition to the Peralta and Cuevillas veins.
Drilling at the Cordon del Oro corridor targeted the San Antonio structure included in the Mineral Resource estimate, in addition to exploration near the Aguita Zarca vein.
Drilling for 2022 totalled 113,487 m in 271 drill holes. The four main corridors of Napoleon, Cinco Senores, Cordon del Oro, and Animas-Refugio were tested.
Drilling at the Napoleon corridor included 106 drill holes tested the Napoleon structure, for 52,306.40 m. At the Cordon del Oro corridor, drilling totalled 4,251.8 m in 19 drill holes. Drilling at the Copala/Tajitos veins included 135 drill holes for 52,045.10 m. Additionally, 4,883.70 m in 11 drill holes were drilled in the Animas-Refugio corridor.
The bulk of 2022 drilling was centred on the western portion of the district, focused on upgrading and expanding resources at the Copala and Napoleon areas. At Copala, mineralization has now been traced over 1,150 meters along strike, 400 m down dip, and remains open to the north and southeast.
At Napoleon, drilling throughout 2022 successfully expanded mineralization along strike and down plunge to the south, several vein splays were identified in the hanging wall and footwall of the main structure.
Other notable discoveries include the Cristiano Vein; marked by high precious metal grades up to 1,935 g/t Ag and 15.47 g/t Au over 1.46 m, located immediately adjacent to Copala; and La Luisa Vein, located ~700 m west of Napoleon which continues to display similar silver and gold zonation as that seen at Napoleon.
Drilling for 2023 (to September) totalled 60,432.95 m in 103 drill holes. The main Napoleon and Cinco Senores corridors were tested (Table 25-1).
Drilling at the Napoleon corridor included 44 drill holes testing the Napoleon structure, for 25,298.30 m. Drilling at the Copala/Tajitos veins included 59 drill holes for 35,134.65 m.
The 2023 drilling was centred on the western portion of the district, focused on upgrading and expanding resources at the Copala and Napoleon areas. At Copala, mineralization has now been traced over 1,700 m along strike and to depths of 450 to 550 m and remains open to the north and southeast.
At Napoleon, drilling throughout 2023 successfully expanded mineralization along strike and down plunge/dip to the south, several vein splays were identified in the hanging wall and footwall of the main structure.
Table 25-1 Highlights of the 2023 Drilling (to September 1, 2023)
|
Drillhole
|
From
(m)
|
To
(m)
|
Down hole
length
(m)
|
Est. true
width
(m)
|
Gold
(g/t)
|
Silver
(g/t)
|
Lead
(%)
|
Zinc
(%)
|
Vein
|
|
CS-23-265
|
380.6
|
388.95
|
8.35
|
5.89
|
4.24
|
1,403
|
-
|
-
|
Copala
|
|
NP-23-395
|
657.1
|
669.3
|
12.2
|
11.2
|
7.14
|
229
|
0.34
|
1.64
|
La Luisa Main
|
|
NP-23-358
|
501.3
|
513.9
|
12.6
|
5.6
|
11.13
|
257
|
0.42
|
2.03
|
La Luisa Main
|
|
CS-23-254
|
535.4
|
538.3
|
2.9
|
2.14
|
22.46
|
1,319
|
-
|
-
|
Copala
|
|
CS-23-253
|
295.4
|
297.5
|
2.1
|
2.1
|
10.91
|
1,920
|
-
|
-
|
Copala
|
|
CS-23-304
|
468
|
471.3
|
3.3
|
2.8
|
6.8
|
1,366
|
-
|
-
|
Copala
|
|
CS-23-290
|
557.8
|
588.7
|
30.9
|
5.05
|
3.48
|
565
|
-
|
-
|
Copala 2
|
|
NP-23-359
|
80
|
82.05
|
2.05
|
1.65
|
8.37
|
1,552
|
0.47
|
1.22
|
El Molino
|
|
NP-23-391
|
526.15
|
528.2
|
2.05
|
1.9
|
7.37
|
908
|
1.62
|
4.91
|
Napoleon FW2
|
|
NP-23-362
|
618.25
|
626.3
|
8.05
|
3.05
|
5.82
|
372
|
2.15
|
3.15
|
Luisa HW 2
|
* Table of Top 10 Drill Composites of 2023, ordered from highest to lowest grade AgEq (see press release dated December 19, 2023)
25.2 Metallurgy
A series of preliminary metallurgical test programs have been completed on ½ drill core samples that are likely representative of the Napoleon, Tajitos and Copala deposits. Variability samples and Master Composites were assembled from numerous drill holes from each deposit, targeting feed grades that were representative of each potential resource.
Comminution testing indicated that the materials were somewhat hard with respect to impact and attrition grinding. Impact breakage tests indicative of SAG milling requirements were only conducted on the Copala deposit, returning average Axb values of approximately 33. Bond ball mill work index tests completed on samples from all three deposits returned values ranging from 16.4 to 18.9 kWhr/tonne.
The samples varied in base metal contents. The Napolean samples contained elevated levels of galena and sphalerite which responded well to sequential froth flotation and demonstrated the potential to produce separate lead and zinc concentrates. Lead and zinc contents were considerably lower in the Tajitos and Copala samples, therefore investigation of separate flotation concentrate production was limited.
Bulk sulphide flotaton testing on samples from all three deposits suggested that about 80-90% of the silver and gold could be recovered to a single bulk sulphide concentrate. Cyanide leaching of the bulk rougher flotation tails was effective at recovering about 65% of the silver and 85% of the gold remaining in these streams. Cyanide leaching of the reground bulk flotation concentrate combined with rougher tail leaching generally returned the highest silver and gold recoveries of a dore production only circuit, achieving approximately 91 and 94% silver and gold extraction, respectively, on a Copala master composite. This circuit was more comprehensively tested on the Copala samples and to a lesser degree on the Napoleon and Tajitos samples.
Whole feed leaching was investigated on samples from all deposits, which indicated that about 83-86% of the silver and 90-94% of the gold could be extracted after 96 hours of leaching. These tests were conducted at primary grind sizes ranging from 63 to 100µm P80.
25.3 Mineral Resource Estimate
Completion of the updated MREs for the Napoleon-Luisa and Copala-Tajitos deposit areas involved the assessment of an updated drill hole database, which included all data for surface drilling completed between November 2019 and September 2023. The MREs for the Animas and San Antonio deposit areas included data for surface drilling completed between November 2019 and September 2022; there has been no new drilling on the Animas and San Antonio deposit areas and these MREs previously published are considered current. Completion of the MREs also included the assessment of updated three-dimensional (3D) mineral resource models (resource domains), 3D topographic surface models, 3D models of historical underground workings, and available written reports.
The Inverse Distance Squared ("ID2") calculation method restricted to mineralized domains was used to interpolate grades for Ag (g/t), Au (g/t), Pb (ppm) and Zn (ppm) into block models for all deposit areas.
The MREs presented below take into consideration that all deposits on the Property may be mined by underground mining methods.
The reporting of the updated MRE complies with all disclosure requirements for Mineral Resources set out in the NI 43-101 Standards of Disclosure for Mineral Projects. The classification of the updated MRE is consistent with the 2014 Canadian Institute of Mining, Metallurgy and Petroleum (CIM) Definition Standards (2014 CIM Definitions) and adheres as best as possible to the 2019 CIM Estimation of Mineral Resources & Mineral Reserves Best Practice Guidelines (2019 CIM Guidelines).
The updated MRE for the Project is presented in Table 25-2 and Table 25-3.
Highlights of the Project Mineral Resource Estimate are as follows:
-
Indicated Mineral Resources are estimated at 9.48 Mt grading 289 g/t silver, 2.41 g/t gold, 0.27% lead, and 0.84% zinc (511 AgEq). The current MRE includes indicated mineral resources of 88.2 Moz of silver, 736 koz of gold, 56 Mlbs of lead, and 176 Mlbs of zinc (155.8 Moz AgEq).
-
Inferred Mineral Resources are estimated at 12.19 Mt grading 239 g/t silver, 1.93 g/t gold, 0.29% lead, and 1.03% zinc (433 g/t AgEq). The current MRE includes inferred mineral resources of 93.7 Moz of silver, 758 koz of gold, 78 Mlbs of lead, and 276 Mlbs of zinc (169.6 Moz AgEq).
Table 25-2 Panuco Project Mineral Resource Estimate, September 1, 2023
|
Resource
Class
|
Tonnes
(MT)
|
Grade
|
Total Metal
|
|
Au g/t
|
Ag g/t
|
Pb %
|
Zn %
|
AgEq
(g/t)
|
Au
(koz)
|
Ag
(koz)
|
Pb
(Mlbs)
|
Zn
(Mlbs)
|
AgEq*
(koz)
|
|
Indicated
|
9.48
|
2.41
|
289
|
0.27
|
0.84
|
511
|
736
|
88,192
|
56.0
|
176.1
|
155,841
|
|
Inferred
|
12.19
|
1.93
|
239
|
0.29
|
1.03
|
433
|
758
|
93,653
|
78.1
|
276.2
|
169,647
|
* AgEq = Ag ppm + (((Au ppm x Au price/gram) + (Pb% x Pb price/t) + (Zn% x Zn price/t))/Ag price/gram) with price assumptions of $24.00/oz Ag, $1800/oz Au, $1.10/lb Pb and $1.35/lb Zn
Table 25-3 Panuco Project Mineral Resource Estimate by Area, September 1, 2023
Copala Area: Copala, Tajitos and Cristiano
|
Area
|
Resource
Class
|
Tonnes
(MT)
|
Grade
|
Total Metal
|
|
Au g/t
|
Ag g/t
|
Pb %
|
Zn %
|
AgEq
(g/t)
|
Au
(koz)
|
Ag
(koz)
|
Pb
(Mlbs)
|
Zn
(Mlbs)
|
AgEq
(koz)
|
|
Copala
|
Indicated
|
4.52
|
2.46
|
380
|
0.08
|
0.15
|
573
|
358
|
55,201
|
8.2
|
15.3
|
83,270
|
|
Inferred
|
3.16
|
1.77
|
332
|
0.12
|
0.20
|
476
|
179
|
33,722
|
8.2
|
13.6
|
48,320
|
|
Tajitos
|
Indicated
|
0.63
|
2.24
|
358
|
0.12
|
0.21
|
538
|
46
|
7,295
|
1.6
|
2.9
|
10,953
|
|
Inferred
|
1.04
|
2.04
|
365
|
0.22
|
0.39
|
540
|
69
|
12,260
|
5.2
|
8.9
|
18,140
|
|
Cristiano
|
Indicated
|
0.21
|
3.37
|
581
|
0.25
|
0.43
|
858
|
23
|
3,961
|
1.1
|
2.0
|
5,851
|
|
Inferred
|
0.72
|
2.54
|
443
|
0.15
|
0.29
|
650
|
59
|
10,213
|
2.4
|
4.5
|
14,974
|
|
Total
|
Indicated
|
5.37
|
2.48
|
385
|
0.09
|
0.17
|
580
|
427
|
66,457
|
11
|
20
|
100,074
|
|
Inferred
|
4.92
|
1.94
|
355
|
0.15
|
0.25
|
515
|
307
|
56,195
|
16
|
27
|
81,434
|
Napoleon Area: Napoleon, Cruz, Josephine and Luisa
|
Area
|
Resource
Class
|
Tonnes
(MT)
|
Grade
|
Total Metal
|
|
Au g/t
|
Ag g/t
|
Pb %
|
Zn %
|
AgEq
(g/t)
|
Au
(koz)
|
Ag
(koz)
|
Pb
(Mlbs)
|
Zn
(Mlbs)
|
AgEq
(koz)
|
|
Luisa
|
Indicated
|
0.27
|
2.56
|
177
|
0.39
|
2.01
|
459
|
22
|
1,556
|
2.3
|
12.1
|
4,027
|
|
Inferred
|
2.04
|
2.13
|
159
|
0.30
|
1.51
|
386
|
139
|
10,439
|
13.3
|
67.9
|
25,326
|
|
Cruz/Negra
|
Indicated
|
0.03
|
2.01
|
144
|
0.37
|
1.71
|
373
|
2
|
153
|
0.3
|
1.2
|
396
|
|
Inferred
|
0.31
|
3.75
|
170
|
0.31
|
1.48
|
519
|
37
|
1,698
|
2.1
|
10.1
|
5,169
|
|
Josephine
|
Indicated
|
0.07
|
2.88
|
221
|
0.39
|
1.11
|
492
|
6
|
491
|
0.6
|
1.7
|
1,092
|
|
Inferred
|
0.22
|
2.05
|
161
|
0.33
|
1.00
|
364
|
15
|
1,161
|
1.6
|
4.9
|
2,618
|
|
Napoleon_HW(4)
|
Indicated
|
0.43
|
1.72
|
164
|
0.42
|
1.53
|
365
|
24
|
2,259
|
4.0
|
14.4
|
5,029
|
|
Inferred
|
0.85
|
2.17
|
220
|
0.59
|
2.02
|
479
|
59
|
5,976
|
10.9
|
37.6
|
13,027
|
|
Napoleon+
Splays
|
Indicated
|
3.31
|
2.39
|
162
|
0.52
|
1.73
|
425
|
255
|
17,276
|
37.8
|
126.5
|
45,223
|
|
Inferred
|
3.18
|
1.64
|
137
|
0.45
|
1.76
|
342
|
168
|
14,045
|
31.8
|
123.2
|
35,063
|
|
Total
|
Indicated
|
4.12
|
2.34
|
164
|
0.50
|
1.72
|
421
|
309
|
21,735
|
45
|
156
|
55,767
|
|
Inferred
|
6.60
|
1.97
|
157
|
0.41
|
1.68
|
383
|
418
|
33,319
|
60
|
244
|
81,203
|
San Antonio Area: Generales and Animas Area: Cuevillas and Rosarito
|
Area
|
Resource
Class
|
Tonnes
(MT)
|
Grade
|
Total Metal
|
|
Au g/t
|
Ag g/t
|
Pb %
|
Zn %
|
AgEq
(g/t)
|
Au
(koz)
|
Ag
(koz)
|
Pb
(Mlbs)
|
Zn
(Mlbs)
|
AgEq
(koz)
|
|
San Antonio
|
Inferred
|
0.28
|
1.30
|
226
|
0.01
|
0.03
|
325
|
12
|
2,038
|
0.1
|
0.2
|
2,936
|
|
Animas
|
Inferred
|
0.39
|
1.68
|
169
|
0.29
|
0.60
|
327
|
21
|
2,101
|
2.5
|
5.2
|
4,074
|
25.3.1 Panuco Project Updated Mineral Resource Estimate Notes:
- The classification of the Updated Mineral Resource Estimate into indicated and inferred mineral resources is consistent with current 2014 CIM Definition Standards for Mineral Resources and Mineral Reserves. The effective date for the Updated Mineral Resource Estimate is September 1, 2023.
-
All figures are rounded to reflect the relative accuracy of the estimate and numbers may not add due to rounding.
-
All mineral resources are presented undiluted and in situ, constrained by continuous 3D wireframe models, and are considered to have reasonable prospects for eventual economic extraction.
-
Mineral resources are not mineral reserves. Mineral resources which are not mineral reserves, do not have demonstrated economic viability. An Inferred Mineral Resource has a lower level of confidence than that applying to an Indicated Mineral Resource and must not be converted to a Mineral Reserve. It is reasonably expected that the majority of Inferred Mineral Resources could be upgraded to Indicated Mineral Resources with continued exploration.
-
The database comprises a total of 822 drill holes for 302,931 m of drilling completed by Vizsla Silver between November 2019 and September 2023.
-
The mineral resource estimate is based on 28 three-dimensional ("3D") resource models, constructed in Leapfrog, representing the Napoleon area (15 wireframes), the Copala area (7 wireframes), Tajitos (1 wireframe), Animas (5 wireframes) and San Antonio (1 wireframe).
-
Silver, gold, lead and zinc were estimated for each mineralization domain in the Panuco Project. Blocks within each mineralized domain were interpolated using 1.5 m capped composites assigned to that domain. To generate grade within the blocks, the inverse distance squared (ID2) interpolation method was used for all domains. All estimates are based on variable block dimensions (by deposit area) and estimation search parameters (by domain).
-
Average density values were assigned per zone based on 1,919 samples analysed by ALS in Zacatecas, Mexico or inhouse with 5% checks by ALS.
-
It is envisioned that the Panuco Project deposits may be mined using underground mining methods. Mineral resources are reported at a base case cut-off grade of 150 g/t AgEq. The mineral resource grade blocks were quantified above the base case cut-off grade, below surface and within the constraining mineralized wireframes.
-
The base-case AgEq Cut-off grade considers metal prices of $24.00/oz Ag, $1800/oz Au, $1.10/lb Pb and $1.35/lb Zn and considers metal recoveries of 93% for silver, 90% for gold, 94% for Pb and 94% for Zn.
-
The base case cut-off grade of 150 g/t AgEq considers a mining cost of US$45.00/t rock and processing, treatment and refining, transportation and G&A cost of US$50.00/t of mineralized material.
-
The Updated Mineral Resource Estimate may be materially affected by environmental, permitting, legal, title, taxation, socio-political, marketing, or other relevant issues.
25.4 Risk and Opportunities
The following risks and opportunities were identified that could affect the future economic outcome of the project. The following does not include external risks that apply to all exploration and development projects (e.g., changes in metal prices, exchange rates, availability of investment capital, change in government regulations, etc.).
There is no other relevant data or information available that is necessary to make the technical report understandable and not misleading. To the Authors knowledge, there are no additional risks or uncertainties that could reasonably be expected to affect the reliability or confidence in the exploration information or MRE.
25.4.1 Risks
25.4.1.1 Mineral Resource Estimate
A portion of the contained metal of the Deposit, at the reported cut-off grades for the updated MRE, is in the Inferred Mineral Resource classification. It is reasonably expected that the majority of Inferred Mineral resources could be upgraded to Indicated Minerals Resources with continued exploration.
The mineralized structures (mineralized domains) in all zones are relatively well understood. However, due to the limited drilling in some areas, all mineralization zones might be of slightly variable shapes from what have been modeled. A different interpretation from the current mineralization models may adversely affect the current MRE. Continued drilling may help define with more precision the shapes of the zones and confirm the geological and grade continuities of the mineralized zones.
25.4.2 Opportunities
25.4.2.1 Mineral Resource Estimate
There is an opportunity in all deposit areas to extend known mineralization at depth, on strike and elsewhere on the Property and to potentially convert Inferred Mineral Resources to Indicated Mineral Resources. Vizsla's intentions are to direct their exploration efforts towards resource growth in 2024 with a focus on extending the limits of known mineralization and testing other targets on the greater Panuco Property.
26 RECOMMENDATIONS
The Deposits of the Panuco Project contain underground Indicated and Inferred Mineral Resources that are associated with well-defined mineralized trends and models. All deposits are open along strike and at depth.
Armitage considers that the Project has potential for delineation of additional Mineral Resources and that further exploration is warranted. Given the prospective nature of the Panuco Property, it is the opinion of Armitage that the Property merits further exploration and that a proposed plan for further work by Vizsla is justified.
Armitage is recommending Vizsla conduct further exploration, subject to funding and any other matters which may cause the proposed exploration program to be altered in the normal course of its business activities or alterations which may affect the program as a result of exploration activities themselves.
For 2024, the company plans to drill ~65,000 m on current resource areas, priority targets proximal to current resources in the west, as well as on other high-priority targets in the eastern portion of the district (Figure 26‑1).
Resource Extension Targets
-
The Copala structure remains open along strike to the north and down dip to the south. In 2024, Vizsla plans to continue 1) upgrading inferred resources in south Copala and 2) continue expanding Copala and its footwall splays down dip.
-
At Napoleon, Vizsla plans to upgrade inferred resources and to conduct resource expansion drilling along the hanging wall-4 vein (HW4) to the east, as well as to explore three potential vein feeders along the main Napoleon structure at depth.
Proximal Targets
-
At La Luisa, the team plans to continue expanding the footprint of the high-grade shoot on the south and infill drilling the recently defined 400 m gap between the northern most drill-hole intercepts and the high-grade shoot on the south.
-
The EL Molino Vein reported significant silver and gold grades close to surface, and Vizsla plans to explore the vein along strike and at depth to add additional high-grade resources close to planned infrastructure in 2024.
- Vizsla plans to drill-test a conceptual target at the projected northern intersection of the Copala fault with the Napoleon vein system near La Estrella area.
District Targets
New mapping efforts completed in 2023 have highlighted an abundance of historic workings in the northeastern portion of the district. This new area named "Camelia" is marked by serval high-grade surface samples grading up to 400 g/t Ag and 5.0 g/t Au. Given, the overall density of veins mapped on surface and the abundance of surface samples related to historic workings this has become a high priority district target in the east.
Bulk Sample / Test Mine
Vizsla has received permits to develop and operate a test mine program at its Panuco project to extract a combined 25,000 tonne bulk sample from the Copala and Napoleon structures. Initial engineering for the bulk sample test mine has already begun with plans to begin underground development in early 2024.
Key objectives for 2024:
-
Deliver an updated MRE for the project in January 2024
-
Deliver maiden PEA in H1 2024
-
Complete updated metallurgical testing in H2 2024
-
Advance Bulk Sample / Test Mine program
-
Complete +65,000 meters of drilling
-
Complete a ~1,100 line-kilometre EM survey and acquire high-resolution multispectral satellite imagery for the whole district.
The total cost of the planned work program by Vizsla is estimated at ~CAD$25.0 million and includes:
- Drilling:
-
43,000m all in CAD$16.5 (drilling only CAD$6.5M) infill mostly and resource expansion
-
22,000M exploration all in CAD$8.5M (drilling only CAD$3.3M)
-
All in costs include geos and workers salaries, equipment, fuel, accomodation expenses, truck rentals, and sample shipment, assaying, QA/QC, standards, density checks.
Figure 26-1 Plan Map of the Panuco District Highlighting Primary 2024 Exploration Targets Relative to Mapped and Sampled Mineralized Veins:
Purple ellipse represents Resource Extension targets, the yellow ellipse represents proximal targets, and the blue arrows represent distal District targets.

27 REFERENCES
Abzalov, M. (2008): Quality control of assay data: a review of procedures for measuring and monitoring precision and accuracy. Exploration and Mining Geology, Vol.17, No 3-4, p.131-144, ISSN 0964-1823
Albinson, T., Norman, D.I., Cole, D., and Chomiak, B., 2001, Controls on Formation of Low-Sulfidation Epithermal Deposits in Mexico: Constraints from Fluid Inclusion and Stable Isotope Data: ECONOMIC GEOLOGY, Special Publication 8, p. 1 - 32.
ALN Abogados Consultores (2022). Legal Opinion Copala Mining Project. 67 p.
ALN Abogados Consultores (2022). Legal Opinion Panuco Mining Project. 49 p.
ALS (2021). Preliminary Metallurgical Testing on the Napoleon Deposit for Vizsla Silver Corporation. Project KM6454. December 17, 2021.
ALS (2022A). Preliminary Metallurgical Testing on the Napoleon Deposit Vizsla Silver Corporation Addendum Report Project KM6454. February 9, 2022.
ALS (2022B). Preliminary Metallurgical Testing on Tajitos Deposit for Vizsla Silver Corporation. Project KM6657. July 21, 2022.
ALS (2023). Metallurgical Test Work On Composites From Vizsla Silver's Copala Gold Project for Vizsla Silver Corp. KM6937 Report. October 10, 2023.
Anonymous (2016). Estudio Geofisico en el Proyecto Copala-Panuco; Geophysical Surveys S.A. de C.V., 49-page report prepared for Minera Rio Panuco S.A. de C.V.
Aranda-Gomez, J., Henry, C.D., Juhr, J., McDowell, F. (2003). Cenozoic volcanic-tectonic development of northwestern Mexico-a transect across the Sierra Madre Occidental volcanic field and observations of extension-related magmatism in the southern basin and range and Gulf of California tectonic sub provinces; UNAM, Geologic Transects across Cordilleran Mexico, p. 71-121.
Armitage, A., Eggers, B. and Camus, Y. (2023). National Instrument 43-101 Technical Report titled Mineral Resource Estimate Update for the Panuco Ag-Au-Pb-Zn Project, Sinaloa State, Mexico, for Vizsla Silver Corp., dated March 10, 2023,186 p.
Avila-Ramirez, P. (1999). Informe de la cartografía geológico-minera y geoquímica hoja Copala clave F13A37 escala 1:50,000 estados de Sinaloa y Durango, 75 p.
Benton, L.D., 1991, Composition and source of the hydrothermal fluids of the San Mateo vein, Fresnillo, Mexico as determined from 87Sr/ 86Sr, stable isotope and gas analyses:Unpublished Master's Thesis, New Mexico Institute of Mining and Technology, 55 p.
Campa, M.F., and Coney, P.J., 1983, Tectono- satratigraphic terranes and mineral resource distributions in Mexico: Canadian Journal of Earth Sciences, vol. 20, p. 1040-1051.
Camprubí A. and Albinson T., 2006, Depósitos epitermales en México: actualización de su conocimiento y reclasificación empírica, Sociedad Geológica Mexicana, Tomo LVIII, Num. 1, P. 27-81
Camprubí, A., and Albinson, T., 2007, Epithermal deposits in Mexico: Update of current knowledge, and an empirical reclassification: Geological Society of America, Special Paper 422, p. 377-415.
Centeno-García, E. (2017). Mesozoic tectono-magmatic evolution of Mexico: An overview; Ore Geology Reviews, v. 81 p. 1035-1052.
Centeno-García, E., Guerrero-Suastegui, M., Talavera-Mendoza, O. (2008). The Guerrero Composite Terrane of western Mexico: collision and subsequent rifting in a supra-subduction zone: Geological Society of America Special Paper 436, p. 279-308.
Christopher, P. and Sim, R. (2008). Technical Report on the Copala Project, Sinaloa State, Mexico; Silverstone Resources Corp., 100 p.
Coote, A., 2021a, Petrologic Studies of Drill Core From AM21-31, CO21-50, CS20-01, 11 & 23, NP20-02 & 07 and NP21-102, 150 & 170, Panuco Silver Gold District, Mexico, pp.65.
Coote, A., 2021b, Fluid Inclusion Microthermometric Studies From Drill Core:AM21-31, CO21-50, CS20-01& 11, NP20-02 & 07 and NP21-102&150, Panuco Silver Gold District, Mexico, pp. 33.
Diario Oficial de la Federación 13 de marzo 2012, NORMA Oficial Mexicana NOM-120-SEMARNAT-2011, Que establece las especificaciones de protección ambiental para las actividades de exploración minera directa, en zonas agrícolas, ganaderas o eriales y en zonas con climas secos y templados en donde se desarrolle vegetación de matorral xerófilo, bosque tropical caducifolio, bosques de coníferas o encinos.
Diario Oficial de la Federación 31 de octubre 2014 Reglamento de la ley general del equilibrio ecológico y la protección al ambiente en materia de evaluación del impacto ambiental.
Diario Oficial de la Federación 31 de octubre 2014 Reglamento de la ley general de desarrollo forestal sustentable.
Diario Oficial de la Federación, 26 junio 1992, Ley Minera.
Duque-Trujillo, J., Ferrari, L., López Martínez, M., Orozco-Esquivel, T., and Lonsdale, P. (2013). Early to Middle Miocene syn-extensional magmatism in the southern Gulf of California: Geological Society of America Abstracts with Programs, v. 45, no. 6, p. 15.
Duque-Trujillo, J., Ferrari, L., Norini, G., López-Martínez, M. (2014). Miocene faulting in the southwestern Sierra Madre Occidental, Nayarit, Mexico: kinematics and segmentation during the initial rifting of the southern Gulf of California; Revista Mexicana de Ciencias Geológicas, v. 31, núm. 3, p. 283-302
Escamilla-Torres, T. (2001). Informe de la cartografía geológico-minera y geoquímica hoja Cosala clave G13C74 escala 1:50,000 estado de Sinaloa, 66 p.
Ferrari, L., López-Martínez, M. Orozco-Esquivel, T., Bryan, S.E., Duque-Trujillo, J., Lonsdale, P., Solari, L. (2013). Late Oligocene to Middle Miocene rifting and synextensional magmatism in the southwestern Sierra Madre Occidental, Mexico: The beginning of the Gulf of California rift; Geosphere v. 9; no. 5; p. 1161-1200; doi:10.1130/GES00925.1; 15 figures; 2 tables; 1 supplemental file.
Ferrari, L., López-Martínez, M., Rosas-Elguera, J. (2002). Ignimbrite flare-up and deformation in the southern Sierra Madre Occidental, western Mexico: Implications for the late subduction history of the Farallon plate; Tectonics v. 21 No. 4 10.1029/2001TC001302, p. 17-1 to 17-24
Ferrari, L., Valencia Moreno. M., Bryan, S. (2005). Magmatismo y tectónica en la Sierra Madre Occidental y su relación con la evolución de la margen occidental de Norteamérica, Boletín de la Sociedad Geológica Mexicana Volumen Conmemorativo del Centenario Temas Selectos de La Geología Mexicana Tomo LVII, N. 3, 343-378.
Garzon-Lopez, J. (2018), Plan municipal de desarrollo 2018-2021, Concordia, Sinaloa, 114 p.
González-León, C. M., Solari, L. Solé, J. Ducea, M.N., Lawton, T.F., Bernal, J.P., González-Becuar, E., Gray, F., López Martínez, M., Santacruz, R.L. (2011). Stratigraphy, geochronology, and geochemistry of the Laramide magmatic arc in north-central Sonora, Mexico; Geosphere; December 2011; v. 7; no. 6; p. 1392-1418
Hedenquist, J.W., Arribas, A., Jr., and Reynolds, J.T., 1998, Evolution of an Intrusion-Centered Hydrothermal System: Far Southeast-Lepanto Porphyry and Epithermal Cu-Au Deposits, Philippines: ECONOMIC GEOLOGY, vol. 93, p. 373-404.
Hedenquist, J.W., Arribas, A.R., Gonzalez-Urien, E. (2000). Exploration for epithermal gold-silver deposits, in Hagemann, S.G., and Brown, P.E., eds., Gold in 2000: Society of Economic Geologists, Reviews in Economic Geology, v. 13, p. 245-277.
Hedenquist, J.W., White, N.C. (2005). Epithermal gold-silver deposits: characteristics, interpretation, and exploration; Prospectors and Developers of Canada and Society of Economic Geologists Short Course Notes.
Henry, C.D., McDowell, F.W., Silver, L.T. (2003). Geology and Geochronology of granitic batholithic complex, Sinaloa, Mexico: Implications for Cordilleras magmatism and tectonics; Geological Society of America Special Paper 374, p. 237-273.
Horner, J., Enriquez, E., 1999. Epithermal precious metal mineralization in a strike-slip corridor: the San Dimas District, Durango, Mexico. Econ. Geol. 94 (8), 1375-1380.
Journel, A. G., and Huijbregts, C. J. (1978). Mining Geostatistics. Academic Press.
Lloyd, C.J. (2019). Panuco Core Photos; internal Vizsla Company Report, 57 p.
Maunula, T. and Murray, K. (2022). National Instrument 43-101 Technical Report for the Panuco Project Mineral Resource Estimate, Concordia, Sinaloa, Mexico for Vizsla Silver Corp. Dated: April 7, 2022 and with an Effective Date: March 1, 2022, 176 p. (Posted on SEDAR+ under Vizsla's profile).
McDowell, F.W., and Keizer, R.P., 1977, Timing of mid-Tertiary volcanism in the Sierra Madre Occidental between Durango City and Mazatlan, Mexico: Geological Society of America Bulletin, vol. 88, pp. 1479 - 1487.
Montoya-Lopera, P., Ferrari, L., Levressea, G., Abdullinb, F., Mata L. (2019). New insights into the geology and tectonics of the San Dimas mining district, Sierra Madre Occidental, Mexico; Ore Geology Reviews 105: 273-294.
Norma Oficial Mexicana NOM-120-SEMARNAT 1997, Diario Oficial 19 noviembre 1998.
Norman, D.I., Moore, J.N. and Musgrave J., 1997, More on the use of fluid inclusion gaseous species as tracers in geothermal systems, Twenty-second workshop on geothermal reservoir engineering, Stanford University, Stanford, California, pp. 27 - 29.
Polanco-Salas, A., Valdez-Monsiváis, A., Saldaña-Saucedo, G. (2003). Informe de la cartografía geológico-minera y geoquímica hoja Concordia clave F13A36 escala 1:50,000 estado de Sinaloa, 77 p.
Robinson, M. (2019). Technical Report on the Panuco-Copala Project Concordia, Sinaloa, Mexico, Vizsla Resources Corp., 50 p.
Rosendo-Brito, M., Guerrero-Salazar, C., Bustos-Moreno, M., Escamilla de la Rosa, J. (2019). Informe de la cartografía geológico-minera y geoquímica hoja Villa Unión clave F13A46 escala 1:50,000 estado de Sinaloa, 77 p.
Sedlock R. L., Ortega-Gutiérrez F., Speed R. C., 1993, Tectonostratigraphic Terranes and Tectonic Evolution of Mexico, Geological Society of America, Special Papers, vol. 278, p. 74-80.
SEMARNAT (2014). Guía para conocer lo principales tramites y permisos ambientales en las diferentes etapas del proceso minero, 25 p.
Servicio Geológico Mexicano (2017). Panorama Minero del Estado de Sinaloa, 50 pages.
Shimizu, T. (2014). Reinterpretation of Quartz Textures in Terms of Hydrothermal Fluid Evolution at the Koryu Au-Ag Deposit, Japan; Economic Geology, v. 109, p. 2051-2065.
Simmons, S.F., Gemmell, J.B., and Sawkins, F.J., 1988, The Santo Niño Silver-Lead-Zinc Vein, Fresnillo District, Zacatecas, Mexico: Part II. Physical and Chemical Nature of Ore-Forming Solutions: ECONOMIC GEOLOGY, vol. 83, p. 1619-1641.
Simmons, S.F., 1991, Hydrologic Implications of Alteration and Fluid Inclusion Studies in the Fresnillo District, Mexico: Evidence for a Brine Reservoir and a Descending Water Table During the Formation of Hydrothermal Ag-Pb-Zn Orebodies: ECONOMIC GEOLOGY, vol. 91, pp. 204 - 212.
Stanley, C., and Lawie, D. (2007): Average Relative Error in Geochemical Determinations: Clarification, Calculation, and a Plea for Consistency; Exploration and Mining Geology, Vol. 16, Nos. 3-4, p. 265-274
Starling, T. (2019). Structural Review of the Panuco District, Private Report prepared for Vizsla Resources Corp., 54 p.
28 DATE AND SIGNATURE PAGE
This report titled “Updated Mineral Resource Estimate for the Panuco Ag-Au-Pb-Zn Project, Sinaloa State, Mexico” dated February 12, 2024 (the “Technical Report”) for Vizsla Silver Corp. was prepared and signed by the following authors:
The effective date of the report is September 1, 2023
The date of the report is February 12, 2024.
Signed by:
| Qualified Persons |
Company |
| Allan Armitage, Ph. D., P. Geo., |
SGS Geological Services ("SGS") |
| Ben Eggers, B.Sc.(Hons), MAIG, P.Geo. |
SGS Geological Services ("SGS") |
|
Peter Mehrfert, P. Eng.
|
|
February 12, 2024
29 CERTIFICATES OF QUALIFIED PERSONS
QP CERTIFICATE - ALLAN ARMITAGE
To accompany the technical report titled "Updated Mineral Resource Estimate for the Panuco Ag-Au-Pb-Zn Project, Sinaloa State, Mexico" with an effective date of September 1, 2023 (the "Technical Report") prepared for Vizsla Silver Corp. (the "Company").
I, Allan E. Armitage, Ph. D., P. Geol. of 62 River Front Way, Fredericton, New Brunswick, hereby certify that:
1. I am a Senior Resource Geologist with SGS Canada Inc., 10 de la Seigneurie E blvd., Unit 203 Blainville, QC, Canada, J7C 3V5.
2. I am a graduate of Acadia University having obtained the degree of Bachelor of Science - Honours in Geology in 1989, a graduate of Laurentian University having obtained the degree of Master of Science in Geology in 1992 and a graduate of the University of Western Ontario having obtained a Doctor of Philosophy in Geology in 1998.
3. I have been employed as a geologist for every field season (May - October) from 1987 to 1996. I have been continuously employed as a geologist since March of 1997.
4. I have been involved in mineral exploration and resource modeling at the grass roots to advanced exploration stage, including producing mines, since 1991, including mineral resource estimation and mineral resource and mineral reserve auditing since 2006 in Canada and internationally. I have extensive experience in Archean and Proterozoic load gold deposits, volcanic and sediment hosted base metal massive sulphide deposits, porphyry copper-gold-silver deposits, low and intermediate sulphidation epithermal gold and silver deposits, magmatic Ni-Cu-PGE deposits, and unconformity- and sandstone-hosted uranium deposits.
5. I am a member of the following: the Association of Professional Engineers, Geologists and Geophysicists of Alberta (P.Geol.) (License No. 64456; 1999), the Association of Professional Engineers and Geoscientists of British Columbia (P.Geo.) (Licence No. 38144; 2012), the Professional Geoscientists Ontario (P.Geo.) (Licence No. 2829; 2017), and Northwest Territories and Nunavut Association of Professional Engineers and Geoscientists (NAPEG) (License No. L4375: 2019).
6. I have read the definition of "Qualified Person" set out in National Instrument 43-101 - Standards of Disclosure for Mineral Projects - ("Nl 43-101") and certify that by reason of my education, affiliation with a professional association (as defined in NI 43 101) and past relevant work experience, I fulfill the requirements to be a "Qualified Person" for the purposes of NI 43 101.
7. I am an author of the Technical Report and responsible for sections 1, 2, 3, 4, 8, 12.2, 12.3, 12.4, 14, 15 to 27. I have reviewed these sections and accept professional responsibility for these sections of the Technical Report.
8. I have conducted two site visits to the Property. I conducted a site visit to the Project on May 29, 2023 and a second site visit November 6 to November 8, 2023
9. I have had prior involvement with the Panuco Property. I was an author of the previous NI 43-101 Technical Report for the Property, dated March 10, 2023 for Vizsla.
10. I am independent of the Company as described in Section 1.5 of NI 43-101.
11. As of the effective date of the Technical Report, to the best of my knowledge, information and belief, the Technical Report contains all scientific and technical information that is required to be disclosed to make the Technical Report not misleading.
12. I have read NI 43-101 and Form 43-101F1 (the "Form"), and the Technical Report has been prepared in compliance with NI 43-101 and the Form.
Signed and dated February 12, 2024 at Fredericton, New Brunswick.
|
"Original Signed and Sealed"
|
|
Allan Armitage, Ph. D., P. Geo., SGS Canada Inc.
|
QP CERTIFICATE - BEN EGGERS
To accompany the report titled "Updated Mineral Resource Estimate for the Panuco Ag-Au-Pb-Zn Project, Sinaloa State, Mexico" with an effective date of September 1, 2023 (the "Technical Report") prepared for Vizsla Silver Corp. (the "Company").
I, Benjamin K. Eggers, B.Sc. (Hons), MAIG, P.Geo. of 321 Olsen Road, Tofino, British Columbia, hereby certify that:
1. I am a Senior Geologist with SGS Canada Inc., 10 Boulevard de la Seigneurie E., Suite 203, Blainville, QC, J7C 3V5, Canada.
2. I am a graduate of the University of Otago, New Zealand having obtained the degree of Bachelor of Science (Honours) in Geology in 2004.
3. I have been continuously employed as a geologist since February of 2005.
4. I have been involved in mineral exploration and resource modeling at the greenfield to advanced exploration stages, including at producing mines, in Canada, Australia, and internationally since 2005, and in mineral resource estimation since 2022 in Canada and internationally. I have experience in lode gold deposits, porphyry copper-gold-silver deposits, low and high sulphidation epithermal gold and silver deposits, volcanic and sediment hosted base metal massive sulphide deposits, and albitite-hosted uranium deposits.
5. I am a member of the Association of Professional Engineers and Geoscientists of British Columbia and use the designation (P.Geo.) (EGBC Licence No. 40384; 2014), and I am a member of the Australian Institute of Geoscientists and use the designation (MAIG) (AIG Licence No. 3824; 2013).
6. I have read the definition of "Qualified Person" set out in National Instrument 43-101 - Standards of Disclosure for Mineral Projects - ("Nl 43-101") and certify that by reason of my education, affiliation with a professional association (as defined in NI 43-101) and past relevant work experience, I fulfill the requirements to be a "Qualified Person" for the purposes of NI 43-101.
7. I am an author of the Technical Report and responsible for sections 5, 6, 7, 9, 10, 11 and 12.1. I have reviewed these sections and accept professional responsibility for these sections of the Technical Report.
8. I have not personally conducted a site visit.
9. I have had prior involvement with the Panuco Property. I was an author of the previous NI 43-101 Technical Report for the Property, dated March 10, 2023 for Vizsla.
10. I am independent of the Company as described in Section 1.5 of NI 43-101.
11. As of the effective date of the Technical Report, to the best of my knowledge, information and belief, the Technical Report contains all scientific and technical information that is required to be disclosed to make the Technical Report not misleading.
12. I have read NI 43-101 and Form 43-101F1 (the "Form"), and the Technical Report has been prepared in compliance with NI 43-101 and the Form.
Signed and dated February 12, 2024 at Tofino, British Columbia.
|
"Original Signed and Sealed"
|
|
Ben Eggers, B.Sc.(Hons), MAIG, P. Geo., SGS Canada Inc.
|
CERTIFICATE OF QUALIFIED PERSON
Peter Mehrfert, P. Eng.
I, Peter Mehrfert, P. Eng., certify that I am employed as a Process Engineer with Ausenco Engineering Canada, with an office at 1050 W Pender St, Vancouver, BC V6E 3S7.
1. This certificate applies to the technical report titled, "Update Mineral Resource Estimate For The Panuco Ag-Au-Pb-Zn Project, Sinaloa State, Mexico, 43-101 Technical Report", (the "Technical Report"), prepared for Vizsla Silver (the "Company") with an effective date of 1 September 2023, (the "Effective Date").
2. I am a graduate of the University of British Columbia in 1996 where I obtained a Bachelor of Applied Science in Mining and Mineral Process Engineering.
3. I am a Professional Engineer, registered with Engineers and Geosciences of British Columbia, member number 24527.
4. I have practiced my profession continuously for 29 years and have been involved in the design, evaluation and operation of mineral processing facilities during that time. Approximately half of my professional practice has been the supervision and management of metallurgical test work related to feasibility and prefeasibility studies of projects involving flotation technologies. Previous flotation and cyanide leach projects that I have worked on that have similar features to Panuco are: Lemhi Gold, Eskay Creek, Spanish Mountain, Springpole and Penasquito.
5. I have read the definition of "Qualified Person" set out in the National Instrument 43-101 Standards of Disclosure for Mineral Projects ("NI 43-101") and certify that by virtue of my education, affiliation to a professional association and past relevant work experience, I fulfill the requirements to be a "Qualified Person" for those sections of the technical report that I am responsible for preparing.
6. I have not visited the Panuco property.
7. I am responsible for Sections 1.3, 13, 25.2 and 26.4 of the Technical Report.
8. I am independent of Vizsla Silver as independence is described by Section 1.5 of the NI 43-101.
9. I have been involved with the Panuco project since January 2023, during which I analyzed results from past metallurgical programs and technical reports, assisted in metallurgical sample selection and coordinated recent metallurgical testing.
10. I have read the NI 43-101 and the sections of the technical report for which I am responsible have been prepared in compliance with that Instrument. As of the Effective Date of the Technical Report, to the best of my knowledge, information and belief, the sections of the Technical Report for which I am responsible contain all scientific and technical information that is required to be disclosed to make those sections of the Technical Report not misleading.
Dated: 12 February 2024
"Signed and Sealed"
Peter Mehrfert, P. Eng.
APEGBC # 24527
Ausenco Permit to Practice # 1001905
Vizsla Silver (AMEX:VZLA)
Historical Stock Chart
From Apr 2024 to May 2024

Vizsla Silver (AMEX:VZLA)
Historical Stock Chart
From May 2023 to May 2024
