0001612630
false
0001612630
2023-11-09
2023-11-09
iso4217:USD
xbrli:shares
iso4217:USD
xbrli:shares
UNITED STATES
SECURITIES AND EXCHANGE COMMISSION
Washington, D.C. 20549
FORM 8-K
CURRENT REPORT
Pursuant to Section 13 or 15(d) of the Securities Exchange Act of 1934
Date of Report (Date of earliest event reported):
November 9, 2023
The Joint Corp.
(Exact Name of Registrant as Specified in Charter)
| Delaware |
001-36724 |
90-0544160 |
| (State or other jurisdiction of incorporation) |
(Commission File Number) |
(IRS Employer Identification No.) |
16767 N. Perimeter Drive, Suite 110
Scottsdale, Arizona 85260
(Address of principal executive offices) (Zip Code)
(480) 245-5960
(Registrant’s telephone number, including area code)
Check the appropriate box below if the Form 8-K filing is intended to simultaneously
satisfy the filing obligation of the registrant under any of the following provisions:
☐ Written communications pursuant to
Rule 425 under the Securities Act (17 CFR 230.425)
☐ Soliciting material pursuant to Rule
14a-12 under the Exchange Act (17 CFR 240.14a-12)
☐ Pre-commencement communications pursuant
to Rule 14d-2(b) under the Exchange Act (17 CFR 240.14d-2(b))
☐ Pre-commencement communications pursuant
to Rule 13e-4(c) under the Exchange Act (17 CFR 240.13e-4(c))
Securities registered pursuant to Section 12(b) of the Act:
| Title of each class |
|
Trading Symbol(s) |
|
Name of each exchange on which registered |
| Common Stock, $0.001 |
|
JYNT |
|
The NASDAQ Capital Market LLC |
Indicate by check mark whether the registrant is an emerging growth company as defined in Rule
405 of the Securities Act of 1933 (17 §CFR 230.405) or Rule 12b-2 of the Securities Exchange Act of 1934 (17 CFR §240.12b-2).
Emerging growth company ☐
If an emerging growth company, indicate by check mark if the registrant
has elected not to use the extended transition period for complying with any new or revised financial accounting standards provided pursuant
to Section 13(a) of the Exchange Act. ☐
Item 2.02. Results of Operations and
Financial Condition.
On November 9, 2023, The Joint Corp. (the “Company”) issued
a press release announcing its financial results for the quarter ended September 30, 2023. The press release is furnished as Exhibit 99.1
to this Current Report on Form 8-K.
The information furnished in this Item 2.02 and Exhibit 99.1 shall not
be deemed “filed” for purposes of Section 18 of the Securities Exchange Act of 1934, as amended (the “Exchange Act”),
or otherwise subject to the liabilities of that section, nor shall it be incorporated by reference in any filing under the Securities
Act of 1933, as amended, or the Exchange Act, except as expressly set forth by specific reference in such a filing.
Item 7.01. Regulation FD Disclosure.
The Company is posting an earnings presentation to its website at https://ir.thejoint.com/.
A copy of the earnings presentation is being furnished herewith as Exhibit 99.2. The Company will use the earnings presentation during
its earnings conference call on November 9, 2023 and also may use the earnings presentation from time to time in conversations with
analysts, investors and others.
The information furnished in this Item 7.01 and Exhibit 99.2 shall not
be deemed “filed” for purposes of Section 18 of the Exchange Act, or otherwise subject to the liabilities of that section,
nor shall it be incorporated by reference in any filing under the Securities Act of 1933, as amended, or the Exchange Act, except as expressly
set forth by specific reference in such a filing.
The information contained in Exhibit 99.2 is summary information that is
intended to be considered in the context of the Company’s filings with the SEC. The Company undertakes no duty or obligation to
publicly update or revise the information contained in this report, although it may do so from time to time as its management believes
is warranted. Any such updating may be made through the filing of other reports or documents with the SEC, through press releases or through
other public disclosure.
Item 9.01. Financial Statements and Exhibits.
SIGNATURES
Pursuant to the requirements of the Securities Exchange Act of 1934, the
registrant has duly caused this report to be signed on its behalf by the undersigned hereunto duly authorized.
| |
THE JOINT CORP. |
| |
|
|
| |
|
|
| Date: November 9, 2023 |
By: |
/s/ Peter D. Holt |
| |
|
Peter D. Holt |
| |
|
President and Chief Executive Officer |
EXHIBIT 99.1

The Joint Corp. Reports Third Quarter 2023 Financial Results
- Reaffirms 2023 Financial and Clinic Opening Guidance -
- Unveils Plan to Convert the Majority of the Corporate Portfolio Clinics
to Franchised Clinics -
SCOTTSDALE, Ariz., November 9, 2023 – The Joint Corp. (NASDAQ: JYNT), a national
operator, manager, and franchisor of chiropractic clinics, reported its financial results for the quarter ended September 30, 2023.
Financial Highlights: Q3 2023 Compared to Q3 2022
| ● | Grew revenue by 11% to $29.5 million. |
| ● | Reported operating loss of $898,000, compared to operating income of $732,000. |
| ● | Reported net loss of $716,000, including a loss on disposition or impairment related to corporate clinics announced to be held for
sale in September 2023, compared to net income of $731,000. |
| ● | Increased system-wide sales by 8%, to $119.3 million. |
| ● | System-wide comp sales for clinics that have been open for at least 13 full months were flat. |
| ● | Reported Adjusted EBITDA of $2.9 million, compared to $3.1 million. |
Q3 2023 Operating Highlights
| ● | Sold 12 franchise licenses, compared to 12 in Q3 2022. |
| ● | Grew total clinic count to 914, 778 franchised and 136 company-owned or managed, up from 890 clinics at June 30, 2023. |
| ○ | Opened 24 franchised clinics and two company-owned or managed greenfield clinics, for a total of 26 new clinics, as compared to 38
new clinics in Q3 2022. |
| ○ | Closed two franchised clinics in both Q3 2023 and Q3 2022. |
“The strength of our franchise concept to revolutionize access to chiropractic care
remains strong, although ongoing economic uncertainty and continued cost pressures have impacted our corporate clinic portfolio
performance. We are implementing a strategic plan to leverage our greatest strength – our capacity to build a franchise
– to drive long-term growth for both our franchisees and The Joint as a public company,” said Peter D. Holt, President
and Chief Executive Officer of The Joint Corp. “After evaluating options for improvement, the board has authorized management
to initiate a plan to refranchise or sell the majority of our company-owned or managed clinics and to retain a portion of the
high-performing corporate clinics. With a focus on profitability, we are taking clear action to strengthen the health of our
franchise network and increase our ability to reinvest in the business to create value for our stakeholders.”
Financial Results for Third Quarter Ended September 30: 2023 Compared to 2022
Revenue was $29.5 million in the third quarter of 2023, compared to $26.5 million in the third
quarter of 2022. The increase reflects a greater number of franchised and company-owned or managed clinics. Cost of revenue was $2.6 million,
compared to $2.3 million in the third quarter of 2022, reflecting the associated higher regional developer royalties and commissions.
Selling and marketing expenses were $4.3 million, up 22%, driven by the increase in advertising
expenses from the larger number of clinics, an increase in local marketing expenditures by the company-owned or managed clinics, and the
timing of the national marketing fund spend. Depreciation and amortization expenses increased 32% for the third quarter of 2023, as compared
to the prior year period, primarily due to the increase of the development of greenfield clinics and the acquisition of franchised clinics.
General and administrative expenses were $20.2 million, compared to $17.8 million in the third
quarter of 2022, reflecting increases in costs to support clinic growth and in payroll to remain competitive in the tight labor market.
Loss on disposition or impairment, including those corporate clinics that were announced to
be held for sale in September 2023, was $905,000, compared to $264,000 in the third quarter of 2022.
Operating loss was $898,000, compared to operating income of $732,000 in the third quarter of
2022. Income tax benefit was $188,000, compared to the benefit of $24,000 in the third quarter of 2022. Net loss was $716,000, or $0.05
per share, compared to income of $731,000 or $0.05 per share in the third quarter of 2022.
Adjusted EBITDA was $2.9 million, compared to $3.1 million in the third quarter of 2022.
Financial Results for the Nine Months Ended September 30: 2023 Compared to 2022
Revenue was $87.1 million in the first nine months of 2023, compared to $73.6 million in the first nine months of 2022. Net income,
including net employee retention credits of $3.8 million and loss on disposition of impairment of $1.1 million, was $1.3 million, or $0.09
per share, compared to a net loss of $137,000, or loss of $0.01 per share, in the first nine months of 2022. Adjusted EBITDA was $8.2
million, compared to $7.5 million in the first nine months of 2022.
Balance Sheet Liquidity
Unrestricted cash was $16.1 million at September 30, 2023, compared to $9.7 million at December
31, 2022. During the first nine months of 2023, cash provided by operating activities was $11.3 million, including the receipt of the
employee retention credits mentioned above, partially offset by investing activities of $4.9 million, which included $1.1 million of clinic
acquisitions and $3.8 million of development of greenfield clinics, improvements of existing clinics and corporate assets.
2023 Guidance
For 2023, management reiterated financial and clinic opening guidance.
| ● | Revenue is expected to be between $115.0 million and $118.0 million, compared to $101.9 million in 2022. |
| ● | Adjusted EBITDA is expected to be between $11.0 million and $12.5 million, compared to $11.5 million in 2022. |
| ● | Franchised clinic openings are expected to be between 100 and 120, compared to 121 in 2022. |
| ● | Company-owned or managed greenfield clinic openings are expected to be between 8 and 12, compared to 16 in 2022. |
Conference Call
The Joint Corp. management will host a conference call at 5:00 p.m. ET on Thursday, November
9, 2023 to discuss the third quarter 2023 financial results. Stockholders and interested participants may listen to a live broadcast of
the conference call by dialing (833) 630-0823 or (412) 317-1831 and ask to be joined into the ‘The Joint’ call approximately
15 minutes prior to the start time.
The live webcast of the call with accompanying slide presentation can be accessed in the IR
events section https://ir.thejoint.com/events and will be available for approximately one year. An audio archive can be accessed for one
week by dialing (877) 344-7529 or (412) 317-0088 and entering conference ID 7032664.
Commonly Discussed Performance Metrics
This release includes a presentation of commonly discussed performance metrics. System-wide
sales include revenues at all clinics, whether operated by the company or by franchisees. While franchised sales are not recorded as revenues
by the company, management believes the information is important in understanding the company’s financial performance, because these
sales are the basis on which the company calculates and records royalty fees and are indicative of the financial health of the franchisee
base. System-wide comp sales include the revenues from both company-owned or managed clinics and franchised clinics that in each case
have been open at least 13 full months and exclude any clinics that have closed.
Non-GAAP Financial Information
This release also includes a presentation of non-GAAP financial measures. EBITDA and Adjusted
EBITDA are presented because they are important measures used by management to assess financial performance, as management believes they
provide a more transparent view of the company’s underlying operating performance and operating trends. Reconciliation of historical
net income/(loss) to EBITDA and Adjusted EBITDA is presented in the table below. The Company defines EBITDA as net income/(loss) before
net interest, tax expense, depreciation, and amortization expenses. The company defines Adjusted EBITDA as EBITDA before acquisition-related
expenses, net (gain)/loss on disposition or impairment, stock-based compensation expenses, and other income related to employee retention
credits.
EBITDA and Adjusted EBITDA do not represent and should not be considered alternatives to net
income or cash flows from operations, as determined by accounting principles generally accepted in the United States, or GAAP. While EBITDA
and Adjusted EBITDA are used as measures of financial performance and the ability to meet debt service requirements, they are not necessarily
comparable to other similarly titled captions of other companies due to potential inconsistencies in the methods of calculation. EBITDA
and Adjusted EBITDA should be reviewed in conjunction with the company’s financial statements filed with the SEC.
Information reconciling forward-looking Adjusted EBITDA to net income/(loss) is unavailable
to the company without unreasonable effort. The company is not able to provide a quantitative reconciliation of adjusted EBITDA to net
income/(loss) because certain items required for such reconciliation are uncertain, outside of the company's control, and/or cannot be
reasonably predicted, including but not limited to [the provision for (benefit from) income taxes. Preparation of such reconciliation
would require a forward-looking statement of income and statement of cash flows prepared in accordance with GAAP, and such forward-looking
financial statements are unavailable to the company without unreasonable effort.
Forward-Looking Statements
This press release contains statements about future events and expectations that constitute
forward-looking statements. Forward-looking statements are based on our beliefs, assumptions and expectations of industry trends, our
future financial and operating performance and our growth plans, taking into account the information currently available to us. These
statements are not statements of historical fact. Words such as, "anticipates," "believes," "continues,"
"estimates," "expects," "goal," "objectives," "intends," "may," "opportunity,"
"plans," "potential," "near-term," "long-term," "projections," "assumptions,"
"projects," "guidance," "forecasts," "outlook," "target," "trends," "should,"
"could," "would," "will," and similar expressions are intended to identify such forward-looking statements.
Specific forward looking statements made in this press release include, among others, our belief that the strength of our franchise concept
to revolutionize access to chiropractic care remains strong; our strategic plan to leverage our biggest strength – our profound
understanding of franchising – to drive long-term growth for both our franchisees and The Joint as a public company; our plan to
refranchise or sell the majority of our company-owned or managed clinics and to retain a portion of the high-performing corporate clinics;
our belief that with a focus on profitability, we are taking clear action to strengthen the health of our network, improve the performance
of our public company, and increase our ability to reinvest in the business and create value for our stockholders; and our guidance for
fiscal 2023 for revenue, adjusted EBITDA, franchised clinic openings, and company-owned or managed greenfield clinic openings. Forward-looking
statements involve risks and uncertainties that may cause our actual results to differ materially from the expectations of future results
we express or imply in any forward-looking statements, and you should not place undue reliance on such statements. Factors that could
contribute to these differences include, but are not limited to, our inability to identify and recruit enough qualified chiropractors
and other personnel to staff our clinics, due in part to the nationwide labor shortage and an increase in operating expenses due to measures
we may need to take to address such shortage; inflation, exacerbated by COVID-19 and the current war in Ukraine, which has increased our
costs and which could otherwise negatively impact our business; the potential for further disruption to our operations and the unpredictable
impact on our business of the COVID-19 outbreak and outbreaks of other contagious diseases; our failure to profitably operate company-owned
or managed clinics; short-selling strategies and negative opinions posted on the internet, which could drive down the market price of
our common stock and result in class action lawsuits; our failure to remediate future material weaknesses in our internal control over
financial reporting, which could negatively impact our ability to accurately report our financial results, prevent fraud, or maintain
investor confidence; and other factors described in our filings with the SEC, including in the section entitled “Risk Factors”
in our Annual Report on Form 10-K/A for the year ended December 31, 2022 filed with the SEC on September 26, 2023 and subsequently-filed
current and quarterly reports. We qualify any forward-looking statements entirely by these cautionary factors. We assume no obligation
to update or revise any forward-looking statements for any reason or to update the reasons actual results could differ materially from
those anticipated in these forward-looking statements, even if new information becomes available in the future. Comparisons of results
for current and any prior periods are not intended to express any future trends or indications of future performance, unless expressed
as such, and should only be viewed as historical data.
About The Joint Corp. (NASDAQ: JYNT)
The Joint Corp. (NASDAQ: JYNT) revolutionized access to chiropractic care when it introduced
its retail healthcare business model in 2010. Today, it is the nation's largest operator, manager
and franchisor of chiropractic clinics through The Joint Chiropractic network. The company is making quality care convenient
and affordable, while eliminating the need for insurance, for millions of patients seeking pain relief and ongoing wellness. With more
than 850 locations nationwide and over 12 million patient visits annually, The Joint Chiropractic is a key leader in
the chiropractic industry. Ranked number one on Forbes’ 2022 America's Best Small Companies list, number
three on Fortune’s 100 Fastest-Growing Companies list in 2022 and consistently named to Franchise Times “Top
400+ Franchises” and Entrepreneur's “Franchise 500®” lists, The Joint Chiropractic is
an innovative force, where healthcare meets retail.
For more information, visit www.thejoint.com. To learn about franchise opportunities, visit
www.thejointfranchise.com.
Business Structure
The Joint Corp. is a franchisor of clinics and an operator of clinics in certain states. In
Arkansas, California, Colorado, District of Columbia, Florida, Illinois, Kansas, Kentucky, Maryland, Michigan, Minnesota, New Jersey,
New York, North Carolina, Oregon, Pennsylvania, Rhode Island, South Dakota, Tennessee, Washington, West Virginia and Wyoming. The Joint
Corp. and its franchisees provide management services to affiliated professional chiropractic practices.
Media Contact: Margie Wojciechowski, The Joint Corp., margie.wojciechowski@thejoint.com
Investor Contact: Kirsten Chapman, LHA Investor Relations, 415-433-3777, thejoint@lhai.com
– Financial Tables Follow –
THE JOINT CORP. AND SUBSIDIARY AND AFFILIATES
CONDENSED CONSOLIDATED BALANCE SHEETS
(unaudited)
| | |
|
September 30,
2023 |
| |
|
December 31,
2022 |
|
| ASSETS | |
|
(unaudited) |
| |
|
(as restated) |
|
| Current assets: | |
| | | |
| | |
| Cash and cash equivalents | |
$ | 16,050,137 | | |
$ | 9,745,066 | |
| Restricted cash | |
| 1,092,216 | | |
| 805,351 | |
| Accounts receivable, net | |
| 3,653,127 | | |
| 3,911,272 | |
| Deferred franchise and regional development costs, current portion | |
| 1,054,534 | | |
| 1,054,060 | |
| Prepaid expenses and other current assets | |
| 2,602,563 | | |
| 2,098,359 | |
| Assets held for sale | |
| 3,972,113 | | |
| — | |
| Total current assets | |
| 28,424,690 | | |
| 17,614,108 | |
| Property and equipment, net | |
| 15,355,755 | | |
| 17,475,152 | |
| Operating lease right-of-use asset | |
| 19,803,896 | | |
| 20,587,199 | |
| Deferred franchise and regional development costs, net of current portion | |
| 5,409,924 | | |
| 5,707,678 | |
| Intangible assets, net | |
| 8,623,115 | | |
| 10,928,295 | |
| Goodwill | |
| 8,448,893 | | |
| 8,493,407 | |
| Deferred tax assets ($1.0 million and $1.0 million attributable to VIE) | |
| 11,741,090 | | |
| 11,928,152 | |
| Deposits and other assets | |
| 765,263 | | |
| 756,386 | |
| Total assets | |
$ | 98,572,626 | | |
$ | 93,490,377 | |
THE JOINT CORP. AND SUBSIDIARY AND AFFILIATES
CONDENSED CONSOLIDATED BALANCE SHEETS
CONT’D
(unaudited)
| | |
|
September 30,
2023 |
| |
|
December 31,
2022 |
|
| LIABILITIES AND STOCKHOLDERS' EQUITY | |
|
(unaudited) |
| |
|
(as restated) |
|
| Current liabilities: | |
| | | |
| | |
| Accounts payable | |
$ | 1,877,162 | | |
$ | 2,966,589 | |
| Accrued expenses | |
| 2,488,324 | | |
| 1,069,610 | |
| Co-op funds liability | |
| 1,092,216 | | |
| 805,351 | |
| Payroll liabilities ($1.0 million and $0.6 million attributable to VIE) | |
| 3,875,453 | | |
| 2,030,510 | |
| Operating lease liability, current portion | |
| 5,392,944 | | |
| 5,295,830 | |
| Finance lease liability, current portion | |
| 25,223 | | |
| 24,433 | |
| Deferred franchise revenue, current portion | |
| 2,512,350 | | |
| 2,468,601 | |
| Deferred revenue from company clinics ($4.6 million and $4.7 million attributable to VIE) | |
| 6,538,713 | | |
| 7,471,549 | |
| Upfront regional developer fees, current portion | |
| 383,972 | | |
| 487,250 | |
| Other current liabilities | |
| 516,249 | | |
| 597,294 | |
| Liabilities to be disposed of | |
| 2,971,933 | | |
| — | |
| Total current liabilities | |
| 27,674,539 | | |
| 23,217,017 | |
| Operating lease liability, net of current portion | |
| 17,200,146 | | |
| 18,672,719 | |
| Finance lease liability, net of current portion | |
| 44,490 | | |
| 63,507 | |
| Debt under the Credit Agreement | |
| 2,000,000 | | |
| 2,000,000 | |
| Deferred franchise revenue, net of current portion | |
| 13,980,758 | | |
| 14,161,134 | |
| Upfront regional developer fees, net of current portion | |
| 1,099,718 | | |
| 1,500,278 | |
| Other liabilities ($1.3 million and $1.3 million attributable to VIE) | |
| 1,287,880 | | |
| 1,287,879 | |
| Total liabilities | |
| 63,287,531 | | |
| 60,902,534 | |
| Commitments and contingencies (Note 10) | |
| | | |
| | |
| Stockholders' equity: | |
| | | |
| | |
| Series A preferred stock, $0.001 par value; 50,000 shares authorized, 0 issued and outstanding, as of September 30, 2023 and December 31, 2022 | |
| — | | |
| — | |
| Common stock, $0.001 par value; 20,000,000 shares authorized, 14,786,411 shares issued and 14,754,287 shares outstanding as of September 30, 2023 and 14,560,353 shares issued and 14,528,487 outstanding as of December 31, 2022 | |
| 14,786 | | |
| 14,560 | |
| Additional paid-in capital | |
| 46,969,761 | | |
| 45,558,305 | |
| Treasury stock 32,124 shares as of September 30, 2023 and 31,866 shares as of December 31, 2022, at cost | |
| (860,474 | ) | |
| (856,642 | ) |
| Accumulated deficit | |
| (10,863,978 | ) | |
| (12,153,380 | ) |
| Total The Joint Corp. stockholders' equity | |
| 35,260,095 | | |
| 32,562,843 | |
| Non-controlling interest | |
| 25,000 | | |
| 25,000 | |
| Total equity | |
| 35,285,095 | | |
| 32,587,843 | |
| Total liabilities and stockholders' equity | |
$ | 98,572,626 | | |
$ | 93,490,377 | |
THE JOINT CORP. AND SUBSIDIARY AND AFFILIATES
CONDENSED CONSOLIDATED INCOME STATEMENTS
(unaudited)
| | |
|
Three Months Ended
September 30, |
| |
|
Nine Months Ended
September 30, |
|
| | |
|
2023 |
| |
|
2022 |
| |
|
2023 |
| |
|
2022 |
|
| | |
| |
|
(as restated) |
| |
| |
|
(as restated) |
|
| Revenues: | |
| | | |
| | | |
| | | |
| | |
| Revenues from company-owned or managed clinics | |
$ | 17,882,303 | | |
$ | 15,836,327 | | |
$ | 52,813,098 | | |
$ | 42,936,298 | |
| Royalty fees | |
| 7,143,791 | | |
| 6,604,653 | | |
| 21,181,973 | | |
| 19,024,799 | |
| Franchise fees | |
| 754,029 | | |
| 642,405 | | |
| 2,179,822 | | |
| 1,970,256 | |
| Advertising fund revenue | |
| 2,050,106 | | |
| 1,881,367 | | |
| 6,043,563 | | |
| 5,417,840 | |
| Software fees | |
| 1,301,577 | | |
| 1,109,753 | | |
| 3,746,394 | | |
| 3,166,732 | |
| Other revenues | |
| 342,143 | | |
| 375,314 | | |
| 1,117,103 | | |
| 1,058,008 | |
| Total revenues | |
| 29,473,949 | | |
| 26,449,819 | | |
| 87,081,953 | | |
| 73,573,933 | |
| Cost of revenues: | |
| | | |
| | | |
| | | |
| | |
| Franchise and regional development cost of revenues | |
| 2,228,689 | | |
| 1,988,764 | | |
| 6,605,964 | | |
| 5,694,723 | |
| IT cost of revenues | |
| 375,411 | | |
| 348,331 | | |
| 1,068,332 | | |
| 1,010,446 | |
| Total cost of revenues | |
| 2,604,100 | | |
| 2,337,095 | | |
| 7,674,296 | | |
| 6,705,169 | |
| Selling and marketing expenses | |
| 4,301,017 | | |
| 3,539,287 | | |
| 13,169,079 | | |
| 10,666,500 | |
| Depreciation and amortization | |
| 2,349,206 | | |
| 1,779,924 | | |
| 6,893,529 | | |
| 4,578,450 | |
| General and administrative expenses | |
| 20,212,750 | | |
| 17,796,806 | | |
| 60,156,022 | | |
| 51,900,533 | |
| Total selling, general and administrative expenses | |
| 26,862,973 | | |
| 23,116,017 | | |
| 80,218,630 | | |
| 67,145,483 | |
| Net loss on disposition or impairment | |
| 904,923 | | |
| 264,391 | | |
| 1,114,738 | | |
| 360,140 | |
| Income (loss) from operations | |
| (898,047 | ) | |
| 732,316 | | |
| (1,925,711 | ) | |
| (636,859 | ) |
| Other income (expense), net | |
| (6,244 | ) | |
| (25,235 | ) | |
| 3,708,399 | | |
| (60,668 | ) |
| Income (loss) before income tax (benefit) expense | |
| (904,291 | ) | |
| 707,081 | | |
| 1,782,688 | | |
| (697,527 | ) |
| Income tax (benefit) expense | |
| (188,018 | ) | |
| (24,015 | ) | |
| 493,286 | | |
| (560,976 | ) |
| Net (loss) income | |
$ | (716,273 | ) | |
$ | 731,096 | | |
$ | 1,289,402 | | |
$ | (136,551 | ) |
| Earnings per share: | |
| | | |
| | | |
| | | |
| | |
| Basic earnings (loss) per share | |
$ | (0.05 | ) | |
$ | 0.05 | | |
$ | 0.09 | | |
$ | (0.01 | ) |
| Diluted earnings (loss) per share | |
$ | (0.05 | ) | |
$ | 0.05 | | |
$ | 0.09 | | |
$ | (0.01 | ) |
| Basic weighted average shares | |
| 14,790,663 | | |
| 14,512,856 | | |
| 14,666,222 | | |
| 14,474,323 | |
| Diluted weighted average shares | |
| 15,015,953 | | |
| 14,829,629 | | |
| 14,931,474 | | |
| 15,119,264 | |
THE JOINT CORP. AND SUBSIDIARY AND AFFILIATES
CONDENSED CONSOLIDATED STATEMENTS OF CASH FLOWS
(unaudited)
| | |
|
Nine Months Ended
September 30, |
|
| | |
|
2023 |
| |
|
2022 |
|
| | |
| |
|
(as restated) |
|
| Cash flows from operating activities: | |
| | | |
| | |
| Net income (loss) | |
$ | 1,289,402 | | |
$ | (136,551 | ) |
| Adjustments to reconcile net income (loss) to net cash provided by operating activities: | |
| | | |
| | |
| Depreciation and amortization | |
| 6,893,529 | | |
| 4,578,450 | |
| Net loss on disposition or impairment | |
| 1,114,738 | | |
| 360,140 | |
| Net franchise fees recognized upon termination of franchise agreements | |
| (170,720 | ) | |
| (15,218 | ) |
| Deferred income taxes | |
| 187,062 | | |
| (961,759 | ) |
| Stock-based compensation expense | |
| 1,209,296 | | |
| 969,562 | |
| Changes in operating assets and liabilities, net of acquisitions: | |
| | | |
| | |
| Accounts receivable | |
| 258,145 | | |
| (244,236 | ) |
| Prepaid expenses and other current assets | |
| (504,203 | ) | |
| (450,702 | ) |
| Deferred franchise costs | |
| 166,078 | | |
| (186,618 | ) |
| Deposits and other assets | |
| (15,377 | ) | |
| (153,650 | ) |
| Accounts payable | |
| (1,244,767 | ) | |
| 50,702 | |
| Accrued expenses | |
| 1,279,949 | | |
| (571,447 | ) |
| Payroll liabilities | |
| 1,844,943 | | |
| (1,118,259 | ) |
| Deferred revenue | |
| (551,226 | ) | |
| 1,161,393 | |
| Upfront regional developer fees | |
| (496,730 | ) | |
| (977,841 | ) |
| Other liabilities | |
| 34,638 | | |
| 728,449 | |
| Net cash provided by operating activities | |
| 11,294,757 | | |
| 3,032,415 | |
| | |
| | | |
| | |
| Cash flows from investing activities: | |
| | | |
| | |
| Acquisition of AZ clinics | |
| — | | |
| (6,861,256 | ) |
| Acquisition of NC clinics | |
| — | | |
| (1,105,000 | ) |
| Acquisition of CA clinics | |
| (1,050,000 | ) | |
| — | |
| Purchase of property and equipment | |
| (3,833,148 | ) | |
| (4,322,673 | ) |
| Net cash used in investing activities | |
| (4,883,148 | ) | |
| (12,288,929 | ) |
| | |
| | | |
| | |
| Cash flows from financing activities: | |
| | | |
| | |
| Payments of finance lease obligation | |
| (18,227 | ) | |
| (43,907 | ) |
| Purchases of treasury stock under employee stock plans | |
| (3,832 | ) | |
| (5,804 | ) |
| Proceeds from exercise of stock options | |
| 202,386 | | |
| 362,029 | |
| Repayment of debt under the Paycheck Protection Program | |
| — | | |
| — | |
| Net cash provided by financing activities | |
| 180,327 | | |
| 312,318 | |
| | |
| | | |
| | |
| Increase (decrease) in cash, cash equivalents and restricted cash | |
| 6,591,936 | | |
| (8,944,196 | ) |
| Cash, cash equivalents and restricted cash, beginning of period | |
| 10,550,417 | | |
| 19,912,338 | |
| Cash, cash equivalents and restricted cash, end of period | |
$ | 17,142,353 | | |
$ | 10,968,142 | |
| | |
| | | |
| | |
| Reconciliation of cash, cash equivalents and restricted cash: | |
| September 30,
2023 | | |
| September 30,
2022 | |
| Cash and cash equivalents | |
$ | 16,050,137 | | |
$ | 10,272,112 | |
| Restricted cash | |
| 1,092,216 | | |
| 696,030 | |
| | |
$ | 17,142,353 | | |
$ | 10,968,142 | |
THE JOINT CORP. AND SUBSIDIARY AND AFFILIATES
RECONCILIATION FOR GAAP TO NON-GAAP
(unaudited)
| | |
|
Three Months Ended
September 30, |
| |
|
Nine Months Ended
September 30, |
|
| | |
|
2023 |
| |
|
2022 |
| |
|
2023 |
| |
|
2022 |
|
| | |
| |
|
(as restated) |
| |
| |
|
(as restated) |
|
| Non-GAAP Financial Data: | |
| | | |
| | | |
| | | |
| | |
| Net income (loss) | |
$ | (716,273 | ) | |
$ | 731,096 | | |
$ | 1,289,402 | | |
$ | (136,551 | ) |
| Net interest expense | |
| 6,244 | | |
| 25,235 | | |
| 70,905 | | |
| 60,668 | |
| Depreciation and amortization expense | |
| 2,349,206 | | |
| 1,779,924 | | |
| 6,893,529 | | |
| 4,578,450 | |
| Tax (benefit) expense | |
| (188,018 | ) | |
| (24,015 | ) | |
| 493,286 | | |
| (560,976 | ) |
| EBITDA | |
| 1,451,159 | | |
| 2,512,240 | | |
| 8,747,122 | | |
| 3,941,591 | |
| Stock compensation expense | |
| 526,069 | | |
| 305,815 | | |
| 1,209,296 | | |
| 969,562 | |
| Acquisition related expenses | |
| 15,222 | | |
| 46,712 | | |
| 873,214 | | |
| 2,275,380 | |
| Loss on disposition or impairment | |
| 904,923 | | |
| 264,391 | | |
| 1,114,738 | | |
| 360,140 | |
| Other income related to the ERC | |
| — | | |
| — | | |
| (3,779,304 | ) | |
| — | |
| Adjusted EBITDA | |
$ | 2,897,373 | | |
$ | 3,129,158 | | |
$ | 8,165,066 | | |
$ | 7,546,673 | |
9
EXHIBIT 99.2

Q3 2023 Financial Results As of September 30, 2023 | Reported on November 9, 2023 The Joint Corp. | NASDAQ: JYNT | thejoint.com EXHIBIT 99.2

Safe Harbor Statements © 2023 The Joint Corp. All Rights Reserved. 2 Certain statements contained in this presentation are "forward - looking statements” about future events and expectations. Forward - looking statements are based on our beliefs, assumptions and expectations of industry trends, our future financial and operating performance and our growth plans, taking into account the information currently available to us. These statements are not statements of historical fact. Words such as, "anticipates," "believes," "continues," "estimates," "expects," "goal," "objectives," "intends," "may," "opportunity," "plans," "potential," "near - term," "long - term," "projections," "assumptions," "projects," "guidance," "forecasts," "outlook," "target," "trends," "should," "could," "would," "will," and similar expressions are intended to identify such forward - looking statements. . Specific forward looking statements made in this press release include, among others, our belief that the strength of our franchise concept to revolutionize access to chiropractic care remains strong; our strategic plan to leverage our biggest strength – our profound understanding of franchising – to drive long - term growth for both our franchisees and The Joint as a public company; our plan to refranchise or sell the majority of our company - owned or managed clinics and to retain a portion of the high - performing corporate clinics; our belief that with a focus on profitability, we are taking clear action to strengthen the health of our network, improve the performance of our public company, and increase our ability to reinvest in the business and create value for our stockholders; and our guidance for fiscal 2023 for revenue, adjusted EBITDA, franchised clinic openings, and company - owned or managed greenfield clinic openings. Forward - looking statements involve risks and uncertainties that may cause our actual results to differ materially from the expectations of future results we express or imply in any forward - looking statements, and you should not place undue reliance on such statements. Factors that could contribute to these differences include, but are not limited to, our inability to identify and recruit enough qualified chiropractors and other personnel to staff our clinics, due in part to the nationwide labor shortage and an increase in operating expenses due to measures we may need to take to address such shortage; inflation, exacerbated by COVID - 19 and the current war in Ukraine, which has increased our costs and which could otherwise negatively impact our business; the potential for further disruption to our operations and the unpredictable impact on our business of the COVID - 19 outbreak and outbreaks of other contagious diseases; our failure to profitably operate company - owned or managed clinics; short - selling strategies and negative opinions posted on the internet, which could drive down the market price of our common stock and result in class action lawsuits; our failure to remediate future material weaknesses in our internal control over financial reporting, which could negatively impact our ability to accurately report our financial results, prevent fraud, or maintain investor confidence; and other factors described in our filings with the SEC, including in the section entitled “Risk Factors” in our Annual Report on Form 10 - K/A for the year ended December 31, 2022 filed with the SEC on September 26, 2023 and subsequently - filed current and quarterly reports. We qualify any forward - looking statements entirely by these cautionary factors. We assume no obligation to update or revise any forward - looking statements for any reason or to update the reasons actual results could differ materially from those anticipated in these forward - looking statements, even if new information becomes available in the future. Comparisons of results for current and any prior periods are not intended to express any future trends or indications of future performance, unless expressed as such, and should only be viewed as historical data. Business Structure The Joint Corp. is a franchisor of clinics and an operator of clinics in certain states. In Arkansas, California, Colorado, District of Columbia, Florida, Illinois, Kansas, Kentucky, Maryland, Michigan, Minnesota, New Jersey, New York, North Carolina, Oregon, Pennsylvania, Rhode Island, South Dakota, Tennessee, Washington, West Virginia and Wyoming. The Joint Corp. and its franchisees provide management services to affiliated professional chiropractic practices.

© 2023 The Joint Corp. All Rights Reserved. 3

Building upon Foundation for Growth 1 System - wide sales include revenues at all clinics, whether operated or managed by the company or by franchisees. While franchised sales are not recorded as revenues by the company, management believes the information is important in understanding the company’s financial performance, because these revenues are the basis on which the company calculates and records royalty fees and are indicative of the financial health of the franchisee base. | 2 Comparable sales include only the sales from clinics that have been open at least 13 or 48 full months and exclude any clinics that have permanently closed. 3 Loss on disposition or impairment, including those corporate clinics that were announced to be held for sale in September 2023. 4 Reconciliation of Adjusted EBITDA to GAAP earnings is included in the Appendix. © 2023 The Joint Corp. All Rights Reserved. 4 8% Increase in system - wide sales 1 Q3 2023 over Q3 2022 0% Increase in system – wide comp sales 2 for all clinics >13 months in operation Q3 2023 over Q3 2022 (5)% Decrease in system – wide comp sales 2 for all clinics >48 months in operation Q3 2023 over Q3 2022 Q3 2022 Q3 2023 $26.5M $29.5M Revenue $264k $905k Loss on disposition or impairment 3 $732k $(898)k Operating (Loss)/Inc. $731K $(716)k Net (Loss/ Income $3.1M $2.9M Adjusted EBITDA 4 Unrestricted cash $16.1M at Sept. 30, 2023, compared to $9.7M at Dec. 31, 2022

© 2023 The Joint Corp. All Rights Reserved. 5 26 New Clinics in Q3 2023 Q3 2022 Q3 2023 12 12 Franchise Licenses Sold 33 24 Total New Franchised Clinics Opened 5 2 Greenfield Clinics Opened 3 0 Franchised Clinics Acquired 252 202 Clinics in Development 12 26 82 175 242 265 309 352 394 453 515 610 712 778 4 47 61 47 48 60 64 96 126 136 2010 2011 2012 2013 2014 2015 2016 2017 2018 2019 2020 2021 2022 Sept. 30, 2023 TOTAL CLINICS OPEN 1 Franchise Company Owned/Managed 1 In Q3 2023 and Q3 2022 , The Joint closed two franchised clinics for both periods. The closure rate remains one of the lowest in the franchise community at less than 1 percent. 370 399 442 513 312 246 579 706 838 914

RD territories cover 55% of Metropolitan Statistical Areas (MSAs) as of Sept. 30, 2023 68% of clinics supported by 17 RDs as of Sept. 30, 2023 52% sold by Regional Developers in YTD 2023 37 99 126 121 156 75 50 Dec. 31, Dec. 31, Dec. 31, Dec. 31, Dec. 31, Dec. 31,Sept. 30, 2017 2018 2019 2020 2021 2022 2023 616 715 841 962 1118 1193 1243 Dec. 31, Dec. 31, Dec. 31, Dec. 31, Dec. 31, Dec. 31,Sept. 30, 2017 2018 2019 2020 2021 2022 2023 112 155 204 253 283 235 202 Dec. 31, Dec. 31, Dec. 31, Dec. 31, Dec. 31, Dec. 31, Sept. 30, 2017 2018 2019 2020 2021 2022 2023 Pipeline for Growth 6 1 Of the 1,243 franchise licenses sold as of Sept. 30, 2023, 202 are in active development, 778 are currently operating and the balance represents terminated/closed licenses. Gross Cumulative Franchise Licenses Sold 1 Franchise Licenses Sold Annually Clinics in Active Development 1 © 2023 The Joint Corp. All Rights Reserved.

Implementing New Marketing Programs 7 Leveraging Data Growing New Leads and Patients Increasing Lifetime Patient Value Growing Brand Equity © 2023 The Joint Corp. All Rights Reserved.

Q3 2023 Financial Results as of Sept. 30, 2023 1 Due to rounding, numbers may not add up precisely to the totals. 2 Loss on disposition or impairment, including those corporate clinics that were announced to be held for sale in September 2023. 3 Reconciliation of Adjusted EBITDA to GAAP earnings is included in the Appendix. © 2023 The Joint Corp. All Rights Reserved. 8 Differences Q3 2022 Q3 2023 $ in M 1 11% 13% 9% $3.0 2.0 1.0 $26.5 15.8 10.6 $29.5 17.9 11.6 Revenue • Corporate clinics • Franchise fees 11% 0.3 2.3 2.6 Cost of revenue 27% 0.9 3.3 4.1 Sales and marketing 32% 0.6 1.8 2.3 Depreciation and amortization 13%0 2.4 17.8 20.2 G&A NA 0.6 0.3 0.9 Loss on disposition or impairment 2 NA (1.6) 0.7 (0.9) Operating (Loss)/Inc. NA (0.2) 0.0 (0.2) Tax benefit NA (1.4) 0.7 (0.7) Net (Loss)/Income (7)% (0.2) 3.1 2.9 Adj. EBITDA 3

YTD 2023 Financial Results as of Sept. 30, 2023 1 Due to rounding, numbers may not add up precisely to the totals. 2 Loss on disposition or impairment, including those corporate clinics that were announced to be held for sale in September 2023. 3 Reconciliation of Adjusted EBITDA to GAAP earnings is included in the Appendix. © 2023 The Joint Corp. All Rights Reserved. 9 Differences YTD 2022 YTD 2023 $ in M 1 18% 23% 12% $13.5 9.9 3.6 $73.6 42.9 30.6 $87.1 52.8 34.3 Revenue • Corporate clinics • Franchise fees 14% 1.0 6.7 7.7 Cost of revenue 23% 2.5 10.7 13.2 Sales and marketing 51% 2.3 4.6 6.9 Depreciation and amortization 16% 8.3 51.9 60.2 G&A NA (0.8) 0.4 1.1 Loss on disposition or impairment 2 NA (1.2) (0.7) (1.9) Operating (Loss)/Inc. NA (1.1) (0.6) 0.5 Tax expense (benefit) NA 1.4 (0.1) 1.3 Net Income/(Loss) 8% 0.6 7.5 8.2 Adj. EBITDA 2

1 Historically, company - owned or managed clinic openings included a combination of both greenfields and acquisitions. The company will continue to acquire previously franchised clinics. However, as these transactions are opportunistic, management will no longer include the acquired clinic estimate in guidance. To provide greater clarity, the 2023 company - owned or managed guidance includes greenfield clinic openings only. Reiterating 2023 Financial Guidance 10 2023 High Guidance 2023 Low Guidance 2022 Actual $ in M $118.0 $115.0 $101.9 Revenues $12.5 $11.0 $11.5 Adjusted EBITDA 120 100 121 New Franchised Clinic Openings 12 8 16 New Greenfield Clinic 1 © 2023 The Joint Corp. All Rights Reserved.

Leading Market Growth The Joint Corp. 12 - yr. CAGR 62% 1 vs. Industry 5 - yr. CAGR 5.1% 2 People will continue to seek more noninvasive, holistic ways to manage their pain. We’ll be there to treat them. 1 For the period ended Dec. 31, 2022 2 March 2023 Kentley Insights Chiropractic Care Market Research Report 11 © 2023 The Joint Corp. All Rights Reserved. System - wide Sales ($ in M) 62% CAGR 1 (2010 - 2022) $8.1 $22.3 $98.6 $70.1 $46.2 $126.9 $165.1 $260.0 $220.3 $361.1 $435.3 $354.8 2012 2013 2014 2015 2016 2017 2018 2019 2020 2021 2022 Sept. 30, 2023

Driving Long - term Shareholder Value The most powerful brand - building tool is our storefronts . © 2023 The Joint Corp. All Rights Reserved. 12

Performance Metrics and Non - GAAP Measures © 2023 The Joint Corp. All Rights Reserved. 13 This presentation includes commonly discussed performance metrics. System - wide sales include sales at all clinics, whether operated by the company or by franchisees. While franchised sales are not recorded as revenues by the company, management believes the information is important in understanding the company’s financial performance, because these sales are the basis on which the company calculates and records royalty fees and are indicative of the financial health of the franchisee base. Comp sales include the sales from both company - owned or managed clinics and franchised clinics that in each case have been open at least 13 full months and exclude any clinics that have closed. This presentation includes non - GAAP financial measures. EBITDA and Adjusted EBITDA are presented because they are important measures used by management to assess financial performance, as management believes they provide a more transparent view of the Company’s underlying operating performance and operating trends than GAAP measures alone. Reconciliations of net loss to EBITDA and Adjusted EBITDA are presented where applicable. The Company defines EBITDA as net income/(loss) before net interest, tax expense, depreciation, and amortization expenses. The Company defines Adjusted EBITDA as EBITDA before acquisition - related expenses, bargain purchase net gain, gain/(loss) on disposition or impairment, stock - based compensation expenses and employee retention credits. EBITDA and Adjusted EBITDA do not represent and should not be considered alternatives to net income or cash flows from operations, as determined by accounting principles generally accepted in the United States, or GAAP. While EBITDA and Adjusted EBITDA are frequently used as measures of financial performance and the ability to meet debt service requirements, they are not necessarily comparable to other similarly titled captions of other companies due to potential inconsistencies in the methods of calculation. EBITDA and Adjusted EBITDA should be reviewed in conjunction with the Company’s financial statements filed with the SEC. Information reconciling forward - looking Adjusted EBITDA to net income/(loss) is unavailable to the company without unreasonable effort. The company is not able to provide a quantitative reconciliation of adjusted EBITDA to net income/(loss) because certain items required for such reconciliation are uncertain, outside of the company's control, and/or cannot be reasonably predicted, including but not limited to [the provision for (benefit from) income taxes. Preparation of such reconciliation would require a forward - looking statement of income and statement of cash flows prepared in accordance with GAAP, and such forward - looking financial statements are unavailable to the company without unreasonable effort.

Q3 2023 Segment Results as of Sept. 30, 2023 $ in 000s 2023 Q3 © 2023 The Joint Corp. All Rights Reserved. 14
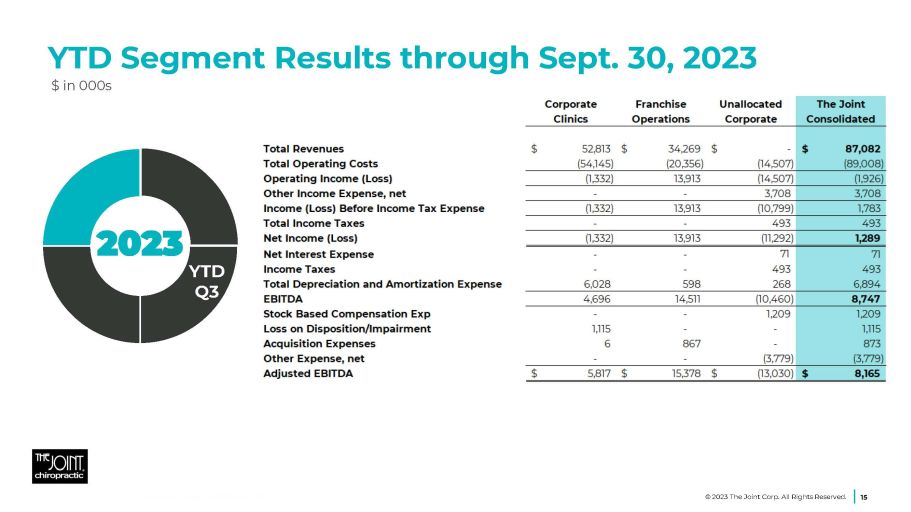
YTD Segment Results through Sept. 30, 2023 $ in 000s 2023 YTD Q3 © 2023 The Joint Corp. All Rights Reserved. 15

GAAP – Non - GAAP Reconciliation $ in 000s © 2023 The Joint Corp. All Rights Reserved. 16

Jake Singleton, CFO jake.singleton@thejoint.com The Joint Corp. | 16767 N. Perimeter Dr., Suite 110, Scottsdale, AZ 85260 | (480) 245 - 5960 https://www.facebook.com/thejointchiro @thejointchiro © 2023 The Joint Corp. All Rights Reserved. 17 https://twitter.com/thejointchiro @thejointchiro https://www.youtube.com/thejointcorp @thejointcorp Peter D. Holt, President & CEO peter.holt@thejoint.com The Joint Corp. | 16767 N. Perimeter Dr., Suite 110, Scottsdale, AZ 85260 | (480) 245 - 5960 Kirsten Chapman, LHA Investor Relations thejoint@lhai.com LHA Investor Relations | 50 California Street, Suite 1500 | San Francisco, CA 94111| (415) 433 - 3777 Contact Information
v3.23.3
| X |
- DefinitionBoolean flag that is true when the XBRL content amends previously-filed or accepted submission.
| Name: |
dei_AmendmentFlag |
| Namespace Prefix: |
dei_ |
| Data Type: |
xbrli:booleanItemType |
| Balance Type: |
na |
| Period Type: |
duration |
|
| X |
- DefinitionFor the EDGAR submission types of Form 8-K: the date of the report, the date of the earliest event reported; for the EDGAR submission types of Form N-1A: the filing date; for all other submission types: the end of the reporting or transition period. The format of the date is YYYY-MM-DD.
| Name: |
dei_DocumentPeriodEndDate |
| Namespace Prefix: |
dei_ |
| Data Type: |
xbrli:dateItemType |
| Balance Type: |
na |
| Period Type: |
duration |
|
| X |
- DefinitionThe type of document being provided (such as 10-K, 10-Q, 485BPOS, etc). The document type is limited to the same value as the supporting SEC submission type, or the word 'Other'.
| Name: |
dei_DocumentType |
| Namespace Prefix: |
dei_ |
| Data Type: |
dei:submissionTypeItemType |
| Balance Type: |
na |
| Period Type: |
duration |
|
| X |
- DefinitionAddress Line 1 such as Attn, Building Name, Street Name
| Name: |
dei_EntityAddressAddressLine1 |
| Namespace Prefix: |
dei_ |
| Data Type: |
xbrli:normalizedStringItemType |
| Balance Type: |
na |
| Period Type: |
duration |
|
| X |
- DefinitionAddress Line 2 such as Street or Suite number
| Name: |
dei_EntityAddressAddressLine2 |
| Namespace Prefix: |
dei_ |
| Data Type: |
xbrli:normalizedStringItemType |
| Balance Type: |
na |
| Period Type: |
duration |
|
| X |
- Definition
+ References
+ Details
| Name: |
dei_EntityAddressCityOrTown |
| Namespace Prefix: |
dei_ |
| Data Type: |
xbrli:normalizedStringItemType |
| Balance Type: |
na |
| Period Type: |
duration |
|
| X |
- DefinitionCode for the postal or zip code
| Name: |
dei_EntityAddressPostalZipCode |
| Namespace Prefix: |
dei_ |
| Data Type: |
xbrli:normalizedStringItemType |
| Balance Type: |
na |
| Period Type: |
duration |
|
| X |
- DefinitionName of the state or province.
| Name: |
dei_EntityAddressStateOrProvince |
| Namespace Prefix: |
dei_ |
| Data Type: |
dei:stateOrProvinceItemType |
| Balance Type: |
na |
| Period Type: |
duration |
|
| X |
- DefinitionA unique 10-digit SEC-issued value to identify entities that have filed disclosures with the SEC. It is commonly abbreviated as CIK. Reference 1: http://www.xbrl.org/2003/role/presentationRef
-Publisher SEC
-Name Exchange Act
-Number 240
-Section 12
-Subsection b-2
| Name: |
dei_EntityCentralIndexKey |
| Namespace Prefix: |
dei_ |
| Data Type: |
dei:centralIndexKeyItemType |
| Balance Type: |
na |
| Period Type: |
duration |
|
| X |
- DefinitionIndicate if registrant meets the emerging growth company criteria. Reference 1: http://www.xbrl.org/2003/role/presentationRef
-Publisher SEC
-Name Exchange Act
-Number 240
-Section 12
-Subsection b-2
| Name: |
dei_EntityEmergingGrowthCompany |
| Namespace Prefix: |
dei_ |
| Data Type: |
xbrli:booleanItemType |
| Balance Type: |
na |
| Period Type: |
duration |
|
| X |
- DefinitionCommission file number. The field allows up to 17 characters. The prefix may contain 1-3 digits, the sequence number may contain 1-8 digits, the optional suffix may contain 1-4 characters, and the fields are separated with a hyphen.
| Name: |
dei_EntityFileNumber |
| Namespace Prefix: |
dei_ |
| Data Type: |
dei:fileNumberItemType |
| Balance Type: |
na |
| Period Type: |
duration |
|
| X |
- DefinitionTwo-character EDGAR code representing the state or country of incorporation.
| Name: |
dei_EntityIncorporationStateCountryCode |
| Namespace Prefix: |
dei_ |
| Data Type: |
dei:edgarStateCountryItemType |
| Balance Type: |
na |
| Period Type: |
duration |
|
| X |
- DefinitionThe exact name of the entity filing the report as specified in its charter, which is required by forms filed with the SEC. Reference 1: http://www.xbrl.org/2003/role/presentationRef
-Publisher SEC
-Name Exchange Act
-Number 240
-Section 12
-Subsection b-2
| Name: |
dei_EntityRegistrantName |
| Namespace Prefix: |
dei_ |
| Data Type: |
xbrli:normalizedStringItemType |
| Balance Type: |
na |
| Period Type: |
duration |
|
| X |
- DefinitionThe Tax Identification Number (TIN), also known as an Employer Identification Number (EIN), is a unique 9-digit value assigned by the IRS. Reference 1: http://www.xbrl.org/2003/role/presentationRef
-Publisher SEC
-Name Exchange Act
-Number 240
-Section 12
-Subsection b-2
| Name: |
dei_EntityTaxIdentificationNumber |
| Namespace Prefix: |
dei_ |
| Data Type: |
dei:employerIdItemType |
| Balance Type: |
na |
| Period Type: |
duration |
|
| X |
- DefinitionLocal phone number for entity.
| Name: |
dei_LocalPhoneNumber |
| Namespace Prefix: |
dei_ |
| Data Type: |
xbrli:normalizedStringItemType |
| Balance Type: |
na |
| Period Type: |
duration |
|
| X |
- DefinitionBoolean flag that is true when the Form 8-K filing is intended to satisfy the filing obligation of the registrant as pre-commencement communications pursuant to Rule 13e-4(c) under the Exchange Act. Reference 1: http://www.xbrl.org/2003/role/presentationRef
-Publisher SEC
-Name Exchange Act
-Number 240
-Section 13e
-Subsection 4c
| Name: |
dei_PreCommencementIssuerTenderOffer |
| Namespace Prefix: |
dei_ |
| Data Type: |
xbrli:booleanItemType |
| Balance Type: |
na |
| Period Type: |
duration |
|
| X |
- DefinitionBoolean flag that is true when the Form 8-K filing is intended to satisfy the filing obligation of the registrant as pre-commencement communications pursuant to Rule 14d-2(b) under the Exchange Act. Reference 1: http://www.xbrl.org/2003/role/presentationRef
-Publisher SEC
-Name Exchange Act
-Number 240
-Section 14d
-Subsection 2b
| Name: |
dei_PreCommencementTenderOffer |
| Namespace Prefix: |
dei_ |
| Data Type: |
xbrli:booleanItemType |
| Balance Type: |
na |
| Period Type: |
duration |
|
| X |
- DefinitionTitle of a 12(b) registered security. Reference 1: http://www.xbrl.org/2003/role/presentationRef
-Publisher SEC
-Name Exchange Act
-Number 240
-Section 12
-Subsection b
| Name: |
dei_Security12bTitle |
| Namespace Prefix: |
dei_ |
| Data Type: |
dei:securityTitleItemType |
| Balance Type: |
na |
| Period Type: |
duration |
|
| X |
- DefinitionName of the Exchange on which a security is registered. Reference 1: http://www.xbrl.org/2003/role/presentationRef
-Publisher SEC
-Name Exchange Act
-Number 240
-Section 12
-Subsection d1-1
| Name: |
dei_SecurityExchangeName |
| Namespace Prefix: |
dei_ |
| Data Type: |
dei:edgarExchangeCodeItemType |
| Balance Type: |
na |
| Period Type: |
duration |
|
| X |
- DefinitionBoolean flag that is true when the Form 8-K filing is intended to satisfy the filing obligation of the registrant as soliciting material pursuant to Rule 14a-12 under the Exchange Act. Reference 1: http://www.xbrl.org/2003/role/presentationRef
-Publisher SEC
-Name Exchange Act
-Section 14a
-Number 240
-Subsection 12
| Name: |
dei_SolicitingMaterial |
| Namespace Prefix: |
dei_ |
| Data Type: |
xbrli:booleanItemType |
| Balance Type: |
na |
| Period Type: |
duration |
|
| X |
- DefinitionTrading symbol of an instrument as listed on an exchange.
| Name: |
dei_TradingSymbol |
| Namespace Prefix: |
dei_ |
| Data Type: |
dei:tradingSymbolItemType |
| Balance Type: |
na |
| Period Type: |
duration |
|
| X |
- DefinitionBoolean flag that is true when the Form 8-K filing is intended to satisfy the filing obligation of the registrant as written communications pursuant to Rule 425 under the Securities Act. Reference 1: http://www.xbrl.org/2003/role/presentationRef
-Publisher SEC
-Name Securities Act
-Number 230
-Section 425
| Name: |
dei_WrittenCommunications |
| Namespace Prefix: |
dei_ |
| Data Type: |
xbrli:booleanItemType |
| Balance Type: |
na |
| Period Type: |
duration |
|
Joint (NASDAQ:JYNT)
Historical Stock Chart
From Apr 2024 to May 2024

Joint (NASDAQ:JYNT)
Historical Stock Chart
From May 2023 to May 2024
