0000827099false--12-31FY20220.0012000000001843704691743704690.0010.00112500001000270000027800518750230000051875023000001250730.130.1300120000600008270992022-01-012022-12-310000827099cpwr:SeriesDPreferredStockThreeMember2022-01-012022-12-310000827099cpwr:SeriesDPreferredStockFourMember2022-01-012022-12-310000827099cpwr:SeriesDPreferredStockFiveMember2022-01-012022-12-310000827099cpwr:CeoMemberus-gaap:SeriesDPreferredStockMember2022-01-012022-12-310000827099cpwr:CeoMemberus-gaap:SeriesDPreferredStockMember2022-12-310000827099cpwr:RelatedPartyNotePayable1Member2021-12-310000827099cpwr:RelatedPartyNotePayable1Member2022-12-310000827099cpwr:CompanyCEOMember2022-01-012022-12-310000827099cpwr:CompanyCEOMember2021-01-012021-12-310000827099cpwr:OneJanuaryTwentyElevenMembercpwr:EmploymentAgreementMembersrt:ChiefExecutiveOfficerMember2022-01-012022-12-310000827099cpwr:ConsultingAgreementMember2018-08-012018-08-140000827099cpwr:ConsultingAgreementMember2022-01-012022-12-310000827099cpwr:TradeBaseSalesIncMember2019-05-012019-05-280000827099cpwr:BrettMRegalMember2019-05-012019-05-2800008270992018-05-302018-07-1900008270992018-08-012018-08-0800008270992018-08-012018-08-2200008270992019-08-012019-08-1500008270992017-06-012017-06-260000827099cpwr:SeriesDPreferredStockTwoMember2021-12-310000827099cpwr:SeriesDPreferredStockOneMember2021-12-310000827099cpwr:SeriesDPreferredStockTwoMember2022-12-310000827099cpwr:SeriesDPreferredStockOneMember2022-12-3100008270992018-05-220000827099cpwr:SeriesDPreferredStockTwoMember2022-01-012022-12-310000827099cpwr:CommonStocksTwoMember2022-01-012022-12-310000827099cpwr:WarrantsMember2022-12-310000827099cpwr:WarrantsMember2020-12-310000827099cpwr:WarrantsMember2021-12-310000827099srt:MaximumMembercpwr:RemeasurementDateMember2021-01-012021-12-310000827099srt:MinimumMembercpwr:RemeasurementDateMember2021-01-012021-12-310000827099srt:MaximumMembercpwr:RemeasurementDateMember2022-01-012022-12-310000827099srt:MinimumMembercpwr:RemeasurementDateMember2022-01-012022-12-310000827099cpwr:RemeasurementDateMember2021-01-012021-12-310000827099cpwr:RemeasurementDateMember2022-01-012022-12-310000827099us-gaap:FairValueInputsLevel3Member2021-12-310000827099us-gaap:FairValueInputsLevel2Member2021-12-310000827099us-gaap:FairValueInputsLevel1Member2021-12-310000827099us-gaap:FairValueInputsLevel3Member2022-12-310000827099us-gaap:FairValueInputsLevel2Member2022-12-310000827099us-gaap:FairValueInputsLevel1Member2022-12-310000827099cpwr:CommonStocksOneMember2021-01-012021-12-310000827099cpwr:CommonStocksOneMember2022-01-012022-12-310000827099us-gaap:SeriesDPreferredStockMember2022-01-012022-12-310000827099cpwr:NotePayableTotalMember2021-12-310000827099cpwr:NotePayableTotalMember2022-12-310000827099cpwr:NotePayableThirtySevenMember2021-12-310000827099cpwr:NotePayableThirtySixMember2021-12-310000827099cpwr:NotePayableThirtyFiveMember2021-12-310000827099cpwr:NotePayableThirtyFourMember2021-12-310000827099cpwr:NotePayableThirtyThreeMember2021-12-310000827099cpwr:NotePayableThirtyTwoMember2021-12-310000827099cpwr:NotePayableThirtyOneMember2021-12-310000827099cpwr:NotePayableThirtyMember2021-12-310000827099cpwr:NotePayableTwentyNineMember2021-12-310000827099cpwr:NotePayableTwentyEightMember2021-12-310000827099cpwr:NotePayableTwentySevenMember2021-12-310000827099cpwr:NotePayableTwentySixMember2021-12-310000827099cpwr:NotePayableTwentyFiveMember2021-12-310000827099cpwr:NotePayableTwentyFourMember2021-12-310000827099cpwr:NotePayableTwentyThreeMember2021-12-310000827099cpwr:NotePayableTwentyTwoMember2021-12-310000827099cpwr:NotePayableTWentyOneMember2021-12-310000827099cpwr:NotePayableTwentyMember2021-12-310000827099cpwr:NotePayableNinteenMember2021-12-310000827099cpwr:NotePayableEighteenMember2021-12-310000827099cpwr:NotePayableSeventeenMember2021-12-310000827099cpwr:NotePayableSixteenMember2021-12-310000827099cpwr:NotePayableFifteenMember2021-12-310000827099cpwr:NotePayableFourteenMember2021-12-310000827099cpwr:NotePayableThirteenMember2021-12-310000827099cpwr:NotePayableTwelveMember2021-12-310000827099cpwr:NotePayableElevenMember2021-12-310000827099cpwr:NotePayableTenMember2021-12-310000827099cpwr:NotePayableNineMember2021-12-310000827099cpwr:NotePayableEightMember2021-12-310000827099cpwr:NotePayableSevenMember2021-12-310000827099cpwr:NotePayableSixMember2021-12-310000827099cpwr:NotePayableFiveMember2021-12-310000827099cpwr:NotePayableFourMember2021-12-310000827099cpwr:NotePayableThreeMember2021-12-310000827099cpwr:NotePayableTwoMember2021-12-310000827099cpwr:NotePayableOneMember2021-12-310000827099cpwr:NotePayableThirtySevenMember2022-12-310000827099cpwr:NotePayableThirtySixMember2022-12-310000827099cpwr:NotePayableThirtyFiveMember2022-12-310000827099cpwr:NotePayableThirtyFourMember2022-12-310000827099cpwr:NotePayableThirtyThreeMember2022-12-310000827099cpwr:NotePayableThirtyTwoMember2022-12-310000827099cpwr:NotePayableThirtyOneMember2022-12-310000827099cpwr:NotePayableThirtyMember2022-12-310000827099cpwr:NotePayableTwentyNineMember2022-12-310000827099cpwr:NotePayableTwentyEightMember2022-12-310000827099cpwr:NotePayableTwentySevenMember2022-12-310000827099cpwr:NotePayableTwentySixMember2022-12-310000827099cpwr:NotePayableTwentyFiveMember2022-12-310000827099cpwr:NotePayableTwentyFourMember2022-12-310000827099cpwr:NotePayableTwentyThreeMember2022-12-310000827099cpwr:NotePayableTwentyTwoMember2022-12-310000827099cpwr:NotePayableTWentyOneMember2022-12-310000827099cpwr:NotePayableTwentyMember2022-12-310000827099cpwr:NotePayableNinteenMember2022-12-310000827099cpwr:NotePayableEighteenMember2022-12-310000827099cpwr:NotePayableSeventeenMember2022-12-310000827099cpwr:NotePayableSixteenMember2022-12-310000827099cpwr:NotePayableFifteenMember2022-12-310000827099cpwr:NotePayableFourteenMember2022-12-310000827099cpwr:NotePayableThirteenMember2022-12-310000827099cpwr:NotePayableTwelveMember2022-12-310000827099cpwr:NotePayableElevenMember2022-12-310000827099cpwr:NotePayableTenMember2022-12-310000827099cpwr:NotePayableNineMember2022-12-310000827099cpwr:NotePayableEightMember2022-12-310000827099cpwr:NotePayableSevenMember2022-12-310000827099cpwr:NotePayableSixMember2022-12-310000827099cpwr:NotePayableFiveMember2022-12-310000827099cpwr:NotePayableFourMember2022-12-310000827099cpwr:NotePayableThreeMember2022-12-310000827099cpwr:NotePayableTwoMember2022-12-310000827099cpwr:NotePayableOneMember2022-12-310000827099cpwr:NotePayableThirtySevenMember2021-01-012021-12-310000827099cpwr:NotePayableThirtySixMember2021-01-012021-12-310000827099cpwr:NotePayableThirtyFiveMember2021-01-012021-12-310000827099cpwr:NotePayableThirtyFourMember2021-01-012021-12-310000827099cpwr:NotePayableThirtyThreeMember2021-01-012021-12-310000827099cpwr:NotePayableThirtyTwoMember2021-01-012021-12-310000827099cpwr:NotePayableThirtyOneMember2021-01-012021-12-310000827099cpwr:NotePayableThirtyMember2021-01-012021-12-310000827099cpwr:NotePayableTwentyNineMember2021-01-012021-12-310000827099cpwr:NotePayableTwentyEightMember2021-01-012021-12-310000827099cpwr:NotePayableTwentySevenMember2021-01-012021-12-310000827099cpwr:NotePayableTwentySixMember2021-01-012021-12-310000827099cpwr:NotePayableTwentyFiveMember2021-01-012021-12-310000827099cpwr:NotePayableTwentyFourMember2021-01-012021-12-310000827099cpwr:NotePayableTwentyThreeMember2021-01-012021-12-310000827099cpwr:NotePayableTwentyTwoMember2021-01-012021-12-310000827099cpwr:NotePayableTWentyOneMember2021-01-012021-12-310000827099cpwr:NotePayableTwentyMember2021-01-012021-12-310000827099cpwr:NotePayableNinteenMember2021-01-012021-12-310000827099cpwr:NotePayableEighteenMember2021-01-012021-12-310000827099cpwr:NotePayableSeventeenMember2021-01-012021-12-310000827099cpwr:NotePayableSixteenMember2021-01-012021-12-310000827099cpwr:NotePayableFifteenMember2021-01-012021-12-310000827099cpwr:NotePayableFourteenMember2021-01-012021-12-310000827099cpwr:NotePayableThirteenMember2021-01-012021-12-310000827099cpwr:NotePayableTwelveMember2021-01-012021-12-310000827099cpwr:NotePayableElevenMember2021-01-012021-12-310000827099cpwr:NotePayableTenMember2021-01-012021-12-310000827099cpwr:NotePayableNineMember2021-01-012021-12-310000827099cpwr:NotePayableEightMember2021-01-012021-12-310000827099cpwr:NotePayableSevenMember2021-01-012021-12-310000827099cpwr:NotePayableSixMember2021-01-012021-12-310000827099cpwr:NotePayableFiveMember2021-01-012021-12-310000827099cpwr:NotePayableFourMember2021-01-012021-12-310000827099cpwr:NotePayableThreeMember2021-01-012021-12-310000827099cpwr:NotePayableTwoMember2021-01-012021-12-310000827099cpwr:NotePayableOneMember2021-01-012021-12-310000827099cpwr:NotePayableThirtySevenMember2022-01-012022-12-310000827099cpwr:NotePayableThirtySixMember2022-01-012022-12-310000827099cpwr:NotePayableThirtyFiveMember2022-01-012022-12-310000827099cpwr:NotePayableThirtyFourMember2022-01-012022-12-310000827099cpwr:NotePayableThirtyThreeMember2022-01-012022-12-310000827099cpwr:NotePayableThirtyTwoMember2022-01-012022-12-310000827099cpwr:NotePayableThirtyOneMember2022-01-012022-12-310000827099cpwr:NotePayableThirtyMember2022-01-012022-12-310000827099cpwr:NotePayableTwentyNineMember2022-01-012022-12-310000827099cpwr:NotePayableTwentyEightMember2022-01-012022-12-310000827099cpwr:NotePayableTwentySevenMember2022-01-012022-12-310000827099cpwr:NotePayableTwentySixMember2022-01-012022-12-310000827099cpwr:NotePayableTwentyFiveMember2022-01-012022-12-310000827099cpwr:NotePayableTwentyFourMember2022-01-012022-12-310000827099cpwr:NotePayableTwentyThreeMember2022-01-012022-12-310000827099cpwr:NotePayableTwentyTwoMember2022-01-012022-12-310000827099cpwr:NotePayableTWentyOneMember2022-01-012022-12-310000827099cpwr:NotePayableTwentyMember2022-01-012022-12-310000827099cpwr:NotePayableNinteenMember2022-01-012022-12-310000827099cpwr:NotePayableEighteenMember2022-01-012022-12-310000827099cpwr:NotePayableSeventeenMember2022-01-012022-12-310000827099cpwr:NotePayableSixteenMember2022-01-012022-12-310000827099cpwr:NotePayableFifteenMember2022-01-012022-12-310000827099cpwr:NotePayableFourteenMember2022-01-012022-12-310000827099cpwr:NotePayableThirteenMember2022-01-012022-12-310000827099cpwr:NotePayableTwelveMember2022-01-012022-12-310000827099cpwr:NotePayableElevenMember2022-01-012022-12-310000827099cpwr:NotePayableTenMember2022-01-012022-12-310000827099cpwr:NotePayableNineMember2022-01-012022-12-310000827099cpwr:NotePayableEightMember2022-01-012022-12-310000827099cpwr:NotePayableSevenMember2022-01-012022-12-310000827099cpwr:NotePayableSixMember2022-01-012022-12-310000827099cpwr:NotePayableFiveMember2022-01-012022-12-310000827099cpwr:NotePayableFourMember2022-01-012022-12-310000827099cpwr:NotePayableThreeMember2022-01-012022-12-310000827099cpwr:NotePayableTwoMember2022-01-012022-12-310000827099cpwr:NotePayableOneMember2022-01-012022-12-3100008270992022-03-110000827099cpwr:MRFeakinsMember2022-01-012022-12-310000827099cpwr:MRFeakinsMember2022-12-310000827099us-gaap:ConvertiblePreferredStockMember2022-01-012022-12-310000827099us-gaap:ConvertiblePreferredStockMember2021-01-012021-12-310000827099us-gaap:ConvertibleNotesPayableMember2022-01-012022-12-310000827099cpwr:WarrantsMember2022-01-012022-12-310000827099us-gaap:ConvertibleNotesPayableMember2021-01-012021-12-310000827099cpwr:WarrantsMember2021-01-012021-12-310000827099cpwr:OCEESInternationalMember2022-01-012022-12-310000827099cpwr:OceanThermalEnergyBahamasLtdMember2022-01-012022-12-310000827099cpwr:OTEBMMember2022-01-012022-12-310000827099us-gaap:RetainedEarningsMember2022-12-310000827099us-gaap:AdditionalPaidInCapitalMember2022-12-310000827099us-gaap:CommonStockMember2022-12-310000827099us-gaap:PreferredStockMember2022-12-310000827099us-gaap:RetainedEarningsMember2022-01-012022-12-310000827099us-gaap:AdditionalPaidInCapitalMember2022-01-012022-12-310000827099us-gaap:CommonStockMember2022-01-012022-12-310000827099us-gaap:PreferredStockMember2022-01-012022-12-310000827099us-gaap:RetainedEarningsMember2021-12-310000827099us-gaap:AdditionalPaidInCapitalMember2021-12-310000827099us-gaap:CommonStockMember2021-12-310000827099us-gaap:PreferredStockMember2021-12-310000827099us-gaap:RetainedEarningsMember2021-01-012021-12-310000827099us-gaap:AdditionalPaidInCapitalMember2021-01-012021-12-310000827099us-gaap:CommonStockMember2021-01-012021-12-310000827099us-gaap:PreferredStockMember2021-01-012021-12-3100008270992020-12-310000827099us-gaap:RetainedEarningsMember2020-12-310000827099us-gaap:AdditionalPaidInCapitalMember2020-12-310000827099us-gaap:CommonStockMember2020-12-310000827099us-gaap:PreferredStockMember2020-12-3100008270992021-01-012021-12-310000827099us-gaap:SeriesDPreferredStockMember2021-12-310000827099us-gaap:SeriesDPreferredStockMember2022-12-310000827099us-gaap:SeriesCPreferredStockMember2021-12-310000827099us-gaap:SeriesCPreferredStockMember2022-12-310000827099us-gaap:SeriesBPreferredStockMember2021-12-310000827099us-gaap:SeriesBPreferredStockMember2022-12-3100008270992021-12-3100008270992022-12-3100008270992023-08-18iso4217:USDxbrli:sharesiso4217:USDxbrli:sharesxbrli:pure
UNITED STATES
SECURITIES AND EXCHANGE COMMISSION
Washington, D.C. 20549
FORM 10-K
(Mark One)
☒ | ANNUAL REPORT PURSUANT TO SECTION 13 OR 15(d) OF THE SECURITIES EXCHANGE ACT OF 1934 |
For the fiscal year ended December 31, 2022
or
☐ | TRANSITION REPORT PURSUANT TO SECTION 13 OR 15(d) OF THE SECURITIES EXCHANGE ACT OF 1934 |
For the transition period from _____________ to ___________________
Commission File No. 033-19411-C
OCEAN THERMAL ENERGY CORPORATION |
(Exact name of registrant as specified in its charter) |
Nevada | | 20-5081381 |
(State or other jurisdiction of incorporation or organization) | | (I.R.S. Employer Identification No.) |
3675 Market Street, Suite 200, Philadelphia PA 19104
(Address of principal executive offices, including Zip Code)
717-299-1344
(Registrant’s telephone number, including area code)
Securities Registered pursuant to Section 12(b) of the Exchange Act:
Title of Class | | Trading Symbol | | Name of Each Exchange on Which Registered |
N/A | | N/A | | N/A |
Securities Registered pursuant to Section 12(g) of the Exchange Act: None
Indicate by check mark if the registrant is a well-known seasoned issuer, as defined in Rule 405 of the Securities Act. Yes ☐ No ☒
Indicate by check mark if the registrant is not required to file reports pursuant to Section 13 or 15(d) of the Act. Yes ☐ No ☒
Indicate by check mark whether the registrant (1) has filed all reports required to be filed by Section 13 or 15(d) of the Securities Exchange Act of 1934 during the preceding 12 months (or for such shorter period that the registrant was required to file such reports), and (2) has been subject to such filing requirements for the past 90 days. Yes ☐ No ☒
Indicate by check mark whether the registrant has submitted electronically every Interactive Data File required to be submitted pursuant to Rule 405 of Regulation S-T (§ 232.405 of this chapter) during the preceding 12 months (or for such shorter period that the registrant was required to submit and post such files). Yes ☐ No ☒
Indicate by check mark whether the registrant is a large accelerated filer, an accelerated filer, a non-accelerated filer, a smaller reporting company, or an emerging growth company. See the definitions of “large accelerated filer,” “accelerated filer,” “smaller reporting company,” and “emerging growth company” in Rule 12b-2 of the Exchange Act.
Large accelerated filer | ☐ | Accelerated filer | ☐ |
Non-accelerated filer | ☒ | Smaller reporting company | ☒ |
Emerging growth company | ☐ | | |
If an emerging growth company, indicate by check mark if the registrant has elected not to use the extended transition period for complying with any new or revised financial accounting standards provided pursuant to Section 13(a) of the Exchange Act. ☐
Indicate by check mark whether the registrant has filed a report on and attestation to its management’s assessment of the effectiveness of its internal control over financial reporting under Section 404(b) of the Sarbanes-Oxley Act (15 U.S.C. 7262(b)) by the registered public accounting firm that prepared or issued its audit report. ☐
If securities are registered pursuant to Section 12(b) of the Act, indicate by check mark whether the financial statements of the registrant included in the filing reflect the correction of an error to previously issued financial statements. ☐
Indicate by check mark whether any of those error corrections are restatements that required a recovery analysis of incentive-based compensation received by any of the registrant’s executive officers during the relevant recovery period pursuant to § 240.10D-1(b). ☐
Indicate by check mark whether the registrant is a shell company (as defined in Rule 12b-2 of the Act). Yes ☐ No ☒
State the aggregate market value of the voting and non-voting common equity held by non-affiliates computed by reference to the price at which the common equity was last sold, or the average bid and asked price of such common equity, as of the last business day of the registrant’s most recently completed second fiscal quarter. The aggregate market value of the voting and nonvoting common equity held by nonaffiliates computed as of the price at which the common equity was last sold on the last business day of the registrant’s most recently completed second fiscal quarter was $1,692,066.
Indicate the number of shares outstanding of each of the registrant’s classes of common stock, as of the latest practicable date. As of August 18, 2023, there were 184,370,469 shares of the registrant’s common stock outstanding, par value $0.001.
DOCUMENTS INCORPORATED BY REFERENCE: None
TABLE OF CONTENTS
Throughout this report, unless otherwise designated, the terms “we,” “us,” “our,” and “our company” refer to Ocean Thermal Energy Corporation, a Nevada corporation, and our subsidiaries. All amounts in this report are in U.S. dollars, unless otherwise indicated.
CAUTIONARY STATEMENT ON FORWARD-LOOKING STATEMENTS
This report may contain certain “forward-looking” statements as such term is defined by the U.S. Securities and Exchange Commission (“SEC”) in its rules, regulations, and releases, which represent our expectations or beliefs, including statements concerning our operations, economic performance, financial condition, growth and acquisition strategies, investments, and future operational plans. For this purpose, any statements contained herein that are not statements of historical fact may be deemed to be forward-looking statements. Without limiting the generality of the foregoing, words such as “may,” “expect,” “believe,” “anticipate,” “intend,” “could,” “estimate,” “might,” “plan,” “propose,” “predict,” or “should,” or the negative or other variations thereof or comparable terminology, are intended to identify forward-looking statements. These statements by their nature involve substantial risks and uncertainties, certain of which are beyond our control, and actual results may differ materially depending on a variety of important factors, including uncertainty related to acquisitions, governmental regulation, management and maintenance of growth, the operations of the company and its subsidiaries, volatility of stock price, commercial viability of OTEC systems, and any other factors discussed in this and our other filings with the SEC.
These risks, uncertainties, and other factors include those set forth under “Risk Factors” of this report. Given these risks and uncertainties, readers are cautioned not to place undue reliance on our forward-looking statements. All subsequent written and oral forward-looking statements attributable to us or to persons acting on our behalf are expressly qualified in their entirety by these cautionary statements. Except as otherwise required by applicable law, we undertake no obligation to publicly update or revise any forward-looking statements or the risk factors described in this report or in the documents we incorporate by reference, whether as a result of new information, future events, changed circumstances, or any other reason after the date of this report.
This report contains forward-looking statements, including statements regarding, among other things:
| · | the significant international political and economic disruption caused by Russia’s military invasion of Ukraine; |
| | |
| · | our ability to continue as a going concern; |
| | |
| · | our anticipated needs for working capital; |
| | |
| · | our ability to secure financing; |
| | |
| · | the possibility that actual capital costs, operating costs, production, and economic returns may differ significantly from those that we have anticipated; |
| | |
| · | the financial model for our proposed projects has not been tested and may not be successful; |
| | |
| · | changing attitudes about environmental risks; |
| | |
| · | substantial regulation of our projects; |
| | |
| · | financial, technical, managerial, and sales risks that may make us unsuccessful; |
| | |
| · | our exposure to political and legal risks in developing or emerging markets where we propose to locate our plants; |
| | |
| · | technological advances that may render our technologies obsolete; and |
| | |
| · | operational problems, natural events or catastrophes, casualty loss, or other events that may impair the commercial operation of our projects. |
The forward-looking information is based on present circumstances and on our predictions respecting events that have not occurred, that may not occur, or that may occur with different consequences from those now assumed or anticipated. Actual events or results may differ materially from those discussed in forward-looking statements because of various factors, including the risks outlined under “Risk Factors,” and matters described in this report generally. The forward-looking statements included in this report are made only as of the date of this report.
PART I
ITEM 1. BUSINESS
Overview
We use our proprietary technology to develop designs for renewable energy systems, primarily for Ocean Thermal Energy Conversion (“OTEC”), Seawater Air Conditioning (“SWAC”), and Lake Source Cooling (“LSC”) systems. Our geographical markets are tropical and subtropical regions of the world for OTEC, SWAC, and LSC and worldwide markets for SWAC and LSC. We develop projects for renewable power generation, desalinated water production, and air conditioning using our proprietary technologies designed to extract energy from the temperature differences between warm surface water and cold deep water. In addition, our projects provide ancillary products such as potable/bottle water and high-profit aquaculture, mariculture, and agriculture opportunities.
Agreement to Sell Subsidiary
On August 25, 2022, we entered into a Stock Purchase Agreement to sell OCEES International, Inc., our wholly owned subsidiary (“OCEES”), to Epaphus Global Energy, LLC (“Epaphus”). Epaphus is controlled by Jeremy Feakins, our Chief Executive Officer and a director. The transaction was approved unanimously by our directors who do not have an interest in the transaction.
In exchange for the sale of OCEES, we will receive:
| · | $1,000,000 in the form of canceled amounts owed by us to certain individuals, including Mr. Feakins, who have assigned their right to receive those payments to Epaphus; |
| · | $75,000 in cash per month for 12 months following the date of the purchase agreement; and |
| · | 70% of the net profit of any currently contemplated project to build an ocean thermal energy conversion power plant entered into by OCEES. |
Under the terms of the purchase agreement, Epaphus has the unilateral right to return OCEES to us and receive a full refund of all portions of the purchase price paid as of the return of OCEES at any time for one year following the date of the purchase agreement.
The transaction had not closed as of December 31, 2022, nor through the date of filing of this report. The transaction has not been reflected in our financial statements at December 31, 2022.
Our Business
We develop projects for renewable power generation, desalinated water production, and air conditioning using proprietary intellectual property designed and developed by our own experienced oceanographers, engineers, and marine scientists. Plants using our technologies are designed to extract energy from the temperature difference between warm surface ocean water and cold deep seawater at a depth of approximately 3,000 feet. We believe these technologies provide practical solutions to the fundamental human needs for sustainable, affordable energy; desalinated water for domestic, agricultural, and aquaculture uses; and cooling, all without the use of fossil fuels.
| ● | Ocean Thermal Electrical Conversion, known in the industry as “OTEC,” power plants are designed to produce electricity. In addition, some of the seawater running through an OTEC plant can be desalinated efficiently, producing fresh water for agriculture and human consumption. |
| ● | Seawater Air Conditioning, known in its industry as SWAC, plants are designed to use cold water from ocean depths to provide air conditioning for large commercial buildings or other facilities. This same technology can also use deep cold water from lakes, known as Lake Source Cooling or LSC. |
Both OTEC and SWAC/LSC systems can be engineered to produce desalinated water for potable, agricultural, and fish farming/aquaculture uses.
Many applications of technologies based on ocean temperature differences between surface and deep seawater have been developed at the Natural Energy Laboratory of Hawaii Authority, or NELHA, test facility (http://nelha.hawaii.gov), including applications for desalinated seawater, fish-farming, and agriculture. Note: All URL addresses in this report are inactive textual references only. We believe our proprietary advances to existing technologies developed by others in the industry enhance their commercialization for the plants we propose to develop.
We have recruited a scientific and engineering team that includes oceanographers, engineers, and marine scientists who have worked for a variety of organizations since the 1970s on several systems based on extracting the energy from the temperature differences between surface and deep seawater, including projects by NELHA, the Argonne National Laboratory (http://www.anl.gov), and others. Our executive team members have complementary experience in leading engineering and technical companies and projects from start-up to commercialization.
We expect to use our technology to develop an OTEC EcoVillage, which should add significant value to our business. We plan to facilitate the development of sustainable living communities by creating an ecologically sustainable “OTEC EcoVillage” powered by 100% fossil-fuel free electricity. In the development, buildings will be cooled by energy-efficient and chemical-free systems, and water for drinking, aquaculture, and agriculture will be produced onsite. The OTEC EcoVillage project consists, in part, of an OTEC plant that will provide all power and water to about 400 residences, a hotel, and a shopping center, as well as models of sustainable agriculture, food production, and other economic developments. Each sale of luxury EcoVillage residences will support the development of environmentally responsible affordable communities currently in development in tropical and subtropical regions of the world. We believe our OTEC EcoVillage will be the first development in the world offering a net-zero carbon footprint. This will be our pilot project, launched to prove the viability of OTEC technology to provide affordable renewable energy for entire communities. We believe this project could be highly profitable and generate significant value for our shareholders.
Through our Small Business Innovation Research credentials, we continue to discuss opportunities to design, build, own, and operate an OTEC system producing base-load sustainable electricity and desalinated water without using fossil fuels to do so. Our discussions have included OTEC designs for a Naval Support Facility in the Indian Ocean and military bases in tropical regions.
Our Vision
Our vision is to bring our technologies to tropical and subtropical regions of the world where about three billion people live. Our market includes 68 countries and 29 territories with suitable sea depth, shore configuration, and market need; we plan to be the first company in the world to design and build a commercial-scale OTEC plant and, to that end, have several projects in the planning stages. Our initial markets and potential projects include several U.S. Department of Defense bases situated in the Asia Pacific and other regions where energy independence is crucial. Currently, we have projects in the planning and development stages in Puerto Rico and the U.S. Virgin Islands.
Our Technology
OTEC is a self-sustaining energy source, with no supplemental power required to generate continuous (24/7) electricity. It works by converting heat from the sun, which has warmed ocean surface water, into electric power, and then completing the process by cooling the plant with cold water from deep in the ocean. The cold water can also be used for very efficient air conditioning and desalinated to produce fresh water. OTEC has worked in test settings where there exists a natural temperature gradient of 20 degrees Celsius or greater in the ocean. We believe OTEC can deliver sustainable electricity in tropical and subtropical regions of the world at rates approximately 20-40% lower than typical costs for electricity produced by fossil fuels in those markets.
Further, we believe that a small, commercial OTEC plant could offer competitive returns even in a market where the cost of electricity is as low as $0.30 per kilowatt-hour, or kWh. The Caribbean depends on imported oil for approximately 90% of its energy needs. The electricity prices in the Caribbean are extremely high, with an average of $0.34 per kWh and as high as $0.50 per kWh, which is nearly four times the price paid in the United States, according to a 2017 renewable energy report, when oil prices were lower. For the U.S. Virgin Islands, the Water and Power Authority of the Virgin Islands reported that as of February 1, 2020, the average price for electricity for commercial customers was nearly $0.47 per kWh. We believe that we have an opportunity to offer base-load energy (the amount of energy required to meet minimum requirements) pricing that is better than our customer’s next best alternative in the markets where electricity costs are $0.30 or more per kWh.
Technology advancements have significantly reduced the capital costs of OTEC to make it competitive compared to traditional energy sources. Technology improvements include larger diameter seawater pipes manufactured with improved materials, increased pumping capabilities from OTEC depths, better understanding of material requirements in the deep ocean environment, more experience in deep water pipeline and cable installation techniques, and more accurate sea bottom mapping technology, which is required for platform positioning and pipe installation. The cold-water pipes at a demonstration site in Hawaii have been in continuous operation for more than 20 years, and the technology has improved significantly since the Hawaiian installation.
We estimate that a small OTEC plant that delivers 13 megawatts (MWs) per hour would currently cost approximately $250 million. This is the plant size that we typically propose for our initial target markets to meet 20% or more of their current demand for electricity and a large portion of their need for fresh drinking water and agricultural water. OTEC has been proven in test settings at NELHA, where a Department of Energy-sponsored OTEC plant operated successfully throughout the 1990s to produce continuous, affordable electricity from the sea without the use of fossil fuels. Spin-off technologies of desalination and seawater cooling, developed from the OTEC plant at NELHA, have also become economically and technically feasible.
Finally, we believe the decreasing supply and increasing cost of fossil-fuel-based energy has intensified the search for renewable alternatives. We further believe that renewable energy sources, although traditionally more expensive than comparable fossil-fuel plants, have many advantages, including increased national energy security, decreased carbon emissions, and compliance with renewable energy mandates and air quality regulations. We believe these market forces will continue and potentially increase. In remote islands where shipping costs and limited economies of scale substantially increase fossil-fuel-based energy, renewable energy sources may be attractive. Many islands contain strategic military bases with high-energy demands that we believe would greatly benefit from a less expensive, reliable source of energy that is produced locally, such as OTEC.
SWAC//LSC is a process that uses cold water from locations such as the ocean or deep lakes to provide the cooling capacity to replace traditional electrical chillers in an air conditioning system. SWAC/LSC applications can reduce the energy consumption of a traditional air-conditioning system by as much as 90%. Even when the capital cost amortization of building a typically sized SWAC/LSC system providing 9,800 tons of cooling ($140-$150 million) are taken into account, SWAC/LSC can save the customer approximately 25-40% when compared to conventional systems—we estimate savings can be as high as 50% in locations where air temperatures and electricity costs are high. Cooling systems using seawater or groundwater for large commercial structures are in use at numerous locations developed and operated by others worldwide, including Heathrow Airport, UK; Finland (Google Data Center); Cornell University, NY; Stockholm, Sweden; and the City of Toronto, Canada.
How Our Technology Works
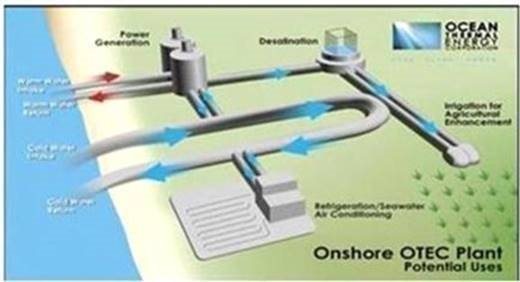
OTEC uses the natural temperature difference between cooler deep ocean water at a depth of approximately 3,000 feet and warmer shallow or surface water to create energy. An OTEC plant project involves installing about 6.0 feet diameter, deep-ocean intake pipes (which can readily be purchased), together with surface water pipes, to bring seawater onshore. OTEC uses a heat pump cycle to generate power. In this application, an array of heat exchangers transfers the warm ocean surface water as an energy source to vaporize a liquid in a closed loop, driving a turbine, which in turn drives a generator to produce electricity. The cold deep ocean water provides the required temperature to condense vapor back into a liquid, thus completing the thermodynamic cycle, which is constantly and continuously repeated. The working fluid is typically ammonia, as it has a low boiling point. Its high hydrogen density makes ammonia a very promising green energy storage and distribution media. Among practical fuels, ammonia has the highest hydrogen density, including hydrogen itself, in either its low temperature, or cryogenic, and compressed forms. Moreover, since the ammonia molecule is free of carbon atoms (unlike many other practical fuels), combustion of ammonia does not result in any carbon dioxide emissions. The fact that ammonia is already a widely produced and used commodity with well-established distribution and handling procedures allows for its use as an alternative fuel. This same general principle is used in steam turbines, internal combustion engines, and, in reverse, refrigerators. Rather than using heat energy from the burning of fossil fuels, OTEC power draws on temperature differences of the ocean caused by the sun’s warming of the ocean’s surface, providing an unlimited and free source of energy.
OTEC and SWAC/LSC infrastructure offers a modular design that facilitates adding components to satisfy customer requirements and access to a sufficient supply of cold water. These components include reverse-osmosis desalination plants to produce drinkable water, bottling plants to commercialize the drinkable water, and off-take solutions for aquaculture uses (such as fish farms), which benefit from the enhanced nutrient content of deep ocean water. A further advantage of a modular design is that, depending on the patterns of electricity demand and output of the OTEC plant, a desalination plant can be run using the excess electricity capacity.
Currently, OTEC requires a minimum temperature difference of approximately 20 degrees Celsius to operate, with each degree greater than this increasing output by approximately 10-15%. OTEC has potential applications in tropical and subtropical zones and is particularly well suited for tropical islands and coastal areas with proximate access to both cold deep water and warm surface water. These communities are typically subject to high and fluctuating energy costs ranging from $0.28-$0.75 per kWh, as they rely on importing fossil fuels for power generation. Data from the National Renewable Energy Laboratory of the U.S. Department of Energy website indicated that at least 68 countries and 29 territories around the globe appear to meet these criteria.
The world’s largest OTEC power plant to date is operational at the NELHA facility in Hawaii and has been connected to the electrical grid. It provides base-load electricity produced by OTEC to residential homes. Around the world, a couple of other successful developmental and experimental plants have been built, and the U.S. National Oceanic and Atmospheric Administration, or NOAA, has stated that: “The qualitative analysis of the technical readiness of OTEC by experts at this workshop suggest that a <10 MWe floating, closed-cycle OTEC facility is technically feasible using current design, manufacturing, deployment techniques and materials” (https://coast.noaa.gov/data/czm/media/otec_nov09_tech.pdf). We believe that we have sufficient skill and knowledge to now commercialize 5-MW to 30-MW land-based OTEC plants, using off-the-shelf components, including the cold-water piping.
SWAC/LSC is a significantly more cost-effective and environmentally friendly way to implement air-conditioning using cold water sourced from lakes or, analogous with OTEC, deep ocean water, rather than from an electric chiller. Comparing Federal Energy Management Program engineering efficiency requirements of approximately 0.94 kilowatts of electricity per ton of cooling capacity with our own engineering estimates of 0.09 kilowatts of electricity per ton of cooling capacity, as calculated by DCO Energy, our engineering, procurement, and construction partner, we estimate that SWAC/LSC systems can reduce electricity consumption by up to 80-90% over conventional systems. Therefore, we believe energy reductions may make SWAC/LSC systems well-suited for large structures, such as office complexes, medical centers, resorts, data centers, airports, and shopping malls. We believe that other SWAC/LSC plants we may develop will likely achieve similar efficiencies. There are examples of proven successful SWAC/LSC systems in use, including a large 79,000-ton system used to cool buildings in the downtown area of the City of Toronto, Canada; a SWAC system in Google’s data center in Finland that uses waters from the Baltic Sea to keep servers cool; and a system with more than 18,000 tons of cooling in operation at Cornell University, Ithaca, New York. On January 10, 2018, William S. (Lanny) Joyce joined our board of advisors. Mr. Joyce was the Director of Utilities and Energy Management in the Energy and Sustainability Department at Cornell University, Ithaca, New York. Mr. Joyce initiated and was project manager for innovative and award-winning Cornell University LSC project completed in 2000 that provides all the chilled water production on the central campus utilizing a renewable resource and 86% less energy.
OTEC Versus Other Energy Sources
The construction costs of power plants using any technology are much higher in remote locations, such as tropical islands, than on the mainland of the United States, principally due to the need to transport materials, components, and other construction supplies and labor not available locally. There are also considerations that make those other technologies less attractive in those areas. We believe the consistency of OTEC during its life provides clear advantages over other power-generation technology in the tropical and subtropical markets, because its base-load power (available at all times and not subject to fluctuations throughout the day) is an important asset to the small transmission grid, which is typical in these regions.
Combined-cycle natural gas plants typically need to be capable of generating several hundred MWs to attain the lower-cost, per-kilowatt installed values that make the plant economically feasible. Tropical locations do not have large enough grids and market demand to make that plant size reasonable. Further, tropical locations frequently do not have domestic fuel supplies, requiring fuel to be imported. In order to import natural gas, it must be liquefied for shipment and then vaporized at the location. There are initial cost and public safety concerns with such facilities. In addition, gas-fired plants emit undesirable nitrogen oxide, carbon dioxide, and volatile organic compounds.
Solar applications continue to increase as the cost and effectiveness of photovoltaic panels improve. However, we estimate that the cost to install solar panels in tropical regions remains high. Beyond the issues with shipping and labor costs that all construction must overcome, the design and building code requirements are tougher in storm-prone areas, which are subject to potential wind damage from hurricanes, earthquakes, and typhoons, than are typically encountered in mainland nontropical installations. Support structures must be more substantial in order to hold the solar panels in place in case of hurricane-force winds. Solar power, like wind power, places substantial stress on an electrical grid. Since the input of both of these sources is subject to weather conditions, they cannot be considered reliable suppliers of power, and back-up capacity is necessary. Further, instantaneous changes in output due to sporadic cloud cover create transient power flow to the grid and difficulties in maintaining proper voltages and stability. OTEC is a stabilizing source to the grid, providing constant and predictable power, and has no emissions. The ability of OTEC to provide constant, continuous power is a large benefit as compared to any of the other renewable options available.
Our estimated price for OTEC-generated power of approximately $0.30 per kWh under current economic conditions, which can be as low as $0.18 net per kWh with maximum efficiency and revenue from water production, is also constant both throughout the year and over a plant’s life. OTEC’s power price, determined almost entirely by the amortization of its initial cost, is a protection against inflation and rising interest rates, which greatly affect coal and oil. Customers in our target markets currently pay from $0.35 to as high as $0.60 per kWh for power from coal and oil-fueled power plants. However, imported fuels are subject to price volatility, which has a direct impact on the cost of electricity and adds operating risk during the life of a plant. The fuel handling to allow for the shipping, storage, and local transport is expensive, a potential source of damaging fuel spills and a basis for environmental concerns. Fossil-fuel plants create pollution, emit carbon dioxide, and are visually unappealing, which is of particular concern in tropical areas renowned for their clear, pristine air and beauty. We project OTEC can save these markets up to 40%, compared to their current electrical costs, and when revenues from fresh drinking water, aquaculture, and agriculture production are considered, the justification is even more compelling.
Overview of the Market and the Feasibility of OTEC in Current Market Conditions
We believe that OTEC is now an economically, technologically, and environmentally competitive power source, especially for developing or emerging countries in certain tropical and subtropical regions contiguous to oceans. Our natural target markets are communities in countries around the Caribbean, Asia, and the Pacific. These locations are typically characterized by limited infrastructure, high-energy costs, mostly imported or expensively generated electricity, and frequently with significant fresh water and food shortages. These are serious limitations on economic development, which we believe our OTEC technology can address.
Data presented to the Sustainable Use of Oceans in the Context of the Green Economy and the Eradication of Poverty workshop in Monaco in 2011 by Whitney Blanchard of the Office of Ocean and Coastal Resource Management, National Oceanic and Atmospheric Administration, show that at least 98 nations and territories using an estimated five terawatts of potential OTEC net power are candidates for OTEC-power systems. Blanchard specifically notes that Hawaii, Guam, Florida, Puerto Rico, and the U.S. Virgin Islands are suitable for OTEC.
Over the past 15 years, there have been substantial changes in many areas that have now made the commercialization of OTEC a reality, influenced by the increasing price of oil, which until 2006/2007 had been relatively inexpensive.
Recent oil prices have been volatile, owing in part to political instability in Eastern Europe and elsewhere. Crude oil prices increased in 2021 as increasing COVID-19 vaccination rates, loosening pandemic-related restrictions, and recovering economies resulted in global petroleum demand rising faster than petroleum supply. The spot price of Brent crude oil, a global benchmark, started the 2021 year at $50 per barrel and increased to a high of $86 per barrel in late October before declining in the final weeks of the year. As a result of the conflict in Eastern Europe, oil prices were up 30% in February 2022, with oil prices hitting a high of about $130 per barrel before settling in the $100 range in mid-March 2022. As of July 2023, oil is quoted at more than $80.00 per barrel.
Facts like these have resulted in increased attention and interest in OTEC in the commercial sector and among candidates. With OTEC power, customers can decouple the price of electricity from the price of oil.
The International Energy Agency’s World Energy Outlook expects liquid natural gas export capacity to grow rapidly in the short term, with major new sources of supply coming mostly from Australia and the United States.
Liquid natural gas prices have collapsed, in part because demand is turning out to be weaker than some previously anticipated. Additionally, many rules and regulations are in effect to mitigate the environmental issues associated with liquid natural gas extraction, transportation, and storage, adding significant costs.
According to the U.S. Environmental Protection Agency, in the United States, nearly 29% of 2017 greenhouse gas emissions was generated primarily from burning fossil fuel for our cars, trucks, ships, trains, and planes. Over 90% of the fuel used for transportation is petroleum-based, which includes gasoline and diesel. The electric power sector accounted for 28% of total greenhouse gas emissions in 2017.
According to the U.S. Environmental Protection Agency: “Global carbon emissions from fossil fuels have significantly increased since 1900. Since 1970, CO2 emissions have increased by about 90%, with emissions from fossil fuel combustion and industrial processes contributing about 78% of the total greenhouse gas emissions increase from 1970 to 2011. Agriculture, deforestation, and other land-use changes have been the second-largest contributors.”
Greenhouse gas emissions from electricity have increased between 1990 and 2007 as electricity demand grew and fossil fuels remained the dominant source for generations. Fossil-fuel-fired power plants are a significant source of domestic carbon dioxide emissions, the primary cause of global warming. To generate electricity, fossil-fuel-fired power plants use natural gas, petroleum, coal, or any form of solid, liquid, or gaseous fuel derived from such materials. Along with the increasing use of renewable energy, the greenhouse emissions from power generation have decreased since 2007, approaching the 1990 levels.
The U.S. Energy Information Administration (“EIA”) states that renewable energy plays an important role in reducing greenhouse gas emissions. Energy consumption of biofuels, geothermal energy, solar energy, and wind energy in the United States has increased. Total U.S. renewable energy production and consumption reached record highs in 2020. In 2020, renewable energy provided about 11.59 quadrillion British thermal units (Btu)—1 quadrillion is the number 1 followed by 15 zeros—equal to 12% of total U.S. energy consumption. The electric power sector accounted for about 60% of total U.S. renewable energy consumption in 2020 and about 20% of total U.S. electricity generation was from renewable energy sources.
According to the EIA, renewable energy can play an important role in U.S. energy security and in reducing greenhouse gas emissions. Using renewable energy can help to reduce energy imports and reduce fossil fuel use, which is the largest source of U.S. carbon dioxide emissions. In the Annual Energy Outlook 2021 reference case, EIA projects that U.S. renewable energy consumption will continue to increase through 2050. The reference case generally assumes that current laws and regulations that affect the energy sector, including laws that have end dates, remain unchanged throughout the projection period.
Interest in renewable energy from the U.S. military, especially the U.S. Army, has increased as articulated by Secretary of the Army Christine E. Wormuth in the 2022 United States Army Climate Strategy:
As the Army optimizes the use of fuel, water, electricity, and other resources, we increase our resilience while saving taxpayer dollars and reducing our impact on the planet. The Army will mitigate and adapt to climate change, and in doing so gain a strategic advantage, especially as we continue to outpace our near-peer competitors.
The President’s purpose in Executive Order 14008 clearly stated the need to combat climate change:
It is the policy of my Administration to lead the Nation’s effort to combat the climate crisis by example—specifically, by aligning the management of Federal procurement and real property, public lands and waters, and financial programs to support robust climate action. By providing an immediate, clear, and stable source of product demand, increased transparency and data, and robust standards for the market, my Administration will help to catalyze private sector investment into, and accelerate the advancement of America’s industrial capacity to supply, domestic clean energy, buildings, vehicles, and other necessary products and materials.
People in many countries today, including the United States, are concerned with environmental issues caused by fossil-fuel-generated power. Gallup surveys find public acceptance of climate change is rising. Close to two-thirds of U.S. adults are concerned about global warming, with 43% worrying about it “a great deal” and 22% “a fair amount.” Gallup surveys also find 43% of Americans believe that global warming will pose a serious threat to themselves or their way of life in their lifetime, underscoring that roughly four in 10 harbor strong concern. The latest results, from a March 1-15, 2021, Gallup poll, predate the hottest summer on record in the lower 48 states.
The international concern about the harmful effects of climate change led to the negotiation of the Paris Agreement in December 2015 as the culmination of the 2015 United Nations Climate Change Conference. The agreement provides for members to reduce their carbon output as soon as possible and to do their best to keep global warming to no more than two degrees Celsius, or 3.6 degrees Fahrenheit. In order to achieve the desired results, there would have to be a worldwide reduction in emissions from fossil fuels and a shift to renewable resources.
Global acceptance of human influence on climate change may also contribute to a shift in the demand for OTEC. As evidenced by the Paris Agreement reached in December 2015 to combat climate change, 195 nations expressly recognized that conventional fossil-fuel powered energy technologies affect global climate change and the need to embrace a sustainable future in energy and water. Low-lying coastal countries (sometimes referred to as small island developing states) that tend to share similar sustainable development challenges, including small but growing populations, limited resources, remoteness, susceptibility to natural disasters, vulnerability to external shocks, excessive dependence on international trade, and fragile environments, have embraced this recognition and are keenly aware that they are on the frontline of early impact of sea level rise and are aggressively trying to embrace sustainable-energy alternatives. This is a major driving force for OTEC in primary early markets.
In February 2021, the United States officially rejoined the Paris Climate Accord, standing with the world to help fight the ‘existential crisis’ of global warming. Even during the years the United States had withdrawn from the Paris Climate Accord, a coalition of 14 U.S. states, including California and New York, said they were on track to meet the U.S. target of a 26-28% reduction in greenhouse gas emissions by 2025, compared to 2005 level.
The United Kingdom hosted the 26th UN Climate Change Conference of the Parties (COP26) in Glasgow on 31 October – 13 November 2021. The COP26 summit brought parties together to accelerate action towards the goals of the Paris Agreement and the UN Framework Convention on Climate Change.
We believe the ongoing concerns about environmental issues and the price instability of fossil-fuel prices are motivation for increased commercial interest in OTEC, renewed activity in the commercial sector, and increased interest among communities and agencies that recognize the potential benefits of this technology, including the U.S. Department of Defense and U.S. Department of the Interior territories.
Several large companies have used their OTEC technology experience to introduce OTEC systems worldwide, supporting the argument that the technology is now at the point where it can be introduced at a commercial level:
| ● | Since early 2014, we have been working with several industrialized and developing countries, including U.S. Virgin Islands, The Bahamas, Cayman Islands, and others, and investigating suitable OTEC sites, infrastructural solutions, and funding opportunities. |
| ● | Two nongovernmental organizations promoting OTEC have been created: OTEC Foundation (based in The Netherlands) and OTEC Africa (based in Sweden). |
| ● | New technological advances for larger and more robust deep seawater pipes and more efficient and cost-effective heat exchangers, pumps, and other components have, in our opinion, further improved the economics for OTEC. |
| ● | Many countries, including a large number of Caribbean nations, now have renewable energy standards and are looking at ways to reduce their carbon footprints, decouple the price of electricity from the volatile price of oil, and increase energy security. Along with these countries, we are aware that Hawaii, U.S. territories, and the U.S. Department of Defense are looking at OTEC as a possible source of renewable energy and water for drinking, fish farming, and agriculture. |
| ● | The NELHA demonstration OTEC plant in Hawaii can produce 100 kilowatts of sustainable, continuous electricity annually and had powered a neighborhood of 120 homes. |
Recent international political instability, especially in Eastern Europe, proved that fossil-fuel-producing regions and oil price volatility have exposed the criticality of energy security and independence for all countries. The need to have a tighter control of domestic energy requirements is a matter of increasing international concern. Continued reliance on other countries (particularly those in oil-producing regions) is no longer a favorable option. We believe these considerations will continue to drive renewable research and commercialization efforts that promote technologies with global potential to replace fossil-fuel-based energy systems and benefit from base-load capabilities like OTEC.
Our current management team has led the development of the business since 2010 and has advanced the technology and understanding of OTEC, SWAC/LSC to worldwide markets. We believe these efforts have helped us establish an eager marketplace for our technology and an understanding as to the importance of designing, building, and operating a commercial-grade OTEC system. Our efforts in the U.S. Virgin Islands included an extensive feasibility study explaining how OTEC could operate successfully in the territory. The Public Services Commission of the U.S. Virgin Islands has approved our application to be a “qualified facility” and build a 15MW OTEC plant on the island of St. Croix. In addition to the OTEC plant, we have presented testimony to the territory showing how OTEC could provide potable water to the U.S. Virgin Islands.
We are discussing both OTEC and SWAC/LSC projects with various federal government departments. Currently, several projects are in the planning and discussion phase:
| ● | We have provided a detailed study and designs for OTEC and/or SWAC/LSC for an Eco Village powered by an OTEC plant for the U.S. Virgin Islands. |
| ● | We have made application for several grants through the U.S. Department of Energy to support the commercialization of OTEC technology together with the production of "green hydrogen.” |
| ● | We continue to respond to inquiries for OTEC/SWAC/LSC from potential customers around the world. |
| ● | We continue to utilize our Small Business Innovation Research credentials in discussions with the U.S. government, including for remote military bases in tropical regions. |
In light of the foregoing, we believe that it is now appropriate to seek additional funding to further progress and build our engineering and technical teams, develop our intellectual property, file patents for several OTEC technical systems, and advance our current opportunities to support our growth strategy.
Our Competition
We compete in the development, construction, and operation of OTEC and SWAC/LSC plants with other operators that develop similar facilities powered by other energy sources, primarily oil, natural gas, nuclear energy, and solar power. These traditional energy sources have well-established infrastructures for production, delivery, and supply, with well-known commercial terms. In developing our OTEC and SWAC/LSC plants, we will need to satisfy our customers that these technologies are sound and economical, which may be a challenge until and unless we have an established successful operating history. The energy industry is dominated by an array of companies of all sizes that have proven technologies and well-established fuel sources from a number of suppliers.
We expect that we will encounter increasing competition for OTEC and SWAC/LSC plants. Other firms with greater financial and technical resources are focusing on commercialization of these technologies. Our competitors may benefit from collaborative relationships with countries, including a large number of Caribbean nations, that now have renewable-energy standards and are looking at ways to reduce their carbon footprints, decouple the price of electricity from the volatile price of oil, and increase energy security. Other competitors may have advantageous relationships with authorities such as Hawaii, U.S. territories, and the U.S. Department of Defense, which are looking at OTEC as a possible source of renewable energy and water for drinking, fish farming, and agriculture.
We cannot assure that we will be able to compete effectively as the industry grows and becomes more established and as OTEC and SWAC/LSC plants become more accepted as viable and economic energy solutions.
We believe competition in this industry is and will be based on technical soundness and viability, the economics of plant outputs as compared to other energy sources, developmental reputation and expertise, financial capability, and ability to develop relationships with potential customers. All these factors are outside our control.
Our Operational Strategy and Economic Models
We have developed economic models of costs and potential revenue structures that we will seek to implement as we develop OTEC and SWAC/LSC projects.
OTEC Projects
The estimated construction costs for a 20-MW plant are approximately $445 million with hard costs of approximately $301 million for the power system and platform construction and piping, which make up 68% of the total. The remaining 32% consists of other construction costs and the deployment of the cold water pipe and soft costs of approximately $144 million for design, permits and licensing, environmental impact assessment, bathymetry, contractor fees, and insurance.
Once operational, the capacity factor, which is the projected percent of time that a power system will be fully operational, considering maintenance, inspections, and estimated unforeseen events, is expected to be 95% annually. This factor is used in our financial calculations, which means the plant will not be generating revenue for 5% of the year. Most fossil-fuel plants have capacity factors around 90%, as a result of the major maintenance for high-temperature boilers, fossil-fuel feed in systems, safety inspections, cleaning, etc. The normal maintenance cycle for the pumps, turbine, and generators used in the OTEC plant is typically every five years. This includes the cleaning of the heat exchangers and installation of new seals.
We anticipate that project returns will be comprised of two components: First, as the project developer, we will seek a lump-sum payment as a development fee at the time of closing the project financing for each project. These payments will be allocated toward reimbursement of development costs and perhaps a financial return at the early stage of each project. The development fee will vary, but initially we will seek a fee of approximately 3% of the project cost, payable upon closing the project financing. Second, we will retain a percentage of equity in the project, with a goal to retain a minimum of 51% of the equity in any OTEC project in order to participate in operating revenues.
We will seek revenue from OTEC plants from contract pricing charged on an energy-only price per kWh or on the basis of a generating capacity payment priced per kilowatt per month and an energy usage price per kWh. In many of the countries of the world where we intend to build OTEC and SWAC/LSC plants, potable water is in short supply. In some locations, water is considered the more important commodity. Depending on the part of the world in which the plant is built, in addition to revenue from power generation, supplying water for drinking, fish farming, and agriculture would significantly increase plant revenue.
We cannot assure that we can maintain the revenue points noted above, that any fees received will offset development costs incurred to date, or that any operating plant will generate revenue.
SWAC/LSC Projects
The estimated construction costs for a SWAC/LSC plant are approximately $150 million with hard costs of approximately $91 million for piping and installation, which make up 60% of the total. The remaining 40% consists of the pump house, central utility plant (CUP), mechanical and engineering equipment, design, and other contingency costs and soft costs of approximately $59 million for the CUP license, permits, environmental impact assessment, bathymetry, and insurance.
Under our economic model, we will seek revenue at two stages of the project. First, as the project developer, we will seek a lump-sum payment of a development fee equal to approximately 3% of the project cost at the time of closing the project financing for each project. These payments would provide us with income at the early stage of each project. If we are able to negotiate a development fee, we estimate that it will vary, but typically will be in the $2,500,000-$3,500,000 range. The second component of project returns is based upon the percentage of equity we will retain in the project.
SWAC/LSC contract revenue will be based typically on three charges:
| ● | Fixed Price–this is based upon the capital costs of the project paid over the term of the debt and with the intention of covering the costs of debt. |
| ● | Operation and Maintenance–this payment covers the cost of the labor and fixed overhead needed to run the SWAC/LSC system, as well as any traditional chiller plant operating to fulfill back-up or peak-load requirements. |
| ● | Chilled Water Payment–this is a variable charge based on the actual chilled water use and chilled water generated both by the SWAC/LSC and conventional system at the agreed upon conversion factors of kilowatt/ton and current electricity costs in U.S. dollars per kWh. |
We plan to structure project financing with the goal of retaining 100% of the equity in any SWAC/LSC project. We cannot assure that we will recover project development costs or realize a financial return over the life of the project.
Our Project Timeline
We have not designed, constructed, and placed into operation any OTEC or SWAC/LSC plants. However, based on our planning process and early development experience to date, we estimate that it will take approximately two years or more, depending on local conditions, including regulatory and permitting requirements, to take a project from a preliminary memorandum of understanding with a potential power or other product purchaser to completion and commencement of operation.
Our Strategic Relationships
We have a strategic relationship with DCO Energy, LLC, Mays Landing, New Jersey, an American energy development company specializing in the development, engineering, construction, start-up, commissioning, operation, maintenance and management, as well as ownership, of central energy centers, renewable energy projects, and combined heat, chilling, and power-production facilities. DCO Energy was formed in 2000 and has independently developed and/or operated energy producing facilities of approximately 275 MW of electric, 400 MMBtu/hr of heat recovery, 1,500 MMBtu/hr of boiler capacity, and 130,000 tons of chilled water capacity, totaling over $1 billion of assets. DCO Energy provides financing, engineering and design, construction management, start-up and commissioning resources, and long-term operating and maintenance services for its own projects as well as third-party clients.
Our Construction and Components
Once we have designed the system, we will review the design with our engineering, procurement, and construction partner to maximize the chances that the project can be delivered according to plan and on budget. We expect our construction contracts to be at a fixed price and to include penalties if the construction timetable is missed. We may, but are not obligated to, engage DCO Energy to construct our plants or serve as our owners’ engineer.
In our systems, the two most important components are heat exchangers and deep-water intake pipes. Although there are multiple providers of each of these components, the supply of the best components comes from just a few companies globally. We expect to source our deep-water intake pipes from Pipelife of Norway, the only company we know of that makes pipes of sufficient quality, strength, and diameter (2.5 meters) to support our planned OTEC plants. However, we expect that we could work around a lack of supply from Pipelife by using multiple smaller pipes that are widely available on the market, although this would increase our construction costs.
We will also need the highest quality, large heat exchangers for our systems; heat exchangers represent a large percentage of the projected costs of our OTEC and SWAC/LSC systems and account for a significant portion of the complexity inherent in commercial OTEC and SWAC/LSC designs.
Other major components, such as ammonia turbines, generators, and pumps, are manufactured by several multinational companies, including General Electric and Siemens.
Our Operations
For OTEC electricity-generating facilities, we intend to enter into 20- to 30-year power purchase agreements, or PPAs, pursuant to which the project would supply fixed-price, baseload electricity to satisfy the minimum demand of the purchaser’s customers. This PPA structure allows customers to plan and budget their energy costs over the life of the contract. For our SWAC/LSC systems, we intend to enter into 20- to 30-year energy service agreements, or ESAs, to supply minimum quantities of chilled water for use in a customer’s air conditioning system.
We anticipate that operations of OTEC and SWAC/LSC plants will be subcontracted to third parties that will take responsibility for ensuring the efficient operation of the plants. These arrangements may reduce our exposure to operational risk, although they may also reduce our financial return if actual operating costs are less than the subcontract payments. We cannot assure that any OTEC and SWAC/LSC plants will permit the PPAs and ESAs to yield minimum target internal rates of return. Our first projects are likely to have lower returns than subsequent projects. Variances in internal rates of return may occur due to a range of factors, including availability and structure of project financing and localized issues such as taxes, some of which may be outside of our control.
We expect our OTEC contract pricing will be charged either on an energy-only price per kWh or on the basis of a capacity payment priced per kilowatt per month and an energy usage price per kWh. We cannot assure that this pricing will enable us to recoup our funding and project costs and allow us to earn a profit.
Marketing Strategies
Our marketing and sales efforts are managed and directed by our chairman and chief executive officer, Jeremy P. Feakins, who has 40 years’ experience of senior-level sales in both commercial and governmental markets. Our marketing campaign has focused on explaining to potential customers the economic, environmental, and other benefits of OTEC and SWAC/LSC through personal contacts, industry interactions, our website, and social media channels.
Our target markets are comprised of large institutional customers that typically include governments, utilities, large resorts, hospitals, educational institutions, and municipalities. We market to them directly through personal meetings and contact by our chief executive officer and other key members of our team. We also make extensive use of centers of influence either to heighten awareness of our products in the minds of key customers’ decision-makers or to secure face-to-face meetings and preliminary agreements between our customers and our chief executive officer.
Sales cycles in our business are extremely long and complex and often involve multiple meetings with governmental, regulatory, electric utility, and corporate entities. Therefore, we cannot predict when or if any of the projects we currently have under development will progress to a signed contract or operational phase and generate revenue. We do not expect sales to be seasonal or cyclical.
Material Regulation
Our business and products are subject to material regulation. However, because we contemplate offering our products and services in different countries, the specific nature of the regulatory requirements will be wholly dependent on the nation where the project will be located and the national, state, and local regulations that apply at that location. In all cases, we expect the level of regulation will be material and will require significant permitting and ongoing compliance during the life of the project.
The most significant regulations will likely be environmental and will include mitigating possible adverse effects during both the construction and operational phases of the project. However, we believe that the limited plant site disturbance of both SWAC/LSC and OTEC projects, together with the significantly lower emissions that result from these projects as compared to fossil-fuel electrical generation, will make compliance with all such regulation manageable in the normal course.
The second most significant regulations will likely involve coordination with existing infrastructure. We believe compliance with this type of regulation is a routine civil engineering coordination process that exists for all new buildings and infrastructure projects of all types. Again, we believe that the design of both SWAC/LSC and OTEC projects can readily be modified to avoid interference with existing infrastructure in most cases.
Facilities
Our principal executive offices are located at. 3675 Market Street, Suite 200, Philadelphia PA 19104. We maintain a small office in Lancaster, PA. Our telephone number at that address is (717) 299-1344.
Intellectual Property
We use, or intend to employ in the performance of our material contracts, intellectual property rights in relation to the design and development of OTEC plants. Our intellectual property rights can be categorized broadly as proprietary know-how, technical databases, and trade secrets comprising concept designs, plant design, and economic models. Additionally, we have applied to register the trademark TOO DEEP® at the U.S. Patent and Trademark Office for the provision of desalinated deep ocean water for consumption. The U.S. Patent and Trademark Office has approved an extension of our Notice of Allowance until 2022.
We may apply for patents for components of our intellectual property for OTEC and SWAC/LSC systems, including novel or new methodologies for cold-water piping, heat exchanges, and computer-aided design programs. We cannot assure that any patents we seek will be granted.
Our intellectual property has been developed by our employees and is protected under employee agreements confirming that the rights in the inventions and developments made by the employees are our property. Confidential information is protected by nondisclosure agreements we entered into with prospective partners or other third parties with which we do business.
We have not received any notification from third parties that our processes or designs infringe any third-party rights, and we are not aware of any valid and enforceable third-party intellectual property rights that infringe our intellectual property rights. Currently, there is no patent for any company for OTEC technology.
Employees
We currently have two employees, consisting of one officer and one finance/accounting. There are no collective-bargaining agreements with our employees, and we have not experienced work interruptions or strikes.
ITEM 1A. RISK FACTORS
Investing in our common stock involves a high degree of risk. Investors should carefully consider the risks described below, as well as the other information in this report, including our financial statements and the related notes and “Management’s Discussion and Analysis of Financial Condition and Results of Operations,” before deciding whether to invest in our common stock. The occurrence of any of the events or developments described below could harm our business, financial condition, operating results, and growth prospects. In such an event, the market price of our common stock could decline, and investors may lose all or part of their investment. Additional risks and uncertainties not presently known to us or that we currently deem immaterial also may impair our business operations.
Risks Related to Our Financial Condition
Russia’s military intervention in Ukraine and the international community’s response have created substantial political and economic disruption, uncertainty, and risk.
Russia’s military intervention in Ukraine in late February 2022, Ukraine’s widespread resistance, and the NATO-led and United States coordinated economic, financial, communications, and other sanctions imposed by other countries have created significant political and economic world uncertainty. There is significant risk of expanded military confrontation between Russia and other countries, possibly including the United States. Current and likely additional international sanctions against Russia may contribute to higher costs, particularly for petroleum-based products. These and related actions, responses, and consequences that cannot now be predicted or controlled may contribute to worldwide economic reversals. In these circumstances, our efforts to commercialize our technology may be delayed or otherwise negatively impacted.
The auditors’ report for the years ended December 31, 2022 and 2021, contains an explanatory paragraph about our ability to continue as a going concern.
The report of our auditors on our consolidated financial statements for the years ended December 31, 2022 and 2021, as well as for prior years, contains an explanatory paragraph raising substantial doubt about our ability to continue as a going concern. We had a net loss of $6,912,102 and $2,670,637, respectively; used cash in operations of $327,213 and $542,630, respectively; had a working capital deficiency of $36,199,026 and $29,801,131, respectively; and had an accumulated deficit of $96,496,618 and $89,584,516, respectively, at December 31, 2022 and 2021. These factors raise substantial doubt about our ability to continue as a going concern. Our ability to continue as a going concern beyond December 31, 2022, is dependent on our ability to raise additional capital through the sale of debt or equity securities or stockholder loans and to implement our business plan during the next 12 months. The financial statements do not include any adjustments that might be necessary if we are unable to continue as a going concern. Management believes that actions presently being taken to obtain additional funding through implementing our strategic plans, broadly based marketing strategy, and sales incentives to expand operations will provide the opportunity for us to continue as a going concern.
We have no current project that will generate revenues in the near future.
None of our projects is at a stage of development that will allow them to generate revenues in the near future. Our project development cycles are relatively long, extending over several years as we identify a potential project site, complete negotiations with third parties, complete permitting, obtain financing, complete construction, and place a plant into service. We expect to receive a development fee of approximately 3% of the project cost from our projects, payable upon the close of project financing. Operating revenues from projects are expected to be received when the plant has been built and placed into operation. We are currently focusing on developing a U.S. Virgin Island project, but even if we develop it successfully, it will not generate revenues until several years in the future. Until we receive revenues from this or another project, we will be dependent on raising funds from external sources.
We will require substantial amounts of additional capital from external sources.
We do not have any current source of revenues or sufficient cash or other liquid resources to fund our planned activities until we receive development fees from new contracts. Accordingly, as in the past, we will need substantial amounts of capital from external sources to fund day-to-day operations and project development. We have no arrangements or commitment for such capital. We plan to continue our practice of seeking external capital through the sale of debt or equity, although we cannot assure that such efforts will be successful and the continuing COVID-19 pandemic may make it more difficult to raise additional capital. Any new investments will dilute the interests of the current stockholders. Further, new investors may require preferential financial returns, security, voting rights, or other preferences that will be superior to the rights of the holders of common stock. Alternatively, as project development advances, we may be required to sell all or a portion of our interest in one or more projects, which could reduce our retained financial interest and potential return.
Risks Related to Our Business
Our efforts to develop OTEC and SWAC/LSC plants are subject to many financial, technical, managerial, and sales risks that may make us unsuccessful.
We incur substantial costs that we may not recover developing a new project that we may not build, operate, or sell. The identification of suitable locations, the investigation of the applicable regulatory and economic framework, the identification of potential purchasers, the completion of preliminary engineering and planning, and the funding of related administrative and support costs ordinarily require several years to complete before we determine to further develop or abandon a project. Each of these steps is fraught with risks and uncertainties, such as:
| ● | limited market due to low demand, existing competitive energy sources, low power costs, or the absence of a single or few large potential output purchasers; |
| ● | a regulatory scheme suggesting that the development and operation of a plant would be subject to excessively stringent utility regulations or environmental requirements, burdensome zoning or permitting practices and requirements, or similar factors; |
| ● | shortage of suitable onshore locations, lack of available cold water with near-shore accessibility, sea wave and current conditions, and exposure to hurricanes, typhoons, earthquakes, or similar extreme events; |
| ● | the unavailability of favorable tax or other incentives or excessively stringent applicable incentive requirements; |
| ● | the high cost and potential regulatory difficulties in integrating into new markets; |
| ● | the possibility that new markets may be limited or unstable or our exposure to competition from other sources of existing or potentially new energy sources; |
| ● | difficulties in negotiating power purchase agreements (PPAs) with potential customers, including in some instances, the necessity to assist in the formation of a power purchasing group; and |
| ● | the need to educate the market as well as investors regarding the reliability and economical and environmental benefits of ocean thermal technologies. |
We cannot assure that we will be able to overcome these risks as we initiate the development of a project. We may incur substantial costs in advancing a project through the early stages, only to conclude eventually that the project is not economically or technically feasible, in which case we may be unable to recover the costs that we have then incurred. When we elect to proceed with a project, we may continue to incur substantial costs and be unable to complete the development, sell the project, or otherwise recover our investment. Even when a project is developed, constructed, and placed into operation, we cannot assure that we will be able to operate at a profit sufficient to recover our total investment.
We are dependent on the performance of counterparties to our agreements.
Our projects are and will be complex, with a number of agreements among several parties that purchase plant outputs; provide financing; complete design, construction, and other services; design and perform regulatory compliance; and fulfill other requirements. The failure of any participant in one of our projects due to its own management, financial, operating, or other deficiencies, all of which may be outside our control, can materially and adversely affect our operations and financial results. In circumstances in which we are not the prime developer of a large-scale project involving many components in addition to our OTEC, SWAC/LSC, or other components, we would have little ability to address problems resulting from performance failures by others or implement project-wide remedial measures. The foregoing is illustrated in our Baha Mar project, which is now on hold, and may never resume, because of contract performance and financing disputes by others.
Ongoing world economic, currency-exchange, energy-price, contagious disease, and political circumstances adversely affect our project development activities.
Recent and ongoing world events outside of our control or influence adversely affect our development activities. Economic uncertainties have resulted in the unpredictable availability of credit, debt, and equity financing; volatile interest rates; currency exchange-rate fluctuations that add risk to international projects; restrictions on the availability of borrowing; concerns respecting inflation and deflation; economic turmoil resulting from unpredictable political events and tensions in international relations and the continuing COVID-19 pandemic; substantial reductions in hydrocarbon energy prices and the impact of such declines on the cost of energy generally; shifts in the economic feasibility of competitive energy sources; and similar factors. These adverse factors frequently have a particularly intense effect on emerging markets and developing countries, which we believe provide the greatest opportunity for our development of our projects. It now appears that emerging markets and developing countries may be slower in vaccinating their populations against the coronavirus, which may make it more difficult for us to operate in our target markets. The possibility that principal energy prices will continue at current or even lower levels, which could reduce the projected cost at which power could be generated by hydrocarbon-fueled power plants, could make our relatively higher-cost plants less competitive. These emerging and developing markets are particularly vulnerable to the negative impacts of these adverse circumstances. The economic feasibility of alternative energy, including the process we develop and propose to operate, as compared to hydrocarbon energy is adversely affected as the prices for hydrocarbon fuels decline. Accordingly, possible continuing low hydrocarbon prices may retard the potential increase in the economic feasibility of alternative energy. The decline in crude oil prices from over $100 per barrel several years ago to approximately one quarter of that today has adversely affected alternative energy development. Our ability to develop and operate alternative energy plants and our ability to generate revenue will be adversely affected by continuing, relatively soft hydrocarbon energy prices. Further, alternative energy development may be adversely affected by uncertainty in hydrocarbon prices or public expectations that hydrocarbon prices may continue to decline.
We require substantial amounts of capital for all phases of our proposed activities.
We require substantial amounts of capital to fund efforts to identify, research, preliminarily engineer, permit, and design our projects and to negotiate PPAs for them. These costs may not be recovered, because we may not elect to complete the development of the project or because the development and operation of the project are not successful. We will rely on external capital to fund our operations, and we cannot assure that such capital will be available. Our efforts to access capital markets will be limited, particularly at the outset, because we have not yet developed and placed into operation our first plant. Accordingly, we expect that we will have to provide the potential for a significant economic return for the initial capital we obtain, which will likely dilute the interests of our existing stockholders. We expect that each project that we are able to fully develop, construct, and place into operation will require several stages and levels of debt and equity financing. For example, we expect that a 20-MW OTEC plant may require total capital expenditures of approximately $445 million, consisting of $365 million in project debt financing and $80 million in equity. We cannot assure that we will be able to obtain financing, and if obtained, such financing may be on terms that we will retain only a minority financial interest in the completed project and its operations. Our inability to obtain required financing for any activity or project could have a material adverse effect on our activities and operations.
We are reliant on our key executives and personnel.
Our business, development, and prospects are highly dependent upon the continued services and performance of our directors and other key personnel, on whom we rely for experience, technical skills, and commercial relationships. We believe that the loss of services for any reason of any existing key executives, or failure to attract and retain necessary personnel, could have a material adverse impact on our business, development, financial condition, results of operations, and prospects. Although we have entered into employment agreements with our key executives, we may not be able to retain them. We do not maintain key-man life insurance on any of our executive employees.
Our projects will be subject to substantial regulations and policies governing energy projects, power generation, desalinated water sales, and other aspects of our OTEC and SWAC/LSC plants, which may adversely affect our ability to develop projects, and any changes in the applicable regulatory schemes may adversely affect projects that we are constructing or have constructed and are operating.
Our projects likely will be significant commercial or industrial enterprises in each of their locations and, as such, will be subject to numerous environmental, health and safety, antidiscrimination, and similar laws and regulations in each of the jurisdictions governing our locations. These laws and regulations will require our projects to obtain and maintain permits and approvals; complete environmental impact assessments or statements prior to construction; and review processes and operations to implement environmental, health and safety, antidiscrimination, and other programs and procedures to control risks associated with our operations.
Environmental health and safety laws, regulations, and permit requirements applicable to any specific project at the time of construction may change or become more stringent during the life of the operation. Any such changes could require that our projects incur substantial additional costs, alter their operations, or limit or curtail their operations in order to comply, which would have a material adverse effect on our operations. We may not be able to pass on any additional costs that we incur to our power purchasers, particularly in those cases in which we sell power pursuant to a long-term, fixed-price agreement.
The financial model for our proposed projects has not been tested and may not be successful.
We are proposing a financial model for the development of individual projects that includes development financing provided by us, construction financing provided by equity investors in the specific projects, and project debt financing; the payment of a development fee to us at the time of construction; and continuing equity participation by us throughout the plant’s operation. We have not used this model in the financing or completion of any plant, and we cannot assure that the financial model and, therefore, the anticipated financial return to us will be acceptable to those that might provide the requisite external capital.
We may need to revise extensively our financing structure for each project, and we cannot assure that any restructured proposal would not substantially reduce our financial return or increase our risk. The financial, investment, and credit community are generally unfamiliar with OTEC and SWAC/LSC projects, which will adversely affect our financing efforts. We have no existing relationships with potential sources of debt or equity capital, and any financing sources that we may develop may be inadequate to support the anticipated capital needs of our business. Our efforts to obtain financing may be adversely affected by the fact that our projects will likely be located in developing or emerging markets. Our inability to obtain financing may force us to abandon projects in which we have invested substantial costs, which we may be unable to recover. The process of identifying new sources of debt and equity financing and agreeing on all relevant business and legal terms could be lengthy and could require us to limit the rate at which we can develop projects or reduce our financial return.
We may be exposed to political and legal risks in the developing or emerging markets in which we propose to locate plants.
Many of the markets that may be suitable for a potential OTEC or SWAC/LSC plants are located in emerging or developing countries that may have evolving and untested regulatory and legal environments for large-scale, international, commercial enterprises. Further, political instability, regime change, or other factors may increase uncertainty and instability, which in turn may adversely affect our ability to secure necessary regulatory approvals and obtain required project financing, which increases related costs and reduces our financial return. Any changes in applicable laws and regulations, including any governmental incentives, environmental requirements or restrictions, safety requirements, and similar matters, and the risk or likelihood of such a change could adversely affect the availability and cost of financing. Further, in some jurisdictions, applicable legal requirements may not have been fully tested and are still being developed in the face of modern international commercial transactions and environmental requirements, which may lead to changes in interpretation or application that may be adverse to us. Our expectations regarding the size of the potential OTEC and SWAC/LSC markets and the number of possible suitable locations may not be accurate.
Our business plan and models are based on our identification of potential suitable locations for OTEC or SWAC/LSC plants based on a preliminary evaluation of public information respecting demographic data, current power-generation costs, and local seafloor contours and seawater temperatures, which may be inaccurate. Any material inaccuracy could substantially reduce the total market available to us for plant development.
We may be unable to arrange or complete future construction projects on time, within expected budgets, or without interruption due to materials availability and disruptions in supply, labor, or other factors. If any project reaches the point at which we undertake construction, such construction may be subject to actual prices higher than the amount budgeted, the limited or delayed availability of components or materials, shortages or interruptions of labor or materials, or similar circumstances. In the case we have insufficient budget flexibility to pay increased construction costs, corresponding delays could result to construction completion and the commencement of operations.
Emerging markets are often associated with growth rates that may not be sustainable and may be accompanied by periods of high inflation. Rising inflation or related government monetary and economic policies in certain project jurisdictions may affect our ability to obtain external financing and reduce our ability to implement our expansion strategy. We can give no assurances that a local government will not implement general or project-specific measures to tighten external financing standards, or that if any such measure is implemented, it will not adversely affect our future operating results and profitability.
We are subject to changing attitudes about environmental risks.
Our projects may face opposition from environmental groups that may oppose our development, construction, or operation of OTEC or SWAC/LSC plants. Each project is expected to have different environmental issues, especially as many of our projects are based in different settings having a wide range of environmental standards. We intend to solicit input from environmental organizations and activists early in our design process for our projects in an effort to consider appropriately these organizations’ recommendations in order to mitigate subsequent conflict or opposition, but we cannot assure that such outreach will be effective in all cases, and if it is not, opposition to our projects could increase our cost and adversely affect the results of our operations.
We may be unable to find land suitable for our projects.
Each project site requires land of differing characteristics to permit the cost-effective construction of OTEC or SWAC/LSC plants, and suitable land may not always be available. Even if available, such land may be difficult to obtain in a timely or cost-effective manner. For example, we would prefer to place OTEC power systems and facilities as close to the ocean as possible. We hope to mitigate this risk by using land owned by local governments, rather than private individuals or entities, as targeting local governments with favorable energy policies or mandates should reduce land rights risks. Our inability to secure appropriate land at a reasonable cost may render certain of our future projects economically unfeasible.
We have a limited number of suppliers for certain materials, which could increase our costs or delay completion of projects.
In our systems, the two most important components are heat exchangers and deep-water intake pipes. Although there are multiple providers of each of these components, the supply of the best components comes from just a few companies globally. Should these resources become unavailable for any reason or too costly, we would be required to seek alternative suppliers. The products from such suppliers could be of a lower quality or more costly, in any event requiring us to expend additional monies or time to complete our projects as planned. This could result in financial penalties or other costs to us.
There may be greater cost in building OTEC plants that generate over 10 MWs of electricity.
In order to successfully obtain debt financing for OTEC facilities, we must find engineering, procurement, and construction contractors willing to enter into fixed-price contracts at a pricing that is economically viable for us. Based on our preliminary discussions, we believe that engineering, procurement, and construction contractors may be willing to consider fixed-price arrangements for up to 10-MW OTEC facilities, but we have not yet discussed performance risk guarantees for OTEC plants greater than 10 MWs. The cost of construction for larger OTEC power systems may vary considerably, and these variances could include increased costs for construction, design, and component procurement. As we gain more experience, we may improve upon efficiencies and accuracy in pricing. Failure to procure engineering, procurement, and construction contractors willing to perform fixed-price contracts on facilities that produce more than 20 MWs may have a material adverse effect on our operations.
Technological advances may render our technologies, products, and services obsolete.
We operate in a fast-moving sector in which innovative forms of power generation and new energy sources are continuously being researched. New technologies may be able to provide power, coolant, desalinated seawater, or other outputs at a lower cost, including amortization of capital costs, or with less environmental impact. We will remain subject to these risks for the useful life of our projects, which could extend for 20 years or more. Any such technological improvements could render our projects obsolete.
We may not successfully manage growth.
We intend to continue to develop the projects in our pipeline of opportunities and to construct and operate plants as we deem warranted and as we are able to finance. This is an ambitious growth strategy. Our growth and future success will depend on the successful completion of the expansion strategies and the sufficiency of demand for our energy products. The execution of our expansion strategies may also place a strain on our managerial, operational, and financial reserves. Should we fail to effectively implement such expansion strategies or should there be insufficient demand for our products and services, our business operations, financial performance, and prospects would be adversely affected.
There will likely be a single or limited number of power purchasers from each plant, so we will be dependent on their economic viability and stability and continued operations.
We expect that any plant that we operate will provide power, cooling, desalinated water, or other products to a few or a limited number of key power purchasers that will use the power for specific commercial enterprises, such as resorts, manufacturing or processing plants, or similar large-scale operations. Accordingly, our ability to sell power and other outputs will be dependent on the economic viability of these purchasers. If one or more key purchasers were to fail, we would be required to obtain alternative purchasers for our power and other outputs, and there may be no or a limited number of alternative purchasers in the merging and developing markets where we anticipate our plants may be located. Accordingly, a failure of an output purchaser may result in the failure of our power plant project. We do not anticipate that we will be able to obtain insurance on acceptable terms to protect us against such a loss. Further, our project output purchasers may not comply with contractual payment obligations or may otherwise fail to perform their contracts, and they may have greater economic bargaining power and negotiating leverage as we seek to enforce our contractual rights. To the extent that any of our project power purchasers are, or are controlled by, governmental entities, our projects may also be subject to legislative, administrative, or other political action or policies that impair their contractual performance. Any failure of any key power purchasers to meet their contractual obligations for any reason could have a material adverse effect on our business and operations.
Operational problems, natural events or catastrophes, casualty loss, or other events may impair the commercial operation of our projects.
Our ability to meet our delivery obligations under power-generation contracts, as well as our ability to meet economic projections, will depend on our ability to maintain the efficient working order of our plants. Severe weather, natural disasters, accidents, failure of significant equipment components, inability to obtain replacement parts, failure of power transmission facilities, or other catastrophes or occurrences could materially interrupt our activities and consequently reduce our economic return. Since all our plants will be located on the shore within close proximity to deep-ocean or lake water, our plants will be subject to extraordinary natural occurrences, such as wave surges from hurricanes or typhoons, tsunamis, earthquakes, and other events, over which we will have absolutely no control. We cannot assure that we can obtain sufficient insurance to protect us from all risks resulting from such catastrophes. Further, we cannot assure that any design features or operating policies that we may use will mitigate the risks to which our plants may be exposed. Any threatened or actual events could expose us to plant shutdowns, substantial repairs, interruptions of operations, damages to our power purchasers, and similar events that could require us to incur substantial costs and significantly impair our revenues and results of operations.
We may be adversely affected by climate change.
Climate change may result in changes in ocean currents and water temperatures that could have a material adverse effect on our results of operations. These changes may require additional capital costs or impair the efficiency of our operations. Because of the size and cost of major components of our power plants, we typically will not inventory spare components, so that any substantial damage may require that we await the custom manufacture and delivery of such items, which may involve substantial delays. Significant changes may render any plant inefficient and uneconomical.
Insurance to cover anticipated risks may become more expensive.
There are no known commercial OTEC and SWAC/LSC plants in operation, so the nature and cost of insurance is difficult to predict. Insurance costs may substantially exceed the costs forecast during the planning process or budgeted during actual operations. We cannot assure that adequate insurance coverage will be available to protect us against all risks or that any related costs will be economical. Accordingly, if we are unable or cannot afford to purchase insurance against specific risks, our projects may be fully exposed to those risks, which also could have a material adverse effect on the viability of any affected plant.
Risks Related to Our International Operations
Certain risks of loss arise from our need to conduct transactions in foreign currencies.
Our business activities outside the United States and its territories may be conducted in foreign currencies. In the future, our capital costs and financial results may be affected by fluctuations in exchange rates between the applicable currency and the dollar. Other currencies used by us may not be convertible at satisfactory rates. In addition, the official conversion rates between a particular foreign currency and the U.S. dollar may not accurately reflect the relative value of goods and services available or required in other countries. Further, inflation may lead to the devaluation of such other currencies.
Foreign governmental entities may have the authority to alter the terms of our rights or agreements if we do not comply with the terms and obligations indicated in such agreements.
Pursuant to the laws in some jurisdictions in which we may develop or operate plants, foreign governmental entities may have the authority to alter the terms of our contractual or financial rights or override the terms of privately negotiated agreements. In extreme circumstances, some foreign governments have taken the step of confiscating private property on the assertion that such action is necessary in the public interest of the country. If this were to occur, we may not be compensated fairly or at all. We cannot assure that we have complied, and will comply, with all the terms and obligations imposed on us under all foreign laws to which one or more of our operations and assets may be subject.
Our operations will require our compliance with the Foreign Corrupt Practices Act.
We must conduct our activities in or related to foreign companies in compliance with the U.S. Foreign Corrupt Practices Act, or FCPA, and similar anti-bribery laws that generally prohibit companies and their intermediaries from making improper payments to foreign government officials for the purpose of obtaining or retaining business. Enforcement officials interpret the FCPA’s prohibition on improper payments to government officials to apply to officials of state-owned enterprises, including state-owned enterprises with which we may develop or operate projects or to which we may sell plant outputs. While our employees and agents are required to acknowledge and comply with these laws, we cannot assure that our internal policies and procedures will always protect us from violations of these laws, despite our commitment to legal compliance and corporate ethics. The occurrence or allegation of these activities may adversely affect our business, performance, prospects, value, financial condition, reputation, and results of operations.
Our competitors may not be subject to laws similar to the FCPA, which may give them an advantage in negotiating with underdeveloped countries and the government agencies.
Our competitors outside the United States may not be subject to anti-bribery or corruption laws as encompassing or stringent as the U.S. laws to which we are subject, which may place us at a competitive disadvantage.
We may encounter difficulties repatriating income from foreign jurisdictions.
As we develop and place plants into operation, we intend to enter into revenue-generating agreements in which we are paid only in U.S. dollars directly to our U.S. banks or through countries in which repatriation of the funds to our U.S. accounts is unrestricted. However, situations could arise in which we agree to accept payment in foreign jurisdictions and for which restrictions make it difficult or costly to transfer these funds to our U.S. accounts. In this event, we could incur costs and expenses from our U.S. assets for which we cannot recover income directly. This could require us to obtain additional working capital from other sources, which may not be readily available, resulting in increased costs and decreased profits, if any.
Risks Related to Our Common Stock
Our common stock is thinly traded, and there is no guarantee of the prices at which the shares will trade.
Our common stock is quoted on the OTC marketplace operated by the OTC Markets Group, Inc., under the ticker symbol “CPWR.” Because we are not current in our SEC reports, our common stock is designated as “Expert Market” by OTC Markets, which has been associated with very little trading activity and a decrease in the share price. We cannot provide any assurance that the trading volume or price will increase if we become current in our SEC reports and are quoted on the OTCPink tier in the future. Not being listed on an established securities exchange has an adverse effect on the liquidity of our common stock, not only in terms of the number of shares that can be bought and sold at a given price, but also through delays in the timing of transactions and reduction in security analysts’ and the media’s coverage of our company. This may result in lower prices for our common stock than might otherwise be obtained and could also result in a larger spread between the bid and asked prices for our common stock. Historically, our common stock has been thinly traded, and there is no guarantee of the prices at which the shares will trade or of the ability of stockholders to sell their shares without having an adverse effect on market prices.
We have never paid dividends on our common stock, and we do not anticipate paying any dividends in the foreseeable future.
We have not paid dividends on our common stock to date, and we may not be in a position to pay dividends in the foreseeable future. Our ability to pay dividends depends on our ability to successfully develop our OTEC business and generate revenue from future operations. Further, our initial earnings, if any, will likely be retained to finance our growth. Any future dividends will depend upon our earnings, our then-existing financial requirements, and other factors and will be at the discretion of our board of directors.
Because our common stock is a “penny stock,” it may be difficult to sell shares of our common stock at times and prices that are acceptable.
Our common stock is a “penny stock.” Broker-dealers that sell penny stocks must provide purchasers of these stocks with a standardized risk disclosure document prepared by the SEC. This document provides information about penny stocks and the nature and level of risks involved in investing in the penny stock market. A broker must also give a purchaser, orally or in writing, bid and offer quotations and information regarding broker and salesperson compensation, make a written determination that the penny stock is a suitable investment for the purchaser, and obtain the purchaser’s written agreement to the purchase. The penny stock rules may make it difficult for investors to sell their shares of our common stock. Because of these rules, many brokers choose not to participate in penny stock transactions and there is less trading in penny stocks. Accordingly, investors may not always be able to resell shares of our common stock publicly at times and prices that they feel are appropriate.
In addition to the “penny stock” rules described above, the Financial Industry Regulatory Authority (known as “FINRA”) has adopted rules that require that in recommending an investment to a customer, a broker-dealer must have reasonable grounds for believing that the investment is suitable for that customer. Prior to recommending speculative, low-priced securities to their non-institutional customers, broker-dealers must make reasonable efforts to obtain information about the customer’s financial status, tax status, investment objectives, and other information. Under interpretations of these rules, FINRA believes that there is a high probability that speculative, low-priced securities will not be suitable for at least some customers. FINRA requirements make it more difficult for broker-dealers to recommend that their customers buy our common stock, which may limit an investor’s ability to buy and sell our stock and have an adverse effect on the market for our shares.
Investors may lose confidence in the accuracy and completeness of our financial reports and the market price of our common stock may be negatively affected.
As a public reporting company, we are subject to the Sarbanes-Oxley Act of 2002 as well as to the information and reporting requirements of the Securities Exchange Act of 1934, as amended (the “Exchange Act”), and other federal securities laws. As a result, we incur significant legal, accounting, and other expenses, including costs associated with our public company reporting requirements and corporate governance requirements. As an example of public reporting company requirements, we evaluate the effectiveness of disclosure controls and procedures and of our internal control over financing reporting to allow management to report on such controls.
Our management concluded that our internal control over financial reporting was not effective as of December 31, 2022, due to a failure to maintain an effective control environment, failure of segregation of duties, failure of entity-level controls, and our sole executive’s access to cash.
If significant deficiencies or other material weaknesses are identified in our internal control over financial reporting that we cannot remediate in a timely manner, investors and others may lose confidence in the reliability of our financial statements. This would likely have an adverse effect on the trading price of our common stock and our ability to secure any necessary additional equity or debt financing.
ITEM 1B. UNRESOLVED STAFF COMMENTS
None.
ITEM 2. PROPERTIES
Our principal corporate offices are located at 3675 Market Street, Suite 200, Philadelphia PA 19104 and leased from CIC, Philadelphia. We are at the heart of University City, just steps away from UPenn and Drexel University. Our rent is approximately $500 per month. These facilities are generally in good condition, well maintained, and suitable and adequate for our current and projected operating needs. In May 2023, we entered into a month-to-month agreement for shared use of an office and facilities at 128 E Grant Street, Lancaster, Pennsylvania 17602, for $1,000per month.
ITEM 3. LEGAL PROCEEDINGS
From time to time, we are involved in legal proceedings and regulatory proceedings arising from operations. We establish reserves for specific liabilities in connection with legal actions that management deems to be probable and estimable.
On May 4, 2018, we reached a settlement of the claims at issue in Ocean Thermal Energy Corp. v. Robert Coe, et al., Case No. 2:17-cv-02343SHL-cgc, before the United States District Court for the Western District of Tennessee. Between May 30 and July 19, 2018, we received three payments totaling $100,000 from the defendants. On August 8, 2018, an $8 million judgment was entered against the defendants and in our favor. On May 28, 2019, we further settled the claims at issue with two of the defendants, Brett M. Regal and his company, Trade Base Sales, Inc. (“Regal Debtors”), for $17,500,000, bringing the combined judgment and settlement amount owed to us is $25,500,000. On July 1, 2019, the United States District Judge for the Central District of California (case number: 2:19-cv-05299-VAP-JPR), approved our stipulated application for an order permitting us to levy on property and appointing a receiver to carry out the levy on Regal Debtors’ property, such that it may be sold (subject to further order of the court approving and confirming such sales), to satisfy the $25,500,000 settlement and judgment amounts in our favor. On August 15, 2019, the court-appointed receiver notified the court that he had taken custody, possession, and control of certain gemstone and mineral specimens, known as the “Ophir Collection” and 350,000 pounds of unrefined gold and other precious metal bearing ore. By order of the court, the receiver was given the authority to assign, sell, and transfer the debtor property. The proceeds of any sales will be used to satisfy the judgment and settlement agreement, receivership’s reasonable costs and fees, as well as any other claims as determined by the court. Various parties have come forward asserting ownership and priority lien rights to the property. In our ongoing efforts to collect the $25,500,000 judgment obtained, a third party has intervened in our case in the Central District of California (case number: 2:19-cv-05299-VAP-JPR), asserting that it is the rightful owner of the “Ophir Collection” of gems and mineral specimens that is now in possession of the court-appointed receiver. On February 25, 2022, all parties who have appeared in this case stipulated to dismiss all pending claims while leaving the Receivership established by the court in place. On the same date, the court ordered that upon a successful sale of the Ophir Collection, the net proceeds shall be distributed in accordance with the terms of the January 3, 2022, confidential settlement between the parties.
On May 21, 2019, Theodore T. Herman filed a complaint against us in Theodore T. Herman v. Ocean Thermal Energy Corporation, Case No. CI-19-04780, in the Court of Common Pleas of Lancaster County, Pennsylvania, asserting that he is entitled to payment on the promissory note described in Note 4: Convertible Notes and Notes Payable. On July 1, 2019, we filed preliminary objections to the complaint, and subsequently filed an answer and new matter on August 20, 2019, to which the plaintiff filed a reply on September 9, 2019. We will continue to defend our position that no further payment on this note is owed.
On August 22, 2018, Fugro USA Maine, Inc. (“Fugro”), filed suit against us in Fugro USA Marine, Inc. v. Ocean Thermal Energy Corp., Cause No. 2018-56396, in the District Court for Harris County, TX, 165th Judicial District, seeking approximately $500,000 allegedly owed for engineering services provided. On June 23, 2020, a settlement was reached under which we would pay Fugro $375,000 by June 30, 2021. We have recorded the amount of accrued legal settlement as of December 31, 2022. We repaid $260,000 and the balance at December 31, 2022, was $115,000. We were unable to pay the remaining balance and therefore entered into a second amendment to the settlement agreement extending the deadline for full payment, with 18% interest per annum, to December 31, 2021. We will continue to make regular monthly payments to Fugro of $10,000 per month, until the balance owed has been paid.
ITEM 4. MINE SAFETY DISCLOSURES
Not applicable.
PART II
ITEM 5. MARKET FOR REGISTRANT’S COMMON EQUITY, RELATED STOCKHOLDER MATTERS AND ISSUER PURCHASES OF EQUITY SECURITIES
Our common stock is quoted on the OTC marketplace operated by the OTC Markets Group, Inc., under the ticker symbol “CPWR.” The following table sets forth, for the periods indicated, the range of high and low closing prices of our common stock per quarter as reported by the OTC Markets. All quoted prices reflect interdealer prices without retail mark-up, mark-down, or commission, adjusted to account for past stock splits, and may not necessarily represent actual transactions:
| | Low | | | High | |
Year Ending December 31, 2023 | | | | | | |
Second Quarter | | $ | 0.006 | | | $ | 0.017 | |
First Quarter | | $ | 0.006 | | | $ | 0.010 | |
| | | | | | | | |
Year Ended December 31, 2022 | | | | | | | | |
Fourth Quarter | | $ | 0.006 | | | $ | 0.017 | |
Third Quarter | | $ | 0.009 | | | $ | 0.020 | |
Second Quarter | | $ | 0.007 | | | $ | 0.043 | |
First Quarter | | $ | 0.006 | | | $ | 0.018 | |
| | | | | | | | |
Year Ended December 31, 2021 | | | | | | | | |
Fourth Quarter | | $ | 0.006 | | | $ | 0.020 | |
Third Quarter | | $ | 0.013 | | | $ | 0.031 | |
Second Quarter | | $ | 0.020 | | | $ | 0.040 | |
First Quarter | | $ | 0.022 | | | $ | 0.094 | |
On August 18, 2023, the closing price per share of our common stock as quoted on the OTC marketplace was $0.0003. As of August 18, 2023, there were approximately 1,474 stockholders of record of our common stock.
Dividends
We have not paid or declared any cash dividends since our inception and do not intend to declare or pay any such dividends in the foreseeable future. Our ability to pay cash dividends is subject to limitations imposed by state law.
Equity Compensation Plan
We do not have any securities authorized under equity compensation plans.
Recent Sales of Unregistered Securities
During the year ended December 31, 2022, we issued 10,000,000 shares of common stock with a fair value of $185,000 for the conversion of a portion of our notes payable in the amount of $45,650.
During the year ended December 31, 2022, we issued 135 shares of Series D Preferred Stock for cash proceeds of $270,000.
During the year ended December 31, 2022, we issued 143 shares of Series D Preferred Stock valued at $286,000 upon conversion of $215,000 of notes and $66,126 of related accrued interest.
These securities were issued in reliance on the exemption from registration provided in Section 4(a)(2) of the Securities Act of 1933, as amended, for transactions not involving any public offering. The investor is an “accredited investor,” as that term is defined in Rule 501(a) of Regulation D, and confirmed the foregoing and acknowledged, in writing, that the securities were acquired and will be held for investment. No underwriter participated in the offer and sale of these securities, and no commission or other remuneration was paid or given directly or indirectly in connection therewith.
ITEM 6. [RESERVED]
ITEM 7. MANAGEMENT’S DISCUSSION AND ANALYSIS OF FINANCIAL CONDITION AND RESULTS OF OPERATIONS
The following discussion and analysis of our financial condition and operating results should be read together with our financial statements and related notes included elsewhere in this report. This discussion and analysis and other parts of this report contain forward-looking statements based upon current beliefs, plans, and expectations that involve risks, uncertainties, and assumptions. Our actual results may differ materially from those anticipated in these forward-looking statements as a result of various factors, including those set forth under “Risk Factors” or in other parts of this report. Our fiscal quarters end on March 31, June 30, September 30, and December 31, and our current fiscal year ended on December 31, 2022.
Overview
We develop projects for renewable power generation, desalinated water production, and air conditioning using our proprietary technologies designed to extract energy from the temperature differences between warm surface water and cold deep water. In addition, our projects provide ancillary products such as potable/bottle water and high-profit aquaculture, mariculture, and agriculture opportunities.
We currently have no source of revenue, so as we continue to incur costs, we are dependent on external funding for operations. We cannot assure that such funding will be available or, if available, can be obtained on acceptable or favorable terms.
Our operating expenses consist principally of expenses associated with the development of our projects until we determine that a particular project is feasible. Salaries and wages consist primarily of employee salaries and wages, payroll taxes, and health insurance. Our professional fees are related to consulting, engineering, legal, investor relations, outside accounting, and auditing expenses. General and administrative expenses include travel, insurance, rent, marketing, and miscellaneous office expenses. The interest expense includes interest and discounts related to our loans and notes payable.
Results of Operations
Comparison of Years Ended December 31, 2022 and 2021
We had no revenue in the years ended December 31, 2022 and 2021.
During the year ended December 31, 2022, we had salaries and compensation of $791,392, compared to salaries and wages of $830,655 during the same period for 2021, a decrease of 4.7%, which is attributable to a reduction in staff because of cost-cutting measures due to our lack of revenue and funding, partially offset by an increase in executive compensation.
During the years ended December 31, 2022 and 2021, we recorded professional fees of $557,055 and $958,101, respectively, a decrease of 41.8% year over year. During 2022, our legal fees were lower due to decreased fees related to the continuing Memphis litigation issues, as compared to fees incurred in the 2021 period.
General and administrative expenses were $170,160 during the year ended December 31, 2022, compared to $193,125 for the same period in 2021, a decrease of 11.9%, primarily resulting from decreases in travel expense and various office expenses.
For the year ended December 31, 2021, we issued 1,693,877 shares of common stock, valued at $83,000, which is included in interest expense. This was a settlement of a second commitment for a convertible promissory note dated May 22, 2018. We did not issue any stock for compensation during the year ended December 31, 2022.
Our interest expense was $1,815,800 for the year ended December 31, 2021, compared to $1,745,194 for the same period of the previous year, an increase of 4.1%. In addition to interest on our notes payable of $1,662,194 for the year ended December 31, 2021, we also incurred the $83,000 commitment fee discussed above.
Our amortization of debt discount and loan fee expenses was $210,351 for the year ended December 31, 2022, compared to $362,259 for the same period of the previous year. The decrease reflects the continued amortization of the fair value of embedded conversion options related with convertible notes payable and recorded as discount, which is amortized over the life of the convertible notes payable. There were no additions to debt discount during 2022. In addition, there was a loss on change in the fair value of the derivative liability of $3,428,245 during the year ended December 31, 2022, as compared to a gain of $1,305,482 for the same period in 2021. Also, we recorded the gain on conversion of convertible notes of $60,901 and $113,215 for the years ended December 31, 2022 and 2021, respectively.
Our operations used net cash of $327,213 in 2022, as compared to $542,630 in the prior year. The decrease in cash used was primarily the result of a decrease in loss, after adjusting for noncash activities, of $308,338, partially offset by a decrease in the change in prepaid expenses and accounts payable and accrued expenses of $92,921.
Financing activities provided cash of $327,660 for our operations during the year ended December 31, 2022, as compared to providing cash of $536,145 in the prior year, a decrease of 38.9%. During 2022, we received $270,000 in proceeds from the sale of preferred stock and we received $57,660 in working capital advances from related parties. During 2021, proceeds from new notes payable were $540,000 in 2021, and repayments of notes payable were $3,855.
Liquidity and Capital Resources
At December 31, 2022, our principal source of liquidity consisted of $1,404 of cash, as compared to $957 of cash at December 31, 2021. At December 31, 2022, we had negative working capital (current assets minus current liabilities) of $36,199,026. In addition, our stockholders’ deficiency was $36,199,026 at December 31, 2022, compared to stockholders’ deficiency of $30,027,924 at December 31, 2021, an increase in the deficiency of $6,171,102. We are focusing our efforts on promoting and marketing our technology by developing and executing contracts. We are exploring external funding alternatives, as our current cash is insufficient to fund operations for the next 12 months.
Our consolidated financial statements have been prepared assuming we will continue as a going concern. We have experienced recurring losses from operations and have an accumulated deficit. Our ability to continue our operations as a going concern is dependent on the success of management’s plans, which include the raising of capital through debt and/or equity markets until such time that revenue provided by operations is sufficient to fund working capital requirements. We will require additional funding to finance the growth of our current and expected future operations as well as to achieve our strategic objectives The accompanying financial statements have been prepared on a going concern basis, which contemplates the realization of assets and the satisfaction of liabilities in the normal course of business.
We have no significant contractual obligations or commercial commitments not reflected on our balance sheet as of this date.
Critical Accounting Policies and Estimates
We have identified the policies outlined below as critical to our business operations and an understanding of our results of operations. The list is not intended to be a comprehensive list of our accounting policies. In many cases, the accounting treatment of a particular transaction is specifically dictated by accounting principles generally accepted in the United States, with no need for management’s judgment in their application. The impact and any associated risks related to these policies on our business operations is discussed throughout Management’s Discussion and Analysis of Financial Condition and Results of Operations when such policies affect our reported and expected financial results. For a detailed discussion on the application of these and other accounting policies, see the notes to our consolidated financial statements for the year ended December 31, 2021. Note that our preparation of the consolidated financial statements requires us to make estimates and assumptions that affect the reported amount of assets and liabilities, disclosure of contingent assets and liabilities at the date of our consolidated financial statements, and the reported amounts of revenue and expenses during the reporting period. We cannot assure that actual results will not differ from those estimates.
Income Taxes
We use the liability method of accounting for income taxes. Under the liability method, deferred tax assets and liabilities are determined based on temporary differences between financial reporting and tax bases of assets and liabilities and on the amount of operating loss carry-forwards and are measured using the enacted tax rates and laws that will be in effect when the temporary differences and carry-forwards are expected to reverse. An allowance against deferred tax assets is recorded when it is more likely than not that such tax benefits will not be realized.
Fair Value of Derivative Liability
We identified conversion features embedded within convertible debt issued. We have determined that the features associated with the embedded conversion option should be accounted for at fair value as a derivative liability. We have elected to account for these instruments together with fixed conversion price instruments as derivative liabilities as we cannot determine if a sufficient number of shares would be available to settle all potential future conversion transactions. We value the derivative liabilities using the Black-Scholes option valuation model. The derivative liabilities are valued at each reporting date and the change in fair value is reflected as change in fair value of derivative liability.
Contingencies
In the normal course of business, we are subject to contingencies, including legal proceedings and claims arising out of our business that relate to a wide range of matters, such as government investigations and tax matters. We recognize a liability for such contingency if we determine it is probable that a loss has occurred and a reasonable estimate of the loss can be made. We may consider many factors in making these assessments including historical and the specific facts and circumstances of each matter.
Recent Accounting Pronouncements
We have reviewed all recently issued, but not yet adopted, accounting standards to determine their effects, if any, on our consolidated results of operations, financial position, and cash flows. Based on that review, we believe that none of these pronouncements will have a significant effect on current or future earnings or operations (see Note 1 of the notes to our consolidated financial statements for the year ended December 31, 2022).
ITEM 7A. QUANTITATIVE AND QUALITATIVE DISCLOSURES ABOUT MARKET RISK
Not applicable.
ITEM 8. FINANCIAL STATEMENTS AND SUPPLEMENTARY DATA
Our consolidated financial statements, including the Report of Independent Registered Public Accounting Firm on our consolidated financial statements, are included beginning on page F-1 of this report, which are incorporated herein by reference.
ITEM 9. CHANGES IN AND DISAGREEMENTS WITH ACCOUNTANTS ON ACCOUNTING AND FINANCIAL DISCLOSURE
None.
ITEM 9A. CONTROLS AND PROCEDURES
Evaluation of Disclosure Controls and Procedures
We maintain disclosure controls and procedures that are designed to ensure that information required to be disclosed by us, in the reports that we file or submit to the SEC under the Exchange Act, is recorded, processed, summarized, and reported within the periods specified by the SEC’s rules and forms and that information is accumulated and communicated to our management, including our principal executive and principal financial officer (whom we refer to in this periodic report as our Certifying Officer), as appropriate to allow timely decisions regarding required disclosure. Our management is responsible for establishing and maintaining adequate internal control over financial reporting. Our management evaluated, with the participation of our Certifying Officer, the effectiveness of our disclosure controls and procedures (as defined in Rule 13a-15(e) under the Exchange Act) as of December 31, 2022, pursuant to Rule 13a-15(b) under the Exchange Act. Based upon that evaluation, our Certifying Officer concluded that, as of December 31, 2022, our disclosure controls and procedures were not effective to provide reasonable assurance because certain deficiencies involving internal controls constituted material weaknesses, as discussed below. The material weaknesses identified did not result in the restatement of any previously reported financial statements or any other related financial disclosure, and management does not believe that the material weaknesses had any effect on the accuracy of our financial statements for the current reporting period.
Limitations on Effectiveness of Controls
A system of controls, however well designed and operated, can provide only reasonable, and not absolute, assurance that the system will meet its objectives. The design of a control system is based, in part, upon the benefits of the control system relative to its costs. Control systems can be circumvented by the individual acts of some persons, by collusion of two or more people, or by management override of the control. In addition, over time, controls may become inadequate because of changes in conditions, or the degree of compliance with the policies or procedures may deteriorate. Also, the design of any control system is based in part upon assumptions about the likelihood of future events.
Changes in Internal Control over Financial Reporting
There were no changes in our internal control over financial reporting that occurred during the fiscal quarter ended December 31, 2022, that materially affected, or are reasonably likely to materially affect, our internal control over financial reporting.
Management’s Annual Report on Internal Control over Financial Reporting
Our management is responsible for establishing and maintaining adequate internal control over financial reporting as defined in Rule 13a-15(f) under the Exchange Act. We have assessed the effectiveness of those internal controls as of December 31, 2022, using the Committee of Sponsoring Organizations of the Treadway Commission (“COSO”) Internal Control—Integrated Framework (2013) as a basis for our assessment.
Because of inherent limitations, internal control over financial reporting may not prevent or detect misstatements. Therefore, even those systems determined to be effective can provide only reasonable assurance respecting financial statement preparation and presentation. Further, the design of a control system must reflect the fact that there are resource constraints, and the benefits of controls must be considered relative to their costs.
A material weakness in internal controls is a deficiency in internal control, or combination of control deficiencies, that adversely affects our ability to initiate, authorize, record, process, or report external financial data reliably in accordance with accounting principles generally accepted in the United States of America such that there is more than a remote likelihood that a material misstatement of our annual or interim financial statements that is more than inconsequential will not be prevented or detected.
Based on our evaluation of internal control over financial reporting, our management concluded that our internal control over financial reporting was not effective as of December 31, 2022.
As of December 31, 2022, management identified the following material weaknesses:
| ● | Control Environment - We did not maintain an effective control environment for internal control over financial reporting. |
| ● | Segregation of Duties - As a result of limited resources and staff, we did not maintain proper segregation of incompatible duties. The effect of the lack of segregation of duties potentially affects multiple processes and procedures. |
| ● | Entity Level Controls - We failed to maintain certain entity-level controls as defined by the 2013 framework issued by COSO. Specifically, our lack of staff does not allow us to effectively maintain a sufficient number of adequately trained personnel necessary to anticipate and identify risks critical to financial reporting. There is a risk that a material misstatement of the financial statements could be caused, or at least not be detected in a timely manner, due to lack of adequate staff with such expertise. |
| ● | Access to Cash - One executive had the ability to transfer from our bank accounts. |
These weaknesses are continuing. Management and the board of directors are aware of these weaknesses that result because of limited resources and staff. Management has begun the process of formally documenting our key processes as a starting point for improved internal control over financial reporting. Efforts to fully implement the processes we have designed have been put on hold due to limited resources, but we anticipate a renewed focus on this effort in the future. Due to our limited financial and managerial resources, we cannot assure when we will be able to implement effective internal controls over financial reporting.
This annual report does not include an attestation report of our registered public accounting firm regarding internal control over financial reporting. Management’s report was not subject to attestation by our registered public accounting firm pursuant to temporary rules of the SEC that permit us to provide only management’s report in this annual report.
ITEM 9B. OTHER INFORMATION
None.
ITEM 9C. DISCLOSURE REGARDING FOREIGN JURISDICTIONS THAT PREVENT INSPECTIONS
None
PART III
ITEM 10. DIRECTORS, EXECUTIVE OFFICERS AND CORPORATE GOVERNANCE
The following table sets forth the names, ages, and positions of our executive officers and directors as of December 31, 2022:
Name | | Age | | Position |
Jeremy P. Feakins | | 69 | | Chairman of the Board, Chief Executive Officer, Chief Financial Officer and Secretary/Treasurer |
Peter H. Wolfson | | 58 | | Director |
Antoinette K. Hempstead | | 58 | | Director |
Jeremy P. Feakins has served as chairman of our board and our chief executive officer, chief financial officer, and secretary/treasurer since March 2015. Mr. Feakins has over 40 years of experience as an entrepreneur and investor, having founded two technology-based companies. Between 1990 and 2006, Mr. Feakins was the chairman and chief executive officer of Medical Technology & Innovations, Inc. (MTI), a developer and manufacturer of a microprocessor-based, vision-screening device and other medical devices located in Lancaster, PA. In 1996, he managed the public listing of MTI on the over-the-counter markets and subsequently structured the sale of the rights to MTI’s vision-screening product to a major international eyewear company. Between 1998 and 2006, he was a managing member of Growth Capital Resources LLC, a venture capital company located in Lancaster, PA, where he successfully managed the public listings for four small companies on the over-the-counter market. Between 2005 and 2008, he served as executive vice chairman and member of the board of directors of Caspian International Oil Corporation (OTC: COIC), an oil exploration and services company located in Houston, TX and Almaty, KZ, where he managed its public listing. Since 2008, Mr. Feakins has been the chairman and managing partner of the JPF Venture Fund 1, LP, a venture capital company located in Lancaster, PA, focused on companies involved with humanitarian and/or sustainability projects. Since 2014, Mr. Feakins has been chairman and chief executive officer of JPF Venture Group, Inc., which provides strategic and operational business assistance to start-up, early-stage, and middle-market high-growth businesses and is a principal stockholder of our stock. Mr. Feakins graduated from the Defence College of Logistics and Personnel Administration, Shrivenham, UK, and served seven years in the British Royal Navy. He is a member of the Institute of Directors in the United Kingdom and the British American Business Council in the United States. Based on his background in the technology industry and his financial and management background, the board of directors has concluded that Mr. Feakins is qualified to serve as a director.
Peter Wolfson has served as one of our directors since March 2015. Mr. Wolfson is a qualified commercial pilot and has been actively flying with Delta Airlines, a major U.S.-owned international airline company, since 1996. In addition, Mr. Wolfson is the founder and currently involved as president, and chief executive officer of Hans Construction, a developer and builder of upscale homes located in Lancaster, PA, organized in 2005. He also has 10 years’ experience as a financial consultant with a subsidiary of Mass Mutual, developing financial strategies and tax planning. He holds a Bachelor of Science degree in Science, Technology, and Business from Embry Riddle Aeronautical University and Edison State College. Based on his financial background, the board of directors has concluded that Mr. Wolfson is qualified to serve as director.
Antoinette Knapp Hempstead was appointed as a director in February 2017. Prior to that, Ms. Hempstead served as our chief executive officer and president from April 2013 until March 2015 and as our deputy chief executive officer and vice president from August 2002 until March 2015. Currently, she is an IT Project Management Professional for Hexcel Corporation, an international carbon fiber manufacturing company. Ms. Hempstead has over 30 years’ experience in management, software management, software development, and finance. Ms. Hempstead has also served as adjunct faculty for University of Idaho where she taught Computer Science courses. Ms. Hempstead has a Master of Science degree in Computer Science from the University of Idaho and a Bachelor of Science degree in Applied Mathematics from the University of Idaho. Ms. Hempstead provides experience in software development and project management, as well as experience in financial statement preparation and regulatory reporting, to our board of directors. Based on her technical background, the board of directors has concluded that Ms. Hempstead is qualified to serve as a director.
Family Relationships
There are no family relationships between any director and executive officer.
Involvement in Certain Legal Proceedings
During the past 10 years, none of our directors and executive officers has been involved in any of the events described in Item 401(f) of Regulation S-K.
Shareholder Nominations to the Board
Our board of directors, acting as the nominating committee, will consider shareholder nominations to the board of directors.
Committees of the Board
We currently do not have nominating, compensation, or audit committees or committees performing similar functions, and we do not have a written nominating, compensation, or audit committee charter. Our board of directors believes that it is not necessary to have these committees, at this time, because the directors can adequately perform the functions of such committees.
Code of Ethics
We have adopted a code of ethics that applies to all employees, including our executive officers, a copy of which is included as an exhibit to this report.
ITEM 11. EXECUTIVE COMPENSATION
The following table sets forth, for the fiscal years ended December 31, 2022 and 2021, the dollar value of all cash and noncash compensation earned by any person that was our principal executive officer, or PEO, during the preceding fiscal year:
| | | | | | | | | | | | | | | | Non-Equity | | | Non-Qualified | | | | | | | |
| | | | | | | | | | | | | | | | Incentive | | | Deferred | | | All | | | | |
| | Year | | | | | | | | Stock | | | Option | | | Plan | | | Compensation | | | Other | | | | |
| | Ended | | Salary | | | Bonus | | | Awards | | | Awards | | | Compensation | | | Earnings | | | Compensation | | | Total | |
Name and Principal Position | | December 31, | | $ | | | $ | | | $ | | | $ | | | $ | | | $ | | | $ | | | $ | |
Jeremy P. Feakins | | 2022 | | | 427,022 | (1) | | | - | | | | - | | | | - | | | | - | | | | - | | | | - | | | | 427,022 | |
Principal Executive Officer | | | | | | | | | | | | | | | | | | | | | | | | | | | | | | | | | | |
Principal Financial Officer | | 2021 | | | 388,220 | (2) | | | - | | | | - | | | | - | | | | - | | | | - | | | | - | | | | 388,220 | |
(1) | For the fiscal year ended December 31, 2022, $427,022 of Mr. Feakins’ was accrued, but unpaid. |
(2) | For the fiscal year ended December 31, 2021, $383,220 of Mr. Feakins’ was accrued, but unpaid. |
Narrative Disclosure to Summary Compensation Table
On January 1, 2011, we entered into a five-year employment agreement with an individual to serve as our chief executive officer. The employment agreement provides for successive one-year term renewals unless it is expressly cancelled by either party 100 days prior to the end of the term. Under the agreement, the chief executive officer will receive an annual salary of $350,000, a car allowance of $12,000, and company-paid health insurance. The agreement also provides for bonuses equal to one times annual salary plus 500,000 shares of common stock for each additional project that generates $25 million or more revenue to us. The chief executive officer is entitled to receive severance pay in the lesser amount of three years’ salary or 100% of the remaining salary if the remaining term is less than three years. On June 3, 2019, we issued 1,000,000 shares of Series C Preferred Stock to the chief executive officer, with a fair value of $69,277, to compensate him for his performance.
On June 29, 2017, the board of directors approved extending the employment agreement for the chief executive officer for an additional five years. The salary and other compensation will be increased to account for inflation since the original employment agreement was executed.
Effective June 9, 2022, we entered into a second addendum to the employment contract. Among other provisions, the addendum extends the employment agreement through December 31, 2025, and increases the annual salary to $454,738 from $388,220.
Outstanding Equity Awards at Fiscal Year-End
No stock option awards were exercisable or unexercisable as of December 31, 2022, for any executive officer.
Director Compensation
For the year ended December 31, 2022, no compensation was awarded to, earned by, or paid to our nonemployee directors. Mr. Feakins, who is our chief executive officer, did not receive compensation for his service as a director. The compensation received by Mr. Feakins as an officer is presented in the above summary compensation table.
ITEM 12. SECURITY OWNERSHIP OF CERTAIN BENEFICIAL OWNERS AND MANAGEMENT AND RELATED STOCKHOLDER MATTERS
The following table sets forth, as of August 18, 2023, the name and shareholdings of each person that owns of record, or was known by us to own beneficially, 5% or more of the common stock currently outstanding; the name and shareholdings of each named executive officer and each director; and the shareholdings of all executive officers and directors as a group. Unless indicated otherwise in the footnotes, each person named below has, to the best of our knowledge, sole voting and investment power with respect to all shares of common stock shown as beneficially owned by each person:
| | | | | | | | Common | | | | | | | |
| | | | | | | | Stock | | | | | | | |
| | | | | Voting | | | Underlying | | | | | | | |
| | Common | | | Preferred | | | Convertible | | | | | | Percent of | |
| Name and Address of Beneficial Owner(1) | | Stock | | | Stock(3)(4) | | | Securities | | | Total | | | Class(2) | |
| Principal Stockholders: | | | | | | | | | | | | | | | |
| Jeremy Feakins (4) | | | 7,816,985 | | | | 102,200,000 | | | | 10,669,075 | | | | 120,686,060 | | | | 40.6 | % |
| | | | | | | | | | | | | | | | | | | | |
| Directors and Named Executive Officers: | | | | | | | | | | | | | | | | | | | | |
| Jeremy Feakins (4) | | | 7,816,985 | | | | 102,200,000 | | | | 10,669,075 | | | | 120,686,060 | | | | 40.6 | % |
| Antoinette Hempstead (5) | | | 114,925 | | | | - | | | | 1,000,000 | | | | 1,114,925 | | | * | |
| Peter H. Wolfson (6) | | | 658,714 | | | | - | | | | 2,903,179 | | | | 3,561,893 | | | | 1.9 | % |
| All directors and executive officers as a group (3 persons) | | | 8,590,624 | | | | 102,200,000 | | | | 14,572,254 | | | | 125,362,878 | | | | 41.6 | % |
| | | | | | | | | | | | | | | | | | | | |
| 5% Sharesholders | | | | | | | | | | | | | | | | | | | | |
| Michael D. Stauch (7) | | | - | | | | 28,000,000 | | | | 4,250,000 | | | | 32,250,000 | | | | 14.9 | % |
| Paula Vitz (8) | | | 1,144,749 | | | | 13,400,000 | | | | 812,500 | | | | 15,357,249 | | | | 7.7 | % |
| Joseph Layman (9) | | | 1,987,128 | | | | 7,600,000 | | | | 2,875,000 | | | | 12,462,128 | | | | 6.4 | % |
* Less than 1%
(1) | 3675 Market Street, Suite 200, Philadelphia PA 19104, is the address for all stockholders in the table. |
| |
(2) | Based on 184,370,469 shares of common stock issued and outstanding as of August 18, 2023. |
| |
(3) | Each share of Series D Preferred stock is convertible into 200,000 shares of common stock. Each share of Series D Preferred Stock votes with common stock on an as-if converted basis |
| |
(4) | Includes 7,452,554 shares of common stock owned of record by Jeremy P. Feakins and 364,431 shares of common stock owned of record by JPF Venture Group, Inc., which is an investment entity that is majority-owned and controlled by Mr. Feakins and, as such, is deemed to be beneficially owned by him. Also includes 5,000,000 shares of our common stock issuable upon conversion of preferred stock within 60 days from August 18, 2023 5,669,075 shares of our common stock issuable upon conversion of notes within 60 days from August 18, 2023. Also includes 500 shares of Series D Preferred Stock which is convertible into 100,000,000 shares of common stock (but not within 60 days of August 18, 2023) which votes with common stock on an as-if converted basis. |
| |
(5) | Includes 226 shares of common stock owned of record by Antoinette Hempstead and 114,699 shares of common stock owned of record by A.R. Hempstead Revocable Trust, which is owned and controlled by Ms. Hempstead and, as such, is deemed to be beneficially owned by her. Also includes 1,000,000 shares of our common stock issuable upon conversion of preferred stock within 60 days from August 18, 2023. |
| |
(6) | Includes 1,000,000 shares of our common stock issuable upon conversion of preferred stock within 60 days from August 18, 2023, and 1,903,179 shares of our common stock issuable upon conversion of notes within 60 days from August 18, 2023. |
| |
(7) | Includes 4,250,000 shares of our common stock issuable upon conversion of notes within 60 days from August 18, 2023.Also includes 140 shares of Series D Preferred Stock which is convertible into 28,000,000 shares of common stock (but not within 60 days of August 18, 2023) which votes with common stock on an as-if converted basis. |
| |
(8) | Includes 312,500 shares of our common stock issuable upon conversion of preferred stock within 60 days from August 18, 2023, and 500,000 shares of our common stock issuable upon conversion of notes within 60 days from August 18, 2023. Also includes 67 shares of Series D Preferred Stock which is convertible into 13,400,000 shares of common stock (but not within 60 days of August 18, 2023) which votes with common stock on an as-if converted basis. |
| |
(9) | Includes 625,000 shares of our common stock issuable upon conversion of preferred stock within 60 days from August 18, 2023, and 2,250,000 shares of our common stock issuable upon conversion of notes within 60 days from August 18, 2023. Also includes 38 shares of Series D Preferred Stock which is convertible into 7,600,000 shares of common stock (but not within 60 days of August 18, 2023) which votes with common stock on an as-if converted basis. |
| |
ITEM 13. CERTAIN RELATIONSHIPS AND RELATED PERSONS, AND DIRECTOR INDEPENDENCE
Related-Party Transactions
For each of the years ended December 31, 2022 and 2021, we recorded rent expense of $120,000 to a company controlled by our chief executive officer under a lease agreement. The lease is for a one-year term and, unless either party shall give to the other written notice of termination, the term shall renew for a further period of one year, and so on from year to year until terminated by either party. At December 31, 2022, we had a payable to the entity of $70,000.
For the years ended December 31, 2022 and 2021, we recorded charges incurred to a company controlled by our chief executive officer for reimbursement of accounting and administrative services provided to us by an employee of that company. For the years ended December 31, 2022 and 2021, we recorded expense of $114,814 and $105,201, respectively, to this company. At December 31, 2022, we had a payable to the entity of $74,070.
On October 20, 2016, we borrowed $12,500 from an independent director pursuant to a promissory note. The terms of the note are as follows: (i) interest is payable at 6% per annum; (ii) the note is payable 90 days after demand; and (iii) the payee is authorized to convert part or all of the note balance and accrued interest, if any, into shares of our common stock at the rate of one share for each $0.03 of principal amount of the note. This conversion share price was adjusted to $0.01384 for the reverse stock splits. As of December 31, 2022, the outstanding balance was $12,500, plus accrued interest of $4,798.
On March 9, 2017, we issued a promissory note payable of $200,000 to a related party in which our chief executive officer is an officer and director. The note bears interest of 10% and is due and payable within 90 days after demand. During the year ended December 31, 2018, we received an additional $2,000 and repaid $25,000. The outstanding balance was $177,000 and accrued interest was $104,684 as of December 31, 2022.
On November 6, 2017, we entered into an agreement and promissory note with JPF Venture Group, Inc. to loan up to $2,000,000 to us. The terms of the note are as follows: (i) interest is payable at 10% per annum; (ii) all unpaid principal and all accrued and unpaid interest is due and payable at the earliest of resolution of the Memphis litigation (as defined therein), December 31, 2020, or when we are otherwise able to pay. On September 30, 2018, the note was amended to extend the maturity date to the earliest of a resolution of the Memphis litigation, December 31, 2020, or when we are otherwise able to pay. This note is in default. As of December 31, 2022, the outstanding balance was $543,093 and the accrued interest was $309,425.
On January 18, 2018, Jeremy P. Feakins & Associates, LLC, an investment entity owned by our chief executive, chief financial officer, and a director, agreed to extend the due date for repayment of a $2,265,000 note issued in 2014 to the earlier of December 31, 2020, or the date of the financial closings of our Baha Mar project (or any other project of $25 million or more), whichever occurs first. On August 15, 2018, principal of $618,500 and accrued interest of $207,731 were converted to 826,231 shares at $1.00 per share, which was ratified by a disinterested majority of the board of directors. As of December 31, 2022, the note balance was $1,102,500 and the accrued interest was $964,697. This note is in default.
We remain liable for the loans made to us by JPF Venture Group, Inc. before the 2018 merger. As of December 31, 2022, the outstanding balance of these loans was $581,880 and the accrued interest was $267,263. These notes are in default.
In the fourth quarter of 2019, we issued a series of convertible promissory notes to accredited investors. The notes bear simple interest on outstanding principal at the rate of 8% per annum, computed based on the actual number of days elapsed in a year of 365 days. Each $5,000 loan automatically converts into 250,000 shares of our common stock, either at the time the closing sale price for our common stock is equal to or greater than $1.00 per share, as adjusted for stock splits, stock dividends, reclassification, and the like, or at the maturity date of October 31, 2021, whichever comes first. On October 14, 2019, we borrowed $5,000 from Jeremy P. Feakins, our chief executive officer. During 2022, the note and related accrued interest of $1,052 was converted into preferred stock. On October 14, 2019, we borrowed $5,000 from an independent director. As of December 31, 2022, the outstanding balance of his loan was $5,000 and the accrued interest was $1,279. These notes are in default.
In the fourth quarter of 2019 and during the year ended December 31, 2020, we issued a series of convertible promissory notes to accredited investors. The notes bear simple interest on outstanding principal at the rate of 8% per annum, computed based on the actual number of days elapsed in a year of 365 days. Each $5,000 loan automatically converts into 250,000 shares of our common stock, either at the time the closing sale price for our common stock is equal to or greater than $1.00 per share, as adjusted for stock splits, stock dividends, reclassification, and the like, or at the maturity date of January 2, 2022, whichever comes first. On December 9, 2019, we borrowed $5,000 from Jeremy P. Feakins, our chief executive officer. On January 21, 2020, we borrowed $5,000 from Jeremy P. Feakins. During 2022, the December 9, 2019 $5,000 note and related accrued interest of $991 was converted into preferred stock. As of December 31, 2022, the outstanding balance of his loans was $5,000 and the accrued interest was $1,178. On December 7, 2019, we borrowed $5,000 from independent director. On January 21, 2020, we borrowed an additional $5,000 from an independent director. As of December 31, 2022, the outstanding balance of his loans was $10,000 and the accrued interest was $2,404. These notes are in default.
In the third quarter of 2021, we issued a series of convertible promissory notes to accredited investors. The notes bear simple interest on outstanding principal at the rate of 8% per annum, computed based on the actual number of days elapsed in a year of 365 days. Each $5,000 loan automatically converts into 250,000 shares of our common stock, either at the time the closing sale price for our common stock is equal to or greater than $1.00 per share, as adjusted for stock splits, stock dividends, reclassification, and the like, or at the maturity date of August 30, 2023, whichever comes first. On July 27, 2021, we borrowed $5,000 from an independent director. As of December 31, 2022, the outstanding balance of his loan was $3,528, net of debt discount of $1,472, and the accrued interest was $573. These notes are in default.
On November 11, 2021, we issued a convertible promissory note to an entity controlled by Jeremy P. Feakins, our chief executive officer, in the amount of $5,000. The note bears simple interest on outstanding principal at the rate of 8% per annum, computed based on the actual number of days elapsed in a year of 365 days. The loan automatically converts into 250,000 shares of our common stock, either at the time the closing sale price for our common stock is equal to or greater than $1.00 per share, as adjusted for stock splits, stock dividends, reclassification, and the like, or at the maturity date of November 30, 2023, whichever comes first. As of December 31, 2022, the total outstanding value of this loan was $3,693, net of debt discount of $1,307. The accrued interest was $456 as of December 31, 2022.
Director Independence
Peter Wolfson and Antoinette Hempstead are independent directors under Nasdaq Rule 5605.
ITEM 14. PRINCIPAL ACCOUNTING FEES AND SERVICES
Principal Accountant Fees and Services
The following table summarizes the approximate aggregate fees billed to us or expected to be billed to us by our independent auditors for our 2022 and 2021 fiscal years:
| | Year Ended December 31, | |
| | 2022 | | | 2021 | |
Audit Fees (1) | | $ | 49,112 | | | $ | 38,600 | |
Tax fees | | | - | | | | - | |
Total Fees | | $ | 49,112 | | | $ | 38,600 | |
_______________
(1) | Includes fees for: (i) audits of our consolidated financial statements for the fiscal years ended December 31, 2022 and 2021; (ii) review of our interim period financial statements for fiscal years 2022 and 2021; and (iii) fees related to services normally provided by the accountant in connection with statutory and regulatory filings or engagements. |
Liggett & Webb, P.A. provided our audit for the year ended 2021 and BF Borgers CPA PC provided our audit for the year ended 2022. The firms engaged during 2022 and 2021, respectively, provided no other services, other than those listed above for their respective years.
Audit and Non-Audit Service Preapproval Policy
In accordance with the requirements of the Sarbanes-Oxley Act of 2002 and the rules and regulations promulgated thereunder, our board of directors has adopted an informal approval policy that it believes will result in an effective and efficient procedure to preapprove services performed by the independent registered public accounting firm.
Audit Services. Audit services include the annual financial statement audit (including quarterly reviews) and other procedures required to be performed by the independent registered public accounting firm to be able to form an opinion on our consolidated financial statements. The board of directors preapproves specified annual audit services engagement terms and fees and other specified audit fees. All other audit services must be specifically preapproved by the board of directors. The board of directors monitors the audit services engagement and may approve, if necessary, any changes in terms, conditions, and fees resulting from changes in audit scope or other items.
Audit-Related Services. Audit-related services are assurance and related services that are reasonably related to the performance of the audit or review of our consolidated financial statements, which historically have been provided to us by the independent registered public accounting firm and are consistent with the SEC’s rules on auditor independence. The board of directors has approved specified audit-related services within preapproved fee levels. All other audit-related services must be preapproved by the board of directors.
Tax Services. The board of directors preapproves specified tax services that it believes would not impair the independence of the independent registered public accounting firm and that are consistent with SEC’s rules and guidance. The board of directors must specifically approve all other tax services.
All Other Services. Other services are services provided by the independent registered public accounting firm that do not fall within the established audit, audit-related, and tax services categories. The board of directors preapproves specified other services that do not fall within any of the specified prohibited categories of services.
Procedures. All proposals for services to be provided by the independent registered public accounting firm, which must include a detailed description of the services to be rendered and the amount of corresponding fees, are submitted to the chairman of the board of directors and the chief financial officer. The chief financial officer authorizes services that have been preapproved by the board of directors. The chief financial officer submits requests or applications to provide services that have not been preapproved by the board of directors, which must include an affirmation by the chief financial officer and the independent registered public accounting firm that the request or application is consistent with the SEC’s rules on auditor independence, to the board of directors (or its chair or any of its other members pursuant to delegated authority) for approval.
PART IV
ITEM 15. EXHIBITS AND FINANCIAL STATEMENT SCHEDULES
(a) | The following financial statements are filed as part of this report: |
(b) | The following exhibits are filed as part of this report: |
Exhibit Number* | | Title of Document | | Location |
| | | | |
Item 3 | | Articles of Incorporation and Bylaws | | |
3.01 | | Articles of Incorporation of TetriDyn Solutions, Inc., dated May 15, 2006 | | Incorporated by reference from the Current Report on Form 8-K filed June 7, 2006 |
3.02 | | Bylaws | | Incorporated by reference from the Current Report on Form 8-K filed June 7, 2006 |
3.03 | | Designation of Rights, Privileges, and Preferences of Series A Preferred Stock | | Incorporated by reference from the Annual Report on Form 10-K for the year ended December 31, 2009, filed March 31, 2010 |
3.04 | | Certificate of Change Pursuant to NRS 78.209 of TetriDyn Solutions, Inc., filed with the Nevada Secretary of State on December 6, 2016 | | Incorporated by reference from the Current Report on Form 8-K filed December 12, 2016 |
3.05 | | Certificate of Correction of TetriDyn Solutions, Inc., filed with the Nevada Secretary of State on December 15, 2016 | | Incorporated by reference from the Current Report on Form 8-K filed December 12, 2016 |
3.06 | | Certificate of Amendment to Articles of Incorporation dated May 8, 2018 | | Incorporated by reference from the Current Report on Form 8-K filed May 12, 2018 |
3.07 | | Certificate of Designation filed with the Nevada Secretary of State on June 6, 2019 | | Incorporated by reference from the Quarterly Report for the quarter ended June 30, 2019, filed August 13, 2019 |
3.08 | | Certificate of Amendment to Designation (Series D Convertible Preferred Stock) filed June 12, 2023 | | Incorporated by reference from the Current Report on Form 8-K filed June 15, 2023 |
Item 4 | | Instruments Defining the Rights of Security Holders, including indentures | | |
4.01 | | Specimen Stock Certificate | | Incorporated by reference from the Registration Statement on Form S-8 filed August 25, 2018 |
Item 10 | | Material Contracts | | |
10.07 | | Loan Agreement between TetriDyn Solutions, Inc., and Southeast Idaho Council of Governments, Inc., together with related promissory notes, dated December 23, 2009 | | Incorporated by reference from the Annual Report on Form 10-K for the year ended December 31, 2009, filed March 31, 2010 |
10.18 | | Consolidated Promissory Note for $394,350 dated December 31, 2014 | | Incorporated by reference from the Current Report on Form 8-K filed June 8, 2015 |
10.25 | | Promissory Note dated February 25, 2016 | | Incorporated by reference from the Current Report on Form 8-K filed March 1, 2016 |
10.26 | | Promissory Note dated November 23, 2015 | | Incorporated by reference from the Annual Report on Form 10-K for the year ended December 31, 2015, filed March 30, 2016 |
10.29 | | Promissory Note dated October 20, 2016 | | Incorporated by reference from the Current Report on Form 8-K filed October 20, 2016 |
10.30 | | Promissory Note dated May 20, 2016 | | Incorporated by reference from the Current Report on Form 8-K filed May 24, 2016 |
10.31 | | Amendment to Convertible Promissory Notes dated February 24, 2018 | | Incorporated by reference from the Current Report on Form 8-K filed March 2, 2018 |
10.32 | | Agreement and Plan of Merger between TetriDyn Solutions, Inc. and Ocean Thermal Energy Corporation dated March 1, 2018 | | Incorporated by reference from the Current Report on Form 8-K filed March 10, 2018 |
10.36 | | Note and Warrant Purchase Agreement dated December 28, 2018 | | Incorporated by reference from the Current Report on Form 8-K filed January 3, 2018 |
10.37 | | Form of Unsecured Promissory Note | | Incorporated by reference from the Current Report on Form 8-K filed January 3, 2018 |
10.38 | | Form of Unsecured Common Stock Purchase Warrant | | Incorporated by reference from the Current Report on Form 8-K filed January 3, 2018 |
10.42 | | Securities Purchase Agreement dated February 16, 2018, between Ocean Thermal Energy Corporation and L2 Capital, LLC | | Incorporated by reference from the Current Report on Form 8-K filed February 23, 2018 |
10.43 | | Senior Secured Promissory Note dated February 16, 2018, issued to L2 Capital, LLC | | Incorporated by reference from the Current Report on Form 8-K filed February 23, 2018 |
10.44 | | Security Agreement dated February 16, 2018, between Ocean Thermal Energy Corporation and L2 Capital, LLC | | Incorporated by reference from the Current Report on Form 8-K filed February 23, 2018 |
10.45 | | Common Stock Purchase Warrant dated February 16, 2018, issued to L2 Capital, LLC | | Incorporated by reference from the Current Report on Form 8-K filed February 23, 2018 |
10.46 | | Common Stock Purchase Warrant dated February 16, 2018, issued to Craft Capital Management, LLC | | Incorporated by reference from the Current Report on Form 8-K filed February 23, 2018 |
10.47 | | Lease Agreement between Ocean Thermal Energy Corporation and Queen Street Development Partners 1, LP, as amended | | Incorporated by reference from the Annual Report for the year ended December 31, 2018, filed March 22, 2019 |
10.48 | | Employment Agreement with Jeremy P. Feakins dated January 1, 2011** | | Incorporated by reference from the Annual Report for the year ended December 31, 2018, filed March 22, 2019 |
10.49 | | Loan Agreement, Promissory Note, and Warrant to Purchase up to 3,295,761 Shares of Common Stock between Ocean Thermal Energy Corporation and DCO Energy, LLC, dated February 10, 2012, including Forbearance and Loan Extension Agreement dated April 1, 2016 | | Incorporated by reference from the Annual Report for the year ended December 31, 2018, filed March 22, 2019 |
10.50 | | Form of Loan Agreement, Promissory Note (Series B), Security Agreement, and Warrant (with related schedule) [2013] | | Incorporated by reference from the Annual Report for the year ended December 31, 2018, filed March 22, 2019 |
10.51 | | Promissory Note for $290,000 payable to Theodore Herman dated December 31, 2013 | | Incorporated by reference from the Annual Report for the year ended December 31, 2018, filed March 22, 2019 |
10.52 | | Loan Agreement, Promissory Note, and Warrant to Purchase up to 12,912,500 Shares of Common Stock between Ocean Thermal Energy Corporation and Jeremy P. Feakins & Associates, LLC, dated April 1, 2014, including Forbearance and Loan Extension Agreement (Revised and Reformed) dated April 1, 2016 | | Incorporated by reference from the Annual Report for the year ended December 31, 2018, filed March 22, 2019 |
10.53 | | Loan Agreement, Promissory Note, and Warrant to Purchase up to 200,000 Shares of Common Stock between Ocean Thermal Energy Corporation and Mart Inn, Inc., dated December 22, 2014 | | Incorporated by reference from the Annual Report for the year ended December 31, 2018, filed March 22, 2019 |
10.54 | | Loan Agreement, Promissory Note, and Warrant to Purchase up to 100,000 Shares of Common Stock between Ocean Thermal Energy Corporation and James G. Garner, Jr., dated December 26, 2014 | | Incorporated by reference from the Annual Report for the year ended December 31, 2018, filed March 22, 2019 |
10.55 | | Promissory Note dated April 17, 2015, with extensions | | Incorporated by reference from the Annual Report for the year ended December 31, 2018, filed March 22, 2019 |
10.56 | | Promissory Note dated October 20, 2016, to Peter Wolfson | | Incorporated by reference from the Current Report on Form 8-K filed October 20, 2016. |
10.57 | | Promissory Note dated December 21, 2016, to JPF Venture Group | | Incorporated by reference from the Annual Report for the year ended December 31, 2018, filed March 22, 2019 |
10.58 | | Promissory Note dated March 9, 2018, to Jeremy P. Feakins & Associates, LLC | | Incorporated by reference from the Annual Report for the year ended December 31, 2018, filed March 22, 2019 |
10.59 | | Loan Agreement and Promissory Note with JPF Venture Group, Inc., dated November 6, 2018 | | Incorporated by reference from the Annual Report for the year ended December 31, 2018, filed March 22, 2019 |
10.60 | | Form of Bridge Loan, Warrant, and Promissory Note for December 2018, together with schedule of investors | | Incorporated by reference from the Annual Report for the year ended December 31, 2018, filed March 22, 2019. |
10.61 | | Replacement Convertible Promissory Note to L2 Capital, LLC, dated December 14, 2018 | | Incorporated by reference from the Annual Report for the year ended December 31, 2018, filed March 22, 2019 |
10.62 | | Form of Loan Agreement made January 2, 2019, between Ocean Thermal Energy Corporation and the lenders identified on the scheduled attached thereto | | Incorporated by reference from the Annual Report for the year ended December 31, 2019, filed March 20, 2020 |
10.63 | | Form of Convertible Loan Agreement with a maturity date of October 31, 2021, between Ocean Thermal Energy Corporation and the lenders identified on the scheduled attached thereto | | Incorporated by reference from the Annual Report for the year ended December 31, 2019, filed March 20, 2020 |
10.64 | | Form of Convertible Loan Agreement with a maturity date of December 31, 2022, between Ocean Thermal Energy Corporation and the lenders identified on the scheduled attached thereto | | Incorporated by reference from the Annual Report for the year ended December 31, 2019, filed March 20, 2020 |
10.65 | | Stock Purchase Agreement between Ocean Thermal Energy Corporation and Epaphus Global Energy, LLC, dated August 23, 2022, and executed August 25, 2022 | | Incorporated by reference from the Current Report on Form 8-K filed August 29, 2022. |
10.66 | | Addendum to Chief Executive Officer Employment Agreement Effective June 9, 2022 | | Incorporated by reference from the Quarterly Report for the quarter ended September 30, 2022, filed November 8, 2022 |
10.67 | | Philadelphia lease agreement | | |
Item 14 | | Code of Ethics | | |
14.01 | | TetriDyn Solutions, Inc. Code of Ethics | | Incorporated by reference from the annual report on Form 10-KSB for the year ended December 31, 2006, filed April 2, 2007 |
Item 21 | | Subsidiaries of the Registrant | | |
21.01 | | Schedule of Subsidiaries | | Incorporated by reference from Post-Effective Amendment No. 1/A to the Registration Statement on Form S-1 (Amendment No. 1) filed January 10, 2019 |
Item 31 | | Rule 13a-14(a)/15d-14(a) Certifications | | |
31.01 | | Certification of Principal Executive and Principal Financial Officer Pursuant to Rule 13a-14 | | This filing |
Item 32 | | Section 1350 Certifications | | |
32.01 | | Certification of Chief Executive Officer and Chief Financial Officer Pursuant to 18 U.S.C. Section 1350, as Adopted Pursuant to Section 906 of the Sarbanes-Oxley Act of 2002 | | This filing |
Item 101 | | Interactive Data Files*** | | |
101.INS | | XBRL Instance Document | | This filing |
101.SCH | | XBRL Taxonomy Extension Schema | | This filing |
101.CAL | | XBRL Taxonomy Extension Calculation Linkbase | | This filing |
101.DEF | | XBRL Taxonomy Extension Definition Linkbase | | This filing |
101.LAB | | XBRL Taxonomy Extension Label Linkbase | | This filing |
101.PRE | | XBRL Taxonomy Extension Presentation Linkbase | | This filing |
___________________________
* | All exhibits are numbered with the number preceding the decimal indicating the applicable SEC reference number in Item 601 and the number following the decimal indicating the sequence of the particular document. Omitted numbers in the sequence refer to documents previously filed as an exhibit. |
** | Identifies each management contract or compensatory plan or arrangement required to be filed as an exhibit, as required by Item 15(a)(3) of Form 10-K. |
*** | The XBRL related information in Exhibit 101 will not be deemed “filed” for purposes of Section 18 of the Securities Exchange Act of 1934, as amended, or otherwise subject to liability of that section and will not be incorporated by reference into any filing or other document pursuant to the Securities Act of 1933, as amended, except as will be expressly set forth by specific reference in such filing or document. |
SIGNATURES
Pursuant to the requirements of Section 13 or 15(d) of the Securities Exchange Act of 1934, the registrant has duly caused this report to be signed on its behalf by the undersigned, thereunto duly authorized.
| OCEAN THERMAL ENERGY CORPORATION | |
| | |
Dated: September 5, 2023 | By: | /s/ Jeremy P. Feakins | |
| | Jeremy P. Feakins | |
| | Principal Executive Officer and | |
| | Principal Financial Officer | |
Pursuant to the requirements of the Securities Exchange Act of 1934, this report has been signed below by the following persons on behalf of the registrant and in the capacities and on the dates indicated.
Name | | Title | | Date |
| | | | |
/s/ Jeremy P. Feakins | | Director, Chief Executive Officer and Chief | | September 5, 2023 |
Jeremy P. Feakins | | Financial Officer (Principal Executive Officer and Principal Financial Officer) | | |
| | | | |
/s/ Peter Wolfson | | Director | | September 5, 2023 |
Peter Wolfson | | | | |
| | | | |
/s/ Antoinette K. Hempstead | | Director | | September 5, 2023 |
Antoinette K. Hempstead | | | | |
SUPPLEMENTAL INFORMATION TO BE FURNISHED WITH REPORTS FILED PURSUANT
TO SECTION 15(d) OF THE ACT BY REGISTRANTS WHICH HAVE NOT REGISTERED
SECURITIES PURSUANT TO SECTION 12 OF THE ACT
We will furnish to the SEC, at the same time that it is sent to stockholders, any proxy or information statement that we send to our stockholders in connection with any annual stockholders’ meeting.
OCEAN THERMAL ENERGY CORPORATION
REPORTS OF INDEPENDENT REGISTERED PUBLIC ACCOUNTING FIRMS
AND
CONSOLIDATED FINANCIAL STATEMENTS
DECEMBER 31, 2022 and 2021
Report of Independent Registered Public Accounting Firm
To the shareholders and the board of directors of Ocean Thermal Energy Corporation
Opinion on the Financial Statements
We have audited the accompanying consolidated balance sheet of Ocean Thermal Energy Corporation (the "Company") as of December 31, 2022, the related statement of operations, stockholders' equity (deficit), and cash flows for the year then ended, and the related notes (collectively referred to as the "financial statements"). In our opinion, the financial statements present fairly, in all material respects, the financial position of the Company as of December 31, 2022, and the results of its operations and its cash flows for the year then ended, in conformity with accounting principles generally accepted in the United States.
Substantial Doubt about the Company’s Ability to Continue as a Going Concern
The accompanying financial statements have been prepared assuming that the Company will continue as a going concern. As discussed in Note 3 to the financial statements, the Company’s significant operating losses raise substantial doubt about its ability to continue as a going concern. The financial statements do not include any adjustments that might result from the outcome of this uncertainty.
Basis for Opinion
These financial statements are the responsibility of the Company's management. Our responsibility is to express an opinion on the Company's financial statements based on our audit. We are a public accounting firm registered with the Public Company Accounting Oversight Board (United States) ("PCAOB") and are required to be independent with respect to the Company in accordance with the U.S. federal securities laws and the applicable rules and regulations of the Securities and Exchange Commission and the PCAOB.
We conducted our audit in accordance with the standards of the PCAOB. Those standards require that we plan and perform the audit to obtain reasonable assurance about whether the financial statements are free of material misstatement, whether due to error or fraud. The Company is not required to have, nor were we engaged to perform, an audit of its internal control over financial reporting. As part of our audits we are required to obtain an understanding of internal control over financial reporting but not for the purpose of expressing an opinion on the effectiveness of the Company’s internal control over financial reporting. Accordingly, we express no such opinion.
Our audit included performing procedures to assess the risks of material misstatement of the financial statements, whether due to error or fraud, and performing procedures that respond to those risks. Such procedures included examining, on a test basis, evidence regarding the amounts and disclosures in the financial statements. Our audit also included evaluating the accounting principles used and significant estimates made by management, as well as evaluating the overall presentation of the financial statements. We believe that our audit provides a reasonable basis for our opinion.
Critical Audit Matters
Critical audit matters are matters arising from the current period audit of the financial statements that were communicated or are required to be communicated to the audit committee and that: (1) relate to accounts or disclosures that are material to the financial statements and (2) involved especially challenging, subjective, or complex judgments.
We determined that there are no critical audit matters.
/sBF Borgers CPA PC
BF Borgers CPA PC (PCAOB ID 5041)
We have served as the Company's auditor since 2022
Lakewood, CO
September 5, 2023
REPORT OF INDEPENDENT REGISTERED PUBLIC ACCOUNTING FIRM
To the Shareholders and Board of Directors of:
Ocean Thermal Energy Corporation
Opinion on the Financial Statements
We have audited the accompanying consolidated balance sheet of Ocean Thermal Energy Corporation and Subsidiaries (the “Company”) as of December 31, 2021 and the related consolidated statement of operations, changes in stockholders’ deficiency and cash flows for the year ended December 31, 2021, and the related notes (collectively referred to as “the consolidated financial statements”). In our opinion, the consolidated financial statements present fairly, in all material respects, the financial position of the Company as of December 31, 2021 and the results of its operations and its cash flows for the year ended December 31, 2021 in conformity with accounting principles generally accepted in the United States of America.
Explanatory Paragraph – Going Concern
The accompanying consolidated financial statements have been prepared assuming that the Company will continue as a going concern. As discussed in Note 3 to the consolidated financial statements, the Company has a net loss, a working capital deficiency, and an accumulated deficit. These factors raise substantial doubt about the Company's ability to continue as a going concern. Management’s plans in regard to these matters are described in Note 3. The consolidated financial statements do not include any adjustments that might result from the outcome of this uncertainty
Basis for Opinion
These consolidated financial statements are the responsibility of the Company’s management. Our responsibility is to express an opinion on the Company’s consolidated financial statements based on our audits. We are a public accounting firm registered with the Public Company Accounting Oversight Board (United States) (“PCAOB”) and are required to be independent with respect to the Company in accordance with the U.S. federal securities laws and the applicable rules and regulations of the Securities and Exchange Commission and the PCAOB.
We conducted our audits in accordance with the standards of the PCAOB. Those standards require that we plan and perform the audit to obtain reasonable assurance about whether the consolidated financial statements are free of material misstatement, whether due to error or fraud. The Company is not required to have, nor were we engaged to perform, an audit of its internal controls over financial reporting. Accordingly, we express no such opinion.
Our audits included performing procedures to assess the risks of material misstatement of the consolidated financial statements, whether due to error or fraud, and performing procedures that respond to those risks. Such procedures included examining, on a test basis, evidence regarding the amounts and disclosures in the consolidated financial statements. Our audits also included evaluating the accounting principles used and significant estimates made by management, as well as evaluating the overall consolidated financial statement presentation. We believe that our audits provide a reasonable basis for our opinion.
Critical Audit Matters
The critical audit matters communicated below are matters arising from the current period audit of the consolidated financial statements that were communicated or required to be communicated to the audit committee and that: (1) relate to accounts or disclosures that are material to the consolidated financial statements and (2) involved our especially challenging, subjective, or complex judgments. The communication of critical audit matters does not alter in any way our opinion on the consolidated financial statements, taken as a whole, and we are not, by communicating the critical audit matters below, providing separate opinions on the critical audit matters or on the accounts or disclosures to which they relate.
Valuation of Derivative Liabilities
As described in Note 5 to the consolidated financial statements, the Company measures fair value of derivative liabilities at fair value using level three inputs. To determine fair value of derivative liabilities, the Company determines the appropriate valuation methodology and assumptions, including unobservable inputs. The derivative liabilities are measured at fair value using a Black-Scholes valuation model that uses significant assumptions, including the Company's stock price, historical volatility of the Company's shares, risk-free interest rate and probability of conversion occurrence through maturity.
Auditing management's estimate for the fair value of derivative liabilities was complex and highly judgmental as it involved our assessment of the significant assumptions used by management because the fair value calculations were sensitive to changes in assumptions described above, and certain inputs used in the determination of fair values were based on unobservable data, including, but not limited to, the historical volatility and probability of conversion.
To test the fair value of derivative liabilities, we performed audit procedures that included, among others, evaluating the methodologies used in the valuation model and the significant assumptions used by the Company.
Contingencies
As described in Note 8 to the consolidated financial statements, the Company is involved in a number of legal proceedings and has made accruals with respect to certain of these matters. For other matters, a liability is not probable, or the amount cannot be reasonably estimated and therefore an accrual has not been made. Where a liability is reasonably possible and may be material, such matters have been disclosed. Management assessed the probability of occurrence and the estimation of any potential loss based on the ability to predict the number of claims that may be filed or whether any loss or range of loss can be reasonably estimated. In assessing the probability of occurrence in a particular legal proceeding, management exercises judgment to determine if it can predict the number of claims that may be filed and whether it can reasonably estimate any loss or range of loss that may arise from that proceeding.
Auditing management’s accounting for, and disclosure of, loss or gain contingencies was highly judgmental as it involved our assessment of the significant judgments made by management when assessing the probability of occurrence or when determining whether an estimate of the loss or range of loss could be made.
To test the Company’s assessment of the probability of occurrence or determination of an estimate of loss, or range of loss, among other procedures, we read the legal documentations, reviewed opinions provided to the Company by certain outside legal counsel, read letters received directly by us from internal and external counsel, and evaluated the current status of contingencies based on discussions with internal legal counsel. We also evaluated the appropriateness of the related disclosures.
/s/ Liggett & Webb, P.A.
We have served as the Company’s auditor since 2008.
Boynton Beach, Florida
March 30, 2022
OCEAN THERMAL ENERGY CORPORATION AND SUBSIDIARIES
CONSOLIDATED BALANCE SHEETS
AS OF DECEMBER 31, 2022 AND 2021
| | December 31, 2022 | | | December 31, 2021 | |
ASSETS |
Current Assets | | | | | | |
Cash | | $ | 1,404 | | | $ | 957 | |
Prepaid expenses | | | 5,000 | | | | 5,000 | |
Total Current Assets | | | 6,404 | | | | 5,957 | |
| | | | | | | | |
Total Assets | | $ | 6,404 | | | $ | 5,957 | |
| | | | | | | | |
LIABILITIES AND STOCKHOLDERS' DEFICIENCY |
| | | | | | | | |
Current Liabilities | | | | | | | | |
Accounts payable and accrued expense | | $ | 20,517,881 | | | $ | 17,553,823 | |
Notes payable - related party | | | 2,329,473 | | | | 2,329,473 | |
Convertible notes payable - related party, net | | | 114,721 | | | | 117,446 | |
Notes payable | | | 3,655,932 | | | | 3,631,620 | |
Convertible note payable, net | | | 2,531,401 | | | | 2,405,515 | |
Advances payable - related party, net | | | 57,760 | | | | - | |
Derivative liability | | | 6,998,262 | | | | 3,769,211 | |
Total Current Liabilities | | | 36,205,430 | | | | 29,807,088 | |
| | | | | | | | |
Long-term Liabilities | | | | | | | | |
Convertible note payable, net | | | - | | | | 64,888 | |
Convertible notes payable - related party, net | | | - | | | | 3,571 | |
Notes payable | | | - | | | | 158,334 | |
Total Liabilities | | | 36,205,430 | | | | 30,033,881 | |
| | | | | | | | |
Commitments and contingencies (See Note 8) | | | - | | | | - | |
| | | | | | | | |
Stockholders' deficiency | | | | | | | | |
Preferred Stock, Series B, $0.001par value; 1,250,000 shares authorized, | | | | | | | | |
518,750 and 518,750 shares issued and outstanding, respectively | | | 519 | | | | 519 | |
Preferred Stock, Series C, $0.001 par value; 2,700,000 shares authorized, | | | | | | | | |
2,300,000 and 2,300,000 shares issued and outstanding, respectively | | | 2,300 | | | | 2,300 | |
Preferred Stock, Series D, $0.001 par value; 1,000 shares authorized, | | | | | | | | |
278 and no shares issued and outstanding, respectively | | | - | | | | - | |
Common stock, $0.001par value; 200,000,000shares authorized, | | | | | | | | |
184,370,469 and 174,370,469 shares issued and outstanding, respectively | | | 184,371 | | | | 174,371 | |
Additional paid-in capital | | | 60,110,402 | | | | 59,379,402 | |
Accumulated deficit | | | (96,496,618 | ) | | | (89,584,516 | ) |
Total Stockholders' Deficiency | | | (36,199,026 | ) | | | (30,027,924 | ) |
| | | | | | | | |
Total Liabilities and Stockholders' Deficiency | | $ | 6,404 | | | $ | 5,957 | |
The accompanying notes are an integral part of these consolidated financial statements.
OCEAN THERMAL ENERGY CORPORATION AND SUBSIDIARIES
CONSOLIDATED STATEMENTS OF OPERATIONS
FOR THE YEARS ENDED DECEMBER 31, 2022 AND 2021
| | 2022 | | | 2021 | |
Operating Expenses | | | | | | |
Salaries and compensation | | $ | 791,392 | | | $ | 830,655 | |
Professional fees | | | 557,055 | | | | 958,101 | |
General and administrative | | | 170,160 | | | | 193,125 | |
Total Operating Expenses | | | 1,518,607 | | | | 1,981,881 | |
| | | | | | | | |
Loss from Operations | | | (1,518,607 | ) | | | (1,981,881 | ) |
| | | | | | | | |
Other (Expenses) Income | | | | | | | | |
Interest expense, net | | | (1,815,800 | ) | | | (1,745,194 | ) |
Amortization of debt discount | | | (210,351 | ) | | | (362,259 | ) |
Change in fair value of derivative liability | | | (3,428,245 | ) | | | 1,305,482 | |
Gain on conversion of debt | | | 60,901 | | | | 113,215 | |
Total Other Expense | | | (5,393,495 | ) | | | (688,756 | ) |
| | | | | | | | |
Loss Before Income Taxes | | | (6,912,102 | ) | | | (2,670,637 | ) |
| | | | | | | | |
Provision for Income Taxes | | | - | | | | - | |
| | | | | | | | |
Net Loss | | $ | (6,912,102 | ) | | $ | (2,670,637 | ) |
| | | | | | | | |
Net Loss per Common Share Basic and Diluted | | $ | (0.04 | ) | | $ | (0.02 | ) |
| | | | | | | | |
Weighted Average Number of Common Shares Outstanding | | | 178,959,510 | | | | 158,566,304 | |
The accompanying notes are an integral part of these consolidated financial statements.
OCEAN THERMAL ENERGY CORPORATION AND SUBSIDIARIES
CONSOLIDATED STATEMENTS OF CHANGES IN STOCKHOLDERS’ DEFICIENCY
FOR THE YEARS ENDED DECEMBER 31, 2022 AND 2021
| | Preferred Stock | | | Common Stock | | | Additional | | | | | | Total | |
| | Number of | | | Par | | | Number of | | | Par | | | Paid-in | | | Accumulated | | | Stockholders’ | |
| | Shares | | | Value | | | Shares | | | Value | | | Capital | | | Deficit | | | Deficiency | |
Balance December 31, 2020 | | | 2,818,750 | | | $ | 2,819 | | | | 137,847,005 | | | $ | 137,847 | | | $ | 58,360,044 | | | $ | (86,913,879 | ) | | $ | (28,413,169 | ) |
Common Stock issued for conversions of notes payable | | | - | | | | - | | | | 34,829,587 | | | | 34,830 | | | | 938,052 | | | | - | | | | 972,882 | |
Common Stock issued for second commitment fee | | | - | | | | - | | | | 1,693,877 | | | | 1,694 | | | | 81,306 | | | | - | | | | 83,000 | |
Net Loss | | | - | | | | - | | | | - | | | | - | | | | - | | | | (2,670,637 | ) | | | (2,670,637 | ) |
Balance December 31, 2021 | | | 2,818,750 | | | | 2,819 | | | | 174,370,469 | | | | 174,371 | | | | 59,379,402 | | | | (89,584,516 | ) | | | (30,027,924 | ) |
Series D Preferred Stock issued for cash | | | 135 | | | | - | | | | - | | | | - | | | | 270,000 | | | | - | | | | 270,000 | |
Series D Preferred Stock issued for conversion of notes and interest | | | 143 | | | | - | | | | - | | | | - | | | | 286,000 | | | | - | | | | 286,000 | |
Common Stock issued for conversions of notes payable | | | - | | | | - | | | | 10,000,000 | | | | 10,000 | | | | 175,000 | | | | - | | | | 185,000 | |
Net Loss | | | - | | | | - | | | | - | | | | - | | | | - | | | | (6,912,102 | ) | | | (6,912,102 | ) |
Balance December 31, 2022 | | | 2,819,028 | | | $ | 2,819 | | | | 184,370,469 | | | $ | 184,371 | | | $ | 60,110,402 | | | $ | (96,496,618 | ) | | $ | (36,199,026 | ) |
The accompanying notes are an integral part of these consolidated financial statements.
OCEAN THERMAL ENERGY CORPORATION AND SUBSIDIARIES
CONSOLIDATED STATEMENTS OF CASH FLOW
FOR THE YEARS ENDED DECEMBER 31, 2022 AND 2021
| | 2022 | | | 2021 | |
Cash Flows From Operating Activities: | | | | | | |
Net loss | | $ | (6,912,102 | ) | | $ | (2,670,637 | ) |
Adjustments to reconcile net loss to net cash used in operating activities: | | | | | | | | |
Change in fair value of derivative liability | | | 3,428,245 | | | | (1,305,482 | ) |
Amortization of debt discount | | | 210,351 | | | | 362,259 | |
Gain on conversion of debt | | | (60,901 | ) | | | (113,215 | ) |
Stock issued for second commitment fee | | | - | | | | 83,000 | |
Changes in assets and liabilities: | | | | | | | | |
Prepaid expense | | | - | | | | 5,000 | |
Accounts payable and accrued expenses | | | 3,007,194 | | | | 3,096,445 | |
Net Cash Used In Operating Activities | | | (327,213 | ) | | | (542,630 | ) |
| | | | | | | | |
Cash Flows From Financing Activities: | | | | | | | | |
Proceeds from sale of preferred stock | | | 270,000 | | | | - | |
Advances from related parties | | | 57,660 | | | | - | |
Repayment of notes payable | | | - | | | | (3,855 | ) |
Proceeds from notes payable | | | - | | | | 105,000 | |
Proceeds from convertible notes payable | | | - | | | | 425,000 | |
Proceeds from convertible notes payable - related party | | | - | | | | 10,000 | |
Net Cash Provided by Financing Activities | | | 327,660 | | | | 536,145 | |
| | | | | | | | |
Net increase (decrease) in cash | | | 447 | | | | (6,485 | ) |
Cash at beginning of year | | | 957 | | | | 7,442 | |
Cash at End of Year | | $ | 1,404 | | | $ | 957 | |
| | | | | | | | |
Supplemental disclosure of cash flow information | | | | | | | | |
Cash paid for interest expense | | $ | 13,823 | | | $ | 20,736 | |
Cash paid for income taxes | | $ | - | | | $ | - | |
| | | | | | | | |
Supplemental disclosure of non-cash investing and financing activities: | | | | | | | | |
Preferred stock issued for conversion of notes and accrued interest | | $ | 286,000 | | | $ | - | |
Convertible notes payable and accrued interest converted into common stock | | $ | 62,596 | | | $ | 419,179 | |
Convertible notes payable and accrued interest converted into preferred stock | | $ | 100,945 | | | $ | - | |
Related party convertible notes payable and accrued interest converted into preferred stock | | $ | 12,043 | | | $ | - | |
Notes payable and accrued interest converted into preferred stock | | $ | 168,138 | | | $ | - | |
Debt discount on notes payable | | $ | - | | | $ | 420,214 | |
Common stock issued for conversion of notes payable | | $ | 185,000 | | | $ | 972,882 | |
Derivative liability extinguished upon conversion of note payable | | $ | 199,194 | | | $ | 666,916 | |
The accompanying notes are an integral part of these consolidated financial statements.
OCEAN THERMAL ENERGY CORPORATION AND SUBSIDIARIES
NOTES TO CONSOLIDATED FINANCIAL STATEMENTS
FOR THE YEARS ENDED DECEMBER 31, 2022 AND 2021
NOTE 1 – NATURE OF BUSINESS AND BASIS OF PRESENTATION
Ocean Thermal Energy Corporation is currently in the businesses of:
| · | OTEC and SWAC/LSC-designing ocean thermal energy conversion (“OTEC”) power plants and seawater air conditioning and lake water air conditioning (“SWAC/LSC”) plants for large commercial properties, utilities, and municipalities. These technologies provide practical solutions to mankind’s three oldest and most fundamental needs: clean drinking water, plentiful food, and sustainable, affordable energy without the use of fossil fuels. OTEC is a clean technology that continuously extracts energy from the temperature difference between warm surface ocean water and cold deep seawater. In addition to producing electricity, some of the seawater running through an OTEC plant can be efficiently desalinated using the power generated by the OTEC technology, producing thousands of cubic meters of fresh water every day for use in agriculture and human consumption in the communities served by its plants. This cold, deep, nutrient-rich water can also be used to cool buildings (SWAC/LSC) and for fish farming/aquaculture. In short, it is a technology with many benefits, and its versatility makes OTEC unique. |
| | |
| · | EcoVillages-developing and commercializing our EcoVillages, as well as working to develop or acquire new complementary assets. EcoVillages are communities whose goal is to become more socially, economically, and ecologically sustainable and whose inhabitants seek to live according to ecological principles, causing as little impact on the environment as possible. We expect that our EcoVillage communities will range from a population of 50 to 150 individuals, although some may be smaller. We may also form larger EcoVillages, of up to 2,000 individuals, as networks of smaller subcommunities. We expect that our EcoVillages will grow by the addition of individuals, families, or other small groups. We expect to use our technology in the development of our EcoVillages, which should add significant value to this line of business. |
The consolidated financial statements include the accounts of the company and our wholly owned subsidiaries. Intercompany accounts and transactions have been eliminated in consolidation. In the opinion of management, our financial statements reflect all adjustments that are of a normal recurring nature necessary for presentation of financial statements in accordance with U.S. generally accepted accounting principles (GAAP).
NOTE 2: SUMMARY OF SIGNIFICANT ACCOUNTING POLICIES
Principles of Consolidation
The financial statements include the accounts of the company and its wholly owned subsidiaries Ocean Thermal Energy Bahamas Ltd., OTE BM Ltd. and OCEES International Inc. Intercompany balances and transactions have been eliminated in consolidation.
Our consolidated financial statements for the years ended December 31, 2022 and 2021, include the following subsidiaries:
Name | | Place of Incorporation / Establishment | | Principal Activities | | Date Formed |
Ocean Thermal Energy Bahamas Ltd. | | Bahamas | | Intermediate holding company of OTE BM Ltd. and OTE Bahamas O&M Ltd. | | 07/04/2011 |
| | | | | | |
OTE BM Ltd. | | Bahamas | | OTEC/SDC development in the Bahamas | | 09/07/2011 |
| | | | | | |
OCEES International Inc. | | Hawaii, USA | | Research and development for the Pacific Rim | | 01/21/1998 |
We have an effective interest of 100% in each of our subsidiaries.
Agreement to Sell Subsidiary
On August 25, 2022, we entered into a Stock Purchase Agreement to sell OCEES International, Inc. (“OCEES”), to Epaphus Global Energy, LLC (“Epaphus”). Epaphus is controlled by Jeremy Feakins, our Chief Executive Officer and a director. The transaction was approved unanimously by our directors who do not have an interest in the transaction.
In exchange for the sale of OCEES, we will receive:
| • | $1,000,000 in the form of canceled amounts owed by us to certain individuals, including Mr. Feakins, who have assigned their right to receive those payments to Epaphus; |
| • | $75,000 in cash per month for 12 months following the date of the purchase agreement; and |
| • | 70% of the net profit of any currently contemplated project to build an ocean thermal energy conversion power plants entered into by OCEES. |
Under the terms of the purchase agreement, Epaphus has the unilateral right to return OCEES to us and receive a full refund of all portions of the purchase price paid as of the return of OCEES at any time for year following the date of the purchase agreement.
The purchase agreement has not yet closed.
Use of Estimates
In preparing financial statements in conformity with GAAP, management is required to make estimates and assumptions that affect the reported amounts of assets and liabilities and the disclosure of contingent assets and liabilities at the date of the financial statements and revenues and expenses during the reported period. Actual results could differ from those estimates. Significant estimates include the assumptions used in the valuation of equity-based transactions, valuation of derivative liabilities, and valuation of deferred tax assets.
Cash and Cash Equivalents
We consider all highly liquid temporary cash investments with an original maturity of three months or less to be cash equivalents. We had no cash equivalents at December 31, 2022 and 2021.
Income Taxes
We use the liability method of accounting for income taxes. Under the liability method, deferred tax assets and liabilities are determined based on temporary differences between financial reporting and tax bases of assets and liabilities and on the amount of operating loss carry-forwards and are measured using the enacted tax rates and laws that will be in effect when the temporary differences and carry-forwards are expected to reverse. An allowance against deferred tax assets is recorded when it is more likely than not that such tax benefits will not be realized.
Our ability to use our net operating loss carryforwards may be substantially limited due to ownership change limitations that may have occurred or that could occur in the future, as required by Section 382 of the Internal Revenue Code of 1986, as amended (the “Code”), as well as similar state provisions. These ownership changes may limit the amount of net operating loss that can be utilized annually to offset future taxable income and tax, respectively. In general, an “ownership change” as defined by Section 382 of the Code results from a transaction or series of transactions over a three-year period resulting in an ownership change of more than 50.0% of the outstanding stock of a company by certain stockholders or public groups.
We have not completed a study to assess whether an ownership change has occurred or whether there have been multiple ownership changes since we became a “loss corporation” under the definition of Section 382. If we have experienced an ownership change, utilization of the net operating loss carryforwards would be subject to an annual limitation under Section 382 of the Code, which is determined by first multiplying the value of our stock at the time of the ownership change by the applicable long-term, tax-exempt rate, and then could be subject to additional adjustments, as required. Any limitation may result in expiration of a portion of the net operating loss carryforwards before utilization. Further, until a study is completed and any limitation known, no positions related to limitations are being considered as an uncertain tax position or disclosed as an unrecognized tax benefit. Any carryforwards that expire prior to utilization as a result of such limitations will be removed from deferred tax assets with a corresponding reduction of the valuation allowance. Due to the existence of the valuation allowance, it is not expected that any possible limitation will have an impact on our results of operations or financial position.
Business Segments
We operate in one segment and, therefore, segment information is not presented.
Fair Value
Financial Accounting Standards Board Accounting Standard Codification (“ASC”) Topic 820, Fair Value Measurements and Disclosures, defines fair value, establishes a framework for measuring fair value under GAAP, and enhances disclosures about fair value measurements. ASC 820 describes a fair value hierarchy based on three levels of inputs, of which the first two are considered observable and the last unobservable, that may be used to measure fair value, which are the following:
| · | Level 1-Pricing inputs are quoted prices available in active markets for identical assets or liabilities as of the reporting date. |
| · | Level 2-Pricing inputs are quoted for similar assets or inputs that are observable, either directly or indirectly, for substantially the full term through corroboration with observable market data. Level 2 includes assets or liabilities valued at quoted prices adjusted for legal or contractual restrictions specific to these investments. |
| · | Level 3-Pricing inputs are unobservable for the assets or liabilities; that is, the inputs reflect the reporting entity’s own assumptions about the assumptions market participants would use in pricing the asset or liability. |
Management believes the carrying amounts of the short-term financial instruments, including cash and cash equivalents, prepaid expenses, accounts payable, accrued liabilities, notes payable, and other liabilities, reflected in the accompanying balance sheets, approximate fair value at December 31, 2022 and December 31, 2021, due to the relatively short-term nature of these instruments.
We accounted for derivative liability at fair value on a recurring basis under Level 3 at December 31, 2022 and 2021 (see Note 5).
Concentrations
Cash, cash equivalents, and restricted cash are deposited with major financial institutions, and at times, such balances with any one financial institution may be in excess of FDIC-insured limits. As of December 31, 2022 and 2021, no balances exceeded FDIC-insured limits.
Loss per Share
Basic loss per share is calculated by dividing our net loss available to common shareholders by the weighted average number of common shares during the period. Diluted loss per share is calculated by dividing our net loss by the diluted weighted average number of shares outstanding during the period. The diluted weighted average number of shares outstanding is the basic weighted number of shares adjusted for any potentially dilutive debt or equity.
The following potentially dilutive securities have been excluded from the computation of diluted weighted average shares outstanding as of December 31, 2022 and 2021, as they would be anti-dilutive:
| | Years Ended December 31, | |
| | 2022 | | | 2021 | |
Shares underlying warrants outstanding | | | 125,073 | | | | 125,073 | |
Shares underlying convertible notes outstanding | | | 836,901,049 | | | | 925,654,995 | |
Shares underlying convertible preferred stock outstanding | | | 16,687,500 | | | | 16,687,500 | |
| | | 853,713,622 | | | | 942,467,568 | |
Revenue Recognition
We account for our revenue in accordance with Accounting Standard Update 2014-09, Revenue from Contracts with Customers (Topic 606), which requires a company to recognize revenue to depict the transfer of goods or services to a customer at an amount that reflects the consideration it expects to receive in exchange for those goods or services.
Reclassifications
Certain prior-year amounts have been reclassified to conform to the current period presentation.
Recent Accounting Pronouncements
We have reviewed all recently issued, but not yet adopted, accounting standards in order to determine their effects, if any, on our consolidated results of operations, financial position, and cash flows. Based on that review, we believe that none of these pronouncements will have a significant effect on current or future earnings or operations.
NOTE 3 – GOING CONCERN
The accompanying audited consolidated financial statements have been prepared on the assumption that we will continue as a going concern. As reflected in the accompanying consolidated financial statements, we had a net loss of $6,912,102 and used $327,213 of cash in operating activities for the year ended December 31, 2022. We had a working capital deficiency of $36,199,026 and a stockholders’ deficiency of $36,199,026 as of December 31, 2022. These factors raise substantial doubt about our ability to continue as a going concern. Our ability to continue as a going concern is dependent on our ability to increase sales and obtain external funding for our projects under development. We continue to apply for grant funding from the U.S. Department of Energy. Our applications focus on desalinated water, ammonia, and hydrogen production from an OTEC facility. On March 11, 2022, President Biden signed a bill that provides $162 million for the Water Power Technologies Office budget. About $112 million of that money is slated for marine energy. We plan to apply for funding to support projects where our technology would apply. The financial statements do not include any adjustments that may result from the outcome of this uncertainty.
NOTE 4 – CONVERTIBLE NOTES AND NOTES PAYABLE
During the year ended December 31, 2022, $215,000 of notes and $66,126 of related accrued interest were converted into 143 shares of Series D Preferred Stock.
During the year ended December 31, 2022, $60,650 of notes and $1,946 of related accrued interest were converted into 10,847,262 shares of common stock. Of this common stock, 847,262 shares were borrowed from our CEO to enable the conversions. We have accrued a liability for the shares to be reissued to our CEO in the amount of $11,014, the fair value of the shares on the date of conversion. The replacement shares have not been issued at December 31, 2022.
During the year ended December 30, 2021, $419,179 of notes were converted into 34,829,587 shares of common stock.
The following convertible notes and notes payable were outstanding at December 31, 2022:
Date of | | | Maturity | | | Interest | | | In | | Original | | | Principal at December 31, | | | Discount at December 31, | | | Carrying Amount at December 31, | | | Related Party | | | Non Related Party | |
Issuance | | | Date | | | Rate | | | Default | | Principal | | | 2022 | | | 2022 | | | 2022 | | | Current | | | Long-Term | | | Current | | | Long-Term | |
12/01/07 | | | 09/01/15 | | | | 7.00 | % | | Yes | | | 125,000 | | | | 85,821 | | | | - | | | | 85,821 | | | | - | | | | - | | | | 85,821 | | | | - | |
09/25/09 | | | 10/25/11 | | | | 5.00 | % | | Yes | | | 50,000 | | | | 50,000 | | | | - | | | | 50,000 | | | | - | | | | - | | | | 50,000 | | | | - | |
12/23/09 | | | 12/23/14 | | | | 7.00 | % | | Yes | | | 100,000 | | | | 83,166 | | | | - | | | | 83,166 | | | | - | | | | - | | | | 83,166 | | | | - | |
12/23/09 | | | 12/23/14 | | | | 7.00 | % | | Yes | | | 25,000 | | | | 22,233 | | | | - | | | | 22,233 | | | | - | | | | - | | | | 22,233 | | | | - | |
12/23/09 | | | 12/23/14 | | | | 7.00 | % | | Yes | | | 25,000 | | | | 22,223 | | | | - | | | | 22,223 | | | | - | | | | - | | | | 22,223 | | | | - | |
02/03/12 | | | 12/31/19 | | | | 10.00 | % | | Yes | | | 1,000,000 | | | | 1,000,000 | | | | - | | | | 1,000,000 | | | | - | | | | - | | | | 1,000,000 | | | | - | |
08/15/13 | | | 10/31/23 | | | | 10.00 | % | | No | | | 158,334 | | | | 158,334 | | | | - | | | | 158,334 | | | | - | | | | - | | | | 158,334 | | | | - | |
12/31/13 | | | 12/31/15 | | | | 8.00 | % | | Yes | | | 290,000 | | | | 130,000 | | | | - | | | | 130,000 | | | | - | | | | - | | | | 130,000 | | | | - | |
04/01/14 | | | 12/31/18 | | | | 10.00 | % | | Yes | | | 2,265,000 | | | | 1,102,500 | | | | - | | | | 1,102,500 | | | | 1,102,500 | | | | - | | | | - | | | | - | |
12/22/14 | | | 03/31/15 | | | | 22.00 | %* | | Yes | | | 200,000 | | | | 200,000 | | | | - | | | | 200,000 | | | | - | | | | - | | | | 200,000 | | | | - | |
12/26/14 | | | 12/26/15 | | | | 22.00 | %* | | Yes | | | 100,000 | | | | 100,000 | | | | - | | | | 100,000 | | | | - | | | | - | | | | 100,000 | | | | - | |
03/12/15 | | | (1) | | | | 6.00 | % | | No | | | 394,380 | | | | 394,380 | | | | - | | | | 394,380 | | | | 394,380 | | | | - | | | | - | | | | - | |
04/07/15 | | | 04/07/18 | | | | 10.00 | % | | Yes | | | 50,000 | | | | 50,000 | | | | - | | | | 50,000 | | | | - | | | | - | | | | 50,000 | | | | - | |
11/23/15 | | | (1) | | | | 6.00 | % | | No | | | 50,000 | | | | 50,000 | | | | - | | | | 50,000 | | | | 50,000 | | | | - | | | | - | | | | - | |
02/25/16 | | | (1) | | | | 6.00 | % | | No | | | 50,000 | | | | 50,000 | | | | - | | | | 50,000 | | | | 50,000 | | | | - | | | | - | | | | - | |
05/20/16 | | | (1) | | | | 6.00 | % | | No | | | 50,000 | | | | 50,000 | | | | - | | | | 50,000 | | | | 50,000 | | | | - | | | | - | | | | - | |
10/20/16 | | | (1) | | | | 6.00 | % | | No | | | 37,500 | | | | 12,500 | | | | - | | | | 12,500 | | | | 12,500 | | | | - | | | | - | | | | - | |
10/20/16 | | | (1) | | | | 6.00 | % | | No | | | 12,500 | | | | 12,500 | | | | - | | | | 12,500 | | | | 12,500 | | | | - | | | | - | | | | - | |
12/21/16 | | | (1) | | | | 6.00 | % | | No | | | 25,000 | | | | 25,000 | | | | - | | | | 25,000 | | | | 25,000 | | | | - | | | | - | | | | - | |
03/09/17 | | | (1) | | | | 10.00 | % | | No | | | 200,000 | | | | 177,000 | | | | - | | | | 177,000 | | | | 177,000 | | | | - | | | | - | | | | - | |
07/13/17 | | | 07/13/19 | | | | 6.00 | % | | Yes | | | 25,000 | | | | 25,000 | | | | - | | | | 25,000 | | | | - | | | | - | | | | 25,000 | | | | - | |
07/18/17 | | | 07/18/19 | | | | 6.00 | % | | Yes | | | 25,000 | | | | 25,000 | | | | - | | | | 25,000 | | | | - | | | | - | | | | 25,000 | | | | - | |
07/26/17 | | | 07/26/19 | | | | 6.00 | % | | Yes | | | 15,000 | | | | 15,000 | | | | - | | | | 15,000 | | | | - | | | | - | | | | 15,000 | | | | - | |
12/20/17 | | | (2) | | | | 10.00 | % | | Yes | | | 979,156 | | | | 859,156 | | | | - | | | | 859,156 | | | | - | | | | - | | | | 859,156 | | | | - | |
11/06/17 | | | 12/31/18 | | | | 10.00 | % | | Yes | | | 646,568 | | | | 543,093 | | | | - | | | | 543,093 | | | | 543,093 | | | | - | | | | - | | | | - | |
02/19/18 | | | (3) | | | | 18.00 | %* | | Yes | | | 629,451 | | | | 1,161,136 | | | | - | | | | 1,161,136 | | | | - | | | | - | | | | 1,161,136 | | | | - | |
09/19/18 | | | 09/28/21 | | | | 6.00 | % | | Yes | | | 10,000 | | | | 10,000 | | | | - | | | | 10,000 | | | | - | | | | - | | | | 10,000 | | | | - | |
12/14/18 | | | 12/22/18 | | | | 24.00 | %* | | Yes | | | 474,759 | | | | 578,075 | | | | - | | | | 578,075 | | | | - | | | | - | | | | 578,075 | | | | - | |
01/02/19 | | | (4) | | | | 17.00 | % | | No | | | 310,000 | | | | 310,000 | | | | - | | | | 310,000 | | | | - | | | | - | | | | 310,000 | | | | - | |
08/14/19 | | | 10/31/2021 | | | | 8.00 | % | | Yes | | | 26,200 | | | | 26,200 | | | | - | | | | 26,200 | | | | - | | | | - | | | | 26,200 | | | | - | |
(5) | | | 10/31/2021 | | | | 8.00 | % | | Yes | | | 105,000 | | | | 75,000 | | | | - | | | | 75,000 | | | | 5,000 | | | | - | | | | 70,000 | | | | - | |
(6) | | | 01/02/22 | | | | 8.00 | % | | Yes | | | 296,750 | | | | 231,750 | | | | - | | | | 231,750 | | | | 15,000 | | | | - | | | | 216,750 | | | | - | |
(8) | | | 05/12/22 | | | | 8.00 | % | | Yes | | | 15,000 | | | | 15,000 | | | | - | | | | 15,000 | | | | - | | | | - | | | | 15,000 | | | | - | |
(9) | | | 09/01/22 | | | | 8.00 | % | | Yes | | | 170,000 | | | | 155,000 | | | | - | | | | 155,000 | | | | - | | | | - | | | | 155,000 | | | | - | |
(10) | | | 08/30/23 | | | | 8.00 | % | | No | | | 285,000 | | | | 285,000 | | | | 87,233 | | | | 197,767 | | | | 3,528 | | | | - | | | | 194,239 | | | | - | |
(11) | | | 11/30/23 | | | | 8.00 | % | | No | | | 5,000 | | | | 5,000 | | | | 1,307 | | | | 3,693 | | | | 3,693 | | | | - | | | | - | | | | - | |
(7) | | | (7) | | | | 10.00 | % | | No | | | 625,000 | | | | 625,000 | | | | - | | | | 625,000 | | | | - | | | | - | | | | 625,000 | | | | - | |
| | | | | | | | | | | | $ | 9,850,598 | | | $ | 8,720,067 | | | $ | 88,540 | | | $ | 8,631,527 | | | $ | 2,444,194 | | | $ | - | | | $ | 6,187,333 | | | $ | - | |
(1) | Maturity date is 90 days after demand. |
(2) | Bridge loans were issued at dates between December 2017 and May 2018. Principal is due on the earlier of 18 months from the anniversary date or the completion of L2 financing with gross proceeds of a minimum of $1.5 million. |
(3) | L2 - Note was drawn down in five tranches between 02/16/18 and 05/02/18. |
(4) | Loans were issued from 01/02/19 to 03/23/19. Principal and interest are due when funds are received from the litigation between Ocean Thermal Energy Corporation vs. Robert Coe, et al. |
(5) | Notes were issued between 10/14/19 and 11/05/19. The notes bear an interest rate of 8% and mature 10/31/21. They can be converted into 250,000 shares of common stock. They can be converted when the stock closing price reaches $1 or on the maturity, whichever occurs first. |
(6) | Notes were issued between 12/09/19 and 11/25/20. The notes bear an interest rate of 8% and mature 01/02/22. They can be converted into 250,000 shares of common stock. They can be converted when the stock closing price reaches $1 or on the maturity, whichever occurs first. |
(7) | Notes were issued between 11/02/20 and 03/18/21. The notes bear an interest rate of 10%. Repayment will be made as follows: (i) the principal and interest within five business days following our receipt of $25.5 million from the Robert Coe, et al. Phase One Litigation; and (ii) the additional payment within five business days following our actual receipt of any funds from the Robert Coe, et al, Phase Two Litigation, less legal fees accrued up to that date. Payment will be made as such funds are actually received by us and after deductions of accrued legal fees up to that date. |
(8) | Notes were issued between 05/14/20 and 08/11/20. The notes bear an interest rate of 8% and mature 05/12/22. They can be converted into 250,000 shares of common stock. They can be converted when the stock closing price reaches $1 or on the maturity, whichever occurs first. |
(9) | Notes were issued in November 2020 and during the first two quarters of 2021. The notes bear an interest rate of 8% and mature 09/01/22. They can be converted into 250,000 shares of common stock. They can be converted when the stock closing price reaches $1 or on the maturity, whichever occurs first. |
(10) | Notes were issued during the third quarter of 2021. The notes bear an interest rate of 8% and mature 08/30/23. They can be converted into 250,000 shares of common stock. They can be converted when the stock closing price reaches $1 or on the maturity, whichever occurs first. |
(11) | Note was issued during November of 2021. The note bears an interest rate of 8% and matures 11/30/23. It can be converted into 250,000 shares of common stock. It can be converted when the stock closing price reaches $1 or on the maturity, whichever occurs first. |
* | Default interest rate. |
The following convertible notes and notes payable were outstanding at December 31, 2021:
Date of | | | Maturity | | | Interest | | | In | | Original | | | Principal at December 31, | | | Discount at December 31, | | | Carrying Amount at December 31 | | | Related Party | | | Non Related Party | |
Issuance | | | Date | | | Rate | | | Default | | Principal | | | 2021 | | | 2021 | | | 2021 | | | Current | | | Long-Term | | | Current | | | Long-Term | |
12/01/07 | | | 09/01/15 | | | | 7.00 | % | | Yes | | | 125,000 | | | | 85,821 | | | | - | | | | 85,821 | | | | - | | | | - | | | | 85,821 | | | | - | |
09/25/09 | | | 10/25/11 | | | | 5.00 | % | | Yes | | | 50,000 | | | | 50,000 | | | | - | | | | 50,000 | | | | - | | | | - | | | | 50,000 | | | | - | |
12/23/09 | | | 12/23/14 | | | | 7.00 | % | | Yes | | | 100,000 | | | | 94,414 | | | | - | | | | 94,414 | | | | - | | | | - | | | | 94,414 | | | | - | |
12/23/09 | | | 12/23/14 | | | | 7.00 | % | | Yes | | | 25,000 | | | | 23,620 | | | | - | | | | 23,620 | | | | - | | | | - | | | | 23,620 | | | | - | |
12/23/09 | | | 12/23/14 | | | | 7.00 | % | | Yes | | | 25,000 | | | | 23,610 | | | | - | | | | 23,610 | | | | - | | | | - | | | | 23,610 | | | | - | |
02/03/12 | | | 12/31/19 | | | | 10.00 | % | | Yes | | | 1,000,000 | | | | 1,000,000 | | | | - | | | | 1,000,000 | | | | - | | | | - | | | | 1,000,000 | | | | - | |
08/15/13 | | | 10/31/23 | | | | 10.00 | % | | No | | | 158,334 | | | | 158,334 | | | | - | | | | 158,334 | | | | - | | | | - | | | | - | | | | 158,334 | |
12/31/13 | | | 12/31/15 | | | | 8.00 | % | | Yes | | | 290,000 | | | | 130,000 | | | | - | | | | 130,000 | | | | - | | | | - | | | | 130,000 | | | | - | |
04/01/14 | | | 12/31/18 | | | | 10.00 | % | | Yes | | | 2,265,000 | | | | 1,102,500 | | | | - | | | | 1,102,500 | | | | 1,102,500 | | | | - | | | | - | | | | - | |
12/22/14 | | | 03/31/15 | | | | 22.00 | %* | | Yes | | | 200,000 | | | | 200,000 | | | | - | | | | 200,000 | | | | - | | | | - | | | | 200,000 | | | | - | |
12/26/14 | | | 12/26/15 | | | | 22.00 | %* | | Yes | | | 100,000 | | | | 100,000 | | | | - | | | | 100,000 | | | | - | | | | - | | | | 100,000 | | | | - | |
03/12/15 | | | (1) | | | | 6.00 | % | | No | | | 394,380 | | | | 394,380 | | | | - | | | | 394,380 | | | | 394,380 | | | | - | | | | - | | | | - | |
04/07/15 | | | 04/07/18 | | | | 10.00 | % | | Yes | | | 50,000 | | | | 50,000 | | | | - | | | | 50,000 | | | | - | | | | - | | | | 50,000 | | | | - | |
11/23/15 | | | (1) | | | | 6.00 | % | | No | | | 50,000 | | | | 50,000 | | | | - | | | | 50,000 | | | | 50,000 | | | | - | | | | - | | | | - | |
02/25/16 | | | (1) | | | | 6.00 | % | | No | | | 50,000 | | | | 50,000 | | | | - | | | | 50,000 | | | | 50,000 | | | | - | | | | - | | | | - | |
05/20/16 | | | (1) | | | | 6.00 | % | | No | | | 50,000 | | | | 50,000 | | | | - | | | | 50,000 | | | | 50,000 | | | | - | | | | - | | | | - | |
10/20/16 | | | (1) | | | | 6.00 | % | | No | | | 37,500 | | | | 12,500 | | | | - | | | | 12,500 | | | | 12,500 | | | | - | | | | - | | | | - | |
10/20/16 | | | (1) | | | | 6.00 | % | | No | | | 12,500 | | | | 12,500 | | | | - | | | | 12,500 | | | | 12,500 | | | | - | | | | - | | | | - | |
12/21/16 | | | (1) | | | | 6.00 | % | | No | | | 25,000 | | | | 25,000 | | | | - | | | | 25,000 | | | | 25,000 | | | | - | | | | - | | | | - | |
03/09/17 | | | (1) | | | | 10.00 | % | | No | | | 200,000 | | | | 177,000 | | | | - | | | | 177,000 | | | | 177,000 | | | | - | | | | - | | | | - | |
07/13/17 | | | 07/13/19 | | | | 6.00 | % | | Yes | | | 25,000 | | | | 25,000 | | | | - | | | | 25,000 | | | | - | | | | - | | | | 25,000 | | | | - | |
07/18/17 | | | 07/18/19 | | | | 6.00 | % | | Yes | | | 25,000 | | | | 25,000 | | | | - | | | | 25,000 | | | | - | | | | - | | | | 25,000 | | | | - | |
07/26/17 | | | 07/26/19 | | | | 6.00 | % | | Yes | | | 15,000 | | | | 15,000 | | | | - | | | | 15,000 | | | | - | | | | - | | | | 15,000 | | | | - | |
12/20/17 | | | (2) | | | | 10.00 | % | | Yes | | | 979,156 | | | | 979,156 | | | | - | | | | 979,156 | | | | - | | | | - | | | | 979,156 | | | | - | |
11/06/17 | | | 12/31/18 | | | | 10.00 | % | | Yes | | | 646,568 | | | | 543,093 | | | | - | | | | 543,093 | | | | 543,093 | | | | - | | | | - | | | | - | |
02/19/18 | | | (3) | | | | 18.00 | % * | | Yes | | | 629,451 | | | | 1,161,136 | | | | - | | | | 1,161,136 | | | | - | | | | - | | | | 1,161,136 | | | | - | |
09/19/18 | | | 09/28/21 | | | | 6.00 | % | | Yes | | | 10,000 | | | | 10,000 | | | | - | | | | 10,000 | | | | - | | | | - | | | | 10,000 | | | | - | |
12/14/18 | | | 12/22/18 | | | | 24.00 | %* | | Yes | | | 474,759 | | | | 623,725 | | | | - | | | | 623,725 | | | | - | | | | - | | | | 623,725 | | | | - | |
01/02/19 | | | (4) | | | | 17.00 | % | | No | | | 310,000 | | | | 310,000 | | | | - | | | | 310,000 | | | | - | | | | - | | | | 310,000 | | | | - | |
08/14/19 | | | 10/31/2021 | | | | 8.00 | % | | Yes | | | 26,200 | | | | 26,200 | | | | - | | | | 26,200 | | | | - | | | | - | | | | 26,200 | | | | - | |
(5) | | | 10/31/2021 | | | | 8.00 | % | | Yes | | | 105,000 | | | | 105,000 | | | | - | | | | 105,000 | | | | 10,000 | | | | - | | | | 95,000 | | | | - | |
(6) | | | 01/02/22 | | | | 8.00 | % | | No | | | 306,750 | | | | 306,750 | | | | 885 | | | | 305,865 | | | | 19,946 | | | | - | | | | 285,919 | | | | - | |
(8) | | | 05/12/22 | | | | 8.00 | % | | No | | | 15,000 | | | | 15,000 | | | | 2,924 | | | | 12,076 | | | | - | | | | - | | | | 12,076 | | | | - | |
(9) | | | 09/01/22 | | | | 8.00 | % | | No | | | 160,000 | | | | 160,000 | | | | 73,542 | | | | 86,458 | | | | - | | | | - | | | | 86,458 | | | | - | |
(10) | | | 08/30/23 | | | | 8.00 | % | | No | | | 285,000 | | | | 285,000 | | | | 218,805 | | | | 66,195 | | | | - | | | | 1,307 | | | | - | | | | 64,888 | |
(11) | | | 11/30/23 | | | | 8.00 | % | | No | | | 5,000 | | | | 5,000 | | | | 2,736 | | | | 2,264 | | | | - | | | | 2,264 | | | | - | | | | - | |
(7) | | | (7) | | | | 10.00 | % | | No | | | 625,000 | | | | 625,000 | | | | - | | | | 625,000 | | | | - | | | | - | | | | 625,000 | | | | - | |
| | | | | | | | | | | | $ | 9,850,598 | | | $ | 9,009,739 | | | $ | 298,892 | | | $ | 8,710,847 | | | $ | 2,446,919 | | | $ | 3,571 | | | $ | 6,037,135 | | | $ | 223,222 | |
(1) | Maturity date is 90 days after demand. |
(2) | Bridge loans were issued at dates between December 2017 and May 2018. Principal is due on the earlier of 18 months from the anniversary date or the completion of L2 financing with gross proceeds of a minimum of $1.5 million. |
(3) | L2 - Note was drawn down in five tranches between 02/16/18 and 05/02/18. |
(4) | Loans were issued from 01/02/19 to 03/23/19. Principal and interest are due when funds are received from the litigation between Ocean Thermal Energy Corporation vs. Robert Coe, et al. |
(5) | Notes were issued between 10/14/19 and 11/05/19. The notes bear an interest rate of 8% and mature 10/31/21. They can be converted into 250,000 shares of common stock. They can be converted when the stock closing price reaches $1 or on the maturity, whichever occurs first. |
(6) | Notes were issued between 12/09/19 and 11/25/20. The notes bear an interest rate of 8% and mature 01/02/22. They can be converted into 250,000 shares of common stock. They can be converted when the stock closing price reaches $1 or on the maturity, whichever occurs first. |
(7) | Notes were issued between 11/02/20 and 03/18/21. The notes bear an interest rate of 10%. Repayment will be made as follows: (i) the principal and interest within five business days following our receipt of $25.5 million from the Robert Coe, et al. Phase One Litigation; and (ii) the additional payment within five business days following our actual receipt of any funds from the Robert Coe, et al. Phase Two Litigation, less legal fees accrued up to that date. Payment will be made as such funds are actually received by us and after deductions of accrued legal fees up to that date. |
(8) | Notes were issued between 05/14/20 and 08/11/20. The notes bear an interest rate of 8% and mature 05/12/22. They can be converted into 250,000 shares of common stock. They can be converted when the stock closing price reaches $1 or on the maturity, whichever occurs first. |
(9) | Notes were issued in November 2020 and during the first two quarters of 2021. The notes bear an interest rate of 8% and mature 09/01/22. They can be converted into 250,000 shares of common stock. They can be converted when the stock closing price reaches $1 or on the maturity, whichever occurs first. |
(10) | Notes were issued during the third quarter of 2021. The notes bear an interest rate of 8% and mature 08/30/23. They can be converted into 250,000 shares of common stock. They can be converted when the stock closing price reaches $1 or on the maturity, whichever occurs first. |
(11) | Note was issued during November of 2021. The note bears an interest rate of 8% and matures 11/30/23. It can be converted into 250,000 shares of common stock. It can be converted when the stock closing price reaches $1 or on the maturity, whichever occurs first. |
* | Default interest rate. |
NOTE 5 – DERIVATIVE LIABILITY
We measure the fair value of our assets and liabilities under the guidance of ASC 820, Fair Value Measurements and Disclosures, which defines fair value, establishes a framework for measuring fair value in accordance with GAAP, and expands disclosures about fair value measurements. ASC 820 does not require any new fair value measurements, but its provisions apply to all other accounting pronouncements that require or permit fair value measurement.
We identified conversion features embedded within convertible debt issued. We have determined that the features associated with the embedded conversion option should be accounted for at fair value as a derivative liability. We have elected to account for these instruments together with fixed conversion price instruments as derivative liabilities as we cannot determine if a sufficient number of shares would be available to settle all potential future conversion transactions. We value the derivative liabilities using the Black-Scholes option valuation model. The derivative liabilities are valued at each reporting date and the change in fair value is reflected as change in fair value of derivative liability.
Following is a description of the valuation methodologies used to determine the fair value of our financial liabilities, including the general classification of such instruments pursuant to the valuation hierarchy:
| | Fair Value at December 31, | | | Quoted market prices for identical assets/liabilities (Level 1) | | | Significant other observable inputs (Level 2) | | | Significant unobservable inputs (Level 3) | |
Derivative Liability, December 31, 2022 | | $ | 6,998,262 | | | $ | - | | | $ | - | | | $ | 6,998,262 | |
Derivative Liability, December 31, 2021 | | $ | 3,769,211 | | | $ | - | | | $ | - | | | $ | 3,769,211 | |
The reconciliation of the derivative liability for the years ended December 31, 2022 and 2021, is as follows:
| | For the Years Ended December 31 | |
| | 2022 | | | 2021 | |
Derivative liability as of January 1 | | $ | 3,769,211 | | | $ | 5,321,395 | |
Addition to derivative instruments | | | - | | | | 420,214 | |
Derivative liability extinguished upon conversion of notes payable | | | (199,194 | ) | | | (666,916 | ) |
Change in fair value of derivative liability | | | 3,428,245 | | | | (1,305,482 | ) |
Derivative liability as of December 31 | | $ | 6,998,262 | | | $ | 3,769,211 | |
The change in fair value of the derivative liability for the years ended December 31, 2022 and 2021, is comprised of the following:
| | For the Years Ended December 31 | |
| | 2022 | | | 2021 | |
Day one loss on valuation | | $ | - | | | $ | 97,861 | |
Gains/(losses) from the change in fair value of derivative liability | | | 3,428,245 | | | | (1,403,343 | ) |
Change in fair value of derivative liability* | | $ | 3,428,245 | | | $ | (1,305,482 | ) |
________________
* Gains (losses) related to the revaluation of Level 3 financial liabilities is included in “Change in fair value of derivative liabilities” in the accompanying consolidated statement of operations.
The fair value of the derivative liability was estimated using the Black-Scholes option-valuation model. The fair values at the commitment and remeasurement dates for our derivative liabilities were based upon the following management assumptions:
| | For the Years Ended December 31 | |
| | 2022 | | | 2021 | |
Expected dividends | | | 0 | % | | | 0 | % |
Expected volatility | | 184%-368 | % | | 77%-326 | % |
Risk free interest rate | | 0.52%-4.73 | % | | 0.03%-0.73 | % |
Expected term (in years) | | 0.25– 1.67 years | | | 0.08– 2.56 years | |
The fair value at the remeasurement date is equal to the carrying value on the balance sheet.
NOTE 6 – STOCKHOLDERS’ EQUITY
Common Stock
During the year ended December 31, 2022, we issued 10,000,000 shares of common stock with a fair value of $185,000 for the conversion of a portion of our notes payable in the amount of $45,650.
During the year ended December 31, 2022, $15,000 of notes and $1,946 of related accrued interest were converted into 847,262 shares of common stock. The 847,262 shares were borrowed from our CEO to enable the conversions. We have accrued a liability for the shares to be reissued to our CEO in the amount of $11,014, the fair value of the shares on the date of conversion. The replacement shares have not been issued at December 31, 2022.
During the year ended December 31, 2021, we issued 34,829,587 shares of common stock with a fair value of $972,882 for the conversion of a portion of our notes payable in the amount of $419,179.
During the year ended December 31, 2021, we issued 1,693,877 shares of common stock valued at $83,000. This was a settlement of a second commitment for a convertible promissory note dated May 22, 2018. The initial commitment was 400,000 shares of common stock issued on May 22, 2018.
Preferred Stock
On December 31, 2021, our board of directors approved a resolution authorizing the withdrawal of the certificate of designation of our Series A preferred stock. No shares were outstanding at the time of withdrawal.
Our board of directors has approved the following issuances of Preferred Stock:
Series B Preferred Stock (authorized June 3, 2019) – We are authorized to issue 1,250,000 shares of Series B Preferred Stock with a par value of $0.001. These shares will not have voting rights alongside the common stock and each share of Series B Preferred Stock will be convertible into ten shares of our common stock. As of December 31, 2022 and 2021, 518,750 shares of Series B Preferred Stock have been issued.
Series C Preferred Stock (authorized June 3, 2019) – We are authorized to issue 2,700,000 shares of Series C Preferred Stock with a par value of $0.001. These shares are a one-time grant and will have voting rights alongside the common stock. Each share of Series C Preferred Stock will be convertible into five shares of our common stock. As of December 31, 2022 and 2021, 2,300,000 shares of Series C Preferred Stock have been issued.
Series D Preferred Stock (authorized December 31, 2021) – We are authorized to issue 1,000 shares of Series D Preferred Stock with a par value of $0.001. These shares will have voting rights alongside the common stock and each share of Series D Preferred Stock will be convertible into 200,000 shares of our common stock as set forth in the certificate of designation. Each share of Series D Preferred Stock shall be converted automatically upon the effectiveness of a registration statement registering the resale of the common stock to be issued upon the conversion of the Series D Preferred Stock, or at any time following a merger or consolidation of the Corporation with or into an unaffiliated entity or the sale of all or substantially all of the assets of the Corporation to an unaffiliated third party, at the election of the holder. As of December 31, 2022 and 2021, 278 and no shares of Series D Preferred Stock have been issued.
During the year ended December 31, 2022, we issued 135 shares of Series D Preferred Stock for cash proceeds of $270,000.
During the year ended December 31, 2022, we issued 143 shares of Series D Preferred Stock valued at $286,000 upon conversion of $215,000 of notes and $66,126 of related accrued interest.
Warrants and Options
The following table summarizes all warrants outstanding and exercisable for the years ended December 31, 2022 and 2021:
| | Number of | | | Weighted Average | |
| | Warrants | | | Exercise Price | |
Balance at December 31, 2020 | | | 125,073 | | | $ | 0.13 | |
Granted | | | - | | | | - | |
Exercised | | | - | | | | - | |
Forfeited | | | - | | | | - | |
Balance at December 31, 2021 | | | 125,073 | | | $ | 0.13 | |
Granted | | | - | | | | - | |
Exercised | | | - | | | | - | |
Forfeited | | | - | | | | - | |
Balance at December 31, 2022 | | | 125,073 | | | $ | 0.13 | |
Exercisable at December 31, 2022 | | | 125,073 | | | $ | 0.13 | |
No warrants were issued or exercised during the years ended December 31, 2022 and 2021. Aggregate intrinsic value represents the excess amount over the exercise price that optionees would have received if all options had been exercised on the last business day of the period indicated, based on our closing stock price of $0.01 per share on December 31, 2022. The outstanding warrants had no intrinsic value, as the price of the stock on that date was lower than the exercise price. The warrants had a weighted average remaining life of six months at December 31, 2022.
NOTE 7 – INCOME TAX
Our ability to use our net operating loss carryforwards may be substantially limited due to ownership change limitations that may have occurred or that could occur in the future, as required by Section 382 of the Code, as well as similar state provisions. These ownership changes may limit the amount of net operating loss that can be utilized annually to offset future taxable income and tax, respectively. In general, an “ownership change” as defined by Section 382 of the Code results from a transaction or series of transactions over a three-year period resulting in an ownership change of more than 50.0% of the outstanding stock of a company by certain stockholders or public groups.
We have not completed a study to assess whether an ownership change has occurred or whether there have been multiple ownership changes since we became a “loss corporation” under the definition of Section 382. If we have experienced an ownership change, utilization of the net operating loss carryforwards would be subject to an annual limitation under Section 382 of the Code, which is determined by first multiplying the value of our stock at the time of the ownership change by the applicable long-term, tax-exempt rate, and then could be subject to additional adjustments, as required. Any limitation may result in expiration of a portion of the net operating loss carryforwards before utilization. Further, until a study is completed, and any limitation known, no positions related to limitations are being considered as an uncertain tax position or disclosed as an unrecognized tax benefit. Any carryforwards that expire prior to utilization as a result of such limitations will be removed from deferred tax assets with a corresponding reduction of the valuation allowance. Due to the existence of the valuation allowance, it is not expected that any possible limitation will have an impact on our results of operations or financial position.
The actual tax benefit differs from the expected tax benefit for the years ended December 31, 2022 and 2021 (computed by applying the U.S. federal corporate tax rate of 21% to income before taxes), as follows:
| | 2022 | | | 2021 | |
Statutory federal income tax rate | | | (21.0 | )% | | | (21.0 | )% |
State income taxes, net of federal benefits | | | (7.9 | )% | | | (7.9 | )% |
Non-deductible items | | | 15.0 | % | | | (11.4 | )% |
Valuation allowance | | | 13.9 | % | | | 40.3 | % |
Effective income tax rate | | | — | % | | | — | % |
Deferred income taxes reflect the net tax effects of temporary differences between the carrying amounts of assets and liabilities for financial reporting purposes and the amounts used for income tax purposes. Significant components of our deferred tax assets and liabilities are as follows:
| | For the Years Ended December 31 | |
| | 2022 | | | 2021 | |
Impairment | | $ | 2,358,860 | | | $ | 2,358,860 | |
Accrued Compensation | | | 1,517,774 | | | | 1,335,457 | |
Operating loss carryforwards | | | 10,809,828 | | | | 10,028,500 | |
Gross deferred tax assets | | | 14,686,462 | | | | 13,722,817 | |
Valuation allowance | | | (14,686,462 | ) | | | (13,722,817 | ) |
Net deferred income tax asset | | $ | - | | | $ | - | |
We have net operating loss carryforwards for income tax purposes of approximately $20.9 million that are available to be offset against future income through 2037. We have net operating loss carryforwards of approximately $16.5 million that can be used indefinitely subject to limitations. The tax benefits relating to all timing differences have been fully reserved for in the valuation allowance account due to the substantial losses incurred through December 31, 2022. The change in the valuation allowance for the years ended December 31, 2022 and 2021, was an increase of $0.96 million and $1.08 million, respectively.
NOTE 8 – COMMITMENTS AND CONTINGENCIES
Commitments
On June 26, 2017, we entered a nonexclusive finder’s arrangement with Craft Capital Management LLC (“Craft”) in the event that proceeds with a debt and/or equity transaction or to finance a merger/acquisition and/or another transaction are arranged by Craft. We have no obligation to consummate any transaction, and we can choose to accept or reject any transaction in our sole and absolute discretion. Upon the successful completion of a placement, we will pay to Craft 8% of the gross proceeds from an equity placement and 3% for a debt placement. In addition, we will issue to Craft, at the time of closing, warrants with an aggregate exercise price equal to 3% of the amount raised. We have issued warrants to purchase 56,073 shares of common stock for L2 Capital equity transactions and warrants to purchase 69,000 shares of common stock for L2 Capital debt transactions for total outstanding warrants to purchase 125,073 shares of common stock, none of which has been exercised. These warrants have a fair value of $219 based on the Black-Scholes option-pricing model. The warrants have exercise prices ranging from $0.0425 to $0.25 per share and are exercisable for a period of five years after the closing of the placement. If we, at any time while these warrants are outstanding, sell or grant any option to purchase or sell or grant any right to reprice, or otherwise dispose of or issue any common stock or securities entitling any person or entity to acquire shares of common stock, at an effective price per share less than the then-exercise price, then the exercise price will be reduced to equal the lower share price, at the option of Craft. Such adjustment will be made whenever such common stock is issued. We will notify Craft in writing, no later than the trading day following the issuance of any common stock, of the applicable issuance price or applicable reset price, exchange price, conversion price, and other pricing terms.
Litigation
On May 4, 2018, we reached a settlement of the claims at issue in Ocean Thermal Energy Corp. v. Robert Coe, et al., Case No. 2:17-cv-02343SHL-cgc, before the United States District Court for the Western District of Tennessee. Between May 30 and July 19, 2018, we received three payments totaling $100,000 from the defendants. On August 8, 2018, an $8 million judgment was entered against the defendants and in our favor. On May 28, 2019, we further settled the claims at issue with two of the defendants, Brett M. Regal and his company, Trade Base Sales, Inc. (“Regal Debtors”), for $17,500,000, bringing the combined judgment and settlement amount owed to us is $25,500,000. On July 1, 2019, the United States District Judge for the Central District of California (case number: 2:19-cv-05299-VAP-JPR), approved our stipulated application for an order permitting us to levy on property and appointing a receiver to carry out the levy on Regal Debtors’ property, such that it may be sold (subject to further order of the court approving and confirming such sales), to satisfy the $25,500,000 settlement and judgment amounts in our favor. On August 15, 2019, the court-appointed receiver notified the court that he had taken custody, possession, and control of certain gemstone and mineral specimens, known as the “Ophir Collection” and 350,000 pounds of unrefined gold and other precious metal bearing ore. By order of the court, the receiver was given the authority to assign, sell, and transfer the debtor property. The proceeds of any sales will be used to satisfy the judgment and settlement agreement, receivership’s reasonable costs and fees, as well as any other claims as determined by the court. Various parties have come forward asserting ownership and priority lien rights to the property. In our ongoing efforts to collect the $25,500,000 judgment obtained, a third party has intervened in our case in the Central District of California (case number: 2:19-cv-05299-VAP-JPR), asserting that it is the rightful owner of the “Ophir Collection” of gems and mineral specimens that is now in possession of the court-appointed receiver. On February 25, 2022, all parties who have appeared in this case stipulated to dismiss all pending claims while leaving the receivership established by the court in place. On the same date, the court ordered that upon a successful sale of the Ophir Collection, the net proceeds shall be distributed in accordance with the terms of the January 3, 2022, confidential settlement between the parties.
On May 21, 2019, Theodore T. Herman filed a complaint against us in Theodore T. Herman v. Ocean Thermal Energy Corporation, Case No. CI-19-04780, in the Court of Common Pleas of Lancaster County, Pennsylvania, asserting that he is entitled to payment on the promissory note described in Note 4: Convertible Notes and Notes Payable. On July 1, 2019, we filed preliminary objections to the complaint, and subsequently filed an answer and new matter on August 20, 2019, to which the plaintiff filed a reply on September 9, 2019. We will continue to defend our position that no further payment on this note is owed.
On August 22, 2018, Fugro USA Maine, Inc. (“Fugro”), filed suit against us in Fugro USA Marine, Inc. v. Ocean Thermal Energy Corp., Cause No. 2018-56396, in the District Court for Harris County, TX, 165th Judicial District, seeking approximately $500,000 allegedly owed for engineering services provided. On June 23, 2020, a settlement was reached under which we would pay Fugro $375,000 by June 30, 2021. We were unable to pay the remaining balance and therefore entered into a second amendment to the settlement agreement extending the deadline for full payment, with 18% interest per annum, to December 31, 2021. We will continue to make regular monthly payments to Fugro of $10,000 per month, until the balance owed has been paid. We have recorded the amount of accrued legal settlement as of December 31, 2022. We have repaid $260,000 and the balance at December 31, 2022, was $115,000, with accrued interest of $51,842 at December 31, 2022.
NOTE 9 – CONSULTING AGREEMENTS
On June 4, 2018, we entered into a consulting agreement to pay 20,000 shares of common stock when one of the conditions of the contract was satisfied. Although this condition was satisfied on August 31, 2018, as of December 31, 2022, we have not issued the shares. As of December 31, 2022, and 2021, we have accrued the share compensation at fair value totaling $1,600.
On August 14, 2018, we entered into a consulting agreement to pay $40,000 by issuing shares of common stock. As of December 31, 2022, we have not issued the shares and have accrued the amount.
NOTE 10 – EMPLOYMENT AGREEMENTS
On January 1, 2011, we entered into a five-year employment agreement with our chief executive officer, which provides for successive one-year term renewals unless it is expressly cancelled by either party 100 days prior to the end of the term. Under the agreement, our chief executive officer will receive an annual salary of $350,000, a car allowance of $12,000, and company-paid health insurance. The agreement also provides for bonuses equal to one times his annual salary plus 500,000 shares of common stock for each additional project that generates $25 million or more in revenue to us. Our chief executive officer is entitled to receive severance pay in the lesser amount of three years’ salary or 100% of the remaining salary if the remaining term is less than three years. On September 15, 2017, an addendum was added to the employment agreement stating that effective June 30, 2017, his salary will be increased to $388,220 per year; that he will receive interest at a rate of 8% on his accrued unpaid wages; and that the term of employment agreement is extended for an additional five years. Effective June 9, 2022, we entered into a second addendum to the employment contract. Among other provisions, the addendum extends the employment agreement through December 31, 2025 and increases the annual salary to $454,738 from $388,220.
NOTE 11 – RELATED-PARTY TRANSACTIONS
For each of the years ended December 31, 2022 and 2021, we recorded rent expense of $120,000 to a company controlled by our chief executive officer under a lease agreement. The lease is for a one-year term and, unless either party shall give to the other written notice of termination, the term shall renew for a further period of one year, and so on from year to year until terminated by either party. At December 31, 2022 we had a payable to the entity of $70,000.
For the years ended December 31, 2022 and 2021, we recorded charges incurred to a company controlled by our chief executive officer for reimbursement of accounting and administrative services provided to us by an employee of that company. For the years ended December 31, 2022 and 2021, we recorded expense of $114,814 and $105,201, respectively, to this company. At December 31, 2022 we had a payable to the entity of $74,070.
From time to time, we enter into loans and notes payable with related parties. Refer to Note 4 for details on notes payable and convertible notes payable to related parties.
Accrued interest on related-party notes was $1,656,757 and $1,435,120 at December 31, 2022 and 2021, respectively.
During the year ended December 31, 2022, our chief executive officer converted $10,000 of notes and $2,043 of accrued interest into six shares of Series D Preferred Stock. He also purchased five shares of Series D Preferred Stock for cash proceeds of $10,000.
During the year ended December 31, 2022, entities controlled by our chief executive officer advanced $58,000 to us for working capital purposes.
During the year ended December 31, 2022, $15,000 of notes and $1,946 of related accrued interest were converted into 847,262 shares of common stock. The 847,262 shares were borrowed from our CEO to enable the conversions. We have accrued a liability for the shares to be reissued to our CEO in the amount of $11,014, the fair value of the shares on the date of conversion. The replacement shares have not been issued at December 31, 2022.
NOTE 12 – SUBSEQUENT EVENTS
Subsequent to December 31, 2022:
We issued 500 shares of series D Preferred Stock upon the conversion of $35,303 of related party notes and $964,697 of related accrued interest.
We issued 31 shares of series D Preferred Stock upon the conversion of $46,750 of notes and $12,670 of related accrued interest.
We issued 291 shares of Series D Preferred Stock for cash proceeds of $582,000.
nullnullnull
v3.23.2
| X |
- DefinitionBoolean flag that is true when the XBRL content amends previously-filed or accepted submission.
| Name: |
dei_AmendmentFlag |
| Namespace Prefix: |
dei_ |
| Data Type: |
xbrli:booleanItemType |
| Balance Type: |
na |
| Period Type: |
duration |
|
| X |
- DefinitionPCAOB issued Audit Firm Identifier Reference 1: http://www.xbrl.org/2003/role/presentationRef
-Publisher SEC
-Name Form 10-K
-Number 249
-Section 310
Reference 2: http://www.xbrl.org/2003/role/presentationRef
-Publisher SEC
-Name Form 20-F
-Number 249
-Section 220
-Subsection f
Reference 3: http://www.xbrl.org/2003/role/presentationRef
-Publisher SEC
-Name Form 40-F
-Number 249
-Section 240
-Subsection f
| Name: |
dei_AuditorFirmId |
| Namespace Prefix: |
dei_ |
| Data Type: |
dei:nonemptySequenceNumberItemType |
| Balance Type: |
na |
| Period Type: |
duration |
|
| X |
- ReferencesReference 1: http://www.xbrl.org/2003/role/presentationRef
-Publisher SEC
-Name Form 10-K
-Number 249
-Section 310
Reference 2: http://www.xbrl.org/2003/role/presentationRef
-Publisher SEC
-Name Form 20-F
-Number 249
-Section 220
-Subsection f
Reference 3: http://www.xbrl.org/2003/role/presentationRef
-Publisher SEC
-Name Form 40-F
-Number 249
-Section 240
-Subsection f
| Name: |
dei_AuditorLocation |
| Namespace Prefix: |
dei_ |
| Data Type: |
dei:internationalNameItemType |
| Balance Type: |
na |
| Period Type: |
duration |
|
| X |
- ReferencesReference 1: http://www.xbrl.org/2003/role/presentationRef
-Publisher SEC
-Name Form 10-K
-Number 249
-Section 310
Reference 2: http://www.xbrl.org/2003/role/presentationRef
-Publisher SEC
-Name Form 20-F
-Number 249
-Section 220
-Subsection f
Reference 3: http://www.xbrl.org/2003/role/presentationRef
-Publisher SEC
-Name Form 40-F
-Number 249
-Section 240
-Subsection f
| Name: |
dei_AuditorName |
| Namespace Prefix: |
dei_ |
| Data Type: |
dei:internationalNameItemType |
| Balance Type: |
na |
| Period Type: |
duration |
|
| X |
- DefinitionEnd date of current fiscal year in the format --MM-DD.
| Name: |
dei_CurrentFiscalYearEndDate |
| Namespace Prefix: |
dei_ |
| Data Type: |
xbrli:gMonthDayItemType |
| Balance Type: |
na |
| Period Type: |
duration |
|
| X |
- DefinitionBoolean flag that is true only for a form used as an annual report. Reference 1: http://www.xbrl.org/2003/role/presentationRef
-Publisher SEC
-Name Form 10-K
-Number 249
-Section 310
Reference 2: http://www.xbrl.org/2003/role/presentationRef
-Publisher SEC
-Name Form 20-F
-Number 249
-Section 220
-Subsection f
Reference 3: http://www.xbrl.org/2003/role/presentationRef
-Publisher SEC
-Name Form 40-F
-Number 249
-Section 240
-Subsection f
| Name: |
dei_DocumentAnnualReport |
| Namespace Prefix: |
dei_ |
| Data Type: |
xbrli:booleanItemType |
| Balance Type: |
na |
| Period Type: |
duration |
|
| X |
- DefinitionFiscal period values are FY, Q1, Q2, and Q3. 1st, 2nd and 3rd quarter 10-Q or 10-QT statements have value Q1, Q2, and Q3 respectively, with 10-K, 10-KT or other fiscal year statements having FY.
| Name: |
dei_DocumentFiscalPeriodFocus |
| Namespace Prefix: |
dei_ |
| Data Type: |
dei:fiscalPeriodItemType |
| Balance Type: |
na |
| Period Type: |
duration |
|
| X |
- DefinitionThis is focus fiscal year of the document report in YYYY format. For a 2006 annual report, which may also provide financial information from prior periods, fiscal 2006 should be given as the fiscal year focus. Example: 2006.
| Name: |
dei_DocumentFiscalYearFocus |
| Namespace Prefix: |
dei_ |
| Data Type: |
xbrli:gYearItemType |
| Balance Type: |
na |
| Period Type: |
duration |
|
| X |
- DefinitionFor the EDGAR submission types of Form 8-K: the date of the report, the date of the earliest event reported; for the EDGAR submission types of Form N-1A: the filing date; for all other submission types: the end of the reporting or transition period. The format of the date is YYYY-MM-DD.
| Name: |
dei_DocumentPeriodEndDate |
| Namespace Prefix: |
dei_ |
| Data Type: |
xbrli:dateItemType |
| Balance Type: |
na |
| Period Type: |
duration |
|
| X |
- DefinitionBoolean flag that is true only for a form used as a transition report. Reference 1: http://www.xbrl.org/2003/role/presentationRef
-Publisher SEC
-Name Forms 10-K, 10-Q, 20-F
-Number 240
-Section 13
-Subsection a-1
| Name: |
dei_DocumentTransitionReport |
| Namespace Prefix: |
dei_ |
| Data Type: |
xbrli:booleanItemType |
| Balance Type: |
na |
| Period Type: |
duration |
|
| X |
- DefinitionThe type of document being provided (such as 10-K, 10-Q, 485BPOS, etc). The document type is limited to the same value as the supporting SEC submission type, or the word 'Other'.
| Name: |
dei_DocumentType |
| Namespace Prefix: |
dei_ |
| Data Type: |
dei:submissionTypeItemType |
| Balance Type: |
na |
| Period Type: |
duration |
|
| X |
- DefinitionAddress Line 1 such as Attn, Building Name, Street Name
| Name: |
dei_EntityAddressAddressLine1 |
| Namespace Prefix: |
dei_ |
| Data Type: |
xbrli:normalizedStringItemType |
| Balance Type: |
na |
| Period Type: |
duration |
|
| X |
- DefinitionAddress Line 2 such as Street or Suite number
| Name: |
dei_EntityAddressAddressLine2 |
| Namespace Prefix: |
dei_ |
| Data Type: |
xbrli:normalizedStringItemType |
| Balance Type: |
na |
| Period Type: |
duration |
|
| X |
- Definition
+ References
+ Details
| Name: |
dei_EntityAddressCityOrTown |
| Namespace Prefix: |
dei_ |
| Data Type: |
xbrli:normalizedStringItemType |
| Balance Type: |
na |
| Period Type: |
duration |
|
| X |
- DefinitionCode for the postal or zip code
| Name: |
dei_EntityAddressPostalZipCode |
| Namespace Prefix: |
dei_ |
| Data Type: |
xbrli:normalizedStringItemType |
| Balance Type: |
na |
| Period Type: |
duration |
|
| X |
- DefinitionName of the state or province.
| Name: |
dei_EntityAddressStateOrProvince |
| Namespace Prefix: |
dei_ |
| Data Type: |
dei:stateOrProvinceItemType |
| Balance Type: |
na |
| Period Type: |
duration |
|
| X |
- DefinitionA unique 10-digit SEC-issued value to identify entities that have filed disclosures with the SEC. It is commonly abbreviated as CIK. Reference 1: http://www.xbrl.org/2003/role/presentationRef
-Publisher SEC
-Name Exchange Act
-Number 240
-Section 12
-Subsection b-2
| Name: |
dei_EntityCentralIndexKey |
| Namespace Prefix: |
dei_ |
| Data Type: |
dei:centralIndexKeyItemType |
| Balance Type: |
na |
| Period Type: |
duration |
|
| X |
- DefinitionIndicate number of shares or other units outstanding of each of registrant's classes of capital or common stock or other ownership interests, if and as stated on cover of related periodic report. Where multiple classes or units exist define each class/interest by adding class of stock items such as Common Class A [Member], Common Class B [Member] or Partnership Interest [Member] onto the Instrument [Domain] of the Entity Listings, Instrument.
| Name: |
dei_EntityCommonStockSharesOutstanding |
| Namespace Prefix: |
dei_ |
| Data Type: |
xbrli:sharesItemType |
| Balance Type: |
na |
| Period Type: |
instant |
|
| X |
- DefinitionIndicate 'Yes' or 'No' whether registrants (1) have filed all reports required to be filed by Section 13 or 15(d) of the Securities Exchange Act of 1934 during the preceding 12 months (or for such shorter period that registrants were required to file such reports), and (2) have been subject to such filing requirements for the past 90 days. This information should be based on the registrant's current or most recent filing containing the related disclosure.
| Name: |
dei_EntityCurrentReportingStatus |
| Namespace Prefix: |
dei_ |
| Data Type: |
dei:yesNoItemType |
| Balance Type: |
na |
| Period Type: |
duration |
|
| X |
- DefinitionIndicate if registrant meets the emerging growth company criteria. Reference 1: http://www.xbrl.org/2003/role/presentationRef
-Publisher SEC
-Name Exchange Act
-Number 240
-Section 12
-Subsection b-2
| Name: |
dei_EntityEmergingGrowthCompany |
| Namespace Prefix: |
dei_ |
| Data Type: |
xbrli:booleanItemType |
| Balance Type: |
na |
| Period Type: |
duration |
|
| X |
- DefinitionCommission file number. The field allows up to 17 characters. The prefix may contain 1-3 digits, the sequence number may contain 1-8 digits, the optional suffix may contain 1-4 characters, and the fields are separated with a hyphen.
| Name: |
dei_EntityFileNumber |
| Namespace Prefix: |
dei_ |
| Data Type: |
dei:fileNumberItemType |
| Balance Type: |
na |
| Period Type: |
duration |
|
| X |
- DefinitionIndicate whether the registrant is one of the following: Large Accelerated Filer, Accelerated Filer, Non-accelerated Filer. Definitions of these categories are stated in Rule 12b-2 of the Exchange Act. This information should be based on the registrant's current or most recent filing containing the related disclosure. Reference 1: http://www.xbrl.org/2003/role/presentationRef
-Publisher SEC
-Name Exchange Act
-Number 240
-Section 12
-Subsection b-2
| Name: |
dei_EntityFilerCategory |
| Namespace Prefix: |
dei_ |
| Data Type: |
dei:filerCategoryItemType |
| Balance Type: |
na |
| Period Type: |
duration |
|
| X |
- DefinitionTwo-character EDGAR code representing the state or country of incorporation.
| Name: |
dei_EntityIncorporationStateCountryCode |
| Namespace Prefix: |
dei_ |
| Data Type: |
dei:edgarStateCountryItemType |
| Balance Type: |
na |
| Period Type: |
duration |
|
| X |
- DefinitionBoolean flag that is true when the registrant has submitted electronically every Interactive Data File required to be submitted pursuant to Rule 405 of Regulation S-T during the preceding 12 months (or for such shorter period that the registrant was required to submit such files). Reference 1: http://www.xbrl.org/2003/role/presentationRef
-Publisher SEC
-Name Regulation S-T
-Number 232
-Section 405
| Name: |
dei_EntityInteractiveDataCurrent |
| Namespace Prefix: |
dei_ |
| Data Type: |
dei:yesNoItemType |
| Balance Type: |
na |
| Period Type: |
duration |
|
| X |
- DefinitionThe aggregate market value of the voting and non-voting common equity held by non-affiliates computed by reference to the price at which the common equity was last sold, or the average bid and asked price of such common equity, as of the last business day of the registrant's most recently completed second fiscal quarter.
| Name: |
dei_EntityPublicFloat |
| Namespace Prefix: |
dei_ |
| Data Type: |
xbrli:monetaryItemType |
| Balance Type: |
credit |
| Period Type: |
instant |
|
| X |
- DefinitionThe exact name of the entity filing the report as specified in its charter, which is required by forms filed with the SEC. Reference 1: http://www.xbrl.org/2003/role/presentationRef
-Publisher SEC
-Name Exchange Act
-Number 240
-Section 12
-Subsection b-2
| Name: |
dei_EntityRegistrantName |
| Namespace Prefix: |
dei_ |
| Data Type: |
xbrli:normalizedStringItemType |
| Balance Type: |
na |
| Period Type: |
duration |
|
| X |
- DefinitionBoolean flag that is true when the registrant is a shell company as defined in Rule 12b-2 of the Exchange Act. Reference 1: http://www.xbrl.org/2003/role/presentationRef
-Publisher SEC
-Name Exchange Act
-Number 240
-Section 12
-Subsection b-2
| Name: |
dei_EntityShellCompany |
| Namespace Prefix: |
dei_ |
| Data Type: |
xbrli:booleanItemType |
| Balance Type: |
na |
| Period Type: |
duration |
|
| X |
- DefinitionIndicates that the company is a Smaller Reporting Company (SRC). Reference 1: http://www.xbrl.org/2003/role/presentationRef
-Publisher SEC
-Name Exchange Act
-Number 240
-Section 12
-Subsection b-2
| Name: |
dei_EntitySmallBusiness |
| Namespace Prefix: |
dei_ |
| Data Type: |
xbrli:booleanItemType |
| Balance Type: |
na |
| Period Type: |
duration |
|
| X |
- DefinitionThe Tax Identification Number (TIN), also known as an Employer Identification Number (EIN), is a unique 9-digit value assigned by the IRS. Reference 1: http://www.xbrl.org/2003/role/presentationRef
-Publisher SEC
-Name Exchange Act
-Number 240
-Section 12
-Subsection b-2
| Name: |
dei_EntityTaxIdentificationNumber |
| Namespace Prefix: |
dei_ |
| Data Type: |
dei:employerIdItemType |
| Balance Type: |
na |
| Period Type: |
duration |
|
| X |
- DefinitionIndicate 'Yes' or 'No' if the registrant is not required to file reports pursuant to Section 13 or Section 15(d) of the Act.
| Name: |
dei_EntityVoluntaryFilers |
| Namespace Prefix: |
dei_ |
| Data Type: |
dei:yesNoItemType |
| Balance Type: |
na |
| Period Type: |
duration |
|
| X |
- DefinitionIndicate 'Yes' or 'No' if the registrant is a well-known seasoned issuer, as defined in Rule 405 of the Securities Act. Is used on Form Type: 10-K, 10-Q, 8-K, 20-F, 6-K, 10-K/A, 10-Q/A, 20-F/A, 6-K/A, N-CSR, N-Q, N-1A. Reference 1: http://www.xbrl.org/2003/role/presentationRef
-Publisher SEC
-Name Securities Act
-Number 230
-Section 405
| Name: |
dei_EntityWellKnownSeasonedIssuer |
| Namespace Prefix: |
dei_ |
| Data Type: |
dei:yesNoItemType |
| Balance Type: |
na |
| Period Type: |
duration |
|
| X |
- ReferencesReference 1: http://www.xbrl.org/2003/role/presentationRef
-Publisher SEC
-Name Form 10-K
-Number 249
-Section 310
Reference 2: http://www.xbrl.org/2003/role/presentationRef
-Publisher SEC
-Name Form 20-F
-Number 249
-Section 220
-Subsection f
Reference 3: http://www.xbrl.org/2003/role/presentationRef
-Publisher SEC
-Name Form 40-F
-Number 249
-Section 240
-Subsection f
| Name: |
dei_IcfrAuditorAttestationFlag |
| Namespace Prefix: |
dei_ |
| Data Type: |
xbrli:booleanItemType |
| Balance Type: |
na |
| Period Type: |
duration |
|
| X |
- DefinitionLocal phone number for entity.
| Name: |
dei_LocalPhoneNumber |
| Namespace Prefix: |
dei_ |
| Data Type: |
xbrli:normalizedStringItemType |
| Balance Type: |
na |
| Period Type: |
duration |
|
v3.23.2
CONSOLIDATED BALANCE SHEETS - USD ($)
|
Dec. 31, 2022 |
Dec. 31, 2021 |
| Current Assets |
|
|
| Cash |
$ 1,404
|
$ 957
|
| Prepaid expenses |
5,000
|
5,000
|
| Total Current Assets |
6,404
|
5,957
|
| Total Assets |
6,404
|
5,957
|
| Current Liabilities |
|
|
| Accounts payable and accrued expense |
20,517,881
|
17,553,823
|
| Notes payable - related party |
2,329,473
|
2,329,473
|
| Convertible notes payable - related party, net |
114,721
|
117,446
|
| Notes payable |
3,655,932
|
3,631,620
|
| Convertible note payable, net |
2,531,401
|
2,405,515
|
| Advances payable - related party, net |
57,760
|
0
|
| Derivative liability |
6,998,262
|
3,769,211
|
| Total Current Liabilities |
36,205,430
|
29,807,088
|
| Long-term Liabilities |
|
|
| Convertible note payable, net |
0
|
64,888
|
| Convertible notes payable - related party, net |
0
|
3,571
|
| Notes payable |
0
|
158,334
|
| Total Liabilities |
36,205,430
|
30,033,881
|
| Commitments and contingencies (See Note 8) |
0
|
0
|
| Stockholders' deficiency |
|
|
| Common stock, $0.001par value; 200,000,000shares authorized, 184,370,469 and 174,370,469 shares issued and outstanding, respectively |
184,371
|
174,371
|
| Additional paid-in capital |
60,110,402
|
59,379,402
|
| Accumulated deficit |
(96,496,618)
|
(89,584,516)
|
| Total Stockholders' Deficiency |
(36,199,026)
|
(30,027,924)
|
| Total Liabilities and Stockholders' Deficiency |
6,404
|
5,957
|
| Series D Preferred Stock Member |
|
|
| Stockholders' deficiency |
|
|
| Preferred Stock, Series B, $0.001par value; 1,250,000 shares authorized, 518,750 and 518,750 shares issued and outstanding, respectively |
0
|
0
|
| Series C Preferred Stock Member |
|
|
| Stockholders' deficiency |
|
|
| Preferred Stock, Series B, $0.001par value; 1,250,000 shares authorized, 518,750 and 518,750 shares issued and outstanding, respectively |
2,300
|
2,300
|
| Series B Preferred Stock Member |
|
|
| Stockholders' deficiency |
|
|
| Preferred Stock, Series B, $0.001par value; 1,250,000 shares authorized, 518,750 and 518,750 shares issued and outstanding, respectively |
$ 519
|
$ 519
|
| X |
- References
+ Details
| Name: |
cpwr_StockholdersDeficiencyAbstract |
| Namespace Prefix: |
cpwr_ |
| Data Type: |
xbrli:stringItemType |
| Balance Type: |
na |
| Period Type: |
duration |
|
| X |
- DefinitionCarrying value as of the balance sheet date of liabilities incurred (and for which invoices have typically been received) and payable to vendors for goods and services received that are used in an entity's business. Used to reflect the current portion of the liabilities (due within one year or within the normal operating cycle if longer). Reference 1: http://www.xbrl.org/2003/role/exampleRef
-Topic 852
-SubTopic 10
-Name Accounting Standards Codification
-Section 55
-Paragraph 10
-Publisher FASB
-URI https://asc.fasb.org//1943274/2147481372/852-10-55-10
Reference 2: http://fasb.org/us-gaap/role/ref/legacyRef
-Name Accounting Standards Codification
-Topic 210
-SubTopic 10
-Section S99
-Paragraph 1
-Subparagraph (SX 210.5-02.19(a))
-Publisher FASB
-URI https://asc.fasb.org//1943274/2147480566/210-10-S99-1
| Name: |
us-gaap_AccountsPayableCurrent |
| Namespace Prefix: |
us-gaap_ |
| Data Type: |
xbrli:monetaryItemType |
| Balance Type: |
credit |
| Period Type: |
instant |
|
| X |
- DefinitionAmount of excess of issue price over par or stated value of stock and from other transaction involving stock or stockholder. Includes, but is not limited to, additional paid-in capital (APIC) for common and preferred stock. Reference 1: http://www.xbrl.org/2003/role/exampleRef
-Topic 852
-SubTopic 10
-Name Accounting Standards Codification
-Section 55
-Paragraph 10
-Publisher FASB
-URI https://asc.fasb.org//1943274/2147481372/852-10-55-10
Reference 2: http://www.xbrl.org/2009/role/commonPracticeRef
-Topic 946
-SubTopic 210
-Name Accounting Standards Codification
-Section S99
-Paragraph 1
-Subparagraph (SX 210.6-04(18))
-Publisher FASB
-URI https://asc.fasb.org//1943274/2147479617/946-210-S99-1
Reference 3: http://fasb.org/us-gaap/role/ref/legacyRef
-Topic 210
-SubTopic 10
-Name Accounting Standards Codification
-Section S99
-Paragraph 1
-Subparagraph (SX 210.5-02(30)(a)(1))
-Publisher FASB
-URI https://asc.fasb.org//1943274/2147480566/210-10-S99-1
| Name: |
us-gaap_AdditionalPaidInCapital |
| Namespace Prefix: |
us-gaap_ |
| Data Type: |
xbrli:monetaryItemType |
| Balance Type: |
credit |
| Period Type: |
instant |
|
| X |
- DefinitionSum of the carrying amounts as of the balance sheet date of all assets that are recognized. Assets are probable future economic benefits obtained or controlled by an entity as a result of past transactions or events. Reference 1: http://www.xbrl.org/2003/role/disclosureRef
-Topic 810
-SubTopic 10
-Name Accounting Standards Codification
-Section 50
-Paragraph 3
-Subparagraph (bb)
-Publisher FASB
-URI https://asc.fasb.org//1943274/2147481203/810-10-50-3
Reference 2: http://www.xbrl.org/2003/role/disclosureRef
-Topic 810
-SubTopic 10
-Name Accounting Standards Codification
-Section 45
-Paragraph 25
-Subparagraph (a)
-Publisher FASB
-URI https://asc.fasb.org//1943274/2147481231/810-10-45-25
Reference 3: http://www.xbrl.org/2003/role/disclosureRef
-Topic 235
-SubTopic 10
-Name Accounting Standards Codification
-Section S99
-Paragraph 1
-Subparagraph (SX 210.4-08(g)(1)(ii))
-Publisher FASB
-URI https://asc.fasb.org//1943274/2147480678/235-10-S99-1
Reference 4: http://www.xbrl.org/2003/role/disclosureRef
-Topic 323
-SubTopic 10
-Name Accounting Standards Codification
-Section 50
-Paragraph 3
-Subparagraph (c)
-Publisher FASB
-URI https://asc.fasb.org//1943274/2147481687/323-10-50-3
Reference 5: http://www.xbrl.org/2003/role/disclosureRef
-Topic 825
-SubTopic 10
-Name Accounting Standards Codification
-Section 50
-Paragraph 28
-Subparagraph (f)
-Publisher FASB
-URI https://asc.fasb.org//1943274/2147482907/825-10-50-28
Reference 6: http://www.xbrl.org/2003/role/exampleRef
-Topic 852
-SubTopic 10
-Name Accounting Standards Codification
-Section 55
-Paragraph 10
-Publisher FASB
-URI https://asc.fasb.org//1943274/2147481372/852-10-55-10
Reference 7: http://www.xbrl.org/2003/role/exampleRef
-Topic 946
-SubTopic 830
-Name Accounting Standards Codification
-Section 55
-Paragraph 12
-Publisher FASB
-URI https://asc.fasb.org//1943274/2147480167/946-830-55-12
Reference 8: http://www.xbrl.org/2003/role/disclosureRef
-Topic 944
-SubTopic 210
-Name Accounting Standards Codification
-Section S99
-Paragraph 1
-Subparagraph (SX 210.7-03(a)(12))
-Publisher FASB
-URI https://asc.fasb.org//1943274/2147479440/944-210-S99-1
Reference 9: http://www.xbrl.org/2003/role/disclosureRef
-Topic 280
-SubTopic 10
-Name Accounting Standards Codification
-Section 50
-Paragraph 22
-Publisher FASB
-URI https://asc.fasb.org//1943274/2147482810/280-10-50-22
Reference 10: http://www.xbrl.org/2003/role/disclosureRef
-Topic 946
-SubTopic 210
-Name Accounting Standards Codification
-Section S99
-Paragraph 1
-Subparagraph (SX 210.6-04(8))
-Publisher FASB
-URI https://asc.fasb.org//1943274/2147479617/946-210-S99-1
Reference 11: http://www.xbrl.org/2003/role/disclosureRef
-Topic 210
-SubTopic 10
-Name Accounting Standards Codification
-Section S99
-Paragraph 1
-Subparagraph (SX 210.5-02(18))
-Publisher FASB
-URI https://asc.fasb.org//1943274/2147480566/210-10-S99-1
Reference 12: http://www.xbrl.org/2003/role/disclosureRef
-Topic 470
-SubTopic 10
-Name Accounting Standards Codification
-Section S99
-Paragraph 1A
-Subparagraph (SX 210.13-01(a)(4)(i))
-Publisher FASB
-URI https://asc.fasb.org//1943274/2147480097/470-10-S99-1A
Reference 13: http://www.xbrl.org/2009/role/commonPracticeRef
-Topic 470
-SubTopic 10
-Name Accounting Standards Codification
-Section S99
-Paragraph 1A
-Subparagraph (SX 210.13-01(a)(4)(ii))
-Publisher FASB
-URI https://asc.fasb.org//1943274/2147480097/470-10-S99-1A
Reference 14: http://www.xbrl.org/2009/role/commonPracticeRef
-Topic 470
-SubTopic 10
-Name Accounting Standards Codification
-Section S99
-Paragraph 1A
-Subparagraph (SX 210.13-01(a)(4)(iii))
-Publisher FASB
-URI https://asc.fasb.org//1943274/2147480097/470-10-S99-1A
Reference 15: http://www.xbrl.org/2003/role/disclosureRef
-Topic 470
-SubTopic 10
-Name Accounting Standards Codification
-Section S99
-Paragraph 1A
-Subparagraph (SX 210.13-01(a)(4)(iii)(A))
-Publisher FASB
-URI https://asc.fasb.org//1943274/2147480097/470-10-S99-1A
Reference 16: http://www.xbrl.org/2003/role/disclosureRef
-Topic 470
-SubTopic 10
-Name Accounting Standards Codification
-Section S99
-Paragraph 1A
-Subparagraph (SX 210.13-01(a)(4)(iv))
-Publisher FASB
-URI https://asc.fasb.org//1943274/2147480097/470-10-S99-1A
Reference 17: http://www.xbrl.org/2003/role/disclosureRef
-Topic 470
-SubTopic 10
-Name Accounting Standards Codification
-Section S99
-Paragraph 1A
-Subparagraph (SX 210.13-01(a)(5))
-Publisher FASB
-URI https://asc.fasb.org//1943274/2147480097/470-10-S99-1A
Reference 18: http://www.xbrl.org/2003/role/disclosureRef
-Topic 470
-SubTopic 10
-Name Accounting Standards Codification
-Section S99
-Paragraph 1B
-Subparagraph (SX 210.13-02(a)(4)(i))
-Publisher FASB
-URI https://asc.fasb.org//1943274/2147480097/470-10-S99-1B
Reference 19: http://www.xbrl.org/2003/role/disclosureRef
-Topic 470
-SubTopic 10
-Name Accounting Standards Codification
-Section S99
-Paragraph 1B
-Subparagraph (SX 210.13-02(a)(4)(iii)(A))
-Publisher FASB
-URI https://asc.fasb.org//1943274/2147480097/470-10-S99-1B
Reference 20: http://www.xbrl.org/2003/role/disclosureRef
-Topic 470
-SubTopic 10
-Name Accounting Standards Codification
-Section S99
-Paragraph 1B
-Subparagraph (SX 210.13-02(a)(4)(iii)(B))
-Publisher FASB
-URI https://asc.fasb.org//1943274/2147480097/470-10-S99-1B
Reference 21: http://www.xbrl.org/2003/role/disclosureRef
-Topic 470
-SubTopic 10
-Name Accounting Standards Codification
-Section S99
-Paragraph 1B
-Subparagraph (SX 210.13-02(a)(4)(iv))
-Publisher FASB
-URI https://asc.fasb.org//1943274/2147480097/470-10-S99-1B
Reference 22: http://www.xbrl.org/2003/role/disclosureRef
-Topic 470
-SubTopic 10
-Name Accounting Standards Codification
-Section S99
-Paragraph 1B
-Subparagraph (SX 210.13-02(a)(5))
-Publisher FASB
-URI https://asc.fasb.org//1943274/2147480097/470-10-S99-1B
Reference 23: http://www.xbrl.org/2009/role/commonPracticeRef
-Topic 852
-SubTopic 10
-Name Accounting Standards Codification
-Section 50
-Paragraph 7
-Subparagraph (a)
-Publisher FASB
-URI https://asc.fasb.org//1943274/2147481404/852-10-50-7
Reference 24: http://www.xbrl.org/2003/role/disclosureRef
-Topic 280
-SubTopic 10
-Name Accounting Standards Codification
-Section 50
-Paragraph 30
-Subparagraph (c)
-Publisher FASB
-URI https://asc.fasb.org//1943274/2147482810/280-10-50-30
Reference 25: http://www.xbrl.org/2003/role/disclosureRef
-Topic 280
-SubTopic 10
-Name Accounting Standards Codification
-Section 50
-Paragraph 32
-Subparagraph (d)
-Publisher FASB
-URI https://asc.fasb.org//1943274/2147482810/280-10-50-32
Reference 26: http://fasb.org/us-gaap/role/ref/legacyRef
-Topic 942
-SubTopic 210
-Name Accounting Standards Codification
-Section S99
-Paragraph 1
-Subparagraph (SX 210.9-03(11))
-Publisher FASB
-URI https://asc.fasb.org//1943274/2147479853/942-210-S99-1
| Name: |
us-gaap_Assets |
| Namespace Prefix: |
us-gaap_ |
| Data Type: |
xbrli:monetaryItemType |
| Balance Type: |
debit |
| Period Type: |
instant |
|
| X |
- DefinitionSum of the carrying amounts as of the balance sheet date of all assets that are expected to be realized in cash, sold, or consumed within one year (or the normal operating cycle, if longer). Assets are probable future economic benefits obtained or controlled by an entity as a result of past transactions or events. Reference 1: http://www.xbrl.org/2003/role/disclosureRef
-Topic 810
-SubTopic 10
-Name Accounting Standards Codification
-Section 50
-Paragraph 3
-Subparagraph (bb)
-Publisher FASB
-URI https://asc.fasb.org//1943274/2147481203/810-10-50-3
Reference 2: http://www.xbrl.org/2003/role/disclosureRef
-Topic 810
-SubTopic 10
-Name Accounting Standards Codification
-Section 45
-Paragraph 25
-Subparagraph (a)
-Publisher FASB
-URI https://asc.fasb.org//1943274/2147481231/810-10-45-25
Reference 3: http://www.xbrl.org/2003/role/disclosureRef
-Topic 235
-SubTopic 10
-Name Accounting Standards Codification
-Section S99
-Paragraph 1
-Subparagraph (SX 210.4-08(g)(1)(ii))
-Publisher FASB
-URI https://asc.fasb.org//1943274/2147480678/235-10-S99-1
Reference 4: http://www.xbrl.org/2003/role/disclosureRef
-Topic 323
-SubTopic 10
-Name Accounting Standards Codification
-Section 50
-Paragraph 3
-Subparagraph (c)
-Publisher FASB
-URI https://asc.fasb.org//1943274/2147481687/323-10-50-3
Reference 5: http://www.xbrl.org/2003/role/disclosureRef
-Topic 825
-SubTopic 10
-Name Accounting Standards Codification
-Section 50
-Paragraph 28
-Subparagraph (f)
-Publisher FASB
-URI https://asc.fasb.org//1943274/2147482907/825-10-50-28
Reference 6: http://www.xbrl.org/2003/role/exampleRef
-Topic 852
-SubTopic 10
-Name Accounting Standards Codification
-Section 55
-Paragraph 10
-Publisher FASB
-URI https://asc.fasb.org//1943274/2147481372/852-10-55-10
Reference 7: http://www.xbrl.org/2003/role/disclosureRef
-Topic 210
-SubTopic 10
-Name Accounting Standards Codification
-Section 45
-Paragraph 1
-Publisher FASB
-URI https://asc.fasb.org//1943274/2147483467/210-10-45-1
Reference 8: http://www.xbrl.org/2003/role/disclosureRef
-Topic 210
-SubTopic 10
-Name Accounting Standards Codification
-Section S99
-Paragraph 1
-Subparagraph (SX 210.5-02(9))
-Publisher FASB
-URI https://asc.fasb.org//1943274/2147480566/210-10-S99-1
Reference 9: http://www.xbrl.org/2003/role/disclosureRef
-Topic 470
-SubTopic 10
-Name Accounting Standards Codification
-Section S99
-Paragraph 1A
-Subparagraph (SX 210.13-01(a)(4)(i))
-Publisher FASB
-URI https://asc.fasb.org//1943274/2147480097/470-10-S99-1A
Reference 10: http://www.xbrl.org/2009/role/commonPracticeRef
-Topic 470
-SubTopic 10
-Name Accounting Standards Codification
-Section S99
-Paragraph 1A
-Subparagraph (SX 210.13-01(a)(4)(ii))
-Publisher FASB
-URI https://asc.fasb.org//1943274/2147480097/470-10-S99-1A
Reference 11: http://www.xbrl.org/2009/role/commonPracticeRef
-Topic 470
-SubTopic 10
-Name Accounting Standards Codification
-Section S99
-Paragraph 1A
-Subparagraph (SX 210.13-01(a)(4)(iii))
-Publisher FASB
-URI https://asc.fasb.org//1943274/2147480097/470-10-S99-1A
Reference 12: http://www.xbrl.org/2003/role/disclosureRef
-Topic 470
-SubTopic 10
-Name Accounting Standards Codification
-Section S99
-Paragraph 1A
-Subparagraph (SX 210.13-01(a)(4)(iii)(A))
-Publisher FASB
-URI https://asc.fasb.org//1943274/2147480097/470-10-S99-1A
Reference 13: http://www.xbrl.org/2003/role/disclosureRef
-Topic 470
-SubTopic 10
-Name Accounting Standards Codification
-Section S99
-Paragraph 1A
-Subparagraph (SX 210.13-01(a)(4)(iv))
-Publisher FASB
-URI https://asc.fasb.org//1943274/2147480097/470-10-S99-1A
Reference 14: http://www.xbrl.org/2003/role/disclosureRef
-Topic 470
-SubTopic 10
-Name Accounting Standards Codification
-Section S99
-Paragraph 1A
-Subparagraph (SX 210.13-01(a)(5))
-Publisher FASB
-URI https://asc.fasb.org//1943274/2147480097/470-10-S99-1A
Reference 15: http://www.xbrl.org/2003/role/disclosureRef
-Topic 470
-SubTopic 10
-Name Accounting Standards Codification
-Section S99
-Paragraph 1B
-Subparagraph (SX 210.13-02(a)(4)(i))
-Publisher FASB
-URI https://asc.fasb.org//1943274/2147480097/470-10-S99-1B
Reference 16: http://www.xbrl.org/2003/role/disclosureRef
-Topic 470
-SubTopic 10
-Name Accounting Standards Codification
-Section S99
-Paragraph 1B
-Subparagraph (SX 210.13-02(a)(4)(iii)(A))
-Publisher FASB
-URI https://asc.fasb.org//1943274/2147480097/470-10-S99-1B
Reference 17: http://www.xbrl.org/2003/role/disclosureRef
-Topic 470
-SubTopic 10
-Name Accounting Standards Codification
-Section S99
-Paragraph 1B
-Subparagraph (SX 210.13-02(a)(4)(iii)(B))
-Publisher FASB
-URI https://asc.fasb.org//1943274/2147480097/470-10-S99-1B
Reference 18: http://www.xbrl.org/2003/role/disclosureRef
-Topic 470
-SubTopic 10
-Name Accounting Standards Codification
-Section S99
-Paragraph 1B
-Subparagraph (SX 210.13-02(a)(4)(iv))
-Publisher FASB
-URI https://asc.fasb.org//1943274/2147480097/470-10-S99-1B
Reference 19: http://www.xbrl.org/2003/role/disclosureRef
-Topic 470
-SubTopic 10
-Name Accounting Standards Codification
-Section S99
-Paragraph 1B
-Subparagraph (SX 210.13-02(a)(5))
-Publisher FASB
-URI https://asc.fasb.org//1943274/2147480097/470-10-S99-1B
Reference 20: http://www.xbrl.org/2009/role/commonPracticeRef
-Topic 852
-SubTopic 10
-Name Accounting Standards Codification
-Section 50
-Paragraph 7
-Subparagraph (a)
-Publisher FASB
-URI https://asc.fasb.org//1943274/2147481404/852-10-50-7
| Name: |
us-gaap_AssetsCurrent |
| Namespace Prefix: |
us-gaap_ |
| Data Type: |
xbrli:monetaryItemType |
| Balance Type: |
debit |
| Period Type: |
instant |
|
| X |
- References
+ Details
| Name: |
us-gaap_AssetsCurrentAbstract |
| Namespace Prefix: |
us-gaap_ |
| Data Type: |
xbrli:stringItemType |
| Balance Type: |
na |
| Period Type: |
duration |
|
| X |
- DefinitionAmount of currency on hand as well as demand deposits with banks or financial institutions. Includes other kinds of accounts that have the general characteristics of demand deposits. Excludes cash and cash equivalents within disposal group and discontinued operation. Reference 1: http://www.xbrl.org/2003/role/exampleRef
-Topic 852
-SubTopic 10
-Name Accounting Standards Codification
-Section 55
-Paragraph 10
-Publisher FASB
-URI https://asc.fasb.org//1943274/2147481372/852-10-55-10
Reference 2: http://www.xbrl.org/2003/role/exampleRef
-Topic 946
-SubTopic 830
-Name Accounting Standards Codification
-Section 55
-Paragraph 12
-Publisher FASB
-URI https://asc.fasb.org//1943274/2147480167/946-830-55-12
Reference 3: http://www.xbrl.org/2003/role/disclosureRef
-Topic 944
-SubTopic 210
-Name Accounting Standards Codification
-Section S99
-Paragraph 1
-Subparagraph (SX 210.7-03(a)(2))
-Publisher FASB
-URI https://asc.fasb.org//1943274/2147479440/944-210-S99-1
Reference 4: http://www.xbrl.org/2003/role/disclosureRef
-Topic 946
-SubTopic 210
-Name Accounting Standards Codification
-Section S99
-Paragraph 1
-Subparagraph (SX 210.6-04(4))
-Publisher FASB
-URI https://asc.fasb.org//1943274/2147479617/946-210-S99-1
Reference 5: http://www.xbrl.org/2003/role/disclosureRef
-Topic 946
-SubTopic 210
-Name Accounting Standards Codification
-Section 45
-Paragraph 21
-Publisher FASB
-URI https://asc.fasb.org//1943274/2147480555/946-210-45-21
Reference 6: http://www.xbrl.org/2009/role/commonPracticeRef
-Topic 210
-SubTopic 10
-Name Accounting Standards Codification
-Section S99
-Paragraph 1
-Subparagraph (SX 210.5-02(1))
-Publisher FASB
-URI https://asc.fasb.org//1943274/2147480566/210-10-S99-1
Reference 7: http://www.xbrl.org/2003/role/disclosureRef
-Name Accounting Standards Codification
-Section 45
-Paragraph 20
-SubTopic 210
-Topic 946
-Publisher FASB
-URI https://asc.fasb.org//1943274/2147480555/946-210-45-20
| Name: |
us-gaap_Cash |
| Namespace Prefix: |
us-gaap_ |
| Data Type: |
xbrli:monetaryItemType |
| Balance Type: |
debit |
| Period Type: |
instant |
|
| X |
- DefinitionRepresents the caption on the face of the balance sheet to indicate that the entity has entered into (1) purchase or supply arrangements that will require expending a portion of its resources to meet the terms thereof, and (2) is exposed to potential losses or, less frequently, gains, arising from (a) possible claims against a company's resources due to future performance under contract terms, and (b) possible losses or likely gains from uncertainties that will ultimately be resolved when one or more future events that are deemed likely to occur do occur or fail to occur. Reference 1: http://www.xbrl.org/2003/role/disclosureRef
-Topic 944
-SubTopic 210
-Name Accounting Standards Codification
-Section S99
-Paragraph 1
-Subparagraph (SX 210.7-03(a)(19))
-Publisher FASB
-URI https://asc.fasb.org//1943274/2147479440/944-210-S99-1
Reference 2: http://www.xbrl.org/2003/role/disclosureRef
-Topic 946
-SubTopic 210
-Name Accounting Standards Codification
-Section S99
-Paragraph 1
-Subparagraph (SX 210.6-04(15))
-Publisher FASB
-URI https://asc.fasb.org//1943274/2147479617/946-210-S99-1
Reference 3: http://fasb.org/us-gaap/role/ref/legacyRef
-Name Accounting Standards Codification
-Topic 942
-SubTopic 210
-Section S99
-Paragraph 1
-Subparagraph (SX 210.9-03.17)
-Publisher FASB
-URI https://asc.fasb.org//1943274/2147479853/942-210-S99-1
Reference 4: http://fasb.org/us-gaap/role/ref/legacyRef
-Name Accounting Standards Codification
-Topic 210
-SubTopic 10
-Section S99
-Paragraph 1
-Subparagraph (SX 210.5-02.25)
-Publisher FASB
-URI https://asc.fasb.org//1943274/2147480566/210-10-S99-1
| Name: |
us-gaap_CommitmentsAndContingencies |
| Namespace Prefix: |
us-gaap_ |
| Data Type: |
xbrli:monetaryItemType |
| Balance Type: |
credit |
| Period Type: |
instant |
|
| X |
- DefinitionAggregate par or stated value of issued nonredeemable common stock (or common stock redeemable solely at the option of the issuer). This item includes treasury stock repurchased by the entity. Note: elements for number of nonredeemable common shares, par value and other disclosure concepts are in another section within stockholders' equity. Reference 1: http://www.xbrl.org/2003/role/exampleRef
-Topic 852
-SubTopic 10
-Name Accounting Standards Codification
-Section 55
-Paragraph 10
-Publisher FASB
-URI https://asc.fasb.org//1943274/2147481372/852-10-55-10
Reference 2: http://www.xbrl.org/2003/role/disclosureRef
-Topic 944
-SubTopic 210
-Name Accounting Standards Codification
-Section S99
-Paragraph 1
-Subparagraph (SX 210.7-03(a)(22))
-Publisher FASB
-URI https://asc.fasb.org//1943274/2147479440/944-210-S99-1
Reference 3: http://fasb.org/us-gaap/role/ref/legacyRef
-Topic 210
-SubTopic 10
-Name Accounting Standards Codification
-Section S99
-Paragraph 1
-Subparagraph (SX 210.5-02(29))
-Publisher FASB
-URI https://asc.fasb.org//1943274/2147480566/210-10-S99-1
| Name: |
us-gaap_CommonStockValue |
| Namespace Prefix: |
us-gaap_ |
| Data Type: |
xbrli:monetaryItemType |
| Balance Type: |
credit |
| Period Type: |
instant |
|
| X |
- DefinitionCarrying amount of long-term convertible debt as of the balance sheet date, net of the amount due in the next twelve months or greater than the normal operating cycle, if longer. The debt is convertible into another form of financial instrument, typically the entity's common stock. Reference 1: http://fasb.org/us-gaap/role/ref/legacyRef
-Name Accounting Standards Codification
-Topic 210
-SubTopic 10
-Section S99
-Paragraph 1
-Subparagraph (SX 210.5-02.22)
-Publisher FASB
-URI https://asc.fasb.org//1943274/2147480566/210-10-S99-1
| Name: |
us-gaap_ConvertibleDebtNoncurrent |
| Namespace Prefix: |
us-gaap_ |
| Data Type: |
xbrli:monetaryItemType |
| Balance Type: |
credit |
| Period Type: |
instant |
|
| X |
- DefinitionCarrying value as of the balance sheet date of the portion of long-term debt due within one year or the operating cycle if longer identified as Convertible Notes Payable. Convertible Notes Payable is a written promise to pay a note which can be exchanged for a specified amount of another, related security, at the option of the issuer and the holder. Reference 1: http://fasb.org/us-gaap/role/ref/legacyRef
-Name Accounting Standards Codification
-Topic 210
-SubTopic 10
-Section S99
-Paragraph 1
-Subparagraph (SX 210.5-02.20)
-Publisher FASB
-URI https://asc.fasb.org//1943274/2147480566/210-10-S99-1
| Name: |
us-gaap_ConvertibleNotesPayableCurrent |
| Namespace Prefix: |
us-gaap_ |
| Data Type: |
xbrli:monetaryItemType |
| Balance Type: |
credit |
| Period Type: |
instant |
|
| X |
- DefinitionFair value, after the effects of master netting arrangements, of a financial liability or contract with one or more underlyings, notional amount or payment provision or both, and the contract can be net settled by means outside the contract or delivery of an asset, expected to be settled within one year or normal operating cycle, if longer. Includes assets not subject to a master netting arrangement and not elected to be offset. Reference 1: http://www.xbrl.org/2003/role/disclosureRef
-Topic 210
-SubTopic 20
-Name Accounting Standards Codification
-Section 50
-Paragraph 3
-Subparagraph (c)
-Publisher FASB
-URI https://asc.fasb.org//1943274/2147483466/210-20-50-3
| Name: |
us-gaap_DerivativeLiabilitiesCurrent |
| Namespace Prefix: |
us-gaap_ |
| Data Type: |
xbrli:monetaryItemType |
| Balance Type: |
credit |
| Period Type: |
instant |
|
| X |
- DefinitionSum of the carrying amounts as of the balance sheet date of all liabilities that are recognized. Liabilities are probable future sacrifices of economic benefits arising from present obligations of an entity to transfer assets or provide services to other entities in the future. Reference 1: http://www.xbrl.org/2003/role/disclosureRef
-Topic 810
-SubTopic 10
-Name Accounting Standards Codification
-Section 50
-Paragraph 3
-Subparagraph (c)
-Publisher FASB
-URI https://asc.fasb.org//1943274/2147481203/810-10-50-3
Reference 2: http://www.xbrl.org/2003/role/disclosureRef
-Topic 810
-SubTopic 10
-Name Accounting Standards Codification
-Section 45
-Paragraph 25
-Subparagraph (b)
-Publisher FASB
-URI https://asc.fasb.org//1943274/2147481231/810-10-45-25
Reference 3: http://www.xbrl.org/2003/role/disclosureRef
-Topic 810
-SubTopic 10
-Name Accounting Standards Codification
-Section 50
-Paragraph 3
-Subparagraph (bb)
-Publisher FASB
-URI https://asc.fasb.org//1943274/2147481203/810-10-50-3
Reference 4: http://www.xbrl.org/2003/role/disclosureRef
-Topic 235
-SubTopic 10
-Name Accounting Standards Codification
-Section S99
-Paragraph 1
-Subparagraph (SX 210.4-08(g)(1)(ii))
-Publisher FASB
-URI https://asc.fasb.org//1943274/2147480678/235-10-S99-1
Reference 5: http://www.xbrl.org/2003/role/disclosureRef
-Topic 323
-SubTopic 10
-Name Accounting Standards Codification
-Section 50
-Paragraph 3
-Subparagraph (c)
-Publisher FASB
-URI https://asc.fasb.org//1943274/2147481687/323-10-50-3
Reference 6: http://www.xbrl.org/2003/role/disclosureRef
-Topic 825
-SubTopic 10
-Name Accounting Standards Codification
-Section 50
-Paragraph 28
-Subparagraph (f)
-Publisher FASB
-URI https://asc.fasb.org//1943274/2147482907/825-10-50-28
Reference 7: http://www.xbrl.org/2003/role/exampleRef
-Topic 946
-SubTopic 830
-Name Accounting Standards Codification
-Section 55
-Paragraph 12
-Publisher FASB
-URI https://asc.fasb.org//1943274/2147480167/946-830-55-12
Reference 8: http://www.xbrl.org/2003/role/disclosureRef
-Topic 946
-SubTopic 210
-Name Accounting Standards Codification
-Section S99
-Paragraph 1
-Subparagraph (SX 210.6-04(14))
-Publisher FASB
-URI https://asc.fasb.org//1943274/2147479617/946-210-S99-1
Reference 9: http://www.xbrl.org/2003/role/disclosureRef
-Topic 470
-SubTopic 10
-Name Accounting Standards Codification
-Section S99
-Paragraph 1A
-Subparagraph (SX 210.13-01(a)(4)(i))
-Publisher FASB
-URI https://asc.fasb.org//1943274/2147480097/470-10-S99-1A
Reference 10: http://www.xbrl.org/2009/role/commonPracticeRef
-Topic 470
-SubTopic 10
-Name Accounting Standards Codification
-Section S99
-Paragraph 1A
-Subparagraph (SX 210.13-01(a)(4)(ii))
-Publisher FASB
-URI https://asc.fasb.org//1943274/2147480097/470-10-S99-1A
Reference 11: http://www.xbrl.org/2003/role/disclosureRef
-Topic 470
-SubTopic 10
-Name Accounting Standards Codification
-Section S99
-Paragraph 1A
-Subparagraph (SX 210.13-01(a)(4)(iii)(A))
-Publisher FASB
-URI https://asc.fasb.org//1943274/2147480097/470-10-S99-1A
Reference 12: http://www.xbrl.org/2003/role/disclosureRef
-Topic 470
-SubTopic 10
-Name Accounting Standards Codification
-Section S99
-Paragraph 1A
-Subparagraph (SX 210.13-01(a)(4)(iv))
-Publisher FASB
-URI https://asc.fasb.org//1943274/2147480097/470-10-S99-1A
Reference 13: http://www.xbrl.org/2003/role/disclosureRef
-Topic 470
-SubTopic 10
-Name Accounting Standards Codification
-Section S99
-Paragraph 1A
-Subparagraph (SX 210.13-01(a)(5))
-Publisher FASB
-URI https://asc.fasb.org//1943274/2147480097/470-10-S99-1A
Reference 14: http://www.xbrl.org/2003/role/disclosureRef
-Topic 470
-SubTopic 10
-Name Accounting Standards Codification
-Section S99
-Paragraph 1B
-Subparagraph (SX 210.13-02(a)(4)(i))
-Publisher FASB
-URI https://asc.fasb.org//1943274/2147480097/470-10-S99-1B
Reference 15: http://www.xbrl.org/2003/role/disclosureRef
-Topic 470
-SubTopic 10
-Name Accounting Standards Codification
-Section S99
-Paragraph 1B
-Subparagraph (SX 210.13-02(a)(4)(iii)(A))
-Publisher FASB
-URI https://asc.fasb.org//1943274/2147480097/470-10-S99-1B
Reference 16: http://www.xbrl.org/2003/role/disclosureRef
-Topic 470
-SubTopic 10
-Name Accounting Standards Codification
-Section S99
-Paragraph 1B
-Subparagraph (SX 210.13-02(a)(4)(iii)(B))
-Publisher FASB
-URI https://asc.fasb.org//1943274/2147480097/470-10-S99-1B
Reference 17: http://www.xbrl.org/2003/role/disclosureRef
-Topic 470
-SubTopic 10
-Name Accounting Standards Codification
-Section S99
-Paragraph 1B
-Subparagraph (SX 210.13-02(a)(4)(iv))
-Publisher FASB
-URI https://asc.fasb.org//1943274/2147480097/470-10-S99-1B
Reference 18: http://www.xbrl.org/2003/role/disclosureRef
-Topic 470
-SubTopic 10
-Name Accounting Standards Codification
-Section S99
-Paragraph 1B
-Subparagraph (SX 210.13-02(a)(5))
-Publisher FASB
-URI https://asc.fasb.org//1943274/2147480097/470-10-S99-1B
Reference 19: http://www.xbrl.org/2009/role/commonPracticeRef
-Topic 852
-SubTopic 10
-Name Accounting Standards Codification
-Section 50
-Paragraph 7
-Subparagraph (a)
-Publisher FASB
-URI https://asc.fasb.org//1943274/2147481404/852-10-50-7
Reference 20: http://www.xbrl.org/2009/role/commonPracticeRef
-Topic 852
-SubTopic 10
-Name Accounting Standards Codification
-Section 50
-Paragraph 7
-Subparagraph (b)
-Publisher FASB
-URI https://asc.fasb.org//1943274/2147481404/852-10-50-7
Reference 21: http://www.xbrl.org/2003/role/exampleRef
-Topic 280
-SubTopic 10
-Name Accounting Standards Codification
-Section 50
-Paragraph 30
-Subparagraph (d)
-Publisher FASB
-URI https://asc.fasb.org//1943274/2147482810/280-10-50-30
Reference 22: http://fasb.org/us-gaap/role/ref/legacyRef
-Name Accounting Standards Codification
-Topic 210
-SubTopic 10
-Section S99
-Paragraph 1
-Subparagraph (SX 210.5-02.19-26)
-Publisher FASB
-URI https://asc.fasb.org//1943274/2147480566/210-10-S99-1
| Name: |
us-gaap_Liabilities |
| Namespace Prefix: |
us-gaap_ |
| Data Type: |
xbrli:monetaryItemType |
| Balance Type: |
credit |
| Period Type: |
instant |
|
| X |
- DefinitionAmount of liabilities and equity items, including the portion of equity attributable to noncontrolling interests, if any. Reference 1: http://www.xbrl.org/2003/role/exampleRef
-Topic 852
-SubTopic 10
-Name Accounting Standards Codification
-Section 55
-Paragraph 10
-Publisher FASB
-URI https://asc.fasb.org//1943274/2147481372/852-10-55-10
Reference 2: http://www.xbrl.org/2003/role/disclosureRef
-Topic 944
-SubTopic 210
-Name Accounting Standards Codification
-Section S99
-Paragraph 1
-Subparagraph (SX 210.7-03(a)(25))
-Publisher FASB
-URI https://asc.fasb.org//1943274/2147479440/944-210-S99-1
Reference 3: http://www.xbrl.org/2009/role/commonPracticeRef
-Topic 235
-SubTopic 10
-Name Accounting Standards Codification
-Section S99
-Paragraph 1
-Subparagraph (SX 210.4-08(g)(1)(ii))
-Publisher FASB
-URI https://asc.fasb.org//1943274/2147480678/235-10-S99-1
Reference 4: http://www.xbrl.org/2009/role/commonPracticeRef
-Topic 323
-SubTopic 10
-Name Accounting Standards Codification
-Section 50
-Paragraph 3
-Subparagraph (c)
-Publisher FASB
-URI https://asc.fasb.org//1943274/2147481687/323-10-50-3
Reference 5: http://www.xbrl.org/2009/role/commonPracticeRef
-Topic 825
-SubTopic 10
-Name Accounting Standards Codification
-Section 50
-Paragraph 28
-Subparagraph (f)
-Publisher FASB
-URI https://asc.fasb.org//1943274/2147482907/825-10-50-28
Reference 6: http://fasb.org/us-gaap/role/ref/legacyRef
-Topic 942
-SubTopic 210
-Name Accounting Standards Codification
-Section S99
-Paragraph 1
-Subparagraph (SX 210.9-03(23))
-Publisher FASB
-URI https://asc.fasb.org//1943274/2147479853/942-210-S99-1
Reference 7: http://fasb.org/us-gaap/role/ref/legacyRef
-Topic 210
-SubTopic 10
-Name Accounting Standards Codification
-Section S99
-Paragraph 1
-Subparagraph (SX 210.5-02(32))
-Publisher FASB
-URI https://asc.fasb.org//1943274/2147480566/210-10-S99-1
| Name: |
us-gaap_LiabilitiesAndStockholdersEquity |
| Namespace Prefix: |
us-gaap_ |
| Data Type: |
xbrli:monetaryItemType |
| Balance Type: |
credit |
| Period Type: |
instant |
|
| X |
- DefinitionTotal obligations incurred as part of normal operations that are expected to be paid during the following twelve months or within one business cycle, if longer. Reference 1: http://www.xbrl.org/2003/role/disclosureRef
-Topic 810
-SubTopic 10
-Name Accounting Standards Codification
-Section 50
-Paragraph 3
-Subparagraph (c)
-Publisher FASB
-URI https://asc.fasb.org//1943274/2147481203/810-10-50-3
Reference 2: http://www.xbrl.org/2003/role/disclosureRef
-Topic 810
-SubTopic 10
-Name Accounting Standards Codification
-Section 45
-Paragraph 25
-Subparagraph (b)
-Publisher FASB
-URI https://asc.fasb.org//1943274/2147481231/810-10-45-25
Reference 3: http://www.xbrl.org/2003/role/disclosureRef
-Topic 810
-SubTopic 10
-Name Accounting Standards Codification
-Section 50
-Paragraph 3
-Subparagraph (bb)
-Publisher FASB
-URI https://asc.fasb.org//1943274/2147481203/810-10-50-3
Reference 4: http://www.xbrl.org/2003/role/disclosureRef
-Topic 235
-SubTopic 10
-Name Accounting Standards Codification
-Section S99
-Paragraph 1
-Subparagraph (SX 210.4-08(g)(1)(ii))
-Publisher FASB
-URI https://asc.fasb.org//1943274/2147480678/235-10-S99-1
Reference 5: http://www.xbrl.org/2003/role/disclosureRef
-Topic 323
-SubTopic 10
-Name Accounting Standards Codification
-Section 50
-Paragraph 3
-Subparagraph (c)
-Publisher FASB
-URI https://asc.fasb.org//1943274/2147481687/323-10-50-3
Reference 6: http://www.xbrl.org/2003/role/disclosureRef
-Topic 825
-SubTopic 10
-Name Accounting Standards Codification
-Section 50
-Paragraph 28
-Subparagraph (f)
-Publisher FASB
-URI https://asc.fasb.org//1943274/2147482907/825-10-50-28
Reference 7: http://www.xbrl.org/2003/role/exampleRef
-Topic 852
-SubTopic 10
-Name Accounting Standards Codification
-Section 55
-Paragraph 10
-Publisher FASB
-URI https://asc.fasb.org//1943274/2147481372/852-10-55-10
Reference 8: http://www.xbrl.org/2003/role/disclosureRef
-Topic 210
-SubTopic 10
-Name Accounting Standards Codification
-Section 45
-Paragraph 5
-Publisher FASB
-URI https://asc.fasb.org//1943274/2147483467/210-10-45-5
Reference 9: http://www.xbrl.org/2003/role/disclosureRef
-Topic 470
-SubTopic 10
-Name Accounting Standards Codification
-Section S99
-Paragraph 1A
-Subparagraph (SX 210.13-01(a)(4)(i))
-Publisher FASB
-URI https://asc.fasb.org//1943274/2147480097/470-10-S99-1A
Reference 10: http://www.xbrl.org/2009/role/commonPracticeRef
-Topic 470
-SubTopic 10
-Name Accounting Standards Codification
-Section S99
-Paragraph 1A
-Subparagraph (SX 210.13-01(a)(4)(ii))
-Publisher FASB
-URI https://asc.fasb.org//1943274/2147480097/470-10-S99-1A
Reference 11: http://www.xbrl.org/2003/role/disclosureRef
-Topic 470
-SubTopic 10
-Name Accounting Standards Codification
-Section S99
-Paragraph 1A
-Subparagraph (SX 210.13-01(a)(4)(iii)(A))
-Publisher FASB
-URI https://asc.fasb.org//1943274/2147480097/470-10-S99-1A
Reference 12: http://www.xbrl.org/2003/role/disclosureRef
-Topic 470
-SubTopic 10
-Name Accounting Standards Codification
-Section S99
-Paragraph 1A
-Subparagraph (SX 210.13-01(a)(4)(iv))
-Publisher FASB
-URI https://asc.fasb.org//1943274/2147480097/470-10-S99-1A
Reference 13: http://www.xbrl.org/2003/role/disclosureRef
-Topic 470
-SubTopic 10
-Name Accounting Standards Codification
-Section S99
-Paragraph 1A
-Subparagraph (SX 210.13-01(a)(5))
-Publisher FASB
-URI https://asc.fasb.org//1943274/2147480097/470-10-S99-1A
Reference 14: http://www.xbrl.org/2003/role/disclosureRef
-Topic 470
-SubTopic 10
-Name Accounting Standards Codification
-Section S99
-Paragraph 1B
-Subparagraph (SX 210.13-02(a)(4)(i))
-Publisher FASB
-URI https://asc.fasb.org//1943274/2147480097/470-10-S99-1B
Reference 15: http://www.xbrl.org/2003/role/disclosureRef
-Topic 470
-SubTopic 10
-Name Accounting Standards Codification
-Section S99
-Paragraph 1B
-Subparagraph (SX 210.13-02(a)(4)(iii)(A))
-Publisher FASB
-URI https://asc.fasb.org//1943274/2147480097/470-10-S99-1B
Reference 16: http://www.xbrl.org/2003/role/disclosureRef
-Topic 470
-SubTopic 10
-Name Accounting Standards Codification
-Section S99
-Paragraph 1B
-Subparagraph (SX 210.13-02(a)(4)(iii)(B))
-Publisher FASB
-URI https://asc.fasb.org//1943274/2147480097/470-10-S99-1B
Reference 17: http://www.xbrl.org/2003/role/disclosureRef
-Topic 470
-SubTopic 10
-Name Accounting Standards Codification
-Section S99
-Paragraph 1B
-Subparagraph (SX 210.13-02(a)(4)(iv))
-Publisher FASB
-URI https://asc.fasb.org//1943274/2147480097/470-10-S99-1B
Reference 18: http://www.xbrl.org/2003/role/disclosureRef
-Topic 470
-SubTopic 10
-Name Accounting Standards Codification
-Section S99
-Paragraph 1B
-Subparagraph (SX 210.13-02(a)(5))
-Publisher FASB
-URI https://asc.fasb.org//1943274/2147480097/470-10-S99-1B
Reference 19: http://www.xbrl.org/2009/role/commonPracticeRef
-Topic 852
-SubTopic 10
-Name Accounting Standards Codification
-Section 50
-Paragraph 7
-Subparagraph (a)
-Publisher FASB
-URI https://asc.fasb.org//1943274/2147481404/852-10-50-7
Reference 20: http://www.xbrl.org/2009/role/commonPracticeRef
-Topic 852
-SubTopic 10
-Name Accounting Standards Codification
-Section 50
-Paragraph 7
-Subparagraph (b)
-Publisher FASB
-URI https://asc.fasb.org//1943274/2147481404/852-10-50-7
Reference 21: http://fasb.org/us-gaap/role/ref/legacyRef
-Name Accounting Standards Codification
-Topic 210
-SubTopic 10
-Section S99
-Paragraph 1
-Subparagraph (SX 210.5-02.21)
-Publisher FASB
-URI https://asc.fasb.org//1943274/2147480566/210-10-S99-1
| Name: |
us-gaap_LiabilitiesCurrent |
| Namespace Prefix: |
us-gaap_ |
| Data Type: |
xbrli:monetaryItemType |
| Balance Type: |
credit |
| Period Type: |
instant |
|
| X |
- References
+ Details
| Name: |
us-gaap_LiabilitiesCurrentAbstract |
| Namespace Prefix: |
us-gaap_ |
| Data Type: |
xbrli:stringItemType |
| Balance Type: |
na |
| Period Type: |
duration |
|
| X |
- References
+ Details
| Name: |
us-gaap_LiabilitiesNoncurrentAbstract |
| Namespace Prefix: |
us-gaap_ |
| Data Type: |
xbrli:stringItemType |
| Balance Type: |
na |
| Period Type: |
duration |
|
| X |
- DefinitionIncluding the current and noncurrent portions, aggregate carrying amount of all types of notes payable, as of the balance sheet date, with initial maturities beyond one year or beyond the normal operating cycle, if longer. Reference 1: http://fasb.org/us-gaap/role/ref/legacyRef
-Name Accounting Standards Codification
-Section S99
-Paragraph 1
-Subparagraph (SX 210.5-02(22))
-SubTopic 10
-Topic 210
-Publisher FASB
-URI https://asc.fasb.org//1943274/2147480566/210-10-S99-1
Reference 2: http://www.xbrl.org/2009/role/commonPracticeRef
-Topic 944
-SubTopic 210
-Name Accounting Standards Codification
-Section S99
-Paragraph 1
-Subparagraph (SX 210.7-03(a)(16)(a)(2))
-Publisher FASB
-URI https://asc.fasb.org//1943274/2147479440/944-210-S99-1
Reference 3: http://fasb.org/us-gaap/role/ref/legacyRef
-Topic 942
-SubTopic 210
-Name Accounting Standards Codification
-Section S99
-Paragraph 1
-Subparagraph (SX 210.9-03(16))
-Publisher FASB
-URI https://asc.fasb.org//1943274/2147479853/942-210-S99-1
| Name: |
us-gaap_NotesPayable |
| Namespace Prefix: |
us-gaap_ |
| Data Type: |
xbrli:monetaryItemType |
| Balance Type: |
credit |
| Period Type: |
instant |
|
| X |
- DefinitionSum of the carrying values as of the balance sheet date of the portions of long-term notes payable due within one year or the operating cycle if longer. Reference 1: http://fasb.org/us-gaap/role/ref/legacyRef
-Name Accounting Standards Codification
-Topic 210
-SubTopic 10
-Section S99
-Paragraph 1
-Subparagraph (SX 210.5-02.19,20)
-Publisher FASB
-URI https://asc.fasb.org//1943274/2147480566/210-10-S99-1
| Name: |
us-gaap_NotesPayableCurrent |
| Namespace Prefix: |
us-gaap_ |
| Data Type: |
xbrli:monetaryItemType |
| Balance Type: |
credit |
| Period Type: |
instant |
|
| X |
- DefinitionAggregate par or stated value of issued nonredeemable preferred stock (or preferred stock redeemable solely at the option of the issuer). This item includes treasury stock repurchased by the entity. Note: elements for number of nonredeemable preferred shares, par value and other disclosure concepts are in another section within stockholders' equity. Reference 1: http://www.xbrl.org/2003/role/exampleRef
-Topic 852
-SubTopic 10
-Name Accounting Standards Codification
-Section 55
-Paragraph 10
-Publisher FASB
-URI https://asc.fasb.org//1943274/2147481372/852-10-55-10
Reference 2: http://www.xbrl.org/2003/role/disclosureRef
-Topic 944
-SubTopic 210
-Name Accounting Standards Codification
-Section S99
-Paragraph 1
-Subparagraph (SX 210.7-03(a)(21))
-Publisher FASB
-URI https://asc.fasb.org//1943274/2147479440/944-210-S99-1
Reference 3: http://fasb.org/us-gaap/role/ref/legacyRef
-Topic 210
-SubTopic 10
-Name Accounting Standards Codification
-Section S99
-Paragraph 1
-Subparagraph (SX 210.5-02(28))
-Publisher FASB
-URI https://asc.fasb.org//1943274/2147480566/210-10-S99-1
| Name: |
us-gaap_PreferredStockValue |
| Namespace Prefix: |
us-gaap_ |
| Data Type: |
xbrli:monetaryItemType |
| Balance Type: |
credit |
| Period Type: |
instant |
|
| X |
- DefinitionAmount of asset related to consideration paid in advance for costs that provide economic benefits within a future period of one year or the normal operating cycle, if longer. Reference 1: http://www.xbrl.org/2003/role/exampleRef
-Topic 210
-SubTopic 10
-Name Accounting Standards Codification
-Section 45
-Paragraph 1
-Subparagraph (g)
-Publisher FASB
-URI https://asc.fasb.org//1943274/2147483467/210-10-45-1
Reference 2: http://www.xbrl.org/2003/role/disclosureRef
-Topic 210
-SubTopic 10
-Name Accounting Standards Codification
-Section S99
-Paragraph 1
-Subparagraph (SX 210.5-02(7))
-Publisher FASB
-URI https://asc.fasb.org//1943274/2147480566/210-10-S99-1
Reference 3: http://www.xbrl.org/2003/role/disclosureRef
-Topic 340
-SubTopic 10
-Name Accounting Standards Codification
-Section 05
-Paragraph 5
-Publisher FASB
-URI https://asc.fasb.org//1943274/2147482955/340-10-05-5
Reference 4: http://www.xbrl.org/2003/role/disclosureRef
-Topic 340
-SubTopic 10
-Name Accounting Standards Codification
-Section 45
-Paragraph 1
-Publisher FASB
-URI https://asc.fasb.org//1943274/2147483032/340-10-45-1
| Name: |
us-gaap_PrepaidExpenseCurrent |
| Namespace Prefix: |
us-gaap_ |
| Data Type: |
xbrli:monetaryItemType |
| Balance Type: |
debit |
| Period Type: |
instant |
|
| X |
- DefinitionAmount of accumulated undistributed earnings (deficit). Reference 1: http://www.xbrl.org/2003/role/exampleRef
-Topic 852
-SubTopic 10
-Name Accounting Standards Codification
-Section 55
-Paragraph 10
-Publisher FASB
-URI https://asc.fasb.org//1943274/2147481372/852-10-55-10
Reference 2: http://www.xbrl.org/2003/role/disclosureRef
-Topic 944
-SubTopic 40
-Name Accounting Standards Codification
-Section 65
-Paragraph 2
-Subparagraph (g)(2)(i)
-Publisher FASB
-URI https://asc.fasb.org//1943274/2147480016/944-40-65-2
Reference 3: http://www.xbrl.org/2003/role/disclosureRef
-Topic 944
-SubTopic 40
-Name Accounting Standards Codification
-Section 65
-Paragraph 2
-Subparagraph (h)(2)
-Publisher FASB
-URI https://asc.fasb.org//1943274/2147480016/944-40-65-2
Reference 4: http://www.xbrl.org/2003/role/disclosureRef
-Topic 946
-SubTopic 20
-Name Accounting Standards Codification
-Section 50
-Paragraph 11
-Publisher FASB
-URI https://asc.fasb.org//1943274/2147480990/946-20-50-11
Reference 5: http://www.xbrl.org/2003/role/disclosureRef
-Topic 944
-SubTopic 210
-Name Accounting Standards Codification
-Section S99
-Paragraph 1
-Subparagraph (SX 210.7-03(a)(23)(a)(4))
-Publisher FASB
-URI https://asc.fasb.org//1943274/2147479440/944-210-S99-1
Reference 6: http://www.xbrl.org/2003/role/disclosureRef
-Topic 946
-SubTopic 210
-Name Accounting Standards Codification
-Section S99
-Paragraph 1
-Subparagraph (SX 210.6-04(17))
-Publisher FASB
-URI https://asc.fasb.org//1943274/2147479617/946-210-S99-1
Reference 7: http://fasb.org/us-gaap/role/ref/legacyRef
-Topic 505
-SubTopic 10
-Name Accounting Standards Codification
-Section S99
-Paragraph 1
-Subparagraph (SX 210.3-04)
-Publisher FASB
-URI https://asc.fasb.org//1943274/2147480008/505-10-S99-1
Reference 8: http://fasb.org/us-gaap/role/ref/legacyRef
-Topic 210
-SubTopic 10
-Name Accounting Standards Codification
-Section S99
-Paragraph 1
-Subparagraph (SX 210.5-02(30)(a)(3))
-Publisher FASB
-URI https://asc.fasb.org//1943274/2147480566/210-10-S99-1
| Name: |
us-gaap_RetainedEarningsAccumulatedDeficit |
| Namespace Prefix: |
us-gaap_ |
| Data Type: |
xbrli:monetaryItemType |
| Balance Type: |
credit |
| Period Type: |
instant |
|
| X |
- DefinitionAmount of equity (deficit) attributable to parent. Excludes temporary equity and equity attributable to noncontrolling interest. Reference 1: http://www.xbrl.org/2003/role/exampleRef
-Topic 852
-SubTopic 10
-Name Accounting Standards Codification
-Section 55
-Paragraph 10
-Publisher FASB
-URI https://asc.fasb.org//1943274/2147481372/852-10-55-10
Reference 2: http://www.xbrl.org/2003/role/exampleRef
-Topic 946
-SubTopic 830
-Name Accounting Standards Codification
-Section 55
-Paragraph 12
-Publisher FASB
-URI https://asc.fasb.org//1943274/2147480167/946-830-55-12
Reference 3: http://www.xbrl.org/2003/role/disclosureRef
-Topic 946
-SubTopic 210
-Name Accounting Standards Codification
-Section S99
-Paragraph 1
-Subparagraph (SX 210.6-04(19))
-Publisher FASB
-URI https://asc.fasb.org//1943274/2147479617/946-210-S99-1
Reference 4: http://www.xbrl.org/2003/role/disclosureRef
-Topic 946
-SubTopic 210
-Name Accounting Standards Codification
-Section S99
-Paragraph 2
-Subparagraph (SX 210.6-05(4))
-Publisher FASB
-URI https://asc.fasb.org//1943274/2147479617/946-210-S99-2
Reference 5: http://www.xbrl.org/2009/role/commonPracticeRef
-Topic 946
-SubTopic 220
-Name Accounting Standards Codification
-Section S99
-Paragraph 3
-Subparagraph (SX 210.6-09(4)(b))
-Publisher FASB
-URI https://asc.fasb.org//1943274/2147483575/946-220-S99-3
Reference 6: http://www.xbrl.org/2003/role/disclosureRef
-Topic 946
-SubTopic 220
-Name Accounting Standards Codification
-Section S99
-Paragraph 3
-Subparagraph (SX 210.6-09(6))
-Publisher FASB
-URI https://asc.fasb.org//1943274/2147483575/946-220-S99-3
Reference 7: http://www.xbrl.org/2003/role/disclosureRef
-Topic 946
-SubTopic 220
-Name Accounting Standards Codification
-Section S99
-Paragraph 3
-Subparagraph (SX 210.6-09(7))
-Publisher FASB
-URI https://asc.fasb.org//1943274/2147483575/946-220-S99-3
Reference 8: http://www.xbrl.org/2009/role/commonPracticeRef
-Topic 235
-SubTopic 10
-Name Accounting Standards Codification
-Section S99
-Paragraph 1
-Subparagraph (SX 210.4-08(g)(1)(ii))
-Publisher FASB
-URI https://asc.fasb.org//1943274/2147480678/235-10-S99-1
Reference 9: http://www.xbrl.org/2009/role/commonPracticeRef
-Topic 323
-SubTopic 10
-Name Accounting Standards Codification
-Section 50
-Paragraph 3
-Subparagraph (c)
-Publisher FASB
-URI https://asc.fasb.org//1943274/2147481687/323-10-50-3
Reference 10: http://www.xbrl.org/2009/role/commonPracticeRef
-Topic 825
-SubTopic 10
-Name Accounting Standards Codification
-Section 50
-Paragraph 28
-Subparagraph (f)
-Publisher FASB
-URI https://asc.fasb.org//1943274/2147482907/825-10-50-28
Reference 11: http://fasb.org/us-gaap/role/ref/legacyRef
-Topic 210
-SubTopic 10
-Name Accounting Standards Codification
-Section S99
-Paragraph 1
-Subparagraph (SX 210.5-02(29))
-Publisher FASB
-URI https://asc.fasb.org//1943274/2147480566/210-10-S99-1
Reference 12: http://fasb.org/us-gaap/role/ref/legacyRef
-Topic 210
-SubTopic 10
-Name Accounting Standards Codification
-Section S99
-Paragraph 1
-Subparagraph (SX 210.5-02(31))
-Publisher FASB
-URI https://asc.fasb.org//1943274/2147480566/210-10-S99-1
Reference 13: http://fasb.org/us-gaap/role/ref/legacyRef
-Topic 210
-SubTopic 10
-Name Accounting Standards Codification
-Section S99
-Paragraph 1
-Subparagraph (SX 210.5-02(30))
-Publisher FASB
-URI https://asc.fasb.org//1943274/2147480566/210-10-S99-1
Reference 14: http://fasb.org/us-gaap/role/ref/legacyRef
-Topic 310
-SubTopic 10
-Name Accounting Standards Codification
-Section S99
-Paragraph 2
-Subparagraph (SAB Topic 4.E)
-Publisher FASB
-URI https://asc.fasb.org//1943274/2147480418/310-10-S99-2
| Name: |
us-gaap_StockholdersEquity |
| Namespace Prefix: |
us-gaap_ |
| Data Type: |
xbrli:monetaryItemType |
| Balance Type: |
credit |
| Period Type: |
instant |
|
| X |
- Details
| Name: |
us-gaap_StatementClassOfStockAxis=us-gaap_SeriesDPreferredStockMember |
| Namespace Prefix: |
|
| Data Type: |
na |
| Balance Type: |
|
| Period Type: |
|
|
| X |
- Details
| Name: |
us-gaap_StatementClassOfStockAxis=us-gaap_SeriesCPreferredStockMember |
| Namespace Prefix: |
|
| Data Type: |
na |
| Balance Type: |
|
| Period Type: |
|
|
| X |
- Details
| Name: |
us-gaap_StatementClassOfStockAxis=us-gaap_SeriesBPreferredStockMember |
| Namespace Prefix: |
|
| Data Type: |
na |
| Balance Type: |
|
| Period Type: |
|
|
v3.23.2
CONSOLIDATED BALANCE SHEETS (Parenthetical) - $ / shares
|
Dec. 31, 2022 |
Dec. 31, 2021 |
| Common stock, par value |
$ 0.001
|
$ 0.001
|
| Common stock, shares authorized |
200,000,000
|
200,000,000
|
| Common stock, shares issued |
184,370,469
|
174,370,469
|
| Common stock, shares outstanding |
184,370,469
|
174,370,469
|
| Series D Preferred Stock Member |
|
|
| Preferred stock, par value |
$ 0.001
|
$ 0.001
|
| Preferred stock, shares authorized |
1,000
|
1,000
|
| Preferred stock, shares issued |
278
|
0
|
| Preferred stock, shares outstanding |
278
|
0
|
| Series C Preferred Stock Member |
|
|
| Preferred stock, par value |
$ 0.001
|
$ 0.001
|
| Preferred stock, shares authorized |
2,700,000
|
2,700,000
|
| Preferred stock, shares issued |
2,300,000
|
2,300,000
|
| Preferred stock, shares outstanding |
2,300,000
|
2,300,000
|
| Series B Preferred Stock Member |
|
|
| Preferred stock, par value |
$ 0.001
|
$ 0.001
|
| Preferred stock, shares authorized |
1,250,000
|
1,250,000
|
| Preferred stock, shares issued |
518,750
|
518,750
|
| Preferred stock, shares outstanding |
518,750
|
518,750
|
| X |
- DefinitionFace amount or stated value per share of common stock. Reference 1: http://fasb.org/us-gaap/role/ref/legacyRef
-Topic 210
-SubTopic 10
-Name Accounting Standards Codification
-Section S99
-Paragraph 1
-Subparagraph (SX 210.5-02(29))
-Publisher FASB
-URI https://asc.fasb.org//1943274/2147480566/210-10-S99-1
| Name: |
us-gaap_CommonStockParOrStatedValuePerShare |
| Namespace Prefix: |
us-gaap_ |
| Data Type: |
dtr-types:perShareItemType |
| Balance Type: |
na |
| Period Type: |
instant |
|
| X |
- DefinitionThe maximum number of common shares permitted to be issued by an entity's charter and bylaws. Reference 1: http://www.xbrl.org/2003/role/disclosureRef
-Topic 946
-SubTopic 210
-Name Accounting Standards Codification
-Section S99
-Paragraph 1
-Subparagraph (SX 210.6-04(16)(a))
-Publisher FASB
-URI https://asc.fasb.org//1943274/2147479617/946-210-S99-1
Reference 2: http://fasb.org/us-gaap/role/ref/legacyRef
-Topic 210
-SubTopic 10
-Name Accounting Standards Codification
-Section S99
-Paragraph 1
-Subparagraph (SX 210.5-02(29))
-Publisher FASB
-URI https://asc.fasb.org//1943274/2147480566/210-10-S99-1
| Name: |
us-gaap_CommonStockSharesAuthorized |
| Namespace Prefix: |
us-gaap_ |
| Data Type: |
xbrli:sharesItemType |
| Balance Type: |
na |
| Period Type: |
instant |
|
| X |
- DefinitionTotal number of common shares of an entity that have been sold or granted to shareholders (includes common shares that were issued, repurchased and remain in the treasury). These shares represent capital invested by the firm's shareholders and owners, and may be all or only a portion of the number of shares authorized. Shares issued include shares outstanding and shares held in the treasury. Reference 1: http://fasb.org/us-gaap/role/ref/legacyRef
-Topic 210
-SubTopic 10
-Name Accounting Standards Codification
-Section S99
-Paragraph 1
-Subparagraph (SX 210.5-02(29))
-Publisher FASB
-URI https://asc.fasb.org//1943274/2147480566/210-10-S99-1
| Name: |
us-gaap_CommonStockSharesIssued |
| Namespace Prefix: |
us-gaap_ |
| Data Type: |
xbrli:sharesItemType |
| Balance Type: |
na |
| Period Type: |
instant |
|
| X |
- DefinitionNumber of shares of common stock outstanding. Common stock represent the ownership interest in a corporation. Reference 1: http://fasb.org/us-gaap/role/ref/legacyRef
-Name Accounting Standards Codification
-Section 50
-Paragraph 2
-SubTopic 10
-Topic 505
-Publisher FASB
-URI https://asc.fasb.org//1943274/2147481112/505-10-50-2
Reference 2: http://www.xbrl.org/2003/role/disclosureRef
-Topic 946
-SubTopic 210
-Name Accounting Standards Codification
-Section S99
-Paragraph 2
-Subparagraph (SX 210.6-05(4))
-Publisher FASB
-URI https://asc.fasb.org//1943274/2147479617/946-210-S99-2
Reference 3: http://www.xbrl.org/2009/role/commonPracticeRef
-Topic 946
-SubTopic 220
-Name Accounting Standards Codification
-Section S99
-Paragraph 3
-Subparagraph (SX 210.6-09(4)(b))
-Publisher FASB
-URI https://asc.fasb.org//1943274/2147483575/946-220-S99-3
Reference 4: http://www.xbrl.org/2003/role/disclosureRef
-Topic 946
-SubTopic 210
-Name Accounting Standards Codification
-Section S99
-Paragraph 1
-Subparagraph (SX 210.6-04(16)(a))
-Publisher FASB
-URI https://asc.fasb.org//1943274/2147479617/946-210-S99-1
Reference 5: http://www.xbrl.org/2009/role/commonPracticeRef
-Topic 946
-SubTopic 220
-Name Accounting Standards Codification
-Section S99
-Paragraph 3
-Subparagraph (SX 210.6-09(7))
-Publisher FASB
-URI https://asc.fasb.org//1943274/2147483575/946-220-S99-3
Reference 6: http://fasb.org/us-gaap/role/ref/legacyRef
-Topic 210
-SubTopic 10
-Name Accounting Standards Codification
-Section S99
-Paragraph 1
-Subparagraph (SX 210.5-02(29))
-Publisher FASB
-URI https://asc.fasb.org//1943274/2147480566/210-10-S99-1
| Name: |
us-gaap_CommonStockSharesOutstanding |
| Namespace Prefix: |
us-gaap_ |
| Data Type: |
xbrli:sharesItemType |
| Balance Type: |
na |
| Period Type: |
instant |
|
| X |
- DefinitionFace amount or stated value per share of preferred stock nonredeemable or redeemable solely at the option of the issuer. Reference 1: http://www.xbrl.org/2003/role/disclosureRef
-Topic 505
-SubTopic 10
-Name Accounting Standards Codification
-Section 50
-Paragraph 13
-Subparagraph (a)
-Publisher FASB
-URI https://asc.fasb.org//1943274/2147481112/505-10-50-13
Reference 2: http://fasb.org/us-gaap/role/ref/legacyRef
-Topic 210
-SubTopic 10
-Name Accounting Standards Codification
-Section S99
-Paragraph 1
-Subparagraph (SX 210.5-02(28))
-Publisher FASB
-URI https://asc.fasb.org//1943274/2147480566/210-10-S99-1
| Name: |
us-gaap_PreferredStockParOrStatedValuePerShare |
| Namespace Prefix: |
us-gaap_ |
| Data Type: |
dtr-types:perShareItemType |
| Balance Type: |
na |
| Period Type: |
instant |
|
| X |
- DefinitionThe maximum number of nonredeemable preferred shares (or preferred stock redeemable solely at the option of the issuer) permitted to be issued by an entity's charter and bylaws. Reference 1: http://www.xbrl.org/2003/role/disclosureRef
-Topic 946
-SubTopic 210
-Name Accounting Standards Codification
-Section S99
-Paragraph 1
-Subparagraph (SX 210.6-04(16)(a))
-Publisher FASB
-URI https://asc.fasb.org//1943274/2147479617/946-210-S99-1
Reference 2: http://fasb.org/us-gaap/role/ref/legacyRef
-Topic 210
-SubTopic 10
-Name Accounting Standards Codification
-Section S99
-Paragraph 1
-Subparagraph (SX 210.5-02(28))
-Publisher FASB
-URI https://asc.fasb.org//1943274/2147480566/210-10-S99-1
| Name: |
us-gaap_PreferredStockSharesAuthorized |
| Namespace Prefix: |
us-gaap_ |
| Data Type: |
xbrli:sharesItemType |
| Balance Type: |
na |
| Period Type: |
instant |
|
| X |
- DefinitionTotal number of nonredeemable preferred shares (or preferred stock redeemable solely at the option of the issuer) issued to shareholders (includes related preferred shares that were issued, repurchased, and remain in the treasury). May be all or portion of the number of preferred shares authorized. Excludes preferred shares that are classified as debt. Reference 1: http://www.xbrl.org/2003/role/disclosureRef
-Topic 505
-SubTopic 10
-Name Accounting Standards Codification
-Section 50
-Paragraph 13
-Subparagraph (a)
-Publisher FASB
-URI https://asc.fasb.org//1943274/2147481112/505-10-50-13
Reference 2: http://fasb.org/us-gaap/role/ref/legacyRef
-Topic 210
-SubTopic 10
-Name Accounting Standards Codification
-Section S99
-Paragraph 1
-Subparagraph (SX 210.5-02(28))
-Publisher FASB
-URI https://asc.fasb.org//1943274/2147480566/210-10-S99-1
| Name: |
us-gaap_PreferredStockSharesIssued |
| Namespace Prefix: |
us-gaap_ |
| Data Type: |
xbrli:sharesItemType |
| Balance Type: |
na |
| Period Type: |
instant |
|
| X |
- DefinitionAggregate share number for all nonredeemable preferred stock (or preferred stock redeemable solely at the option of the issuer) held by stockholders. Does not include preferred shares that have been repurchased. Reference 1: http://www.xbrl.org/2003/role/disclosureRef
-Topic 946
-SubTopic 210
-Name Accounting Standards Codification
-Section S99
-Paragraph 2
-Subparagraph (SX 210.6-05(4))
-Publisher FASB
-URI https://asc.fasb.org//1943274/2147479617/946-210-S99-2
Reference 2: http://www.xbrl.org/2009/role/commonPracticeRef
-Topic 946
-SubTopic 220
-Name Accounting Standards Codification
-Section S99
-Paragraph 3
-Subparagraph (SX 210.6-09(4)(b))
-Publisher FASB
-URI https://asc.fasb.org//1943274/2147483575/946-220-S99-3
Reference 3: http://www.xbrl.org/2003/role/disclosureRef
-Topic 946
-SubTopic 210
-Name Accounting Standards Codification
-Section S99
-Paragraph 1
-Subparagraph (SX 210.6-04(16)(a))
-Publisher FASB
-URI https://asc.fasb.org//1943274/2147479617/946-210-S99-1
Reference 4: http://www.xbrl.org/2009/role/commonPracticeRef
-Topic 946
-SubTopic 220
-Name Accounting Standards Codification
-Section S99
-Paragraph 3
-Subparagraph (SX 210.6-09(7))
-Publisher FASB
-URI https://asc.fasb.org//1943274/2147483575/946-220-S99-3
Reference 5: http://fasb.org/us-gaap/role/ref/legacyRef
-Topic 210
-SubTopic 10
-Name Accounting Standards Codification
-Section S99
-Paragraph 1
-Subparagraph (SX 210.5-02(28))
-Publisher FASB
-URI https://asc.fasb.org//1943274/2147480566/210-10-S99-1
| Name: |
us-gaap_PreferredStockSharesOutstanding |
| Namespace Prefix: |
us-gaap_ |
| Data Type: |
xbrli:sharesItemType |
| Balance Type: |
na |
| Period Type: |
instant |
|
| X |
- Details
| Name: |
us-gaap_StatementClassOfStockAxis=us-gaap_SeriesDPreferredStockMember |
| Namespace Prefix: |
|
| Data Type: |
na |
| Balance Type: |
|
| Period Type: |
|
|
| X |
- Details
| Name: |
us-gaap_StatementClassOfStockAxis=us-gaap_SeriesCPreferredStockMember |
| Namespace Prefix: |
|
| Data Type: |
na |
| Balance Type: |
|
| Period Type: |
|
|
| X |
- Details
| Name: |
us-gaap_StatementClassOfStockAxis=us-gaap_SeriesBPreferredStockMember |
| Namespace Prefix: |
|
| Data Type: |
na |
| Balance Type: |
|
| Period Type: |
|
|
v3.23.2
CONSOLIDATED STATEMENTS OF OPERATIONS - USD ($)
|
12 Months Ended |
Dec. 31, 2022 |
Dec. 31, 2021 |
| Operating Expenses |
|
|
| Salaries and compensation |
$ 791,392
|
$ 830,655
|
| Professional fees |
557,055
|
958,101
|
| General and administrative |
170,160
|
193,125
|
| Total Operating Expenses |
1,518,607
|
1,981,881
|
| Loss from Operations |
(1,518,607)
|
(1,981,881)
|
| Other (Expenses) Income |
|
|
| Interest expense, net |
(1,815,800)
|
(1,745,194)
|
| Amortization of debt discount |
(210,351)
|
(362,259)
|
| Change in fair value of derivative liability |
(3,428,245)
|
1,305,482
|
| Gain on conversion of debt |
60,901
|
113,215
|
| Total Other Expense |
(5,393,495)
|
(688,756)
|
| Loss Before Income Taxes |
(6,912,102)
|
(2,670,637)
|
| Provision for Income Taxes |
0
|
0
|
| Net Loss |
$ (6,912,102)
|
$ (2,670,637)
|
| Net Loss per Common Share Basic and Diluted |
$ (0.04)
|
$ (0.02)
|
| Weighted Average Number of Common Shares Outstanding |
178,959,510
|
158,566,304
|
| X |
- References
+ Details
| Name: |
cpwr_AmortizationOfDebtDiscountpremium |
| Namespace Prefix: |
cpwr_ |
| Data Type: |
xbrli:monetaryItemType |
| Balance Type: |
credit |
| Period Type: |
duration |
|
| X |
- DefinitionThe number of shares issued in exchange for the original debt being converted in a noncash (or part noncash) transaction. "Part noncash" refers to that portion of the transaction not resulting in cash receipts or payments in the period.
| Name: |
cpwr_ConversionGainsAndLosses |
| Namespace Prefix: |
cpwr_ |
| Data Type: |
xbrli:monetaryItemType |
| Balance Type: |
credit |
| Period Type: |
duration |
|
| X |
- DefinitionTotal costs of sales and operating expenses for the period. Reference 1: http://fasb.org/us-gaap/role/ref/legacyRef
-Topic 220
-SubTopic 10
-Name Accounting Standards Codification
-Section S99
-Paragraph 2
-Subparagraph (SX 210.5-03)
-Publisher FASB
-URI https://asc.fasb.org//1943274/2147483621/220-10-S99-2
| Name: |
us-gaap_CostsAndExpenses |
| Namespace Prefix: |
us-gaap_ |
| Data Type: |
xbrli:monetaryItemType |
| Balance Type: |
debit |
| Period Type: |
duration |
|
| X |
- DefinitionThe amount of net income (loss) for the period per each share of common stock or unit outstanding during the reporting period. Reference 1: http://www.xbrl.org/2003/role/disclosureRef
-Topic 250
-SubTopic 10
-Name Accounting Standards Codification
-Section 50
-Paragraph 3
-Publisher FASB
-URI https://asc.fasb.org//1943274/2147483443/250-10-50-3
Reference 2: http://www.xbrl.org/2003/role/disclosureRef
-Topic 260
-SubTopic 10
-Name Accounting Standards Codification
-Section 55
-Paragraph 15
-Publisher FASB
-URI https://asc.fasb.org//1943274/2147482635/260-10-55-15
Reference 3: http://www.xbrl.org/2003/role/disclosureRef
-Topic 815
-SubTopic 40
-Name Accounting Standards Codification
-Section 65
-Paragraph 1
-Subparagraph (e)(4)
-Publisher FASB
-URI https://asc.fasb.org//1943274/2147480175/815-40-65-1
Reference 4: http://www.xbrl.org/2003/role/disclosureRef
-Topic 815
-SubTopic 40
-Name Accounting Standards Codification
-Section 65
-Paragraph 1
-Subparagraph (f)
-Publisher FASB
-URI https://asc.fasb.org//1943274/2147480175/815-40-65-1
Reference 5: http://www.xbrl.org/2003/role/disclosureRef
-Topic 250
-SubTopic 10
-Name Accounting Standards Codification
-Section 50
-Paragraph 11
-Subparagraph (a)
-Publisher FASB
-URI https://asc.fasb.org//1943274/2147483443/250-10-50-11
Reference 6: http://www.xbrl.org/2003/role/disclosureRef
-Topic 250
-SubTopic 10
-Name Accounting Standards Codification
-Section 50
-Paragraph 11
-Subparagraph (b)
-Publisher FASB
-URI https://asc.fasb.org//1943274/2147483443/250-10-50-11
Reference 7: http://www.xbrl.org/2003/role/disclosureRef
-Topic 250
-SubTopic 10
-Name Accounting Standards Codification
-Section 50
-Paragraph 7
-Subparagraph (a)
-Publisher FASB
-URI https://asc.fasb.org//1943274/2147483443/250-10-50-7
Reference 8: http://www.xbrl.org/2003/role/disclosureRef
-Topic 260
-SubTopic 10
-Name Accounting Standards Codification
-Section 45
-Paragraph 2
-Publisher FASB
-URI https://asc.fasb.org//1943274/2147482689/260-10-45-2
Reference 9: http://www.xbrl.org/2003/role/disclosureRef
-Topic 260
-SubTopic 10
-Name Accounting Standards Codification
-Section 45
-Paragraph 60B
-Subparagraph (d)
-Publisher FASB
-URI https://asc.fasb.org//1943274/2147482689/260-10-45-60B
Reference 10: http://www.xbrl.org/2003/role/disclosureRef
-Topic 250
-SubTopic 10
-Name Accounting Standards Codification
-Section 50
-Paragraph 4
-Publisher FASB
-URI https://asc.fasb.org//1943274/2147483443/250-10-50-4
Reference 11: http://www.xbrl.org/2003/role/disclosureRef
-Topic 260
-SubTopic 10
-Name Accounting Standards Codification
-Section 50
-Paragraph 1
-Subparagraph (a)
-Publisher FASB
-URI https://asc.fasb.org//1943274/2147482662/260-10-50-1
Reference 12: http://www.xbrl.org/2003/role/disclosureRef
-Topic 260
-SubTopic 10
-Name Accounting Standards Codification
-Section 45
-Paragraph 10
-Publisher FASB
-URI https://asc.fasb.org//1943274/2147482689/260-10-45-10
Reference 13: http://www.xbrl.org/2003/role/disclosureRef
-Topic 220
-SubTopic 10
-Name Accounting Standards Codification
-Section S99
-Paragraph 2
-Subparagraph (SX 210.5-03(25))
-Publisher FASB
-URI https://asc.fasb.org//1943274/2147483621/220-10-S99-2
Reference 14: http://www.xbrl.org/2003/role/disclosureRef
-Topic 942
-SubTopic 220
-Name Accounting Standards Codification
-Section S99
-Paragraph 1
-Subparagraph (SX 210.9-04(27))
-Publisher FASB
-URI https://asc.fasb.org//1943274/2147483589/942-220-S99-1
Reference 15: http://www.xbrl.org/2003/role/disclosureRef
-Topic 944
-SubTopic 220
-Name Accounting Standards Codification
-Section S99
-Paragraph 1
-Subparagraph (SX 210.7-04(23))
-Publisher FASB
-URI https://asc.fasb.org//1943274/2147483586/944-220-S99-1
Reference 16: http://www.xbrl.org/2003/role/exampleRef
-Topic 260
-SubTopic 10
-Name Accounting Standards Codification
-Section 55
-Paragraph 52
-Publisher FASB
-URI https://asc.fasb.org//1943274/2147482635/260-10-55-52
Reference 17: http://www.xbrl.org/2003/role/disclosureRef
-Topic 260
-SubTopic 10
-Name Accounting Standards Codification
-Section 45
-Paragraph 7
-Publisher FASB
-URI https://asc.fasb.org//1943274/2147482689/260-10-45-7
| Name: |
us-gaap_EarningsPerShareBasic |
| Namespace Prefix: |
us-gaap_ |
| Data Type: |
dtr-types:perShareItemType |
| Balance Type: |
na |
| Period Type: |
duration |
|
| X |
- DefinitionAmount of unrealized gain (loss) recognized in income for derivative asset (liability) after deduction of derivative liability (asset), measured at fair value using unobservable input (level 3) and still held. Reference 1: http://www.xbrl.org/2003/role/disclosureRef
-Topic 820
-SubTopic 10
-Name Accounting Standards Codification
-Section 50
-Paragraph 2
-Subparagraph (d)
-Publisher FASB
-URI https://asc.fasb.org//1943274/2147482106/820-10-50-2
| Name: |
us-gaap_FairValueNetDerivativeAssetLiabilityMeasuredOnRecurringBasisChangeInUnrealizedGainLoss |
| Namespace Prefix: |
us-gaap_ |
| Data Type: |
xbrli:monetaryItemType |
| Balance Type: |
credit |
| Period Type: |
duration |
|
| X |
- DefinitionThe aggregate total of expenses of managing and administering the affairs of an entity, including affiliates of the reporting entity, which are not directly or indirectly associated with the manufacture, sale or creation of a product or product line. Reference 1: http://www.xbrl.org/2003/role/disclosureRef
-Topic 946
-SubTopic 220
-Name Accounting Standards Codification
-Section S99
-Paragraph 1
-Subparagraph (SX 210.6-07(2)(a))
-Publisher FASB
-URI https://asc.fasb.org//1943274/2147483575/946-220-S99-1
Reference 2: http://fasb.org/us-gaap/role/ref/legacyRef
-Topic 220
-SubTopic 10
-Name Accounting Standards Codification
-Section S99
-Paragraph 2
-Subparagraph (SX 210.5-03.4)
-Publisher FASB
-URI https://asc.fasb.org//1943274/2147483621/220-10-S99-2
| Name: |
us-gaap_GeneralAndAdministrativeExpense |
| Namespace Prefix: |
us-gaap_ |
| Data Type: |
xbrli:monetaryItemType |
| Balance Type: |
debit |
| Period Type: |
duration |
|
| X |
- DefinitionAmount of the cost of borrowed funds accounted for as interest expense. Reference 1: http://www.xbrl.org/2003/role/exampleRef
-Topic 946
-SubTopic 830
-Name Accounting Standards Codification
-Section 55
-Paragraph 10
-Publisher FASB
-URI https://asc.fasb.org//1943274/2147480167/946-830-55-10
Reference 2: http://www.xbrl.org/2009/role/commonPracticeRef
-Topic 946
-SubTopic 220
-Name Accounting Standards Codification
-Section 45
-Paragraph 3
-Subparagraph (i)
-Publisher FASB
-URI https://asc.fasb.org//1943274/2147483581/946-220-45-3
Reference 3: http://www.xbrl.org/2003/role/disclosureRef
-Topic 946
-SubTopic 220
-Name Accounting Standards Codification
-Section S99
-Paragraph 1
-Subparagraph (SX 210.6-07(3))
-Publisher FASB
-URI https://asc.fasb.org//1943274/2147483575/946-220-S99-1
Reference 4: http://www.xbrl.org/2003/role/disclosureRef
-Topic 280
-SubTopic 10
-Name Accounting Standards Codification
-Section 50
-Paragraph 22
-Subparagraph (d)
-Publisher FASB
-URI https://asc.fasb.org//1943274/2147482810/280-10-50-22
Reference 5: http://fasb.org/us-gaap/role/ref/legacyRef
-Name Accounting Standards Codification
-Topic 835
-SubTopic 30
-Section 45
-Paragraph 3
-Publisher FASB
-URI https://asc.fasb.org//1943274/2147482925/835-30-45-3
Reference 6: http://fasb.org/us-gaap/role/ref/legacyRef
-Topic 942
-SubTopic 220
-Name Accounting Standards Codification
-Section S99
-Paragraph 1
-Subparagraph (SX 210.9-04.9)
-Publisher FASB
-URI https://asc.fasb.org//1943274/2147483589/942-220-S99-1
Reference 7: http://www.xbrl.org/2003/role/disclosureRef
-Topic 220
-SubTopic 10
-Name Accounting Standards Codification
-Section S99
-Paragraph 2
-Subparagraph (210.5-03(11))
-Publisher FASB
-URI https://asc.fasb.org//1943274/2147483621/220-10-S99-2
Reference 8: http://www.xbrl.org/2003/role/disclosureRef
-Topic 835
-SubTopic 20
-Name Accounting Standards Codification
-Section 50
-Paragraph 1
-Subparagraph (a)
-Publisher FASB
-URI https://asc.fasb.org//1943274/2147483013/835-20-50-1
| Name: |
us-gaap_InterestExpense |
| Namespace Prefix: |
us-gaap_ |
| Data Type: |
xbrli:monetaryItemType |
| Balance Type: |
debit |
| Period Type: |
duration |
|
| X |
- DefinitionThe portion of profit or loss for the period, net of income taxes, which is attributable to the parent. Reference 1: http://www.xbrl.org/2003/role/disclosureRef
-Topic 235
-SubTopic 10
-Name Accounting Standards Codification
-Section S99
-Paragraph 1
-Subparagraph (SX 210.4-08(g)(1)(ii))
-Publisher FASB
-URI https://asc.fasb.org//1943274/2147480678/235-10-S99-1
Reference 2: http://www.xbrl.org/2003/role/disclosureRef
-Topic 323
-SubTopic 10
-Name Accounting Standards Codification
-Section 50
-Paragraph 3
-Subparagraph (c)
-Publisher FASB
-URI https://asc.fasb.org//1943274/2147481687/323-10-50-3
Reference 3: http://www.xbrl.org/2003/role/disclosureRef
-Topic 825
-SubTopic 10
-Name Accounting Standards Codification
-Section 50
-Paragraph 28
-Subparagraph (f)
-Publisher FASB
-URI https://asc.fasb.org//1943274/2147482907/825-10-50-28
Reference 4: http://www.xbrl.org/2003/role/disclosureRef
-Topic 220
-SubTopic 10
-Name Accounting Standards Codification
-Section 50
-Paragraph 6
-Publisher FASB
-URI https://asc.fasb.org//1943274/2147482765/220-10-50-6
Reference 5: http://www.xbrl.org/2003/role/disclosureRef
-Topic 250
-SubTopic 10
-Name Accounting Standards Codification
-Section 50
-Paragraph 3
-Publisher FASB
-URI https://asc.fasb.org//1943274/2147483443/250-10-50-3
Reference 6: http://www.xbrl.org/2003/role/disclosureRef
-Topic 250
-SubTopic 10
-Name Accounting Standards Codification
-Section 50
-Paragraph 1
-Subparagraph (b)(2)
-Publisher FASB
-URI https://asc.fasb.org//1943274/2147483443/250-10-50-1
Reference 7: http://www.xbrl.org/2003/role/disclosureRef
-Topic 815
-SubTopic 40
-Name Accounting Standards Codification
-Section 65
-Paragraph 1
-Subparagraph (f)
-Publisher FASB
-URI https://asc.fasb.org//1943274/2147480175/815-40-65-1
Reference 8: http://www.xbrl.org/2003/role/disclosureRef
-Topic 250
-SubTopic 10
-Name Accounting Standards Codification
-Section 50
-Paragraph 8
-Publisher FASB
-URI https://asc.fasb.org//1943274/2147483443/250-10-50-8
Reference 9: http://www.xbrl.org/2003/role/disclosureRef
-Topic 250
-SubTopic 10
-Name Accounting Standards Codification
-Section 50
-Paragraph 9
-Publisher FASB
-URI https://asc.fasb.org//1943274/2147483443/250-10-50-9
Reference 10: http://www.xbrl.org/2003/role/disclosureRef
-Topic 250
-SubTopic 10
-Name Accounting Standards Codification
-Section 50
-Paragraph 11
-Subparagraph (a)
-Publisher FASB
-URI https://asc.fasb.org//1943274/2147483443/250-10-50-11
Reference 11: http://www.xbrl.org/2003/role/disclosureRef
-Topic 250
-SubTopic 10
-Name Accounting Standards Codification
-Section 50
-Paragraph 11
-Subparagraph (b)
-Publisher FASB
-URI https://asc.fasb.org//1943274/2147483443/250-10-50-11
Reference 12: http://www.xbrl.org/2003/role/disclosureRef
-Topic 250
-SubTopic 10
-Name Accounting Standards Codification
-Section 50
-Paragraph 4
-Publisher FASB
-URI https://asc.fasb.org//1943274/2147483443/250-10-50-4
Reference 13: http://www.xbrl.org/2003/role/exampleRef
-Topic 946
-SubTopic 830
-Name Accounting Standards Codification
-Section 55
-Paragraph 10
-Publisher FASB
-URI https://asc.fasb.org//1943274/2147480167/946-830-55-10
Reference 14: http://www.xbrl.org/2003/role/disclosureRef
-Topic 946
-SubTopic 220
-Name Accounting Standards Codification
-Section 45
-Paragraph 7
-Publisher FASB
-URI https://asc.fasb.org//1943274/2147483581/946-220-45-7
Reference 15: http://www.xbrl.org/2003/role/disclosureRef
-Topic 944
-SubTopic 220
-Name Accounting Standards Codification
-Section S99
-Paragraph 1
-Subparagraph (SX 210.7-04(18))
-Publisher FASB
-URI https://asc.fasb.org//1943274/2147483586/944-220-S99-1
Reference 16: http://www.xbrl.org/2003/role/disclosureRef
-Topic 280
-SubTopic 10
-Name Accounting Standards Codification
-Section 50
-Paragraph 22
-Publisher FASB
-URI https://asc.fasb.org//1943274/2147482810/280-10-50-22
Reference 17: http://www.xbrl.org/2003/role/disclosureRef
-Topic 946
-SubTopic 220
-Name Accounting Standards Codification
-Section S99
-Paragraph 1
-Subparagraph (SX 210.6-07(9))
-Publisher FASB
-URI https://asc.fasb.org//1943274/2147483575/946-220-S99-1
Reference 18: http://www.xbrl.org/2003/role/disclosureRef
-Topic 946
-SubTopic 220
-Name Accounting Standards Codification
-Section S99
-Paragraph 3
-Subparagraph (SX 210.6-09(1)(d))
-Publisher FASB
-URI https://asc.fasb.org//1943274/2147483575/946-220-S99-3
Reference 19: http://www.xbrl.org/2003/role/disclosureRef
-Topic 470
-SubTopic 10
-Name Accounting Standards Codification
-Section S99
-Paragraph 1A
-Subparagraph (SX 210.13-01(a)(4)(i))
-Publisher FASB
-URI https://asc.fasb.org//1943274/2147480097/470-10-S99-1A
Reference 20: http://www.xbrl.org/2009/role/commonPracticeRef
-Topic 470
-SubTopic 10
-Name Accounting Standards Codification
-Section S99
-Paragraph 1A
-Subparagraph (SX 210.13-01(a)(4)(ii))
-Publisher FASB
-URI https://asc.fasb.org//1943274/2147480097/470-10-S99-1A
Reference 21: http://www.xbrl.org/2003/role/disclosureRef
-Topic 470
-SubTopic 10
-Name Accounting Standards Codification
-Section S99
-Paragraph 1A
-Subparagraph (SX 210.13-01(a)(4)(iii)(A))
-Publisher FASB
-URI https://asc.fasb.org//1943274/2147480097/470-10-S99-1A
Reference 22: http://www.xbrl.org/2003/role/disclosureRef
-Topic 470
-SubTopic 10
-Name Accounting Standards Codification
-Section S99
-Paragraph 1A
-Subparagraph (SX 210.13-01(a)(4)(iv))
-Publisher FASB
-URI https://asc.fasb.org//1943274/2147480097/470-10-S99-1A
Reference 23: http://www.xbrl.org/2003/role/disclosureRef
-Topic 470
-SubTopic 10
-Name Accounting Standards Codification
-Section S99
-Paragraph 1A
-Subparagraph (SX 210.13-01(a)(5))
-Publisher FASB
-URI https://asc.fasb.org//1943274/2147480097/470-10-S99-1A
Reference 24: http://www.xbrl.org/2003/role/disclosureRef
-Topic 470
-SubTopic 10
-Name Accounting Standards Codification
-Section S99
-Paragraph 1B
-Subparagraph (SX 210.13-02(a)(4)(i))
-Publisher FASB
-URI https://asc.fasb.org//1943274/2147480097/470-10-S99-1B
Reference 25: http://www.xbrl.org/2003/role/disclosureRef
-Topic 470
-SubTopic 10
-Name Accounting Standards Codification
-Section S99
-Paragraph 1B
-Subparagraph (SX 210.13-02(a)(4)(iii)(A))
-Publisher FASB
-URI https://asc.fasb.org//1943274/2147480097/470-10-S99-1B
Reference 26: http://www.xbrl.org/2003/role/disclosureRef
-Topic 470
-SubTopic 10
-Name Accounting Standards Codification
-Section S99
-Paragraph 1B
-Subparagraph (SX 210.13-02(a)(4)(iii)(B))
-Publisher FASB
-URI https://asc.fasb.org//1943274/2147480097/470-10-S99-1B
Reference 27: http://www.xbrl.org/2003/role/disclosureRef
-Topic 470
-SubTopic 10
-Name Accounting Standards Codification
-Section S99
-Paragraph 1B
-Subparagraph (SX 210.13-02(a)(4)(iv))
-Publisher FASB
-URI https://asc.fasb.org//1943274/2147480097/470-10-S99-1B
Reference 28: http://www.xbrl.org/2003/role/disclosureRef
-Topic 470
-SubTopic 10
-Name Accounting Standards Codification
-Section S99
-Paragraph 1B
-Subparagraph (SX 210.13-02(a)(5))
-Publisher FASB
-URI https://asc.fasb.org//1943274/2147480097/470-10-S99-1B
Reference 29: http://www.xbrl.org/2003/role/disclosureRef
-Topic 280
-SubTopic 10
-Name Accounting Standards Codification
-Section 50
-Paragraph 30
-Subparagraph (b)
-Publisher FASB
-URI https://asc.fasb.org//1943274/2147482810/280-10-50-30
Reference 30: http://www.xbrl.org/2003/role/disclosureRef
-Topic 280
-SubTopic 10
-Name Accounting Standards Codification
-Section 50
-Paragraph 32
-Subparagraph (f)
-Publisher FASB
-URI https://asc.fasb.org//1943274/2147482810/280-10-50-32
Reference 31: http://www.xbrl.org/2003/role/disclosureRef
-Topic 260
-SubTopic 10
-Name Accounting Standards Codification
-Section 45
-Paragraph 60B
-Subparagraph (a)
-Publisher FASB
-URI https://asc.fasb.org//1943274/2147482689/260-10-45-60B
Reference 32: http://www.xbrl.org/2003/role/exampleRef
-Topic 280
-SubTopic 10
-Name Accounting Standards Codification
-Section 50
-Paragraph 31
-Publisher FASB
-URI https://asc.fasb.org//1943274/2147482810/280-10-50-31
Reference 33: http://www.xbrl.org/2003/role/disclosureRef
-Topic 280
-SubTopic 10
-Name Accounting Standards Codification
-Section 50
-Paragraph 32
-Subparagraph (c)
-Publisher FASB
-URI https://asc.fasb.org//1943274/2147482810/280-10-50-32
Reference 34: http://www.xbrl.org/2003/role/disclosureRef
-Topic 205
-SubTopic 20
-Name Accounting Standards Codification
-Section 50
-Paragraph 7
-Publisher FASB
-URI https://asc.fasb.org//1943274/2147483499/205-20-50-7
Reference 35: http://fasb.org/us-gaap/role/ref/legacyRef
-Topic 230
-SubTopic 10
-Name Accounting Standards Codification
-Section 45
-Paragraph 28
-Publisher FASB
-URI https://asc.fasb.org//1943274/2147482740/230-10-45-28
Reference 36: http://www.xbrl.org/2003/role/disclosureRef
-Topic 220
-SubTopic 10
-Name Accounting Standards Codification
-Section 45
-Paragraph 1A
-Subparagraph (a)
-Publisher FASB
-URI https://asc.fasb.org//1943274/2147482790/220-10-45-1A
Reference 37: http://www.xbrl.org/2003/role/disclosureRef
-Topic 220
-SubTopic 10
-Name Accounting Standards Codification
-Section 45
-Paragraph 1B
-Subparagraph (a)
-Publisher FASB
-URI https://asc.fasb.org//1943274/2147482790/220-10-45-1B
Reference 38: http://fasb.org/us-gaap/role/ref/legacyRef
-Topic 220
-SubTopic 10
-Name Accounting Standards Codification
-Section S99
-Paragraph 2
-Subparagraph (SX 210.5-03(20))
-Publisher FASB
-URI https://asc.fasb.org//1943274/2147483621/220-10-S99-2
Reference 39: http://fasb.org/us-gaap/role/ref/legacyRef
-Topic 942
-SubTopic 220
-Name Accounting Standards Codification
-Section S99
-Paragraph 1
-Subparagraph (SX 210.9-04(22))
-Publisher FASB
-URI https://asc.fasb.org//1943274/2147483589/942-220-S99-1
| Name: |
us-gaap_NetIncomeLoss |
| Namespace Prefix: |
us-gaap_ |
| Data Type: |
xbrli:monetaryItemType |
| Balance Type: |
credit |
| Period Type: |
duration |
|
| X |
- References
+ Details
| Name: |
us-gaap_OperatingCostsAndExpensesAbstract |
| Namespace Prefix: |
us-gaap_ |
| Data Type: |
xbrli:stringItemType |
| Balance Type: |
na |
| Period Type: |
duration |
|
| X |
- DefinitionThe net result for the period of deducting operating expenses from operating revenues. Reference 1: http://www.xbrl.org/2003/role/disclosureRef
-Topic 280
-SubTopic 10
-Name Accounting Standards Codification
-Section 50
-Paragraph 22
-Publisher FASB
-URI https://asc.fasb.org//1943274/2147482810/280-10-50-22
Reference 2: http://www.xbrl.org/2003/role/disclosureRef
-Topic 280
-SubTopic 10
-Name Accounting Standards Codification
-Section 50
-Paragraph 30
-Subparagraph (b)
-Publisher FASB
-URI https://asc.fasb.org//1943274/2147482810/280-10-50-30
Reference 3: http://www.xbrl.org/2003/role/disclosureRef
-Topic 280
-SubTopic 10
-Name Accounting Standards Codification
-Section 50
-Paragraph 32
-Subparagraph (f)
-Publisher FASB
-URI https://asc.fasb.org//1943274/2147482810/280-10-50-32
Reference 4: http://www.xbrl.org/2003/role/exampleRef
-Topic 280
-SubTopic 10
-Name Accounting Standards Codification
-Section 50
-Paragraph 31
-Publisher FASB
-URI https://asc.fasb.org//1943274/2147482810/280-10-50-31
Reference 5: http://www.xbrl.org/2003/role/disclosureRef
-Topic 280
-SubTopic 10
-Name Accounting Standards Codification
-Section 50
-Paragraph 32
-Subparagraph (c)
-Publisher FASB
-URI https://asc.fasb.org//1943274/2147482810/280-10-50-32
| Name: |
us-gaap_OperatingIncomeLoss |
| Namespace Prefix: |
us-gaap_ |
| Data Type: |
xbrli:monetaryItemType |
| Balance Type: |
credit |
| Period Type: |
duration |
|
| X |
- References
+ Details
| Name: |
us-gaap_OtherIncomeAndExpensesAbstract |
| Namespace Prefix: |
us-gaap_ |
| Data Type: |
xbrli:stringItemType |
| Balance Type: |
na |
| Period Type: |
duration |
|
| X |
- DefinitionAmount of income (expense) related to nonoperating activities, classified as other. Reference 1: http://fasb.org/us-gaap/role/ref/legacyRef
-Topic 220
-SubTopic 10
-Name Accounting Standards Codification
-Section S99
-Paragraph 2
-Subparagraph (SX 210.5-03.9)
-Publisher FASB
-URI https://asc.fasb.org//1943274/2147483621/220-10-S99-2
| Name: |
us-gaap_OtherNonoperatingIncomeExpense |
| Namespace Prefix: |
us-gaap_ |
| Data Type: |
xbrli:monetaryItemType |
| Balance Type: |
credit |
| Period Type: |
duration |
|
| X |
- DefinitionA fee charged for services from professionals such as doctors, lawyers and accountants. The term is often expanded to include other professions, for example, pharmacists charging to maintain a medicinal profile of a client or customer. Reference 1: http://www.xbrl.org/2003/role/exampleRef
-Topic 946
-SubTopic 830
-Name Accounting Standards Codification
-Section 55
-Paragraph 10
-Publisher FASB
-URI https://asc.fasb.org//1943274/2147480167/946-830-55-10
Reference 2: http://www.xbrl.org/2009/role/commonPracticeRef
-Topic 946
-SubTopic 220
-Name Accounting Standards Codification
-Section 45
-Paragraph 3
-Subparagraph (k)
-Publisher FASB
-URI https://asc.fasb.org//1943274/2147483581/946-220-45-3
Reference 3: http://www.xbrl.org/2009/role/commonPracticeRef
-Topic 946
-SubTopic 220
-Name Accounting Standards Codification
-Section S99
-Paragraph 1
-Subparagraph (SX 210.6-07(2)(b))
-Publisher FASB
-URI https://asc.fasb.org//1943274/2147483575/946-220-S99-1
| Name: |
us-gaap_ProfessionalFees |
| Namespace Prefix: |
us-gaap_ |
| Data Type: |
xbrli:monetaryItemType |
| Balance Type: |
debit |
| Period Type: |
duration |
|
| X |
- DefinitionAmount of expense for salary and wage arising from service rendered by nonofficer employee. Excludes allocated cost, labor-related nonsalary expense, and direct and overhead labor cost included in cost of good and service sold. Reference 1: http://www.xbrl.org/2009/role/commonPracticeRef
-Topic 220
-SubTopic 10
-Name Accounting Standards Codification
-Section S99
-Paragraph 2
-Subparagraph (SX 210.5-03(4))
-Publisher FASB
-URI https://asc.fasb.org//1943274/2147483621/220-10-S99-2
| Name: |
us-gaap_SalariesAndWages |
| Namespace Prefix: |
us-gaap_ |
| Data Type: |
xbrli:monetaryItemType |
| Balance Type: |
debit |
| Period Type: |
duration |
|
| X |
- DefinitionNumber of [basic] shares or units, after adjustment for contingently issuable shares or units and other shares or units not deemed outstanding, determined by relating the portion of time within a reporting period that common shares or units have been outstanding to the total time in that period. Reference 1: http://www.xbrl.org/2003/role/disclosureRef
-Topic 260
-SubTopic 10
-Name Accounting Standards Codification
-Section 50
-Paragraph 1
-Subparagraph (a)
-Publisher FASB
-URI https://asc.fasb.org//1943274/2147482662/260-10-50-1
Reference 2: http://www.xbrl.org/2003/role/disclosureRef
-Topic 260
-SubTopic 10
-Name Accounting Standards Codification
-Section 45
-Paragraph 10
-Publisher FASB
-URI https://asc.fasb.org//1943274/2147482689/260-10-45-10
| Name: |
us-gaap_WeightedAverageNumberOfSharesOutstandingBasic |
| Namespace Prefix: |
us-gaap_ |
| Data Type: |
xbrli:sharesItemType |
| Balance Type: |
na |
| Period Type: |
duration |
|
v3.23.2
CONSOLIDATED STATEMENTS OF CHANGES IN STOCKHOLDERS EQUITY - USD ($)
|
Total |
Preferred Stock |
Common Stock |
Additional Paid-In Capital |
Retained Earnings (Accumulated Deficit) |
| Balance, shares at Dec. 31, 2020 |
|
2,818,750
|
137,847,005
|
|
|
| Balance, amount at Dec. 31, 2020 |
$ (28,413,169)
|
$ 2,819
|
$ 137,847
|
$ 58,360,044
|
$ (86,913,879)
|
| Common Stock issued for conversions of notes payable, shares |
|
|
34,829,587
|
|
|
| Common Stock issued for conversions of notes payable, amount |
972,882
|
0
|
$ 34,830
|
938,052
|
0
|
| Common Stock issued for second commitment fee, shares |
|
|
1,693,877
|
|
|
| Common Stock issued for second commitment fee, amount |
83,000
|
0
|
$ 1,694
|
81,306
|
0
|
| Net Loss |
(2,670,637)
|
$ 0
|
$ 0
|
0
|
(2,670,637)
|
| Balance, shares at Dec. 31, 2021 |
|
2,818,750
|
174,370,469
|
|
|
| Balance, amount at Dec. 31, 2021 |
(30,027,924)
|
$ 2,819
|
$ 174,371
|
59,379,402
|
(89,584,516)
|
| Common Stock issued for conversions of notes payable, shares |
|
|
10,000,000
|
|
|
| Common Stock issued for conversions of notes payable, amount |
185,000
|
0
|
$ 10,000
|
175,000
|
0
|
| Net Loss |
(6,912,102)
|
$ 0
|
0
|
0
|
(6,912,102)
|
| Series D Preferred Stock issued for cash, shares |
|
135
|
|
|
|
| Series D Preferred Stock issued for cash, amount |
270,000
|
$ 0
|
0
|
270,000
|
0
|
| Series D Preferred Stock issued for conversion of notes and interest, shares |
|
143
|
|
|
|
| Series D Preferred Stock issued for conversion of notes and interest, amount |
286,000
|
$ 0
|
$ 0
|
286,000
|
0
|
| Balance, shares at Dec. 31, 2022 |
|
2,819,028
|
184,370,469
|
|
|
| Balance, amount at Dec. 31, 2022 |
$ (36,199,026)
|
$ 2,819
|
$ 184,371
|
$ 60,110,402
|
$ (96,496,618)
|
| X |
- References
+ Details
| Name: |
cpwr_CommonStockIssuedForConversionsOfNotesPayableAmount |
| Namespace Prefix: |
cpwr_ |
| Data Type: |
xbrli:monetaryItemType |
| Balance Type: |
debit |
| Period Type: |
duration |
|
| X |
- References
+ Details
| Name: |
cpwr_CommonStockIssuedForConversionsOfNotesPayableShares |
| Namespace Prefix: |
cpwr_ |
| Data Type: |
xbrli:sharesItemType |
| Balance Type: |
na |
| Period Type: |
duration |
|
| X |
- References
+ Details
| Name: |
cpwr_CommonStockIssuedForSecondCommitmentFeeAmount |
| Namespace Prefix: |
cpwr_ |
| Data Type: |
xbrli:monetaryItemType |
| Balance Type: |
credit |
| Period Type: |
duration |
|
| X |
- References
+ Details
| Name: |
cpwr_CommonStockIssuedForSecondCommitmentFeeShares |
| Namespace Prefix: |
cpwr_ |
| Data Type: |
xbrli:sharesItemType |
| Balance Type: |
na |
| Period Type: |
duration |
|
| X |
- References
+ Details
| Name: |
cpwr_SeriesDPreferredStockIssuedForCashAmount |
| Namespace Prefix: |
cpwr_ |
| Data Type: |
xbrli:monetaryItemType |
| Balance Type: |
credit |
| Period Type: |
duration |
|
| X |
- References
+ Details
| Name: |
cpwr_SeriesDPreferredStockIssuedForCashShares |
| Namespace Prefix: |
cpwr_ |
| Data Type: |
xbrli:sharesItemType |
| Balance Type: |
na |
| Period Type: |
duration |
|
| X |
- References
+ Details
| Name: |
cpwr_SeriesDPreferredStockIssuedForConversionOfNotesAndInterestAmount |
| Namespace Prefix: |
cpwr_ |
| Data Type: |
xbrli:monetaryItemType |
| Balance Type: |
credit |
| Period Type: |
duration |
|
| X |
- References
+ Details
| Name: |
cpwr_SeriesDPreferredStockIssuedForConversionOfNotesAndInterestShares |
| Namespace Prefix: |
cpwr_ |
| Data Type: |
xbrli:sharesItemType |
| Balance Type: |
na |
| Period Type: |
duration |
|
| X |
- DefinitionThe portion of profit or loss for the period, net of income taxes, which is attributable to the parent. Reference 1: http://www.xbrl.org/2003/role/disclosureRef
-Topic 235
-SubTopic 10
-Name Accounting Standards Codification
-Section S99
-Paragraph 1
-Subparagraph (SX 210.4-08(g)(1)(ii))
-Publisher FASB
-URI https://asc.fasb.org//1943274/2147480678/235-10-S99-1
Reference 2: http://www.xbrl.org/2003/role/disclosureRef
-Topic 323
-SubTopic 10
-Name Accounting Standards Codification
-Section 50
-Paragraph 3
-Subparagraph (c)
-Publisher FASB
-URI https://asc.fasb.org//1943274/2147481687/323-10-50-3
Reference 3: http://www.xbrl.org/2003/role/disclosureRef
-Topic 825
-SubTopic 10
-Name Accounting Standards Codification
-Section 50
-Paragraph 28
-Subparagraph (f)
-Publisher FASB
-URI https://asc.fasb.org//1943274/2147482907/825-10-50-28
Reference 4: http://www.xbrl.org/2003/role/disclosureRef
-Topic 220
-SubTopic 10
-Name Accounting Standards Codification
-Section 50
-Paragraph 6
-Publisher FASB
-URI https://asc.fasb.org//1943274/2147482765/220-10-50-6
Reference 5: http://www.xbrl.org/2003/role/disclosureRef
-Topic 250
-SubTopic 10
-Name Accounting Standards Codification
-Section 50
-Paragraph 3
-Publisher FASB
-URI https://asc.fasb.org//1943274/2147483443/250-10-50-3
Reference 6: http://www.xbrl.org/2003/role/disclosureRef
-Topic 250
-SubTopic 10
-Name Accounting Standards Codification
-Section 50
-Paragraph 1
-Subparagraph (b)(2)
-Publisher FASB
-URI https://asc.fasb.org//1943274/2147483443/250-10-50-1
Reference 7: http://www.xbrl.org/2003/role/disclosureRef
-Topic 815
-SubTopic 40
-Name Accounting Standards Codification
-Section 65
-Paragraph 1
-Subparagraph (f)
-Publisher FASB
-URI https://asc.fasb.org//1943274/2147480175/815-40-65-1
Reference 8: http://www.xbrl.org/2003/role/disclosureRef
-Topic 250
-SubTopic 10
-Name Accounting Standards Codification
-Section 50
-Paragraph 8
-Publisher FASB
-URI https://asc.fasb.org//1943274/2147483443/250-10-50-8
Reference 9: http://www.xbrl.org/2003/role/disclosureRef
-Topic 250
-SubTopic 10
-Name Accounting Standards Codification
-Section 50
-Paragraph 9
-Publisher FASB
-URI https://asc.fasb.org//1943274/2147483443/250-10-50-9
Reference 10: http://www.xbrl.org/2003/role/disclosureRef
-Topic 250
-SubTopic 10
-Name Accounting Standards Codification
-Section 50
-Paragraph 11
-Subparagraph (a)
-Publisher FASB
-URI https://asc.fasb.org//1943274/2147483443/250-10-50-11
Reference 11: http://www.xbrl.org/2003/role/disclosureRef
-Topic 250
-SubTopic 10
-Name Accounting Standards Codification
-Section 50
-Paragraph 11
-Subparagraph (b)
-Publisher FASB
-URI https://asc.fasb.org//1943274/2147483443/250-10-50-11
Reference 12: http://www.xbrl.org/2003/role/disclosureRef
-Topic 250
-SubTopic 10
-Name Accounting Standards Codification
-Section 50
-Paragraph 4
-Publisher FASB
-URI https://asc.fasb.org//1943274/2147483443/250-10-50-4
Reference 13: http://www.xbrl.org/2003/role/exampleRef
-Topic 946
-SubTopic 830
-Name Accounting Standards Codification
-Section 55
-Paragraph 10
-Publisher FASB
-URI https://asc.fasb.org//1943274/2147480167/946-830-55-10
Reference 14: http://www.xbrl.org/2003/role/disclosureRef
-Topic 946
-SubTopic 220
-Name Accounting Standards Codification
-Section 45
-Paragraph 7
-Publisher FASB
-URI https://asc.fasb.org//1943274/2147483581/946-220-45-7
Reference 15: http://www.xbrl.org/2003/role/disclosureRef
-Topic 944
-SubTopic 220
-Name Accounting Standards Codification
-Section S99
-Paragraph 1
-Subparagraph (SX 210.7-04(18))
-Publisher FASB
-URI https://asc.fasb.org//1943274/2147483586/944-220-S99-1
Reference 16: http://www.xbrl.org/2003/role/disclosureRef
-Topic 280
-SubTopic 10
-Name Accounting Standards Codification
-Section 50
-Paragraph 22
-Publisher FASB
-URI https://asc.fasb.org//1943274/2147482810/280-10-50-22
Reference 17: http://www.xbrl.org/2003/role/disclosureRef
-Topic 946
-SubTopic 220
-Name Accounting Standards Codification
-Section S99
-Paragraph 1
-Subparagraph (SX 210.6-07(9))
-Publisher FASB
-URI https://asc.fasb.org//1943274/2147483575/946-220-S99-1
Reference 18: http://www.xbrl.org/2003/role/disclosureRef
-Topic 946
-SubTopic 220
-Name Accounting Standards Codification
-Section S99
-Paragraph 3
-Subparagraph (SX 210.6-09(1)(d))
-Publisher FASB
-URI https://asc.fasb.org//1943274/2147483575/946-220-S99-3
Reference 19: http://www.xbrl.org/2003/role/disclosureRef
-Topic 470
-SubTopic 10
-Name Accounting Standards Codification
-Section S99
-Paragraph 1A
-Subparagraph (SX 210.13-01(a)(4)(i))
-Publisher FASB
-URI https://asc.fasb.org//1943274/2147480097/470-10-S99-1A
Reference 20: http://www.xbrl.org/2009/role/commonPracticeRef
-Topic 470
-SubTopic 10
-Name Accounting Standards Codification
-Section S99
-Paragraph 1A
-Subparagraph (SX 210.13-01(a)(4)(ii))
-Publisher FASB
-URI https://asc.fasb.org//1943274/2147480097/470-10-S99-1A
Reference 21: http://www.xbrl.org/2003/role/disclosureRef
-Topic 470
-SubTopic 10
-Name Accounting Standards Codification
-Section S99
-Paragraph 1A
-Subparagraph (SX 210.13-01(a)(4)(iii)(A))
-Publisher FASB
-URI https://asc.fasb.org//1943274/2147480097/470-10-S99-1A
Reference 22: http://www.xbrl.org/2003/role/disclosureRef
-Topic 470
-SubTopic 10
-Name Accounting Standards Codification
-Section S99
-Paragraph 1A
-Subparagraph (SX 210.13-01(a)(4)(iv))
-Publisher FASB
-URI https://asc.fasb.org//1943274/2147480097/470-10-S99-1A
Reference 23: http://www.xbrl.org/2003/role/disclosureRef
-Topic 470
-SubTopic 10
-Name Accounting Standards Codification
-Section S99
-Paragraph 1A
-Subparagraph (SX 210.13-01(a)(5))
-Publisher FASB
-URI https://asc.fasb.org//1943274/2147480097/470-10-S99-1A
Reference 24: http://www.xbrl.org/2003/role/disclosureRef
-Topic 470
-SubTopic 10
-Name Accounting Standards Codification
-Section S99
-Paragraph 1B
-Subparagraph (SX 210.13-02(a)(4)(i))
-Publisher FASB
-URI https://asc.fasb.org//1943274/2147480097/470-10-S99-1B
Reference 25: http://www.xbrl.org/2003/role/disclosureRef
-Topic 470
-SubTopic 10
-Name Accounting Standards Codification
-Section S99
-Paragraph 1B
-Subparagraph (SX 210.13-02(a)(4)(iii)(A))
-Publisher FASB
-URI https://asc.fasb.org//1943274/2147480097/470-10-S99-1B
Reference 26: http://www.xbrl.org/2003/role/disclosureRef
-Topic 470
-SubTopic 10
-Name Accounting Standards Codification
-Section S99
-Paragraph 1B
-Subparagraph (SX 210.13-02(a)(4)(iii)(B))
-Publisher FASB
-URI https://asc.fasb.org//1943274/2147480097/470-10-S99-1B
Reference 27: http://www.xbrl.org/2003/role/disclosureRef
-Topic 470
-SubTopic 10
-Name Accounting Standards Codification
-Section S99
-Paragraph 1B
-Subparagraph (SX 210.13-02(a)(4)(iv))
-Publisher FASB
-URI https://asc.fasb.org//1943274/2147480097/470-10-S99-1B
Reference 28: http://www.xbrl.org/2003/role/disclosureRef
-Topic 470
-SubTopic 10
-Name Accounting Standards Codification
-Section S99
-Paragraph 1B
-Subparagraph (SX 210.13-02(a)(5))
-Publisher FASB
-URI https://asc.fasb.org//1943274/2147480097/470-10-S99-1B
Reference 29: http://www.xbrl.org/2003/role/disclosureRef
-Topic 280
-SubTopic 10
-Name Accounting Standards Codification
-Section 50
-Paragraph 30
-Subparagraph (b)
-Publisher FASB
-URI https://asc.fasb.org//1943274/2147482810/280-10-50-30
Reference 30: http://www.xbrl.org/2003/role/disclosureRef
-Topic 280
-SubTopic 10
-Name Accounting Standards Codification
-Section 50
-Paragraph 32
-Subparagraph (f)
-Publisher FASB
-URI https://asc.fasb.org//1943274/2147482810/280-10-50-32
Reference 31: http://www.xbrl.org/2003/role/disclosureRef
-Topic 260
-SubTopic 10
-Name Accounting Standards Codification
-Section 45
-Paragraph 60B
-Subparagraph (a)
-Publisher FASB
-URI https://asc.fasb.org//1943274/2147482689/260-10-45-60B
Reference 32: http://www.xbrl.org/2003/role/exampleRef
-Topic 280
-SubTopic 10
-Name Accounting Standards Codification
-Section 50
-Paragraph 31
-Publisher FASB
-URI https://asc.fasb.org//1943274/2147482810/280-10-50-31
Reference 33: http://www.xbrl.org/2003/role/disclosureRef
-Topic 280
-SubTopic 10
-Name Accounting Standards Codification
-Section 50
-Paragraph 32
-Subparagraph (c)
-Publisher FASB
-URI https://asc.fasb.org//1943274/2147482810/280-10-50-32
Reference 34: http://www.xbrl.org/2003/role/disclosureRef
-Topic 205
-SubTopic 20
-Name Accounting Standards Codification
-Section 50
-Paragraph 7
-Publisher FASB
-URI https://asc.fasb.org//1943274/2147483499/205-20-50-7
Reference 35: http://fasb.org/us-gaap/role/ref/legacyRef
-Topic 230
-SubTopic 10
-Name Accounting Standards Codification
-Section 45
-Paragraph 28
-Publisher FASB
-URI https://asc.fasb.org//1943274/2147482740/230-10-45-28
Reference 36: http://www.xbrl.org/2003/role/disclosureRef
-Topic 220
-SubTopic 10
-Name Accounting Standards Codification
-Section 45
-Paragraph 1A
-Subparagraph (a)
-Publisher FASB
-URI https://asc.fasb.org//1943274/2147482790/220-10-45-1A
Reference 37: http://www.xbrl.org/2003/role/disclosureRef
-Topic 220
-SubTopic 10
-Name Accounting Standards Codification
-Section 45
-Paragraph 1B
-Subparagraph (a)
-Publisher FASB
-URI https://asc.fasb.org//1943274/2147482790/220-10-45-1B
Reference 38: http://fasb.org/us-gaap/role/ref/legacyRef
-Topic 220
-SubTopic 10
-Name Accounting Standards Codification
-Section S99
-Paragraph 2
-Subparagraph (SX 210.5-03(20))
-Publisher FASB
-URI https://asc.fasb.org//1943274/2147483621/220-10-S99-2
Reference 39: http://fasb.org/us-gaap/role/ref/legacyRef
-Topic 942
-SubTopic 220
-Name Accounting Standards Codification
-Section S99
-Paragraph 1
-Subparagraph (SX 210.9-04(22))
-Publisher FASB
-URI https://asc.fasb.org//1943274/2147483589/942-220-S99-1
| Name: |
us-gaap_NetIncomeLoss |
| Namespace Prefix: |
us-gaap_ |
| Data Type: |
xbrli:monetaryItemType |
| Balance Type: |
credit |
| Period Type: |
duration |
|
| X |
- DefinitionNumber of shares of stock issued as of the balance sheet date, including shares that had been issued and were previously outstanding but which are now held in the treasury. Reference 1: http://fasb.org/us-gaap/role/ref/legacyRef
-Name Accounting Standards Codification
-Section 50
-Paragraph 2
-SubTopic 10
-Topic 505
-Publisher FASB
-URI https://asc.fasb.org//1943274/2147481112/505-10-50-2
| Name: |
us-gaap_SharesIssued |
| Namespace Prefix: |
us-gaap_ |
| Data Type: |
xbrli:sharesItemType |
| Balance Type: |
na |
| Period Type: |
instant |
|
| X |
- DefinitionAmount of equity (deficit) attributable to parent. Excludes temporary equity and equity attributable to noncontrolling interest. Reference 1: http://www.xbrl.org/2003/role/exampleRef
-Topic 852
-SubTopic 10
-Name Accounting Standards Codification
-Section 55
-Paragraph 10
-Publisher FASB
-URI https://asc.fasb.org//1943274/2147481372/852-10-55-10
Reference 2: http://www.xbrl.org/2003/role/exampleRef
-Topic 946
-SubTopic 830
-Name Accounting Standards Codification
-Section 55
-Paragraph 12
-Publisher FASB
-URI https://asc.fasb.org//1943274/2147480167/946-830-55-12
Reference 3: http://www.xbrl.org/2003/role/disclosureRef
-Topic 946
-SubTopic 210
-Name Accounting Standards Codification
-Section S99
-Paragraph 1
-Subparagraph (SX 210.6-04(19))
-Publisher FASB
-URI https://asc.fasb.org//1943274/2147479617/946-210-S99-1
Reference 4: http://www.xbrl.org/2003/role/disclosureRef
-Topic 946
-SubTopic 210
-Name Accounting Standards Codification
-Section S99
-Paragraph 2
-Subparagraph (SX 210.6-05(4))
-Publisher FASB
-URI https://asc.fasb.org//1943274/2147479617/946-210-S99-2
Reference 5: http://www.xbrl.org/2009/role/commonPracticeRef
-Topic 946
-SubTopic 220
-Name Accounting Standards Codification
-Section S99
-Paragraph 3
-Subparagraph (SX 210.6-09(4)(b))
-Publisher FASB
-URI https://asc.fasb.org//1943274/2147483575/946-220-S99-3
Reference 6: http://www.xbrl.org/2003/role/disclosureRef
-Topic 946
-SubTopic 220
-Name Accounting Standards Codification
-Section S99
-Paragraph 3
-Subparagraph (SX 210.6-09(6))
-Publisher FASB
-URI https://asc.fasb.org//1943274/2147483575/946-220-S99-3
Reference 7: http://www.xbrl.org/2003/role/disclosureRef
-Topic 946
-SubTopic 220
-Name Accounting Standards Codification
-Section S99
-Paragraph 3
-Subparagraph (SX 210.6-09(7))
-Publisher FASB
-URI https://asc.fasb.org//1943274/2147483575/946-220-S99-3
Reference 8: http://www.xbrl.org/2009/role/commonPracticeRef
-Topic 235
-SubTopic 10
-Name Accounting Standards Codification
-Section S99
-Paragraph 1
-Subparagraph (SX 210.4-08(g)(1)(ii))
-Publisher FASB
-URI https://asc.fasb.org//1943274/2147480678/235-10-S99-1
Reference 9: http://www.xbrl.org/2009/role/commonPracticeRef
-Topic 323
-SubTopic 10
-Name Accounting Standards Codification
-Section 50
-Paragraph 3
-Subparagraph (c)
-Publisher FASB
-URI https://asc.fasb.org//1943274/2147481687/323-10-50-3
Reference 10: http://www.xbrl.org/2009/role/commonPracticeRef
-Topic 825
-SubTopic 10
-Name Accounting Standards Codification
-Section 50
-Paragraph 28
-Subparagraph (f)
-Publisher FASB
-URI https://asc.fasb.org//1943274/2147482907/825-10-50-28
Reference 11: http://fasb.org/us-gaap/role/ref/legacyRef
-Topic 210
-SubTopic 10
-Name Accounting Standards Codification
-Section S99
-Paragraph 1
-Subparagraph (SX 210.5-02(29))
-Publisher FASB
-URI https://asc.fasb.org//1943274/2147480566/210-10-S99-1
Reference 12: http://fasb.org/us-gaap/role/ref/legacyRef
-Topic 210
-SubTopic 10
-Name Accounting Standards Codification
-Section S99
-Paragraph 1
-Subparagraph (SX 210.5-02(31))
-Publisher FASB
-URI https://asc.fasb.org//1943274/2147480566/210-10-S99-1
Reference 13: http://fasb.org/us-gaap/role/ref/legacyRef
-Topic 210
-SubTopic 10
-Name Accounting Standards Codification
-Section S99
-Paragraph 1
-Subparagraph (SX 210.5-02(30))
-Publisher FASB
-URI https://asc.fasb.org//1943274/2147480566/210-10-S99-1
Reference 14: http://fasb.org/us-gaap/role/ref/legacyRef
-Topic 310
-SubTopic 10
-Name Accounting Standards Codification
-Section S99
-Paragraph 2
-Subparagraph (SAB Topic 4.E)
-Publisher FASB
-URI https://asc.fasb.org//1943274/2147480418/310-10-S99-2
| Name: |
us-gaap_StockholdersEquity |
| Namespace Prefix: |
us-gaap_ |
| Data Type: |
xbrli:monetaryItemType |
| Balance Type: |
credit |
| Period Type: |
instant |
|
v3.23.2
CONSOLIDATED STATEMENTS OF CASH FLOW - USD ($)
|
12 Months Ended |
Dec. 31, 2022 |
Dec. 31, 2021 |
| Cash Flows From Operating Activities: |
|
|
| Net loss |
$ (6,912,102)
|
$ (2,670,637)
|
| Adjustments to reconcile net loss to net cash used in operating activities: |
|
|
| Change in fair value of derivative liability |
3,428,245
|
(1,305,482)
|
| Amortization of debt discount |
210,351
|
362,259
|
| Gain on conversion of debt |
(60,901)
|
(113,215)
|
| Stock issued for second commitment fee |
0
|
83,000
|
| Changes in assets and liabilities: |
|
|
| Prepaid expense |
0
|
5,000
|
| Accounts payable and accrued expenses |
3,007,194
|
3,096,445
|
| Net Cash Used In Operating Activities |
(327,213)
|
(542,630)
|
| Cash Flows From Financing Activities: |
|
|
| Proceeds from sale of preferred stock |
270,000
|
0
|
| Advances from related parties |
57,660
|
0
|
| Repayment of notes payable |
0
|
(3,855)
|
| Proceeds from notes payable |
0
|
105,000
|
| Proceeds from convertible notes payable |
0
|
425,000
|
| Proceeds from convertible notes payable - related party |
0
|
10,000
|
| Net Cash Provided by Financing Activities |
327,660
|
536,145
|
| Net increase (decrease) in cash |
447
|
(6,485)
|
| Cash at beginning of year |
957
|
7,442
|
| Cash at End of Year |
1,404
|
957
|
| Supplemental disclosure of cash flow information |
|
|
| Cash paid for interest expense |
13,823
|
20,736
|
| Cash paid for income taxes |
0
|
0
|
| Supplemental disclosure of non-cash investing and financing activities: |
|
|
| Preferred stock issued for conversion of notes and accrued interest |
286,000
|
0
|
| Convertible notes payable and accrued interest converted into common stock |
62,596
|
419,179
|
| Convertible notes payable and accrued interest converted into preferred stock |
100,945
|
0
|
| Related party convertible notes payable and accrued interest converted into preferred stock |
$ 12,043
|
0
|
| Notes payable and accrued interest converted into preferred stock |
168,138
|
|
| Debt discount on notes payable |
$ 0
|
420,214
|
| Common stock issued for conversion of notes payable |
185,000
|
972,882
|
| Derivative liability extinguished upon conversion of note payable |
$ 199,194
|
$ 666,916
|
| X |
- References
+ Details
| Name: |
cpwr_ConvertibleNotesPayableAndAccruedInterestConvertedIntoCommonStock |
| Namespace Prefix: |
cpwr_ |
| Data Type: |
xbrli:monetaryItemType |
| Balance Type: |
credit |
| Period Type: |
duration |
|
| X |
- References
+ Details
| Name: |
cpwr_DerivativeLiabilityExtinguishedUponConversionOfNotePayable |
| Namespace Prefix: |
cpwr_ |
| Data Type: |
xbrli:monetaryItemType |
| Balance Type: |
debit |
| Period Type: |
duration |
|
| X |
- References
+ Details
| Name: |
cpwr_GainsLossesOnConversionOfDebt |
| Namespace Prefix: |
cpwr_ |
| Data Type: |
xbrli:monetaryItemType |
| Balance Type: |
credit |
| Period Type: |
duration |
|
| X |
- References
+ Details
| Name: |
us-gaap_AdjustmentsToReconcileNetIncomeLossToCashProvidedByUsedInOperatingActivitiesAbstract |
| Namespace Prefix: |
us-gaap_ |
| Data Type: |
xbrli:stringItemType |
| Balance Type: |
na |
| Period Type: |
duration |
|
| X |
- DefinitionAmount of noncash expense included in interest expense to amortize debt discount and premium associated with the related debt instruments. Excludes amortization of financing costs. Alternate captions include noncash interest expense. Reference 1: http://fasb.org/us-gaap/role/ref/legacyRef
-Name Accounting Standards Codification
-Section 45
-Paragraph 28
-Subparagraph (b)
-SubTopic 10
-Topic 230
-Publisher FASB
-URI https://asc.fasb.org//1943274/2147482740/230-10-45-28
Reference 2: http://www.xbrl.org/2003/role/disclosureRef
-Topic 470
-SubTopic 20
-Name Accounting Standards Codification
-Section 50
-Paragraph 1F
-Subparagraph (b)(2)
-Publisher FASB
-URI https://asc.fasb.org//1943274/2147481139/470-20-50-1F
Reference 3: http://fasb.org/us-gaap/role/ref/legacyRef
-Name Accounting Standards Codification
-Topic 835
-SubTopic 30
-Section 45
-Paragraph 1A
-Publisher FASB
-URI https://asc.fasb.org//1943274/2147482925/835-30-45-1A
Reference 4: http://fasb.org/us-gaap/role/ref/legacyRef
-Topic 220
-SubTopic 10
-Name Accounting Standards Codification
-Section S99
-Paragraph 2
-Subparagraph (SX 210.5-03.8)
-Publisher FASB
-URI https://asc.fasb.org//1943274/2147483621/220-10-S99-2
| Name: |
us-gaap_AmortizationOfDebtDiscountPremium |
| Namespace Prefix: |
us-gaap_ |
| Data Type: |
xbrli:monetaryItemType |
| Balance Type: |
debit |
| Period Type: |
duration |
|
| X |
- DefinitionAmount of cash and cash equivalents, and cash and cash equivalents restricted to withdrawal or usage. Excludes amount for disposal group and discontinued operations. Cash includes, but is not limited to, currency on hand, demand deposits with banks or financial institutions, and other accounts with general characteristics of demand deposits. Cash equivalents include, but are not limited to, short-term, highly liquid investments that are both readily convertible to known amounts of cash and so near their maturity that they present insignificant risk of changes in value because of changes in interest rates. Reference 1: http://www.xbrl.org/2003/role/disclosureRef
-Topic 230
-SubTopic 10
-Name Accounting Standards Codification
-Section 50
-Paragraph 8
-Publisher FASB
-URI https://asc.fasb.org//1943274/2147482913/230-10-50-8
Reference 2: http://fasb.org/us-gaap/role/ref/legacyRef
-Topic 230
-SubTopic 10
-Name Accounting Standards Codification
-Section 45
-Paragraph 24
-Publisher FASB
-URI https://asc.fasb.org//1943274/2147482740/230-10-45-24
Reference 3: http://fasb.org/us-gaap/role/ref/legacyRef
-Name Accounting Standards Codification
-Topic 230
-SubTopic 10
-Section 45
-Paragraph 4
-Publisher FASB
-URI https://asc.fasb.org//1943274/2147482740/230-10-45-4
| Name: |
us-gaap_CashCashEquivalentsRestrictedCashAndRestrictedCashEquivalents |
| Namespace Prefix: |
us-gaap_ |
| Data Type: |
xbrli:monetaryItemType |
| Balance Type: |
debit |
| Period Type: |
instant |
|
| X |
- DefinitionAmount of increase (decrease) in cash and cash equivalents, and cash and cash equivalents restricted to withdrawal or usage; excluding effect from exchange rate change. Cash includes, but is not limited to, currency on hand, demand deposits with banks or financial institutions, and other accounts with general characteristics of demand deposits. Cash equivalents include, but are not limited to, short-term, highly liquid investments that are both readily convertible to known amounts of cash and so near their maturity that they present insignificant risk of changes in value because of changes in interest rates. Reference 1: http://fasb.org/us-gaap/role/ref/legacyRef
-Topic 230
-SubTopic 10
-Name Accounting Standards Codification
-Section 45
-Paragraph 24
-Publisher FASB
-URI https://asc.fasb.org//1943274/2147482740/230-10-45-24
Reference 2: http://fasb.org/us-gaap/role/ref/legacyRef
-Name Accounting Standards Codification
-Section 45
-Paragraph 1
-SubTopic 230
-Topic 830
-Publisher FASB
-URI https://asc.fasb.org//1943274/2147481877/830-230-45-1
| Name: |
us-gaap_CashCashEquivalentsRestrictedCashAndRestrictedCashEquivalentsPeriodIncreaseDecreaseExcludingExchangeRateEffect |
| Namespace Prefix: |
us-gaap_ |
| Data Type: |
xbrli:monetaryItemType |
| Balance Type: |
debit |
| Period Type: |
duration |
|
| X |
- References
+ Details
| Name: |
us-gaap_CashFlowNoncashInvestingAndFinancingActivitiesDisclosureAbstract |
| Namespace Prefix: |
us-gaap_ |
| Data Type: |
xbrli:stringItemType |
| Balance Type: |
na |
| Period Type: |
duration |
|
| X |
- DefinitionThe value of the stock converted in a noncash (or part noncash) transaction. Noncash is defined as transactions during a period that do not result in cash receipts or cash payments in the period. "Part noncash" refers to that portion of the transaction not resulting in cash receipts or cash payments in the period. Reference 1: http://fasb.org/us-gaap/role/ref/legacyRef
-Name Accounting Standards Codification
-Topic 230
-SubTopic 10
-Section 50
-Paragraph 4
-Publisher FASB
-URI https://asc.fasb.org//1943274/2147482913/230-10-50-4
Reference 2: http://fasb.org/us-gaap/role/ref/legacyRef
-Name Accounting Standards Codification
-Topic 230
-SubTopic 10
-Section 50
-Paragraph 3
-Publisher FASB
-URI https://asc.fasb.org//1943274/2147482913/230-10-50-3
Reference 3: http://fasb.org/us-gaap/role/ref/legacyRef
-Name Accounting Standards Codification
-Topic 230
-SubTopic 10
-Section 50
-Paragraph 5
-Publisher FASB
-URI https://asc.fasb.org//1943274/2147482913/230-10-50-5
| Name: |
us-gaap_ConversionOfStockAmountConverted1 |
| Namespace Prefix: |
us-gaap_ |
| Data Type: |
xbrli:monetaryItemType |
| Balance Type: |
debit |
| Period Type: |
duration |
|
| X |
- DefinitionThe number of new shares issued in the conversion of stock in a noncash (or part noncash) transaction. Noncash is defined as transactions during a period that do not result in cash receipts or cash payments in the period. "Part noncash" refers to that portion of the transaction not resulting in cash receipts or cash payments in the period. Reference 1: http://fasb.org/us-gaap/role/ref/legacyRef
-Name Accounting Standards Codification
-Topic 230
-SubTopic 10
-Section 50
-Paragraph 4
-Publisher FASB
-URI https://asc.fasb.org//1943274/2147482913/230-10-50-4
Reference 2: http://fasb.org/us-gaap/role/ref/legacyRef
-Name Accounting Standards Codification
-Topic 230
-SubTopic 10
-Section 50
-Paragraph 3
-Publisher FASB
-URI https://asc.fasb.org//1943274/2147482913/230-10-50-3
Reference 3: http://fasb.org/us-gaap/role/ref/legacyRef
-Name Accounting Standards Codification
-Topic 230
-SubTopic 10
-Section 50
-Paragraph 5
-Publisher FASB
-URI https://asc.fasb.org//1943274/2147482913/230-10-50-5
| Name: |
us-gaap_ConversionOfStockSharesIssued1 |
| Namespace Prefix: |
us-gaap_ |
| Data Type: |
xbrli:sharesItemType |
| Balance Type: |
na |
| Period Type: |
duration |
|
| X |
- DefinitionThe amount of debt issuance costs that were incurred during a noncash or partial noncash transaction. Reference 1: http://fasb.org/us-gaap/role/ref/legacyRef
-Name Accounting Standards Codification
-Topic 230
-SubTopic 10
-Section 50
-Paragraph 4
-Publisher FASB
-URI https://asc.fasb.org//1943274/2147482913/230-10-50-4
Reference 2: http://fasb.org/us-gaap/role/ref/legacyRef
-Name Accounting Standards Codification
-Topic 230
-SubTopic 10
-Section 50
-Paragraph 3
-Publisher FASB
-URI https://asc.fasb.org//1943274/2147482913/230-10-50-3
Reference 3: http://fasb.org/us-gaap/role/ref/legacyRef
-Name Accounting Standards Codification
-Topic 230
-SubTopic 10
-Section 50
-Paragraph 5
-Publisher FASB
-URI https://asc.fasb.org//1943274/2147482913/230-10-50-5
| Name: |
us-gaap_DebtIssuanceCostsIncurredDuringNoncashOrPartialNoncashTransaction |
| Namespace Prefix: |
us-gaap_ |
| Data Type: |
xbrli:monetaryItemType |
| Balance Type: |
debit |
| Period Type: |
duration |
|
| X |
- DefinitionThe increase (decrease) during the reporting period in the amounts payable to vendors for goods and services received and the amount of obligations and expenses incurred but not paid. Reference 1: http://fasb.org/us-gaap/role/ref/legacyRef
-Name Accounting Standards Codification
-Section 45
-Paragraph 28
-Subparagraph (a)
-SubTopic 10
-Topic 230
-Publisher FASB
-URI https://asc.fasb.org//1943274/2147482740/230-10-45-28
| Name: |
us-gaap_IncreaseDecreaseInAccountsPayableAndAccruedLiabilities |
| Namespace Prefix: |
us-gaap_ |
| Data Type: |
xbrli:monetaryItemType |
| Balance Type: |
debit |
| Period Type: |
duration |
|
| X |
- DefinitionThe increase (decrease) during the period in the carrying value of derivative instruments reported as liabilities that are due to be disposed of within one year (or the normal operating cycle, if longer). Reference 1: http://www.xbrl.org/2009/role/commonPracticeRef
-Topic 230
-SubTopic 10
-Name Accounting Standards Codification
-Section 45
-Paragraph 28
-Subparagraph (a)
-Publisher FASB
-URI https://asc.fasb.org//1943274/2147482740/230-10-45-28
| Name: |
us-gaap_IncreaseDecreaseInDerivativeLiabilities |
| Namespace Prefix: |
us-gaap_ |
| Data Type: |
xbrli:monetaryItemType |
| Balance Type: |
debit |
| Period Type: |
duration |
|
| X |
- References
+ Details
| Name: |
us-gaap_IncreaseDecreaseInOperatingCapitalAbstract |
| Namespace Prefix: |
us-gaap_ |
| Data Type: |
xbrli:stringItemType |
| Balance Type: |
na |
| Period Type: |
duration |
|
| X |
- DefinitionThe increase (decrease) during the reporting period in the amount of outstanding money paid in advance for goods or services that bring economic benefits for future periods. Reference 1: http://fasb.org/us-gaap/role/ref/legacyRef
-Name Accounting Standards Codification
-Section 45
-Paragraph 28
-Subparagraph (a)
-SubTopic 10
-Topic 230
-Publisher FASB
-URI https://asc.fasb.org//1943274/2147482740/230-10-45-28
| Name: |
us-gaap_IncreaseDecreaseInPrepaidExpense |
| Namespace Prefix: |
us-gaap_ |
| Data Type: |
xbrli:monetaryItemType |
| Balance Type: |
credit |
| Period Type: |
duration |
|
| X |
- DefinitionAmount of cash paid for interest, excluding capitalized interest, classified as operating activity. Includes, but is not limited to, payment to settle zero-coupon bond for accreted interest of debt discount and debt instrument with insignificant coupon interest rate in relation to effective interest rate of borrowing attributable to accreted interest of debt discount. Reference 1: http://www.xbrl.org/2003/role/disclosureRef
-Topic 230
-SubTopic 10
-Name Accounting Standards Codification
-Section 45
-Paragraph 17
-Subparagraph (d)
-Publisher FASB
-URI https://asc.fasb.org//1943274/2147482740/230-10-45-17
Reference 2: http://www.xbrl.org/2003/role/disclosureRef
-Topic 230
-SubTopic 10
-Name Accounting Standards Codification
-Section 45
-Paragraph 25
-Subparagraph (e)
-Publisher FASB
-URI https://asc.fasb.org//1943274/2147482740/230-10-45-25
Reference 3: http://www.xbrl.org/2003/role/disclosureRef
-Topic 230
-SubTopic 10
-Name Accounting Standards Codification
-Section 50
-Paragraph 2
-Publisher FASB
-URI https://asc.fasb.org//1943274/2147482913/230-10-50-2
| Name: |
us-gaap_InterestPaidNet |
| Namespace Prefix: |
us-gaap_ |
| Data Type: |
xbrli:monetaryItemType |
| Balance Type: |
credit |
| Period Type: |
duration |
|
| X |
- DefinitionFair value of share-based compensation granted to nonemployees as payment for services rendered or acknowledged claims. Reference 1: http://fasb.org/us-gaap/role/ref/legacyRef
-Name Accounting Standards Codification
-Section 45
-Paragraph 28
-Subparagraph (b)
-SubTopic 10
-Topic 230
-Publisher FASB
-URI https://asc.fasb.org//1943274/2147482740/230-10-45-28
| Name: |
us-gaap_IssuanceOfStockAndWarrantsForServicesOrClaims |
| Namespace Prefix: |
us-gaap_ |
| Data Type: |
xbrli:monetaryItemType |
| Balance Type: |
debit |
| Period Type: |
duration |
|
| X |
- DefinitionAmount of cash inflow (outflow) from financing activities, including discontinued operations. Financing activity cash flows include obtaining resources from owners and providing them with a return on, and a return of, their investment; borrowing money and repaying amounts borrowed, or settling the obligation; and obtaining and paying for other resources obtained from creditors on long-term credit. Reference 1: http://www.xbrl.org/2003/role/disclosureRef
-Topic 230
-SubTopic 10
-Name Accounting Standards Codification
-Section 45
-Paragraph 24
-Publisher FASB
-URI https://asc.fasb.org//1943274/2147482740/230-10-45-24
| Name: |
us-gaap_NetCashProvidedByUsedInFinancingActivities |
| Namespace Prefix: |
us-gaap_ |
| Data Type: |
xbrli:monetaryItemType |
| Balance Type: |
debit |
| Period Type: |
duration |
|
| X |
- References
+ Details
| Name: |
us-gaap_NetCashProvidedByUsedInFinancingActivitiesAbstract |
| Namespace Prefix: |
us-gaap_ |
| Data Type: |
xbrli:stringItemType |
| Balance Type: |
na |
| Period Type: |
duration |
|
| X |
- DefinitionAmount of cash inflow (outflow) from operating activities, including discontinued operations. Operating activity cash flows include transactions, adjustments, and changes in value not defined as investing or financing activities. Reference 1: http://fasb.org/us-gaap/role/ref/legacyRef
-Topic 230
-SubTopic 10
-Name Accounting Standards Codification
-Section 45
-Paragraph 28
-Publisher FASB
-URI https://asc.fasb.org//1943274/2147482740/230-10-45-28
Reference 2: http://fasb.org/us-gaap/role/ref/legacyRef
-Topic 230
-SubTopic 10
-Name Accounting Standards Codification
-Section 45
-Paragraph 24
-Publisher FASB
-URI https://asc.fasb.org//1943274/2147482740/230-10-45-24
Reference 3: http://fasb.org/us-gaap/role/ref/legacyRef
-Topic 230
-SubTopic 10
-Name Accounting Standards Codification
-Section 45
-Paragraph 25
-Publisher FASB
-URI https://asc.fasb.org//1943274/2147482740/230-10-45-25
| Name: |
us-gaap_NetCashProvidedByUsedInOperatingActivities |
| Namespace Prefix: |
us-gaap_ |
| Data Type: |
xbrli:monetaryItemType |
| Balance Type: |
na |
| Period Type: |
duration |
|
| X |
- References
+ Details
| Name: |
us-gaap_NetCashProvidedByUsedInOperatingActivitiesAbstract |
| Namespace Prefix: |
us-gaap_ |
| Data Type: |
xbrli:stringItemType |
| Balance Type: |
na |
| Period Type: |
duration |
|
| X |
- DefinitionThe portion of profit or loss for the period, net of income taxes, which is attributable to the parent. Reference 1: http://www.xbrl.org/2003/role/disclosureRef
-Topic 235
-SubTopic 10
-Name Accounting Standards Codification
-Section S99
-Paragraph 1
-Subparagraph (SX 210.4-08(g)(1)(ii))
-Publisher FASB
-URI https://asc.fasb.org//1943274/2147480678/235-10-S99-1
Reference 2: http://www.xbrl.org/2003/role/disclosureRef
-Topic 323
-SubTopic 10
-Name Accounting Standards Codification
-Section 50
-Paragraph 3
-Subparagraph (c)
-Publisher FASB
-URI https://asc.fasb.org//1943274/2147481687/323-10-50-3
Reference 3: http://www.xbrl.org/2003/role/disclosureRef
-Topic 825
-SubTopic 10
-Name Accounting Standards Codification
-Section 50
-Paragraph 28
-Subparagraph (f)
-Publisher FASB
-URI https://asc.fasb.org//1943274/2147482907/825-10-50-28
Reference 4: http://www.xbrl.org/2003/role/disclosureRef
-Topic 220
-SubTopic 10
-Name Accounting Standards Codification
-Section 50
-Paragraph 6
-Publisher FASB
-URI https://asc.fasb.org//1943274/2147482765/220-10-50-6
Reference 5: http://www.xbrl.org/2003/role/disclosureRef
-Topic 250
-SubTopic 10
-Name Accounting Standards Codification
-Section 50
-Paragraph 3
-Publisher FASB
-URI https://asc.fasb.org//1943274/2147483443/250-10-50-3
Reference 6: http://www.xbrl.org/2003/role/disclosureRef
-Topic 250
-SubTopic 10
-Name Accounting Standards Codification
-Section 50
-Paragraph 1
-Subparagraph (b)(2)
-Publisher FASB
-URI https://asc.fasb.org//1943274/2147483443/250-10-50-1
Reference 7: http://www.xbrl.org/2003/role/disclosureRef
-Topic 815
-SubTopic 40
-Name Accounting Standards Codification
-Section 65
-Paragraph 1
-Subparagraph (f)
-Publisher FASB
-URI https://asc.fasb.org//1943274/2147480175/815-40-65-1
Reference 8: http://www.xbrl.org/2003/role/disclosureRef
-Topic 250
-SubTopic 10
-Name Accounting Standards Codification
-Section 50
-Paragraph 8
-Publisher FASB
-URI https://asc.fasb.org//1943274/2147483443/250-10-50-8
Reference 9: http://www.xbrl.org/2003/role/disclosureRef
-Topic 250
-SubTopic 10
-Name Accounting Standards Codification
-Section 50
-Paragraph 9
-Publisher FASB
-URI https://asc.fasb.org//1943274/2147483443/250-10-50-9
Reference 10: http://www.xbrl.org/2003/role/disclosureRef
-Topic 250
-SubTopic 10
-Name Accounting Standards Codification
-Section 50
-Paragraph 11
-Subparagraph (a)
-Publisher FASB
-URI https://asc.fasb.org//1943274/2147483443/250-10-50-11
Reference 11: http://www.xbrl.org/2003/role/disclosureRef
-Topic 250
-SubTopic 10
-Name Accounting Standards Codification
-Section 50
-Paragraph 11
-Subparagraph (b)
-Publisher FASB
-URI https://asc.fasb.org//1943274/2147483443/250-10-50-11
Reference 12: http://www.xbrl.org/2003/role/disclosureRef
-Topic 250
-SubTopic 10
-Name Accounting Standards Codification
-Section 50
-Paragraph 4
-Publisher FASB
-URI https://asc.fasb.org//1943274/2147483443/250-10-50-4
Reference 13: http://www.xbrl.org/2003/role/exampleRef
-Topic 946
-SubTopic 830
-Name Accounting Standards Codification
-Section 55
-Paragraph 10
-Publisher FASB
-URI https://asc.fasb.org//1943274/2147480167/946-830-55-10
Reference 14: http://www.xbrl.org/2003/role/disclosureRef
-Topic 946
-SubTopic 220
-Name Accounting Standards Codification
-Section 45
-Paragraph 7
-Publisher FASB
-URI https://asc.fasb.org//1943274/2147483581/946-220-45-7
Reference 15: http://www.xbrl.org/2003/role/disclosureRef
-Topic 944
-SubTopic 220
-Name Accounting Standards Codification
-Section S99
-Paragraph 1
-Subparagraph (SX 210.7-04(18))
-Publisher FASB
-URI https://asc.fasb.org//1943274/2147483586/944-220-S99-1
Reference 16: http://www.xbrl.org/2003/role/disclosureRef
-Topic 280
-SubTopic 10
-Name Accounting Standards Codification
-Section 50
-Paragraph 22
-Publisher FASB
-URI https://asc.fasb.org//1943274/2147482810/280-10-50-22
Reference 17: http://www.xbrl.org/2003/role/disclosureRef
-Topic 946
-SubTopic 220
-Name Accounting Standards Codification
-Section S99
-Paragraph 1
-Subparagraph (SX 210.6-07(9))
-Publisher FASB
-URI https://asc.fasb.org//1943274/2147483575/946-220-S99-1
Reference 18: http://www.xbrl.org/2003/role/disclosureRef
-Topic 946
-SubTopic 220
-Name Accounting Standards Codification
-Section S99
-Paragraph 3
-Subparagraph (SX 210.6-09(1)(d))
-Publisher FASB
-URI https://asc.fasb.org//1943274/2147483575/946-220-S99-3
Reference 19: http://www.xbrl.org/2003/role/disclosureRef
-Topic 470
-SubTopic 10
-Name Accounting Standards Codification
-Section S99
-Paragraph 1A
-Subparagraph (SX 210.13-01(a)(4)(i))
-Publisher FASB
-URI https://asc.fasb.org//1943274/2147480097/470-10-S99-1A
Reference 20: http://www.xbrl.org/2009/role/commonPracticeRef
-Topic 470
-SubTopic 10
-Name Accounting Standards Codification
-Section S99
-Paragraph 1A
-Subparagraph (SX 210.13-01(a)(4)(ii))
-Publisher FASB
-URI https://asc.fasb.org//1943274/2147480097/470-10-S99-1A
Reference 21: http://www.xbrl.org/2003/role/disclosureRef
-Topic 470
-SubTopic 10
-Name Accounting Standards Codification
-Section S99
-Paragraph 1A
-Subparagraph (SX 210.13-01(a)(4)(iii)(A))
-Publisher FASB
-URI https://asc.fasb.org//1943274/2147480097/470-10-S99-1A
Reference 22: http://www.xbrl.org/2003/role/disclosureRef
-Topic 470
-SubTopic 10
-Name Accounting Standards Codification
-Section S99
-Paragraph 1A
-Subparagraph (SX 210.13-01(a)(4)(iv))
-Publisher FASB
-URI https://asc.fasb.org//1943274/2147480097/470-10-S99-1A
Reference 23: http://www.xbrl.org/2003/role/disclosureRef
-Topic 470
-SubTopic 10
-Name Accounting Standards Codification
-Section S99
-Paragraph 1A
-Subparagraph (SX 210.13-01(a)(5))
-Publisher FASB
-URI https://asc.fasb.org//1943274/2147480097/470-10-S99-1A
Reference 24: http://www.xbrl.org/2003/role/disclosureRef
-Topic 470
-SubTopic 10
-Name Accounting Standards Codification
-Section S99
-Paragraph 1B
-Subparagraph (SX 210.13-02(a)(4)(i))
-Publisher FASB
-URI https://asc.fasb.org//1943274/2147480097/470-10-S99-1B
Reference 25: http://www.xbrl.org/2003/role/disclosureRef
-Topic 470
-SubTopic 10
-Name Accounting Standards Codification
-Section S99
-Paragraph 1B
-Subparagraph (SX 210.13-02(a)(4)(iii)(A))
-Publisher FASB
-URI https://asc.fasb.org//1943274/2147480097/470-10-S99-1B
Reference 26: http://www.xbrl.org/2003/role/disclosureRef
-Topic 470
-SubTopic 10
-Name Accounting Standards Codification
-Section S99
-Paragraph 1B
-Subparagraph (SX 210.13-02(a)(4)(iii)(B))
-Publisher FASB
-URI https://asc.fasb.org//1943274/2147480097/470-10-S99-1B
Reference 27: http://www.xbrl.org/2003/role/disclosureRef
-Topic 470
-SubTopic 10
-Name Accounting Standards Codification
-Section S99
-Paragraph 1B
-Subparagraph (SX 210.13-02(a)(4)(iv))
-Publisher FASB
-URI https://asc.fasb.org//1943274/2147480097/470-10-S99-1B
Reference 28: http://www.xbrl.org/2003/role/disclosureRef
-Topic 470
-SubTopic 10
-Name Accounting Standards Codification
-Section S99
-Paragraph 1B
-Subparagraph (SX 210.13-02(a)(5))
-Publisher FASB
-URI https://asc.fasb.org//1943274/2147480097/470-10-S99-1B
Reference 29: http://www.xbrl.org/2003/role/disclosureRef
-Topic 280
-SubTopic 10
-Name Accounting Standards Codification
-Section 50
-Paragraph 30
-Subparagraph (b)
-Publisher FASB
-URI https://asc.fasb.org//1943274/2147482810/280-10-50-30
Reference 30: http://www.xbrl.org/2003/role/disclosureRef
-Topic 280
-SubTopic 10
-Name Accounting Standards Codification
-Section 50
-Paragraph 32
-Subparagraph (f)
-Publisher FASB
-URI https://asc.fasb.org//1943274/2147482810/280-10-50-32
Reference 31: http://www.xbrl.org/2003/role/disclosureRef
-Topic 260
-SubTopic 10
-Name Accounting Standards Codification
-Section 45
-Paragraph 60B
-Subparagraph (a)
-Publisher FASB
-URI https://asc.fasb.org//1943274/2147482689/260-10-45-60B
Reference 32: http://www.xbrl.org/2003/role/exampleRef
-Topic 280
-SubTopic 10
-Name Accounting Standards Codification
-Section 50
-Paragraph 31
-Publisher FASB
-URI https://asc.fasb.org//1943274/2147482810/280-10-50-31
Reference 33: http://www.xbrl.org/2003/role/disclosureRef
-Topic 280
-SubTopic 10
-Name Accounting Standards Codification
-Section 50
-Paragraph 32
-Subparagraph (c)
-Publisher FASB
-URI https://asc.fasb.org//1943274/2147482810/280-10-50-32
Reference 34: http://www.xbrl.org/2003/role/disclosureRef
-Topic 205
-SubTopic 20
-Name Accounting Standards Codification
-Section 50
-Paragraph 7
-Publisher FASB
-URI https://asc.fasb.org//1943274/2147483499/205-20-50-7
Reference 35: http://fasb.org/us-gaap/role/ref/legacyRef
-Topic 230
-SubTopic 10
-Name Accounting Standards Codification
-Section 45
-Paragraph 28
-Publisher FASB
-URI https://asc.fasb.org//1943274/2147482740/230-10-45-28
Reference 36: http://www.xbrl.org/2003/role/disclosureRef
-Topic 220
-SubTopic 10
-Name Accounting Standards Codification
-Section 45
-Paragraph 1A
-Subparagraph (a)
-Publisher FASB
-URI https://asc.fasb.org//1943274/2147482790/220-10-45-1A
Reference 37: http://www.xbrl.org/2003/role/disclosureRef
-Topic 220
-SubTopic 10
-Name Accounting Standards Codification
-Section 45
-Paragraph 1B
-Subparagraph (a)
-Publisher FASB
-URI https://asc.fasb.org//1943274/2147482790/220-10-45-1B
Reference 38: http://fasb.org/us-gaap/role/ref/legacyRef
-Topic 220
-SubTopic 10
-Name Accounting Standards Codification
-Section S99
-Paragraph 2
-Subparagraph (SX 210.5-03(20))
-Publisher FASB
-URI https://asc.fasb.org//1943274/2147483621/220-10-S99-2
Reference 39: http://fasb.org/us-gaap/role/ref/legacyRef
-Topic 942
-SubTopic 220
-Name Accounting Standards Codification
-Section S99
-Paragraph 1
-Subparagraph (SX 210.9-04(22))
-Publisher FASB
-URI https://asc.fasb.org//1943274/2147483589/942-220-S99-1
| Name: |
us-gaap_NetIncomeLoss |
| Namespace Prefix: |
us-gaap_ |
| Data Type: |
xbrli:monetaryItemType |
| Balance Type: |
credit |
| Period Type: |
duration |
|
| X |
- DefinitionThe cash inflow from the issuance of a long-term debt instrument which can be exchanged for a specified amount of another security, typically the entity's common stock, at the option of the issuer or the holder. Reference 1: http://fasb.org/us-gaap/role/ref/legacyRef
-Name Accounting Standards Codification
-Topic 230
-SubTopic 10
-Section 45
-Paragraph 14
-Subparagraph (b)
-Publisher FASB
-URI https://asc.fasb.org//1943274/2147482740/230-10-45-14
| Name: |
us-gaap_ProceedsFromConvertibleDebt |
| Namespace Prefix: |
us-gaap_ |
| Data Type: |
xbrli:monetaryItemType |
| Balance Type: |
debit |
| Period Type: |
duration |
|
| X |
- DefinitionProceeds from issuance of capital stock which provides for a specific dividend that is paid to the shareholders before any dividends to common stockholders and which takes precedence over common stockholders in the event of liquidation. Reference 1: http://fasb.org/us-gaap/role/ref/legacyRef
-Name Accounting Standards Codification
-Section 45
-Paragraph 14
-Subparagraph (a)
-SubTopic 10
-Topic 230
-Publisher FASB
-URI https://asc.fasb.org//1943274/2147482740/230-10-45-14
| Name: |
us-gaap_ProceedsFromIssuanceOfPreferredStockAndPreferenceStock |
| Namespace Prefix: |
us-gaap_ |
| Data Type: |
xbrli:monetaryItemType |
| Balance Type: |
debit |
| Period Type: |
duration |
|
| X |
- DefinitionThe cash inflow from the issuance of common stock, preferred stock, treasury stock, stock options, and other types of equity. Reference 1: http://fasb.org/us-gaap/role/ref/legacyRef
-Name Accounting Standards Codification
-Section 45
-Paragraph 14
-Subparagraph (a)
-SubTopic 10
-Topic 230
-Publisher FASB
-URI https://asc.fasb.org//1943274/2147482740/230-10-45-14
Reference 2: http://www.xbrl.org/2003/role/disclosureRef
-Topic 946
-SubTopic 10
-Name Accounting Standards Codification
-Section S99
-Paragraph 3
-Subparagraph (SX 210.6-03(i)(1))
-Publisher FASB
-URI https://asc.fasb.org//1943274/2147479886/946-10-S99-3
| Name: |
us-gaap_ProceedsFromIssuanceOrSaleOfEquity |
| Namespace Prefix: |
us-gaap_ |
| Data Type: |
xbrli:monetaryItemType |
| Balance Type: |
debit |
| Period Type: |
duration |
|
| X |
- DefinitionThe cash inflow from a borrowing supported by a written promise to pay an obligation. Reference 1: http://fasb.org/us-gaap/role/ref/legacyRef
-Name Accounting Standards Codification
-Topic 230
-SubTopic 10
-Section 45
-Paragraph 14
-Subparagraph (b)
-Publisher FASB
-URI https://asc.fasb.org//1943274/2147482740/230-10-45-14
| Name: |
us-gaap_ProceedsFromNotesPayable |
| Namespace Prefix: |
us-gaap_ |
| Data Type: |
xbrli:monetaryItemType |
| Balance Type: |
debit |
| Period Type: |
duration |
|
| X |
- DefinitionThe cash outflow for a borrowing supported by a written promise to pay an obligation. Reference 1: http://fasb.org/us-gaap/role/ref/legacyRef
-Name Accounting Standards Codification
-Topic 230
-SubTopic 10
-Section 45
-Paragraph 15
-Subparagraph (b)
-Publisher FASB
-URI https://asc.fasb.org//1943274/2147482740/230-10-45-15
| Name: |
us-gaap_RepaymentsOfNotesPayable |
| Namespace Prefix: |
us-gaap_ |
| Data Type: |
xbrli:monetaryItemType |
| Balance Type: |
credit |
| Period Type: |
duration |
|
| X |
- DefinitionThe fair value of stock issued in noncash financing activities. Reference 1: http://fasb.org/us-gaap/role/ref/legacyRef
-Name Accounting Standards Codification
-Topic 230
-SubTopic 10
-Section 50
-Paragraph 4
-Publisher FASB
-URI https://asc.fasb.org//1943274/2147482913/230-10-50-4
Reference 2: http://fasb.org/us-gaap/role/ref/legacyRef
-Name Accounting Standards Codification
-Topic 230
-SubTopic 10
-Section 50
-Paragraph 3
-Publisher FASB
-URI https://asc.fasb.org//1943274/2147482913/230-10-50-3
Reference 3: http://fasb.org/us-gaap/role/ref/legacyRef
-Name Accounting Standards Codification
-Topic 230
-SubTopic 10
-Section 50
-Paragraph 5
-Publisher FASB
-URI https://asc.fasb.org//1943274/2147482913/230-10-50-5
| Name: |
us-gaap_StockIssued1 |
| Namespace Prefix: |
us-gaap_ |
| Data Type: |
xbrli:monetaryItemType |
| Balance Type: |
credit |
| Period Type: |
duration |
|
| X |
- DefinitionThe gross value of stock issued during the period upon the conversion of convertible securities. Reference 1: http://fasb.org/us-gaap/role/ref/legacyRef
-Name Accounting Standards Codification
-Section 50
-Paragraph 2
-SubTopic 10
-Topic 505
-Publisher FASB
-URI https://asc.fasb.org//1943274/2147481112/505-10-50-2
Reference 2: http://fasb.org/us-gaap/role/ref/legacyRef
-Topic 505
-SubTopic 10
-Name Accounting Standards Codification
-Section S99
-Paragraph 1
-Subparagraph (SX 210.3-04)
-Publisher FASB
-URI https://asc.fasb.org//1943274/2147480008/505-10-S99-1
Reference 3: http://fasb.org/us-gaap/role/ref/legacyRef
-Name Accounting Standards Codification
-Topic 210
-SubTopic 10
-Section S99
-Paragraph 1
-Subparagraph (SX 210.5-02.29-31)
-Publisher FASB
-URI https://asc.fasb.org//1943274/2147480566/210-10-S99-1
| Name: |
us-gaap_StockIssuedDuringPeriodValueConversionOfConvertibleSecurities |
| Namespace Prefix: |
us-gaap_ |
| Data Type: |
xbrli:monetaryItemType |
| Balance Type: |
credit |
| Period Type: |
duration |
|
v3.23.2
NATURE OF BUSINESS AND BASIS OF PRESENTATION
|
12 Months Ended |
Dec. 31, 2022 |
|---|
| NATURE OF BUSINESS AND BASIS OF PRESENTATION |
|
| NATURE OF BUSINESS AND BASIS OF PRESENTATION |
NOTE 1 – NATURE OF BUSINESS AND BASIS OF PRESENTATION Ocean Thermal Energy Corporation is currently in the businesses of: | · | OTEC and SWAC/LSC-designing ocean thermal energy conversion (“OTEC”) power plants and seawater air conditioning and lake water air conditioning (“SWAC/LSC”) plants for large commercial properties, utilities, and municipalities. These technologies provide practical solutions to mankind’s three oldest and most fundamental needs: clean drinking water, plentiful food, and sustainable, affordable energy without the use of fossil fuels. OTEC is a clean technology that continuously extracts energy from the temperature difference between warm surface ocean water and cold deep seawater. In addition to producing electricity, some of the seawater running through an OTEC plant can be efficiently desalinated using the power generated by the OTEC technology, producing thousands of cubic meters of fresh water every day for use in agriculture and human consumption in the communities served by its plants. This cold, deep, nutrient-rich water can also be used to cool buildings (SWAC/LSC) and for fish farming/aquaculture. In short, it is a technology with many benefits, and its versatility makes OTEC unique. | | | | | · | EcoVillages-developing and commercializing our EcoVillages, as well as working to develop or acquire new complementary assets. EcoVillages are communities whose goal is to become more socially, economically, and ecologically sustainable and whose inhabitants seek to live according to ecological principles, causing as little impact on the environment as possible. We expect that our EcoVillage communities will range from a population of 50 to 150 individuals, although some may be smaller. We may also form larger EcoVillages, of up to 2,000 individuals, as networks of smaller subcommunities. We expect that our EcoVillages will grow by the addition of individuals, families, or other small groups. We expect to use our technology in the development of our EcoVillages, which should add significant value to this line of business. |
The consolidated financial statements include the accounts of the company and our wholly owned subsidiaries. Intercompany accounts and transactions have been eliminated in consolidation. In the opinion of management, our financial statements reflect all adjustments that are of a normal recurring nature necessary for presentation of financial statements in accordance with U.S. generally accepted accounting principles (GAAP).
|
| X |
- References
+ Details
| Name: |
cpwr_NatureOfBusinessAndBasisOfPresentationAbstract |
| Namespace Prefix: |
cpwr_ |
| Data Type: |
xbrli:stringItemType |
| Balance Type: |
na |
| Period Type: |
duration |
|
| X |
- DefinitionThe entire disclosure for organization, consolidation and basis of presentation of financial statements disclosure. Reference 1: http://www.xbrl.org/2003/role/disclosureRef
-Topic 946
-SubTopic 10
-Name Accounting Standards Codification
-Section 50
-Paragraph 1
-Publisher FASB
-URI https://asc.fasb.org//1943274/2147480424/946-10-50-1
Reference 2: http://www.xbrl.org/2003/role/disclosureRef
-Topic 946
-SubTopic 10
-Name Accounting Standards Codification
-Section 50
-Paragraph 2
-Publisher FASB
-URI https://asc.fasb.org//1943274/2147480424/946-10-50-2
Reference 3: http://fasb.org/us-gaap/role/ref/legacyRef
-Topic 810
-Name Accounting Standards Codification
-Publisher FASB
-URI https://asc.fasb.org//810/tableOfContent
Reference 4: http://fasb.org/us-gaap/role/ref/legacyRef
-Topic 205
-Name Accounting Standards Codification
-Publisher FASB
-URI https://asc.fasb.org//205/tableOfContent
| Name: |
us-gaap_OrganizationConsolidationAndPresentationOfFinancialStatementsDisclosureTextBlock |
| Namespace Prefix: |
us-gaap_ |
| Data Type: |
dtr-types:textBlockItemType |
| Balance Type: |
na |
| Period Type: |
duration |
|
v3.23.2
SUMMARY OF SIGNIFICANT ACCOUNTING POLICIES
|
12 Months Ended |
Dec. 31, 2022 |
|---|
| SUMMARY OF SIGNIFICANT ACCOUNTING POLICIES |
|
| SUMMARY OF SIGNIFICANT ACCOUNTING POLICIES |
NOTE 2: SUMMARY OF SIGNIFICANT ACCOUNTING POLICIES Principles of Consolidation The financial statements include the accounts of the company and its wholly owned subsidiaries Ocean Thermal Energy Bahamas Ltd., OTE BM Ltd. and OCEES International Inc. Intercompany balances and transactions have been eliminated in consolidation. Our consolidated financial statements for the years ended December 31, 2022 and 2021, include the following subsidiaries: Name | | Place of Incorporation / Establishment | | Principal Activities | | Date Formed | Ocean Thermal Energy Bahamas Ltd. | | Bahamas | | Intermediate holding company of OTE BM Ltd. and OTE Bahamas O&M Ltd. | | 07/04/2011 | | | | | | | | OTE BM Ltd. | | Bahamas | | OTEC/SDC development in the Bahamas | | 09/07/2011 | | | | | | | | OCEES International Inc. | | Hawaii, USA | | Research and development for the Pacific Rim | | 01/21/1998 |
We have an effective interest of 100% in each of our subsidiaries. Agreement to Sell Subsidiary On August 25, 2022, we entered into a Stock Purchase Agreement to sell OCEES International, Inc. (“OCEES”), to Epaphus Global Energy, LLC (“Epaphus”). Epaphus is controlled by Jeremy Feakins, our Chief Executive Officer and a director. The transaction was approved unanimously by our directors who do not have an interest in the transaction. In exchange for the sale of OCEES, we will receive: | • | $1,000,000 in the form of canceled amounts owed by us to certain individuals, including Mr. Feakins, who have assigned their right to receive those payments to Epaphus; | | • | $75,000 in cash per month for 12 months following the date of the purchase agreement; and | | • | 70% of the net profit of any currently contemplated project to build an ocean thermal energy conversion power plants entered into by OCEES. |
Under the terms of the purchase agreement, Epaphus has the unilateral right to return OCEES to us and receive a full refund of all portions of the purchase price paid as of the return of OCEES at any time for year following the date of the purchase agreement. The purchase agreement has not yet closed. Use of Estimates In preparing financial statements in conformity with GAAP, management is required to make estimates and assumptions that affect the reported amounts of assets and liabilities and the disclosure of contingent assets and liabilities at the date of the financial statements and revenues and expenses during the reported period. Actual results could differ from those estimates. Significant estimates include the assumptions used in the valuation of equity-based transactions, valuation of derivative liabilities, and valuation of deferred tax assets. Cash and Cash Equivalents We consider all highly liquid temporary cash investments with an original maturity of three months or less to be cash equivalents. We had no cash equivalents at December 31, 2022 and 2021. Income Taxes We use the liability method of accounting for income taxes. Under the liability method, deferred tax assets and liabilities are determined based on temporary differences between financial reporting and tax bases of assets and liabilities and on the amount of operating loss carry-forwards and are measured using the enacted tax rates and laws that will be in effect when the temporary differences and carry-forwards are expected to reverse. An allowance against deferred tax assets is recorded when it is more likely than not that such tax benefits will not be realized. Our ability to use our net operating loss carryforwards may be substantially limited due to ownership change limitations that may have occurred or that could occur in the future, as required by Section 382 of the Internal Revenue Code of 1986, as amended (the “Code”), as well as similar state provisions. These ownership changes may limit the amount of net operating loss that can be utilized annually to offset future taxable income and tax, respectively. In general, an “ownership change” as defined by Section 382 of the Code results from a transaction or series of transactions over a three-year period resulting in an ownership change of more than 50.0% of the outstanding stock of a company by certain stockholders or public groups. We have not completed a study to assess whether an ownership change has occurred or whether there have been multiple ownership changes since we became a “loss corporation” under the definition of Section 382. If we have experienced an ownership change, utilization of the net operating loss carryforwards would be subject to an annual limitation under Section 382 of the Code, which is determined by first multiplying the value of our stock at the time of the ownership change by the applicable long-term, tax-exempt rate, and then could be subject to additional adjustments, as required. Any limitation may result in expiration of a portion of the net operating loss carryforwards before utilization. Further, until a study is completed and any limitation known, no positions related to limitations are being considered as an uncertain tax position or disclosed as an unrecognized tax benefit. Any carryforwards that expire prior to utilization as a result of such limitations will be removed from deferred tax assets with a corresponding reduction of the valuation allowance. Due to the existence of the valuation allowance, it is not expected that any possible limitation will have an impact on our results of operations or financial position. Business Segments We operate in one segment and, therefore, segment information is not presented. Fair Value Financial Accounting Standards Board Accounting Standard Codification (“ASC”) Topic 820, Fair Value Measurements and Disclosures, defines fair value, establishes a framework for measuring fair value under GAAP, and enhances disclosures about fair value measurements. ASC 820 describes a fair value hierarchy based on three levels of inputs, of which the first two are considered observable and the last unobservable, that may be used to measure fair value, which are the following: | · | Level 1-Pricing inputs are quoted prices available in active markets for identical assets or liabilities as of the reporting date. | | · | Level 2-Pricing inputs are quoted for similar assets or inputs that are observable, either directly or indirectly, for substantially the full term through corroboration with observable market data. Level 2 includes assets or liabilities valued at quoted prices adjusted for legal or contractual restrictions specific to these investments. | | · | Level 3-Pricing inputs are unobservable for the assets or liabilities; that is, the inputs reflect the reporting entity’s own assumptions about the assumptions market participants would use in pricing the asset or liability. |
Management believes the carrying amounts of the short-term financial instruments, including cash and cash equivalents, prepaid expenses, accounts payable, accrued liabilities, notes payable, and other liabilities, reflected in the accompanying balance sheets, approximate fair value at December 31, 2022 and December 31, 2021, due to the relatively short-term nature of these instruments. We accounted for derivative liability at fair value on a recurring basis under Level 3 at December 31, 2022 and 2021 (see Note 5). Concentrations Cash, cash equivalents, and restricted cash are deposited with major financial institutions, and at times, such balances with any one financial institution may be in excess of FDIC-insured limits. As of December 31, 2022 and 2021, no balances exceeded FDIC-insured limits. Loss per Share Basic loss per share is calculated by dividing our net loss available to common shareholders by the weighted average number of common shares during the period. Diluted loss per share is calculated by dividing our net loss by the diluted weighted average number of shares outstanding during the period. The diluted weighted average number of shares outstanding is the basic weighted number of shares adjusted for any potentially dilutive debt or equity. The following potentially dilutive securities have been excluded from the computation of diluted weighted average shares outstanding as of December 31, 2022 and 2021, as they would be anti-dilutive: | | Years Ended December 31, | | | | 2022 | | | 2021 | | Shares underlying warrants outstanding | | | 125,073 | | | | 125,073 | | Shares underlying convertible notes outstanding | | | 836,901,049 | | | | 925,654,995 | | Shares underlying convertible preferred stock outstanding | | | 16,687,500 | | | | 16,687,500 | | | | | 853,713,622 | | | | 942,467,568 | |
Revenue Recognition We account for our revenue in accordance with Accounting Standard Update 2014-09, Revenue from Contracts with Customers (Topic 606), which requires a company to recognize revenue to depict the transfer of goods or services to a customer at an amount that reflects the consideration it expects to receive in exchange for those goods or services. Reclassifications Certain prior-year amounts have been reclassified to conform to the current period presentation. Recent Accounting Pronouncements We have reviewed all recently issued, but not yet adopted, accounting standards in order to determine their effects, if any, on our consolidated results of operations, financial position, and cash flows. Based on that review, we believe that none of these pronouncements will have a significant effect on current or future earnings or operations.
|
| X |
- References
+ Details
| Name: |
cpwr_NoteSummaryOfSignificantAccountingPoliciesAbstract |
| Namespace Prefix: |
cpwr_ |
| Data Type: |
xbrli:stringItemType |
| Balance Type: |
na |
| Period Type: |
duration |
|
| X |
- References
+ Details
| Name: |
cpwr_SummaryOfSignificantAccountingPoliciesTextBlock |
| Namespace Prefix: |
cpwr_ |
| Data Type: |
nonnum:textBlockItemType |
| Balance Type: |
na |
| Period Type: |
duration |
|
v3.23.2
GOING CONCERN
|
12 Months Ended |
Dec. 31, 2022 |
|---|
| GOING CONCERN |
|
| GOING CONCERN |
NOTE 3 – GOING CONCERN The accompanying audited consolidated financial statements have been prepared on the assumption that we will continue as a going concern. As reflected in the accompanying consolidated financial statements, we had a net loss of $6,912,102 and used $327,213 of cash in operating activities for the year ended December 31, 2022. We had a working capital deficiency of $36,199,026 and a stockholders’ deficiency of $36,199,026 as of December 31, 2022. These factors raise substantial doubt about our ability to continue as a going concern. Our ability to continue as a going concern is dependent on our ability to increase sales and obtain external funding for our projects under development. We continue to apply for grant funding from the U.S. Department of Energy. Our applications focus on desalinated water, ammonia, and hydrogen production from an OTEC facility. On March 11, 2022, President Biden signed a bill that provides $162 million for the Water Power Technologies Office budget. About $112 million of that money is slated for marine energy. We plan to apply for funding to support projects where our technology would apply. The financial statements do not include any adjustments that may result from the outcome of this uncertainty.
|
| X |
- References
+ Details
| Name: |
cpwr_GoingConcernAbstract |
| Namespace Prefix: |
cpwr_ |
| Data Type: |
xbrli:stringItemType |
| Balance Type: |
na |
| Period Type: |
duration |
|
| X |
- DefinitionThe entire disclosure when substantial doubt is raised about the ability to continue as a going concern. Includes, but is not limited to, principal conditions or events that raised substantial doubt about the ability to continue as a going concern, management's evaluation of the significance of those conditions or events in relation to the ability to meet its obligations, and management's plans that alleviated or are intended to mitigate the conditions or events that raise substantial doubt about the ability to continue as a going concern. Reference 1: http://fasb.org/us-gaap/role/ref/legacyRef
-Topic 205
-SubTopic 40
-Name Accounting Standards Codification
-Publisher FASB
-URI https://asc.fasb.org//205-40/tableOfContent
| Name: |
us-gaap_SubstantialDoubtAboutGoingConcernTextBlock |
| Namespace Prefix: |
us-gaap_ |
| Data Type: |
dtr-types:textBlockItemType |
| Balance Type: |
na |
| Period Type: |
duration |
|
v3.23.2
CONVERTIBLE NOTES AND NOTES PAYABLE
|
12 Months Ended |
Dec. 31, 2022 |
|---|
| CONVERTIBLE NOTES AND NOTES PAYABLE |
|
| CONVERTIBLE NOTES AND NOTES PAYABLE |
NOTE 4 – CONVERTIBLE NOTES AND NOTES PAYABLE During the year ended December 31, 2022, $215,000 of notes and $66,126 of related accrued interest were converted into 143 shares of Series D Preferred Stock. During the year ended December 31, 2022, $60,650 of notes and $1,946 of related accrued interest were converted into 10,847,262 shares of common stock. Of this common stock, 847,262 shares were borrowed from our CEO to enable the conversions. We have accrued a liability for the shares to be reissued to our CEO in the amount of $11,014, the fair value of the shares on the date of conversion. The replacement shares have not been issued at December 31, 2022. During the year ended December 30, 2021, $419,179 of notes were converted into 34,829,587 shares of common stock. The following convertible notes and notes payable were outstanding at December 31, 2022: Date of | | | Maturity | | | Interest | | | In | | Original | | | Principal at December 31, | | | Discount at December 31, | | | Carrying Amount at December 31, | | | Related Party | | | Non Related Party | | Issuance | | | Date | | | Rate | | | Default | | Principal | | | 2022 | | | 2022 | | | 2022 | | | Current | | | Long-Term | | | Current | | | Long-Term | | 12/01/07 | | | 09/01/15 | | | | 7.00 | % | | Yes | | | 125,000 | | | | 85,821 | | | | - | | | | 85,821 | | | | - | | | | - | | | | 85,821 | | | | - | | 09/25/09 | | | 10/25/11 | | | | 5.00 | % | | Yes | | | 50,000 | | | | 50,000 | | | | - | | | | 50,000 | | | | - | | | | - | | | | 50,000 | | | | - | | 12/23/09 | | | 12/23/14 | | | | 7.00 | % | | Yes | | | 100,000 | | | | 83,166 | | | | - | | | | 83,166 | | | | - | | | | - | | | | 83,166 | | | | - | | 12/23/09 | | | 12/23/14 | | | | 7.00 | % | | Yes | | | 25,000 | | | | 22,233 | | | | - | | | | 22,233 | | | | - | | | | - | | | | 22,233 | | | | - | | 12/23/09 | | | 12/23/14 | | | | 7.00 | % | | Yes | | | 25,000 | | | | 22,223 | | | | - | | | | 22,223 | | | | - | | | | - | | | | 22,223 | | | | - | | 02/03/12 | | | 12/31/19 | | | | 10.00 | % | | Yes | | | 1,000,000 | | | | 1,000,000 | | | | - | | | | 1,000,000 | | | | - | | | | - | | | | 1,000,000 | | | | - | | 08/15/13 | | | 10/31/23 | | | | 10.00 | % | | No | | | 158,334 | | | | 158,334 | | | | - | | | | 158,334 | | | | - | | | | - | | | | 158,334 | | | | - | | 12/31/13 | | | 12/31/15 | | | | 8.00 | % | | Yes | | | 290,000 | | | | 130,000 | | | | - | | | | 130,000 | | | | - | | | | - | | | | 130,000 | | | | - | | 04/01/14 | | | 12/31/18 | | | | 10.00 | % | | Yes | | | 2,265,000 | | | | 1,102,500 | | | | - | | | | 1,102,500 | | | | 1,102,500 | | | | - | | | | - | | | | - | | 12/22/14 | | | 03/31/15 | | | | 22.00 | %* | | Yes | | | 200,000 | | | | 200,000 | | | | - | | | | 200,000 | | | | - | | | | - | | | | 200,000 | | | | - | | 12/26/14 | | | 12/26/15 | | | | 22.00 | %* | | Yes | | | 100,000 | | | | 100,000 | | | | - | | | | 100,000 | | | | - | | | | - | | | | 100,000 | | | | - | | 03/12/15 | | | (1) | | | | 6.00 | % | | No | | | 394,380 | | | | 394,380 | | | | - | | | | 394,380 | | | | 394,380 | | | | - | | | | - | | | | - | | 04/07/15 | | | 04/07/18 | | | | 10.00 | % | | Yes | | | 50,000 | | | | 50,000 | | | | - | | | | 50,000 | | | | - | | | | - | | | | 50,000 | | | | - | | 11/23/15 | | | (1) | | | | 6.00 | % | | No | | | 50,000 | | | | 50,000 | | | | - | | | | 50,000 | | | | 50,000 | | | | - | | | | - | | | | - | | 02/25/16 | | | (1) | | | | 6.00 | % | | No | | | 50,000 | | | | 50,000 | | | | - | | | | 50,000 | | | | 50,000 | | | | - | | | | - | | | | - | | 05/20/16 | | | (1) | | | | 6.00 | % | | No | | | 50,000 | | | | 50,000 | | | | - | | | | 50,000 | | | | 50,000 | | | | - | | | | - | | | | - | | 10/20/16 | | | (1) | | | | 6.00 | % | | No | | | 37,500 | | | | 12,500 | | | | - | | | | 12,500 | | | | 12,500 | | | | - | | | | - | | | | - | | 10/20/16 | | | (1) | | | | 6.00 | % | | No | | | 12,500 | | | | 12,500 | | | | - | | | | 12,500 | | | | 12,500 | | | | - | | | | - | | | | - | | 12/21/16 | | | (1) | | | | 6.00 | % | | No | | | 25,000 | | | | 25,000 | | | | - | | | | 25,000 | | | | 25,000 | | | | - | | | | - | | | | - | | 03/09/17 | | | (1) | | | | 10.00 | % | | No | | | 200,000 | | | | 177,000 | | | | - | | | | 177,000 | | | | 177,000 | | | | - | | | | - | | | | - | | 07/13/17 | | | 07/13/19 | | | | 6.00 | % | | Yes | | | 25,000 | | | | 25,000 | | | | - | | | | 25,000 | | | | - | | | | - | | | | 25,000 | | | | - | | 07/18/17 | | | 07/18/19 | | | | 6.00 | % | | Yes | | | 25,000 | | | | 25,000 | | | | - | | | | 25,000 | | | | - | | | | - | | | | 25,000 | | | | - | | 07/26/17 | | | 07/26/19 | | | | 6.00 | % | | Yes | | | 15,000 | | | | 15,000 | | | | - | | | | 15,000 | | | | - | | | | - | | | | 15,000 | | | | - | | 12/20/17 | | | (2) | | | | 10.00 | % | | Yes | | | 979,156 | | | | 859,156 | | | | - | | | | 859,156 | | | | - | | | | - | | | | 859,156 | | | | - | | 11/06/17 | | | 12/31/18 | | | | 10.00 | % | | Yes | | | 646,568 | | | | 543,093 | | | | - | | | | 543,093 | | | | 543,093 | | | | - | | | | - | | | | - | | 02/19/18 | | | (3) | | | | 18.00 | %* | | Yes | | | 629,451 | | | | 1,161,136 | | | | - | | | | 1,161,136 | | | | - | | | | - | | | | 1,161,136 | | | | - | | 09/19/18 | | | 09/28/21 | | | | 6.00 | % | | Yes | | | 10,000 | | | | 10,000 | | | | - | | | | 10,000 | | | | - | | | | - | | | | 10,000 | | | | - | | 12/14/18 | | | 12/22/18 | | | | 24.00 | %* | | Yes | | | 474,759 | | | | 578,075 | | | | - | | | | 578,075 | | | | - | | | | - | | | | 578,075 | | | | - | | 01/02/19 | | | (4) | | | | 17.00 | % | | No | | | 310,000 | | | | 310,000 | | | | - | | | | 310,000 | | | | - | | | | - | | | | 310,000 | | | | - | | 08/14/19 | | | 10/31/2021 | | | | 8.00 | % | | Yes | | | 26,200 | | | | 26,200 | | | | - | | | | 26,200 | | | | - | | | | - | | | | 26,200 | | | | - | | (5) | | | 10/31/2021 | | | | 8.00 | % | | Yes | | | 105,000 | | | | 75,000 | | | | - | | | | 75,000 | | | | 5,000 | | | | - | | | | 70,000 | | | | - | | (6) | | | 01/02/22 | | | | 8.00 | % | | Yes | | | 296,750 | | | | 231,750 | | | | - | | | | 231,750 | | | | 15,000 | | | | - | | | | 216,750 | | | | - | | (8) | | | 05/12/22 | | | | 8.00 | % | | Yes | | | 15,000 | | | | 15,000 | | | | - | | | | 15,000 | | | | - | | | | - | | | | 15,000 | | | | - | | (9) | | | 09/01/22 | | | | 8.00 | % | | Yes | | | 170,000 | | | | 155,000 | | | | - | | | | 155,000 | | | | - | | | | - | | | | 155,000 | | | | - | | (10) | | | 08/30/23 | | | | 8.00 | % | | No | | | 285,000 | | | | 285,000 | | | | 87,233 | | | | 197,767 | | | | 3,528 | | | | - | | | | 194,239 | | | | - | | (11) | | | 11/30/23 | | | | 8.00 | % | | No | | | 5,000 | | | | 5,000 | | | | 1,307 | | | | 3,693 | | | | 3,693 | | | | - | | | | - | | | | - | | (7) | | | (7) | | | | 10.00 | % | | No | | | 625,000 | | | | 625,000 | | | | - | | | | 625,000 | | | | - | | | | - | | | | 625,000 | | | | - | | | | | | | | | | | | | | $ | 9,850,598 | | | $ | 8,720,067 | | | $ | 88,540 | | | $ | 8,631,527 | | | $ | 2,444,194 | | | $ | - | | | $ | 6,187,333 | | | $ | - | |
(1) | Maturity date is 90 days after demand. | (2) | Bridge loans were issued at dates between December 2017 and May 2018. Principal is due on the earlier of 18 months from the anniversary date or the completion of L2 financing with gross proceeds of a minimum of $1.5 million. | (3) | L2 - Note was drawn down in five tranches between 02/16/18 and 05/02/18. | (4) | Loans were issued from 01/02/19 to 03/23/19. Principal and interest are due when funds are received from the litigation between Ocean Thermal Energy Corporation vs. Robert Coe, et al. | (5) | Notes were issued between 10/14/19 and 11/05/19. The notes bear an interest rate of 8% and mature 10/31/21. They can be converted into 250,000 shares of common stock. They can be converted when the stock closing price reaches $1 or on the maturity, whichever occurs first. | (6) | Notes were issued between 12/09/19 and 11/25/20. The notes bear an interest rate of 8% and mature 01/02/22. They can be converted into 250,000 shares of common stock. They can be converted when the stock closing price reaches $1 or on the maturity, whichever occurs first. | (7) | Notes were issued between 11/02/20 and 03/18/21. The notes bear an interest rate of 10%. Repayment will be made as follows: (i) the principal and interest within five business days following our receipt of $25.5 million from the Robert Coe, et al. Phase One Litigation; and (ii) the additional payment within five business days following our actual receipt of any funds from the Robert Coe, et al, Phase Two Litigation, less legal fees accrued up to that date. Payment will be made as such funds are actually received by us and after deductions of accrued legal fees up to that date. | (8) | Notes were issued between 05/14/20 and 08/11/20. The notes bear an interest rate of 8% and mature 05/12/22. They can be converted into 250,000 shares of common stock. They can be converted when the stock closing price reaches $1 or on the maturity, whichever occurs first. | (9) | Notes were issued in November 2020 and during the first two quarters of 2021. The notes bear an interest rate of 8% and mature 09/01/22. They can be converted into 250,000 shares of common stock. They can be converted when the stock closing price reaches $1 or on the maturity, whichever occurs first. | (10) | Notes were issued during the third quarter of 2021. The notes bear an interest rate of 8% and mature 08/30/23. They can be converted into 250,000 shares of common stock. They can be converted when the stock closing price reaches $1 or on the maturity, whichever occurs first. | (11) | Note was issued during November of 2021. The note bears an interest rate of 8% and matures 11/30/23. It can be converted into 250,000 shares of common stock. It can be converted when the stock closing price reaches $1 or on the maturity, whichever occurs first. | * | Default interest rate. |
The following convertible notes and notes payable were outstanding at December 31, 2021: Date of | | | Maturity | | | Interest | | | In | | Original | | | Principal at December 31, | | | Discount at December 31, | | | Carrying Amount at December 31 | | | Related Party | | | Non Related Party | | Issuance | | | Date | | | Rate | | | Default | | Principal | | | 2021 | | | 2021 | | | 2021 | | | Current | | | Long-Term | | | Current | | | Long-Term | | 12/01/07 | | | 09/01/15 | | | | 7.00 | % | | Yes | | | 125,000 | | | | 85,821 | | | | - | | | | 85,821 | | | | - | | | | - | | | | 85,821 | | | | - | | 09/25/09 | | | 10/25/11 | | | | 5.00 | % | | Yes | | | 50,000 | | | | 50,000 | | | | - | | | | 50,000 | | | | - | | | | - | | | | 50,000 | | | | - | | 12/23/09 | | | 12/23/14 | | | | 7.00 | % | | Yes | | | 100,000 | | | | 94,414 | | | | - | | | | 94,414 | | | | - | | | | - | | | | 94,414 | | | | - | | 12/23/09 | | | 12/23/14 | | | | 7.00 | % | | Yes | | | 25,000 | | | | 23,620 | | | | - | | | | 23,620 | | | | - | | | | - | | | | 23,620 | | | | - | | 12/23/09 | | | 12/23/14 | | | | 7.00 | % | | Yes | | | 25,000 | | | | 23,610 | | | | - | | | | 23,610 | | | | - | | | | - | | | | 23,610 | | | | - | | 02/03/12 | | | 12/31/19 | | | | 10.00 | % | | Yes | | | 1,000,000 | | | | 1,000,000 | | | | - | | | | 1,000,000 | | | | - | | | | - | | | | 1,000,000 | | | | - | | 08/15/13 | | | 10/31/23 | | | | 10.00 | % | | No | | | 158,334 | | | | 158,334 | | | | - | | | | 158,334 | | | | - | | | | - | | | | - | | | | 158,334 | | 12/31/13 | | | 12/31/15 | | | | 8.00 | % | | Yes | | | 290,000 | | | | 130,000 | | | | - | | | | 130,000 | | | | - | | | | - | | | | 130,000 | | | | - | | 04/01/14 | | | 12/31/18 | | | | 10.00 | % | | Yes | | | 2,265,000 | | | | 1,102,500 | | | | - | | | | 1,102,500 | | | | 1,102,500 | | | | - | | | | - | | | | - | | 12/22/14 | | | 03/31/15 | | | | 22.00 | %* | | Yes | | | 200,000 | | | | 200,000 | | | | - | | | | 200,000 | | | | - | | | | - | | | | 200,000 | | | | - | | 12/26/14 | | | 12/26/15 | | | | 22.00 | %* | | Yes | | | 100,000 | | | | 100,000 | | | | - | | | | 100,000 | | | | - | | | | - | | | | 100,000 | | | | - | | 03/12/15 | | | (1) | | | | 6.00 | % | | No | | | 394,380 | | | | 394,380 | | | | - | | | | 394,380 | | | | 394,380 | | | | - | | | | - | | | | - | | 04/07/15 | | | 04/07/18 | | | | 10.00 | % | | Yes | | | 50,000 | | | | 50,000 | | | | - | | | | 50,000 | | | | - | | | | - | | | | 50,000 | | | | - | | 11/23/15 | | | (1) | | | | 6.00 | % | | No | | | 50,000 | | | | 50,000 | | | | - | | | | 50,000 | | | | 50,000 | | | | - | | | | - | | | | - | | 02/25/16 | | | (1) | | | | 6.00 | % | | No | | | 50,000 | | | | 50,000 | | | | - | | | | 50,000 | | | | 50,000 | | | | - | | | | - | | | | - | | 05/20/16 | | | (1) | | | | 6.00 | % | | No | | | 50,000 | | | | 50,000 | | | | - | | | | 50,000 | | | | 50,000 | | | | - | | | | - | | | | - | | 10/20/16 | | | (1) | | | | 6.00 | % | | No | | | 37,500 | | | | 12,500 | | | | - | | | | 12,500 | | | | 12,500 | | | | - | | | | - | | | | - | | 10/20/16 | | | (1) | | | | 6.00 | % | | No | | | 12,500 | | | | 12,500 | | | | - | | | | 12,500 | | | | 12,500 | | | | - | | | | - | | | | - | | 12/21/16 | | | (1) | | | | 6.00 | % | | No | | | 25,000 | | | | 25,000 | | | | - | | | | 25,000 | | | | 25,000 | | | | - | | | | - | | | | - | | 03/09/17 | | | (1) | | | | 10.00 | % | | No | | | 200,000 | | | | 177,000 | | | | - | | | | 177,000 | | | | 177,000 | | | | - | | | | - | | | | - | | 07/13/17 | | | 07/13/19 | | | | 6.00 | % | | Yes | | | 25,000 | | | | 25,000 | | | | - | | | | 25,000 | | | | - | | | | - | | | | 25,000 | | | | - | | 07/18/17 | | | 07/18/19 | | | | 6.00 | % | | Yes | | | 25,000 | | | | 25,000 | | | | - | | | | 25,000 | | | | - | | | | - | | | | 25,000 | | | | - | | 07/26/17 | | | 07/26/19 | | | | 6.00 | % | | Yes | | | 15,000 | | | | 15,000 | | | | - | | | | 15,000 | | | | - | | | | - | | | | 15,000 | | | | - | | 12/20/17 | | | (2) | | | | 10.00 | % | | Yes | | | 979,156 | | | | 979,156 | | | | - | | | | 979,156 | | | | - | | | | - | | | | 979,156 | | | | - | | 11/06/17 | | | 12/31/18 | | | | 10.00 | % | | Yes | | | 646,568 | | | | 543,093 | | | | - | | | | 543,093 | | | | 543,093 | | | | - | | | | - | | | | - | | 02/19/18 | | | (3) | | | | 18.00 | % * | | Yes | | | 629,451 | | | | 1,161,136 | | | | - | | | | 1,161,136 | | | | - | | | | - | | | | 1,161,136 | | | | - | | 09/19/18 | | | 09/28/21 | | | | 6.00 | % | | Yes | | | 10,000 | | | | 10,000 | | | | - | | | | 10,000 | | | | - | | | | - | | | | 10,000 | | | | - | | 12/14/18 | | | 12/22/18 | | | | 24.00 | %* | | Yes | | | 474,759 | | | | 623,725 | | | | - | | | | 623,725 | | | | - | | | | - | | | | 623,725 | | | | - | | 01/02/19 | | | (4) | | | | 17.00 | % | | No | | | 310,000 | | | | 310,000 | | | | - | | | | 310,000 | | | | - | | | | - | | | | 310,000 | | | | - | | 08/14/19 | | | 10/31/2021 | | | | 8.00 | % | | Yes | | | 26,200 | | | | 26,200 | | | | - | | | | 26,200 | | | | - | | | | - | | | | 26,200 | | | | - | | (5) | | | 10/31/2021 | | | | 8.00 | % | | Yes | | | 105,000 | | | | 105,000 | | | | - | | | | 105,000 | | | | 10,000 | | | | - | | | | 95,000 | | | | - | | (6) | | | 01/02/22 | | | | 8.00 | % | | No | | | 306,750 | | | | 306,750 | | | | 885 | | | | 305,865 | | | | 19,946 | | | | - | | | | 285,919 | | | | - | | (8) | | | 05/12/22 | | | | 8.00 | % | | No | | | 15,000 | | | | 15,000 | | | | 2,924 | | | | 12,076 | | | | - | | | | - | | | | 12,076 | | | | - | | (9) | | | 09/01/22 | | | | 8.00 | % | | No | | | 160,000 | | | | 160,000 | | | | 73,542 | | | | 86,458 | | | | - | | | | - | | | | 86,458 | | | | - | | (10) | | | 08/30/23 | | | | 8.00 | % | | No | | | 285,000 | | | | 285,000 | | | | 218,805 | | | | 66,195 | | | | - | | | | 1,307 | | | | - | | | | 64,888 | | (11) | | | 11/30/23 | | | | 8.00 | % | | No | | | 5,000 | | | | 5,000 | | | | 2,736 | | | | 2,264 | | | | - | | | | 2,264 | | | | - | | | | - | | (7) | | | (7) | | | | 10.00 | % | | No | | | 625,000 | | | | 625,000 | | | | - | | | | 625,000 | | | | - | | | | - | | | | 625,000 | | | | - | | | | | | | | | | | | | | $ | 9,850,598 | | | $ | 9,009,739 | | | $ | 298,892 | | | $ | 8,710,847 | | | $ | 2,446,919 | | | $ | 3,571 | | | $ | 6,037,135 | | | $ | 223,222 | |
(1) | Maturity date is 90 days after demand. | (2) | Bridge loans were issued at dates between December 2017 and May 2018. Principal is due on the earlier of 18 months from the anniversary date or the completion of L2 financing with gross proceeds of a minimum of $1.5 million. | (3) | L2 - Note was drawn down in five tranches between 02/16/18 and 05/02/18. | (4) | Loans were issued from 01/02/19 to 03/23/19. Principal and interest are due when funds are received from the litigation between Ocean Thermal Energy Corporation vs. Robert Coe, et al. | (5) | Notes were issued between 10/14/19 and 11/05/19. The notes bear an interest rate of 8% and mature 10/31/21. They can be converted into 250,000 shares of common stock. They can be converted when the stock closing price reaches $1 or on the maturity, whichever occurs first. | (6) | Notes were issued between 12/09/19 and 11/25/20. The notes bear an interest rate of 8% and mature 01/02/22. They can be converted into 250,000 shares of common stock. They can be converted when the stock closing price reaches $1 or on the maturity, whichever occurs first. | (7) | Notes were issued between 11/02/20 and 03/18/21. The notes bear an interest rate of 10%. Repayment will be made as follows: (i) the principal and interest within five business days following our receipt of $25.5 million from the Robert Coe, et al. Phase One Litigation; and (ii) the additional payment within five business days following our actual receipt of any funds from the Robert Coe, et al. Phase Two Litigation, less legal fees accrued up to that date. Payment will be made as such funds are actually received by us and after deductions of accrued legal fees up to that date. | (8) | Notes were issued between 05/14/20 and 08/11/20. The notes bear an interest rate of 8% and mature 05/12/22. They can be converted into 250,000 shares of common stock. They can be converted when the stock closing price reaches $1 or on the maturity, whichever occurs first. | (9) | Notes were issued in November 2020 and during the first two quarters of 2021. The notes bear an interest rate of 8% and mature 09/01/22. They can be converted into 250,000 shares of common stock. They can be converted when the stock closing price reaches $1 or on the maturity, whichever occurs first. | (10) | Notes were issued during the third quarter of 2021. The notes bear an interest rate of 8% and mature 08/30/23. They can be converted into 250,000 shares of common stock. They can be converted when the stock closing price reaches $1 or on the maturity, whichever occurs first. | (11) | Note was issued during November of 2021. The note bears an interest rate of 8% and matures 11/30/23. It can be converted into 250,000 shares of common stock. It can be converted when the stock closing price reaches $1 or on the maturity, whichever occurs first. | * | Default interest rate. |
|
| X |
- References
+ Details
| Name: |
cpwr_ConvertibleNotesAndNotesPayableAbstract |
| Namespace Prefix: |
cpwr_ |
| Data Type: |
xbrli:stringItemType |
| Balance Type: |
na |
| Period Type: |
duration |
|
| X |
- DefinitionThe entire disclosure for information about short-term and long-term debt arrangements, which includes amounts of borrowings under each line of credit, note payable, commercial paper issue, bonds indenture, debenture issue, own-share lending arrangements and any other contractual agreement to repay funds, and about the underlying arrangements, rationale for a classification as long-term, including repayment terms, interest rates, collateral provided, restrictions on use of assets and activities, whether or not in compliance with debt covenants, and other matters important to users of the financial statements, such as the effects of refinancing and noncompliance with debt covenants. Reference 1: http://www.xbrl.org/2003/role/disclosureRef
-Topic 470
-SubTopic 20
-Name Accounting Standards Codification
-Section 50
-Paragraph 1B
-Subparagraph (h)
-Publisher FASB
-URI https://asc.fasb.org//1943274/2147481139/470-20-50-1B
Reference 2: http://www.xbrl.org/2003/role/disclosureRef
-Topic 235
-SubTopic 10
-Name Accounting Standards Codification
-Section S99
-Paragraph 1
-Subparagraph (SX 210.4-08(c))
-Publisher FASB
-URI https://asc.fasb.org//1943274/2147480678/235-10-S99-1
Reference 3: http://fasb.org/us-gaap/role/ref/legacyRef
-Topic 470
-Name Accounting Standards Codification
-Publisher FASB
-URI https://asc.fasb.org//470/tableOfContent
Reference 4: http://www.xbrl.org/2003/role/disclosureRef
-Topic 470
-SubTopic 20
-Name Accounting Standards Codification
-Section 50
-Paragraph 1B
-Publisher FASB
-URI https://asc.fasb.org//1943274/2147481139/470-20-50-1B
Reference 5: http://www.xbrl.org/2003/role/disclosureRef
-Topic 470
-SubTopic 20
-Name Accounting Standards Codification
-Section 50
-Paragraph 1B
-Subparagraph (g)
-Publisher FASB
-URI https://asc.fasb.org//1943274/2147481139/470-20-50-1B
Reference 6: http://www.xbrl.org/2003/role/disclosureRef
-Topic 470
-SubTopic 20
-Name Accounting Standards Codification
-Section 50
-Paragraph 1B
-Subparagraph (i)
-Publisher FASB
-URI https://asc.fasb.org//1943274/2147481139/470-20-50-1B
Reference 7: http://www.xbrl.org/2003/role/disclosureRef
-Topic 470
-SubTopic 20
-Name Accounting Standards Codification
-Section 50
-Paragraph 1C
-Subparagraph (a)
-Publisher FASB
-URI https://asc.fasb.org//1943274/2147481139/470-20-50-1C
Reference 8: http://www.xbrl.org/2003/role/disclosureRef
-Topic 470
-SubTopic 20
-Name Accounting Standards Codification
-Section 50
-Paragraph 1C
-Subparagraph (b)
-Publisher FASB
-URI https://asc.fasb.org//1943274/2147481139/470-20-50-1C
Reference 9: http://www.xbrl.org/2003/role/disclosureRef
-Topic 470
-SubTopic 20
-Name Accounting Standards Codification
-Section 50
-Paragraph 1C
-Subparagraph (c)
-Publisher FASB
-URI https://asc.fasb.org//1943274/2147481139/470-20-50-1C
Reference 10: http://www.xbrl.org/2003/role/disclosureRef
-Topic 470
-SubTopic 20
-Name Accounting Standards Codification
-Section 50
-Paragraph 1E
-Subparagraph (b)
-Publisher FASB
-URI https://asc.fasb.org//1943274/2147481139/470-20-50-1E
Reference 11: http://www.xbrl.org/2003/role/disclosureRef
-Topic 470
-SubTopic 20
-Name Accounting Standards Codification
-Section 50
-Paragraph 1I
-Subparagraph (a)
-Publisher FASB
-URI https://asc.fasb.org//1943274/2147481139/470-20-50-1I
Reference 12: http://www.xbrl.org/2003/role/disclosureRef
-Topic 470
-SubTopic 20
-Name Accounting Standards Codification
-Section 50
-Paragraph 1I
-Subparagraph (b)
-Publisher FASB
-URI https://asc.fasb.org//1943274/2147481139/470-20-50-1I
Reference 13: http://www.xbrl.org/2003/role/disclosureRef
-Topic 470
-SubTopic 20
-Name Accounting Standards Codification
-Section 50
-Paragraph 1I
-Subparagraph (d)
-Publisher FASB
-URI https://asc.fasb.org//1943274/2147481139/470-20-50-1I
| Name: |
us-gaap_DebtDisclosureTextBlock |
| Namespace Prefix: |
us-gaap_ |
| Data Type: |
dtr-types:textBlockItemType |
| Balance Type: |
na |
| Period Type: |
duration |
|
v3.23.2
DERIVATIVE LIABILITY
|
12 Months Ended |
Dec. 31, 2022 |
|---|
| DERIVATIVE LIABILITY |
|
| DERIVATIVE LIABILITY |
NOTE 5 – DERIVATIVE LIABILITY We measure the fair value of our assets and liabilities under the guidance of ASC 820, Fair Value Measurements and Disclosures, which defines fair value, establishes a framework for measuring fair value in accordance with GAAP, and expands disclosures about fair value measurements. ASC 820 does not require any new fair value measurements, but its provisions apply to all other accounting pronouncements that require or permit fair value measurement. We identified conversion features embedded within convertible debt issued. We have determined that the features associated with the embedded conversion option should be accounted for at fair value as a derivative liability. We have elected to account for these instruments together with fixed conversion price instruments as derivative liabilities as we cannot determine if a sufficient number of shares would be available to settle all potential future conversion transactions. We value the derivative liabilities using the Black-Scholes option valuation model. The derivative liabilities are valued at each reporting date and the change in fair value is reflected as change in fair value of derivative liability. Following is a description of the valuation methodologies used to determine the fair value of our financial liabilities, including the general classification of such instruments pursuant to the valuation hierarchy: | | Fair Value at December 31, | | | Quoted market prices for identical assets/liabilities (Level 1) | | | Significant other observable inputs (Level 2) | | | Significant unobservable inputs (Level 3) | | Derivative Liability, December 31, 2022 | | $ | 6,998,262 | | | $ | - | | | $ | - | | | $ | 6,998,262 | | Derivative Liability, December 31, 2021 | | $ | 3,769,211 | | | $ | - | | | $ | - | | | $ | 3,769,211 | |
The reconciliation of the derivative liability for the years ended December 31, 2022 and 2021, is as follows: | | For the Years Ended December 31 | | | | 2022 | | | 2021 | | Derivative liability as of January 1 | | $ | 3,769,211 | | | $ | 5,321,395 | | Addition to derivative instruments | | | - | | | | 420,214 | | Derivative liability extinguished upon conversion of notes payable | | | (199,194 | ) | | | (666,916 | ) | Change in fair value of derivative liability | | | 3,428,245 | | | | (1,305,482 | ) | Derivative liability as of December 31 | | $ | 6,998,262 | | | $ | 3,769,211 | |
The change in fair value of the derivative liability for the years ended December 31, 2022 and 2021, is comprised of the following: | | For the Years Ended December 31 | | | | 2022 | | | 2021 | | Day one loss on valuation | | $ | - | | | $ | 97,861 | | Gains/(losses) from the change in fair value of derivative liability | | | 3,428,245 | | | | (1,403,343 | ) | Change in fair value of derivative liability* | | $ | 3,428,245 | | | $ | (1,305,482 | ) |
________________ * Gains (losses) related to the revaluation of Level 3 financial liabilities is included in “Change in fair value of derivative liabilities” in the accompanying consolidated statement of operations. The fair value of the derivative liability was estimated using the Black-Scholes option-valuation model. The fair values at the commitment and remeasurement dates for our derivative liabilities were based upon the following management assumptions: | | For the Years Ended December 31 | | | | 2022 | | | 2021 | | Expected dividends | | | 0 | % | | | 0 | % | Expected volatility | | 184%-368 | % | | 77%-326 | % | Risk free interest rate | | 0.52%-4.73 | % | | 0.03%-0.73 | % | Expected term (in years) | | 0.25– 1.67 years | | | 0.08– 2.56 years | |
The fair value at the remeasurement date is equal to the carrying value on the balance sheet.
|
| X |
- References
+ Details
| Name: |
cpwr_DerivativeLiabilityAbstract |
| Namespace Prefix: |
cpwr_ |
| Data Type: |
xbrli:stringItemType |
| Balance Type: |
na |
| Period Type: |
duration |
|
| X |
- DefinitionThe entire disclosure for derivatives and fair value of assets and liabilities. Reference 1: http://fasb.org/us-gaap/role/ref/legacyRef
-Topic 815
-Name Accounting Standards Codification
-Publisher FASB
-URI https://asc.fasb.org//815/tableOfContent
Reference 2: http://fasb.org/us-gaap/role/ref/legacyRef
-Topic 820
-Name Accounting Standards Codification
-Publisher FASB
-URI https://asc.fasb.org//820/tableOfContent
| Name: |
us-gaap_DerivativesAndFairValueTextBlock |
| Namespace Prefix: |
us-gaap_ |
| Data Type: |
dtr-types:textBlockItemType |
| Balance Type: |
na |
| Period Type: |
duration |
|
v3.23.2
STOCKHOLDERS EQUITY
|
12 Months Ended |
Dec. 31, 2022 |
|---|
| STOCKHOLDERS EQUITY |
|
| STOCKHOLDERS EQUITY |
NOTE 6 – STOCKHOLDERS’ EQUITY Common Stock During the year ended December 31, 2022, we issued 10,000,000 shares of common stock with a fair value of $185,000 for the conversion of a portion of our notes payable in the amount of $45,650. During the year ended December 31, 2022, $15,000 of notes and $1,946 of related accrued interest were converted into 847,262 shares of common stock. The 847,262 shares were borrowed from our CEO to enable the conversions. We have accrued a liability for the shares to be reissued to our CEO in the amount of $11,014, the fair value of the shares on the date of conversion. The replacement shares have not been issued at December 31, 2022. During the year ended December 31, 2021, we issued 34,829,587 shares of common stock with a fair value of $972,882 for the conversion of a portion of our notes payable in the amount of $419,179. During the year ended December 31, 2021, we issued 1,693,877 shares of common stock valued at $83,000. This was a settlement of a second commitment for a convertible promissory note dated May 22, 2018. The initial commitment was 400,000 shares of common stock issued on May 22, 2018. Preferred Stock On December 31, 2021, our board of directors approved a resolution authorizing the withdrawal of the certificate of designation of our Series A preferred stock. No shares were outstanding at the time of withdrawal. Our board of directors has approved the following issuances of Preferred Stock: Series B Preferred Stock (authorized June 3, 2019) – We are authorized to issue 1,250,000 shares of Series B Preferred Stock with a par value of $0.001. These shares will not have voting rights alongside the common stock and each share of Series B Preferred Stock will be convertible into ten shares of our common stock. As of December 31, 2022 and 2021, 518,750 shares of Series B Preferred Stock have been issued. Series C Preferred Stock (authorized June 3, 2019) – We are authorized to issue 2,700,000 shares of Series C Preferred Stock with a par value of $0.001. These shares are a one-time grant and will have voting rights alongside the common stock. Each share of Series C Preferred Stock will be convertible into five shares of our common stock. As of December 31, 2022 and 2021, 2,300,000 shares of Series C Preferred Stock have been issued. Series D Preferred Stock (authorized December 31, 2021) – We are authorized to issue 1,000 shares of Series D Preferred Stock with a par value of $0.001. These shares will have voting rights alongside the common stock and each share of Series D Preferred Stock will be convertible into 200,000 shares of our common stock as set forth in the certificate of designation. Each share of Series D Preferred Stock shall be converted automatically upon the effectiveness of a registration statement registering the resale of the common stock to be issued upon the conversion of the Series D Preferred Stock, or at any time following a merger or consolidation of the Corporation with or into an unaffiliated entity or the sale of all or substantially all of the assets of the Corporation to an unaffiliated third party, at the election of the holder. As of December 31, 2022 and 2021, 278 and no shares of Series D Preferred Stock have been issued. During the year ended December 31, 2022, we issued 135 shares of Series D Preferred Stock for cash proceeds of $270,000. During the year ended December 31, 2022, we issued 143 shares of Series D Preferred Stock valued at $286,000 upon conversion of $215,000 of notes and $66,126 of related accrued interest. Warrants and Options The following table summarizes all warrants outstanding and exercisable for the years ended December 31, 2022 and 2021: | | Number of | | | Weighted Average | | | | Warrants | | | Exercise Price | | Balance at December 31, 2020 | | | 125,073 | | | $ | 0.13 | | Granted | | | - | | | | - | | Exercised | | | - | | | | - | | Forfeited | | | - | | | | - | | Balance at December 31, 2021 | | | 125,073 | | | $ | 0.13 | | Granted | | | - | | | | - | | Exercised | | | - | | | | - | | Forfeited | | | - | | | | - | | Balance at December 31, 2022 | | | 125,073 | | | $ | 0.13 | | Exercisable at December 31, 2022 | | | 125,073 | | | $ | 0.13 | |
No warrants were issued or exercised during the years ended December 31, 2022 and 2021. Aggregate intrinsic value represents the excess amount over the exercise price that optionees would have received if all options had been exercised on the last business day of the period indicated, based on our closing stock price of $0.01 per share on December 31, 2022. The outstanding warrants had no intrinsic value, as the price of the stock on that date was lower than the exercise price. The warrants had a weighted average remaining life of six months at December 31, 2022.
|
| X |
- References
+ Details
| Name: |
us-gaap_StockholdersEquityAbstract |
| Namespace Prefix: |
us-gaap_ |
| Data Type: |
xbrli:stringItemType |
| Balance Type: |
na |
| Period Type: |
duration |
|
| X |
- DefinitionThe entire disclosure for equity. Reference 1: http://www.xbrl.org/2003/role/disclosureRef
-Topic 505
-SubTopic 10
-Name Accounting Standards Codification
-Section 50
-Paragraph 13
-Subparagraph (b)
-Publisher FASB
-URI https://asc.fasb.org//1943274/2147481112/505-10-50-13
Reference 2: http://www.xbrl.org/2003/role/disclosureRef
-Topic 505
-SubTopic 10
-Name Accounting Standards Codification
-Section 50
-Paragraph 13
-Subparagraph (h)
-Publisher FASB
-URI https://asc.fasb.org//1943274/2147481112/505-10-50-13
Reference 3: http://www.xbrl.org/2003/role/disclosureRef
-Topic 505
-SubTopic 10
-Name Accounting Standards Codification
-Section 50
-Paragraph 14
-Subparagraph (b)
-Publisher FASB
-URI https://asc.fasb.org//1943274/2147481112/505-10-50-14
Reference 4: http://www.xbrl.org/2003/role/disclosureRef
-Topic 946
-SubTopic 235
-Name Accounting Standards Codification
-Section 50
-Paragraph 2
-Subparagraph (a)
-Publisher FASB
-URI https://asc.fasb.org//1943274/2147481062/946-235-50-2
Reference 5: http://www.xbrl.org/2003/role/disclosureRef
-Topic 946
-SubTopic 235
-Name Accounting Standards Codification
-Section 50
-Paragraph 2
-Subparagraph (d)
-Publisher FASB
-URI https://asc.fasb.org//1943274/2147481062/946-235-50-2
Reference 6: http://www.xbrl.org/2003/role/disclosureRef
-Topic 946
-SubTopic 505
-Name Accounting Standards Codification
-Section 50
-Paragraph 6
-Publisher FASB
-URI https://asc.fasb.org//1943274/2147481004/946-505-50-6
Reference 7: http://www.xbrl.org/2003/role/disclosureRef
-Topic 815
-SubTopic 40
-Name Accounting Standards Codification
-Section 50
-Paragraph 6
-Subparagraph (a)
-Publisher FASB
-URI https://asc.fasb.org//1943274/2147480237/815-40-50-6
Reference 8: http://www.xbrl.org/2003/role/disclosureRef
-Topic 505
-SubTopic 10
-Name Accounting Standards Codification
-Section S99
-Paragraph 1
-Subparagraph (SX 210.3-04)
-Publisher FASB
-URI https://asc.fasb.org//1943274/2147480008/505-10-S99-1
Reference 9: http://www.xbrl.org/2003/role/disclosureRef
-Topic 235
-SubTopic 10
-Name Accounting Standards Codification
-Section S99
-Paragraph 1
-Subparagraph (SX 210.4-08(e)(1))
-Publisher FASB
-URI https://asc.fasb.org//1943274/2147480678/235-10-S99-1
Reference 10: http://fasb.org/us-gaap/role/ref/legacyRef
-Topic 505
-Name Accounting Standards Codification
-Publisher FASB
-URI https://asc.fasb.org//505/tableOfContent
Reference 11: http://www.xbrl.org/2003/role/disclosureRef
-Topic 505
-SubTopic 10
-Name Accounting Standards Codification
-Section 50
-Paragraph 13
-Publisher FASB
-URI https://asc.fasb.org//1943274/2147481112/505-10-50-13
Reference 12: http://www.xbrl.org/2003/role/disclosureRef
-Topic 505
-SubTopic 10
-Name Accounting Standards Codification
-Section 50
-Paragraph 13
-Subparagraph (g)
-Publisher FASB
-URI https://asc.fasb.org//1943274/2147481112/505-10-50-13
Reference 13: http://www.xbrl.org/2003/role/disclosureRef
-Topic 505
-SubTopic 10
-Name Accounting Standards Codification
-Section 50
-Paragraph 13
-Subparagraph (i)
-Publisher FASB
-URI https://asc.fasb.org//1943274/2147481112/505-10-50-13
Reference 14: http://www.xbrl.org/2003/role/disclosureRef
-Topic 505
-SubTopic 10
-Name Accounting Standards Codification
-Section 50
-Paragraph 14
-Subparagraph (a)
-Publisher FASB
-URI https://asc.fasb.org//1943274/2147481112/505-10-50-14
Reference 15: http://www.xbrl.org/2003/role/disclosureRef
-Topic 505
-SubTopic 10
-Name Accounting Standards Codification
-Section 50
-Paragraph 14
-Subparagraph (c)
-Publisher FASB
-URI https://asc.fasb.org//1943274/2147481112/505-10-50-14
Reference 16: http://www.xbrl.org/2003/role/disclosureRef
-Topic 505
-SubTopic 10
-Name Accounting Standards Codification
-Section 50
-Paragraph 16
-Subparagraph (b)
-Publisher FASB
-URI https://asc.fasb.org//1943274/2147481112/505-10-50-16
Reference 17: http://www.xbrl.org/2003/role/disclosureRef
-Topic 505
-SubTopic 10
-Name Accounting Standards Codification
-Section 50
-Paragraph 18
-Subparagraph (a)
-Publisher FASB
-URI https://asc.fasb.org//1943274/2147481112/505-10-50-18
Reference 18: http://www.xbrl.org/2003/role/disclosureRef
-Topic 505
-SubTopic 10
-Name Accounting Standards Codification
-Section 50
-Paragraph 18
-Subparagraph (b)
-Publisher FASB
-URI https://asc.fasb.org//1943274/2147481112/505-10-50-18
Reference 19: http://www.xbrl.org/2003/role/disclosureRef
-Topic 505
-SubTopic 10
-Name Accounting Standards Codification
-Section 50
-Paragraph 18
-Subparagraph (d)
-Publisher FASB
-URI https://asc.fasb.org//1943274/2147481112/505-10-50-18
| Name: |
us-gaap_StockholdersEquityNoteDisclosureTextBlock |
| Namespace Prefix: |
us-gaap_ |
| Data Type: |
dtr-types:textBlockItemType |
| Balance Type: |
na |
| Period Type: |
duration |
|
v3.23.2
INCOME TAX
|
12 Months Ended |
Dec. 31, 2022 |
|---|
| INCOME TAX |
|
| INCOME TAX |
NOTE 7 – INCOME TAX Our ability to use our net operating loss carryforwards may be substantially limited due to ownership change limitations that may have occurred or that could occur in the future, as required by Section 382 of the Code, as well as similar state provisions. These ownership changes may limit the amount of net operating loss that can be utilized annually to offset future taxable income and tax, respectively. In general, an “ownership change” as defined by Section 382 of the Code results from a transaction or series of transactions over a three-year period resulting in an ownership change of more than 50.0% of the outstanding stock of a company by certain stockholders or public groups. We have not completed a study to assess whether an ownership change has occurred or whether there have been multiple ownership changes since we became a “loss corporation” under the definition of Section 382. If we have experienced an ownership change, utilization of the net operating loss carryforwards would be subject to an annual limitation under Section 382 of the Code, which is determined by first multiplying the value of our stock at the time of the ownership change by the applicable long-term, tax-exempt rate, and then could be subject to additional adjustments, as required. Any limitation may result in expiration of a portion of the net operating loss carryforwards before utilization. Further, until a study is completed, and any limitation known, no positions related to limitations are being considered as an uncertain tax position or disclosed as an unrecognized tax benefit. Any carryforwards that expire prior to utilization as a result of such limitations will be removed from deferred tax assets with a corresponding reduction of the valuation allowance. Due to the existence of the valuation allowance, it is not expected that any possible limitation will have an impact on our results of operations or financial position. The actual tax benefit differs from the expected tax benefit for the years ended December 31, 2022 and 2021 (computed by applying the U.S. federal corporate tax rate of 21% to income before taxes), as follows: | | 2022 | | | 2021 | | Statutory federal income tax rate | | | (21.0 | )% | | | (21.0 | )% | State income taxes, net of federal benefits | | | (7.9 | )% | | | (7.9 | )% | Non-deductible items | | | 15.0 | % | | | (11.4 | )% | Valuation allowance | | | 13.9 | % | | | 40.3 | % | Effective income tax rate | | | — | % | | | — | % |
Deferred income taxes reflect the net tax effects of temporary differences between the carrying amounts of assets and liabilities for financial reporting purposes and the amounts used for income tax purposes. Significant components of our deferred tax assets and liabilities are as follows: | | For the Years Ended December 31 | | | | 2022 | | | 2021 | | Impairment | | $ | 2,358,860 | | | $ | 2,358,860 | | Accrued Compensation | | | 1,517,774 | | | | 1,335,457 | | Operating loss carryforwards | | | 10,809,828 | | | | 10,028,500 | | Gross deferred tax assets | | | 14,686,462 | | | | 13,722,817 | | Valuation allowance | | | (14,686,462 | ) | | | (13,722,817 | ) | Net deferred income tax asset | | $ | - | | | $ | - | |
We have net operating loss carryforwards for income tax purposes of approximately $20.9 million that are available to be offset against future income through 2037. We have net operating loss carryforwards of approximately $16.5 million that can be used indefinitely subject to limitations. The tax benefits relating to all timing differences have been fully reserved for in the valuation allowance account due to the substantial losses incurred through December 31, 2022. The change in the valuation allowance for the years ended December 31, 2022 and 2021, was an increase of $0.96 million and $1.08 million, respectively.
|
| X |
- DefinitionThe entire disclosure for income taxes. Disclosures may include net deferred tax liability or asset recognized in an enterprise's statement of financial position, net change during the year in the total valuation allowance, approximate tax effect of each type of temporary difference and carryforward that gives rise to a significant portion of deferred tax liabilities and deferred tax assets, utilization of a tax carryback, and tax uncertainties information. Reference 1: http://www.xbrl.org/2003/role/disclosureRef
-Topic 946
-SubTopic 20
-Name Accounting Standards Codification
-Section 50
-Paragraph 13
-Publisher FASB
-URI https://asc.fasb.org//1943274/2147480990/946-20-50-13
Reference 2: http://www.xbrl.org/2003/role/disclosureRef
-Topic 235
-SubTopic 10
-Name Accounting Standards Codification
-Section S99
-Paragraph 1
-Subparagraph (SX 210.4-08(h)(2))
-Publisher FASB
-URI https://asc.fasb.org//1943274/2147480678/235-10-S99-1
Reference 3: http://www.xbrl.org/2003/role/disclosureRef
-Topic 740
-Name Accounting Standards Codification
-Publisher FASB
-URI https://asc.fasb.org//740/tableOfContent
Reference 4: http://www.xbrl.org/2003/role/disclosureRef
-Topic 740
-SubTopic 10
-Name Accounting Standards Codification
-Section 50
-Paragraph 14
-Publisher FASB
-URI https://asc.fasb.org//1943274/2147482685/740-10-50-14
Reference 5: http://www.xbrl.org/2003/role/disclosureRef
-Topic 740
-SubTopic 10
-Name Accounting Standards Codification
-Section 50
-Paragraph 21
-Publisher FASB
-URI https://asc.fasb.org//1943274/2147482685/740-10-50-21
Reference 6: http://www.xbrl.org/2003/role/disclosureRef
-Topic 740
-SubTopic 270
-Name Accounting Standards Codification
-Section 50
-Paragraph 1
-Publisher FASB
-URI https://asc.fasb.org//1943274/2147482526/740-270-50-1
Reference 7: http://www.xbrl.org/2003/role/disclosureRef
-Topic 740
-SubTopic 10
-Name Accounting Standards Codification
-Section 50
-Paragraph 17
-Subparagraph (b)
-Publisher FASB
-URI https://asc.fasb.org//1943274/2147482685/740-10-50-17
Reference 8: http://www.xbrl.org/2003/role/disclosureRef
-Topic 740
-SubTopic 10
-Name Accounting Standards Codification
-Section S99
-Paragraph 1
-Subparagraph (SAB TOPIC 6.I.5.Q1)
-Publisher FASB
-URI https://asc.fasb.org//1943274/2147479360/740-10-S99-1
Reference 9: http://www.xbrl.org/2003/role/disclosureRef
-Topic 740
-SubTopic 10
-Name Accounting Standards Codification
-Section S99
-Paragraph 2
-Subparagraph (SAB Topic 11.C)
-Publisher FASB
-URI https://asc.fasb.org//1943274/2147479360/740-10-S99-2
Reference 10: http://www.xbrl.org/2003/role/disclosureRef
-Topic 740
-SubTopic 30
-Name Accounting Standards Codification
-Section 50
-Paragraph 2
-Subparagraph (a)
-Publisher FASB
-URI https://asc.fasb.org//1943274/2147482603/740-30-50-2
| Name: |
us-gaap_IncomeTaxDisclosureTextBlock |
| Namespace Prefix: |
us-gaap_ |
| Data Type: |
dtr-types:textBlockItemType |
| Balance Type: |
na |
| Period Type: |
duration |
|
v3.23.2
COMMITMENTS AND CONTINGENCIES
|
12 Months Ended |
Dec. 31, 2022 |
|---|
| COMMITMENTS AND CONTINGENCIES |
|
| COMMITMENTS AND CONTINGENCIES |
NOTE 8 – COMMITMENTS AND CONTINGENCIES Commitments On June 26, 2017, we entered a nonexclusive finder’s arrangement with Craft Capital Management LLC (“Craft”) in the event that proceeds with a debt and/or equity transaction or to finance a merger/acquisition and/or another transaction are arranged by Craft. We have no obligation to consummate any transaction, and we can choose to accept or reject any transaction in our sole and absolute discretion. Upon the successful completion of a placement, we will pay to Craft 8% of the gross proceeds from an equity placement and 3% for a debt placement. In addition, we will issue to Craft, at the time of closing, warrants with an aggregate exercise price equal to 3% of the amount raised. We have issued warrants to purchase 56,073 shares of common stock for L2 Capital equity transactions and warrants to purchase 69,000 shares of common stock for L2 Capital debt transactions for total outstanding warrants to purchase 125,073 shares of common stock, none of which has been exercised. These warrants have a fair value of $219 based on the Black-Scholes option-pricing model. The warrants have exercise prices ranging from $0.0425 to $0.25 per share and are exercisable for a period of five years after the closing of the placement. If we, at any time while these warrants are outstanding, sell or grant any option to purchase or sell or grant any right to reprice, or otherwise dispose of or issue any common stock or securities entitling any person or entity to acquire shares of common stock, at an effective price per share less than the then-exercise price, then the exercise price will be reduced to equal the lower share price, at the option of Craft. Such adjustment will be made whenever such common stock is issued. We will notify Craft in writing, no later than the trading day following the issuance of any common stock, of the applicable issuance price or applicable reset price, exchange price, conversion price, and other pricing terms. Litigation On May 4, 2018, we reached a settlement of the claims at issue in Ocean Thermal Energy Corp. v. Robert Coe, et al., Case No. 2:17-cv-02343SHL-cgc, before the United States District Court for the Western District of Tennessee. Between May 30 and July 19, 2018, we received three payments totaling $100,000 from the defendants. On August 8, 2018, an $8 million judgment was entered against the defendants and in our favor. On May 28, 2019, we further settled the claims at issue with two of the defendants, Brett M. Regal and his company, Trade Base Sales, Inc. (“Regal Debtors”), for $17,500,000, bringing the combined judgment and settlement amount owed to us is $25,500,000. On July 1, 2019, the United States District Judge for the Central District of California (case number: 2:19-cv-05299-VAP-JPR), approved our stipulated application for an order permitting us to levy on property and appointing a receiver to carry out the levy on Regal Debtors’ property, such that it may be sold (subject to further order of the court approving and confirming such sales), to satisfy the $25,500,000 settlement and judgment amounts in our favor. On August 15, 2019, the court-appointed receiver notified the court that he had taken custody, possession, and control of certain gemstone and mineral specimens, known as the “Ophir Collection” and 350,000 pounds of unrefined gold and other precious metal bearing ore. By order of the court, the receiver was given the authority to assign, sell, and transfer the debtor property. The proceeds of any sales will be used to satisfy the judgment and settlement agreement, receivership’s reasonable costs and fees, as well as any other claims as determined by the court. Various parties have come forward asserting ownership and priority lien rights to the property. In our ongoing efforts to collect the $25,500,000 judgment obtained, a third party has intervened in our case in the Central District of California (case number: 2:19-cv-05299-VAP-JPR), asserting that it is the rightful owner of the “Ophir Collection” of gems and mineral specimens that is now in possession of the court-appointed receiver. On February 25, 2022, all parties who have appeared in this case stipulated to dismiss all pending claims while leaving the receivership established by the court in place. On the same date, the court ordered that upon a successful sale of the Ophir Collection, the net proceeds shall be distributed in accordance with the terms of the January 3, 2022, confidential settlement between the parties. On May 21, 2019, Theodore T. Herman filed a complaint against us in Theodore T. Herman v. Ocean Thermal Energy Corporation, Case No. CI-19-04780, in the Court of Common Pleas of Lancaster County, Pennsylvania, asserting that he is entitled to payment on the promissory note described in Note 4: Convertible Notes and Notes Payable. On July 1, 2019, we filed preliminary objections to the complaint, and subsequently filed an answer and new matter on August 20, 2019, to which the plaintiff filed a reply on September 9, 2019. We will continue to defend our position that no further payment on this note is owed. On August 22, 2018, Fugro USA Maine, Inc. (“Fugro”), filed suit against us in Fugro USA Marine, Inc. v. Ocean Thermal Energy Corp., Cause No. 2018-56396, in the District Court for Harris County, TX, 165th Judicial District, seeking approximately $500,000 allegedly owed for engineering services provided. On June 23, 2020, a settlement was reached under which we would pay Fugro $375,000 by June 30, 2021. We were unable to pay the remaining balance and therefore entered into a second amendment to the settlement agreement extending the deadline for full payment, with 18% interest per annum, to December 31, 2021. We will continue to make regular monthly payments to Fugro of $10,000 per month, until the balance owed has been paid. We have recorded the amount of accrued legal settlement as of December 31, 2022. We have repaid $260,000 and the balance at December 31, 2022, was $115,000, with accrued interest of $51,842 at December 31, 2022.
|
| X |
- References
+ Details
| Name: |
cpwr_CommitmentsAndContingenciesAbstract |
| Namespace Prefix: |
cpwr_ |
| Data Type: |
xbrli:stringItemType |
| Balance Type: |
na |
| Period Type: |
duration |
|
| X |
- DefinitionThe entire disclosure for commitments and contingencies. Reference 1: http://www.xbrl.org/2003/role/disclosureRef
-Topic 440
-SubTopic 10
-Name Accounting Standards Codification
-Section 50
-Paragraph 4
-Subparagraph (a)
-Publisher FASB
-URI https://asc.fasb.org//1943274/2147482648/440-10-50-4
Reference 2: http://www.xbrl.org/2009/role/commonPracticeRef
-Topic 450
-Name Accounting Standards Codification
-Publisher FASB
-URI https://asc.fasb.org//450/tableOfContent
Reference 3: http://www.xbrl.org/2003/role/disclosureRef
-Topic 954
-SubTopic 440
-Name Accounting Standards Codification
-Section 50
-Paragraph 1
-Subparagraph (a)
-Publisher FASB
-URI https://asc.fasb.org//1943274/2147480327/954-440-50-1
Reference 4: http://www.xbrl.org/2003/role/disclosureRef
-Topic 440
-SubTopic 10
-Name Accounting Standards Codification
-Section 50
-Paragraph 4
-Subparagraph (c)
-Publisher FASB
-URI https://asc.fasb.org//1943274/2147482648/440-10-50-4
Reference 5: http://fasb.org/us-gaap/role/ref/legacyRef
-Topic 440
-Name Accounting Standards Codification
-Publisher FASB
-URI https://asc.fasb.org//440/tableOfContent
| Name: |
us-gaap_CommitmentsAndContingenciesDisclosureTextBlock |
| Namespace Prefix: |
us-gaap_ |
| Data Type: |
dtr-types:textBlockItemType |
| Balance Type: |
na |
| Period Type: |
duration |
|
v3.23.2
CONSULTING AGREEMENTS
|
12 Months Ended |
Dec. 31, 2022 |
|---|
| CONSULTING AGREEMENTS |
|
| CONSULTING AGREEMENTS |
NOTE 9 – CONSULTING AGREEMENTS On June 4, 2018, we entered into a consulting agreement to pay 20,000 shares of common stock when one of the conditions of the contract was satisfied. Although this condition was satisfied on August 31, 2018, as of December 31, 2022, we have not issued the shares. As of December 31, 2022, and 2021, we have accrued the share compensation at fair value totaling $1,600. On August 14, 2018, we entered into a consulting agreement to pay $40,000 by issuing shares of common stock. As of December 31, 2022, we have not issued the shares and have accrued the amount.
|
| X |
- References
+ Details
| Name: |
cpwr_ConsultingAgreementsAbstract |
| Namespace Prefix: |
cpwr_ |
| Data Type: |
xbrli:stringItemType |
| Balance Type: |
na |
| Period Type: |
duration |
|
| X |
- References
+ Details
| Name: |
cpwr_ConsultingAgreementsDisclosureTextBlock |
| Namespace Prefix: |
cpwr_ |
| Data Type: |
nonnum:textBlockItemType |
| Balance Type: |
na |
| Period Type: |
duration |
|
v3.23.2
EMPLOYMENT AGREEMENTS
|
12 Months Ended |
Dec. 31, 2022 |
|---|
| EMPLOYMENT AGREEMENTS |
|
| EMPLOYMENT AGREEMENTS |
NOTE 10 – EMPLOYMENT AGREEMENTS On January 1, 2011, we entered into a five-year employment agreement with our chief executive officer, which provides for successive one-year term renewals unless it is expressly cancelled by either party 100 days prior to the end of the term. Under the agreement, our chief executive officer will receive an annual salary of $350,000, a car allowance of $12,000, and company-paid health insurance. The agreement also provides for bonuses equal to one times his annual salary plus 500,000 shares of common stock for each additional project that generates $25 million or more in revenue to us. Our chief executive officer is entitled to receive severance pay in the lesser amount of three years’ salary or 100% of the remaining salary if the remaining term is less than three years. On September 15, 2017, an addendum was added to the employment agreement stating that effective June 30, 2017, his salary will be increased to $388,220 per year; that he will receive interest at a rate of 8% on his accrued unpaid wages; and that the term of employment agreement is extended for an additional five years. Effective June 9, 2022, we entered into a second addendum to the employment contract. Among other provisions, the addendum extends the employment agreement through December 31, 2025 and increases the annual salary to $454,738 from $388,220.
|
| X |
- References
+ Details
| Name: |
cpwr_EmploymentAgreementsAbstract |
| Namespace Prefix: |
cpwr_ |
| Data Type: |
xbrli:stringItemType |
| Balance Type: |
na |
| Period Type: |
duration |
|
| X |
- References
+ Details
| Name: |
cpwr_EmploymentAgreementsDisclosureTextBlock |
| Namespace Prefix: |
cpwr_ |
| Data Type: |
nonnum:textBlockItemType |
| Balance Type: |
na |
| Period Type: |
duration |
|
v3.23.2
PARTY TRANSACTIONS
|
12 Months Ended |
Dec. 31, 2022 |
|---|
| PARTY TRANSACTIONS |
|
| PARTY TRANSACTIONS |
NOTE 11 – RELATED-PARTY TRANSACTIONS For each of the years ended December 31, 2022 and 2021, we recorded rent expense of $120,000 to a company controlled by our chief executive officer under a lease agreement. The lease is for a one-year term and, unless either party shall give to the other written notice of termination, the term shall renew for a further period of one year, and so on from year to year until terminated by either party. At December 31, 2022 we had a payable to the entity of $70,000. For the years ended December 31, 2022 and 2021, we recorded charges incurred to a company controlled by our chief executive officer for reimbursement of accounting and administrative services provided to us by an employee of that company. For the years ended December 31, 2022 and 2021, we recorded expense of $114,814 and $105,201, respectively, to this company. At December 31, 2022 we had a payable to the entity of $74,070. From time to time, we enter into loans and notes payable with related parties. Refer to Note 4 for details on notes payable and convertible notes payable to related parties. Accrued interest on related-party notes was $1,656,757 and $1,435,120 at December 31, 2022 and 2021, respectively. During the year ended December 31, 2022, our chief executive officer converted $10,000 of notes and $2,043 of accrued interest into six shares of Series D Preferred Stock. He also purchased five shares of Series D Preferred Stock for cash proceeds of $10,000. During the year ended December 31, 2022, entities controlled by our chief executive officer advanced $58,000 to us for working capital purposes. During the year ended December 31, 2022, $15,000 of notes and $1,946 of related accrued interest were converted into 847,262 shares of common stock. The 847,262 shares were borrowed from our CEO to enable the conversions. We have accrued a liability for the shares to be reissued to our CEO in the amount of $11,014, the fair value of the shares on the date of conversion. The replacement shares have not been issued at December 31, 2022.
|
| X |
- References
+ Details
| Name: |
cpwr_PartyTransactionsAbstract |
| Namespace Prefix: |
cpwr_ |
| Data Type: |
xbrli:stringItemType |
| Balance Type: |
na |
| Period Type: |
duration |
|
| X |
- References
+ Details
| Name: |
cpwr_PartyTransactionsTextBlock |
| Namespace Prefix: |
cpwr_ |
| Data Type: |
nonnum:textBlockItemType |
| Balance Type: |
na |
| Period Type: |
duration |
|
v3.23.2
SUBSEQUENT EVENTS
|
12 Months Ended |
Dec. 31, 2022 |
|---|
| SUBSEQUENT EVENTS |
|
| SUBSEQUENT EVENTS |
NOTE 12 – SUBSEQUENT EVENTS Subsequent to December 31, 2022: We issued 500 shares of series D Preferred Stock upon the conversion of $35,303 of related party notes and $964,697 of related accrued interest. We issued 31 shares of series D Preferred Stock upon the conversion of $46,750 of notes and $12,670 of related accrued interest. We issued 291 shares of Series D Preferred Stock for cash proceeds of $582,000.
|
| X |
- References
+ Details
| Name: |
us-gaap_SubsequentEventsAbstract |
| Namespace Prefix: |
us-gaap_ |
| Data Type: |
xbrli:stringItemType |
| Balance Type: |
na |
| Period Type: |
duration |
|
| X |
- DefinitionThe entire disclosure for significant events or transactions that occurred after the balance sheet date through the date the financial statements were issued or the date the financial statements were available to be issued. Examples include: the sale of a capital stock issue, purchase of a business, settlement of litigation, catastrophic loss, significant foreign exchange rate changes, loans to insiders or affiliates, and transactions not in the ordinary course of business. Reference 1: http://www.xbrl.org/2003/role/disclosureRef
-Topic 855
-Name Accounting Standards Codification
-Publisher FASB
-URI https://asc.fasb.org//855/tableOfContent
Reference 2: http://www.xbrl.org/2003/role/disclosureRef
-Topic 855
-SubTopic 10
-Name Accounting Standards Codification
-Section 50
-Paragraph 2
-Subparagraph (a)
-Publisher FASB
-URI https://asc.fasb.org//1943274/2147483399/855-10-50-2
| Name: |
us-gaap_SubsequentEventsTextBlock |
| Namespace Prefix: |
us-gaap_ |
| Data Type: |
dtr-types:textBlockItemType |
| Balance Type: |
na |
| Period Type: |
duration |
|
v3.23.2
SUMMARY OF SIGNIFICANT ACCOUNTING POLICIES (Policies)
|
12 Months Ended |
Dec. 31, 2022 |
|---|
| SUMMARY OF SIGNIFICANT ACCOUNTING POLICIES |
|
| Principles of Consolidation |
The financial statements include the accounts of the company and its wholly owned subsidiaries Ocean Thermal Energy Bahamas Ltd., OTE BM Ltd. and OCEES International Inc. Intercompany balances and transactions have been eliminated in consolidation. Our consolidated financial statements for the years ended December 31, 2022 and 2021, include the following subsidiaries: Name | | Place of Incorporation / Establishment | | Principal Activities | | Date Formed | Ocean Thermal Energy Bahamas Ltd. | | Bahamas | | Intermediate holding company of OTE BM Ltd. and OTE Bahamas O&M Ltd. | | 07/04/2011 | | | | | | | | OTE BM Ltd. | | Bahamas | | OTEC/SDC development in the Bahamas | | 09/07/2011 | | | | | | | | OCEES International Inc. | | Hawaii, USA | | Research and development for the Pacific Rim | | 01/21/1998 |
We have an effective interest of 100% in each of our subsidiaries. Agreement to Sell Subsidiary On August 25, 2022, we entered into a Stock Purchase Agreement to sell OCEES International, Inc. (“OCEES”), to Epaphus Global Energy, LLC (“Epaphus”). Epaphus is controlled by Jeremy Feakins, our Chief Executive Officer and a director. The transaction was approved unanimously by our directors who do not have an interest in the transaction. In exchange for the sale of OCEES, we will receive: | • | $1,000,000 in the form of canceled amounts owed by us to certain individuals, including Mr. Feakins, who have assigned their right to receive those payments to Epaphus; | | • | $75,000 in cash per month for 12 months following the date of the purchase agreement; and | | • | 70% of the net profit of any currently contemplated project to build an ocean thermal energy conversion power plants entered into by OCEES. |
Under the terms of the purchase agreement, Epaphus has the unilateral right to return OCEES to us and receive a full refund of all portions of the purchase price paid as of the return of OCEES at any time for year following the date of the purchase agreement. The purchase agreement has not yet closed.
|
| Use of Estimates |
In preparing financial statements in conformity with GAAP, management is required to make estimates and assumptions that affect the reported amounts of assets and liabilities and the disclosure of contingent assets and liabilities at the date of the financial statements and revenues and expenses during the reported period. Actual results could differ from those estimates. Significant estimates include the assumptions used in the valuation of equity-based transactions, valuation of derivative liabilities, and valuation of deferred tax assets.
|
| Cash and Cash Equivalents |
We consider all highly liquid temporary cash investments with an original maturity of three months or less to be cash equivalents. We had no cash equivalents at December 31, 2022 and 2021.
|
| Income Taxes |
We use the liability method of accounting for income taxes. Under the liability method, deferred tax assets and liabilities are determined based on temporary differences between financial reporting and tax bases of assets and liabilities and on the amount of operating loss carry-forwards and are measured using the enacted tax rates and laws that will be in effect when the temporary differences and carry-forwards are expected to reverse. An allowance against deferred tax assets is recorded when it is more likely than not that such tax benefits will not be realized. Our ability to use our net operating loss carryforwards may be substantially limited due to ownership change limitations that may have occurred or that could occur in the future, as required by Section 382 of the Internal Revenue Code of 1986, as amended (the “Code”), as well as similar state provisions. These ownership changes may limit the amount of net operating loss that can be utilized annually to offset future taxable income and tax, respectively. In general, an “ownership change” as defined by Section 382 of the Code results from a transaction or series of transactions over a three-year period resulting in an ownership change of more than 50.0% of the outstanding stock of a company by certain stockholders or public groups. We have not completed a study to assess whether an ownership change has occurred or whether there have been multiple ownership changes since we became a “loss corporation” under the definition of Section 382. If we have experienced an ownership change, utilization of the net operating loss carryforwards would be subject to an annual limitation under Section 382 of the Code, which is determined by first multiplying the value of our stock at the time of the ownership change by the applicable long-term, tax-exempt rate, and then could be subject to additional adjustments, as required. Any limitation may result in expiration of a portion of the net operating loss carryforwards before utilization. Further, until a study is completed and any limitation known, no positions related to limitations are being considered as an uncertain tax position or disclosed as an unrecognized tax benefit. Any carryforwards that expire prior to utilization as a result of such limitations will be removed from deferred tax assets with a corresponding reduction of the valuation allowance. Due to the existence of the valuation allowance, it is not expected that any possible limitation will have an impact on our results of operations or financial position.
|
| Business Segments |
We operate in one segment and, therefore, segment information is not presented.
|
| Fair Value |
Financial Accounting Standards Board Accounting Standard Codification (“ASC”) Topic 820, Fair Value Measurements and Disclosures, defines fair value, establishes a framework for measuring fair value under GAAP, and enhances disclosures about fair value measurements. ASC 820 describes a fair value hierarchy based on three levels of inputs, of which the first two are considered observable and the last unobservable, that may be used to measure fair value, which are the following: | · | Level 1-Pricing inputs are quoted prices available in active markets for identical assets or liabilities as of the reporting date. | | · | Level 2-Pricing inputs are quoted for similar assets or inputs that are observable, either directly or indirectly, for substantially the full term through corroboration with observable market data. Level 2 includes assets or liabilities valued at quoted prices adjusted for legal or contractual restrictions specific to these investments. | | · | Level 3-Pricing inputs are unobservable for the assets or liabilities; that is, the inputs reflect the reporting entity’s own assumptions about the assumptions market participants would use in pricing the asset or liability. |
Management believes the carrying amounts of the short-term financial instruments, including cash and cash equivalents, prepaid expenses, accounts payable, accrued liabilities, notes payable, and other liabilities, reflected in the accompanying balance sheets, approximate fair value at December 31, 2022 and December 31, 2021, due to the relatively short-term nature of these instruments. We accounted for derivative liability at fair value on a recurring basis under Level 3 at December 31, 2022 and 2021 (see Note 5).
|
| Concentrations |
Cash, cash equivalents, and restricted cash are deposited with major financial institutions, and at times, such balances with any one financial institution may be in excess of FDIC-insured limits. As of December 31, 2022 and 2021, no balances exceeded FDIC-insured limits.
|
| Loss per Share |
Basic loss per share is calculated by dividing our net loss available to common shareholders by the weighted average number of common shares during the period. Diluted loss per share is calculated by dividing our net loss by the diluted weighted average number of shares outstanding during the period. The diluted weighted average number of shares outstanding is the basic weighted number of shares adjusted for any potentially dilutive debt or equity. The following potentially dilutive securities have been excluded from the computation of diluted weighted average shares outstanding as of December 31, 2022 and 2021, as they would be anti-dilutive: | | Years Ended December 31, | | | | 2022 | | | 2021 | | Shares underlying warrants outstanding | | | 125,073 | | | | 125,073 | | Shares underlying convertible notes outstanding | | | 836,901,049 | | | | 925,654,995 | | Shares underlying convertible preferred stock outstanding | | | 16,687,500 | | | | 16,687,500 | | | | | 853,713,622 | | | | 942,467,568 | |
|
| Revenue Recognition |
We account for our revenue in accordance with Accounting Standard Update 2014-09, Revenue from Contracts with Customers (Topic 606), which requires a company to recognize revenue to depict the transfer of goods or services to a customer at an amount that reflects the consideration it expects to receive in exchange for those goods or services.
|
| Reclassifications |
Certain prior-year amounts have been reclassified to conform to the current period presentation.
|
| Recent Accounting Pronouncements |
We have reviewed all recently issued, but not yet adopted, accounting standards in order to determine their effects, if any, on our consolidated results of operations, financial position, and cash flows. Based on that review, we believe that none of these pronouncements will have a significant effect on current or future earnings or operations.
|
| X |
- References
+ Details
| Name: |
cpwr_NoteSummaryOfSignificantAccountingPoliciesAbstract |
| Namespace Prefix: |
cpwr_ |
| Data Type: |
xbrli:stringItemType |
| Balance Type: |
na |
| Period Type: |
duration |
|
| X |
- References
+ Details
| Name: |
cpwr_ReclassificationsPolicyTextBlock |
| Namespace Prefix: |
cpwr_ |
| Data Type: |
nonnum:textBlockItemType |
| Balance Type: |
na |
| Period Type: |
duration |
|
| X |
- DefinitionDisclosure of accounting policy for cash and cash equivalents, including the policy for determining which items are treated as cash equivalents. Other information that may be disclosed includes (1) the nature of any restrictions on the entity's use of its cash and cash equivalents, (2) whether the entity's cash and cash equivalents are insured or expose the entity to credit risk, (3) the classification of any negative balance accounts (overdrafts), and (4) the carrying basis of cash equivalents (for example, at cost) and whether the carrying amount of cash equivalents approximates fair value. Reference 1: http://fasb.org/us-gaap/role/ref/legacyRef
-Name Accounting Standards Codification
-Topic 230
-SubTopic 10
-Section 50
-Paragraph 1
-Publisher FASB
-URI https://asc.fasb.org//1943274/2147482913/230-10-50-1
| Name: |
us-gaap_CashAndCashEquivalentsPolicyTextBlock |
| Namespace Prefix: |
us-gaap_ |
| Data Type: |
dtr-types:textBlockItemType |
| Balance Type: |
na |
| Period Type: |
duration |
|
| X |
- DefinitionDisclosure of accounting policy for credit risk. Reference 1: http://fasb.org/us-gaap/role/ref/legacyRef
-Name Accounting Standards Codification
-Topic 942
-SubTopic 825
-Section 50
-Paragraph 1
-Publisher FASB
-URI https://asc.fasb.org//1943274/2147480981/942-825-50-1
Reference 2: http://www.xbrl.org/2003/role/disclosureRef
-Name Accounting Standards Codification
-Section 50
-Paragraph 1
-Subparagraph (d)
-SubTopic 10
-Topic 275
-Publisher FASB
-URI https://asc.fasb.org//1943274/2147482861/275-10-50-1
| Name: |
us-gaap_ConcentrationRiskCreditRisk |
| Namespace Prefix: |
us-gaap_ |
| Data Type: |
dtr-types:textBlockItemType |
| Balance Type: |
na |
| Period Type: |
duration |
|
| X |
- DefinitionDisclosure of accounting policy for consolidation to describe the significant judgments and assumptions made in determining whether a variable interest held by the entity requires the variable interest entity to be consolidated and (or) disclose information about its involvement with the variable interest entity; the methodology used by the entity for determining whether or not it is the primary beneficiary of the variable interest entity; and the significant factors considered and judgments made in determining that the power to direct the activities that significantly impact the economic performance of the variable interest entity are shared (as defined). Reference 1: http://fasb.org/us-gaap/role/ref/legacyRef
-Name Accounting Standards Codification
-Topic 810
-SubTopic 10
-Section 50
-Paragraph 4
-Subparagraph (e)
-Publisher FASB
-URI https://asc.fasb.org//1943274/2147481203/810-10-50-4
Reference 2: http://fasb.org/us-gaap/role/ref/legacyRef
-Name Accounting Standards Codification
-Topic 810
-SubTopic 10
-Section 50
-Paragraph 5A
-Subparagraph (a)
-Publisher FASB
-URI https://asc.fasb.org//1943274/2147481203/810-10-50-5A
Reference 3: http://fasb.org/us-gaap/role/ref/legacyRef
-Name Accounting Standards Codification
-Topic 810
-SubTopic 10
-Section 50
-Paragraph 2AA
-Subparagraph a
-Publisher FASB
-URI https://asc.fasb.org//1943274/2147481203/810-10-50-2AA
| Name: |
us-gaap_ConsolidationVariableInterestEntityPolicy |
| Namespace Prefix: |
us-gaap_ |
| Data Type: |
dtr-types:textBlockItemType |
| Balance Type: |
na |
| Period Type: |
duration |
|
| X |
- DefinitionDisclosure of accounting policy for computing basic and diluted earnings or loss per share for each class of common stock and participating security. Addresses all significant policy factors, including any antidilutive items that have been excluded from the computation and takes into account stock dividends, splits and reverse splits that occur after the balance sheet date of the latest reporting period but before the issuance of the financial statements. Reference 1: http://fasb.org/us-gaap/role/ref/legacyRef
-Name Accounting Standards Codification
-Topic 260
-SubTopic 10
-Section 50
-Paragraph 1
-Subparagraph (c)
-Publisher FASB
-URI https://asc.fasb.org//1943274/2147482662/260-10-50-1
Reference 2: http://fasb.org/us-gaap/role/ref/legacyRef
-Name Accounting Standards Codification
-Topic 260
-SubTopic 10
-Section 50
-Paragraph 2
-Publisher FASB
-URI https://asc.fasb.org//1943274/2147482662/260-10-50-2
| Name: |
us-gaap_EarningsPerSharePolicyTextBlock |
| Namespace Prefix: |
us-gaap_ |
| Data Type: |
dtr-types:textBlockItemType |
| Balance Type: |
na |
| Period Type: |
duration |
|
| X |
- DefinitionDisclosure of accounting policy for fair value measurements of financial and non-financial assets, liabilities and instruments classified in shareholders' equity. Disclosures include, but are not limited to, how an entity that manages a group of financial assets and liabilities on the basis of its net exposure measures the fair value of those assets and liabilities.
| Name: |
us-gaap_FairValueMeasurementPolicyPolicyTextBlock |
| Namespace Prefix: |
us-gaap_ |
| Data Type: |
dtr-types:textBlockItemType |
| Balance Type: |
na |
| Period Type: |
duration |
|
| X |
- DefinitionDisclosure of accounting policy for income taxes, which may include its accounting policies for recognizing and measuring deferred tax assets and liabilities and related valuation allowances, recognizing investment tax credits, operating loss carryforwards, tax credit carryforwards, and other carryforwards, methodologies for determining its effective income tax rate and the characterization of interest and penalties in the financial statements. Reference 1: http://www.xbrl.org/2003/role/disclosureRef
-Topic 946
-SubTopic 10
-Name Accounting Standards Codification
-Section S99
-Paragraph 3
-Subparagraph (SX 210.6-03(h)(1))
-Publisher FASB
-URI https://asc.fasb.org//1943274/2147479886/946-10-S99-3
Reference 2: http://www.xbrl.org/2003/role/disclosureRef
-Topic 740
-SubTopic 10
-Name Accounting Standards Codification
-Section 50
-Paragraph 17
-Subparagraph (b)
-Publisher FASB
-URI https://asc.fasb.org//1943274/2147482685/740-10-50-17
Reference 3: http://www.xbrl.org/2003/role/disclosureRef
-Topic 740
-SubTopic 10
-Name Accounting Standards Codification
-Section 50
-Paragraph 9
-Publisher FASB
-URI https://asc.fasb.org//1943274/2147482685/740-10-50-9
Reference 4: http://www.xbrl.org/2003/role/disclosureRef
-Topic 740
-SubTopic 10
-Name Accounting Standards Codification
-Section 45
-Paragraph 25
-Publisher FASB
-URI https://asc.fasb.org//1943274/2147482525/740-10-45-25
Reference 5: http://www.xbrl.org/2003/role/disclosureRef
-Topic 740
-SubTopic 10
-Name Accounting Standards Codification
-Section 45
-Paragraph 28
-Publisher FASB
-URI https://asc.fasb.org//1943274/2147482525/740-10-45-28
Reference 6: http://www.xbrl.org/2003/role/disclosureRef
-Topic 740
-SubTopic 10
-Name Accounting Standards Codification
-Section 50
-Paragraph 19
-Publisher FASB
-URI https://asc.fasb.org//1943274/2147482685/740-10-50-19
Reference 7: http://www.xbrl.org/2003/role/disclosureRef
-Topic 220
-SubTopic 10
-Name Accounting Standards Codification
-Section 50
-Paragraph 1
-Publisher FASB
-URI https://asc.fasb.org//1943274/2147482765/220-10-50-1
Reference 8: http://www.xbrl.org/2003/role/disclosureRef
-Topic 740
-SubTopic 10
-Name Accounting Standards Codification
-Section 50
-Paragraph 20
-Publisher FASB
-URI https://asc.fasb.org//1943274/2147482685/740-10-50-20
| Name: |
us-gaap_IncomeTaxPolicyTextBlock |
| Namespace Prefix: |
us-gaap_ |
| Data Type: |
dtr-types:textBlockItemType |
| Balance Type: |
na |
| Period Type: |
duration |
|
| X |
- DefinitionDisclosure of accounting policy pertaining to new accounting pronouncements that may impact the entity's financial reporting. Includes, but is not limited to, quantification of the expected or actual impact.
| Name: |
us-gaap_NewAccountingPronouncementsPolicyPolicyTextBlock |
| Namespace Prefix: |
us-gaap_ |
| Data Type: |
dtr-types:textBlockItemType |
| Balance Type: |
na |
| Period Type: |
duration |
|
| X |
- DefinitionDisclosure of accounting policy for revenue. Includes revenue from contract with customer and from other sources. Reference 1: http://www.xbrl.org/2003/role/disclosureRef
-Topic 946
-SubTopic 220
-Name Accounting Standards Codification
-Section S99
-Paragraph 1
-Subparagraph (SX 210.6-07(1))
-Publisher FASB
-URI https://asc.fasb.org//1943274/2147483575/946-220-S99-1
Reference 2: http://www.xbrl.org/2003/role/exampleRef
-Topic 235
-SubTopic 10
-Name Accounting Standards Codification
-Section 50
-Paragraph 4
-Subparagraph (f)
-Publisher FASB
-URI https://asc.fasb.org//1943274/2147483426/235-10-50-4
Reference 3: http://www.xbrl.org/2003/role/exampleRef
-Name Accounting Standards Codification
-Section 50
-Paragraph 4
-Subparagraph (e)
-SubTopic 10
-Topic 235
-Publisher FASB
-URI https://asc.fasb.org//1943274/2147483426/235-10-50-4
| Name: |
us-gaap_RevenueRecognitionPolicyTextBlock |
| Namespace Prefix: |
us-gaap_ |
| Data Type: |
dtr-types:textBlockItemType |
| Balance Type: |
na |
| Period Type: |
duration |
|
| X |
- DefinitionDisclosure of accounting policy for segment reporting. Reference 1: http://www.xbrl.org/2003/role/exampleRef
-Topic 280
-SubTopic 10
-Name Accounting Standards Codification
-Section 55
-Paragraph 47
-Subparagraph (b)
-Publisher FASB
-URI https://asc.fasb.org//1943274/2147482785/280-10-55-47
Reference 2: http://www.xbrl.org/2003/role/disclosureRef
-Topic 280
-SubTopic 10
-Name Accounting Standards Codification
-Section 50
-Paragraph 29
-Subparagraph (d)
-Publisher FASB
-URI https://asc.fasb.org//1943274/2147482810/280-10-50-29
Reference 3: http://www.xbrl.org/2003/role/disclosureRef
-Topic 280
-SubTopic 10
-Name Accounting Standards Codification
-Section 50
-Paragraph 41
-Subparagraph (a)
-Publisher FASB
-URI https://asc.fasb.org//1943274/2147482810/280-10-50-41
Reference 4: http://www.xbrl.org/2003/role/disclosureRef
-Topic 280
-SubTopic 10
-Name Accounting Standards Codification
-Section 50
-Paragraph 29
-Publisher FASB
-URI https://asc.fasb.org//1943274/2147482810/280-10-50-29
Reference 5: http://www.xbrl.org/2003/role/disclosureRef
-Topic 280
-SubTopic 10
-Name Accounting Standards Codification
-Section 50
-Paragraph 29
-Subparagraph (a)
-Publisher FASB
-URI https://asc.fasb.org//1943274/2147482810/280-10-50-29
Reference 6: http://www.xbrl.org/2003/role/disclosureRef
-Topic 280
-SubTopic 10
-Name Accounting Standards Codification
-Section 50
-Paragraph 29
-Subparagraph (b)
-Publisher FASB
-URI https://asc.fasb.org//1943274/2147482810/280-10-50-29
Reference 7: http://www.xbrl.org/2003/role/disclosureRef
-Topic 280
-SubTopic 10
-Name Accounting Standards Codification
-Section 50
-Paragraph 29
-Subparagraph (c)
-Publisher FASB
-URI https://asc.fasb.org//1943274/2147482810/280-10-50-29
Reference 8: http://www.xbrl.org/2003/role/disclosureRef
-Topic 280
-SubTopic 10
-Name Accounting Standards Codification
-Section 50
-Paragraph 29
-Subparagraph (e)
-Publisher FASB
-URI https://asc.fasb.org//1943274/2147482810/280-10-50-29
| Name: |
us-gaap_SegmentReportingPolicyPolicyTextBlock |
| Namespace Prefix: |
us-gaap_ |
| Data Type: |
dtr-types:textBlockItemType |
| Balance Type: |
na |
| Period Type: |
duration |
|
| X |
- DefinitionDisclosure of accounting policy for the use of estimates in the preparation of financial statements in conformity with generally accepted accounting principles. Reference 1: http://fasb.org/us-gaap/role/ref/legacyRef
-Name Accounting Standards Codification
-Topic 275
-SubTopic 10
-Section 50
-Paragraph 9
-Publisher FASB
-URI https://asc.fasb.org//1943274/2147482861/275-10-50-9
Reference 2: http://fasb.org/us-gaap/role/ref/legacyRef
-Name Accounting Standards Codification
-Topic 275
-SubTopic 10
-Section 50
-Paragraph 4
-Publisher FASB
-URI https://asc.fasb.org//1943274/2147482861/275-10-50-4
Reference 3: http://www.xbrl.org/2003/role/disclosureRef
-Name Accounting Standards Codification
-Section 50
-Paragraph 1
-Subparagraph (b)
-SubTopic 10
-Topic 275
-Publisher FASB
-URI https://asc.fasb.org//1943274/2147482861/275-10-50-1
Reference 4: http://www.xbrl.org/2003/role/disclosureRef
-Name Accounting Standards Codification
-Section 50
-Paragraph 1
-Subparagraph (c)
-SubTopic 10
-Topic 275
-Publisher FASB
-URI https://asc.fasb.org//1943274/2147482861/275-10-50-1
Reference 5: http://www.xbrl.org/2003/role/disclosureRef
-Name Accounting Standards Codification
-Section 50
-Paragraph 11
-SubTopic 10
-Topic 275
-Publisher FASB
-URI https://asc.fasb.org//1943274/2147482861/275-10-50-11
Reference 6: http://www.xbrl.org/2003/role/disclosureRef
-Name Accounting Standards Codification
-Section 50
-Paragraph 12
-SubTopic 10
-Topic 275
-Publisher FASB
-URI https://asc.fasb.org//1943274/2147482861/275-10-50-12
Reference 7: http://fasb.org/us-gaap/role/ref/legacyRef
-Name Accounting Standards Codification
-Topic 275
-SubTopic 10
-Section 50
-Paragraph 8
-Publisher FASB
-URI https://asc.fasb.org//1943274/2147482861/275-10-50-8
| Name: |
us-gaap_UseOfEstimates |
| Namespace Prefix: |
us-gaap_ |
| Data Type: |
dtr-types:textBlockItemType |
| Balance Type: |
na |
| Period Type: |
duration |
|
v3.23.2
SUMMARY OF SIGNIFICANT ACCOUNTING POLICIES (Tables)
|
12 Months Ended |
Dec. 31, 2022 |
|---|
| SUMMARY OF SIGNIFICANT ACCOUNTING POLICIES |
|
| Schedule of Subsidiaries |
Name | | Place of Incorporation / Establishment | | Principal Activities | | Date Formed | Ocean Thermal Energy Bahamas Ltd. | | Bahamas | | Intermediate holding company of OTE BM Ltd. and OTE Bahamas O&M Ltd. | | 07/04/2011 | | | | | | | | OTE BM Ltd. | | Bahamas | | OTEC/SDC development in the Bahamas | | 09/07/2011 | | | | | | | | OCEES International Inc. | | Hawaii, USA | | Research and development for the Pacific Rim | | 01/21/1998 |
|
| Schedule of computation of diluted weighted average shares |
| | Years Ended December 31, | | | | 2022 | | | 2021 | | Shares underlying warrants outstanding | | | 125,073 | | | | 125,073 | | Shares underlying convertible notes outstanding | | | 836,901,049 | | | | 925,654,995 | | Shares underlying convertible preferred stock outstanding | | | 16,687,500 | | | | 16,687,500 | | | | | 853,713,622 | | | | 942,467,568 | |
|
| X |
- References
+ Details
| Name: |
cpwr_NoteSummaryOfSignificantAccountingPoliciesAbstract |
| Namespace Prefix: |
cpwr_ |
| Data Type: |
xbrli:stringItemType |
| Balance Type: |
na |
| Period Type: |
duration |
|
| X |
- DefinitionTabular disclosure of the key aspects of a subsidiary (partnership, corporation, or other entity) of the limited liability company or limited partnership.
| Name: |
us-gaap_ScheduleOfSubsidiaryOfLimitedLiabilityCompanyOrLimitedPartnershipDescriptionTextBlock |
| Namespace Prefix: |
us-gaap_ |
| Data Type: |
dtr-types:textBlockItemType |
| Balance Type: |
na |
| Period Type: |
duration |
|
| X |
- DefinitionTabular disclosure of the weighted average number of shares used in calculating basic net earnings per share (or unit) and diluted earnings per share (or unit). Reference 1: http://fasb.org/us-gaap/role/ref/legacyRef
-Name Accounting Standards Codification
-Topic 260
-SubTopic 10
-Section 50
-Paragraph 1
-Publisher FASB
-URI https://asc.fasb.org//1943274/2147482662/260-10-50-1
| Name: |
us-gaap_ScheduleOfWeightedAverageNumberOfSharesTableTextBlock |
| Namespace Prefix: |
us-gaap_ |
| Data Type: |
dtr-types:textBlockItemType |
| Balance Type: |
na |
| Period Type: |
duration |
|
v3.23.2
CONVERTIBLE NOTES AND NOTES PAYABLE (Tables)
|
12 Months Ended |
Dec. 31, 2022 |
|---|
| CONVERTIBLE NOTES AND NOTES PAYABLE |
|
| Convertible notes and notes payable December 31, 2022 |
Date of | | | Maturity | | | Interest | | | In | | Original | | | Principal at December 31, | | | Discount at December 31, | | | Carrying Amount at December 31, | | | Related Party | | | Non Related Party | | Issuance | | | Date | | | Rate | | | Default | | Principal | | | 2022 | | | 2022 | | | 2022 | | | Current | | | Long-Term | | | Current | | | Long-Term | | 12/01/07 | | | 09/01/15 | | | | 7.00 | % | | Yes | | | 125,000 | | | | 85,821 | | | | - | | | | 85,821 | | | | - | | | | - | | | | 85,821 | | | | - | | 09/25/09 | | | 10/25/11 | | | | 5.00 | % | | Yes | | | 50,000 | | | | 50,000 | | | | - | | | | 50,000 | | | | - | | | | - | | | | 50,000 | | | | - | | 12/23/09 | | | 12/23/14 | | | | 7.00 | % | | Yes | | | 100,000 | | | | 83,166 | | | | - | | | | 83,166 | | | | - | | | | - | | | | 83,166 | | | | - | | 12/23/09 | | | 12/23/14 | | | | 7.00 | % | | Yes | | | 25,000 | | | | 22,233 | | | | - | | | | 22,233 | | | | - | | | | - | | | | 22,233 | | | | - | | 12/23/09 | | | 12/23/14 | | | | 7.00 | % | | Yes | | | 25,000 | | | | 22,223 | | | | - | | | | 22,223 | | | | - | | | | - | | | | 22,223 | | | | - | | 02/03/12 | | | 12/31/19 | | | | 10.00 | % | | Yes | | | 1,000,000 | | | | 1,000,000 | | | | - | | | | 1,000,000 | | | | - | | | | - | | | | 1,000,000 | | | | - | | 08/15/13 | | | 10/31/23 | | | | 10.00 | % | | No | | | 158,334 | | | | 158,334 | | | | - | | | | 158,334 | | | | - | | | | - | | | | 158,334 | | | | - | | 12/31/13 | | | 12/31/15 | | | | 8.00 | % | | Yes | | | 290,000 | | | | 130,000 | | | | - | | | | 130,000 | | | | - | | | | - | | | | 130,000 | | | | - | | 04/01/14 | | | 12/31/18 | | | | 10.00 | % | | Yes | | | 2,265,000 | | | | 1,102,500 | | | | - | | | | 1,102,500 | | | | 1,102,500 | | | | - | | | | - | | | | - | | 12/22/14 | | | 03/31/15 | | | | 22.00 | %* | | Yes | | | 200,000 | | | | 200,000 | | | | - | | | | 200,000 | | | | - | | | | - | | | | 200,000 | | | | - | | 12/26/14 | | | 12/26/15 | | | | 22.00 | %* | | Yes | | | 100,000 | | | | 100,000 | | | | - | | | | 100,000 | | | | - | | | | - | | | | 100,000 | | | | - | | 03/12/15 | | | (1) | | | | 6.00 | % | | No | | | 394,380 | | | | 394,380 | | | | - | | | | 394,380 | | | | 394,380 | | | | - | | | | - | | | | - | | 04/07/15 | | | 04/07/18 | | | | 10.00 | % | | Yes | | | 50,000 | | | | 50,000 | | | | - | | | | 50,000 | | | | - | | | | - | | | | 50,000 | | | | - | | 11/23/15 | | | (1) | | | | 6.00 | % | | No | | | 50,000 | | | | 50,000 | | | | - | | | | 50,000 | | | | 50,000 | | | | - | | | | - | | | | - | | 02/25/16 | | | (1) | | | | 6.00 | % | | No | | | 50,000 | | | | 50,000 | | | | - | | | | 50,000 | | | | 50,000 | | | | - | | | | - | | | | - | | 05/20/16 | | | (1) | | | | 6.00 | % | | No | | | 50,000 | | | | 50,000 | | | | - | | | | 50,000 | | | | 50,000 | | | | - | | | | - | | | | - | | 10/20/16 | | | (1) | | | | 6.00 | % | | No | | | 37,500 | | | | 12,500 | | | | - | | | | 12,500 | | | | 12,500 | | | | - | | | | - | | | | - | | 10/20/16 | | | (1) | | | | 6.00 | % | | No | | | 12,500 | | | | 12,500 | | | | - | | | | 12,500 | | | | 12,500 | | | | - | | | | - | | | | - | | 12/21/16 | | | (1) | | | | 6.00 | % | | No | | | 25,000 | | | | 25,000 | | | | - | | | | 25,000 | | | | 25,000 | | | | - | | | | - | | | | - | | 03/09/17 | | | (1) | | | | 10.00 | % | | No | | | 200,000 | | | | 177,000 | | | | - | | | | 177,000 | | | | 177,000 | | | | - | | | | - | | | | - | | 07/13/17 | | | 07/13/19 | | | | 6.00 | % | | Yes | | | 25,000 | | | | 25,000 | | | | - | | | | 25,000 | | | | - | | | | - | | | | 25,000 | | | | - | | 07/18/17 | | | 07/18/19 | | | | 6.00 | % | | Yes | | | 25,000 | | | | 25,000 | | | | - | | | | 25,000 | | | | - | | | | - | | | | 25,000 | | | | - | | 07/26/17 | | | 07/26/19 | | | | 6.00 | % | | Yes | | | 15,000 | | | | 15,000 | | | | - | | | | 15,000 | | | | - | | | | - | | | | 15,000 | | | | - | | 12/20/17 | | | (2) | | | | 10.00 | % | | Yes | | | 979,156 | | | | 859,156 | | | | - | | | | 859,156 | | | | - | | | | - | | | | 859,156 | | | | - | | 11/06/17 | | | 12/31/18 | | | | 10.00 | % | | Yes | | | 646,568 | | | | 543,093 | | | | - | | | | 543,093 | | | | 543,093 | | | | - | | | | - | | | | - | | 02/19/18 | | | (3) | | | | 18.00 | %* | | Yes | | | 629,451 | | | | 1,161,136 | | | | - | | | | 1,161,136 | | | | - | | | | - | | | | 1,161,136 | | | | - | | 09/19/18 | | | 09/28/21 | | | | 6.00 | % | | Yes | | | 10,000 | | | | 10,000 | | | | - | | | | 10,000 | | | | - | | | | - | | | | 10,000 | | | | - | | 12/14/18 | | | 12/22/18 | | | | 24.00 | %* | | Yes | | | 474,759 | | | | 578,075 | | | | - | | | | 578,075 | | | | - | | | | - | | | | 578,075 | | | | - | | 01/02/19 | | | (4) | | | | 17.00 | % | | No | | | 310,000 | | | | 310,000 | | | | - | | | | 310,000 | | | | - | | | | - | | | | 310,000 | | | | - | | 08/14/19 | | | 10/31/2021 | | | | 8.00 | % | | Yes | | | 26,200 | | | | 26,200 | | | | - | | | | 26,200 | | | | - | | | | - | | | | 26,200 | | | | - | | (5) | | | 10/31/2021 | | | | 8.00 | % | | Yes | | | 105,000 | | | | 75,000 | | | | - | | | | 75,000 | | | | 5,000 | | | | - | | | | 70,000 | | | | - | | (6) | | | 01/02/22 | | | | 8.00 | % | | Yes | | | 296,750 | | | | 231,750 | | | | - | | | | 231,750 | | | | 15,000 | | | | - | | | | 216,750 | | | | - | | (8) | | | 05/12/22 | | | | 8.00 | % | | Yes | | | 15,000 | | | | 15,000 | | | | - | | | | 15,000 | | | | - | | | | - | | | | 15,000 | | | | - | | (9) | | | 09/01/22 | | | | 8.00 | % | | Yes | | | 170,000 | | | | 155,000 | | | | - | | | | 155,000 | | | | - | | | | - | | | | 155,000 | | | | - | | (10) | | | 08/30/23 | | | | 8.00 | % | | No | | | 285,000 | | | | 285,000 | | | | 87,233 | | | | 197,767 | | | | 3,528 | | | | - | | | | 194,239 | | | | - | | (11) | | | 11/30/23 | | | | 8.00 | % | | No | | | 5,000 | | | | 5,000 | | | | 1,307 | | | | 3,693 | | | | 3,693 | | | | - | | | | - | | | | - | | (7) | | | (7) | | | | 10.00 | % | | No | | | 625,000 | | | | 625,000 | | | | - | | | | 625,000 | | | | - | | | | - | | | | 625,000 | | | | - | | | | | | | | | | | | | | $ | 9,850,598 | | | $ | 8,720,067 | | | $ | 88,540 | | | $ | 8,631,527 | | | $ | 2,444,194 | | | $ | - | | | $ | 6,187,333 | | | $ | - | |
|
| Convertible notes and notes payable December 31, 2021 |
Date of | | | Maturity | | | Interest | | | In | | Original | | | Principal at December 31, | | | Discount at December 31, | | | Carrying Amount at December 31 | | | Related Party | | | Non Related Party | | Issuance | | | Date | | | Rate | | | Default | | Principal | | | 2021 | | | 2021 | | | 2021 | | | Current | | | Long-Term | | | Current | | | Long-Term | | 12/01/07 | | | 09/01/15 | | | | 7.00 | % | | Yes | | | 125,000 | | | | 85,821 | | | | - | | | | 85,821 | | | | - | | | | - | | | | 85,821 | | | | - | | 09/25/09 | | | 10/25/11 | | | | 5.00 | % | | Yes | | | 50,000 | | | | 50,000 | | | | - | | | | 50,000 | | | | - | | | | - | | | | 50,000 | | | | - | | 12/23/09 | | | 12/23/14 | | | | 7.00 | % | | Yes | | | 100,000 | | | | 94,414 | | | | - | | | | 94,414 | | | | - | | | | - | | | | 94,414 | | | | - | | 12/23/09 | | | 12/23/14 | | | | 7.00 | % | | Yes | | | 25,000 | | | | 23,620 | | | | - | | | | 23,620 | | | | - | | | | - | | | | 23,620 | | | | - | | 12/23/09 | | | 12/23/14 | | | | 7.00 | % | | Yes | | | 25,000 | | | | 23,610 | | | | - | | | | 23,610 | | | | - | | | | - | | | | 23,610 | | | | - | | 02/03/12 | | | 12/31/19 | | | | 10.00 | % | | Yes | | | 1,000,000 | | | | 1,000,000 | | | | - | | | | 1,000,000 | | | | - | | | | - | | | | 1,000,000 | | | | - | | 08/15/13 | | | 10/31/23 | | | | 10.00 | % | | No | | | 158,334 | | | | 158,334 | | | | - | | | | 158,334 | | | | - | | | | - | | | | - | | | | 158,334 | | 12/31/13 | | | 12/31/15 | | | | 8.00 | % | | Yes | | | 290,000 | | | | 130,000 | | | | - | | | | 130,000 | | | | - | | | | - | | | | 130,000 | | | | - | | 04/01/14 | | | 12/31/18 | | | | 10.00 | % | | Yes | | | 2,265,000 | | | | 1,102,500 | | | | - | | | | 1,102,500 | | | | 1,102,500 | | | | - | | | | - | | | | - | | 12/22/14 | | | 03/31/15 | | | | 22.00 | %* | | Yes | | | 200,000 | | | | 200,000 | | | | - | | | | 200,000 | | | | - | | | | - | | | | 200,000 | | | | - | | 12/26/14 | | | 12/26/15 | | | | 22.00 | %* | | Yes | | | 100,000 | | | | 100,000 | | | | - | | | | 100,000 | | | | - | | | | - | | | | 100,000 | | | | - | | 03/12/15 | | | (1) | | | | 6.00 | % | | No | | | 394,380 | | | | 394,380 | | | | - | | | | 394,380 | | | | 394,380 | | | | - | | | | - | | | | - | | 04/07/15 | | | 04/07/18 | | | | 10.00 | % | | Yes | | | 50,000 | | | | 50,000 | | | | - | | | | 50,000 | | | | - | | | | - | | | | 50,000 | | | | - | | 11/23/15 | | | (1) | | | | 6.00 | % | | No | | | 50,000 | | | | 50,000 | | | | - | | | | 50,000 | | | | 50,000 | | | | - | | | | - | | | | - | | 02/25/16 | | | (1) | | | | 6.00 | % | | No | | | 50,000 | | | | 50,000 | | | | - | | | | 50,000 | | | | 50,000 | | | | - | | | | - | | | | - | | 05/20/16 | | | (1) | | | | 6.00 | % | | No | | | 50,000 | | | | 50,000 | | | | - | | | | 50,000 | | | | 50,000 | | | | - | | | | - | | | | - | | 10/20/16 | | | (1) | | | | 6.00 | % | | No | | | 37,500 | | | | 12,500 | | | | - | | | | 12,500 | | | | 12,500 | | | | - | | | | - | | | | - | | 10/20/16 | | | (1) | | | | 6.00 | % | | No | | | 12,500 | | | | 12,500 | | | | - | | | | 12,500 | | | | 12,500 | | | | - | | | | - | | | | - | | 12/21/16 | | | (1) | | | | 6.00 | % | | No | | | 25,000 | | | | 25,000 | | | | - | | | | 25,000 | | | | 25,000 | | | | - | | | | - | | | | - | | 03/09/17 | | | (1) | | | | 10.00 | % | | No | | | 200,000 | | | | 177,000 | | | | - | | | | 177,000 | | | | 177,000 | | | | - | | | | - | | | | - | | 07/13/17 | | | 07/13/19 | | | | 6.00 | % | | Yes | | | 25,000 | | | | 25,000 | | | | - | | | | 25,000 | | | | - | | | | - | | | | 25,000 | | | | - | | 07/18/17 | | | 07/18/19 | | | | 6.00 | % | | Yes | | | 25,000 | | | | 25,000 | | | | - | | | | 25,000 | | | | - | | | | - | | | | 25,000 | | | | - | | 07/26/17 | | | 07/26/19 | | | | 6.00 | % | | Yes | | | 15,000 | | | | 15,000 | | | | - | | | | 15,000 | | | | - | | | | - | | | | 15,000 | | | | - | | 12/20/17 | | | (2) | | | | 10.00 | % | | Yes | | | 979,156 | | | | 979,156 | | | | - | | | | 979,156 | | | | - | | | | - | | | | 979,156 | | | | - | | 11/06/17 | | | 12/31/18 | | | | 10.00 | % | | Yes | | | 646,568 | | | | 543,093 | | | | - | | | | 543,093 | | | | 543,093 | | | | - | | | | - | | | | - | | 02/19/18 | | | (3) | | | | 18.00 | % * | | Yes | | | 629,451 | | | | 1,161,136 | | | | - | | | | 1,161,136 | | | | - | | | | - | | | | 1,161,136 | | | | - | | 09/19/18 | | | 09/28/21 | | | | 6.00 | % | | Yes | | | 10,000 | | | | 10,000 | | | | - | | | | 10,000 | | | | - | | | | - | | | | 10,000 | | | | - | | 12/14/18 | | | 12/22/18 | | | | 24.00 | %* | | Yes | | | 474,759 | | | | 623,725 | | | | - | | | | 623,725 | | | | - | | | | - | | | | 623,725 | | | | - | | 01/02/19 | | | (4) | | | | 17.00 | % | | No | | | 310,000 | | | | 310,000 | | | | - | | | | 310,000 | | | | - | | | | - | | | | 310,000 | | | | - | | 08/14/19 | | | 10/31/2021 | | | | 8.00 | % | | Yes | | | 26,200 | | | | 26,200 | | | | - | | | | 26,200 | | | | - | | | | - | | | | 26,200 | | | | - | | (5) | | | 10/31/2021 | | | | 8.00 | % | | Yes | | | 105,000 | | | | 105,000 | | | | - | | | | 105,000 | | | | 10,000 | | | | - | | | | 95,000 | | | | - | | (6) | | | 01/02/22 | | | | 8.00 | % | | No | | | 306,750 | | | | 306,750 | | | | 885 | | | | 305,865 | | | | 19,946 | | | | - | | | | 285,919 | | | | - | | (8) | | | 05/12/22 | | | | 8.00 | % | | No | | | 15,000 | | | | 15,000 | | | | 2,924 | | | | 12,076 | | | | - | | | | - | | | | 12,076 | | | | - | | (9) | | | 09/01/22 | | | | 8.00 | % | | No | | | 160,000 | | | | 160,000 | | | | 73,542 | | | | 86,458 | | | | - | | | | - | | | | 86,458 | | | | - | | (10) | | | 08/30/23 | | | | 8.00 | % | | No | | | 285,000 | | | | 285,000 | | | | 218,805 | | | | 66,195 | | | | - | | | | 1,307 | | | | - | | | | 64,888 | | (11) | | | 11/30/23 | | | | 8.00 | % | | No | | | 5,000 | | | | 5,000 | | | | 2,736 | | | | 2,264 | | | | - | | | | 2,264 | | | | - | | | | - | | (7) | | | (7) | | | | 10.00 | % | | No | | | 625,000 | | | | 625,000 | | | | - | | | | 625,000 | | | | - | | | | - | | | | 625,000 | | | | - | | | | | | | | | | | | | | $ | 9,850,598 | | | $ | 9,009,739 | | | $ | 298,892 | | | $ | 8,710,847 | | | $ | 2,446,919 | | | $ | 3,571 | | | $ | 6,037,135 | | | $ | 223,222 | |
|
| X |
- References
+ Details
| Name: |
cpwr_ConvertibleNotesAndNotesPayableAbstract |
| Namespace Prefix: |
cpwr_ |
| Data Type: |
xbrli:stringItemType |
| Balance Type: |
na |
| Period Type: |
duration |
|
| X |
- References
+ Details
| Name: |
cpwr_ConvertibleNotesAndNotesPayableDecember312022 |
| Namespace Prefix: |
cpwr_ |
| Data Type: |
nonnum:textBlockItemType |
| Balance Type: |
na |
| Period Type: |
duration |
|
| X |
- DefinitionTabular disclosure of convertible debt instrument. Includes, but is not limited to, principal amount and amortized premium or discount.
| Name: |
us-gaap_ConvertibleDebtTableTextBlock |
| Namespace Prefix: |
us-gaap_ |
| Data Type: |
dtr-types:textBlockItemType |
| Balance Type: |
na |
| Period Type: |
duration |
|
v3.23.2
DERIVATIVE LIABILITY (Tables)
|
12 Months Ended |
Dec. 31, 2022 |
|---|
| DERIVATIVE LIABILITY |
|
| Schedule of Fair value hierarchy |
| | Fair Value at December 31, | | | Quoted market prices for identical assets/liabilities (Level 1) | | | Significant other observable inputs (Level 2) | | | Significant unobservable inputs (Level 3) | | Derivative Liability, December 31, 2022 | | $ | 6,998,262 | | | $ | - | | | $ | - | | | $ | 6,998,262 | | Derivative Liability, December 31, 2021 | | $ | 3,769,211 | | | $ | - | | | $ | - | | | $ | 3,769,211 | |
|
| Schedule of reconciliation of the derivative liability |
| | For the Years Ended December 31 | | | | 2022 | | | 2021 | | Derivative liability as of January 1 | | $ | 3,769,211 | | | $ | 5,321,395 | | Addition to derivative instruments | | | - | | | | 420,214 | | Derivative liability extinguished upon conversion of notes payable | | | (199,194 | ) | | | (666,916 | ) | Change in fair value of derivative liability | | | 3,428,245 | | | | (1,305,482 | ) | Derivative liability as of December 31 | | $ | 6,998,262 | | | $ | 3,769,211 | |
|
| Schedule of change in fair value of the derivative liability |
| | For the Years Ended December 31 | | | | 2022 | | | 2021 | | Expected dividends | | | 0 | % | | | 0 | % | Expected volatility | | 184%-368 | % | | 77%-326 | % | Risk free interest rate | | 0.52%-4.73 | % | | 0.03%-0.73 | % | Expected term (in years) | | 0.25– 1.67 years | | | 0.08– 2.56 years | |
|
| Schedule of Assumptions |
| | For the Years Ended December 31 | | | | 2022 | | | 2021 | | Day one loss on valuation | | $ | - | | | $ | 97,861 | | Gains/(losses) from the change in fair value of derivative liability | | | 3,428,245 | | | | (1,403,343 | ) | Change in fair value of derivative liability* | | $ | 3,428,245 | | | $ | (1,305,482 | ) |
|
| X |
- References
+ Details
| Name: |
cpwr_DerivativeLiabilityAbstract |
| Namespace Prefix: |
cpwr_ |
| Data Type: |
xbrli:stringItemType |
| Balance Type: |
na |
| Period Type: |
duration |
|
| X |
- References
+ Details
| Name: |
cpwr_Scheduleoffairvaluehierarchytabletextblock |
| Namespace Prefix: |
cpwr_ |
| Data Type: |
nonnum:textBlockItemType |
| Balance Type: |
na |
| Period Type: |
duration |
|
| X |
- DefinitionTabular disclosure of assumption used to determine benefit obligation and net periodic benefit cost of defined benefit plan. Includes, but is not limited to, discount rate, rate of compensation increase, expected long-term rate of return on plan assets and interest crediting rate. Reference 1: http://www.xbrl.org/2003/role/disclosureRef
-Topic 715
-SubTopic 20
-Name Accounting Standards Codification
-Section 50
-Paragraph 1
-Subparagraph (k)
-Publisher FASB
-URI https://asc.fasb.org//1943274/2147480506/715-20-50-1
| Name: |
us-gaap_ScheduleOfAssumptionsUsedTableTextBlock |
| Namespace Prefix: |
us-gaap_ |
| Data Type: |
dtr-types:textBlockItemType |
| Balance Type: |
na |
| Period Type: |
duration |
|
| X |
- DefinitionTabular disclosure of derivative liabilities at fair value.
| Name: |
us-gaap_ScheduleOfDerivativeLiabilitiesAtFairValueTableTextBlock |
| Namespace Prefix: |
us-gaap_ |
| Data Type: |
dtr-types:textBlockItemType |
| Balance Type: |
na |
| Period Type: |
duration |
|
| X |
- DefinitionTabular disclosure of the reconciliation using percentage or dollar amounts of the reported amount of income tax expense attributable to continuing operations for the year to the amount of income tax expense that would result from applying domestic federal statutory tax rates to pretax income from continuing operations. Reference 1: http://fasb.org/us-gaap/role/ref/legacyRef
-Topic 740
-SubTopic 10
-Name Accounting Standards Codification
-Paragraph 12
-Section 50
-Publisher FASB
-URI https://asc.fasb.org//1943274/2147482685/740-10-50-12
| Name: |
us-gaap_ScheduleOfEffectiveIncomeTaxRateReconciliationTableTextBlock |
| Namespace Prefix: |
us-gaap_ |
| Data Type: |
dtr-types:textBlockItemType |
| Balance Type: |
na |
| Period Type: |
duration |
|
v3.23.2
STOCKHOLDERS EQUITY (Tables)
|
12 Months Ended |
Dec. 31, 2022 |
|---|
| STOCKHOLDERS EQUITY |
|
| Warrant activity |
| | Number of | | | Weighted Average | | | | Warrants | | | Exercise Price | | Balance at December 31, 2020 | | | 125,073 | | | $ | 0.13 | | Granted | | | - | | | | - | | Exercised | | | - | | | | - | | Forfeited | | | - | | | | - | | Balance at December 31, 2021 | | | 125,073 | | | $ | 0.13 | | Granted | | | - | | | | - | | Exercised | | | - | | | | - | | Forfeited | | | - | | | | - | | Balance at December 31, 2022 | | | 125,073 | | | $ | 0.13 | | Exercisable at December 31, 2022 | | | 125,073 | | | $ | 0.13 | |
|
| X |
- DefinitionTabular disclosure of warrants or rights issued. Warrants and rights outstanding are derivative securities that give the holder the right to purchase securities (usually equity) from the issuer at a specific price within a certain time frame. Warrants are often included in a new debt issue to entice investors by a higher return potential. The main difference between warrants and call options is that warrants are issued and guaranteed by the company, whereas options are exchange instruments and are not issued by the company. Also, the lifetime of a warrant is often measured in years, while the lifetime of a typical option is measured in months. Disclose the title of issue of securities called for by warrants and rights outstanding, the aggregate amount of securities called for by warrants and rights outstanding, the date from which the warrants or rights are exercisable, and the price at which the warrant or right is exercisable. Reference 1: http://fasb.org/us-gaap/role/ref/legacyRef
-Name Accounting Standards Codification
-Topic 718
-SubTopic 10
-Section 50
-Paragraph 1
-Subparagraph (a)
-Publisher FASB
-URI https://asc.fasb.org//1943274/2147480429/718-10-50-1
| Name: |
us-gaap_ScheduleOfStockholdersEquityNoteWarrantsOrRightsTextBlock |
| Namespace Prefix: |
us-gaap_ |
| Data Type: |
dtr-types:textBlockItemType |
| Balance Type: |
na |
| Period Type: |
duration |
|
| X |
- References
+ Details
| Name: |
us-gaap_StockholdersEquityAbstract |
| Namespace Prefix: |
us-gaap_ |
| Data Type: |
xbrli:stringItemType |
| Balance Type: |
na |
| Period Type: |
duration |
|
v3.23.2
INCOME TAX (Tables)
|
12 Months Ended |
Dec. 31, 2022 |
|---|
| INCOME TAX |
|
| Schedule of expected tax benefit |
| | 2022 | | | 2021 | | Statutory federal income tax rate | | | (21.0 | )% | | | (21.0 | )% | State income taxes, net of federal benefits | | | (7.9 | )% | | | (7.9 | )% | Non-deductible items | | | 15.0 | % | | | (11.4 | )% | Valuation allowance | | | 13.9 | % | | | 40.3 | % | Effective income tax rate | | | — | % | | | — | % |
|
| Deferred income taxes |
| | For the Years Ended December 31 | | | | 2022 | | | 2021 | | Impairment | | $ | 2,358,860 | | | $ | 2,358,860 | | Accrued Compensation | | | 1,517,774 | | | | 1,335,457 | | Operating loss carryforwards | | | 10,809,828 | | | | 10,028,500 | | Gross deferred tax assets | | | 14,686,462 | | | | 13,722,817 | | Valuation allowance | | | (14,686,462 | ) | | | (13,722,817 | ) | Net deferred income tax asset | | $ | - | | | $ | - | |
|
| X |
- DefinitionTabular disclosure of the components of net deferred tax asset or liability recognized in an entity's statement of financial position, including the following: the total of all deferred tax liabilities, the total of all deferred tax assets, the total valuation allowance recognized for deferred tax assets. Reference 1: http://fasb.org/us-gaap/role/ref/legacyRef
-Topic 740
-SubTopic 10
-Name Accounting Standards Codification
-Paragraph 2
-Section 50
-Publisher FASB
-URI https://asc.fasb.org//1943274/2147482685/740-10-50-2
| Name: |
us-gaap_ScheduleOfDeferredTaxAssetsAndLiabilitiesTableTextBlock |
| Namespace Prefix: |
us-gaap_ |
| Data Type: |
dtr-types:textBlockItemType |
| Balance Type: |
na |
| Period Type: |
duration |
|
| X |
- DefinitionTabular disclosure of benefits expected to be paid by pension plans and/or other employee benefit plans in each of the next five fiscal years and in the aggregate for the five fiscal years thereafter. Reference 1: http://fasb.org/us-gaap/role/ref/legacyRef
-Topic 715
-SubTopic 20
-Subparagraph (f)
-Name Accounting Standards Codification
-Paragraph 1
-Section 50
-Publisher FASB
-URI https://asc.fasb.org//1943274/2147480506/715-20-50-1
| Name: |
us-gaap_ScheduleOfExpectedBenefitPaymentsTableTextBlock |
| Namespace Prefix: |
us-gaap_ |
| Data Type: |
dtr-types:textBlockItemType |
| Balance Type: |
na |
| Period Type: |
duration |
|
v3.23.2
| X |
- References
+ Details
| Name: |
cpwr_Entityincorporationdateofincorporation |
| Namespace Prefix: |
cpwr_ |
| Data Type: |
xbrli:stringItemType |
| Balance Type: |
na |
| Period Type: |
duration |
|
| X |
- References
+ Details
| Name: |
cpwr_Placeofincorporation |
| Namespace Prefix: |
cpwr_ |
| Data Type: |
xbrli:stringItemType |
| Balance Type: |
na |
| Period Type: |
duration |
|
| X |
- References
+ Details
| Name: |
cpwr_Principalactivities |
| Namespace Prefix: |
cpwr_ |
| Data Type: |
xbrli:stringItemType |
| Balance Type: |
na |
| Period Type: |
duration |
|
v3.23.2
SUMMARY OF SIGNIFICANT ACCOUNTING POLICIES (Details 1) - shares
|
12 Months Ended |
Dec. 31, 2022 |
Dec. 31, 2021 |
| Shares Underlying Convertible Preferred Stock Outstanding |
853,713,622
|
942,467,568
|
| Convertible Notes Payable [Member] |
|
|
| Shares Underlying Convertible Preferred Stock Outstanding |
836,901,049
|
925,654,995
|
| Warrant [Member] |
|
|
| Shares Underlying Convertible Preferred Stock Outstanding |
125,073
|
125,073
|
| Convertible Preferred Stock [Member] |
|
|
| Shares Underlying Convertible Preferred Stock Outstanding |
16,687,500
|
16,687,500
|
| X |
- DefinitionThe sum of dilutive potential common shares or units used in the calculation of the diluted per-share or per-unit computation. Reference 1: http://www.xbrl.org/2009/role/commonPracticeRef
-Topic 260
-SubTopic 10
-Name Accounting Standards Codification
-Section 50
-Paragraph 1
-Subparagraph (a)
-Publisher FASB
-URI https://asc.fasb.org//1943274/2147482662/260-10-50-1
| Name: |
us-gaap_WeightedAverageNumberDilutedSharesOutstandingAdjustment |
| Namespace Prefix: |
us-gaap_ |
| Data Type: |
xbrli:sharesItemType |
| Balance Type: |
na |
| Period Type: |
duration |
|
| X |
- Details
| Name: |
us-gaap_ShortTermDebtTypeAxis=us-gaap_ConvertibleNotesPayableMember |
| Namespace Prefix: |
|
| Data Type: |
na |
| Balance Type: |
|
| Period Type: |
|
|
| X |
- Details
| Name: |
us-gaap_StatementClassOfStockAxis=cpwr_WarrantsMember |
| Namespace Prefix: |
|
| Data Type: |
na |
| Balance Type: |
|
| Period Type: |
|
|
| X |
- Details
| Name: |
us-gaap_StatementClassOfStockAxis=us-gaap_ConvertiblePreferredStockMember |
| Namespace Prefix: |
|
| Data Type: |
na |
| Balance Type: |
|
| Period Type: |
|
|
v3.23.2
| X |
- References
+ Details
| Name: |
cpwr_AssetAcquisitionDateOfAcquisitionAgreement56 |
| Namespace Prefix: |
cpwr_ |
| Data Type: |
num:percentItemType |
| Balance Type: |
na |
| Period Type: |
duration |
|
| X |
- References
+ Details
| Name: |
cpwr_CanceledAmounts |
| Namespace Prefix: |
cpwr_ |
| Data Type: |
xbrli:monetaryItemType |
| Balance Type: |
debit |
| Period Type: |
duration |
|
| X |
- DefinitionAmount of currency on hand as well as demand deposits with banks or financial institutions. Includes other kinds of accounts that have the general characteristics of demand deposits. Excludes cash and cash equivalents within disposal group and discontinued operation. Reference 1: http://www.xbrl.org/2003/role/exampleRef
-Topic 852
-SubTopic 10
-Name Accounting Standards Codification
-Section 55
-Paragraph 10
-Publisher FASB
-URI https://asc.fasb.org//1943274/2147481372/852-10-55-10
Reference 2: http://www.xbrl.org/2003/role/exampleRef
-Topic 946
-SubTopic 830
-Name Accounting Standards Codification
-Section 55
-Paragraph 12
-Publisher FASB
-URI https://asc.fasb.org//1943274/2147480167/946-830-55-12
Reference 3: http://www.xbrl.org/2003/role/disclosureRef
-Topic 944
-SubTopic 210
-Name Accounting Standards Codification
-Section S99
-Paragraph 1
-Subparagraph (SX 210.7-03(a)(2))
-Publisher FASB
-URI https://asc.fasb.org//1943274/2147479440/944-210-S99-1
Reference 4: http://www.xbrl.org/2003/role/disclosureRef
-Topic 946
-SubTopic 210
-Name Accounting Standards Codification
-Section S99
-Paragraph 1
-Subparagraph (SX 210.6-04(4))
-Publisher FASB
-URI https://asc.fasb.org//1943274/2147479617/946-210-S99-1
Reference 5: http://www.xbrl.org/2003/role/disclosureRef
-Topic 946
-SubTopic 210
-Name Accounting Standards Codification
-Section 45
-Paragraph 21
-Publisher FASB
-URI https://asc.fasb.org//1943274/2147480555/946-210-45-21
Reference 6: http://www.xbrl.org/2009/role/commonPracticeRef
-Topic 210
-SubTopic 10
-Name Accounting Standards Codification
-Section S99
-Paragraph 1
-Subparagraph (SX 210.5-02(1))
-Publisher FASB
-URI https://asc.fasb.org//1943274/2147480566/210-10-S99-1
Reference 7: http://www.xbrl.org/2003/role/disclosureRef
-Name Accounting Standards Codification
-Section 45
-Paragraph 20
-SubTopic 210
-Topic 946
-Publisher FASB
-URI https://asc.fasb.org//1943274/2147480555/946-210-45-20
| Name: |
us-gaap_Cash |
| Namespace Prefix: |
us-gaap_ |
| Data Type: |
xbrli:monetaryItemType |
| Balance Type: |
debit |
| Period Type: |
instant |
|
v3.23.2
GOING CONCERN (Details Narrative) - USD ($)
|
12 Months Ended |
|
|
Dec. 31, 2022 |
Dec. 31, 2021 |
Mar. 11, 2022 |
Dec. 31, 2020 |
| GOING CONCERN |
|
|
|
|
| Net loss |
$ (6,912,102)
|
$ (2,670,637)
|
|
|
| Cash In Operating Activities |
327,213
|
|
|
|
| Working Capital (deficiency) |
36,199,026
|
|
|
|
| Total Stockholders' Deficiency |
$ (36,199,026)
|
$ (30,027,924)
|
|
$ (28,413,169)
|
| Water Power Technology Office Bill |
|
|
$ 162,000,000
|
|
| Marine Energy |
|
|
$ 112,000,000
|
|
| X |
- References
+ Details
| Name: |
cpwr_AmountReserveForOtherProject |
| Namespace Prefix: |
cpwr_ |
| Data Type: |
xbrli:monetaryItemType |
| Balance Type: |
credit |
| Period Type: |
instant |
|
| X |
- References
+ Details
| Name: |
cpwr_BillAmountSigned |
| Namespace Prefix: |
cpwr_ |
| Data Type: |
xbrli:monetaryItemType |
| Balance Type: |
credit |
| Period Type: |
instant |
|
| X |
- References
+ Details
| Name: |
cpwr_CashUsedInOperatingActivities |
| Namespace Prefix: |
cpwr_ |
| Data Type: |
xbrli:monetaryItemType |
| Balance Type: |
debit |
| Period Type: |
duration |
|
| X |
- References
+ Details
| Name: |
cpwr_GoingConcernAbstract |
| Namespace Prefix: |
cpwr_ |
| Data Type: |
xbrli:stringItemType |
| Balance Type: |
na |
| Period Type: |
duration |
|
| X |
- References
+ Details
| Name: |
cpwr_WorkingCapital |
| Namespace Prefix: |
cpwr_ |
| Data Type: |
xbrli:monetaryItemType |
| Balance Type: |
debit |
| Period Type: |
instant |
|
| X |
- DefinitionThe portion of profit or loss for the period, net of income taxes, which is attributable to the parent. Reference 1: http://www.xbrl.org/2003/role/disclosureRef
-Topic 235
-SubTopic 10
-Name Accounting Standards Codification
-Section S99
-Paragraph 1
-Subparagraph (SX 210.4-08(g)(1)(ii))
-Publisher FASB
-URI https://asc.fasb.org//1943274/2147480678/235-10-S99-1
Reference 2: http://www.xbrl.org/2003/role/disclosureRef
-Topic 323
-SubTopic 10
-Name Accounting Standards Codification
-Section 50
-Paragraph 3
-Subparagraph (c)
-Publisher FASB
-URI https://asc.fasb.org//1943274/2147481687/323-10-50-3
Reference 3: http://www.xbrl.org/2003/role/disclosureRef
-Topic 825
-SubTopic 10
-Name Accounting Standards Codification
-Section 50
-Paragraph 28
-Subparagraph (f)
-Publisher FASB
-URI https://asc.fasb.org//1943274/2147482907/825-10-50-28
Reference 4: http://www.xbrl.org/2003/role/disclosureRef
-Topic 220
-SubTopic 10
-Name Accounting Standards Codification
-Section 50
-Paragraph 6
-Publisher FASB
-URI https://asc.fasb.org//1943274/2147482765/220-10-50-6
Reference 5: http://www.xbrl.org/2003/role/disclosureRef
-Topic 250
-SubTopic 10
-Name Accounting Standards Codification
-Section 50
-Paragraph 3
-Publisher FASB
-URI https://asc.fasb.org//1943274/2147483443/250-10-50-3
Reference 6: http://www.xbrl.org/2003/role/disclosureRef
-Topic 250
-SubTopic 10
-Name Accounting Standards Codification
-Section 50
-Paragraph 1
-Subparagraph (b)(2)
-Publisher FASB
-URI https://asc.fasb.org//1943274/2147483443/250-10-50-1
Reference 7: http://www.xbrl.org/2003/role/disclosureRef
-Topic 815
-SubTopic 40
-Name Accounting Standards Codification
-Section 65
-Paragraph 1
-Subparagraph (f)
-Publisher FASB
-URI https://asc.fasb.org//1943274/2147480175/815-40-65-1
Reference 8: http://www.xbrl.org/2003/role/disclosureRef
-Topic 250
-SubTopic 10
-Name Accounting Standards Codification
-Section 50
-Paragraph 8
-Publisher FASB
-URI https://asc.fasb.org//1943274/2147483443/250-10-50-8
Reference 9: http://www.xbrl.org/2003/role/disclosureRef
-Topic 250
-SubTopic 10
-Name Accounting Standards Codification
-Section 50
-Paragraph 9
-Publisher FASB
-URI https://asc.fasb.org//1943274/2147483443/250-10-50-9
Reference 10: http://www.xbrl.org/2003/role/disclosureRef
-Topic 250
-SubTopic 10
-Name Accounting Standards Codification
-Section 50
-Paragraph 11
-Subparagraph (a)
-Publisher FASB
-URI https://asc.fasb.org//1943274/2147483443/250-10-50-11
Reference 11: http://www.xbrl.org/2003/role/disclosureRef
-Topic 250
-SubTopic 10
-Name Accounting Standards Codification
-Section 50
-Paragraph 11
-Subparagraph (b)
-Publisher FASB
-URI https://asc.fasb.org//1943274/2147483443/250-10-50-11
Reference 12: http://www.xbrl.org/2003/role/disclosureRef
-Topic 250
-SubTopic 10
-Name Accounting Standards Codification
-Section 50
-Paragraph 4
-Publisher FASB
-URI https://asc.fasb.org//1943274/2147483443/250-10-50-4
Reference 13: http://www.xbrl.org/2003/role/exampleRef
-Topic 946
-SubTopic 830
-Name Accounting Standards Codification
-Section 55
-Paragraph 10
-Publisher FASB
-URI https://asc.fasb.org//1943274/2147480167/946-830-55-10
Reference 14: http://www.xbrl.org/2003/role/disclosureRef
-Topic 946
-SubTopic 220
-Name Accounting Standards Codification
-Section 45
-Paragraph 7
-Publisher FASB
-URI https://asc.fasb.org//1943274/2147483581/946-220-45-7
Reference 15: http://www.xbrl.org/2003/role/disclosureRef
-Topic 944
-SubTopic 220
-Name Accounting Standards Codification
-Section S99
-Paragraph 1
-Subparagraph (SX 210.7-04(18))
-Publisher FASB
-URI https://asc.fasb.org//1943274/2147483586/944-220-S99-1
Reference 16: http://www.xbrl.org/2003/role/disclosureRef
-Topic 280
-SubTopic 10
-Name Accounting Standards Codification
-Section 50
-Paragraph 22
-Publisher FASB
-URI https://asc.fasb.org//1943274/2147482810/280-10-50-22
Reference 17: http://www.xbrl.org/2003/role/disclosureRef
-Topic 946
-SubTopic 220
-Name Accounting Standards Codification
-Section S99
-Paragraph 1
-Subparagraph (SX 210.6-07(9))
-Publisher FASB
-URI https://asc.fasb.org//1943274/2147483575/946-220-S99-1
Reference 18: http://www.xbrl.org/2003/role/disclosureRef
-Topic 946
-SubTopic 220
-Name Accounting Standards Codification
-Section S99
-Paragraph 3
-Subparagraph (SX 210.6-09(1)(d))
-Publisher FASB
-URI https://asc.fasb.org//1943274/2147483575/946-220-S99-3
Reference 19: http://www.xbrl.org/2003/role/disclosureRef
-Topic 470
-SubTopic 10
-Name Accounting Standards Codification
-Section S99
-Paragraph 1A
-Subparagraph (SX 210.13-01(a)(4)(i))
-Publisher FASB
-URI https://asc.fasb.org//1943274/2147480097/470-10-S99-1A
Reference 20: http://www.xbrl.org/2009/role/commonPracticeRef
-Topic 470
-SubTopic 10
-Name Accounting Standards Codification
-Section S99
-Paragraph 1A
-Subparagraph (SX 210.13-01(a)(4)(ii))
-Publisher FASB
-URI https://asc.fasb.org//1943274/2147480097/470-10-S99-1A
Reference 21: http://www.xbrl.org/2003/role/disclosureRef
-Topic 470
-SubTopic 10
-Name Accounting Standards Codification
-Section S99
-Paragraph 1A
-Subparagraph (SX 210.13-01(a)(4)(iii)(A))
-Publisher FASB
-URI https://asc.fasb.org//1943274/2147480097/470-10-S99-1A
Reference 22: http://www.xbrl.org/2003/role/disclosureRef
-Topic 470
-SubTopic 10
-Name Accounting Standards Codification
-Section S99
-Paragraph 1A
-Subparagraph (SX 210.13-01(a)(4)(iv))
-Publisher FASB
-URI https://asc.fasb.org//1943274/2147480097/470-10-S99-1A
Reference 23: http://www.xbrl.org/2003/role/disclosureRef
-Topic 470
-SubTopic 10
-Name Accounting Standards Codification
-Section S99
-Paragraph 1A
-Subparagraph (SX 210.13-01(a)(5))
-Publisher FASB
-URI https://asc.fasb.org//1943274/2147480097/470-10-S99-1A
Reference 24: http://www.xbrl.org/2003/role/disclosureRef
-Topic 470
-SubTopic 10
-Name Accounting Standards Codification
-Section S99
-Paragraph 1B
-Subparagraph (SX 210.13-02(a)(4)(i))
-Publisher FASB
-URI https://asc.fasb.org//1943274/2147480097/470-10-S99-1B
Reference 25: http://www.xbrl.org/2003/role/disclosureRef
-Topic 470
-SubTopic 10
-Name Accounting Standards Codification
-Section S99
-Paragraph 1B
-Subparagraph (SX 210.13-02(a)(4)(iii)(A))
-Publisher FASB
-URI https://asc.fasb.org//1943274/2147480097/470-10-S99-1B
Reference 26: http://www.xbrl.org/2003/role/disclosureRef
-Topic 470
-SubTopic 10
-Name Accounting Standards Codification
-Section S99
-Paragraph 1B
-Subparagraph (SX 210.13-02(a)(4)(iii)(B))
-Publisher FASB
-URI https://asc.fasb.org//1943274/2147480097/470-10-S99-1B
Reference 27: http://www.xbrl.org/2003/role/disclosureRef
-Topic 470
-SubTopic 10
-Name Accounting Standards Codification
-Section S99
-Paragraph 1B
-Subparagraph (SX 210.13-02(a)(4)(iv))
-Publisher FASB
-URI https://asc.fasb.org//1943274/2147480097/470-10-S99-1B
Reference 28: http://www.xbrl.org/2003/role/disclosureRef
-Topic 470
-SubTopic 10
-Name Accounting Standards Codification
-Section S99
-Paragraph 1B
-Subparagraph (SX 210.13-02(a)(5))
-Publisher FASB
-URI https://asc.fasb.org//1943274/2147480097/470-10-S99-1B
Reference 29: http://www.xbrl.org/2003/role/disclosureRef
-Topic 280
-SubTopic 10
-Name Accounting Standards Codification
-Section 50
-Paragraph 30
-Subparagraph (b)
-Publisher FASB
-URI https://asc.fasb.org//1943274/2147482810/280-10-50-30
Reference 30: http://www.xbrl.org/2003/role/disclosureRef
-Topic 280
-SubTopic 10
-Name Accounting Standards Codification
-Section 50
-Paragraph 32
-Subparagraph (f)
-Publisher FASB
-URI https://asc.fasb.org//1943274/2147482810/280-10-50-32
Reference 31: http://www.xbrl.org/2003/role/disclosureRef
-Topic 260
-SubTopic 10
-Name Accounting Standards Codification
-Section 45
-Paragraph 60B
-Subparagraph (a)
-Publisher FASB
-URI https://asc.fasb.org//1943274/2147482689/260-10-45-60B
Reference 32: http://www.xbrl.org/2003/role/exampleRef
-Topic 280
-SubTopic 10
-Name Accounting Standards Codification
-Section 50
-Paragraph 31
-Publisher FASB
-URI https://asc.fasb.org//1943274/2147482810/280-10-50-31
Reference 33: http://www.xbrl.org/2003/role/disclosureRef
-Topic 280
-SubTopic 10
-Name Accounting Standards Codification
-Section 50
-Paragraph 32
-Subparagraph (c)
-Publisher FASB
-URI https://asc.fasb.org//1943274/2147482810/280-10-50-32
Reference 34: http://www.xbrl.org/2003/role/disclosureRef
-Topic 205
-SubTopic 20
-Name Accounting Standards Codification
-Section 50
-Paragraph 7
-Publisher FASB
-URI https://asc.fasb.org//1943274/2147483499/205-20-50-7
Reference 35: http://fasb.org/us-gaap/role/ref/legacyRef
-Topic 230
-SubTopic 10
-Name Accounting Standards Codification
-Section 45
-Paragraph 28
-Publisher FASB
-URI https://asc.fasb.org//1943274/2147482740/230-10-45-28
Reference 36: http://www.xbrl.org/2003/role/disclosureRef
-Topic 220
-SubTopic 10
-Name Accounting Standards Codification
-Section 45
-Paragraph 1A
-Subparagraph (a)
-Publisher FASB
-URI https://asc.fasb.org//1943274/2147482790/220-10-45-1A
Reference 37: http://www.xbrl.org/2003/role/disclosureRef
-Topic 220
-SubTopic 10
-Name Accounting Standards Codification
-Section 45
-Paragraph 1B
-Subparagraph (a)
-Publisher FASB
-URI https://asc.fasb.org//1943274/2147482790/220-10-45-1B
Reference 38: http://fasb.org/us-gaap/role/ref/legacyRef
-Topic 220
-SubTopic 10
-Name Accounting Standards Codification
-Section S99
-Paragraph 2
-Subparagraph (SX 210.5-03(20))
-Publisher FASB
-URI https://asc.fasb.org//1943274/2147483621/220-10-S99-2
Reference 39: http://fasb.org/us-gaap/role/ref/legacyRef
-Topic 942
-SubTopic 220
-Name Accounting Standards Codification
-Section S99
-Paragraph 1
-Subparagraph (SX 210.9-04(22))
-Publisher FASB
-URI https://asc.fasb.org//1943274/2147483589/942-220-S99-1
| Name: |
us-gaap_NetIncomeLoss |
| Namespace Prefix: |
us-gaap_ |
| Data Type: |
xbrli:monetaryItemType |
| Balance Type: |
credit |
| Period Type: |
duration |
|
| X |
- DefinitionAmount of equity (deficit) attributable to parent. Excludes temporary equity and equity attributable to noncontrolling interest. Reference 1: http://www.xbrl.org/2003/role/exampleRef
-Topic 852
-SubTopic 10
-Name Accounting Standards Codification
-Section 55
-Paragraph 10
-Publisher FASB
-URI https://asc.fasb.org//1943274/2147481372/852-10-55-10
Reference 2: http://www.xbrl.org/2003/role/exampleRef
-Topic 946
-SubTopic 830
-Name Accounting Standards Codification
-Section 55
-Paragraph 12
-Publisher FASB
-URI https://asc.fasb.org//1943274/2147480167/946-830-55-12
Reference 3: http://www.xbrl.org/2003/role/disclosureRef
-Topic 946
-SubTopic 210
-Name Accounting Standards Codification
-Section S99
-Paragraph 1
-Subparagraph (SX 210.6-04(19))
-Publisher FASB
-URI https://asc.fasb.org//1943274/2147479617/946-210-S99-1
Reference 4: http://www.xbrl.org/2003/role/disclosureRef
-Topic 946
-SubTopic 210
-Name Accounting Standards Codification
-Section S99
-Paragraph 2
-Subparagraph (SX 210.6-05(4))
-Publisher FASB
-URI https://asc.fasb.org//1943274/2147479617/946-210-S99-2
Reference 5: http://www.xbrl.org/2009/role/commonPracticeRef
-Topic 946
-SubTopic 220
-Name Accounting Standards Codification
-Section S99
-Paragraph 3
-Subparagraph (SX 210.6-09(4)(b))
-Publisher FASB
-URI https://asc.fasb.org//1943274/2147483575/946-220-S99-3
Reference 6: http://www.xbrl.org/2003/role/disclosureRef
-Topic 946
-SubTopic 220
-Name Accounting Standards Codification
-Section S99
-Paragraph 3
-Subparagraph (SX 210.6-09(6))
-Publisher FASB
-URI https://asc.fasb.org//1943274/2147483575/946-220-S99-3
Reference 7: http://www.xbrl.org/2003/role/disclosureRef
-Topic 946
-SubTopic 220
-Name Accounting Standards Codification
-Section S99
-Paragraph 3
-Subparagraph (SX 210.6-09(7))
-Publisher FASB
-URI https://asc.fasb.org//1943274/2147483575/946-220-S99-3
Reference 8: http://www.xbrl.org/2009/role/commonPracticeRef
-Topic 235
-SubTopic 10
-Name Accounting Standards Codification
-Section S99
-Paragraph 1
-Subparagraph (SX 210.4-08(g)(1)(ii))
-Publisher FASB
-URI https://asc.fasb.org//1943274/2147480678/235-10-S99-1
Reference 9: http://www.xbrl.org/2009/role/commonPracticeRef
-Topic 323
-SubTopic 10
-Name Accounting Standards Codification
-Section 50
-Paragraph 3
-Subparagraph (c)
-Publisher FASB
-URI https://asc.fasb.org//1943274/2147481687/323-10-50-3
Reference 10: http://www.xbrl.org/2009/role/commonPracticeRef
-Topic 825
-SubTopic 10
-Name Accounting Standards Codification
-Section 50
-Paragraph 28
-Subparagraph (f)
-Publisher FASB
-URI https://asc.fasb.org//1943274/2147482907/825-10-50-28
Reference 11: http://fasb.org/us-gaap/role/ref/legacyRef
-Topic 210
-SubTopic 10
-Name Accounting Standards Codification
-Section S99
-Paragraph 1
-Subparagraph (SX 210.5-02(29))
-Publisher FASB
-URI https://asc.fasb.org//1943274/2147480566/210-10-S99-1
Reference 12: http://fasb.org/us-gaap/role/ref/legacyRef
-Topic 210
-SubTopic 10
-Name Accounting Standards Codification
-Section S99
-Paragraph 1
-Subparagraph (SX 210.5-02(31))
-Publisher FASB
-URI https://asc.fasb.org//1943274/2147480566/210-10-S99-1
Reference 13: http://fasb.org/us-gaap/role/ref/legacyRef
-Topic 210
-SubTopic 10
-Name Accounting Standards Codification
-Section S99
-Paragraph 1
-Subparagraph (SX 210.5-02(30))
-Publisher FASB
-URI https://asc.fasb.org//1943274/2147480566/210-10-S99-1
Reference 14: http://fasb.org/us-gaap/role/ref/legacyRef
-Topic 310
-SubTopic 10
-Name Accounting Standards Codification
-Section S99
-Paragraph 2
-Subparagraph (SAB Topic 4.E)
-Publisher FASB
-URI https://asc.fasb.org//1943274/2147480418/310-10-S99-2
| Name: |
us-gaap_StockholdersEquity |
| Namespace Prefix: |
us-gaap_ |
| Data Type: |
xbrli:monetaryItemType |
| Balance Type: |
credit |
| Period Type: |
instant |
|
v3.23.2
CONVERTIBLE NOTES AND NOTES PAYABLE (Details) - USD ($)
|
12 Months Ended |
Dec. 31, 2022 |
Dec. 31, 2021 |
| Notes Payable 2 [Member] |
|
|
| Debt Instrument, Issuance Date |
09/25/09
|
09/25/09
|
| Debt Instrument, Maturity Date |
10/25/11
|
10/25/11
|
| Debt Stated Interest Rate |
5.00%
|
5.00%
|
| In Default |
Yes
|
Yes
|
| Debt Original Principal |
$ 50,000
|
$ 50,000
|
| Debt Amount At Period End |
50,000
|
50,000
|
| Unamortized Discount |
0
|
0
|
| Carrying Amount At Period End |
50,000
|
50,000
|
| Debt Related Party Current |
0
|
0
|
| Debt Related Party Noncurrent |
0
|
0
|
| Debt Current |
50,000
|
50,000
|
| Debt Noncurrent |
$ 0
|
$ 0
|
| Notes Payable 3 [Member] |
|
|
| Debt Instrument, Issuance Date |
12/23/09
|
12/23/09
|
| Debt Instrument, Maturity Date |
12/23/14
|
12/23/14
|
| Debt Stated Interest Rate |
7.00%
|
7.00%
|
| In Default |
Yes
|
Yes
|
| Debt Original Principal |
$ 100,000
|
$ 100,000
|
| Debt Amount At Period End |
83,166
|
94,414
|
| Unamortized Discount |
0
|
0
|
| Carrying Amount At Period End |
83,166
|
94,414
|
| Debt Related Party Current |
0
|
0
|
| Debt Related Party Noncurrent |
0
|
0
|
| Debt Current |
83,166
|
94,414
|
| Debt Noncurrent |
$ 0
|
$ 0
|
| Notes Payable 4 [Member] |
|
|
| Debt Instrument, Issuance Date |
12/23/09
|
12/23/09
|
| Debt Instrument, Maturity Date |
12/23/14
|
12/23/14
|
| Debt Stated Interest Rate |
7.00%
|
7.00%
|
| In Default |
Yes
|
Yes
|
| Debt Original Principal |
$ 25,000
|
$ 25,000
|
| Debt Amount At Period End |
22,233
|
23,620
|
| Unamortized Discount |
0
|
0
|
| Carrying Amount At Period End |
22,233
|
23,620
|
| Debt Related Party Current |
0
|
0
|
| Debt Related Party Noncurrent |
0
|
0
|
| Debt Current |
22,233
|
23,620
|
| Debt Noncurrent |
$ 0
|
$ 0
|
| Notes Payable 5 [Member] |
|
|
| Debt Instrument, Issuance Date |
12/23/09
|
12/23/09
|
| Debt Instrument, Maturity Date |
12/23/14
|
12/23/14
|
| Debt Stated Interest Rate |
7.00%
|
7.00%
|
| In Default |
Yes
|
Yes
|
| Debt Original Principal |
$ 25,000
|
$ 25,000
|
| Debt Amount At Period End |
22,223
|
23,610
|
| Unamortized Discount |
0
|
0
|
| Carrying Amount At Period End |
22,223
|
23,610
|
| Debt Related Party Current |
0
|
0
|
| Debt Related Party Noncurrent |
0
|
0
|
| Debt Current |
22,223
|
23,610
|
| Debt Noncurrent |
$ 0
|
$ 0
|
| Notes Payable 6 [Member] |
|
|
| Debt Instrument, Issuance Date |
02/03/12
|
02/03/12
|
| Debt Instrument, Maturity Date |
12/31/19
|
12/31/19
|
| Debt Stated Interest Rate |
10.00%
|
10.00%
|
| In Default |
Yes
|
Yes
|
| Debt Original Principal |
$ 1,000,000
|
$ 1,000,000
|
| Debt Amount At Period End |
1,000,000
|
1,000,000
|
| Unamortized Discount |
0
|
0
|
| Carrying Amount At Period End |
1,000,000
|
1,000,000
|
| Debt Related Party Current |
0
|
0
|
| Debt Related Party Noncurrent |
0
|
0
|
| Debt Current |
1,000,000
|
1,000,000
|
| Debt Noncurrent |
$ 0
|
$ 0
|
| Notes Payable 7 [Member] |
|
|
| Debt Instrument, Issuance Date |
08/15/13
|
08/15/13
|
| Debt Instrument, Maturity Date |
10/31/23
|
10/31/23
|
| Debt Stated Interest Rate |
10.00%
|
10.00%
|
| In Default |
No
|
No
|
| Debt Original Principal |
$ 158,334
|
$ 158,334
|
| Debt Amount At Period End |
158,334
|
158,334
|
| Unamortized Discount |
0
|
0
|
| Carrying Amount At Period End |
158,334
|
158,334
|
| Debt Related Party Current |
0
|
0
|
| Debt Related Party Noncurrent |
0
|
0
|
| Debt Current |
158,334
|
0
|
| Debt Noncurrent |
$ 0
|
$ 158,334
|
| Notes Payable 8 [Member] |
|
|
| Debt Instrument, Issuance Date |
12/31/13
|
12/31/13
|
| Debt Instrument, Maturity Date |
12/31/15
|
12/31/15
|
| Debt Stated Interest Rate |
8.00%
|
8.00%
|
| In Default |
Yes
|
Yes
|
| Debt Original Principal |
$ 290,000
|
$ 290,000
|
| Debt Amount At Period End |
130,000
|
130,000
|
| Unamortized Discount |
0
|
0
|
| Carrying Amount At Period End |
130,000
|
130,000
|
| Debt Related Party Current |
0
|
0
|
| Debt Related Party Noncurrent |
0
|
0
|
| Debt Current |
130,000
|
130,000
|
| Debt Noncurrent |
$ 0
|
$ 0
|
| Notes Payable 9 [Member] |
|
|
| Debt Instrument, Issuance Date |
04/01/14
|
04/01/14
|
| Debt Instrument, Maturity Date |
12/31/18
|
12/31/18
|
| Debt Stated Interest Rate |
10.00%
|
10.00%
|
| In Default |
Yes
|
Yes
|
| Debt Original Principal |
$ 2,265,000
|
$ 2,265,000
|
| Debt Amount At Period End |
1,102,500
|
1,102,500
|
| Unamortized Discount |
0
|
0
|
| Carrying Amount At Period End |
1,102,500
|
1,102,500
|
| Debt Related Party Current |
1,102,500
|
1,102,500
|
| Debt Related Party Noncurrent |
0
|
0
|
| Debt Current |
0
|
0
|
| Debt Noncurrent |
$ 0
|
$ 0
|
| Notes Payable 10 [Member] |
|
|
| Debt Instrument, Issuance Date |
12/22/14
|
12/22/14
|
| Debt Instrument, Maturity Date |
03/31/15
|
03/31/15
|
| Debt Stated Interest Rate |
22.00%
|
22.00%
|
| In Default |
Yes
|
Yes
|
| Debt Original Principal |
$ 200,000
|
$ 200,000
|
| Debt Amount At Period End |
200,000
|
200,000
|
| Unamortized Discount |
0
|
0
|
| Carrying Amount At Period End |
200,000
|
200,000
|
| Debt Related Party Current |
0
|
0
|
| Debt Related Party Noncurrent |
0
|
0
|
| Debt Noncurrent |
0
|
0
|
| Debt Current |
$ 200,000
|
$ 200,000
|
| Notes Payable 11 [Member] |
|
|
| Debt Instrument, Issuance Date |
12/26/14
|
12/26/14
|
| Debt Instrument, Maturity Date |
12/26/15
|
12/26/15
|
| Debt Stated Interest Rate |
22.00%
|
22.00%
|
| In Default |
Yes
|
Yes
|
| Debt Original Principal |
$ 100,000
|
$ 100,000
|
| Debt Amount At Period End |
100,000
|
100,000
|
| Unamortized Discount |
0
|
0
|
| Carrying Amount At Period End |
100,000
|
100,000
|
| Debt Related Party Current |
0
|
0
|
| Debt Related Party Noncurrent |
0
|
0
|
| Debt Current |
100,000
|
100,000
|
| Debt Noncurrent |
$ 0
|
$ 0
|
| Notes Payable 12 [Member] |
|
|
| Debt Instrument, Issuance Date |
03/12/15
|
03/12/15
|
| Debt Instrument, Maturity Date |
1
|
1
|
| Debt Stated Interest Rate |
6.00%
|
6.00%
|
| In Default |
No
|
No
|
| Debt Original Principal |
$ 394,380
|
$ 394,380
|
| Debt Amount At Period End |
394,380
|
394,380
|
| Unamortized Discount |
0
|
0
|
| Carrying Amount At Period End |
394,380
|
394,380
|
| Debt Related Party Current |
394,380
|
394,380
|
| Debt Related Party Noncurrent |
0
|
0
|
| Debt Current |
0
|
0
|
| Debt Noncurrent |
$ 0
|
$ 0
|
| Notes Payable 13 [Member] |
|
|
| Debt Instrument, Issuance Date |
04/07/15
|
04/07/15
|
| Debt Instrument, Maturity Date |
04/07/18
|
04/07/18
|
| Debt Stated Interest Rate |
10.00%
|
10.00%
|
| In Default |
Yes
|
Yes
|
| Debt Original Principal |
$ 50,000
|
$ 50,000
|
| Debt Amount At Period End |
50,000
|
50,000
|
| Unamortized Discount |
0
|
0
|
| Carrying Amount At Period End |
50,000
|
50,000
|
| Debt Related Party Current |
0
|
0
|
| Debt Related Party Noncurrent |
0
|
0
|
| Debt Current |
50,000
|
50,000
|
| Debt Noncurrent |
$ 0
|
$ 0
|
| Notes Payable 14 [Member] |
|
|
| Debt Instrument, Issuance Date |
11/23/15
|
11/23/15
|
| Debt Instrument, Maturity Date |
1
|
1
|
| Debt Stated Interest Rate |
6.00%
|
6.00%
|
| In Default |
No
|
No
|
| Debt Original Principal |
$ 50,000
|
$ 50,000
|
| Debt Amount At Period End |
50,000
|
50,000
|
| Unamortized Discount |
0
|
0
|
| Carrying Amount At Period End |
50,000
|
50,000
|
| Debt Related Party Current |
50,000
|
50,000
|
| Debt Related Party Noncurrent |
0
|
0
|
| Debt Current |
0
|
0
|
| Debt Noncurrent |
$ 0
|
$ 0
|
| Notes Payable 15 [Member] |
|
|
| Debt Instrument, Issuance Date |
02/25/16
|
02/25/16
|
| Debt Instrument, Maturity Date |
1
|
1
|
| Debt Stated Interest Rate |
6.00%
|
6.00%
|
| In Default |
No
|
No
|
| Debt Original Principal |
$ 50,000
|
$ 50,000
|
| Debt Amount At Period End |
50,000
|
50,000
|
| Unamortized Discount |
0
|
0
|
| Carrying Amount At Period End |
50,000
|
50,000
|
| Debt Related Party Current |
50,000
|
50,000
|
| Debt Related Party Noncurrent |
0
|
0
|
| Debt Current |
0
|
0
|
| Debt Noncurrent |
$ 0
|
$ 0
|
| Notes Payable 16 [Member] |
|
|
| Debt Instrument, Issuance Date |
05/20/16
|
05/20/16
|
| Debt Instrument, Maturity Date |
1
|
1
|
| Debt Stated Interest Rate |
6.00%
|
6.00%
|
| In Default |
No
|
No
|
| Debt Original Principal |
$ 50,000
|
$ 50,000
|
| Debt Amount At Period End |
50,000
|
50,000
|
| Unamortized Discount |
0
|
0
|
| Carrying Amount At Period End |
50,000
|
50,000
|
| Debt Related Party Current |
50,000
|
50,000
|
| Debt Related Party Noncurrent |
0
|
0
|
| Debt Current |
0
|
0
|
| Debt Noncurrent |
$ 0
|
$ 0
|
| Notes Payable 17 [Member] |
|
|
| Debt Instrument, Issuance Date |
10/20/16
|
10/20/16
|
| Debt Instrument, Maturity Date |
1
|
1
|
| Debt Stated Interest Rate |
6.00%
|
6.00%
|
| In Default |
No
|
No
|
| Debt Original Principal |
$ 37,500
|
$ 37,500
|
| Debt Amount At Period End |
12,500
|
12,500
|
| Unamortized Discount |
0
|
0
|
| Debt Related Party Noncurrent |
0
|
0
|
| Debt Current |
0
|
0
|
| Debt Noncurrent |
0
|
0
|
| Carrying Amount at Period End |
12,500
|
12,500
|
| Debt to Related Party Current |
$ 12,500
|
$ 12,500
|
| Notes Payable 18 [Member] |
|
|
| Debt Instrument, Issuance Date |
10/20/16
|
10/20/16
|
| Debt Instrument, Maturity Date |
1
|
1
|
| Debt Stated Interest Rate |
6.00%
|
6.00%
|
| In Default |
No
|
No
|
| Debt Original Principal |
$ 12,500
|
$ 12,500
|
| Debt Amount At Period End |
12,500
|
12,500
|
| Unamortized Discount |
0
|
0
|
| Debt Related Party Current |
12,500
|
12,500
|
| Debt Related Party Noncurrent |
0
|
0
|
| Debt Current |
0
|
0
|
| Debt Noncurrent |
0
|
0
|
| Carrying Amount at Period End |
$ 12,500
|
$ 12,500
|
| Notes Payable 19 [Member] |
|
|
| Debt Instrument, Issuance Date |
12/21/16
|
12/21/16
|
| Debt Instrument, Maturity Date |
1
|
1
|
| Debt Stated Interest Rate |
6.00%
|
6.00%
|
| In Default |
No
|
No
|
| Debt Original Principal |
$ 25,000
|
$ 25,000
|
| Debt Amount At Period End |
25,000
|
25,000
|
| Unamortized Discount |
0
|
0
|
| Carrying Amount At Period End |
25,000
|
25,000
|
| Debt Related Party Noncurrent |
0
|
0
|
| Debt Current |
0
|
0
|
| Debt Noncurrent |
0
|
0
|
| Debt to Related Party Current |
$ 25,000
|
$ 25,000
|
| Notes Payable 20 [Member] |
|
|
| Debt Instrument, Issuance Date |
03/09/17
|
03/09/17
|
| Debt Instrument, Maturity Date |
1
|
1
|
| Debt Stated Interest Rate |
10.00%
|
10.00%
|
| In Default |
No
|
No
|
| Debt Original Principal |
$ 200,000
|
$ 200,000
|
| Debt Amount At Period End |
177,000
|
177,000
|
| Unamortized Discount |
0
|
0
|
| Carrying Amount At Period End |
177,000
|
177,000
|
| Debt Related Party Current |
177,000
|
177,000
|
| Debt Related Party Noncurrent |
0
|
0
|
| Debt Current |
0
|
0
|
| Debt Noncurrent |
$ 0
|
$ 0
|
| Notes Payable 21 [Member] |
|
|
| Debt Instrument, Issuance Date |
07/13/17
|
07/13/17
|
| Debt Instrument, Maturity Date |
07/13/19
|
07/13/19
|
| Debt Stated Interest Rate |
6.00%
|
6.00%
|
| In Default |
Yes
|
Yes
|
| Debt Original Principal |
$ 25,000
|
$ 25,000
|
| Debt Amount At Period End |
25,000
|
25,000
|
| Unamortized Discount |
0
|
0
|
| Debt Related Party Current |
0
|
0
|
| Debt Related Party Noncurrent |
0
|
0
|
| Debt Current |
25,000
|
25,000
|
| Debt Noncurrent |
0
|
0
|
| Carrying Amount at Period End |
$ 25,000
|
$ 25,000
|
| Notes Payable 22 [Member] |
|
|
| Debt Instrument, Issuance Date |
07/18/17
|
07/18/17
|
| Debt Instrument, Maturity Date |
07/18/19
|
07/18/19
|
| Debt Stated Interest Rate |
6.00%
|
6.00%
|
| In Default |
Yes
|
Yes
|
| Debt Original Principal |
$ 25,000
|
$ 25,000
|
| Debt Amount At Period End |
25,000
|
25,000
|
| Unamortized Discount |
0
|
0
|
| Carrying Amount At Period End |
25,000
|
25,000
|
| Debt Related Party Current |
0
|
0
|
| Debt Related Party Noncurrent |
0
|
0
|
| Debt Current |
25,000
|
25,000
|
| Debt Noncurrent |
$ 0
|
$ 0
|
| Notes Payable 23 [Member] |
|
|
| Debt Instrument, Issuance Date |
07/26/17
|
07/26/17
|
| Debt Instrument, Maturity Date |
07/26/19
|
07/26/19
|
| Debt Stated Interest Rate |
6.00%
|
6.00%
|
| In Default |
Yes
|
Yes
|
| Debt Original Principal |
$ 15,000
|
$ 15,000
|
| Debt Amount At Period End |
15,000
|
15,000
|
| Unamortized Discount |
0
|
0
|
| Debt Related Party Current |
0
|
0
|
| Debt Related Party Noncurrent |
0
|
0
|
| Debt Current |
15,000
|
15,000
|
| Debt Noncurrent |
0
|
0
|
| Carrying Amount at Period End |
$ 15,000
|
$ 15,000
|
| Notes Payable 24 [Member] |
|
|
| Debt Instrument, Issuance Date |
12/20/17
|
12/20/17
|
| Debt Instrument, Maturity Date |
2
|
2
|
| Debt Stated Interest Rate |
10.00%
|
10.00%
|
| In Default |
Yes
|
Yes
|
| Debt Original Principal |
$ 979,156
|
$ 979,156
|
| Debt Amount At Period End |
859,156
|
979,156
|
| Unamortized Discount |
0
|
0
|
| Carrying Amount At Period End |
859,156
|
979,156
|
| Debt Related Party Current |
0
|
0
|
| Debt Related Party Noncurrent |
0
|
0
|
| Debt Current |
859,156
|
979,156
|
| Debt Noncurrent |
$ 0
|
$ 0
|
| Notes Payable 25 [Member] |
|
|
| Debt Instrument, Issuance Date |
11/06/17
|
11/06/17
|
| Debt Instrument, Maturity Date |
12/31/18
|
12/31/18
|
| Debt Stated Interest Rate |
10.00%
|
10.00%
|
| In Default |
Yes
|
Yes
|
| Debt Original Principal |
$ 646,568
|
$ 646,568
|
| Debt Amount At Period End |
543,093
|
543,093
|
| Unamortized Discount |
0
|
0
|
| Debt Related Party Current |
543,093
|
543,093
|
| Debt Related Party Noncurrent |
0
|
0
|
| Debt Current |
0
|
0
|
| Debt Noncurrent |
0
|
0
|
| Carrying Amount At Period End |
$ 543,093
|
$ 543,093
|
| Notes Payable 26 [Member] |
|
|
| Debt Instrument, Issuance Date |
02/19/18
|
02/19/18
|
| Debt Instrument, Maturity Date |
3
|
3
|
| Debt Stated Interest Rate |
18.00%
|
18.00%
|
| In Default |
Yes
|
Yes
|
| Debt Original Principal |
$ 629,451
|
$ 629,451
|
| Debt Amount At Period End |
1,161,136
|
1,161,136
|
| Unamortized Discount |
0
|
0
|
| Carrying Amount At Period End |
1,161,136
|
1,161,136
|
| Debt Related Party Current |
0
|
0
|
| Debt Related Party Noncurrent |
0
|
0
|
| Debt Current |
1,161,136
|
1,161,136
|
| Debt Noncurrent |
$ 0
|
$ 0
|
| Notes Payable 27 [Member] |
|
|
| Debt Instrument, Issuance Date |
09/19/18
|
09/19/18
|
| Debt Instrument, Maturity Date |
09/28/21
|
09/28/21
|
| Debt Stated Interest Rate |
6.00%
|
6.00%
|
| In Default |
Yes
|
Yes
|
| Debt Original Principal |
$ 10,000
|
$ 10,000
|
| Debt Amount At Period End |
10,000
|
10,000
|
| Unamortized Discount |
0
|
0
|
| Carrying Amount At Period End |
10,000
|
10,000
|
| Debt Related Party Current |
0
|
0
|
| Debt Related Party Noncurrent |
0
|
0
|
| Debt Current |
10,000
|
10,000
|
| Debt Noncurrent |
$ 0
|
$ 0
|
| Notes Payable 28 [Member] |
|
|
| Debt Instrument, Issuance Date |
12/14/18
|
12/14/18
|
| Debt Instrument, Maturity Date |
12/22/18
|
12/22/18
|
| Debt Stated Interest Rate |
24.00%
|
24.00%
|
| In Default |
Yes
|
Yes
|
| Debt Original Principal |
$ 474,759
|
$ 474,759
|
| Debt Amount At Period End |
578,075
|
623,725
|
| Unamortized Discount |
0
|
0
|
| Carrying Amount At Period End |
578,075
|
623,725
|
| Debt Related Party Current |
0
|
0
|
| Debt Related Party Noncurrent |
0
|
0
|
| Debt Current |
578,075
|
623,725
|
| Debt Noncurrent |
$ 0
|
$ 0
|
| Notes Payable 29 [Member] |
|
|
| Debt Instrument, Issuance Date |
01/02/19
|
01/02/19
|
| Debt Instrument, Maturity Date |
4
|
4
|
| Debt Stated Interest Rate |
17.00%
|
17.00%
|
| In Default |
No
|
No
|
| Debt Original Principal |
$ 310,000
|
$ 310,000
|
| Debt Amount At Period End |
310,000
|
310,000
|
| Unamortized Discount |
0
|
0
|
| Carrying Amount At Period End |
310,000
|
310,000
|
| Debt Related Party Current |
0
|
0
|
| Debt Related Party Noncurrent |
0
|
0
|
| Debt Current |
310,000
|
310,000
|
| Debt Noncurrent |
$ 0
|
$ 0
|
| Notes Payable 30 [Member] |
|
|
| Debt Instrument, Issuance Date |
08/14/19
|
08/14/19
|
| Debt Instrument, Maturity Date |
10/31/2021
|
10/31/2021
|
| Debt Stated Interest Rate |
8.00%
|
8.00%
|
| In Default |
Yes
|
Yes
|
| Debt Original Principal |
$ 26,200
|
$ 26,200
|
| Debt Amount At Period End |
26,200
|
26,200
|
| Unamortized Discount |
0
|
0
|
| Carrying Amount At Period End |
26,200
|
26,200
|
| Debt Related Party Current |
0
|
0
|
| Debt Related Party Noncurrent |
0
|
0
|
| Debt Current |
26,200
|
26,200
|
| Debt Noncurrent |
$ 0
|
$ 0
|
| Notes Payable 31 [Member] |
|
|
| Debt Instrument, Issuance Date |
5
|
5
|
| Debt Instrument, Maturity Date |
10/31/2021
|
10/31/2021
|
| Debt Stated Interest Rate |
8.00%
|
8.00%
|
| In Default |
Yes
|
Yes
|
| Debt Original Principal |
$ 105,000
|
$ 105,000
|
| Debt Amount At Period End |
75,000
|
105,000
|
| Unamortized Discount |
0
|
0
|
| Carrying Amount At Period End |
75,000
|
105,000
|
| Debt Related Party Current |
5,000
|
10,000
|
| Debt Related Party Noncurrent |
0
|
0
|
| Debt Current |
70,000
|
95,000
|
| Debt Noncurrent |
$ 0
|
$ 0
|
| Notes Payable 32 [Member] |
|
|
| Debt Instrument, Issuance Date |
6
|
6
|
| Debt Instrument, Maturity Date |
01/02/22
|
01/02/22
|
| Debt Stated Interest Rate |
8.00%
|
8.00%
|
| In Default |
Yes
|
No
|
| Debt Original Principal |
$ 296,750
|
$ 306,750
|
| Debt Amount At Period End |
231,750
|
306,750
|
| Unamortized Discount |
0
|
885
|
| Carrying Amount At Period End |
231,750
|
305,865
|
| Debt Related Party Current |
15,000
|
19,946
|
| Debt Related Party Noncurrent |
0
|
0
|
| Debt Current |
216,750
|
285,919
|
| Debt Noncurrent |
$ 0
|
$ 0
|
| Notes Payable 33 [Member] |
|
|
| Debt Instrument, Issuance Date |
8
|
8
|
| Debt Instrument, Maturity Date |
05/12/22
|
05/12/22
|
| Debt Stated Interest Rate |
8.00%
|
8.00%
|
| In Default |
Yes
|
No
|
| Debt Original Principal |
$ 15,000
|
$ 15,000
|
| Debt Amount At Period End |
15,000
|
15,000
|
| Unamortized Discount |
0
|
2,924
|
| Carrying Amount At Period End |
15,000
|
12,076
|
| Debt Related Party Current |
0
|
0
|
| Debt Related Party Noncurrent |
0
|
0
|
| Debt Current |
15,000
|
12,076
|
| Debt Noncurrent |
$ 0
|
$ 0
|
| Notes Payable 34 [Member] |
|
|
| Debt Instrument, Issuance Date |
9
|
9
|
| Debt Instrument, Maturity Date |
09/01/22
|
09/01/22
|
| Debt Stated Interest Rate |
8.00%
|
8.00%
|
| In Default |
Yes
|
No
|
| Debt Original Principal |
$ 170,000
|
$ 160,000
|
| Debt Amount At Period End |
155,000
|
160,000
|
| Unamortized Discount |
0
|
73,542
|
| Carrying Amount At Period End |
155,000
|
86,458
|
| Debt Related Party Current |
0
|
0
|
| Debt Related Party Noncurrent |
0
|
0
|
| Debt Current |
155,000
|
86,458
|
| Debt Noncurrent |
$ 0
|
$ 0
|
| Notes Payable 35 [Member] |
|
|
| Debt Instrument, Issuance Date |
10
|
10
|
| Debt Instrument, Maturity Date |
08/30/23
|
08/30/23
|
| Debt Stated Interest Rate |
8.00%
|
8.00%
|
| In Default |
No
|
No
|
| Debt Original Principal |
$ 285,000
|
$ 285,000
|
| Debt Amount At Period End |
285,000
|
285,000
|
| Unamortized Discount |
87,233
|
218,805
|
| Carrying Amount At Period End |
197,767
|
66,195
|
| Debt Related Party Current |
3,528
|
0
|
| Debt Related Party Noncurrent |
0
|
1,307
|
| Debt Current |
194,239
|
0
|
| Debt Noncurrent |
$ 0
|
$ 64,888
|
| Notes Payable 36 [Member] |
|
|
| Debt Instrument, Issuance Date |
11
|
11
|
| Debt Instrument, Maturity Date |
11/30/23
|
11/30/23
|
| Debt Stated Interest Rate |
8.00%
|
8.00%
|
| In Default |
No
|
No
|
| Debt Original Principal |
$ 5,000
|
$ 5,000
|
| Debt Amount At Period End |
5,000
|
5,000
|
| Unamortized Discount |
1,307
|
2,736
|
| Carrying Amount At Period End |
3,693
|
2,264
|
| Debt Related Party Current |
3,693
|
0
|
| Debt Related Party Noncurrent |
0
|
2,264
|
| Debt Current |
0
|
0
|
| Debt Noncurrent |
$ 0
|
$ 0
|
| Notes Payable 37 [Member] |
|
|
| Debt Instrument, Issuance Date |
7
|
7
|
| Debt Instrument, Maturity Date |
7
|
7
|
| Debt Stated Interest Rate |
10.00%
|
10.00%
|
| In Default |
No
|
No
|
| Debt Original Principal |
$ 625,000
|
$ 625,000
|
| Debt Amount At Period End |
625,000
|
625,000
|
| Unamortized Discount |
0
|
0
|
| Carrying Amount At Period End |
625,000
|
625,000
|
| Debt Related Party Current |
0
|
0
|
| Debt Related Party Noncurrent |
0
|
0
|
| Debt Current |
625,000
|
625,000
|
| Debt Noncurrent |
0
|
0
|
| Notes Payable Total [Member] |
|
|
| Debt Original Principal |
9,850,598
|
9,850,598
|
| Debt Amount At Period End |
8,720,067
|
9,009,739
|
| Unamortized Discount |
88,540
|
298,892
|
| Carrying Amount At Period End |
8,631,527
|
8,710,847
|
| Debt Related Party Current |
2,444,194
|
2,446,919
|
| Debt Related Party Noncurrent |
0
|
3,571
|
| Debt Current |
6,187,333
|
6,037,135
|
| Debt Noncurrent |
$ 0
|
$ 223,222
|
| Notes Payable 1 [Member] |
|
|
| Debt Instrument, Issuance Date |
12/01/07
|
12/01/07
|
| Debt Instrument, Maturity Date |
09/01/15
|
09/01/15
|
| Debt Stated Interest Rate |
7.00%
|
7.00%
|
| In Default |
Yes
|
Yes
|
| Debt Original Principal |
$ 125,000
|
$ 125,000
|
| Debt Amount At Period End |
85,821
|
85,821
|
| Unamortized Discount |
0
|
0
|
| Carrying Amount At Period End |
85,821
|
85,821
|
| Debt Related Party Current |
0
|
0
|
| Debt Related Party Noncurrent |
0
|
0
|
| Debt Current |
85,821
|
85,821
|
| Debt Noncurrent |
$ 0
|
$ 0
|
| X |
- References
+ Details
| Name: |
cpwr_CarryingAmountAtPeriodEnd |
| Namespace Prefix: |
cpwr_ |
| Data Type: |
xbrli:monetaryItemType |
| Balance Type: |
credit |
| Period Type: |
instant |
|
| X |
- References
+ Details
| Name: |
cpwr_DebtInDefault |
| Namespace Prefix: |
cpwr_ |
| Data Type: |
xbrli:stringItemType |
| Balance Type: |
na |
| Period Type: |
duration |
|
| X |
- References
+ Details
| Name: |
cpwr_DebtInstrumentIssuanceDate |
| Namespace Prefix: |
cpwr_ |
| Data Type: |
xbrli:stringItemType |
| Balance Type: |
na |
| Period Type: |
duration |
|
| X |
- References
+ Details
| Name: |
cpwr_DebtInstrumentsMaturityDate |
| Namespace Prefix: |
cpwr_ |
| Data Type: |
xbrli:stringItemType |
| Balance Type: |
na |
| Period Type: |
duration |
|
| X |
- References
+ Details
| Name: |
cpwr_DebtLongtermAndShorttermCombinedAmount1 |
| Namespace Prefix: |
cpwr_ |
| Data Type: |
xbrli:monetaryItemType |
| Balance Type: |
credit |
| Period Type: |
instant |
|
| X |
- DefinitionAmount of debt and lease obligation, classified as current. Reference 1: http://www.xbrl.org/2003/role/disclosureRef
-Topic 210
-SubTopic 10
-Name Accounting Standards Codification
-Section S99
-Paragraph 1
-Subparagraph (SX 210.5-02(21))
-Publisher FASB
-URI https://asc.fasb.org//1943274/2147480566/210-10-S99-1
| Name: |
us-gaap_DebtCurrent |
| Namespace Prefix: |
us-gaap_ |
| Data Type: |
xbrli:monetaryItemType |
| Balance Type: |
credit |
| Period Type: |
instant |
|
| X |
- DefinitionAmount, before unamortized (discount) premium and debt issuance costs, of long-term debt. Includes, but is not limited to, notes payable, bonds payable, commercial loans, mortgage loans, convertible debt, subordinated debt and other types of debt. Reference 1: http://fasb.org/us-gaap/role/ref/legacyRef
-Name Accounting Standards Codification
-Section S99
-Paragraph 1
-Subparagraph (SX 210.5-02(22))
-SubTopic 10
-Topic 210
-Publisher FASB
-URI https://asc.fasb.org//1943274/2147480566/210-10-S99-1
Reference 2: http://fasb.org/us-gaap/role/ref/legacyRef
-Topic 942
-SubTopic 210
-Name Accounting Standards Codification
-Section S99
-Paragraph 1
-Subparagraph (SX 210.9-03(16))
-Publisher FASB
-URI https://asc.fasb.org//1943274/2147479853/942-210-S99-1
Reference 3: http://www.xbrl.org/2003/role/disclosureRef
-Topic 470
-SubTopic 20
-Name Accounting Standards Codification
-Section 50
-Paragraph 4
-Subparagraph (b)(1)
-Publisher FASB
-URI https://asc.fasb.org//1943274/2147481139/470-20-50-4
| Name: |
us-gaap_DebtInstrumentCarryingAmount |
| Namespace Prefix: |
us-gaap_ |
| Data Type: |
xbrli:monetaryItemType |
| Balance Type: |
credit |
| Period Type: |
instant |
|
| X |
- DefinitionFace (par) amount of debt instrument at time of issuance. Reference 1: http://www.xbrl.org/2003/role/disclosureRef
-Topic 835
-SubTopic 30
-Name Accounting Standards Codification
-Section 50
-Paragraph 1
-Publisher FASB
-URI https://asc.fasb.org//1943274/2147482900/835-30-50-1
Reference 2: http://www.xbrl.org/2003/role/disclosureRef
-Topic 470
-SubTopic 20
-Name Accounting Standards Codification
-Section 50
-Paragraph 1B
-Subparagraph (a)
-Publisher FASB
-URI https://asc.fasb.org//1943274/2147481139/470-20-50-1B
Reference 3: http://www.xbrl.org/2003/role/exampleRef
-Topic 470
-SubTopic 20
-Name Accounting Standards Codification
-Section 55
-Paragraph 69B
-Publisher FASB
-URI https://asc.fasb.org//1943274/2147481568/470-20-55-69B
Reference 4: http://www.xbrl.org/2003/role/exampleRef
-Topic 470
-SubTopic 20
-Name Accounting Standards Codification
-Section 55
-Paragraph 69C
-Publisher FASB
-URI https://asc.fasb.org//1943274/2147481568/470-20-55-69C
Reference 5: http://fasb.org/us-gaap/role/ref/legacyRef
-Name Accounting Standards Codification
-Topic 835
-SubTopic 30
-Section 45
-Paragraph 2
-Publisher FASB
-URI https://asc.fasb.org//1943274/2147482925/835-30-45-2
Reference 6: http://fasb.org/us-gaap/role/ref/legacyRef
-Name Accounting Standards Codification
-Topic 835
-SubTopic 30
-Section 55
-Paragraph 8
-Publisher FASB
-URI https://asc.fasb.org//1943274/2147482949/835-30-55-8
| Name: |
us-gaap_DebtInstrumentFaceAmount |
| Namespace Prefix: |
us-gaap_ |
| Data Type: |
xbrli:monetaryItemType |
| Balance Type: |
credit |
| Period Type: |
instant |
|
| X |
- DefinitionContractual interest rate for funds borrowed, under the debt agreement. Reference 1: http://www.xbrl.org/2003/role/disclosureRef
-Topic 470
-SubTopic 20
-Name Accounting Standards Codification
-Section 50
-Paragraph 1B
-Subparagraph (b)
-Publisher FASB
-URI https://asc.fasb.org//1943274/2147481139/470-20-50-1B
Reference 2: http://fasb.org/us-gaap/role/ref/legacyRef
-Name Accounting Standards Codification
-Topic 210
-SubTopic 10
-Section S99
-Paragraph 1
-Subparagraph (SX 210.5-02.22(a)(1))
-Publisher FASB
-URI https://asc.fasb.org//1943274/2147480566/210-10-S99-1
| Name: |
us-gaap_DebtInstrumentInterestRateStatedPercentage |
| Namespace Prefix: |
us-gaap_ |
| Data Type: |
dtr-types:percentItemType |
| Balance Type: |
na |
| Period Type: |
instant |
|
| X |
- DefinitionAmount, after accumulated amortization, of debt discount. Reference 1: http://fasb.org/us-gaap/role/ref/legacyRef
-Name Accounting Standards Codification
-Topic 835
-SubTopic 30
-Section 45
-Paragraph 1A
-Publisher FASB
-URI https://asc.fasb.org//1943274/2147482925/835-30-45-1A
Reference 2: http://fasb.org/us-gaap/role/ref/legacyRef
-Name Accounting Standards Codification
-Topic 835
-SubTopic 30
-Section 55
-Paragraph 8
-Publisher FASB
-URI https://asc.fasb.org//1943274/2147482949/835-30-55-8
Reference 3: http://www.xbrl.org/2009/role/commonPracticeRef
-Topic 470
-SubTopic 20
-Name Accounting Standards Codification
-Section 50
-Paragraph 1D
-Subparagraph (a)
-Publisher FASB
-URI https://asc.fasb.org//1943274/2147481139/470-20-50-1D
| Name: |
us-gaap_DebtInstrumentUnamortizedDiscount |
| Namespace Prefix: |
us-gaap_ |
| Data Type: |
xbrli:monetaryItemType |
| Balance Type: |
debit |
| Period Type: |
instant |
|
| X |
- DefinitionRepresents the aggregate of total long-term debt, including current maturities and short-term debt.
| Name: |
us-gaap_DebtLongtermAndShorttermCombinedAmount |
| Namespace Prefix: |
us-gaap_ |
| Data Type: |
xbrli:monetaryItemType |
| Balance Type: |
credit |
| Period Type: |
instant |
|
| X |
- DefinitionAmount, after deduction of unamortized premium (discount) and debt issuance cost, of long-term debt classified as current. Excludes lease obligation. Reference 1: http://www.xbrl.org/2003/role/disclosureRef
-Topic 210
-SubTopic 10
-Name Accounting Standards Codification
-Section S99
-Paragraph 1
-Subparagraph (SX 210.5-02(20))
-Publisher FASB
-URI https://asc.fasb.org//1943274/2147480566/210-10-S99-1
| Name: |
us-gaap_LongTermDebtCurrent |
| Namespace Prefix: |
us-gaap_ |
| Data Type: |
xbrli:monetaryItemType |
| Balance Type: |
credit |
| Period Type: |
instant |
|
| X |
- DefinitionAmount, after deduction of unamortized premium (discount) and debt issuance cost, of long-term debt classified as noncurrent. Excludes lease obligation. Reference 1: http://www.xbrl.org/2003/role/disclosureRef
-Topic 210
-SubTopic 10
-Name Accounting Standards Codification
-Section S99
-Paragraph 1
-Subparagraph (SX 210.5-02(22))
-Publisher FASB
-URI https://asc.fasb.org//1943274/2147480566/210-10-S99-1
| Name: |
us-gaap_LongTermDebtNoncurrent |
| Namespace Prefix: |
us-gaap_ |
| Data Type: |
xbrli:monetaryItemType |
| Balance Type: |
credit |
| Period Type: |
instant |
|
| X |
- Details
| Name: |
us-gaap_LongtermDebtTypeAxis=cpwr_NotePayableTwoMember |
| Namespace Prefix: |
|
| Data Type: |
na |
| Balance Type: |
|
| Period Type: |
|
|
| X |
- Details
| Name: |
us-gaap_LongtermDebtTypeAxis=cpwr_NotePayableThreeMember |
| Namespace Prefix: |
|
| Data Type: |
na |
| Balance Type: |
|
| Period Type: |
|
|
| X |
- Details
| Name: |
us-gaap_LongtermDebtTypeAxis=cpwr_NotePayableFourMember |
| Namespace Prefix: |
|
| Data Type: |
na |
| Balance Type: |
|
| Period Type: |
|
|
| X |
- Details
| Name: |
us-gaap_LongtermDebtTypeAxis=cpwr_NotePayableFiveMember |
| Namespace Prefix: |
|
| Data Type: |
na |
| Balance Type: |
|
| Period Type: |
|
|
| X |
- Details
| Name: |
us-gaap_LongtermDebtTypeAxis=cpwr_NotePayableSixMember |
| Namespace Prefix: |
|
| Data Type: |
na |
| Balance Type: |
|
| Period Type: |
|
|
| X |
- Details
| Name: |
us-gaap_LongtermDebtTypeAxis=cpwr_NotePayableSevenMember |
| Namespace Prefix: |
|
| Data Type: |
na |
| Balance Type: |
|
| Period Type: |
|
|
| X |
- Details
| Name: |
us-gaap_LongtermDebtTypeAxis=cpwr_NotePayableEightMember |
| Namespace Prefix: |
|
| Data Type: |
na |
| Balance Type: |
|
| Period Type: |
|
|
| X |
- Details
| Name: |
us-gaap_LongtermDebtTypeAxis=cpwr_NotePayableNineMember |
| Namespace Prefix: |
|
| Data Type: |
na |
| Balance Type: |
|
| Period Type: |
|
|
| X |
- Details
| Name: |
us-gaap_LongtermDebtTypeAxis=cpwr_NotePayableTenMember |
| Namespace Prefix: |
|
| Data Type: |
na |
| Balance Type: |
|
| Period Type: |
|
|
| X |
- Details
| Name: |
us-gaap_LongtermDebtTypeAxis=cpwr_NotePayableElevenMember |
| Namespace Prefix: |
|
| Data Type: |
na |
| Balance Type: |
|
| Period Type: |
|
|
| X |
- Details
| Name: |
us-gaap_LongtermDebtTypeAxis=cpwr_NotePayableTwelveMember |
| Namespace Prefix: |
|
| Data Type: |
na |
| Balance Type: |
|
| Period Type: |
|
|
| X |
- Details
| Name: |
us-gaap_LongtermDebtTypeAxis=cpwr_NotePayableThirteenMember |
| Namespace Prefix: |
|
| Data Type: |
na |
| Balance Type: |
|
| Period Type: |
|
|
| X |
- Details
| Name: |
us-gaap_LongtermDebtTypeAxis=cpwr_NotePayableFourteenMember |
| Namespace Prefix: |
|
| Data Type: |
na |
| Balance Type: |
|
| Period Type: |
|
|
| X |
- Details
| Name: |
us-gaap_LongtermDebtTypeAxis=cpwr_NotePayableFifteenMember |
| Namespace Prefix: |
|
| Data Type: |
na |
| Balance Type: |
|
| Period Type: |
|
|
| X |
- Details
| Name: |
us-gaap_LongtermDebtTypeAxis=cpwr_NotePayableSixteenMember |
| Namespace Prefix: |
|
| Data Type: |
na |
| Balance Type: |
|
| Period Type: |
|
|
| X |
- Details
| Name: |
us-gaap_LongtermDebtTypeAxis=cpwr_NotePayableSeventeenMember |
| Namespace Prefix: |
|
| Data Type: |
na |
| Balance Type: |
|
| Period Type: |
|
|
| X |
- Details
| Name: |
us-gaap_LongtermDebtTypeAxis=cpwr_NotePayableEighteenMember |
| Namespace Prefix: |
|
| Data Type: |
na |
| Balance Type: |
|
| Period Type: |
|
|
| X |
- Details
| Name: |
us-gaap_LongtermDebtTypeAxis=cpwr_NotePayableNinteenMember |
| Namespace Prefix: |
|
| Data Type: |
na |
| Balance Type: |
|
| Period Type: |
|
|
| X |
- Details
| Name: |
us-gaap_LongtermDebtTypeAxis=cpwr_NotePayableTwentyMember |
| Namespace Prefix: |
|
| Data Type: |
na |
| Balance Type: |
|
| Period Type: |
|
|
| X |
- Details
| Name: |
us-gaap_LongtermDebtTypeAxis=cpwr_NotePayableTWentyOneMember |
| Namespace Prefix: |
|
| Data Type: |
na |
| Balance Type: |
|
| Period Type: |
|
|
| X |
- Details
| Name: |
us-gaap_LongtermDebtTypeAxis=cpwr_NotePayableTwentyTwoMember |
| Namespace Prefix: |
|
| Data Type: |
na |
| Balance Type: |
|
| Period Type: |
|
|
| X |
- Details
| Name: |
us-gaap_LongtermDebtTypeAxis=cpwr_NotePayableTwentyThreeMember |
| Namespace Prefix: |
|
| Data Type: |
na |
| Balance Type: |
|
| Period Type: |
|
|
| X |
- Details
| Name: |
us-gaap_LongtermDebtTypeAxis=cpwr_NotePayableTwentyFourMember |
| Namespace Prefix: |
|
| Data Type: |
na |
| Balance Type: |
|
| Period Type: |
|
|
| X |
- Details
| Name: |
us-gaap_LongtermDebtTypeAxis=cpwr_NotePayableTwentyFiveMember |
| Namespace Prefix: |
|
| Data Type: |
na |
| Balance Type: |
|
| Period Type: |
|
|
| X |
- Details
| Name: |
us-gaap_LongtermDebtTypeAxis=cpwr_NotePayableTwentySixMember |
| Namespace Prefix: |
|
| Data Type: |
na |
| Balance Type: |
|
| Period Type: |
|
|
| X |
- Details
| Name: |
us-gaap_LongtermDebtTypeAxis=cpwr_NotePayableTwentySevenMember |
| Namespace Prefix: |
|
| Data Type: |
na |
| Balance Type: |
|
| Period Type: |
|
|
| X |
- Details
| Name: |
us-gaap_LongtermDebtTypeAxis=cpwr_NotePayableTwentyEightMember |
| Namespace Prefix: |
|
| Data Type: |
na |
| Balance Type: |
|
| Period Type: |
|
|
| X |
- Details
| Name: |
us-gaap_LongtermDebtTypeAxis=cpwr_NotePayableTwentyNineMember |
| Namespace Prefix: |
|
| Data Type: |
na |
| Balance Type: |
|
| Period Type: |
|
|
| X |
- Details
| Name: |
us-gaap_LongtermDebtTypeAxis=cpwr_NotePayableThirtyMember |
| Namespace Prefix: |
|
| Data Type: |
na |
| Balance Type: |
|
| Period Type: |
|
|
| X |
- Details
| Name: |
us-gaap_LongtermDebtTypeAxis=cpwr_NotePayableThirtyOneMember |
| Namespace Prefix: |
|
| Data Type: |
na |
| Balance Type: |
|
| Period Type: |
|
|
| X |
- Details
| Name: |
us-gaap_LongtermDebtTypeAxis=cpwr_NotePayableThirtyTwoMember |
| Namespace Prefix: |
|
| Data Type: |
na |
| Balance Type: |
|
| Period Type: |
|
|
| X |
- Details
| Name: |
us-gaap_LongtermDebtTypeAxis=cpwr_NotePayableThirtyThreeMember |
| Namespace Prefix: |
|
| Data Type: |
na |
| Balance Type: |
|
| Period Type: |
|
|
| X |
- Details
| Name: |
us-gaap_LongtermDebtTypeAxis=cpwr_NotePayableThirtyFourMember |
| Namespace Prefix: |
|
| Data Type: |
na |
| Balance Type: |
|
| Period Type: |
|
|
| X |
- Details
| Name: |
us-gaap_LongtermDebtTypeAxis=cpwr_NotePayableThirtyFiveMember |
| Namespace Prefix: |
|
| Data Type: |
na |
| Balance Type: |
|
| Period Type: |
|
|
| X |
- Details
| Name: |
us-gaap_LongtermDebtTypeAxis=cpwr_NotePayableThirtySixMember |
| Namespace Prefix: |
|
| Data Type: |
na |
| Balance Type: |
|
| Period Type: |
|
|
| X |
- Details
| Name: |
us-gaap_LongtermDebtTypeAxis=cpwr_NotePayableThirtySevenMember |
| Namespace Prefix: |
|
| Data Type: |
na |
| Balance Type: |
|
| Period Type: |
|
|
| X |
- Details
| Name: |
us-gaap_LongtermDebtTypeAxis=cpwr_NotePayableTotalMember |
| Namespace Prefix: |
|
| Data Type: |
na |
| Balance Type: |
|
| Period Type: |
|
|
| X |
- Details
| Name: |
us-gaap_LongtermDebtTypeAxis=cpwr_NotePayableOneMember |
| Namespace Prefix: |
|
| Data Type: |
na |
| Balance Type: |
|
| Period Type: |
|
|
v3.23.2
CONVERTIBLE NOTES AND NOTES PAYABLE (Details Narrative) - USD ($)
|
12 Months Ended |
Dec. 31, 2022 |
Dec. 31, 2021 |
| Series D Preferred Stock Member |
|
|
| Amount Converted Into Shares |
$ 215,000
|
|
| Coversion Of Shares |
143
|
|
| Coversion Of Shares |
200,000
|
|
| Accrued Interest |
$ 66,126
|
|
| Common Stock One [Member] |
|
|
| Amount Converted Into Shares |
$ 60,650
|
$ 419,179
|
| Borrowed shares from CEO |
847,262
|
|
| Coversion Of Shares |
10,847,262
|
34,829,587
|
| Accrued Interest |
$ 1,946
|
|
| Accrued liability |
$ 11,014
|
|
| X |
- References
+ Details
| Name: |
cpwr_CoversionOfShares |
| Namespace Prefix: |
cpwr_ |
| Data Type: |
xbrli:sharesItemType |
| Balance Type: |
na |
| Period Type: |
duration |
|
| X |
- References
+ Details
| Name: |
cpwr_DebtConversionOriginalDebtsAmount1 |
| Namespace Prefix: |
cpwr_ |
| Data Type: |
xbrli:monetaryItemType |
| Balance Type: |
credit |
| Period Type: |
duration |
|
| X |
- References
+ Details
| Name: |
cpwr_SharesBorrowedFromCeo |
| Namespace Prefix: |
cpwr_ |
| Data Type: |
xbrli:sharesItemType |
| Balance Type: |
na |
| Period Type: |
duration |
|
| X |
- DefinitionThe number of shares issued in exchange for the original debt being converted in a noncash (or part noncash) transaction. "Part noncash" refers to that portion of the transaction not resulting in cash receipts or payments in the period. Reference 1: http://fasb.org/us-gaap/role/ref/legacyRef
-Name Accounting Standards Codification
-Topic 230
-SubTopic 10
-Section 50
-Paragraph 3
-Publisher FASB
-URI https://asc.fasb.org//1943274/2147482913/230-10-50-3
Reference 2: http://fasb.org/us-gaap/role/ref/legacyRef
-Name Accounting Standards Codification
-Topic 230
-SubTopic 10
-Section 50
-Paragraph 5
-Publisher FASB
-URI https://asc.fasb.org//1943274/2147482913/230-10-50-5
| Name: |
us-gaap_DebtConversionConvertedInstrumentSharesIssued1 |
| Namespace Prefix: |
us-gaap_ |
| Data Type: |
xbrli:sharesItemType |
| Balance Type: |
na |
| Period Type: |
duration |
|
| X |
- DefinitionIncrease for accrued, but unpaid interest on the debt instrument for the period. Reference 1: http://www.xbrl.org/2009/role/commonPracticeRef
-Topic 235
-SubTopic 10
-Name Accounting Standards Codification
-Section S99
-Paragraph 1
-Subparagraph (SX 210.4-08(f))
-Publisher FASB
-URI https://asc.fasb.org//1943274/2147480678/235-10-S99-1
| Name: |
us-gaap_DebtInstrumentIncreaseAccruedInterest |
| Namespace Prefix: |
us-gaap_ |
| Data Type: |
xbrli:monetaryItemType |
| Balance Type: |
credit |
| Period Type: |
duration |
|
| X |
- DefinitionThe increase (decrease) during the reporting period in other expenses incurred but not yet paid. Reference 1: http://fasb.org/us-gaap/role/ref/legacyRef
-Name Accounting Standards Codification
-Section 45
-Paragraph 28
-Subparagraph (a)
-SubTopic 10
-Topic 230
-Publisher FASB
-URI https://asc.fasb.org//1943274/2147482740/230-10-45-28
| Name: |
us-gaap_IncreaseDecreaseInOtherAccruedLiabilities |
| Namespace Prefix: |
us-gaap_ |
| Data Type: |
xbrli:monetaryItemType |
| Balance Type: |
debit |
| Period Type: |
duration |
|
| X |
- Details
| Name: |
us-gaap_StatementClassOfStockAxis=us-gaap_SeriesDPreferredStockMember |
| Namespace Prefix: |
|
| Data Type: |
na |
| Balance Type: |
|
| Period Type: |
|
|
| X |
- Details
| Name: |
us-gaap_StatementClassOfStockAxis=cpwr_CommonStocksOneMember |
| Namespace Prefix: |
|
| Data Type: |
na |
| Balance Type: |
|
| Period Type: |
|
|
v3.23.2
DERIVATIVE LIABILITY (Details) - USD ($)
|
Dec. 31, 2022 |
Dec. 31, 2021 |
| Derivative Liability |
$ 6,998,262
|
$ 3,769,211
|
| Level 1 |
|
|
| Derivative Liability |
0
|
0
|
| Level 2 |
|
|
| Derivative Liability |
0
|
0
|
| Level 3 |
|
|
| Derivative Liability |
$ 6,998,262
|
$ 3,769,211
|
| X |
- DefinitionFair value, after the effects of master netting arrangements, of a financial liability or contract with one or more underlyings, notional amount or payment provision or both, and the contract can be net settled by means outside the contract or delivery of an asset, expected to be settled within one year or normal operating cycle, if longer. Includes assets not subject to a master netting arrangement and not elected to be offset. Reference 1: http://www.xbrl.org/2003/role/disclosureRef
-Topic 210
-SubTopic 20
-Name Accounting Standards Codification
-Section 50
-Paragraph 3
-Subparagraph (c)
-Publisher FASB
-URI https://asc.fasb.org//1943274/2147483466/210-20-50-3
| Name: |
us-gaap_DerivativeLiabilitiesCurrent |
| Namespace Prefix: |
us-gaap_ |
| Data Type: |
xbrli:monetaryItemType |
| Balance Type: |
credit |
| Period Type: |
instant |
|
v3.23.2
DERIVATIVE LIABILITY (Details 1) - USD ($)
|
12 Months Ended |
Dec. 31, 2022 |
Dec. 31, 2021 |
| DERIVATIVE LIABILITY |
|
|
| Derivative Liability, Beginning of period |
$ 3,769,211
|
$ 5,321,395
|
| Addition To Derivative Instruments |
0
|
420,214
|
| Derivative Liability Extinguished Upon Conversion Of Notes Payable |
(199,194)
|
(666,916)
|
| Change In Fair Value Of Derivative Liability |
3,428,245
|
(1,305,482)
|
| Derivative Liability, End of period |
$ 6,998,262
|
$ 3,769,211
|
| X |
- References
+ Details
| Name: |
cpwr_AdditionToDerivativeInstruments |
| Namespace Prefix: |
cpwr_ |
| Data Type: |
xbrli:monetaryItemType |
| Balance Type: |
debit |
| Period Type: |
duration |
|
| X |
- References
+ Details
| Name: |
cpwr_DerivativeLiabilityAbstract |
| Namespace Prefix: |
cpwr_ |
| Data Type: |
xbrli:stringItemType |
| Balance Type: |
na |
| Period Type: |
duration |
|
| X |
- References
+ Details
| Name: |
cpwr_DerivativeLiabilityExtinguishedUponConversionOfNotesPayable |
| Namespace Prefix: |
cpwr_ |
| Data Type: |
xbrli:monetaryItemType |
| Balance Type: |
debit |
| Period Type: |
duration |
|
| X |
- References
+ Details
| Name: |
cpwr_FairValueNetDerivativeAssetLiabilityMeasuredOnRecurringBasisChangesInUnrealizedGainLoss |
| Namespace Prefix: |
cpwr_ |
| Data Type: |
xbrli:monetaryItemType |
| Balance Type: |
credit |
| Period Type: |
duration |
|
| X |
- DefinitionFair value, after the effects of master netting arrangements, of a financial liability or contract with one or more underlyings, notional amount or payment provision or both, and the contract can be net settled by means outside the contract or delivery of an asset. Includes liabilities not subject to a master netting arrangement and not elected to be offset. Reference 1: http://www.xbrl.org/2003/role/disclosureRef
-Topic 946
-SubTopic 210
-Name Accounting Standards Codification
-Section 50
-Paragraph 6
-Subparagraph (e)
-Publisher FASB
-URI https://asc.fasb.org//1943274/2147480524/946-210-50-6
Reference 2: http://www.xbrl.org/2003/role/disclosureRef
-Topic 946
-SubTopic 210
-Name Accounting Standards Codification
-Section 50
-Paragraph 6
-Subparagraph (a)(1)
-Publisher FASB
-URI https://asc.fasb.org//1943274/2147480524/946-210-50-6
Reference 3: http://www.xbrl.org/2003/role/disclosureRef
-Topic 946
-SubTopic 210
-Name Accounting Standards Codification
-Section 50
-Paragraph 6
-Subparagraph (a)(2)
-Publisher FASB
-URI https://asc.fasb.org//1943274/2147480524/946-210-50-6
Reference 4: http://www.xbrl.org/2003/role/disclosureRef
-Topic 946
-SubTopic 210
-Name Accounting Standards Codification
-Section 50
-Paragraph 6
-Subparagraph (a)(4)
-Publisher FASB
-URI https://asc.fasb.org//1943274/2147480524/946-210-50-6
Reference 5: http://www.xbrl.org/2003/role/disclosureRef
-Topic 946
-SubTopic 210
-Name Accounting Standards Codification
-Section 50
-Paragraph 1
-Subparagraph (a)(1)
-Publisher FASB
-URI https://asc.fasb.org//1943274/2147480524/946-210-50-1
Reference 6: http://www.xbrl.org/2003/role/disclosureRef
-Topic 946
-SubTopic 210
-Name Accounting Standards Codification
-Section 50
-Paragraph 1
-Subparagraph (b)(1)
-Publisher FASB
-URI https://asc.fasb.org//1943274/2147480524/946-210-50-1
Reference 7: http://www.xbrl.org/2003/role/disclosureRef
-Topic 946
-SubTopic 210
-Name Accounting Standards Codification
-Section 50
-Paragraph 1
-Subparagraph (b)(2)
-Publisher FASB
-URI https://asc.fasb.org//1943274/2147480524/946-210-50-1
Reference 8: http://www.xbrl.org/2003/role/disclosureRef
-Topic 946
-SubTopic 210
-Name Accounting Standards Codification
-Section 50
-Paragraph 1
-Subparagraph (c)(2)
-Publisher FASB
-URI https://asc.fasb.org//1943274/2147480524/946-210-50-1
Reference 9: http://www.xbrl.org/2003/role/disclosureRef
-Topic 946
-SubTopic 210
-Name Accounting Standards Codification
-Section 50
-Paragraph 6
-Subparagraph (f)
-Publisher FASB
-URI https://asc.fasb.org//1943274/2147480524/946-210-50-6
Reference 10: http://www.xbrl.org/2009/role/commonPracticeRef
-Topic 946
-SubTopic 210
-Name Accounting Standards Codification
-Section 50
-Paragraph 6
-Subparagraph (a)(3)
-Publisher FASB
-URI https://asc.fasb.org//1943274/2147480524/946-210-50-6
Reference 11: http://www.xbrl.org/2003/role/disclosureRef
-Topic 946
-SubTopic 210
-Name Accounting Standards Codification
-Section S99
-Paragraph 1
-Subparagraph (SX 210.6-04(9)(e))
-Publisher FASB
-URI https://asc.fasb.org//1943274/2147479617/946-210-S99-1
Reference 12: http://www.xbrl.org/2003/role/disclosureRef
-Topic 946
-SubTopic 320
-Name Accounting Standards Codification
-Section S99
-Paragraph 5C
-Subparagraph (SX 210.12-13C(Column H)(Footnote 7))
-Publisher FASB
-URI https://asc.fasb.org//1943274/2147480032/946-320-S99-5C
Reference 13: http://www.xbrl.org/2003/role/disclosureRef
-Topic 946
-SubTopic 210
-Name Accounting Standards Codification
-Section S99
-Paragraph 1
-Subparagraph (SX 210.6-04(9)(b))
-Publisher FASB
-URI https://asc.fasb.org//1943274/2147479617/946-210-S99-1
Reference 14: http://www.xbrl.org/2003/role/disclosureRef
-Topic 946
-SubTopic 210
-Name Accounting Standards Codification
-Section S99
-Paragraph 1
-Subparagraph (SX 210.6-04(9)(d))
-Publisher FASB
-URI https://asc.fasb.org//1943274/2147479617/946-210-S99-1
Reference 15: http://www.xbrl.org/2003/role/disclosureRef
-Topic 946
-SubTopic 320
-Name Accounting Standards Codification
-Section S99
-Paragraph 5
-Subparagraph (SX 210.12-13(Column G)(Footnote 8))
-Publisher FASB
-URI https://asc.fasb.org//1943274/2147480032/946-320-S99-5
Reference 16: http://www.xbrl.org/2003/role/disclosureRef
-Topic 946
-SubTopic 320
-Name Accounting Standards Codification
-Section S99
-Paragraph 5C
-Subparagraph (SX 210.12-13C(Column H))
-Publisher FASB
-URI https://asc.fasb.org//1943274/2147480032/946-320-S99-5C
Reference 17: http://www.xbrl.org/2003/role/disclosureRef
-Topic 946
-SubTopic 320
-Name Accounting Standards Codification
-Section S99
-Paragraph 5
-Subparagraph (SX 210.12-13(Column G))
-Publisher FASB
-URI https://asc.fasb.org//1943274/2147480032/946-320-S99-5
Reference 18: http://www.xbrl.org/2003/role/disclosureRef
-Topic 946
-SubTopic 320
-Name Accounting Standards Codification
-Section S99
-Paragraph 5A
-Subparagraph (SX 210.12-13A(Column E))
-Publisher FASB
-URI https://asc.fasb.org//1943274/2147480032/946-320-S99-5A
Reference 19: http://www.xbrl.org/2003/role/disclosureRef
-Topic 946
-SubTopic 320
-Name Accounting Standards Codification
-Section S99
-Paragraph 5B
-Subparagraph (SX 210.12-13B(Column E))
-Publisher FASB
-URI https://asc.fasb.org//1943274/2147480032/946-320-S99-5B
Reference 20: http://www.xbrl.org/2003/role/disclosureRef
-Topic 946
-SubTopic 320
-Name Accounting Standards Codification
-Section S99
-Paragraph 5B
-Subparagraph (SX 210.12-13B(Column E)(Footnote 4))
-Publisher FASB
-URI https://asc.fasb.org//1943274/2147480032/946-320-S99-5B
Reference 21: http://www.xbrl.org/2003/role/disclosureRef
-Topic 210
-SubTopic 20
-Name Accounting Standards Codification
-Section 50
-Paragraph 3
-Subparagraph (c)
-Publisher FASB
-URI https://asc.fasb.org//1943274/2147483466/210-20-50-3
Reference 22: http://www.xbrl.org/2003/role/exampleRef
-Topic 210
-SubTopic 20
-Name Accounting Standards Codification
-Section 55
-Paragraph 22
-Publisher FASB
-URI https://asc.fasb.org//1943274/2147483444/210-20-55-22
Reference 23: http://www.xbrl.org/2003/role/disclosureRef
-Topic 210
-SubTopic 20
-Name Accounting Standards Codification
-Section 55
-Paragraph 10
-Publisher FASB
-URI https://asc.fasb.org//1943274/2147483444/210-20-55-10
Reference 24: http://www.xbrl.org/2003/role/disclosureRef
-Topic 825
-SubTopic 10
-Name Accounting Standards Codification
-Section 50
-Paragraph 10
-Publisher FASB
-URI https://asc.fasb.org//1943274/2147482907/825-10-50-10
| Name: |
us-gaap_DerivativeLiabilities |
| Namespace Prefix: |
us-gaap_ |
| Data Type: |
xbrli:monetaryItemType |
| Balance Type: |
credit |
| Period Type: |
instant |
|
v3.23.2
DERIVATIVE LIABILITY (Details 2) - USD ($)
|
12 Months Ended |
Dec. 31, 2022 |
Dec. 31, 2021 |
| DERIVATIVE LIABILITY |
|
|
| Day one loss on valuation |
$ 0
|
$ 97,861
|
| Loss (gain) from the change in fair value of derivative liability |
3,428,245
|
(1,403,343)
|
| Change In Fair Value Of Derivative Liability |
$ 3,428,245
|
$ (1,305,482)
|
| X |
- References
+ Details
| Name: |
cpwr_DayOneGainslossesOnValuation |
| Namespace Prefix: |
cpwr_ |
| Data Type: |
xbrli:monetaryItemType |
| Balance Type: |
credit |
| Period Type: |
duration |
|
| X |
- References
+ Details
| Name: |
cpwr_DerivativeLiabilityAbstract |
| Namespace Prefix: |
cpwr_ |
| Data Type: |
xbrli:stringItemType |
| Balance Type: |
na |
| Period Type: |
duration |
|
| X |
- References
+ Details
| Name: |
cpwr_LossGainFromTheChangeInFairValueOfDerivativeLiability |
| Namespace Prefix: |
cpwr_ |
| Data Type: |
xbrli:monetaryItemType |
| Balance Type: |
debit |
| Period Type: |
duration |
|
| X |
- DefinitionFair values as of the balance sheet date of the net amount of all assets and liabilities resulting from contracts that meet the criteria of being accounted for as derivative instruments. Reference 1: http://fasb.org/us-gaap/role/ref/legacyRef
-Name Accounting Standards Codification
-Section 45
-Paragraph 5
-SubTopic 10
-Topic 815
-Publisher FASB
-URI https://asc.fasb.org//1943274/2147480463/815-10-45-5
| Name: |
us-gaap_DerivativeAssetsLiabilitiesAtFairValueNet |
| Namespace Prefix: |
us-gaap_ |
| Data Type: |
xbrli:monetaryItemType |
| Balance Type: |
debit |
| Period Type: |
instant |
|
v3.23.2
| X |
- References
+ Details
| Name: |
cpwr_DerivativeLiabilityExpectedDividends |
| Namespace Prefix: |
cpwr_ |
| Data Type: |
num:percentItemType |
| Balance Type: |
na |
| Period Type: |
duration |
|
| X |
- References
+ Details
| Name: |
cpwr_DerivativeLiabilityExpectedTerm |
| Namespace Prefix: |
cpwr_ |
| Data Type: |
xbrli:durationItemType |
| Balance Type: |
na |
| Period Type: |
duration |
|
| X |
- References
+ Details
| Name: |
cpwr_DerivativeLiabilityExpectedVolatility |
| Namespace Prefix: |
cpwr_ |
| Data Type: |
num:percentItemType |
| Balance Type: |
na |
| Period Type: |
duration |
|
| X |
- References
+ Details
| Name: |
cpwr_DerivativeLiabilityRiskFreeInterestRate |
| Namespace Prefix: |
cpwr_ |
| Data Type: |
num:percentItemType |
| Balance Type: |
na |
| Period Type: |
duration |
|
| X |
- Details
| Name: |
us-gaap_AwardDateAxis=cpwr_RemeasurementDateMember |
| Namespace Prefix: |
|
| Data Type: |
na |
| Balance Type: |
|
| Period Type: |
|
|
| X |
- Details
| Name: |
srt_RangeAxis=srt_MinimumMember |
| Namespace Prefix: |
|
| Data Type: |
na |
| Balance Type: |
|
| Period Type: |
|
|
| X |
- Details
| Name: |
srt_RangeAxis=srt_MaximumMember |
| Namespace Prefix: |
|
| Data Type: |
na |
| Balance Type: |
|
| Period Type: |
|
|
v3.23.2
Stockholders Equity (Details) - Warrant [Member] - $ / shares
|
12 Months Ended |
Dec. 31, 2022 |
Dec. 31, 2021 |
| Warrants outstanding, beginning |
125,073
|
125,073
|
| Warrants outstanding, ending |
125,073
|
125,073
|
| Warrants exercisable |
125,073
|
|
| Weighted Average excercise price, beginning balance |
$ 0.13
|
$ 0.13
|
| Weighted Average excercise price, Granted |
0
|
0
|
| Weighted Average excercise price, Exercised |
0
|
0
|
| Weighted Average excercise price, Forfeited |
0
|
0
|
| Weighted Average excercise price, ending balance |
0.13
|
0.13
|
| Weighted Average excercise price, exercisable |
$ 0.13
|
$ 0.13
|
| X |
- References
+ Details
| Name: |
cpwr_ShareBasedCompensationArrangementByShareBasedPaymentAwardEquityInstrumentsOtherThanOptionsExercisableNumber |
| Namespace Prefix: |
cpwr_ |
| Data Type: |
xbrli:sharesItemType |
| Balance Type: |
na |
| Period Type: |
duration |
|
| X |
- References
+ Details
| Name: |
cpwr_WeightedAverageExcercisePriceExercisable |
| Namespace Prefix: |
cpwr_ |
| Data Type: |
num:perShareItemType |
| Balance Type: |
na |
| Period Type: |
duration |
|
| X |
- DefinitionNumber of warrants or rights outstanding.
| Name: |
us-gaap_ClassOfWarrantOrRightOutstanding |
| Namespace Prefix: |
us-gaap_ |
| Data Type: |
xbrli:sharesItemType |
| Balance Type: |
na |
| Period Type: |
instant |
|
| X |
- DefinitionWeighted average price at which grantees can acquire the shares reserved for issuance under the stock option plan. Reference 1: http://www.xbrl.org/2003/role/disclosureRef
-Topic 718
-SubTopic 10
-Name Accounting Standards Codification
-Section 50
-Paragraph 2
-Subparagraph (c)(1)(i)
-Publisher FASB
-URI https://asc.fasb.org//1943274/2147480429/718-10-50-2
Reference 2: http://www.xbrl.org/2003/role/disclosureRef
-Topic 718
-SubTopic 10
-Name Accounting Standards Codification
-Section 50
-Paragraph 2
-Subparagraph (c)(1)(ii)
-Publisher FASB
-URI https://asc.fasb.org//1943274/2147480429/718-10-50-2
| Name: |
us-gaap_ShareBasedCompensationArrangementByShareBasedPaymentAwardOptionsOutstandingWeightedAverageExercisePrice |
| Namespace Prefix: |
us-gaap_ |
| Data Type: |
dtr-types:perShareItemType |
| Balance Type: |
na |
| Period Type: |
instant |
|
| X |
- DefinitionWeighted average price at which option holders acquired shares when converting their stock options into shares. Reference 1: http://www.xbrl.org/2003/role/disclosureRef
-Topic 718
-SubTopic 10
-Name Accounting Standards Codification
-Section 50
-Paragraph 2
-Subparagraph (c)(1)(iv)(02)
-Publisher FASB
-URI https://asc.fasb.org//1943274/2147480429/718-10-50-2
| Name: |
us-gaap_ShareBasedCompensationArrangementsByShareBasedPaymentAwardOptionsExercisesInPeriodWeightedAverageExercisePrice |
| Namespace Prefix: |
us-gaap_ |
| Data Type: |
dtr-types:perShareItemType |
| Balance Type: |
na |
| Period Type: |
duration |
|
| X |
- DefinitionWeighted average price at which grantees could have acquired the underlying shares with respect to stock options that were terminated. Reference 1: http://www.xbrl.org/2003/role/disclosureRef
-Topic 718
-SubTopic 10
-Name Accounting Standards Codification
-Section 50
-Paragraph 2
-Subparagraph (c)(1)(iv)(03)
-Publisher FASB
-URI https://asc.fasb.org//1943274/2147480429/718-10-50-2
| Name: |
us-gaap_ShareBasedCompensationArrangementsByShareBasedPaymentAwardOptionsForfeituresInPeriodWeightedAverageExercisePrice |
| Namespace Prefix: |
us-gaap_ |
| Data Type: |
dtr-types:perShareItemType |
| Balance Type: |
na |
| Period Type: |
duration |
|
| X |
- DefinitionWeighted average per share amount at which grantees can acquire shares of common stock by exercise of options. Reference 1: http://www.xbrl.org/2003/role/disclosureRef
-Topic 718
-SubTopic 10
-Name Accounting Standards Codification
-Section 50
-Paragraph 2
-Subparagraph (c)(1)(iv)(01)
-Publisher FASB
-URI https://asc.fasb.org//1943274/2147480429/718-10-50-2
| Name: |
us-gaap_ShareBasedCompensationArrangementsByShareBasedPaymentAwardOptionsGrantsInPeriodWeightedAverageExercisePrice |
| Namespace Prefix: |
us-gaap_ |
| Data Type: |
dtr-types:perShareItemType |
| Balance Type: |
na |
| Period Type: |
duration |
|
| X |
- Details
| Name: |
us-gaap_StatementClassOfStockAxis=cpwr_WarrantsMember |
| Namespace Prefix: |
|
| Data Type: |
na |
| Balance Type: |
|
| Period Type: |
|
|
v3.23.2
Stockholders Equity (Details Narrative) - USD ($)
|
12 Months Ended |
|
Dec. 31, 2022 |
Dec. 31, 2021 |
May 22, 2018 |
| Initial commitment, shares issued |
|
|
400,000
|
| Common stock shares issued during the period, shares |
|
693,877
|
|
| Common stock shares issued during the period, value |
|
$ 83,000
|
|
| Closing stock price per share |
$ 0.01
|
|
|
| Common Stock |
|
|
|
| Common stock shares issued during the period, shares |
10,000,000
|
34,829,587
|
|
| Common stock shares issued during the period, value |
$ 185,000
|
$ 972,882
|
|
| Convertible note payable and accrued interest converted into common stock |
45,650
|
$ 419,179
|
|
| Series D Preferred Stock Member |
|
|
|
| Amount Converted Into Shares |
$ 215,000
|
|
|
| Coversion Of Shares |
200,000
|
|
|
| Accrued Interest |
$ 66,126
|
|
|
| Preferred stock, par value |
$ 0.001
|
$ 0.001
|
|
| Preferred stock, shares issued |
278
|
0
|
|
| Preferred stock, shares value |
$ 0
|
$ 0
|
|
| Preferred stock, shares authorized |
1,000
|
1,000
|
|
| Series C Preferred Stock Member |
|
|
|
| Preferred stock, par value |
$ 0.001
|
$ 0.001
|
|
| Preferred stock, shares issued |
2,300,000
|
2,300,000
|
|
| Preferred stock, shares value |
$ 2,300
|
$ 2,300
|
|
| Preferred stock, shares authorized |
2,700,000
|
2,700,000
|
|
| Series B Preferred Stock Member |
|
|
|
| Preferred stock, par value |
$ 0.001
|
$ 0.001
|
|
| Preferred stock, shares issued |
518,750
|
518,750
|
|
| Preferred stock, shares value |
$ 519
|
$ 519
|
|
| Preferred stock, shares authorized |
1,250,000
|
1,250,000
|
|
| Common Stock Two [Member] |
|
|
|
| Amount Converted Into Shares |
$ 15,000
|
|
|
| Borrowed shares from CEO |
847,262
|
|
|
| Coversion Of Shares |
847,262
|
|
|
| Accrued liability |
$ 11,014
|
|
|
| Accrued Interest |
$ 1,946
|
|
|
| Preferred Stock, Series D One |
|
|
|
| Preferred stock, shares issued |
135
|
0
|
|
| Preferred stock, shares value |
$ 270,000
|
|
|
| Preferred Stock, Series D Two |
|
|
|
| Amount Converted Into Shares |
215,000
|
|
|
| Accrued Interest |
$ 66,126
|
|
|
| Preferred stock, shares issued |
143
|
0
|
|
| Preferred stock, shares value |
$ 286,000
|
|
|
| X |
- References
+ Details
| Name: |
cpwr_ClosingStockPricePerShare |
| Namespace Prefix: |
cpwr_ |
| Data Type: |
num:perShareItemType |
| Balance Type: |
na |
| Period Type: |
instant |
|
| X |
- References
+ Details
| Name: |
cpwr_ConvertibleNotePayableAndAccruedInterestConvertedIntoCommonStock |
| Namespace Prefix: |
cpwr_ |
| Data Type: |
xbrli:monetaryItemType |
| Balance Type: |
credit |
| Period Type: |
duration |
|
| X |
- References
+ Details
| Name: |
cpwr_DebtConversionOriginalDebtsAmount1 |
| Namespace Prefix: |
cpwr_ |
| Data Type: |
xbrli:monetaryItemType |
| Balance Type: |
credit |
| Period Type: |
duration |
|
| X |
- References
+ Details
| Name: |
cpwr_InitialCommitmentSharesIssued |
| Namespace Prefix: |
cpwr_ |
| Data Type: |
xbrli:sharesItemType |
| Balance Type: |
na |
| Period Type: |
instant |
|
| X |
- References
+ Details
| Name: |
cpwr_SharesBorrowedFromCeo |
| Namespace Prefix: |
cpwr_ |
| Data Type: |
xbrli:sharesItemType |
| Balance Type: |
na |
| Period Type: |
duration |
|
| X |
- DefinitionThe number of shares issued in exchange for the original debt being converted in a noncash (or part noncash) transaction. "Part noncash" refers to that portion of the transaction not resulting in cash receipts or payments in the period. Reference 1: http://fasb.org/us-gaap/role/ref/legacyRef
-Name Accounting Standards Codification
-Topic 230
-SubTopic 10
-Section 50
-Paragraph 3
-Publisher FASB
-URI https://asc.fasb.org//1943274/2147482913/230-10-50-3
Reference 2: http://fasb.org/us-gaap/role/ref/legacyRef
-Name Accounting Standards Codification
-Topic 230
-SubTopic 10
-Section 50
-Paragraph 5
-Publisher FASB
-URI https://asc.fasb.org//1943274/2147482913/230-10-50-5
| Name: |
us-gaap_DebtConversionConvertedInstrumentSharesIssued1 |
| Namespace Prefix: |
us-gaap_ |
| Data Type: |
xbrli:sharesItemType |
| Balance Type: |
na |
| Period Type: |
duration |
|
| X |
- DefinitionIncrease for accrued, but unpaid interest on the debt instrument for the period. Reference 1: http://www.xbrl.org/2009/role/commonPracticeRef
-Topic 235
-SubTopic 10
-Name Accounting Standards Codification
-Section S99
-Paragraph 1
-Subparagraph (SX 210.4-08(f))
-Publisher FASB
-URI https://asc.fasb.org//1943274/2147480678/235-10-S99-1
| Name: |
us-gaap_DebtInstrumentIncreaseAccruedInterest |
| Namespace Prefix: |
us-gaap_ |
| Data Type: |
xbrli:monetaryItemType |
| Balance Type: |
credit |
| Period Type: |
duration |
|
| X |
- DefinitionThe increase (decrease) during the reporting period in other expenses incurred but not yet paid. Reference 1: http://fasb.org/us-gaap/role/ref/legacyRef
-Name Accounting Standards Codification
-Section 45
-Paragraph 28
-Subparagraph (a)
-SubTopic 10
-Topic 230
-Publisher FASB
-URI https://asc.fasb.org//1943274/2147482740/230-10-45-28
| Name: |
us-gaap_IncreaseDecreaseInOtherAccruedLiabilities |
| Namespace Prefix: |
us-gaap_ |
| Data Type: |
xbrli:monetaryItemType |
| Balance Type: |
debit |
| Period Type: |
duration |
|
| X |
- DefinitionFace amount or stated value per share of preferred stock nonredeemable or redeemable solely at the option of the issuer. Reference 1: http://www.xbrl.org/2003/role/disclosureRef
-Topic 505
-SubTopic 10
-Name Accounting Standards Codification
-Section 50
-Paragraph 13
-Subparagraph (a)
-Publisher FASB
-URI https://asc.fasb.org//1943274/2147481112/505-10-50-13
Reference 2: http://fasb.org/us-gaap/role/ref/legacyRef
-Topic 210
-SubTopic 10
-Name Accounting Standards Codification
-Section S99
-Paragraph 1
-Subparagraph (SX 210.5-02(28))
-Publisher FASB
-URI https://asc.fasb.org//1943274/2147480566/210-10-S99-1
| Name: |
us-gaap_PreferredStockParOrStatedValuePerShare |
| Namespace Prefix: |
us-gaap_ |
| Data Type: |
dtr-types:perShareItemType |
| Balance Type: |
na |
| Period Type: |
instant |
|
| X |
- DefinitionThe maximum number of nonredeemable preferred shares (or preferred stock redeemable solely at the option of the issuer) permitted to be issued by an entity's charter and bylaws. Reference 1: http://www.xbrl.org/2003/role/disclosureRef
-Topic 946
-SubTopic 210
-Name Accounting Standards Codification
-Section S99
-Paragraph 1
-Subparagraph (SX 210.6-04(16)(a))
-Publisher FASB
-URI https://asc.fasb.org//1943274/2147479617/946-210-S99-1
Reference 2: http://fasb.org/us-gaap/role/ref/legacyRef
-Topic 210
-SubTopic 10
-Name Accounting Standards Codification
-Section S99
-Paragraph 1
-Subparagraph (SX 210.5-02(28))
-Publisher FASB
-URI https://asc.fasb.org//1943274/2147480566/210-10-S99-1
| Name: |
us-gaap_PreferredStockSharesAuthorized |
| Namespace Prefix: |
us-gaap_ |
| Data Type: |
xbrli:sharesItemType |
| Balance Type: |
na |
| Period Type: |
instant |
|
| X |
- DefinitionTotal number of nonredeemable preferred shares (or preferred stock redeemable solely at the option of the issuer) issued to shareholders (includes related preferred shares that were issued, repurchased, and remain in the treasury). May be all or portion of the number of preferred shares authorized. Excludes preferred shares that are classified as debt. Reference 1: http://www.xbrl.org/2003/role/disclosureRef
-Topic 505
-SubTopic 10
-Name Accounting Standards Codification
-Section 50
-Paragraph 13
-Subparagraph (a)
-Publisher FASB
-URI https://asc.fasb.org//1943274/2147481112/505-10-50-13
Reference 2: http://fasb.org/us-gaap/role/ref/legacyRef
-Topic 210
-SubTopic 10
-Name Accounting Standards Codification
-Section S99
-Paragraph 1
-Subparagraph (SX 210.5-02(28))
-Publisher FASB
-URI https://asc.fasb.org//1943274/2147480566/210-10-S99-1
| Name: |
us-gaap_PreferredStockSharesIssued |
| Namespace Prefix: |
us-gaap_ |
| Data Type: |
xbrli:sharesItemType |
| Balance Type: |
na |
| Period Type: |
instant |
|
| X |
- DefinitionAggregate par or stated value of issued nonredeemable preferred stock (or preferred stock redeemable solely at the option of the issuer). This item includes treasury stock repurchased by the entity. Note: elements for number of nonredeemable preferred shares, par value and other disclosure concepts are in another section within stockholders' equity. Reference 1: http://www.xbrl.org/2003/role/exampleRef
-Topic 852
-SubTopic 10
-Name Accounting Standards Codification
-Section 55
-Paragraph 10
-Publisher FASB
-URI https://asc.fasb.org//1943274/2147481372/852-10-55-10
Reference 2: http://www.xbrl.org/2003/role/disclosureRef
-Topic 944
-SubTopic 210
-Name Accounting Standards Codification
-Section S99
-Paragraph 1
-Subparagraph (SX 210.7-03(a)(21))
-Publisher FASB
-URI https://asc.fasb.org//1943274/2147479440/944-210-S99-1
Reference 3: http://fasb.org/us-gaap/role/ref/legacyRef
-Topic 210
-SubTopic 10
-Name Accounting Standards Codification
-Section S99
-Paragraph 1
-Subparagraph (SX 210.5-02(28))
-Publisher FASB
-URI https://asc.fasb.org//1943274/2147480566/210-10-S99-1
| Name: |
us-gaap_PreferredStockValue |
| Namespace Prefix: |
us-gaap_ |
| Data Type: |
xbrli:monetaryItemType |
| Balance Type: |
credit |
| Period Type: |
instant |
|
| X |
- DefinitionNumber of new stock issued during the period. Reference 1: http://fasb.org/us-gaap/role/ref/legacyRef
-Name Accounting Standards Codification
-Section 50
-Paragraph 2
-SubTopic 10
-Topic 505
-Publisher FASB
-URI https://asc.fasb.org//1943274/2147481112/505-10-50-2
Reference 2: http://www.xbrl.org/2003/role/disclosureRef
-Topic 946
-SubTopic 505
-Name Accounting Standards Codification
-Section 50
-Paragraph 2
-Subparagraph (a)
-Publisher FASB
-URI https://asc.fasb.org//1943274/2147481004/946-505-50-2
Reference 3: http://www.xbrl.org/2003/role/disclosureRef
-Topic 946
-SubTopic 220
-Name Accounting Standards Codification
-Section S99
-Paragraph 3
-Subparagraph (SX 210.6-09(4)(b))
-Publisher FASB
-URI https://asc.fasb.org//1943274/2147483575/946-220-S99-3
Reference 4: http://www.xbrl.org/2003/role/disclosureRef
-Topic 946
-SubTopic 10
-Name Accounting Standards Codification
-Section S99
-Paragraph 3
-Subparagraph (SX 210.6-03(i)(1))
-Publisher FASB
-URI https://asc.fasb.org//1943274/2147479886/946-10-S99-3
Reference 5: http://fasb.org/us-gaap/role/ref/legacyRef
-Topic 210
-SubTopic 10
-Name Accounting Standards Codification
-Section S99
-Paragraph 1
-Subparagraph (SX 210.5-02(28))
-Publisher FASB
-URI https://asc.fasb.org//1943274/2147480566/210-10-S99-1
Reference 6: http://fasb.org/us-gaap/role/ref/legacyRef
-Topic 505
-SubTopic 10
-Name Accounting Standards Codification
-Section S99
-Paragraph 1
-Subparagraph (SX 210.3-04)
-Publisher FASB
-URI https://asc.fasb.org//1943274/2147480008/505-10-S99-1
Reference 7: http://fasb.org/us-gaap/role/ref/legacyRef
-Topic 210
-SubTopic 10
-Name Accounting Standards Codification
-Section S99
-Paragraph 1
-Subparagraph (SX 210.5-02(29))
-Publisher FASB
-URI https://asc.fasb.org//1943274/2147480566/210-10-S99-1
| Name: |
us-gaap_StockIssuedDuringPeriodSharesNewIssues |
| Namespace Prefix: |
us-gaap_ |
| Data Type: |
xbrli:sharesItemType |
| Balance Type: |
na |
| Period Type: |
duration |
|
| X |
- DefinitionEquity impact of the value of new stock issued during the period. Includes shares issued in an initial public offering or a secondary public offering. Reference 1: http://fasb.org/us-gaap/role/ref/legacyRef
-Name Accounting Standards Codification
-Section 50
-Paragraph 2
-SubTopic 10
-Topic 505
-Publisher FASB
-URI https://asc.fasb.org//1943274/2147481112/505-10-50-2
Reference 2: http://www.xbrl.org/2003/role/exampleRef
-Topic 946
-SubTopic 830
-Name Accounting Standards Codification
-Section 55
-Paragraph 11
-Publisher FASB
-URI https://asc.fasb.org//1943274/2147480167/946-830-55-11
Reference 3: http://www.xbrl.org/2003/role/disclosureRef
-Topic 946
-SubTopic 205
-Name Accounting Standards Codification
-Section 45
-Paragraph 4
-Subparagraph (a)
-Publisher FASB
-URI https://asc.fasb.org//1943274/2147480767/946-205-45-4
Reference 4: http://www.xbrl.org/2003/role/disclosureRef
-Topic 946
-SubTopic 505
-Name Accounting Standards Codification
-Section 50
-Paragraph 2
-Subparagraph (a)
-Publisher FASB
-URI https://asc.fasb.org//1943274/2147481004/946-505-50-2
Reference 5: http://www.xbrl.org/2003/role/disclosureRef
-Topic 946
-SubTopic 220
-Name Accounting Standards Codification
-Section S99
-Paragraph 3
-Subparagraph (SX 210.6-09(4)(b))
-Publisher FASB
-URI https://asc.fasb.org//1943274/2147483575/946-220-S99-3
Reference 6: http://fasb.org/us-gaap/role/ref/legacyRef
-Topic 210
-SubTopic 10
-Name Accounting Standards Codification
-Section S99
-Paragraph 1
-Subparagraph (SX 210.5-02(28))
-Publisher FASB
-URI https://asc.fasb.org//1943274/2147480566/210-10-S99-1
Reference 7: http://fasb.org/us-gaap/role/ref/legacyRef
-Topic 505
-SubTopic 10
-Name Accounting Standards Codification
-Section S99
-Paragraph 1
-Subparagraph (SX 210.3-04)
-Publisher FASB
-URI https://asc.fasb.org//1943274/2147480008/505-10-S99-1
Reference 8: http://fasb.org/us-gaap/role/ref/legacyRef
-Topic 210
-SubTopic 10
-Name Accounting Standards Codification
-Section S99
-Paragraph 1
-Subparagraph (SX 210.5-02(29))
-Publisher FASB
-URI https://asc.fasb.org//1943274/2147480566/210-10-S99-1
| Name: |
us-gaap_StockIssuedDuringPeriodValueNewIssues |
| Namespace Prefix: |
us-gaap_ |
| Data Type: |
xbrli:monetaryItemType |
| Balance Type: |
credit |
| Period Type: |
duration |
|
| X |
- Details
| Name: |
us-gaap_StatementEquityComponentsAxis=us-gaap_CommonStockMember |
| Namespace Prefix: |
|
| Data Type: |
na |
| Balance Type: |
|
| Period Type: |
|
|
| X |
- Details
| Name: |
us-gaap_StatementClassOfStockAxis=us-gaap_SeriesDPreferredStockMember |
| Namespace Prefix: |
|
| Data Type: |
na |
| Balance Type: |
|
| Period Type: |
|
|
| X |
- Details
| Name: |
us-gaap_StatementClassOfStockAxis=us-gaap_SeriesCPreferredStockMember |
| Namespace Prefix: |
|
| Data Type: |
na |
| Balance Type: |
|
| Period Type: |
|
|
| X |
- Details
| Name: |
us-gaap_StatementClassOfStockAxis=us-gaap_SeriesBPreferredStockMember |
| Namespace Prefix: |
|
| Data Type: |
na |
| Balance Type: |
|
| Period Type: |
|
|
| X |
- Details
| Name: |
us-gaap_StatementClassOfStockAxis=cpwr_CommonStocksTwoMember |
| Namespace Prefix: |
|
| Data Type: |
na |
| Balance Type: |
|
| Period Type: |
|
|
| X |
- Details
| Name: |
us-gaap_StatementClassOfStockAxis=cpwr_SeriesDPreferredStockOneMember |
| Namespace Prefix: |
|
| Data Type: |
na |
| Balance Type: |
|
| Period Type: |
|
|
| X |
- Details
| Name: |
us-gaap_StatementClassOfStockAxis=cpwr_SeriesDPreferredStockTwoMember |
| Namespace Prefix: |
|
| Data Type: |
na |
| Balance Type: |
|
| Period Type: |
|
|
v3.23.2
v3.23.2
INCOME TAX (Details 1) - USD ($)
|
Dec. 31, 2022 |
Dec. 31, 2021 |
| INCOME TAX |
|
|
| Impairment |
$ 2,358,860
|
$ 2,358,860
|
| Accrued Compensation |
1,517,774
|
1,335,457
|
| Operating loss carryforwards |
10,809,828
|
10,028,500
|
| Gross deferred tax assets |
14,686,462
|
13,722,817
|
| Valuation allowance |
$ (14,686,462)
|
$ (13,722,817)
|
| X |
- References
+ Details
| Name: |
cpwr_AccruedCompensation |
| Namespace Prefix: |
cpwr_ |
| Data Type: |
xbrli:monetaryItemType |
| Balance Type: |
credit |
| Period Type: |
instant |
|
| X |
- References
+ Details
| Name: |
cpwr_DeferredTaxAssetsImpairment |
| Namespace Prefix: |
cpwr_ |
| Data Type: |
xbrli:monetaryItemType |
| Balance Type: |
debit |
| Period Type: |
instant |
|
| X |
- DefinitionAmount before allocation of valuation allowances of deferred tax asset attributable to deductible temporary differences and carryforwards. Reference 1: http://www.xbrl.org/2003/role/disclosureRef
-Topic 740
-SubTopic 10
-Name Accounting Standards Codification
-Section 50
-Paragraph 2
-Subparagraph (b)
-Publisher FASB
-URI https://asc.fasb.org//1943274/2147482685/740-10-50-2
| Name: |
us-gaap_DeferredTaxAssetsGross |
| Namespace Prefix: |
us-gaap_ |
| Data Type: |
xbrli:monetaryItemType |
| Balance Type: |
debit |
| Period Type: |
instant |
|
| X |
- DefinitionAmount before allocation of valuation allowances of deferred tax asset attributable to deductible operating loss carryforwards. Reference 1: http://www.xbrl.org/2009/role/commonPracticeRef
-Topic 740
-SubTopic 10
-Name Accounting Standards Codification
-Section 50
-Paragraph 6
-Publisher FASB
-URI https://asc.fasb.org//1943274/2147482685/740-10-50-6
Reference 2: http://fasb.org/us-gaap/role/ref/legacyRef
-Name Accounting Standards Codification
-Topic 740
-SubTopic 10
-Section 50
-Paragraph 8
-Publisher FASB
-URI https://asc.fasb.org//1943274/2147482685/740-10-50-8
| Name: |
us-gaap_DeferredTaxAssetsOperatingLossCarryforwards |
| Namespace Prefix: |
us-gaap_ |
| Data Type: |
xbrli:monetaryItemType |
| Balance Type: |
debit |
| Period Type: |
instant |
|
| X |
- DefinitionAmount of deferred tax assets for which it is more likely than not that a tax benefit will not be realized. Reference 1: http://www.xbrl.org/2003/role/disclosureRef
-Topic 740
-SubTopic 10
-Name Accounting Standards Codification
-Section 50
-Paragraph 2
-Subparagraph (c)
-Publisher FASB
-URI https://asc.fasb.org//1943274/2147482685/740-10-50-2
| Name: |
us-gaap_DeferredTaxAssetsValuationAllowance |
| Namespace Prefix: |
us-gaap_ |
| Data Type: |
xbrli:monetaryItemType |
| Balance Type: |
credit |
| Period Type: |
instant |
|
v3.23.2
| X |
- References
+ Details
| Name: |
cpwr_ChangeInValuationAllowances |
| Namespace Prefix: |
cpwr_ |
| Data Type: |
xbrli:monetaryItemType |
| Balance Type: |
credit |
| Period Type: |
duration |
|
| X |
- DefinitionAmount of operating loss carryforward, before tax effects, available to reduce future taxable income under enacted tax laws. Reference 1: http://fasb.org/us-gaap/role/ref/legacyRef
-Name Accounting Standards Codification
-Topic 740
-SubTopic 10
-Section 50
-Paragraph 3
-Subparagraph (a)
-Publisher FASB
-URI https://asc.fasb.org//1943274/2147482685/740-10-50-3
| Name: |
us-gaap_OperatingLossCarryforwards |
| Namespace Prefix: |
us-gaap_ |
| Data Type: |
xbrli:monetaryItemType |
| Balance Type: |
debit |
| Period Type: |
instant |
|
v3.23.2
Commitments and Contingencies (Details Narrative) - USD ($)
|
|
|
1 Months Ended |
2 Months Ended |
12 Months Ended |
Aug. 15, 2019 |
Aug. 08, 2018 |
May 28, 2019 |
Aug. 22, 2018 |
Jun. 26, 2017 |
Jul. 19, 2018 |
Dec. 31, 2022 |
| Gross proceeds from an equity placement |
|
|
|
|
8.00%
|
|
|
| Gross proceeds from an debt placement |
|
|
|
|
3.00%
|
|
|
| Warrants with an aggregate exercise price equal |
|
|
|
|
3.00%
|
|
|
| Issued warrants to purchase shares of common stock for L2 Capital equity |
|
|
|
|
|
|
56,073
|
| Warrants to purchase shares of common stock for L2 Capital debt |
|
|
|
|
|
|
69,000
|
| Outstanding of warrants to purchase shares of common stock |
|
|
|
|
|
|
125,073
|
| Warrants fair value of based on the Black-Scholes option-pricing model |
|
|
|
|
|
|
$ 219
|
| Accrued Interest |
|
|
|
|
|
|
$ 51,842
|
| Warrants exercise prices per share maximum |
|
|
|
|
|
|
$ 0.25
|
| Repayment of settlement |
|
|
|
|
|
|
$ 260,000
|
| Outstanding balance of settlement |
|
|
|
|
|
|
115,000
|
| Settlement agreement descriptions |
In our ongoing efforts to collect the $25,500,000 judgment obtained, a third party has intervened in our case in the Central District of California (case number: 2:19-cv-05299-VAP-JPR), asserting that it is the rightful
|
|
|
|
|
|
|
| Engineering service paid |
|
|
|
$ 500,000
|
|
|
|
| Accrued legal settlement |
|
$ 8,000,000
|
|
|
|
|
$ 375,000
|
| Settlement interest rate |
|
|
|
|
|
|
18.00%
|
| Total payment received from defendant |
|
|
|
|
|
$ 100,000
|
|
| Regular monthly payments to Fugro of per month, until the balance owed has been paid |
|
|
|
|
|
|
$ 10,000
|
| Trade Base Sales, Inc [Member] |
|
|
|
|
|
|
|
| Settlement amount, total |
|
|
$ 25,500,000
|
|
|
|
|
| Brett M Regal [Member] |
|
|
|
|
|
|
|
| Settlement amount, total |
|
|
$ 25,500,000
|
|
|
|
|
| X |
- References
+ Details
| Name: |
cpwr_EngineeringServicePaid |
| Namespace Prefix: |
cpwr_ |
| Data Type: |
xbrli:monetaryItemType |
| Balance Type: |
credit |
| Period Type: |
duration |
|
| X |
- References
+ Details
| Name: |
cpwr_GrossProceedsFromAnDebtPlacement |
| Namespace Prefix: |
cpwr_ |
| Data Type: |
num:percentItemType |
| Balance Type: |
na |
| Period Type: |
duration |
|
| X |
- References
+ Details
| Name: |
cpwr_GrossProceedsFromAnEquityPlacement |
| Namespace Prefix: |
cpwr_ |
| Data Type: |
num:percentItemType |
| Balance Type: |
na |
| Period Type: |
duration |
|
| X |
- References
+ Details
| Name: |
cpwr_IssuedWarrantsToPurchaseSharesOfCommonStockForL2CapitalEquity |
| Namespace Prefix: |
cpwr_ |
| Data Type: |
xbrli:sharesItemType |
| Balance Type: |
na |
| Period Type: |
instant |
|
| X |
- References
+ Details
| Name: |
cpwr_OutstandingBalanceOfSettlement |
| Namespace Prefix: |
cpwr_ |
| Data Type: |
xbrli:monetaryItemType |
| Balance Type: |
credit |
| Period Type: |
duration |
|
| X |
- References
+ Details
| Name: |
cpwr_OutstandingOfWarrantsToPurchaseSharesOfCommonStock |
| Namespace Prefix: |
cpwr_ |
| Data Type: |
xbrli:sharesItemType |
| Balance Type: |
na |
| Period Type: |
instant |
|
| X |
- References
+ Details
| Name: |
cpwr_RegularMonthlyPaymentsToFugroOfPerMonthUntilTheBalanceOwedHasBeenPaid |
| Namespace Prefix: |
cpwr_ |
| Data Type: |
xbrli:monetaryItemType |
| Balance Type: |
debit |
| Period Type: |
duration |
|
| X |
- References
+ Details
| Name: |
cpwr_RepaymentOfSettlement |
| Namespace Prefix: |
cpwr_ |
| Data Type: |
xbrli:monetaryItemType |
| Balance Type: |
debit |
| Period Type: |
duration |
|
| X |
- References
+ Details
| Name: |
cpwr_SettlementAgreementDescriptions |
| Namespace Prefix: |
cpwr_ |
| Data Type: |
xbrli:stringItemType |
| Balance Type: |
na |
| Period Type: |
duration |
|
| X |
- References
+ Details
| Name: |
cpwr_SettlementAmountTotal |
| Namespace Prefix: |
cpwr_ |
| Data Type: |
xbrli:monetaryItemType |
| Balance Type: |
debit |
| Period Type: |
duration |
|
| X |
- References
+ Details
| Name: |
cpwr_SettlementInterestRate |
| Namespace Prefix: |
cpwr_ |
| Data Type: |
num:percentItemType |
| Balance Type: |
na |
| Period Type: |
instant |
|
| X |
- References
+ Details
| Name: |
cpwr_TotalPaymentReceivedFromDefendant |
| Namespace Prefix: |
cpwr_ |
| Data Type: |
xbrli:monetaryItemType |
| Balance Type: |
debit |
| Period Type: |
duration |
|
| X |
- References
+ Details
| Name: |
cpwr_WarrantsExercisePricesPerShareMaximum |
| Namespace Prefix: |
cpwr_ |
| Data Type: |
num:perShareItemType |
| Balance Type: |
na |
| Period Type: |
duration |
|
| X |
- References
+ Details
| Name: |
cpwr_WarrantsFairValueOfBasedOnTheBlackScholesOptionPricingModel |
| Namespace Prefix: |
cpwr_ |
| Data Type: |
xbrli:monetaryItemType |
| Balance Type: |
credit |
| Period Type: |
duration |
|
| X |
- References
+ Details
| Name: |
cpwr_WarrantsToPurchaseSharesOfCommonStockForL2CapitalDebt |
| Namespace Prefix: |
cpwr_ |
| Data Type: |
xbrli:sharesItemType |
| Balance Type: |
na |
| Period Type: |
instant |
|
| X |
- References
+ Details
| Name: |
cpwr_WarrantsWithAnAggregateExercisePriceEqual |
| Namespace Prefix: |
cpwr_ |
| Data Type: |
num:percentItemType |
| Balance Type: |
na |
| Period Type: |
duration |
|
| X |
- DefinitionAmount of accrued but unpaid interest on deposit liabilities. Reference 1: http://fasb.org/us-gaap/role/ref/legacyRef
-Name Accounting Standards Codification
-Topic 942
-SubTopic 210
-Section S99
-Paragraph 1
-Subparagraph (SX 210.9-03.15(5))
-Publisher FASB
-URI https://asc.fasb.org//1943274/2147479853/942-210-S99-1
| Name: |
us-gaap_DepositLiabilitiesAccruedInterest |
| Namespace Prefix: |
us-gaap_ |
| Data Type: |
xbrli:monetaryItemType |
| Balance Type: |
credit |
| Period Type: |
instant |
|
| X |
- DefinitionAmount awarded from other party in judgment or settlement of litigation.
| Name: |
us-gaap_LitigationSettlementAmountAwardedFromOtherParty |
| Namespace Prefix: |
us-gaap_ |
| Data Type: |
xbrli:monetaryItemType |
| Balance Type: |
debit |
| Period Type: |
duration |
|
| X |
- Details
| Name: |
us-gaap_PlanNameAxis=cpwr_TradeBaseSalesIncMember |
| Namespace Prefix: |
|
| Data Type: |
na |
| Balance Type: |
|
| Period Type: |
|
|
v3.23.2
| X |
- References
+ Details
| Name: |
cpwr_ConsultingAgreementToPayIssuingSharesOfCommonStock |
| Namespace Prefix: |
cpwr_ |
| Data Type: |
xbrli:monetaryItemType |
| Balance Type: |
debit |
| Period Type: |
duration |
|
| X |
- References
+ Details
| Name: |
cpwr_ShareToBeIssued |
| Namespace Prefix: |
cpwr_ |
| Data Type: |
xbrli:sharesItemType |
| Balance Type: |
na |
| Period Type: |
duration |
|
| X |
- DefinitionValue of stock issued in lieu of cash for services contributed to the entity. Value of the stock issued includes, but is not limited to, services contributed by vendors and founders.
| Name: |
us-gaap_StockIssuedDuringPeriodValueIssuedForServices |
| Namespace Prefix: |
us-gaap_ |
| Data Type: |
xbrli:monetaryItemType |
| Balance Type: |
credit |
| Period Type: |
duration |
|
| X |
- Details
| Name: |
us-gaap_PlanNameAxis=cpwr_ConsultingAgreementMember |
| Namespace Prefix: |
|
| Data Type: |
na |
| Balance Type: |
|
| Period Type: |
|
|
v3.23.2
EMPLOYMENT AGREEMENTS (Details Narrative) - One January Twenty Eleven [Member] - Employment Agreement [Member] - Chief Executive Officer [Member]
|
12 Months Ended |
|
Dec. 31, 2022
USD ($)
|
|---|
| Salary received |
$ 350,000
|
| Car allowance |
$ 12,000
|
| Employment agreement descriptions |
The agreement also provides for bonuses equal to one times his annual salary plus 500,000 shares of common stock for each additional project that generates $25 million or more in revenue to us. Our chief executive officer is entitled to receive severance pay in the lesser amount of three years’ salary or 100% of the remaining salary if the remaining term is less than three years. On September 15, 2017, an addendum was added to the employment agreement stating that effective June 30, 2017, his salary will be increased to $388,220 per year; that he will receive interest at a rate of 8% on his accrued unpaid wages; and that the term of employment agreement is extended for an additional five years. Effective June 9, 2022, we entered into a second addendum to the employment contract. Among other provisions, the addendum extends the employment agreement through December 31, 2025 and increases the annual salary to $454,738 from $388,220
|
| X |
- References
+ Details
| Name: |
cpwr_CarAllowance |
| Namespace Prefix: |
cpwr_ |
| Data Type: |
xbrli:monetaryItemType |
| Balance Type: |
credit |
| Period Type: |
duration |
|
| X |
- References
+ Details
| Name: |
cpwr_EmploymentAgreementDescriptions |
| Namespace Prefix: |
cpwr_ |
| Data Type: |
xbrli:stringItemType |
| Balance Type: |
na |
| Period Type: |
duration |
|
| X |
- DefinitionAmount of expense for salary and wage arising from service rendered by nonofficer and officer employees. Excludes allocated cost, labor-related nonsalary expense, and direct and overhead labor cost included in cost of good and service sold.
| Name: |
us-gaap_SalariesWagesAndOfficersCompensation |
| Namespace Prefix: |
us-gaap_ |
| Data Type: |
xbrli:monetaryItemType |
| Balance Type: |
debit |
| Period Type: |
duration |
|
| X |
- Details
| Name: |
us-gaap_AwardDateAxis=cpwr_OneJanuaryTwentyElevenMember |
| Namespace Prefix: |
|
| Data Type: |
na |
| Balance Type: |
|
| Period Type: |
|
|
| X |
- Details
| Name: |
us-gaap_PlanNameAxis=cpwr_EmploymentAgreementMember |
| Namespace Prefix: |
|
| Data Type: |
na |
| Balance Type: |
|
| Period Type: |
|
|
v3.23.2
RELATED PARTY TRANSACTIONS (Details Narrative) - USD ($)
|
12 Months Ended |
Dec. 31, 2022 |
Dec. 31, 2021 |
| Outstanding rent |
$ 74,070
|
|
| Company Controlled by the CEO |
|
|
| Rent Expense |
120,000
|
$ 120,000
|
| Outstanding rent |
70,000
|
|
| Payment of reimbursement amount |
114,814
|
105,201
|
| Related Party 1 |
|
|
| Accrued Interest |
1,656,757
|
$ 1,435,120
|
| Common Stock Two [Member] |
|
|
| Amount Converted Into Shares |
$ 15,000
|
|
| Borrowed shares from CEO |
847,262
|
|
| Coversion Of Shares |
847,262
|
|
| Accrued Interest |
$ 1,946
|
|
| Accrued liability |
11,014
|
|
| Series D Preferred Stock Member |
|
|
| Amount Converted Into Shares |
$ 215,000
|
|
| Coversion Of Shares |
200,000
|
|
| Accrued Interest |
$ 66,126
|
|
| Series D Preferred Stock Member | CEO |
|
|
| Accrued Interest |
2,043
|
|
| Working capital |
$ 58,000
|
|
| Preferred shares issued for conversion |
6
|
|
| Amount of notes converted |
$ 10,000
|
|
| Proceeds from Stock |
$ 10,000
|
|
| X |
- References
+ Details
| Name: |
cpwr_DebtConversionOriginalDebtsAmount1 |
| Namespace Prefix: |
cpwr_ |
| Data Type: |
xbrli:monetaryItemType |
| Balance Type: |
credit |
| Period Type: |
duration |
|
| X |
- References
+ Details
| Name: |
cpwr_LeasesAndRentalExpense |
| Namespace Prefix: |
cpwr_ |
| Data Type: |
xbrli:monetaryItemType |
| Balance Type: |
debit |
| Period Type: |
duration |
|
| X |
- References
+ Details
| Name: |
cpwr_PaymentOfReimbursementAmount |
| Namespace Prefix: |
cpwr_ |
| Data Type: |
xbrli:monetaryItemType |
| Balance Type: |
debit |
| Period Type: |
duration |
|
| X |
- References
+ Details
| Name: |
cpwr_PreferredSharesIssuedForConversion |
| Namespace Prefix: |
cpwr_ |
| Data Type: |
xbrli:sharesItemType |
| Balance Type: |
na |
| Period Type: |
duration |
|
| X |
- References
+ Details
| Name: |
cpwr_ProceedsFromStock |
| Namespace Prefix: |
cpwr_ |
| Data Type: |
xbrli:monetaryItemType |
| Balance Type: |
debit |
| Period Type: |
duration |
|
| X |
- References
+ Details
| Name: |
cpwr_SharesBorrowedFromCeo |
| Namespace Prefix: |
cpwr_ |
| Data Type: |
xbrli:sharesItemType |
| Balance Type: |
na |
| Period Type: |
duration |
|
| X |
- References
+ Details
| Name: |
cpwr_WorkingCapitals |
| Namespace Prefix: |
cpwr_ |
| Data Type: |
xbrli:monetaryItemType |
| Balance Type: |
debit |
| Period Type: |
instant |
|
| X |
- DefinitionThe value of the financial instrument(s) that the original debt is being converted into in a noncash (or part noncash) transaction. "Part noncash" refers to that portion of the transaction not resulting in cash receipts or cash payments in the period. Reference 1: http://fasb.org/us-gaap/role/ref/legacyRef
-Name Accounting Standards Codification
-Topic 230
-SubTopic 10
-Section 50
-Paragraph 3
-Publisher FASB
-URI https://asc.fasb.org//1943274/2147482913/230-10-50-3
Reference 2: http://fasb.org/us-gaap/role/ref/legacyRef
-Name Accounting Standards Codification
-Topic 230
-SubTopic 10
-Section 50
-Paragraph 5
-Publisher FASB
-URI https://asc.fasb.org//1943274/2147482913/230-10-50-5
| Name: |
us-gaap_DebtConversionConvertedInstrumentAmount1 |
| Namespace Prefix: |
us-gaap_ |
| Data Type: |
xbrli:monetaryItemType |
| Balance Type: |
credit |
| Period Type: |
duration |
|
| X |
- DefinitionThe number of shares issued in exchange for the original debt being converted in a noncash (or part noncash) transaction. "Part noncash" refers to that portion of the transaction not resulting in cash receipts or payments in the period. Reference 1: http://fasb.org/us-gaap/role/ref/legacyRef
-Name Accounting Standards Codification
-Topic 230
-SubTopic 10
-Section 50
-Paragraph 3
-Publisher FASB
-URI https://asc.fasb.org//1943274/2147482913/230-10-50-3
Reference 2: http://fasb.org/us-gaap/role/ref/legacyRef
-Name Accounting Standards Codification
-Topic 230
-SubTopic 10
-Section 50
-Paragraph 5
-Publisher FASB
-URI https://asc.fasb.org//1943274/2147482913/230-10-50-5
| Name: |
us-gaap_DebtConversionConvertedInstrumentSharesIssued1 |
| Namespace Prefix: |
us-gaap_ |
| Data Type: |
xbrli:sharesItemType |
| Balance Type: |
na |
| Period Type: |
duration |
|
| X |
- DefinitionIncrease for accrued, but unpaid interest on the debt instrument for the period. Reference 1: http://www.xbrl.org/2009/role/commonPracticeRef
-Topic 235
-SubTopic 10
-Name Accounting Standards Codification
-Section S99
-Paragraph 1
-Subparagraph (SX 210.4-08(f))
-Publisher FASB
-URI https://asc.fasb.org//1943274/2147480678/235-10-S99-1
| Name: |
us-gaap_DebtInstrumentIncreaseAccruedInterest |
| Namespace Prefix: |
us-gaap_ |
| Data Type: |
xbrli:monetaryItemType |
| Balance Type: |
credit |
| Period Type: |
duration |
|
| X |
- DefinitionThe increase (decrease) during the reporting period in other expenses incurred but not yet paid. Reference 1: http://fasb.org/us-gaap/role/ref/legacyRef
-Name Accounting Standards Codification
-Section 45
-Paragraph 28
-Subparagraph (a)
-SubTopic 10
-Topic 230
-Publisher FASB
-URI https://asc.fasb.org//1943274/2147482740/230-10-45-28
| Name: |
us-gaap_IncreaseDecreaseInOtherAccruedLiabilities |
| Namespace Prefix: |
us-gaap_ |
| Data Type: |
xbrli:monetaryItemType |
| Balance Type: |
debit |
| Period Type: |
duration |
|
| X |
- DefinitionCarrying value as of the balance sheet date of [accrued] interest payable on all forms of debt, including trade payables, that has been incurred and is unpaid. Used to reflect the current portion of the liabilities (due within one year or within the normal operating cycle if longer). Reference 1: http://fasb.org/us-gaap/role/ref/legacyRef
-Name Accounting Standards Codification
-Topic 210
-SubTopic 10
-Section S99
-Paragraph 1
-Subparagraph (SX 210.5-02.20)
-Publisher FASB
-URI https://asc.fasb.org//1943274/2147480566/210-10-S99-1
| Name: |
us-gaap_InterestPayableCurrent |
| Namespace Prefix: |
us-gaap_ |
| Data Type: |
xbrli:monetaryItemType |
| Balance Type: |
credit |
| Period Type: |
instant |
|
| X |
- DefinitionFor the form of debt having an initial term of less than one year or less than the normal operating cycle, if longer, average borrowings during the period. Reference 1: http://www.xbrl.org/2003/role/disclosureRef
-Topic 946
-SubTopic 220
-Name Accounting Standards Codification
-Section S99
-Paragraph 1
-Subparagraph (SX 210.6-07(3))
-Publisher FASB
-URI https://asc.fasb.org//1943274/2147483575/946-220-S99-1
Reference 2: http://www.xbrl.org/2003/role/disclosureRef
-Name Regulation S-K (SK)
-Number 229
-Section 1402
-Paragraph (a)
-Publisher SEC
Reference 3: http://www.xbrl.org/2003/role/disclosureRef
-Name Regulation S-K (SK)
-Number 229
-Section 1402
-Paragraph (b)
-Subparagraph (1)
-Publisher SEC
| Name: |
us-gaap_ShorttermDebtAverageOutstandingAmount |
| Namespace Prefix: |
us-gaap_ |
| Data Type: |
xbrli:monetaryItemType |
| Balance Type: |
credit |
| Period Type: |
duration |
|
| X |
- Details
| Name: |
us-gaap_StatementClassOfStockAxis=cpwr_CommonStocksTwoMember |
| Namespace Prefix: |
|
| Data Type: |
na |
| Balance Type: |
|
| Period Type: |
|
|
| X |
- Details
| Name: |
us-gaap_StatementClassOfStockAxis=us-gaap_SeriesDPreferredStockMember |
| Namespace Prefix: |
|
| Data Type: |
na |
| Balance Type: |
|
| Period Type: |
|
|
v3.23.2
| X |
- References
+ Details
| Name: |
cpwr_DebtConversionOriginalDebtsAmount1 |
| Namespace Prefix: |
cpwr_ |
| Data Type: |
xbrli:monetaryItemType |
| Balance Type: |
credit |
| Period Type: |
duration |
|
| X |
- DefinitionIncrease for accrued, but unpaid interest on the debt instrument for the period. Reference 1: http://www.xbrl.org/2009/role/commonPracticeRef
-Topic 235
-SubTopic 10
-Name Accounting Standards Codification
-Section S99
-Paragraph 1
-Subparagraph (SX 210.4-08(f))
-Publisher FASB
-URI https://asc.fasb.org//1943274/2147480678/235-10-S99-1
| Name: |
us-gaap_DebtInstrumentIncreaseAccruedInterest |
| Namespace Prefix: |
us-gaap_ |
| Data Type: |
xbrli:monetaryItemType |
| Balance Type: |
credit |
| Period Type: |
duration |
|
| X |
- DefinitionCash received from principal payments made on loans related to operating activities. Reference 1: http://fasb.org/us-gaap/role/ref/legacyRef
-Name Accounting Standards Codification
-Topic 230
-SubTopic 10
-Section 45
-Paragraph 25
-Subparagraph (c)
-Publisher FASB
-URI https://asc.fasb.org//1943274/2147482740/230-10-45-25
| Name: |
us-gaap_ProceedsFromLoans |
| Namespace Prefix: |
us-gaap_ |
| Data Type: |
xbrli:monetaryItemType |
| Balance Type: |
debit |
| Period Type: |
duration |
|
| X |
- DefinitionThe number of shares issued or sold by the subsidiary or equity method investee per stock transaction.
| Name: |
us-gaap_SaleOfStockNumberOfSharesIssuedInTransaction |
| Namespace Prefix: |
us-gaap_ |
| Data Type: |
xbrli:sharesItemType |
| Balance Type: |
na |
| Period Type: |
duration |
|
| X |
- Details
| Name: |
us-gaap_StatementClassOfStockAxis=cpwr_SeriesDPreferredStockFiveMember |
| Namespace Prefix: |
|
| Data Type: |
na |
| Balance Type: |
|
| Period Type: |
|
|
| X |
- Details
| Name: |
us-gaap_StatementClassOfStockAxis=cpwr_SeriesDPreferredStockFourMember |
| Namespace Prefix: |
|
| Data Type: |
na |
| Balance Type: |
|
| Period Type: |
|
|
| X |
- Details
| Name: |
us-gaap_StatementClassOfStockAxis=cpwr_SeriesDPreferredStockThreeMember |
| Namespace Prefix: |
|
| Data Type: |
na |
| Balance Type: |
|
| Period Type: |
|
|
Ocean Thermal Energy (PK) (USOTC:CPWR)
Historical Stock Chart
From Mar 2024 to Apr 2024
 Charts.")
Ocean Thermal Energy (PK) (USOTC:CPWR)
Historical Stock Chart
From Apr 2023 to Apr 2024
 Charts.")