UNITED STATES
SECURITIES AND EXCHANGE COMMISSION
Washington, D.C. 20549
FORM 6-K
REPORT OF FOREIGN PRIVATE ISSUER
PURSUANT TO RULE 13a-16 OR 15d-16
UNDER THE SECURITIES EXCHANGE ACT of 1934
August 16, 2023
Pan American
Silver Corp.
(Exact name of registrant as specified in its charter)
1500-625 HOWE STREET
VANCOUVER BC CANADA V6C 2T6
(Address of principal executive offices)
001-41683
(Commission File Number)
Indicate by check mark whether the registrant files or will file annual
reports under cover Form 20-F or Form 40-F.
Indicate by check mark if the registrant is submitting the Form 6-K
in paper as permitted by Regulation S-T Rule 101(b)(1). ¨
Indicate by check mark if the registrant is submitting the Form 6-K
in paper as permitted by Regulation S-T Rule 101(b)(7): ¨
EXHIBIT LIST
Cautionary Note to U.S.
Investors Concerning Estimates of
Measured, Indicated and Inferred Resources
The Technical Report for the El Peñon Gold-Silver
Mine, Antofagasta Region, Chile, with an effective date of December 31, 2020, included as Exhibit 99.1 hereto (the “Technical
Report”), has been prepared and disclosed in accordance with Canadian National Instrument 43-101 — Standards of Disclosure
for Mineral Projects (“NI 43-101”) and the Canadian Institute of Mining, Metallurgy and Petroleum classification system.
NI 43-101 is a rule developed by the Canadian Securities Administrators that establishes standards for all public disclosure an issuer
makes of scientific and technical information concerning mineral projects.
Canadian public disclosure standards, including
NI 43-101, differ significantly from the requirements of the United States Securities and Exchange Commission (the “SEC”),
and mineral reserve and mineral resource information included in the Technical Report may not be comparable to similar information disclosed
by U.S. companies. In particular, and without limiting the generality of the foregoing, the Technical Report uses the terms “measured
mineral resources,” “indicated mineral resources” and “inferred mineral resources” as defined under Canadian
regulations. The requirements of NI 43-101 for the identification of “mineral reserves” are also not the same as those of
the SEC, and reserves reported by the Registrant in compliance with NI 43-101 may not qualify as “reserves” under SEC standards.
While the SEC has adopted amendments to its disclosure rules to modernize the mineral property disclosure requirements for issuers
whose securities are registered with the SEC under the U.S. Securities Exchange Act of 1934, as amended, including amendments to certain
definitions to be substantially similar to the corresponding standards under NI 43-101, there are still differences in these standards
and definitions. U.S. investors are cautioned not to assume that any part of a “measured mineral resource” or “indicated
mineral resource” will ever be converted into a “mineral reserve”. U.S. investors should also understand that “inferred
mineral resources” have a great amount of uncertainty as to their existence and as to their economic and legal feasibility. It cannot
be assumed that all or any part of “inferred mineral resources” exist, are economically or legally mineable or will ever be
upgraded to a higher category. Under Canadian rules, estimated “inferred mineral resources” may not form the basis of feasibility
or pre-feasibility studies except in rare cases. In addition, disclosure of “contained ounces” in a mineral resource is permitted
disclosure under Canadian regulations. However, the SEC normally only permits issuers to report mineralization that does not constitute
“reserves” by SEC standards as in place tonnage and grade, without reference to unit measures. Accordingly, information concerning
mineral deposits set forth in the Technical Report may not be comparable with information made public by companies that report in accordance
with U.S. standards.
Signatures
Pursuant to the requirements of the Securities Exchange Act of 1934,
the registrant has duly caused this report to be signed on its behalf by the undersigned, thereunto duly authorized.
| |
Pan American Silver Corp. |
| |
(Registrant) |
| |
|
|
| Date: August 16, 2023 |
By: |
/s/ “Delaney Fisher” |
| |
|
Delaney Fisher |
| |
|
SVP Associate General Counsel & Corporate Secretary |
Exhibit 99.1
| |

|
| |
NI
43-101 TECHNICAL REPORT
El
Peñón gold-silver MINE
Antofagasta
Region, Chile
|
 |
| |
Qualified Persons:
Sergio Castro, Registered
Member CMC
Marco Velásquez Corrales, Registered
Member CMC
Henry Marsden, P.Geo.
Carlos Iturralde, P.Eng.
|
|
Royal Bank Plaza, North Tower
200 Bay Street, Suite 2200
Toronto, Ontario M5J 2J3
|
Effective Date: December
31, 2020
Signature Date: March 25,
2021
|
 |
|
|
|
Yamana Gold Inc.
Royal Bank Plaza, North Tower
200 Bay Street, Suite 2200
Toronto, ON, Canada
M5J 2J3 |
NI
43-101 TECHNICAL REPORT
El
Peñón gold-silver MINE
Antofagasta
Region, Chile
|
|
| |
|
|
|
|
| Effective Date: |
December 31, 2020 |
|
|
|
| Signature Date: |
March 25, 2021 |
|
|
|
| |
|
|
|
|
| Authors: |
[Signature] |
|
[Signature] |
| |
Sergio Castro
Registered Member CMC
Technical Services Manager, El Peñón
Yamana Gold Inc. |
|
Marco Velásquez Corrales,
Registered Member CMC
Chief Resource Geologist, El Peñón
Yamana Gold Inc. |
| |
|
|
|
| |
[Signature] |
|
[Signature] |
|
Henry Marsden, P.Geo.
Senior Vice President, Exploration
Yamana Gold Inc. |
|
Carlos Iturralde, P.Eng.
Director, Tailings, Health, Safety & Sustainable Development
Yamana Gold Inc. |
| |
|
|
|
| Reviewer |
[Signature] |
|
|
| |
Sébastien Bernier, P.Geo.
Senior Director, Geology & Mineral Resources,
Yamana Gold Inc. |
|
|
| |
|
|
|
|
|
|
|
|
|
|

Technical
Report El Peñón Mine, Chile
TABLE OF CONTENTS
| |
|
|
|
|
|
|
| Signature
Page |
|
I |
| |
|
|
| TABLE OF CONTENTS |
|
II |
| |
|
|
| Cautionary
Note Regarding Forward-Looking Statements |
|
VIII |
| |
|
|
| List
of Abbreviations |
|
X |
| |
|
|
| 1 |
|
Summary |
|
1 |
| |
|
|
|
|
| |
1.1 |
|
Property
Description |
|
1 |
| |
1.2 |
|
Geology
and Mineralization |
|
2 |
| |
1.3 |
|
Exploration
Status |
|
2 |
| |
1.4 |
|
Mineral
Resource and Mineral Reserve Estimates |
|
3 |
| |
1.5 |
|
Mining
and Processing Methods |
|
6 |
| |
1.6 |
|
Environmental
Studies, Permitting, and Social or Community Impact |
|
7 |
| |
1.7 |
|
Conclusions
and Recommendations |
|
8 |
| |
|
|
|
|
|
| 2 |
|
Introduction |
|
11 |
| |
|
|
|
|
| |
2.1 |
|
Sources
of Information |
|
12 |
| |
|
|
|
|
|
| 3 |
|
Reliance
on Other Experts |
|
13 |
| |
|
|
|
|
| 4 |
|
Property
Description and Location |
|
14 |
| |
|
|
|
|
| |
4.1 |
|
Mineral
and Surface Tenure |
|
15 |
| |
4.2 |
|
Underlying
Agreements |
|
23 |
| |
4.3 |
|
Permits
and Authorizations |
|
23 |
| |
4.4 |
|
Environmental
Considerations |
|
23 |
| |
|
|
|
|
|
| 5 |
|
Accessibility,
Climate, Local Resources, Infrastructure, and Physiography |
|
24 |
| |
|
|
|
|
| |
5.1 |
|
Accessibility |
|
24 |
| |
5.2 |
|
Climate |
|
24 |
| |
5.3 |
|
Local
Resources |
|
24 |
| |
5.4 |
|
Infrastructure |
|
24 |
| |
5.5 |
|
Physiography |
|
25 |
| |
|
|
|
|
|
| 6 |
|
History |
|
26 |
| |
|
|
|
|
| |
6.1 |
|
Historical
Mineral Resource and Mineral Reserve Estimates |
|
26 |
| |
6.2 |
|
Past Production |
|
27 |
| |
|
|
|
|
|
| 7 |
|
Geological
Setting and Mineralization |
|
28 |
| |
|
|
|
|
| |
7.1 |
|
Regional
Geology |
|
28 |
| |
7.2 |
|
Local
Geology |
|
29 |
| |
7.3 |
|
Property
Geology |
|
32 |
| Signature Date: March 25, 2021 |
ii |
Technical
Report El Peñón Mine, Chile
| |
|
7.3.1 |
|
Structure |
|
32 |
| |
7.4 |
|
Mineralization |
34 |
| |
|
|
|
| 8 |
|
Deposit
Types |
|
36 |
| |
|
|
|
|
| 9 |
|
Exploration |
|
37 |
| |
|
|
|
|
| |
9.1 |
|
Exploration
Potential |
|
37 |
| |
|
|
|
|
|
| 10 |
|
Drilling |
|
39 |
| |
|
|
|
|
| 11 |
|
Sample
Preparation, Analyses, and Security |
|
43 |
| |
|
|
|
|
| |
11.1 |
|
Sample
Preparation and Analysis |
|
43 |
| |
|
11.1.1 |
|
Sampling of Drill Core |
|
43 |
| |
|
11.1.2 |
|
Underground Channel Sampling |
|
44 |
| |
|
11.1.3 |
|
Preparation and Analytical Procedures |
|
45 |
| |
11.2 |
|
Quality
Assurance/ Quality Control |
|
48 |
| |
|
11.2.1 |
|
Certified Reference Materials |
|
50 |
| |
|
11.2.2 |
|
Blank Samples |
|
51 |
| |
|
11.2.3 |
|
Umpire Laboratory Check Assays |
|
54 |
| |
11.3 |
|
Sample
Security |
|
55 |
| |
|
|
|
|
|
| 12 |
|
Data
Verification |
|
57 |
| |
|
|
|
|
| 13 |
|
Mineral
Processing and Metallurgical Testing |
|
58 |
| |
|
|
|
|
| |
13.1 |
|
Processing
Plant |
|
58 |
| |
13.2 |
|
Metallurgical
Testing |
|
58 |
| |
|
|
|
|
|
| 14 |
|
Mineral
Resource Estimates |
|
61 |
| |
|
|
|
|
| |
14.1 |
|
Mineral
Resource Summary |
|
61 |
| |
14.2 |
|
Resource
Database and Validation |
63 |
| |
14.3 |
|
Definition
and Interpretation of Estimation Domains |
|
63 |
| |
14.4 |
|
Compositing
Methods |
|
65 |
| |
14.5 |
|
Basic
Statistics |
|
65 |
| |
14.6 |
|
Specific
Gravity |
|
67 |
| |
14.7 |
|
Variography |
|
67 |
| |
14.8 |
|
Block
Models |
|
70 |
| |
14.9 |
|
Block
Model Validation |
|
72 |
| |
14.10 |
|
Resource
Classification |
|
76 |
| |
14.11 |
|
Resource
Estimation of Stockpiles and Tailings |
|
76 |
| |
14.12 |
|
Mineral
Resource Estimate |
|
76 |
| |
|
|
|
|
|
| 15 |
|
Mineral
Reserve Estimates |
|
80 |
| |
|
|
|
|
| |
15.1 |
|
Mineral
Reserve Summary |
|
80 |
| |
15.2 |
|
Conversion
Methodology |
|
81 |
| |
15.3 |
|
NSR Cut-Off
Value |
|
81 |
| |
15.4 |
|
Design,
Dilution, and Mining Recovery Parameters |
|
82 |
| Signature Date: March 25, 2021 |
iii |
Technical
Report El Peñón Mine, Chile
| |
15.5 |
|
Reconciliation |
|
83 |
| |
15.6 |
|
Mineral Reserve Estimate |
|
83 |
| |
|
|
|
|
|
| 16 |
|
Mining Methods |
|
86 |
| |
|
|
|
|
| |
16.1 |
|
Underground Mining Methods |
|
86 |
| |
16.2 |
|
Underground Mine Design |
|
87 |
| |
16.3 |
|
Mining Sequence |
|
88 |
| |
16.4 |
|
Geomechanics and Ground Support |
|
89 |
| |
16.5 |
|
Mine Equipment |
|
90 |
| |
16.6 |
|
Mine Services |
|
91 |
| |
|
16.6.1 |
|
Dewatering |
|
91 |
| |
|
16.6.2 |
|
Ventilation |
|
92 |
| |
|
16.6.3 |
|
Electrical |
|
93 |
| |
|
16.6.4 |
|
Compressed Air |
|
93 |
| |
|
16.6.5 |
|
Communications |
|
94 |
| |
16.7 |
|
Life of Mine Plan |
|
94 |
| |
|
|
|
|
|
| 17 |
|
Recovery Methods |
|
96 |
| |
|
|
|
|
| |
17.1 |
|
Primary Crushing |
|
96 |
| |
17.2 |
|
Grinding and Pre-Leach Thickening |
|
98 |
| |
17.3 |
|
Clarification |
|
98 |
| |
17.4 |
|
Leaching |
|
98 |
| |
17.5 |
|
CCD Concentrate Solution Recovery |
|
99 |
| |
17.6 |
|
Pregnant Solution Precipitation |
|
99 |
| |
17.7 |
|
Refining |
|
100 |
| |
17.8 |
|
Tailings Filtering and Disposal |
|
100 |
| |
17.9 |
|
Metallurgical Reporting |
|
101 |
| |
17.10 |
|
Plant Consumption |
|
101 |
| |
17.11 |
|
Optimization Opportunities |
|
102 |
| |
|
|
|
|
|
| 18 |
|
Project Infrastructure |
|
103 |
| |
|
|
|
|
| |
18.1 |
|
Filtered Tailings Stack Design and Construction |
|
105 |
| |
|
|
|
|
|
| 19 |
|
MARKET STUDIES AND CONTRACTS |
|
107 |
| |
|
|
|
|
|
| |
19.1 |
|
Market Studies |
|
107 |
| |
19.2 |
|
Contracts |
|
107 |
| |
|
|
|
|
|
| 20 |
|
Environmental Studies, Permitting, and Social or Community Impact |
|
108 |
| |
|
|
|
|
| |
20.1 |
|
Project Permitting and Authorizations |
|
108 |
| |
20.2 |
|
Environmental Management |
|
110 |
| |
|
20.2.1 |
|
Environmental Management System |
|
110 |
| |
|
20.2.2 |
|
Tailings Management |
|
111 |
| |
|
20.2.3 |
|
Water Management |
|
112 |
| |
20.3 |
|
Community Relations |
|
114 |
| Signature Date: March 25, 2021 |
iv |
Technical
Report El Peñón Mine, Chile
| |
|
20.3.1 |
|
General Social Context |
|
114 |
| |
|
20.3.2 |
|
Social and Environmental Assessment and Management Systems |
|
114 |
| |
|
20.3.3 |
|
Workplace Health and Safety |
|
115 |
| |
|
20.3.4 |
|
Support for Community Priorities |
|
116 |
| |
|
20.3.5 |
|
Cultural Heritage |
|
117 |
| |
20.4 |
|
Mine Closure |
|
117 |
| |
|
|
|
|
|
| 21 |
|
Capital and Operating Costs |
|
119 |
| |
|
|
|
|
| |
21.1 |
|
Capital Costs |
|
119 |
| |
21.2 |
|
Operating Costs |
|
120 |
| |
|
|
|
|
|
| 22 |
|
Economic Analysis |
|
121 |
| |
|
|
|
|
| 23 |
|
Adjacent Properties |
|
122 |
| |
|
|
|
|
| 24 |
|
Other Relevant Data and Information |
|
123 |
| |
|
|
|
|
| 25 |
|
Interpretation and Conclusions |
|
124 |
| |
|
|
|
|
| 26 |
|
Recommendations |
|
126 |
| |
|
|
|
|
| 27 |
|
References |
|
127 |
| |
|
|
|
|
| 28 |
|
Certificates of Qualified Persons |
|
130 |
| |
|
|
|
|
|
|
| Signature Date: March 25, 2021 |
v |
Technical
Report El Peñón Mine, Chile
LIST
OF FIGURES
| Figure
4-1: General location map |
14 |
| Figure
4-2: Map of mineral tenure |
16 |
| Figure
4-3: Detailed map of mineral tenure |
22 |
| Figure
5-1: Infrastructure and typical landscape |
25 |
| Figure
7-1: Regional geological setting |
29 |
| Figure
7-2: Local and property geology |
31 |
| Figure
7-3: Schematic geological plan and cross-sections of the El Peñón deposit |
33 |
| Figure
7-4: Photographs of mineralization in underground exposures and in drill core |
35 |
| Figure
8-1: Generalized gold deposit types and environments |
36 |
| Figure
10-1: Plan view of drill holes in El Peñón core mine area |
40 |
| Figure
11-1: Time-series plots: gold assays of select CRMs by laboratory (2018–2020) |
51 |
| Figure
11-2: Time-series plots: gold assays of select blanks by type and laboratory (2018–2020) |
53 |
| Figure
11-3: Comparison between SGS and Geoassay umpire gold assays (2019-2020) |
55 |
| Figure
14-1: Plan view of estimation domains in El Peñón core mine area |
64 |
| Figure
14-2: Experimental gold and silver correlograms and fitted correlograms models for the 505 and Magenta veins |
69 |
| Figure
14-3: Gold swath plots for 505 Vein |
74 |
| Figure
14-4: Gold swath plots for Magenta Vein |
75 |
| Figure
16-1: Schematic cross-section of drift and vein showing extent of split-blasting technique |
87 |
| Figure
16-2: Schematic example of bench-and-fill mining method |
88 |
| Figure
16-3: Ventilation circuit of the Pampa Augusta Victoria underground mine |
93 |
| Figure
17-1: Mineral processing flowsheet |
97 |
| Figure
18-1: Plan map of main infrastructure at El Peñón |
104 |
| Figure
18-2: Schematic cross-section of western face of filtered tailings stack |
105 |
| Signature Date: March 25, 2021 |
vi |
Technical
Report El Peñón Mine, Chile
LIST
OF TABLES
| Table
1-1: El Peñón Mineral Resource Statement as of December 31, 2020 |
3 |
| Table
1-2: El Peñón Mineral Reserve Statement as of December 31, 2020 |
5 |
| Table
4-1: Mineral tenure list |
17 |
| Table
6-1: Commercial production at El Peñón, January 2000 to December 31, 2020 |
27 |
| Table
7-1: Description of main lithologies |
30 |
| Table
10-1: Exploration and infill drilling by year and type, 1993 to December 31, 2020 |
39 |
| Table
11-1: Sample preparation and analytical standard operating procedures |
43 |
| Table
11-2: Summary of analytical quality control data produced between 2018 and 2020 |
49 |
| Table
11-3: Lower detection limits and acceptance limits for blanks |
52 |
| Table
13-1: Gold recovery by zone, ore type, and grade category |
59 |
| Table
13-2: Silver recovery by zone, ore type, and grade category |
59 |
| Table
13-3: Processing plant production for 2019 |
60 |
| Table
13-4: Processing plant production for 2020 |
60 |
| Table
14-1: El Peñón Mineral Resource Statement as of December 31, 2020 |
62 |
| Table
14-2: Summary of gold and silver capping values by zone |
65 |
| Table
14-3: Specific gravity density values assigned to each zone |
67 |
| Table
14-4: Typical calculation parameters for experimental correlograms |
68 |
| Table
14-5: Correlogram model parameters for 505 and Magenta veins |
68 |
| Table
14-6: Generalized block model variables |
70 |
| Table
14-7: Block models per veins and per mining zones |
71 |
| Table
14-8: Summary of the typical estimation search parameters |
72 |
| Table
14-9: Statistical validation of the estimated block model – 505 Vein |
73 |
| Table
14-10: Statistical validation of the estimated block model – Magenta Vein |
73 |
| Table
14-11: Resource NSR cut-off value calculation parameters |
77 |
| Table
14-12: Summary of El Peñón mineral resources by zone, as of December 31, 2020 |
78 |
| Table
15-1: El Peñón Mineral Reserve Statement as of December 31, 2020 |
80 |
| Table
15-2: NSR cut-off value calculation parameters for mineral reserves |
82 |
| Table
15-3: Stope SMU design parameters by zone |
82 |
| Table
15-4: Drift (split blasting) SMU design parameters |
82 |
| Table
15-5: Reconciliation |
83 |
| Table
15-6: Summary of El Peñón mineral reserves by zone, as of December 31, 2020 |
84 |
| Table
16-1: Underground mobile equipment for development & production |
90 |
| Table
16-2: Support mobile equipment |
91 |
| Table
16-3: Life of mine plan (LOM) |
95 |
| Table
17-1: Consumption of reagents for 2020 |
101 |
| Table
17-2: Consumption of processing supplies for 2020 |
102 |
| Table
20-1: Summary of environmental resolutions since 1998 |
109 |
| Table
20-2: Social risk management element of Yamana’s HSEC Framework (2016) |
114 |
| Table
20-3: Health and safety management elements of Yamana’s HSEC Framework (2016) |
115 |
| Table
20-4: Mine closure costs |
118 |
| Table
21-1: Life of mine capital costs |
119 |
| Table
21-2: LOM average unit operating costs |
120 |
| Signature Date: March 25, 2021 |
vii |
Technical
Report El Peñón Mine, Chile
Cautionary Note Regarding
Forward-Looking Statements
This report contains or incorporates by reference
“forward-looking statements” and “forward-looking information” under applicable Canadian securities legislation
within the meaning of the United States Private Securities Litigation Reform Act of 1995. Forward-looking information includes,
but is not limited to: cash flow forecasts, projected capital, operating and exploration expenditures, targeted cost reductions,
mine life and production rates, grades, infrastructure, capital, operating and sustaining costs, the future price of gold, potential
mineralization and metal or mineral recoveries, estimates of mineral resources and mineral reserves and the realization of such
mineral resources and mineral reserves, information pertaining to potential improvements to financial and operating performance
and mine life at El Peñón (as defined herein) that may result from expansion projects or other initiatives, maintenance
and renewal of permits or mineral tenure, estimates of mine closure obligations, leverage ratios and information with respect
to the Company’s (as defined herein) strategy, plans or future financial or operating performance. Forward-looking statements
are characterized by words such as “plan,” “expect”, “budget”, “target”, “project”,
“intend”, “believe”, “anticipate”, “estimate” and other similar words, or statements
that certain events or conditions “may” or “will” occur, including the negative connotations of such terms.
Forward-looking statements are statements that are not historical facts and are based on the opinions, assumptions and estimates
of Qualified Persons (as defined herein) considered reasonable at the date the statements are made, and are inherently subject
to a variety of risks and uncertainties and other known and unknown factors that could cause actual events or results to differ
materially from those projected in the forward-looking statements. These factors include, but are not limited to: the impact of
general domestic and foreign business; economic and political conditions; global liquidity and credit availability on the timing
of cash flows and the values of assets and liabilities based on projected future conditions; fluctuating metal and commodity prices
(such as gold, silver, diesel fuel, natural gas and electricity); currency exchange rates (such as the Chilean Peso and the Canadian
dollar versus the United States dollar); changes in interest rates; possible variations in ore grade or recovery rates; the speculative
nature of mineral exploration and development; changes in mineral production performance, exploitation and exploration successes;
diminishing quantities or grades of reserves; increased costs, delays, suspensions, and technical challenges associated with the
construction of capital projects; operating or technical difficulties in connection with mining or development activities, including
disruptions in the maintenance or provision of required infrastructure and information technology systems; damage to the Company’s
or El Peñón’s reputation due to the actual or perceived occurrence of any number of events, including negative
publicity with respect to the handling of environmental matters or dealings with community groups, whether true or not; risk of
loss due to acts of war, terrorism, sabotage and civil disturbances; risks associated with infectious diseases, including COVID-19;
risks associated with nature and climatic conditions; uncertainty regarding whether El Peñón will meet the Company’s
capital allocation objectives; the impact of global liquidity and credit availability on the timing of cash flows and the values
of assets and liabilities based on projected future cash flows; the impact of inflation; fluctuations in the currency markets;
changes in national and local government legislation, taxation, controls or regulations and/or changes in the administration of
laws, policies and practices, expropriation or nationalization of property and political or economic developments in Chile; failure
to comply with environmental and health and safety laws and regulations; timing of receipt of, or failure to comply with, necessary
permits and approvals; changes in project parameters as plans continue to be refined; changes in project development, construction,
production and commissioning time frames; contests over title to properties or over access to water, power, and other required
infrastructure; increased costs and physical risks including extreme weather events and resource shortages related to climate
change; availability and increased costs associated with mining inputs and labor; the possibility of project cost overruns or
unanticipated costs and expenses, potential impairment charges, higher prices for fuel, steel, power, labour, and other consumables
contributing to higher costs; unexpected changes in mine life; final pricing for concentrate sales; unanticipated results of future
studies; seasonality and unanticipated weather changes; costs and timing of the development of new deposits; success of exploration
activities; risks related to relying on local advisors and consultants in foreign jurisdictions; unanticipated reclamation expenses;
limitations on insurance coverage; timing and possible outcome of pending and outstanding litigation and labour disputes; risks
related to enforcing legal rights in foreign jurisdictions, vulnerability of information systems and risks related to global financial
conditions. In addition, there are risks and hazards associated with the business of mineral exploration, development, and mining,
including environmental hazards, industrial accidents, unusual or unexpected formations, pressures, cave-ins, flooding, failure
of plant, equipment, or processes to operate as anticipated (and the risk of inadequate insurance, or inability to obtain insurance,
to cover these risks), as well as those risk factors discussed or referred to herein and in the Company's Annual Information Form
filed with the securities regulatory authorities in all of the provinces and territories of Canada and available under the Company’s
profile at www.sedar.com, and the Company’s Annual Report on Form 40-F filed with the United States Securities and Exchange
Commission at www.edgar.com. Although the Company has attempted to identify important factors that could cause actual actions,
events, or results to differ materially from those described in forward-looking statements, there may be other factors that cause
actions, events, or results not to be anticipated, estimated or intended. There can be no assurance that forward-looking statements
will prove to be accurate, as actual results and future events could differ materially from those anticipated in such statements.
The Company undertakes no obligation to update forward-looking statements if circumstances or management’s estimates, assumptions,
or opinions should change, except as required by applicable law. The reader is cautioned not to place undue reliance on forward-looking
statements. The forward-looking information contained herein is presented for the purpose of assisting investors in understanding
the Company’s expected financial and operational performance and results as at and for the periods ended on the dates presented
in the Company’s plans and objectives and may not be appropriate for other purposes.
| Signature Date: March 25, 2021 |
viii |
Technical
Report El Peñón Mine, Chile
Cautionary Note to United States Investors Concerning
Estimates of Mineral Reserves and Mineral Resources
This report has been prepared in accordance with
the requirements of the securities laws in effect in Canada, which differ in certain material respects from the disclosure requirements
promulgated by the Securities and Exchange Commission (SEC). For example, the terms “Mineral Reserve”, “Proven
Mineral Reserve”, “Probable Mineral Reserve”, “Mineral Resource”, “Measured Mineral Resource”,
“Indicated Mineral Resource” and “Inferred Mineral Resource” are Canadian mining terms as defined in accordance
with Canadian National Instrument 43-101 - Standards of Disclosure for Mineral Projects and the Canadian Institute of Mining, Metallurgy
and Petroleum (CIM) Definition Standards on Mineral Resources and Mineral Reserves (May 2014), adopted by the CIM Council, as amended.
These definitions differ from the definitions in the disclosure requirements promulgated by the SEC. Accordingly, information contained
in this report may not be comparable to similar information made public by U.S. companies reporting pursuant to SEC disclosure
requirements.
Non-GAAP Measures
The
Company has included certain non-GAAP financial measures and additional line items or subtotals, which the Company believes that,
together with measures determined in accordance with IFRS, provide investors with an improved ability to evaluate the underlying
performance of the Company. Non-GAAP financial measures do not have any standardized meaning prescribed under IFRS, and therefore
they may not be comparable to similar measures employed by other companies. The data is intended to provide additional information
and should not be considered in isolation or as a substitute for measures of performance prepared in accordance with IFRS. The
non-GAAP financial measures included in this report include: free cash flow, cash costs per gold-equivalent ounce sold, and all-in
sustaining costs per gold-equivalent ounce sold. Please refer to section 11 of the Company’s current annual Management’s
Discussion and Analysis, which is filed under the Company’s profile on SEDAR at www.sedar.com and which includes
a detailed discussion of the usefulness of the non-GAAP measures. The Company believes that in addition to conventional measures
prepared in accordance with IFRS, the Company and certain investors and analysts use this information to evaluate the Company’s
performance. In particular, management uses these measures for internal valuation for the period and to assist with planning and
forecasting of future operations.
| Signature Date: March 25, 2021 |
ix |
Technical
Report El Peñón Mine, Chile
List
of Abbreviations
Units of measurement used in this report conform to the metric
system. All currency in this report is listed in US dollars (US$) unless noted otherwise
| ° |
degrees |
|
HDPE |
high-density polyethylene |
|
NSR |
net smelter return |
| > |
greater than |
|
hp |
horsepower |
|
NPV |
net present value |
| < |
less than |
|
HSEC |
Health, Safety, Environment, and Community |
|
NTU |
nephelometric turbidity units |
| % |
percent |
|
ID3 |
inverse distance cubed |
|
oz |
troy ounce (31.1035 g) |
| a |
annum |
|
k |
kilo (thousand) |
|
PFS |
pre-feasibility study |
| A |
ampere or amp |
|
kg |
kilogram |
|
ppm |
parts per million |
| AAS |
atomic absorption spectrometry |
|
km |
kilometre |
|
QA/QC |
quality assurance/quality control |
| Ag |
silver |
|
km2 |
square kilometre |
|
RAR |
return air raise |
| ARD |
acid rock drainage |
|
kV |
kilovolt |
|
RC |
reverse circulation |
| Au |
gold |
|
kVA |
kilovolt-amperes |
|
RCA |
Environmental Qualification Resolutions |
| C&F |
cut and fill mining method |
|
kW |
kilowatt |
|
RMR89 |
rock mass rating |
| °C |
degree Celsius |
|
kWh |
kilowatt-hour |
|
s |
second |
| CRM |
certified reference material |
|
L |
litre |
|
SD |
Standard deviation |
| cm |
centimetre |
|
LHD |
load-haul-dump truck |
|
SMU |
selective mining units |
| cm2 |
square centimetre |
|
LOM |
life of mine |
|
SOP |
standard operating procedures |
| cog |
cut-off grade |
|
L/s |
litres per second |
|
t |
metric tonne |
| d |
day |
|
m |
metre |
|
tpa |
metric tonnes per year |
| DL |
detection limit |
|
M |
Mega, million |
|
tpd |
metric tonnes per day |
| DIA |
Declaration of Environmental Impacts |
|
m2 |
square metre |
|
tph |
metric tonnes per hour |
| dmt |
dry metric tonne |
|
m3 |
cubic metre |
|
tpm |
metric tonnes per month |
| EDA |
exploratory data analysis |
|
masl |
metres above sea level |
|
US$ |
United States dollar |
| EIA |
environmental impact assessment |
|
μg |
microgram |
|
TFS |
tailings storage facility |
| Fm |
formation |
|
m3/h |
cubic metres per hour |
|
V |
volt |
| g |
gram |
|
min |
minute |
|
VFD |
variable frequency drive |
| g |
peak ground acceleration |
|
ML |
metal leaching |
|
VSO |
Vulcan Stope Optimizer |
| G |
giga (billion) |
|
mm |
micrometre, micron |
|
W |
watt |
| GDMS |
geological data management system |
|
mm |
millimetre |
|
wt % |
weight percent |
| g/L |
grams per litre |
|
Mtpa |
million tonnes per year |
|
|
|
| g/t |
grams per metric tonne |
|
MVA |
megavolt-amperes |
|
|
|
| ha |
hectare |
|
MW |
megawatt |
|
|
|
| |
|
|
MWh |
megawatt-hour |
|
|
|
| |
|
|
NN |
nearest neighbour |
|
|
|
| Signature Date: March 25, 2021 |
x |
Technical
Report El Peñón Mine, Chile
This report documents the El Peñón
mine (El Peñón), an underground and open-pit gold-silver mine located in northern Chile in the Atacama Desert. Yamana
Gold Inc. (Yamana) holds a 100% interest in El Peñón through its subsidiary, Minera Meridian Limitada (Minera Meridian).
Yamana is a Canadian-based precious metals producer
with significant gold and silver production- and development-stage properties, exploration properties, and land positions throughout
the Americas, including Canada, Brazil, Chile, and Argentina. Yamana plans to continue to build on this base through expansion
and optimization initiatives at existing operating mines, development of new mines, advancement of its exploration properties and,
at times, by targeting other consolidation opportunities, with a primary focus on the Americas.
This technical report prepared in accordance with
National Instrument 43-101 – Standards of Disclosure for Mineral Projects (NI 43-101) documents the current mining operation
as well as the mineral resource and mineral reserve estimate of El Peñón as of December 31, 2020.
El Peñón is located approximately
165 km southeast of the city of Antofagasta. The mine site, situated approximately midway between the Pacific Coast and the border
with Argentina, is in the Atacama Desert, a desert plateau with one of the driest climates on earth. The mine has been in operation
since 1999 and it operates on a year-round basis.
Yamana acquired the property in late 2007 with the
purchase of Meridian Gold Inc. (Meridian Gold). The mineral rights consist of 443 individual mining exploitation claims that comprise
an area measuring 92,387 ha. It covers the El Peñón core mine area, the Fortuna area, the Laguna area, the Pampa
Augusta Vitoria (PAV) area, and the surrounding exploration lands.
Minera Meridian is subject to a royalty tax between
5% and 14% based on the mining gross profit margin and currently pays approximately a 5% to 7% royalty tax on taxable mining income.
In addition, El Peñón is also subject to First Category Tax (income tax) in Chile at a rate of 27%.
Minera Meridian has all required permits to continue
carrying out mining and processing operations on the El Peñón property.
A 2% Net Smelter Return (NSR) royalty is payable
to Maverix Metals Inc. as agreed as part of the purchase of the Nado claims covering the Fortuna area and a further 2% NSR is payable
to Soquimich Comercial SA for claims Providencia 1, 2, 3, 4, and 5 and claims Dominador 1, 2, and 4. These claims are also located
in the Fortuna area.
| 1 –Summary |
1 |
| |
|
| Signature Date: March 25, 2021 |
|
Technical
Report El Peñón Mine, Chile
| 1.2 | Geology
and Mineralization |
The discovery of the El Peñón gold-silver
deposit was the result of successful grassroots exploration throughout the early 1990s. El Peñón is classified as
a low- to intermediate-sulphidation epithermal gold-silver deposit associated with steeply dipping fault-controlled veins emplaced
following rhyolite dome emplacement.
The gold-silver mineralization is hosted in near-horizontal
to gently dipping Paleocene to Eocene basaltic to rhyolitic volcanic rocks. The deposit comprises many individual tabular and steeply
dipping zones that are amenable to mining by both underground and surface methods. Vein thickness range from decimetre-scale to
more than 20 metres. The strike length of individual mineralized zones ranges from less than 1 km to 4 km and the down-dip extent
reaches up to 350 m.
Yamana has been successful in expanding the footprint
of mineralization through geological mapping, geochemical characterization, geophysics, and abundant surface and underground drilling
within the northeast trend, first starting at the El Peñón area, with Quebrada Orito in the southwest and ending
at Angosta in the northeast.
The significant exploration results were obtained
by surface and underground core drilling. As of the end of December 2020, over three million metres have been drilled at El Peñón.
Yamana continually conducts exploration work to develop drill targets to replenish mineral reserves. Drilling is carried out on
a 60 × 60 m grid with infill drill holes on a 30 × 30 m grid pattern.
Drilling activities have been successful in defining
and expanding known mineralized zones and have led to the discovery of new mineralized zones. Based on these exploration successes
and the production history of El Peñón, good potential exists for the discovery of new mineralized zones in the proximity
of the current mine infrastructure and in the strike and dip extents of known mineralized horizons.
Analytical samples include both drill core and channel
samples. The drill core samples are generated from exploration and infill drilling programs that are conducted on surface and underground;
analytical results are used for target generation and estimation of mineral resources and reserves. The sample preparation, sample
security, and analytical procedures at El Peñón are adequate and consistent with industry standards. The verification
of the sampling data by Yamana and external consultants, including the analytical quality control data produced by Yamana for samples
submitted to various laboratories, suggests that the analytical results delivered by the laboratories are sufficiently reliable
for the purpose of mineral resource and mineral reserve estimation.
| 1 –Summary |
2 |
| |
|
| Signature Date: March 25, 2021 |
|
Technical
Report El Peñón Mine, Chile
| 1.4 | Mineral
Resource and Mineral Reserve Estimates |
Interpreted geological wireframes were constructed
based on a three-dimensional and sectional interpretation of geological continuity, assay results, lithological information and
structural data. Assays were composited to one-metre lengths, then interpolated using capping and a high-yield restriction for
anomalously high grades. Gold and silver grades were interpolated into a sub-blocked model with minimum block size of 0.5 ×
0.5 × 0.5 m and a parent block size of 20 × 20 × 20 m. Estimated grades were interpolated into blocks using Inverse
Distance Cubed (ID3) and checked using Nearest Neighbor (NN) methods. Block estimates were validated using industry standard validation
techniques. Classification of blocks was completed following distance-based criteria.
El Peñón mineral resources have been
estimated in conformity with generally accepted standards set out in Canadian Institute of Mining, Metallurgy and Petroleum (CIM)
Mineral Resource and Mineral Reserves Estimation Best Practices Guidelines (November 2019) and were classified according
to CIM Definition Standards for Mineral Resources and Mineral Reserves (May 2014) (CIM (2014) Standards). Mineral resources
are not mineral reserves and have not demonstrated economic viability. Underground mineral resources are estimated within conceptual
underground mining shapes at a cut-off value of US$95.31/t, which corresponds to 75% of the break-even cut-off value used to estimate
the mineral reserves. A minimum mining width of 0.60 m as well as 0.30 m of hanging-wall and 0.30 m of footwall overbreak dilution
are used to construct the conceptual mining shapes. Mineral resources are reported fully diluted.
Table 1-1: El Peñón Mineral Resource Statement
as of December 31, 2020
| Mineral Resources |
|
Category |
|
Tonnage |
|
Grade |
|
Contained Metal |
| |
|
(kt) |
|
Au (g/t) |
|
Ag (g/t) |
|
Au (koz) |
|
Ag (koz) |
| Underground |
|
Measured |
|
667 |
|
4.81 |
|
143.0 |
|
103 |
|
3,063 |
| |
Indicated |
|
6,355 |
|
3.06 |
|
105.4 |
|
625 |
|
21,535 |
| |
Total Measured + Indicated |
|
7,022 |
|
3.22 |
|
109.0 |
|
728 |
|
24,599 |
| |
Inferred |
|
5,208 |
|
3.61 |
|
118.0 |
|
605 |
|
19,758 |
| Tailings |
|
Measured |
|
– |
|
– |
|
– |
|
– |
|
– |
| |
Indicated |
|
– |
|
– |
|
– |
|
– |
|
– |
| |
Total Measured + Indicated |
|
– |
|
– |
|
– |
|
– |
|
– |
| |
Inferred |
|
13,767 |
|
0.55 |
|
18.9 |
|
245 |
|
8,380 |
| Stockpiles |
|
Measured |
|
– |
|
– |
|
– |
|
– |
|
– |
| |
Indicated |
|
1,019 |
|
1.13 |
|
28.8 |
|
37 |
|
942 |
| |
Total Measured + Indicated |
|
1,019 |
|
1.13 |
|
28.8 |
|
37 |
|
942 |
| |
Inferred |
|
– |
|
– |
|
– |
|
– |
|
– |
| Combined |
|
Measured |
|
667 |
|
4.81 |
|
143.0 |
|
103 |
|
3,063 |
| |
Indicated |
|
7,374 |
|
2.79 |
|
94.8 |
|
662 |
|
22,478 |
| |
Total Measured + Indicated |
|
8,041 |
|
2.96 |
|
98.8 |
|
765 |
|
25,541 |
| |
Inferred |
|
18,975 |
|
1.39 |
|
46.1 |
|
850 |
|
28,138 |
| 1 –Summary |
3 |
| |
|
| Signature Date: March 25, 2021 |
|
Technical
Report El Peñón Mine, Chile
| 1. | Mineral resources have been estimated by the El Peñón resource geology team under
the supervision of Marco Velásquez Corrales, Registered Member of the Chilean Mining Commission, a full-time employee of
Minera Meridian Limitada, and a qualified person as defined by NI 43-101. The estimate conforms to the CIM (2014) Standards. Mineral
resources are reported exclusive of mineral reserves. Mineral resources were evaluated using an inverse distance weighting algorithm
informed by capped composites and constrained by three-dimensional mineralization wireframes. Mineral resources are not mineral
reserves and have not demonstrated economic viability. Metal price assumptions of US$1,250/oz for gold and US$18.00/oz for silver
were used. |
| 2. | Underground mineral resources are estimated at a cut-off NSR of US$95.31/t, which corresponds
to 75% of the mineral reserves cut-off value. Processing recoveries assumptions range from 84.13% to 97.38% for gold and from 56.47%
to 92.33% for silver. The estimation considered the following cost assumptions: mine operating cost of US$80.10/t; processing cost
of US$29.42/t; sustaining capital cost of US$4.10/t; and G&A costs of US$13.46/t. A royalty of 2% was also considered for mineral
resources contained in the Fortuna zone. Mineral resources are reported fully diluted; they consider a minimum mining width of
0.60 m and hanging wall and footwall overbreak dilutions of 0.30 m each to determine reasonable prospects of economic extraction.
Bulk densities ranging from 2.36 g/cm3 to 2.57 g/cm3 were used to convert volume to tonnage. |
| 3. | Mineral resources contained in tailings are reported at a cut-off grade of 0.50 g/t gold-equivalent,
using recoveries of 60% for gold and 30% for silver, operating cost of US$2.39/t, and processing cost of US$29.42/t. A bulk density
value of 1.75 g/cm3 was used to convert tailings volume to tonnage. |
| 4. | Mineral resources contained in stockpiles are reported at a cut-off grade of 0.79 g/t gold-equivalent,
using recoveries of 88.0% for gold and 80.8% for silver, operating cost of US$2.39/t, and processing cost of US$29.42/t. A bulk
density value of 1.60 g/cm3 was used to convert the stockpile volume to tonnage. |
| 5. | Mineral resources are reported as of December 31, 2020. |
| 6. | All figures are rounded to reflect the relative accuracy of the estimate. |
| 7. | Numbers may not add up due to rounding. |
The methodology used at El Peñón to
convert mineral resources to mineral reserves is summarized as follows:
| • | Drift and bench (stope) selective mining units (SMUs) are designed using Vulcan Stope Optimiser; design parameters calibrated
with actual operational results. |
| • | Long-term metal price assumptions for gold and silver of US$1,250/oz and US$18/oz, respectively, as well as processing recoveries
and average operating costs obtained respectively from geometallurgical tests and last year’s life of mine (LOM) plan are
used to determine an economic score for each SMU. Only measured and indicated mineral resources are considered for conversion to
mineral reserves |
| • | SMUs with positive scores are analyzed for inclusion into the mineral reserve inventory. This is done by analyzing development
costs, considering the capital and auxiliary development required to enable mining of the designed SMUs. |
| 1 –Summary |
4 |
| |
|
| Signature Date: March 25, 2021 |
|
Technical
Report El Peñón Mine, Chile
| • | Before including SMUs with positive scores in the mineral reserves inventory, geomechanical considerations are revised. Design
is adjusted where required. |
| • | SMUs containing a majority portion of measured or indicated blocks are converted to proven or probable mineral reserves, respectively. |
Table 1-2: El Peñón Mineral Reserve
Statement as of December 31, 2020
| Mineral Reserves |
|
Category |
|
Tonnage |
|
Grade |
|
Contained Metal |
| |
|
(kt) |
|
Au (g/t) |
|
Ag (g/t) |
|
Au (koz) |
|
Ag (koz) |
| Open Pit |
|
Proven |
|
– |
|
– |
|
– |
|
– |
|
– |
| |
Probable |
|
53 |
|
0.34 |
|
316.2 |
|
1 |
|
543 |
| |
Total Open Pit |
|
53 |
|
0.34 |
|
316.2 |
|
1 |
|
543 |
| Underground |
|
Proven |
|
368 |
|
5.73 |
|
213.4 |
|
68 |
|
2,526 |
| |
Probable |
|
5,068 |
|
5.07 |
|
158.6 |
|
826 |
|
25,835 |
| |
Total Underground |
|
5,436 |
|
5.12 |
|
162.3 |
|
894 |
|
28,361 |
| Stockpile |
|
Proven |
|
9 |
|
1.40 |
|
54.1 |
|
0 |
|
16 |
| |
Probable |
|
651 |
|
1.26 |
|
14.1 |
|
26 |
|
294 |
| |
Total Stockpile |
|
660 |
|
1.26 |
|
14.6 |
|
27 |
|
310 |
| Combined |
|
Proven |
|
377 |
|
5.63 |
|
209.5 |
|
68 |
|
2,542 |
| |
Probable |
|
5,772 |
|
4.60 |
|
143.7 |
|
853 |
|
26,672 |
| |
Grand Total |
|
6,149 |
|
4.66 |
|
147.8 |
|
921 |
|
29,214 |
| 1. | Mineral reserves have been estimated by the El Peñón long-term mine planning team
under the supervision of Sergio Castro, Registered Member of the Chilean Mining Commission, a full-time employee of Minera Meridian
Limitada, and a qualified person as defined by NI 43-101. The estimate conforms to the CIM (2014) Standards. Mineral reserves are
stated at a mill feed reference point and allow for dilution and mining losses. Metal price assumptions of US$1,250/oz for gold
and US$18.00/oz for silver were used. |
| 2. | Open-pit mineral reserves are reported at a cut-off NSR of US$ 49.14/t. Processing recoveries
assumptions range from 84.13% to 89.22% for gold and from 79.71% to 81.67% for silver. Mine operating (including transport), processing,
and G&A costs assumptions of US$6.27/t and US$29.42/t and US$13.46/t were considered, respectively. |
| 3. | Underground mineral reserves are reported at an NSR cut-off of US$127.08/t. Processing recoveries
assumptions range from 84.13% to 97.38% for gold and from 56.47% to 92.33% for silver. The following cost assumptions were considered:
mine operating cost: US$80.10/t; processing cost: US$29.42/t; sustaining capital cost: US$4.10/t, and G&A cost: US$13.46/t.
A royalty of 2% was considered for reserves planned to be mined in the Fortuna zone. |
| 4. | Mineral reserves contained in low-grade stockpiles are reported at a cut-off grade of 0.90 g/t
gold-equivalent. Processing recoveries assumptions of 95.2% for gold and 83.0% for silver were used. Operating and processing costs
assumptions of US$2.02/t and US$29.42/t, respectively, were considered. |
| 5. | Mineral reserves are reported as of December 31, 2020. |
| 6. | All figures are rounded to reflect the relative accuracy of the estimate. |
| 7. | Numbers may not add up due to rounding |
| 1 –Summary |
5 |
| |
|
| Signature Date: March 25, 2021 |
|
Technical
Report El Peñón Mine, Chile
| 1.5 | Mining
and Processing Methods |
Ore from underground mines have recently been—and
will continue to be—the main source of feed for the El Peñón mill.
The various underground mining zones are accessed
by ramps; this type of access is suitable for this mine in light of its shallow depth. The underground workings of the core mine
extend approximately ten kilometers along strike and span a vertical extent of approximately 500 m, measured from the highest portal
collar elevation to the bottom-most mine workings. The ramps provide flexibility for rapid adjustments for changes in direction
and elevation and allow access to the veins at appropriate elevations.
Mining at El Peñón utilizes mainly
the bench-and-fill mining method, which is a narrow longhole-stoping method that uses a combination of rockfill and cemented rockfill;
a small percentage of cut-and-fill mining is also applied where required, depending on the characteristics of vein geometry and
ground conditions. Due to the narrow vein widths, a “split-blasting” technique is used in many areas of the mine to
reduce dilution in secondary development in ore zones.
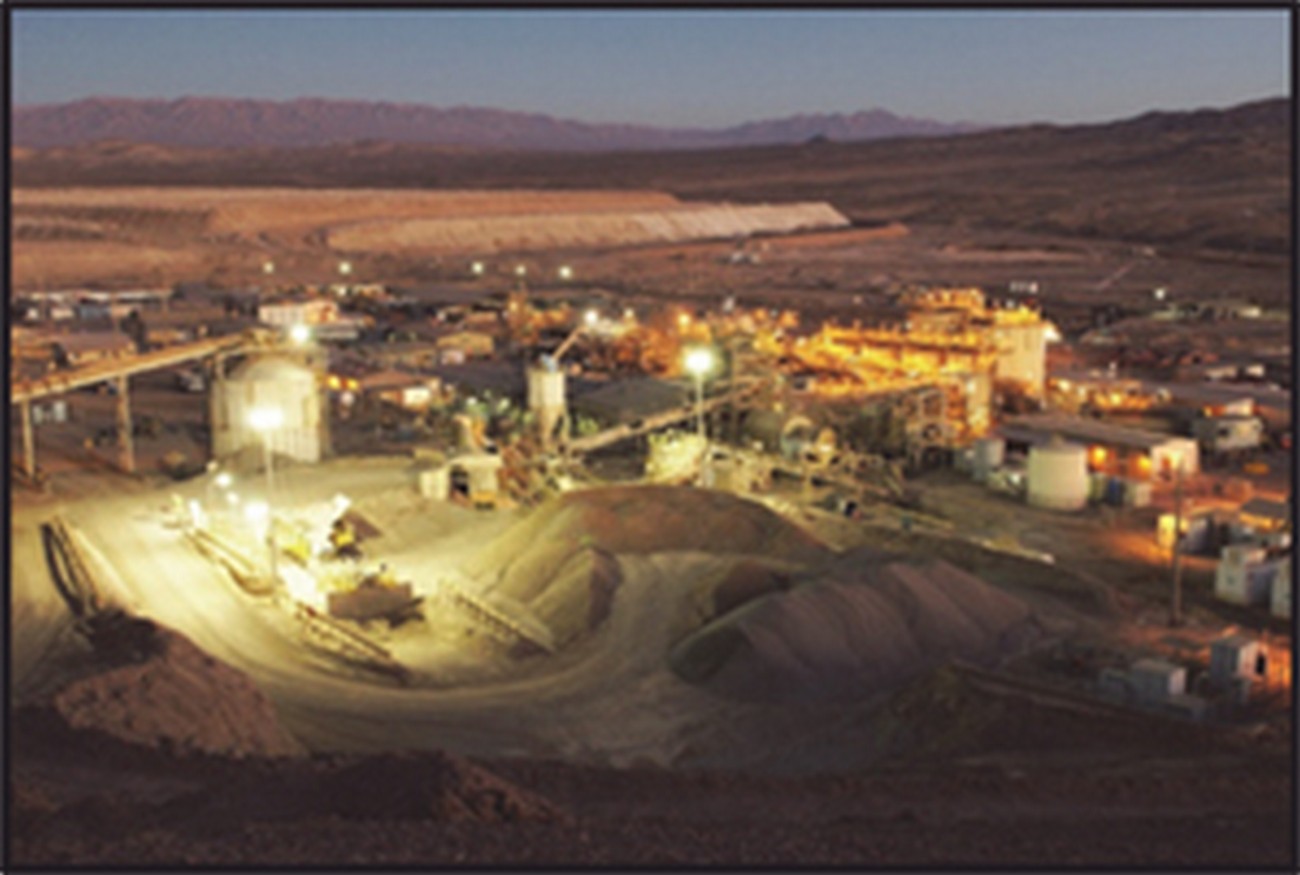
The major assets and facilities associated with
El Peñón are: the mining and processing infrastructure, which include office buildings, shops, and equipment; a processing
plant which produces gold doré by crushing, grinding, leaching, counter-current decantation (CCD) concentrate solution recovery,
zinc precipitation and refining; concrete and cemented backfill plants, and a filtered tailings stack storage facility.
El Peñón is connected to the National
Electric Grid through a 66 kV transmission line connected to the Palestina substation.
The tailings produced at the El Peñón
mill are stored in a filtered tailings stack storage facility, located 1.5 km southeast of the mineral processing plant. The current filter stack stores 25.4 Mt of tailings. The final design
considers an additional storage capacity of 24.5 Mt.
The El Peñón mineral processing plant
and associated facilities process run-of-mine as well as stockpiled ore. Comminution comprises a single stage of crushing followed
by wet grinding in a SAG mill operating in series with a ball mill; these feed a battery of hydrocyclones. Leaching starts at the
SAG mill, where sodium cyanide is added as a leaching agent. The hydrocyclones overflow is subsequently clarified and leached in
reactors with mechanical agitators. The leached pulp is finally transported by gravity to a CCD thickener circuit to wash the pulp
and recover the pregnant solution for gold and silver by zinc precipitation and refining to doré.
| 1 –Summary |
6 |
| |
|
| Signature Date: March 25, 2021 |
|
Technical
Report El Peñón Mine, Chile
| 1.6 | Environmental
Studies, Permitting, and Social or Community Impact |
The El Peñón operation submitted its
first Environmental Impact Assessment (EIA) in 1997 to the Chilean Environmental Impact Assessment System (SEIA). The Environmental
Commission of the Region of Antofagasta (Comision Regional de Medio Ambiente de Antofagasta) approved the application with Exempt
Resolution Nr. 043 in 1998.
The El Peñón operation has undergone
a series of modifications since its original EIA submission. Required Environmental Qualification Resolutions (RCAs) were granted
through a series of Declaration of Environmental Impacts (DIAs). A DIA was approved in 2019. Based on the increase in mineral reserves
over the past three years, a new DIA was submitted in February 2021 for a life of mine plan extension; approval is expected in
2021.
El Peñón consists of historical open
pits, underground mining operations, a process plant, and other support infrastructure, including waste dumps and a filtered tailings
facility with a total storage capacity of 49.8 Mt. The approved plant capacity is 4,800 tpd.
Yamana has implemented an integrated management
system covering health, safety, environment, and community through internationally accredited systems that include the ISO 14001
Environment Management System and the OSHAS 18001 Occupational Health and Safety Management System. A risk assessment matrix has
been developed for the El Peñón mine operation that integrates risk matrices for ISO 14001:2015 and OHSAS 18001:2007.
Beginning in 2020, El Peñón also began the
implementation of the Mining Association of Canada’s Towards Sustainable Mining framework, as well as the World Gold Council’s
Responsible Gold Mining Principles, each of which included internal assessments and will require external audits within a 3-year
timeframe.
Water conservation is a primary focus at El
Peñón. The water management system at El Peñón has been designed as a closed circuit. Process water from
the mill is recovered in the tailings filter plant and recirculated back to the processing plant.
Even though no communities are located near El Peñón,
Yamana has made a number of commitments to the well-being, health, and safety of the communities in the area. As such, the social
and community activities conducted by Yamana are concentrated in the Taltal District and are of philanthropic orientation.
El Peñón has developed a closure plan
covering all current and approved facilities; this plan is in accordance with applicable legal requirements. The closure plan addresses
progressive and final closure actions, post-closure inspections, and monitoring.
| 1 –Summary |
7 |
| |
|
| Signature Date: March 25, 2021 |
|
Technical
Report El Peñón Mine, Chile
| 1.7 | Conclusions
and Recommendations |
More than 5.3 Moz of gold and 134 Moz of silver
have been produced from El Peñón since commercial production commenced in 2000. The mine’s current production
rate, the result of the rightsizing of the operation initiated in late 2016, increased free cash flow generation and reduced capital
expenditures while ensuring the long-term sustainability of the mine, matching production rate with replacement of mineral reserves
and mineral resources.
Exploration results at El Peñón continue
to highlight the expansion potential of the mine and Yamana’s ability to replenish mineral reserves and mineral resources
so as to extend the life of mine past its current mineral reserve base. Drilling is effective at adding mineral resources and mineral
reserves at El Peñón. Similar to drilling results from the previous two years, the 2020 drilling successfully replenished
the 2020 depletion of gold mineral reserves. Based on this successful track record, a drilling program totalling 384,000 m is planned
from 2021 to 2023.
El Peñón mineral resources and mineral
reserves have been estimated in conformity with generally accepted CIM Estimation of Mineral Resources and Mineral Reserves Best
Practice Guidelines (November 2019) and were classified in accordance with CIM (2014) Standards.
The total proven and probable mineral reserve at
El Peñón as of December 31, 2020, is 6.1 Mt averaging 4.66 g/t gold and 147.8 g/t silver, for approximately 0.921
Moz of contained gold and 29.21 Moz of silver. In addition, measured and indicated mineral resources are estimated at 8.0 Mt grading
2.96 g/t gold (0.765 Moz gold) and 98.8 g/t silver (25.5 Moz silver), and inferred mineral resources are estimated at 18.98 Mt
grading 1.39 g/t gold (0.850 Moz gold) and 46.1 g/t silver (28.1 Moz silver).
The mineral reserves supporting the life of mine
(LOM) plan consists of an integrated operation, mining mainly underground ore and small amounts of ore from the Chiquilla Chica
open pit. The ore produced by the mining operations and reclaimed from stockpiles is fed to the mill to sustain a six-year mine
life. LOM production is estimated at 866 koz gold and 25,591 koz silver.
Yamana is confident that, based on required infill
drilling, the future conversion of mineral resources to mineral reserves will continue to show positive results. In recent years,
mineral resources converted to mineral reserves have more than offset the depletion of mineral reserves; this indicates the significant
potential of extending the mine life beyond the current LOM and sustaining a strategic mine life of 10 years or more.
The capital and operating cost estimates are based
on mine budget data and operating experience, and are appropriate for the known mining methods and production schedule. Under the
assumptions in this technical report, El Peñón has positive project economics until the end of mine life, which supports
the mineral reserve estimate. Capital costs over the LOM period are estimated at US$167M, consisting mainly of sustaining underground
mine development (83%) and capital required for equipment replacement (14%). An additional budget of US$37M is estimated for mine
closure purposes.
| 1 –Summary |
8 |
| |
|
| Signature Date: March 25, 2021 |
|
Technical
Report El Peñón Mine, Chile
No environmental or social issues were identified
that could materially impact the ability to extract the mineral resources and mineral reserves. El Peñón has all
the operational licences required for operation according to the national legislation. The approved licences address the authority’s
requirements for mining extraction and operation activities. The results of this technical report are subject to variations in
operational conditions including, but not limited to the following:
| • | Assumptions related to commodity and foreign exchange (in particular, the relative movement
of gold and the Chilean peso/US dollar exchange rate) |
| • | Unanticipated inflation of capital or operating costs |
| • | Significant changes in equipment productivities |
| • | Geological continuity of the mineralized structures |
| • | Geotechnical assumptions in pit and underground designs |
| • | Throughput and recovery rate assumptions |
| • | Changes in political and regulatory requirements that may affect the operation or future closure
plans |
| • | Changes in closure plan costs |
| • | Availability of financing and changes in modelled taxes |
In the opinion of the qualified persons, there are
no reasonably foreseen inputs from risks and uncertainties identified in the technical report that could affect the project’s
continued economic viability.
Over the past 20 years, El Peñón has
established an exploration strategy to continually replace depletion of mineral reserves and extend mine life. The strategy involves
maintaining a pipeline of mineral resources and exploration potential to maintain a rolling mine life visibility of at least 10
years. To continue this trend, drilling programs should continue to be carried out with the following objectives:
| • | Infill drilling to replace production by upgrading and extending known mineral resources. |
| • | Expansion exploration drilling to upgrade inferred mineral resources to measured or indicated categories, or to transform zones
of geological potential into inferred mineral resources. |
| • | District exploration to test the extension of little-known areas of mineralization or to discover new primary structures by
testing targets identified in mapping, geochemistry, geophysics, or machine learning programs. |
| 1 –Summary |
9 |
| |
|
| Signature Date: March 25, 2021 |
|
Technical
Report El Peñón Mine, Chile
Ongoing exploration success could also unlock the
opportunity to leverage the available processing capacity which could increase annual gold and silver production and reduce unit
costs.
Yamana instituted an Operational Excellence program
to improve productivity and control costs. An assessment of the processing plant performed in the first quarter of 2021 has identified
several opportunities to improve gold and silver recoveries and/or reduce operating costs. Opportunities include leach solution
management, additional filblast in the leaching circuit, optimized automated reagent dosing, thickener Advanced Process Control,
and Viper filtration technology. These opportunities could be quickly implemented with minimal capital investment. The El Peñón
team should continue to evaluate and prioritize these opportunities and develop an action plan for their implementation.
In the underground mine, El Peñón
should continue the implementation of Operational Excellence initiatives with an objective to increase productivity minimize dilution,
and control operating costs. Mining initiatives include testing of smaller drift profiles for specific sectors, optimized stoping
and development face drill patterns, and opportunities to reduce specific consumption of consumables.
In 2021, El Peñón should initiate
the process of certification for ISO 45001 (replacing OSHAS 18001) and recertification of the ISO 14001 Environment Management
System; it should also continue the implementation of the Mining Association of Canada’s Towards Sustainable Mining
framework as well as the World Gold Council’s Responsible Gold Mining Principles.
| 1 –Summary |
10 |
| |
|
| Signature Date: March 25, 2021 |
|
Technical
Report El Peñón Mine, Chile
The El Peñón mine (El Peñón)
is an underground and open-pit gold-silver mine located in the Atacama Region of Chile, approximately 165 km southeast of the city
of Antofagasta. Yamana Gold Inc. (Yamana) holds a 100% interest in El Peñón through its subsidiary, Minera Meridian
Limitada (Minera Meridian).
Yamana is a Canadian-based precious metals producer
with significant gold and silver production- and development-stage properties, exploration properties, and land positions throughout
the Americas, including Canada, Brazil, Chile, and Argentina. Yamana plans to continue to build on this base through the expansion
and optimization initiatives at existing operating mines, the development of new mines, advancement of its exploration properties
and, at times, by targeting other consolidation opportunities, with a primary focus on the Americas.
Yamana acquired El Peñón when it completed
the purchase of Meridian Gold Inc. (Meridian Gold) in 2007.
Yamana’s other operations include:
| • | 100% ownership of the Jacobina underground gold mine located in the state of Bahia in eastern
Brazil |
| • | 50% ownership in the Canadian Malartic open-pit gold mine located in Malartic, Québec,
Canada |
| • | 100% ownership of the Minera Florida underground gold-silver mine located southwest of Santiago,
Chile |
| • | 100% ownership in the Cerro Moro underground and open-pit gold-silver mine located in Santa
Cruz province, Argentina |
This technical report, prepared in accordance with
National Instrument 43-101 – Standards of Disclosure for Mineral Projects (NI 43-101) and Form 43-101F1, documents
the mineral resource estimate for El Peñón as of December 31, 2020, the mineral reserve estimate for El Peñón
as of December 31, 2020, and also summarizes the current mining operation at El Peñón as of December 31, 2020.
The mineral resource and mineral reserve estimates
reported herein were prepared in conformity with generally accepted standards set out in the Canadian Institute of Mining, Metallurgy
and Petroleum (CIM) Mineral Resource and Mineral Reserves Estimation Best Practices Guidelines (November 2019) and were
classified according to CIM Definition Standards for Mineral Resources and Mineral Reserves (May 2014) (CIM (2014) Standards).
| 2–Introduction |
11 |
| |
|
| Signature Date: March 25, 2021 |
|
Technical
Report El Peñón Mine, Chile
| 2.1 | Sources
of Information |
The qualified persons for this technical report
are Sergio Castro, Registered Member of the Chilean Mining Commission; Marco Velásquez Corrales, Registered Member of the
Chilean Mining Commission; Henry Marsden, P.Geo.; and Carlos Iturralde, P.Eng.; all are full-time employees of Yamana.
Mr. Castro is the Technical Services Manager of
El Peñón for Yamana. Mr. Velásquez is Chief Resource Geologist at El Peñón for Yamana. Mr. Castro
and Mr. Velásquez are both local employees and work full time at the mine. Mr. Marsden, Senior Vice President, Exploration
for Yamana visited the project on many occasions since January 2016 and most recently between March 11 and 13, 2020. Mr. Iturralde,
Director, Tailings, Health, Safety & Sustainable Development at Yamana, has not visited the project due to travel restrictions
related to the global COVID-19 pandemic.
Sergio Castro is responsible for Sections 13, 15
to 19 (excluding sub-section 18.1), 21 to 22, and 24; he also shares responsibility for related disclosure in Sections 1, 25, 26,
and 27 of the technical report. Marco Velásquez Corrales is responsible for Section 11, 12, and 14, and shares responsibility
for related disclosure in Sections 1, 25, 26, and 27 of the technical report. Henry Marsden is responsible for Sections 2 to 10,
23, and shares responsibility for related disclosure in Sections 1, 25, 26, and 27 of the technical report. Carlos Iturralde is
responsible for Sections 18.1 and 20, and shares responsibility for related disclosure in Sections 1, 25, 26, and 27 of the technical
report.
In preparation of this technical report, the qualified
persons reviewed technical documents and reports on El Peñón supplied by on-site personnel. The documentation reviewed
and other sources of information are listed at the end of this technical report in Section 27 - References.
The prior technical report on El Peñón
was compiled by RPA Inc. (RPA) with an effective date and signature date of March 2, 2018 (RPA, 2018). The RPA report served as
the foundation for this current technical report, which updates the information as of an effective date of December 31, 2020.
| 1 –Introduction |
12 |
| |
|
| Signature Date: March 25, 2021 |
|
Technical
Report El Peñón Mine, Chile
| 3 | Reliance
on Other Experts |
The information, conclusions, opinions, and estimates
contained herein in this technical report are based on the following parameters:
| • | Information available to Yamana at the time of preparation of this technical report |
| • | Assumptions, conditions, and qualifications as set forth in this technical report |
The qualified persons have not performed an independent
verification of the land title and tenure information, as summarized in Section 4 of this technical report, nor have they verified
the legality of any underlying agreement(s) that may exist concerning the permits or other agreement(s) between third parties,
as summarized in Section 4 of this technical report. For this topic, the qualified persons of this report have relied on information
provided by the legal department of Yamana.
The qualified persons have not performed an independent
verification of the permitting and environmental monitoring information and have relied on documents and information provided by
Yamana’s Health, Safety, Environment, and Community (HSEC) teams.
The qualified persons have relied on various Yamana
departments for guidance on applicable taxes, royalties, and other government levies or interests, applicable to revenue or income
from the El Peñón mine.
Except for the purposes legislated under applicable
securities laws, any use of this technical report by any third party is at that party’s sole risk.
| 3 –Reliance on Other Experts |
13 |
| |
|
| Signature Date: March 25, 2021 |
|
Technical
Report El Peñón Mine, Chile
| 4 | Property
Description and Location |
El
Peñón is located in north-central Chile, at latitude 24°40′ S and longitude 69°50′ W, approximately
165 km southeast of the city of Antofagasta (Figure 4-1). The mine site, situated approximately midway between the Pacific Coast
and the border with Argentina, is in the Atacama Desert, a desert plateau with one of the driest climates on earth. The mine operates
on a year-round basis.

Figure
4-1: General location map
| 4
–Property Description and Location |
14 |
| |
|
| Signature Date:
March 25, 2021 |
|
Technical
Report El Peñón Mine, Chile
| 4.1 | Mineral
and Surface Tenure |
The
El Peñón property consists of 443 individual mining exploitation claims owned by Minera Meridian Limitada (Minera
Meridian), a wholly-owned subsidiary of Yamana. The claims comprise an area measuring 92,387 ha that covers the El Peñón
core mine area, the Fortuna area, the Laguna area, the Pampa Augusta Vitoria (PAV) area, and the surrounding exploration lands
(Figure 4-2, Figure 4-3, and Table 4-1). Canons are paid annually to maintain the active claim status. The boundaries of the mining
exploitation concessions are legally surveyed and are covered by an additional layer of claims for increased legal protection.
El
Peñón has been in operation since 1999 and the existing surface rights are deemed sufficient for mining and processing
operations. As well, El Peñón has sufficient water, power, and labour supplies and sufficient areas for tailings
and waste disposal.
Minera
Meridian is subject to a royalty tax between 5% and 14% based on the mining gross profit margin and currently pays approximately
a 5% to 7% royalty tax on taxable mining income.
In
addition, El Peñón is also subject to First Category Tax (income tax) in Chile at a rate of 27%.
| 4 –Property Description and Location |
15 |
| |
|
| Signature Date: March 25, 2021 |
|
Technical
Report El Peñón Mine, Chile

Figure
4-2: Map of mineral tenure
| 4 –Property Description and Location |
16 |
| |
|
| Signature Date: March 25, 2021 |
|
Technical
Report El Peñón Mine, Chile
Table
4-1: Mineral tenure list
| Name |
National Roll | | |
Area (ha) | |
| AURIA 10 1/60 |
| 22015122 | | |
| 60 | |
| AURIA 11 1/60 |
| 22015123 | | |
| 300 | |
| AURIA 4 1/60 |
| 22015120 | | |
| 300 | |
| AURIA 5 1/60 |
| 22015121 | | |
| 300 | |
| AZUL 01 1/10 |
| 22012619 | | |
| 100 | |
| AZUL 02 1/10 |
| 22012620 | | |
| 100 | |
| AZUL 03 1/10 |
| 22012621 | | |
| 100 | |
| AZUL 04 1/10 |
| 22012622 | | |
| 100 | |
| AZUL 05 1/10 |
| 22012623 | | |
| 100 | |
| AZUL 06 1/10 |
| 22012624 | | |
| 100 | |
| AZUL 07 1/10 |
| 22012625 | | |
| 100 | |
| AZUL 08 1/10 |
| 22012626 | | |
| 100 | |
| AZUL 09 1/10 |
| 22012627 | | |
| 100 | |
| AZUL 10 1/10 |
| 22012628 | | |
| 100 | |
| AZUL 11 1/10 |
| 22012629 | | |
| 100 | |
| AZUL 12 1/10 |
| 22012630 | | |
| 100 | |
| AZUL 13 1/10 |
| 22012631 | | |
| 100 | |
| AZUL 14 1/10 |
| 22012632 | | |
| 100 | |
| AZUL 15 1/10 |
| 22012633 | | |
| 100 | |
| AZUL 16 1/10 |
| 22012634 | | |
| 100 | |
| AZUL 17 1/10 |
| 22012635 | | |
| 100 | |
| AZUL 18 1/10 |
| 22012636 | | |
| 50 | |
| AZUL 19 1/10 |
| 22012637 | | |
| 100 | |
| AZUL 22 1/5 |
| 22012640 | | |
| 50 | |
| AZUL 23 1/10 |
| 22012641 | | |
| 100 | |
| AZUL 24 1/10 |
| 22012642 | | |
| 100 | |
| BLANCA 1 1/20 |
| 22014370 | | |
| 300 | |
| BLANCA 1 1/30 |
| 22015721 | | |
| 100 | |
| BLANCA 10 1/30 |
| 22015727 | | |
| 300 | |
| BLANCA 11 1/20 |
| 22015728 | | |
| 200 | |
| BLANCA 12 1/20 |
| 22015729 | | |
| 200 | |
| BLANCA 13 1/20 |
| 22015730 | | |
| 200 | |
| BLANCA 14 1/30 |
| 22015731 | | |
| 300 | |
| BLANCA 15 1/30 |
| 22015732 | | |
| 300 | |
| BLANCA 16 1/30 |
| 22015733 | | |
| 300 | |
| BLANCA 17 1/30 |
| 22015734 | | |
| 300 | |
| BLANCA 18 1/30 |
| 22015735 | | |
| 300 | |
| BLANCA 3 1/30 |
| 22015722 | | |
| 300 | |
| BLANCA 5 1/20 |
| 22015723 | | |
| 200 | |
| BLANCA 7 1/30 |
| 22015724 | | |
| 300 | |
| BLANCA 8 1/30 |
| 22015725 | | |
| 300 | |
| BLANCA 9 1/30 |
| 22015726 | | |
| 300 | |
| BLANCO CHIQUILLA 2 1/16 |
| 22016498 | | |
| 300 | |
| BLANCO NORTE 110 1/30 |
| 22016524 | | |
| 300 | |
| BLANCO NORTE 2B 1/20 |
| 22016218 | | |
| 200 | |
| BLANCO NORTE 3B 1/20 |
| 22016215 | | |
| 200 | |
| BLANCO NORTE 4B 1/10 |
| 22016216 | | |
| 100 | |
| BLANCO NORTE 5B 1/10 |
| 22016217 | | |
| 100 | |
| BLANCO NORTE 8 1/30 |
| 22016351 | | |
| 300 | |
| BLANCO NORTE 9 1/30 |
| 22016352 | | |
| 300 | |
| Name |
National Roll | | |
Area (ha) | |
| BLANCO SUR 1 1/30 |
| 22016499 | | |
| 300 | |
| BLANCO SUR 10 1/30 |
| 22016508 | | |
| 300 | |
| BLANCO SUR 2 1/30 |
| 22016500 | | |
| 300 | |
| BLANCO SUR 3 1/30 |
| 22016501 | | |
| 300 | |
| BLANCO SUR 4 1/30 |
| 22016502 | | |
| 300 | |
| BLANCO SUR 5 1/20 |
| 22016503 | | |
| 200 | |
| BLANCO SUR 6 1/30 |
| 22016504 | | |
| 300 | |
| BLANCO SUR 7 1/30 |
| 22016505 | | |
| 300 | |
| BLANCO SUR 8 1/20 |
| 22016506 | | |
| 200 | |
| BLANCO SUR 9 1/30 |
| 22016507 | | |
| 300 | |
| CAMBIAR 131 1/60 |
| 22016373 | | |
| 300 | |
| CAMBIAR 132 1/60 |
| 22016413 | | |
| 300 | |
| CAMBIAR 133 1/60 |
| 22016374 | | |
| 300 | |
| CAMBIAR 134 1/60 |
| 22016375 | | |
| 300 | |
| CAMBIAR 135 1/40 |
| 22016376 | | |
| 200 | |
| CAMBIAR 136 1/60 |
| 22016377 | | |
| 300 | |
| CAMBIAR 137 1/60 |
| 22016378 | | |
| 300 | |
| CAMBIAR 138 1/60 |
| 22016379 | | |
| 300 | |
| CERRO 1 1/20 |
| 22014311 | | |
| 100 | |
| CERRO 2 1/20 |
| 22014312 | | |
| 100 | |
| CERRO AZUL 01 1/5 |
| 22012704 | | |
| 50 | |
| CERRO AZUL 02 1/10 |
| 22012705 | | |
| 100 | |
| CERRO AZUL 03 1/5 |
| 22012706 | | |
| 50 | |
| CERRO AZUL 04 1/10 |
| 22012707 | | |
| 100 | |
| CERRO AZUL 05 1/10 |
| 22012708 | | |
| 100 | |
| CERRO AZUL 06 1/10 |
| 22012709 | | |
| 100 | |
| CERRO AZUL 07 1/5 |
| 22012710 | | |
| 50 | |
| CERRO AZUL 08 1/10 |
| 22012711 | | |
| 100 | |
| CERRO AZUL 09 1/10 |
| 22012712 | | |
| 100 | |
| CERRO AZUL 10 1/10 |
| 22012713 | | |
| 100 | |
| CERRO AZUL 11 1/10 |
| 22012714 | | |
| 100 | |
| CERRO AZUL 12 1/5 |
| 22012715 | | |
| 50 | |
| CERRO AZUL 13 1/5 |
| 22012716 | | |
| 50 | |
| CERRO AZUL 14 1/10 |
| 22012717 | | |
| 100 | |
| CERRO AZUL 15 1/10 |
| 22012718 | | |
| 100 | |
| CERRO AZUL 16 1/5 |
| 22012719 | | |
| 50 | |
| CERRO AZUL 17 1/10 |
| 22012720 | | |
| 100 | |
| CERRO AZUL 18 1/5 |
| 22012721 | | |
| 50 | |
| CERRO AZUL 19 1/10 |
| 22012722 | | |
| 100 | |
| CERRO AZUL 20 1/10 |
| 22012723 | | |
| 100 | |
| CERRO AZUL 21 1/10 |
| 22012724 | | |
| 100 | |
| CERRO AZUL 22 1/10 |
| 22012725 | | |
| 100 | |
| CERRO AZUL 23 1/5 |
| 22012726 | | |
| 50 | |
| CERRO AZUL 24 1/10 |
| 22012727 | | |
| 100 | |
| CERRO AZUL 25 1/10 |
| 22012728 | | |
| 100 | |
| CERRO AZUL 26 1/10 |
| 22012729 | | |
| 100 | |
| CERRO AZUL 27 1/10 |
| 22012730 | | |
| 100 | |
| CERRO AZUL 28 1/10 |
| 22012731 | | |
| 100 | |
| CERRO AZUL 29 1/5 |
| 22012732 | | |
| 50 | |
| CERRO AZUL 30 1/10 |
| 22012733 | | |
| 100 | |
| 4 –Property Description and Location |
17 |
| Signature Date: March 25, 2021 |
|
Technical
Report El Peñón Mine, Chile
| Name |
National Roll | | |
Area (ha) | |
| CERRO AZUL 31 1/10 |
| 22012734 | | |
| 100 | |
| CERRO AZUL 32 1/10 |
| 22012735 | | |
| 100 | |
| CERRO AZUL 33 1/10 |
| 22012736 | | |
| 100 | |
| CERRO AZUL 34 1/10 |
| 22012737 | | |
| 100 | |
| CERRO AZUL 35 1/5 |
| 22012738 | | |
| 50 | |
| CERRO AZUL 36 1/5 |
| 22012739 | | |
| 50 | |
| CERRO AZUL 37 1/5 |
| 22012740 | | |
| 50 | |
| CERRO AZUL 38 1/5 |
| 22012741 | | |
| 50 | |
| CERRO AZUL 39 1/5 |
| 22012742 | | |
| 25 | |
| CERRO AZUL A 1/10 |
| 22012608 | | |
| 100 | |
| CERRO AZUL B 1/5 |
| 22012609 | | |
| 50 | |
| CERRO AZUL PONIENTE A 1/5 |
| 22012610 | | |
| 50 | |
| CERRO AZUL PONIENTE B 1/10 |
| 22012611 | | |
| 100 | |
| CERRO AZUL PONIENTE C 1/10 |
| 22012612 | | |
| 100 | |
| CERRO AZUL PONIENTE D 1/10 |
| 22012613 | | |
| 100 | |
| CERRO AZUL PONIENTE E 1/5 |
| 22012614 | | |
| 50 | |
| CERRO AZUL PONIENTE F 1/5 |
| 22012615 | | |
| 50 | |
| CERRO AZUL PONIENTE G 1/5 |
| 22012616 | | |
| 50 | |
| CERRO AZUL PONIENTE H 1/10 |
| 22012617 | | |
| 100 | |
| CERRO AZUL PONIENTE I 1/10 |
| 22012618 | | |
| 100 | |
| CERRO IMAN 1/30 |
| 22011796 | | |
| 300 | |
| CERRO IMAN II 1/10 |
| 22011845 | | |
| 100 | |
| CERRO IMAN III 1/10 |
| 22011846 | | |
| 100 | |
| CERRO IMAN IV 1/5 |
| 22011847 | | |
| 50 | |
| CERRO IMAN IX 1/10 |
| 22012315 | | |
| 100 | |
| CERRO IMAN SUR 1/10 |
| 22014488 | | |
| 100 | |
| CERRO IMAN SUR 1/5 |
| 22012369 | | |
| 50 | |
| CERRO IMAN V 1/10 |
| 22011848 | | |
| 100 | |
| CERRO IMAN VI 1/10 |
| 22011849 | | |
| 100 | |
| CERRO IMAN VII 1/10 |
| 22011850 | | |
| 100 | |
| CERRO IMAN VIII 1/10 |
| 22012314 | | |
| 100 | |
| CERRO IMAN X 1/10 |
| 22012316 | | |
| 100 | |
| CERRO IMAN XI 1/10 |
| 22012317 | | |
| 100 | |
| CERRO IMAN XII 1/10 |
| 22012318 | | |
| 100 | |
| CERRO IMAN XIII 1/10 |
| 22012319 | | |
| 100 | |
| CERRO IMAN XIV 1/10 |
| 22012320 | | |
| 100 | |
| CERRO IMAN XV 1/10 |
| 22012321 | | |
| 100 | |
| CERRO IMAN XVII 1/10 |
| 22012450 | | |
| 100 | |
| CERRO IMAN XVIII 1/15 |
| 22012366 | | |
| 50 | |
| CHICA 15 1/20 |
| 22015443 | | |
| 200 | |
| CHICA 28 1/10 |
| 22015444 | | |
| 100 | |
| CHICA 29 1/20 |
| 22015445 | | |
| 200 | |
| CHICA 30 1/20 |
| 22015446 | | |
| 200 | |
| CHICA 31A 1/10 |
| 22015447 | | |
| 75 | |
| CHICA 31B 1/10 |
| 22015448 | | |
| 100 | |
| CHIQUILLA CHICA II 1/30 |
| 22014786 | | |
| 300 | |
| CHIQUILLA CHICA III 1/30 |
| 22014787 | | |
| 300 | |
| CHIQUILLA CHICA IV 1/30 |
| 22014788 | | |
| 300 | |
| CHIQUILLA CHICA IX 1/30 |
| 22014792 | | |
| 300 | |
| CHIQUILLA CHICA V 1/30 |
| 22014789 | | |
| 300 | |
| CHIQUILLA CHICA VI 1/30 |
| 22014790 | | |
| 300 | |
| Name |
National Roll | | |
Area (ha) | |
| CHIQUILLA CHICA VII 1/30 |
| 22014791 | | |
| 300 | |
| CHIQUILLA CHICA VIII 1/30 |
| 22014829 | | |
| 300 | |
| CHIQUILLA CHICA X 1/30 |
| 22014830 | | |
| 300 | |
| CHIQUILLA CHICA XI 1/30 |
| 22014793 | | |
| 300 | |
| CHIQUILLA CHICA XIX 1/30 |
| 22014798 | | |
| 300 | |
| CHIQUILLA CHICA XVI 1/30 |
| 22014832 | | |
| 300 | |
| CHIQUILLA CHICA XVII 1/30 |
| 22014833 | | |
| 300 | |
| CHIQUILLA CHICA XVIII 1/30 |
| 22014797 | | |
| 300 | |
| CHIQUILLA CHICA XX 1/30 |
| 22014799 | | |
| 300 | |
| CHIQUILLA CHICA XXIII 1/30 |
| 22014801 | | |
| 300 | |
| CHIQUILLA CHICA XXIX 1/30 |
| 22014804 | | |
| 300 | |
| CHIQUILLA CHICA XXVI 1/30 |
| 22014834 | | |
| 300 | |
| CHIQUILLA CHICA XXVII 1/30 |
| 22014802 | | |
| 300 | |
| CHIQUILLA CHICA XXVIII 1/30 |
| 22014803 | | |
| 300 | |
| CHIQUILLA CHICA XXX 1/30 |
| 22014805 | | |
| 300 | |
| DOMINADOR 1 1/20 |
| 22013109 | | |
| 100 | |
| DOMINADOR 1 1/5 |
| 22012743 | | |
| 50 | |
| DOMINADOR 2 1/20 |
| 22013110 | | |
| 100 | |
| DOMINADOR 2 1/5 |
| 22012744 | | |
| 50 | |
| DOMINADOR 3 1/20 |
| 22013111 | | |
| 100 | |
| DOMINADOR 4 1/10 |
| 22013112 | | |
| 50 | |
| DOMINADOR 4 1/15 |
| 22012745 | | |
| 150 | |
| EL PENON 10 1/20 |
| 22013491 | | |
| 100 | |
| EL PENON 11 1/20 |
| 22013492 | | |
| 100 | |
| EL PENON 12 1/20 |
| 22013493 | | |
| 100 | |
| EL PENON 13 1/30 |
| 22013494 | | |
| 150 | |
| EL PENON 14 1/50 |
| 22013495 | | |
| 250 | |
| EL PENON 15 1/40 |
| 22013496 | | |
| 200 | |
| EL PENON 16 1/40 |
| 22013497 | | |
| 200 | |
| EL PENON 17 1/10 |
| 22013498 | | |
| 50 | |
| EL PENON 18 1/10 |
| 22013650 | | |
| 50 | |
| EL PENON 18 1/50 |
| 22013518 | | |
| 250 | |
| EL PENON 19 1/60 |
| 22013519 | | |
| 300 | |
| EL PENON 20 1/60 |
| 22013520 | | |
| 300 | |
| EL PENON 21 1/60 |
| 22013521 | | |
| 300 | |
| EL PENON 22 1/60 |
| 22013522 | | |
| 300 | |
| EL PENON 23 1/60 |
| 22013523 | | |
| 300 | |
| EL PENON 24 1/60 |
| 22013524 | | |
| 300 | |
| EL PENON 25 1/40 |
| 22013525 | | |
| 200 | |
| EL PENON 26 1/60 |
| 22013526 | | |
| 300 | |
| EL PENON 27 1/60 |
| 22013527 | | |
| 300 | |
| EL PENON 28 1/60 |
| 22013528 | | |
| 300 | |
| EL PENON 29 1/60 |
| 22013529 | | |
| 300 | |
| EL PENON 3 1/20 |
| 22013482 | | |
| 100 | |
| EL PENON 30 1/60 |
| 22013530 | | |
| 300 | |
| EL PENON 31 1/60 |
| 22013531 | | |
| 300 | |
| EL PENON 32 1/40 |
| 22013532 | | |
| 200 | |
| EL PENON 33 1/60 |
| 22013533 | | |
| 300 | |
| EL PENON 34 1/60 |
| 22013534 | | |
| 300 | |
| EL PENON 35 1/60 |
| 22013535 | | |
| 300 | |
| EL PENON 36 1/60 |
| 22013536 | | |
| 300 | |
| 4 –Property Description and Location |
18 |
| Signature Date: March 25, 2021 |
|
Technical
Report El Peñón Mine, Chile
| Name |
National Roll | | |
Area (ha) | |
| EL PENON 37 1/40 |
| 22013537 | | |
| 200 | |
| EL PENON 38 1/40 |
| 22013538 | | |
| 200 | |
| EL PENON 39 1/60 |
| 22013539 | | |
| 300 | |
| EL PENON 4 1/20 |
| 22013483 | | |
| 100 | |
| EL PENON 40 1/60 |
| 22013540 | | |
| 300 | |
| EL PENON 41 1/60 |
| 22013541 | | |
| 300 | |
| EL PENON 42 1/40 |
| 22013543 | | |
| 200 | |
| EL PENON 42 1/60 |
| 22013542 | | |
| 300 | |
| EL PENON 43 1/40 |
| 22013544 | | |
| 200 | |
| EL PENON 44 1/60 |
| 22013545 | | |
| 300 | |
| EL PENON 45 1/60 |
| 22013546 | | |
| 300 | |
| EL PENON 46 1/60 |
| 22013547 | | |
| 300 | |
| EL PENON 5 1/10 |
| 22013484 | | |
| 50 | |
| EL PENON 6 1/10 |
| 22013485 | | |
| 50 | |
| EL PENON 7 1/40 |
| 22013488 | | |
| 200 | |
| EL PENON 8 1/60 |
| 22013489 | | |
| 300 | |
| EL PENON 9 1/50 |
| 22013490 | | |
| 250 | |
| ENCANTADA 1 1/60 |
| 22013964 | | |
| 300 | |
| ENCANTADA 12 1/60 |
| 22013968 | | |
| 300 | |
| ENCANTADA 13 1/60 |
| 22013969 | | |
| 300 | |
| ENCANTADA 14 1/60 |
| 22013970 | | |
| 300 | |
| ENCANTADA 15 1/60 |
| 22013971 | | |
| 300 | |
| ENCANTADA 16 1/60 |
| 22013972 | | |
| 300 | |
| ENCANTADA 18 1/40 |
| 22014110 | | |
| 200 | |
| ENCANTADA 2 1/40 |
| 22014109 | | |
| 200 | |
| ENCANTADA 21 1/60 |
| 22013975 | | |
| 300 | |
| ENCANTADA 22 1/20 |
| 22013976 | | |
| 100 | |
| ENCANTADA 3 1/60 |
| 22013965 | | |
| 300 | |
| ENCANTADA 44 1/17 |
| 22014270 | | |
| 85 | |
| ENCANTADA 5 1/40 |
| 22013967 | | |
| 200 | |
| FRANCISCA XIX 1/20 |
| 22014780 | | |
| 200 | |
| FRANCISCA XXIII 1/30 |
| 22014781 | | |
| 300 | |
| FRANCISCA XXIV 1/30 |
| 22014782 | | |
| 300 | |
| LA SUERTE 1/20 |
| 22014965 | | |
| 100 | |
| LAGUNA 1 1/60 |
| 22014099 | | |
| 300 | |
| LAGUNA 2 1/60 |
| 22014100 | | |
| 300 | |
| LAGUNA 3 1/60 |
| 22014101 | | |
| 300 | |
| LAGUNA 4 1/60 |
| 22014102 | | |
| 300 | |
| LAGUNA 5 1/60 |
| 22014103 | | |
| 300 | |
| LAGUNA 6 1/60 |
| 22014104 | | |
| 300 | |
| LAGUNA 7 1/60 |
| 22014105 | | |
| 300 | |
| LAS CONDES 1 1/40 |
| 22013147 | | |
| 200 | |
| LAS CONDES 10 1/10 |
| 22013156 | | |
| 50 | |
| LAS CONDES 11 1/10 |
| 22013157 | | |
| 50 | |
| LAS CONDES 2 1/30 |
| 22013148 | | |
| 150 | |
| LAS CONDES 3 1/20 |
| 22013149 | | |
| 100 | |
| LAS CONDES 4 1/60 |
| 22013150 | | |
| 300 | |
| LAS CONDES 5 1/60 |
| 22013151 | | |
| 300 | |
| LAS CONDES 6 1/30 |
| 22013152 | | |
| 150 | |
| LAS CONDES 7 1/30 |
| 22013153 | | |
| 150 | |
| LAS CONDES 8 1/60 |
| 22013154 | | |
| 300 | |
| Name |
National Roll | | |
Area (ha) | |
| LAS CONDES 9 1/60 |
| 22013155 | | |
| 300 | |
| LINA 1 1/60 |
| 22014251 | | |
| 300 | |
| LINA 10 1/10 |
| 22014260 | | |
| 50 | |
| LINA 11 1/40 |
| 22014455 | | |
| 200 | |
| LINA 12 1/60 |
| 22014456 | | |
| 300 | |
| LINA 14 1/10-21/40 |
| 22014457 | | |
| 150 | |
| LINA 2 1/60 |
| 22014252 | | |
| 300 | |
| LINA 3 1/20 |
| 22014253 | | |
| 100 | |
| LINA 4 1/60 |
| 22014254 | | |
| 300 | |
| LINA 5 1/60 |
| 22014255 | | |
| 300 | |
| LINA 6 1/60 |
| 22014256 | | |
| 300 | |
| LINA 7 1/20 |
| 22014257 | | |
| 100 | |
| LINA 8 1/30 |
| 22014258 | | |
| 150 | |
| LINA 9 1/30 |
| 22014259 | | |
| 150 | |
| LINEA 1 1/60 |
| 22014136 | | |
| 300 | |
| LINEA 2 1/60 |
| 22014137 | | |
| 300 | |
| LINEA 3 1/60 |
| 22014138 | | |
| 300 | |
| LINEA 4 1/60 |
| 22014139 | | |
| 300 | |
| LLANO 1 1/20 |
| 22014539 | | |
| 100 | |
| LLANO 10 1/20 |
| 22014548 | | |
| 100 | |
| LLANO 2 1/20 |
| 22014540 | | |
| 100 | |
| LLANO 3 1/20 |
| 22014541 | | |
| 100 | |
| LLANO 4 1/20 |
| 22014542 | | |
| 100 | |
| LLANO 5 1/20 |
| 22014543 | | |
| 100 | |
| LLANO 6 1/20 |
| 22014544 | | |
| 100 | |
| LLANO 7 1/20 |
| 22014545 | | |
| 100 | |
| LLANO 8 1/20 |
| 22014546 | | |
| 100 | |
| LLANO 9 1/20 |
| 22014547 | | |
| 100 | |
| LOBA 1 1/60 |
| 22014061 | | |
| 300 | |
| LOBA 3 1/60 |
| 22014063 | | |
| 300 | |
| LOBA 34 1/60 |
| 22014520 | | |
| 300 | |
| LOBA 35 1/60 |
| 22014519 | | |
| 300 | |
| LOBA 4 1/60 |
| 22014064 | | |
| 300 | |
| LOBA 5 1/60 |
| 22014065 | | |
| 300 | |
| LOBA 6 1/60 |
| 22014066 | | |
| 300 | |
| LOBA 7 1/40 |
| 22014067 | | |
| 200 | |
| LOBITA 1 1/40 |
| 22014002 | | |
| 200 | |
| LOBITA 23 1/40 |
| 22014024 | | |
| 200 | |
| LOBITA 24 1/60 |
| 22014025 | | |
| 300 | |
| LOBITA 25 1/60 |
| 22014026 | | |
| 300 | |
| LOBITA 3 1/60 |
| 22014004 | | |
| 300 | |
| LOBITA 38 1/60 |
| 22014106 | | |
| 300 | |
| LOBITA 39 1/60 |
| 22014035 | | |
| 300 | |
| LOBITA 4 1/60 |
| 22014005 | | |
| 300 | |
| LOBITA 40 1/60 |
| 22014036 | | |
| 300 | |
| LOBITA 41 1/60 |
| 22014037 | | |
| 300 | |
| LOBITA 42 1/60 |
| 22014038 | | |
| 300 | |
| LOBO 18 1/30 |
| 22016197 | | |
| 300 | |
| LOBO 19 1/30 |
| 22016196 | | |
| 300 | |
| LOBO 20 1/30 |
| 22016195 | | |
| 300 | |
| MAGICA 1 1/40 |
| 22016565 | | |
| 200 | |
| 4 –Property Description and Location |
19 |
| Signature Date: March 25, 2021 |
|
Technical
Report El Peñón Mine, Chile
| Name |
National Roll | | |
Area (ha) | |
| MAGICA 2 1/40 |
| 22016566 | | |
| 200 | |
| MERLIN 40 1/60 |
| 22016656 | | |
| 300 | |
| NADIAN 4A 1/40 |
| 22016169 | | |
| 200 | |
| NADIAN 4B 1/40 |
| 22016170 | | |
| 200 | |
| NADIAN 7A 1/60 |
| 22016171 | | |
| 300 | |
| NADIAN 7B 1/60 |
| 22016172 | | |
| 300 | |
| NADIAN 8A 1/60 |
| 22016173 | | |
| 300 | |
| NADIAN 8B 1/60 |
| 22016174 | | |
| 300 | |
| NADIAN 9A 1/40 |
| 22016175 | | |
| 200 | |
| NADO 1 1/60 |
| 22015529 | | |
| 300 | |
| NADO 10 1/60 |
| 22015538 | | |
| 300 | |
| NADO 11 1/60 |
| 22015539 | | |
| 300 | |
| NADO 12 1/60 |
| 22015540 | | |
| 300 | |
| NADO 13 1/60 |
| 22015541 | | |
| 300 | |
| NADO 14 1/60 |
| 22015542 | | |
| 300 | |
| NADO 15 1/60 |
| 22015543 | | |
| 300 | |
| NADO 16 1/60 |
| 22015544 | | |
| 300 | |
| NADO 17 1/60 |
| 22015545 | | |
| 300 | |
| NADO 18 1/60 |
| 22015546 | | |
| 300 | |
| NADO 19 1/60 |
| 22015547 | | |
| 300 | |
| NADO 2 1/60 |
| 22015530 | | |
| 300 | |
| NADO 20 1/60 |
| 22015548 | | |
| 300 | |
| NADO 21 1/60 |
| 22015549 | | |
| 300 | |
| NADO 22 1/60 |
| 22015550 | | |
| 300 | |
| NADO 23 1/20 |
| 22015551 | | |
| 100 | |
| NADO 24 1/40 |
| 22015552 | | |
| 200 | |
| NADO 25 1/60 |
| 22015553 | | |
| 300 | |
| NADO 26 1/60 |
| 22015554 | | |
| 300 | |
| NADO 27 1/60 |
| 22015555 | | |
| 300 | |
| NADO 3 1/60 |
| 22015531 | | |
| 300 | |
| NADO 4 1/60 |
| 22015532 | | |
| 300 | |
| NADO 5 1/60 |
| 22015533 | | |
| 300 | |
| NADO 6 1/60 |
| 22015534 | | |
| 300 | |
| NADO 7 1/60 |
| 22015535 | | |
| 300 | |
| NADO 8 1/60 |
| 22015536 | | |
| 300 | |
| NADO 9 1/60 |
| 22015537 | | |
| 300 | |
| NIVA 3 1/60 |
| 22025455 | | |
| 300 | |
| NIVA 4 1/60 |
| 22025456 | | |
| 300 | |
| NIVA 7 1/40 |
| 22025457 | | |
| 200 | |
| PAISAJE 1 1/20 |
| 22013208 | | |
| 100 | |
| PAISAJE 1 1/40 |
| 22013651 | | |
| 200 | |
| PAISAJE 11 1/60 |
| 22013661 | | |
| 300 | |
| PAISAJE 12 1/60 |
| 22013662 | | |
| 300 | |
| PAISAJE 13 1/20 |
| 22013663 | | |
| 100 | |
| PAISAJE 14 1/20 |
| 22013664 | | |
| 100 | |
| PAISAJE 18 1/60 |
| 22013668 | | |
| 300 | |
| PAISAJE 19 1/60 |
| 22013669 | | |
| 300 | |
| PAISAJE 2 1/40 |
| 22013652 | | |
| 200 | |
| PAISAJE 20 1/40 |
| 22013670 | | |
| 200 | |
| PAISAJE 21 1/40 |
| 22013671 | | |
| 200 | |
| PAISAJE 22 1/40 |
| 22013672 | | |
| 200 | |
| Name |
National Roll | | |
Area (ha) | |
| PAISAJE 23 1/40 |
| 22013962 | | |
| 200 | |
| PAISAJE 24 1/40 |
| 22013963 | | |
| 200 | |
| PAISAJE 3 1/40 |
| 22013653 | | |
| 200 | |
| PAISAJE 4 1/40 |
| 22013654 | | |
| 200 | |
| PAISAJE 5 1/40 |
| 22013655 | | |
| 200 | |
| PAISAJE 6 1/40 |
| 22013656 | | |
| 200 | |
| PAMPA 4 1/60 |
| 22014730 | | |
| 300 | |
| PAMPA 5 1/60 |
| 22014731 | | |
| 300 | |
| PAMPA 6 1/40 |
| 22014732 | | |
| 200 | |
| PAMPA 7 1/60 |
| 22014733 | | |
| 300 | |
| PAMPA 8 1/60 |
| 22014734 | | |
| 300 | |
| PAMPA 9 1/60 |
| 22014735 | | |
| 300 | |
| PAMPA AUGUSTA I 1/59 |
| 22015271 | | |
| 292 | |
| PENON 50 1/10 |
| 22013977 | | |
| 50 | |
| PENON 51 1/20 |
| 22013978 | | |
| 100 | |
| PENON 53 1/60 |
| 22013980 | | |
| 300 | |
| PENON 54 1/60 |
| 22013981 | | |
| 300 | |
| PENON 55 1/60 |
| 22013982 | | |
| 300 | |
| PENON 56 1/60 |
| 22013983 | | |
| 300 | |
| PENON 57 1/60 |
| 22013984 | | |
| 300 | |
| PENON 58 1/60 |
| 22013985 | | |
| 300 | |
| PENON 59 1/60 |
| 22013986 | | |
| 300 | |
| PENON 60 1/60 |
| 22013987 | | |
| 300 | |
| PENON 61 1/40 |
| 22013988 | | |
| 200 | |
| PENON 62 1/40 |
| 22013989 | | |
| 200 | |
| PENON 63 1/20 |
| 22013990 | | |
| 100 | |
| PROVIDENCIA 1 1/40 |
| 22013073 | | |
| 200 | |
| PROVIDENCIA 1 II 1/30 |
| 22013556 | | |
| 300 | |
| PROVIDENCIA 1 II 31/60 |
| 22013557 | | |
| 300 | |
| PROVIDENCIA 1 II 61/90 |
| 22013558 | | |
| 300 | |
| PROVIDENCIA 1 II 91/120 |
| 22013559 | | |
| 300 | |
| PROVIDENCIA 10 1/10 |
| 22013082 | | |
| 50 | |
| PROVIDENCIA 11 1/10 |
| 22013083 | | |
| 50 | |
| PROVIDENCIA 2 1/30 |
| 22013074 | | |
| 150 | |
| PROVIDENCIA 2 II 1/40 |
| 22013561 | | |
| 400 | |
| PROVIDENCIA 3 1/20 |
| 22013075 | | |
| 100 | |
| PROVIDENCIA 3 II 1/30 |
| 22013562 | | |
| 300 | |
| PROVIDENCIA 3 II 121/150 |
| 22013566 | | |
| 300 | |
| PROVIDENCIA 3 II 31/60 |
| 22013563 | | |
| 300 | |
| PROVIDENCIA 3 II 61/90 |
| 22013564 | | |
| 300 | |
| PROVIDENCIA 3 II 91/120 |
| 22013565 | | |
| 300 | |
| PROVIDENCIA 4 1/60 |
| 22013076 | | |
| 300 | |
| PROVIDENCIA 4 II 1/40 |
| 22013567 | | |
| 400 | |
| PROVIDENCIA 4 II 41/80 |
| 22013568 | | |
| 400 | |
| PROVIDENCIA 5 1/60 |
| 22013077 | | |
| 300 | |
| PROVIDENCIA 5 II 1/10 |
| 22013569 | | |
| 100 | |
| PROVIDENCIA 5 II 31/40 |
| 22013570 | | |
| 100 | |
| PROVIDENCIA 5 II 61/70 |
| 22013571 | | |
| 100 | |
| PROVIDENCIA 6 1/30 |
| 22013078 | | |
| 150 | |
| PROVIDENCIA 7 1/30 |
| 22013079 | | |
| 150 | |
| PROVIDENCIA 8 1/60 |
| 22013080 | | |
| 300 | |
| 4 –Property Description and Location |
20 |
| Signature Date: March 25, 2021 |
|
Technical
Report El Peñón Mine, Chile
| Name |
National Roll | | |
Area (ha) | |
| PROVIDENCIA 9 1/60 |
| 22013081 | | |
| 300 | |
| PUNTA BLANCA 1 1/30 |
| 22015474 | | |
| 300 | |
| PUNTA BLANCA 2 1/30 |
| 22015475 | | |
| 300 | |
| PUNTA BLANCA 3 1/30 |
| 22015476 | | |
| 300 | |
| SERRUCHO 1 1/60 |
| 22013591 | | |
| 300 | |
| SERRUCHO 2 1/60 |
| 22013592 | | |
| 300 | |
| SERRUCHO 3 1/60 |
| 22013593 | | |
| 300 | |
| SERRUCHO 4 1/20 |
| 22014600 | | |
| 100 | |
| SERRUCHO 5 1/20 |
| 22014601 | | |
| 100 | |
| TACO 1 1/20 |
| 22014154 | | |
| 100 | |
| TOSTADO 1 1/60 |
| 22013145 | | |
| 300 | |
| TOSTADO 1 1/60 |
| 22013612 | | |
| 300 | |
| TOSTADO 10 1/60 |
| 22013621 | | |
| 300 | |
| TOSTADO 11 1/20 |
| 22013622 | | |
| 100 | |
| TOSTADO 12 1/40 |
| 22013623 | | |
| 200 | |
| TOSTADO 13 1/20 |
| 22013624 | | |
| 100 | |
| TOSTADO 15 1/40 |
| 22013626 | | |
| 200 | |
| TOSTADO 16 1/60 |
| 22013627 | | |
| 300 | |
| TOSTADO 17 1/20 |
| 22013628 | | |
| 100 | |
| TOSTADO 18 1/40 |
| 22013629 | | |
| 200 | |
| TOSTADO 19 1/60 |
| 22013630 | | |
| 300 | |
| TOSTADO 2 1/20 |
| 22013146 | | |
| 100 | |
| TOSTADO 2 1/60 |
| 22013613 | | |
| 300 | |
| TOSTADO 20 1/60 |
| 22013631 | | |
| 300 | |
| TOSTADO 21 1/20 |
| 22013632 | | |
| 100 | |
| TOSTADO 22 1/60 |
| 22013633 | | |
| 300 | |
| TOSTADO 23 1/40 |
| 22013635 | | |
| 200 | |
| TOSTADO 24 1/60 |
| 22014186 | | |
| 300 | |
| TOSTADO 25 1/40 |
| 22014187 | | |
| 200 | |
| TOSTADO 3 1/60 |
| 22013614 | | |
| 300 | |
| TOSTADO 4 1/60 |
| 22013615 | | |
| 300 | |
| TOSTADO 5 1/60 |
| 22013616 | | |
| 300 | |
| TOSTADO 6 1/60 |
| 22013617 | | |
| 300 | |
| TOSTADO 7 1/20 |
| 22013618 | | |
| 100 | |
| TOSTADO 8 1/40 |
| 22013619 | | |
| 200 | |
| TOSTADO 9 1/60 |
| 22013620 | | |
| 300 | |
| VERDE 4 6/10-16/20 |
| 22014317 | | |
| 50 | |
| Total: 443 claims |
| | | |
| 92,387 | |
| 4 –Property Description and Location |
21 |
| Signature Date: March 25, 2021 |
|
Technical
Report El Peñón Mine, Chile
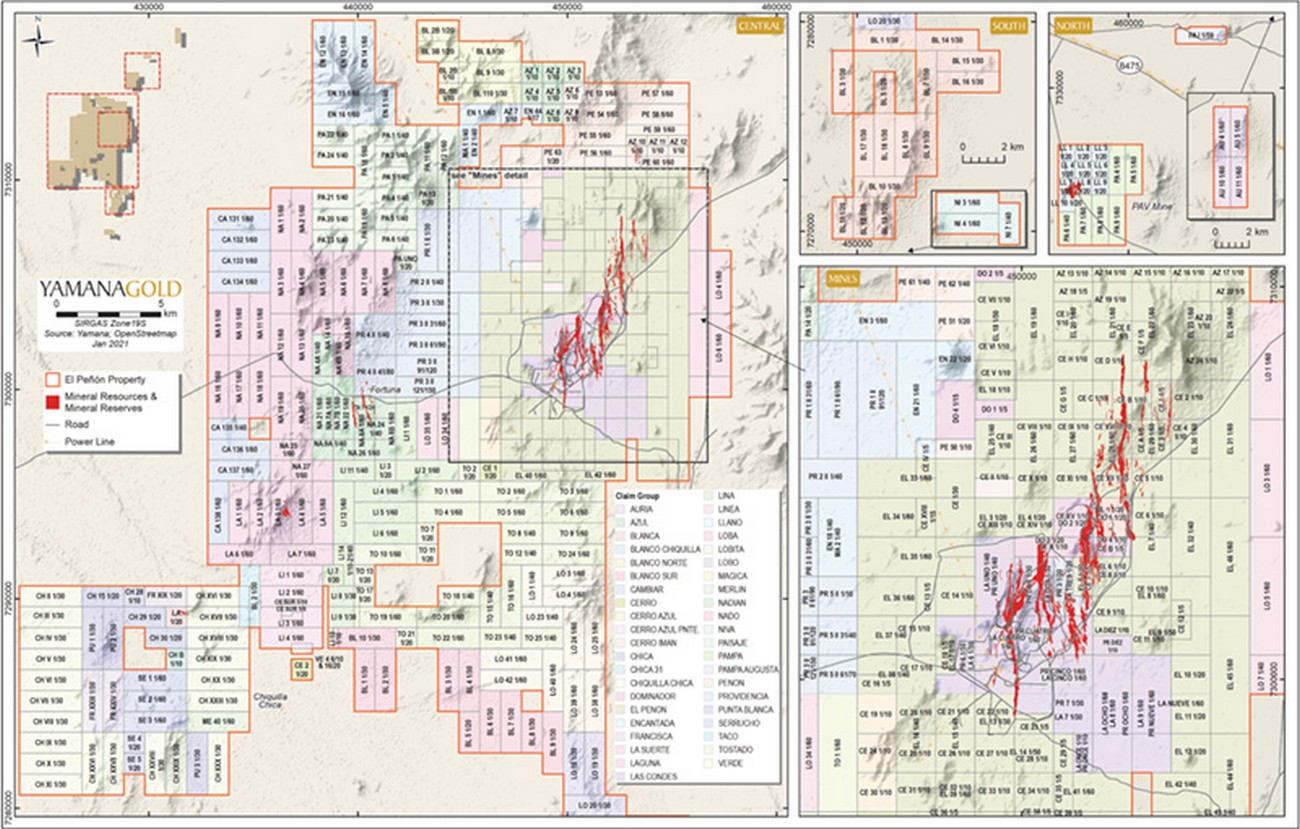
Figure
4-3: Detailed map of mineral tenure
| 4 –Property Description and Location |
22 |
| Signature Date: March 25, 2021 |
|
Technical
Report El Peñón Mine, Chile
A
2% Net Smelter Return (NSR) royalty is payable to Maverix Metals Inc. as agreed as part of the purchase of the Nado claims covering
the Fortuna area and a further 2% NSR is payable to Soquimich Comercial SA for claims Providencia 1, 2, 3, 4, and 5 and claims
Dominador 1, 2, and 4. These claims are also located in the Fortuna area.
| 4.3 | Permits
and Authorizations |
Minera
Meridian has all required permits to continue carrying out mining and processing operations at El Peñón. Further
details of these permits can be found in Section 20 of this technical report.
Government
regulations require that a full closure plan be submitted when mine life is less than five years. The latest closure plan was
approved through Exempt Resolution Nº 2658/2019. Updates to the closure plan are required whenever the life of mine is extended.
| 4.4 | Environmental
Considerations |
The
primary environmental considerations and potential liabilities for El Peñón are related to the operations of the
tailings storage facility (TSF) and the management of seepage water and mine water. Yamana prioritizes the management of tailings
and is in the process of aligning the company’s tailings management system with best practices developed by the Mining Association
of Canada (MAC), Canadian Dam Association (CDA) guidelines, and other international standards.
Additional
details on tailings infrastructure and management at El Peñón are provided in Sections 17.11 and 20 of this technical
report.
The
qualified person responsible for this section is not aware of any other significant factors and risks that may affect access,
title, or the right or ability to perform mining and exploration work on the property.
| 4 –Property Description and Location |
23 |
| Signature Date: March 25, 2021 |
|
Technical
Report El Peñón Mine, Chile
| 5 | Accessibility,
Climate, Local
Resources, Infrastructure,
and Physiography |
El
Peñón is located approximately 165 km southeast of Antofagasta. It is accessible by paved roads, a trip taking approximately
2.5 hours. Antofagasta, the principal source of supplies for the mine, is linked to Santiago (the capital) by daily air service.
Minera Meridian has surface rights deemed sufficient for mining and processing operations.
The
climate in the Atacama Desert is renowned as among the most arid in the world, with a mean annual precipitation between 0 and
15 mm per year, with some areas with no precipitation whatsoever. Temperatures in the area close to the mine can range from -5°C
to +30°C. Climatic conditions do not hinder mining operations, which can be carried out throughout the whole year.
There
are no significant population centres or infrastructure in the immediate vicinity of El Peñón. Antofagasta, a port
city with a population of 380,000, is the main supply source for the mine. It hosts a variety of commercial establishments, hotels,
restaurants, retailers, service suppliers, high schools, and universities as well as hospitals and health clinics. The city also
hosts a large number of manufacturing companies and suppliers who serve the mining industry.
Skilled
personnel can be easily sourced from Antofagasta or from other cities of the region and country, where mining is the main economic
activity.
The
current major assets and facilities associated with the mining operations at El Peñón are listed as follows:
| • | Mine
and mill infrastructure including office buildings, shops, laboratories, stockpiles,
tailing storage facility, and equipment. |
| • | Campsite/housing
facilities |
| • | Facilities
providing basic infrastructure to the mine, such as access roads, electric power distribution
systems connected to national power grid, water treatment and supply and sewage treatment. |
| • | Underground
infrastructure including portals, access ramps, ventilation raises, maintenance shops,
and mobile fleet equipment. |
| • | The
open-pit infrastructure including haulage roads, ramps, and mobile fleet equipment. |
5
–Accessibility, Climate, Local Resources, Infrastructure, and Physiography
|
24 |
| Signature Date: March 25, 2021 |
|
Technical
Report El Peñón Mine, Chile
The
mine is located in the Atacama Desert region of Chile at an elevation of approximately 1,800 masl. Relief in the area is modest,
with widely spaced hills and peaks separated by broad open valleys. There is little to no vegetation or wildlife in the area around
the mine, and the principal land use is mining.

Figure
5-1: Infrastructure and typical landscape
| A. | Atacama
Desert and mineral processing plant |
| C. | Mine
site overview at surface and Atacama Desert
|
5
–Accessibility, Climate, Local Resources, Infrastructure, and Physiography |
25 |
| Signature Date: March 25, 2021 |
|
Technical
Report El Peñón Mine, Chile
The
history of El Peñón has been described in Pearson and Rennie (2008) and Collins, Moore and Scott (2010). Information
from both reports is summarized below.
The
El Peñón gold-silver deposit was discovered by Meridian Gold in the early 1990s and went into production in 1998.
Meridian Gold was acquired by Yamana in late 2007.
Regional
exploration throughout the 1990s focussed on Early to Mid-Eocene volcanic belts in northern Chile and led to the acquisition of
the El Peñón property in 1993. Trenching carried out that year was followed by a 13-hole drilling program which
led to the discovery of significant gold-silver mineralization. The next year, the first hole of a follow-up program intersected
100 m grading 10.9 g/t Au and 123.4 g/t Ag in what eventually became the Quebrada Orito deposit.
Various
geological, petrographic, and mineralogical studies occurred during the exploration and operation stages of the project. These
include Pérez (1999), Robbins (2000), Warren et al. (2004), Zuluaga (2004), Warren (2005), and Cornejo et al. (2006). Various
geophysical surveys were performed on the property including transient electromagnetic (TEM) surveys in 2001, a magnetotelluric
(CSAMT) survey in 2002, a gravity survey in the El Peñón area in 2003, a very low frequency (VLF) electromagnetic
(EM) survey in 2004, and an aeromagnetic and radiometric survey in the El Peñón and Amancaya areas in 2005. Geochemical
soil sampling was also undertaken in targeted areas of the deposit. The geophysical and geochemical surveys provided key data
to map the lithology, alteration, and structures on the El Peñón property.
Between
1993 and 2007, 1,052,996 metres of exploration drilling and 649,639 metres of infill drilling were carried out for a total of
1,702,635 metres drilled. Additional details on drilling at El Peñón are provided in Section 10 of this technical
report
In
July 1998, it was decided to advance the property into production, and construction on a 2,000 tpd mine and mill facility commenced
later that year. Production began in September 1999, ramping up to full capacity by January 2000. Production has continued uninterrupted
to the present day.
| 6.1 | Historical
Mineral Resource
and Mineral Reserve
Estimates |
Although
a number of historical mineral resource estimates and mineral reserve estimates have been prepared for El Peñón
throughout its life, none of these estimates are currently regarded as significant.
| 6
–History |
26 |
| Signature Date: March 25, 2021 |
|
Technical
Report El Peñón Mine, Chile
Since
September 1999, the operation has run continually at design and increased capacity, treating both open-pit and underground ore.
As of December 31, 2020, the mine had processed approximately 23.7 million tonnes (Mt) of ore grading 7.46 g/t gold and 202.7
g/t silver, producing 5.4 million ounces (Moz) of gold and 134.0 Moz of silver, as shown in Table 6-1. In late 2016, Yamana
decided to rightsize the El Peñón operation at a production rate of approximately 150 to 160 koz gold and 4,000
to 4,500 koz silver per year, to promote cash flow generation rather than maximizing production.
Table
6-1: Commercial production at El Peñón, January 2000 to December 31, 2020
| Year | | |
Processed
Tonnes | | |
Au
Feed
Grade
(g/t) | | |
Ag
Feed
Grade
(g/t) | | |
Au
Recovery
(%) | | |
Ag
Recovery
(%) | | |
Au
Production
(oz) | | |
Ag
Production
(oz) | |
| 2000 | | |
| 739,450 | | |
| 13.18 | | |
| 194.4 | | |
| 93.6 | | |
| 89.1 | | |
| 282,718 | | |
| 4,018,397 | |
| 2001 | | |
| 715,413 | | |
| 14.87 | | |
| 234.4 | | |
| 94.5 | | |
| 89.0 | | |
| 318,012 | | |
| 4,751,758 | |
| 2002 | | |
| 688,876 | | |
| 15.33 | | |
| 249.5 | | |
| 95.3 | | |
| 90.8 | | |
| 328,061 | | |
| 5,077,188 | |
| 2003 | | |
| 703,775 | | |
| 14.62 | | |
| 204.5 | | |
| 96.6 | | |
| 92.4 | | |
| 320,998 | | |
| 4,283,436 | |
| 2004 | | |
| 837,111 | | |
| 11.96 | | |
| 192.7 | | |
| 96.5 | | |
| 92.2 | | |
| 314,080 | | |
| 4,812,152 | |
| 2005 | | |
| 880,229 | | |
| 11.13 | | |
| 211.1 | | |
| 96.4 | | |
| 92.8 | | |
| 303,508 | | |
| 5,537,589 | |
| 2006 | | |
| 935,105 | | |
| 8.10 | | |
| 234.6 | | |
| 95.5 | | |
| 92.8 | | |
| 230,145 | | |
| 6,428,905 | |
| 20071 | | |
| 998,252 | | |
| 7.64 | | |
| 274.6 | | |
| 94.2 | | |
| 91.8 | | |
| 234,598 | | |
| 8,186,718 | |
| 2008 | | |
| 1,124,567 | | |
| 6.73 | | |
| 305.4 | | |
| 92.0 | | |
| 89.2 | | |
| 224,990 | | |
| 9,864,275 | |
| 2009 | | |
| 1,271,596 | | |
| 5.79 | | |
| 276.3 | | |
| 91.2 | | |
| 86.9 | | |
| 215,846 | | |
| 9,820,474 | |
| 2010 | | |
| 1,522,366 | | |
| 5.74 | | |
| 228.5 | | |
| 91.1 | | |
| 84.1 | | |
| 256,530 | | |
| 9,427,207 | |
| 2011 | | |
| 1,452,090 | | |
| 7.05 | | |
| 215.9 | | |
| 93.0 | | |
| 84.0 | | |
| 306,184 | | |
| 8,470,112 | |
| 2012 | | |
| 1,415,292 | | |
| 7.47 | | |
| 199.2 | | |
| 93.4 | | |
| 80.0 | | |
| 317,508 | | |
| 7,249,430 | |
| 2013 | | |
| 1,422,055 | | |
| 7.94 | | |
| 187.2 | | |
| 93.0 | | |
| 75.6 | | |
| 338,231 | | |
| 6,464,623 | |
| 2014 | | |
| 1,475,857 | | |
| 6.36 | | |
| 212.0 | | |
| 93.3 | | |
| 83.9 | | |
| 282,617 | | |
| 8,475,133 | |
| 2015 | | |
| 1,418,132 | | |
| 5.32 | | |
| 194.0 | | |
| 93.6 | | |
| 86.9 | | |
| 227,228 | | |
| 7,692,811 | |
| 2016 | | |
| 1,421,243 | | |
| 5.11 | | |
| 153.9 | | |
| 94.3 | | |
| 85.7 | | |
| 220,209 | | |
| 6,020,758 | |
| 2017 | | |
| 1,041,199 | | |
| 5.05 | | |
| 148.3 | | |
| 95.1 | | |
| 86.4 | | |
| 160,510 | | |
| 4,282,339 | |
| 2018 | | |
| 1,103,835 | | |
| 4.53 | | |
| 131.3 | | |
| 94.1 | | |
| 83.6 | | |
| 151,893 | | |
| 3,903,961 | |
| 2019 | | |
| 1,290,239 | | |
| 4.09 | | |
| 120.6 | | |
| 94.0 | | |
| 86.2 | | |
| 159,515 | | |
| 4,317,292 | |
| 2020 | | |
| 1,266,829 | | |
| 4.22 | | |
| 138.9 | | |
| 93.7 | | |
| 86.7 | | |
| 160,824 | | |
| 4,917,101 | |
| Total | | |
| 23,723,511 | | |
| 7.46 | | |
| 202.7 | | |
| 93.8 | | |
| 86.3 | | |
| 5,354,205 | | |
| 134,001,658 | |
| 1. | Acquisition
by Yamana in late 2007 |
| 6
–History |
27 |
| Signature Date: March 25, 2021 |
|
Technical
Report El Peñón Mine, Chile
| 7 | Geological
Setting and
Mineralization |
The
geological setting and mineralization of El Peñón are described in Robbins (2000) and in former technical reports
on El Peñón (Pearson and Rennie (2008); Collins, Moore, and Scott (2010)). The most recent update to the regional
and district geology is outlined in the Aguas Blancas (Ferrando et al., 2013) and Augusta Victoria (Astudillo et al., 2017) geological
maps by SERNAGEOMIN, the Chilean National Geology and Mining Service. This section is based on these reports and maps.
El
Peñón is located in the Central Depression (also known as the Central or Longitudinal Valley), that extends for
650 km from the Chile-Peru border in the north to south-central Chile in the south. In the Atacama Desert, this valley corresponds
in part to a Late Cretaceous to Paleogene volcanic belt that separates the Mesozoic magmatic arc, exposed in the Coast Mountains
located to the west, from the Paleozoic and Triassic volcanic and sedimentary assemblages of the Domeyko Cordillera to the east.
The
Late Cretaceous to Eocene volcanic and intrusive rocks within the Central Depression consist of an alkali-enriched calk-alkaline
bimodal suite. Rocks consist of basaltic andesite to rhyolitic lavas and tuffs, subvolcanic porphyritic intrusions, and granitoid
stocks. This belt is host to many epithermal deposits and subvolcanic porphyry systems.
Late
Cretaceous volcanic and volcaniclastic rocks were deposited in narrow fault-bounded extensional basins (84 Ma to 65 Ma). The margins
of the basins were intruded by dioritic to monzonitic plutons. Compressive tectonism, active from 65 Ma to 62 Ma, resulted in
the inversion of the Late Cretaceous basins, uplift and erosion of Late Cretaceous plutonic rocks to the west of the basin, and
syn-tectonic magmatism along the basin-bounding faults.
Volcanism
continued through the Paleocene and into the Middle Eocene, with mafic to felsic magmatism depositing flows, volcaniclastic, epiclastic,
and subvolcanic rocks. A sequence of late Paleocene felsic domes, tuffs, and subvolcanic rocks is associated with the hydrothermal
veining and brecciation responsible mineralization at El Peñón. These rocks are overlain by Eocene volcanic and
subvolcanic rocks (rhyolitic dome complexes, andesites and basalts) that host significant areas of acid sulphate or high-sulphidation
alteration.
Deformation
occurred in the Middle to Late Eocene with uplift of the pre-Cordillera, triggering copper porphyry emplacement further to the
east. Low-angle offset of the El Peñón vein system occurred during this period.
7
–Geological Setting and Mineralization
|
28 |
| Signature Date: March 25, 2021 |
|
Technical
Report El Peñón Mine, Chile

Figure
7-1: Regional geological setting
The
local area is underlain by a fault-bounded north-south trending panel of Paleocene to Eocene volcanic rocks. This panel is bounded
to the east and west by rocks of Permian to Cretaceous age. Formation names and ages as reported below are from updated extensive
recent work by the Servicio Nacional de Geología y Minería (SERNAGEOMIN), which resulted in significant changes
from stratigraphic divisions reported in earlier reports (Robbins, 2000). The Cretaceous sequence (95-90 Ma) dominates and consists
of volcanic and minor sedimentary rocks of the Paradero del Desierto Strata Formation and continental sedimentary and volcanic
rocks Quebrada Mala Formation. The Paradero del Desierto Strata outcrops northwest of the deposit area. The Upper Cretaceous Quebrada
Mala Formation is present to the west, north, and northeast of El Peñón; it consists of volcanic rocks varying in
composition from basaltic andesite to high-silica rhyolite; textures vary from flows to ignimbrites (Astudillo et al, 2017; Ferrando
et al., 2013). Ignimbrites and other rock types formerly assigned to the Augusta Vitoria Formation are now included in the Quebrada
Mala Formation. Away from the deposit, these rocks are intruded by large granitic to dioritic stocks dated at between 40 and 50
Ma.
7
–Geological Setting and Mineralization
|
29 |
| Signature Date: March 25, 2021 |
|
Technical
Report El Peñón Mine, Chile
The
geology of the El Peñón deposit area is characterized by the emplacement of a Paleocene to Lower Eocene dacite/rhyolite
dome complex into volcanic and tuffaceous rocks of the Chile Alemania Formation (Figure 7-2).
The
kilometre-scale Paleocene to Lower Eocene dome consists of several layers or sill-like masses of rhyolite, up to 200 m-thick,
intercalated with units of pyroclastic rocks, volcaniclastic rocks, and volcanic flows or intermediate composition assigned to
the Chile Alemania Formation (Ferrando et al., 2013; Figure 7-3); these are interpreted to provide important lithological controls
for development of vein mineralization.
Extensive
colluvium, alluvial gravel, and saline crust deposits cover the bedrock.
The
main rock types in the area are described in Table 7-1. The local and property-scale geology of the El Peñón property
is illustrated in Figure 7-2.
Table
7-1: Description of main lithologies
| Age |
|
Formation |
|
Description |
| Cretaceous
to Eocene |
|
|
|
Diorite
and monzonite intrusions |
| |
|
|
|
|
| Paleocene
to Lower Eocene |
|
Chile
Alemania Formation |
|
Basalt,
andesite, dacite, and rhyolite volcanic rocks. Flow breccia, pyroclastic rocks, and minor epiclastic volcanic sandstone and
conglomerate. Prominent rhyolite to dacite domes and highly welded ignimbrites that host mineralization. |
| |
|
|
|
|
| Upper
Cretaceous |
|
Quebrada
Mala Formation |
|
Andesitic
lavas, breccia volcaniclastic and epiclastic sandstone, rhyolite and dacite with characteristic quartz phenocrysts. |
| |
|
|
|
|
| Lower
Cretaceous |
|
Estratos
de Paradero del Desierto |
|
Fluvial
sandstone, volcanic breccia, andesitic lava, with some dacitic tuff. |
7
–Geological Setting and Mineralization
|
30 |
| Signature Date: March 25, 2021 |
|
Technical
Report El Peñón Mine, Chile

Figure
7-2: Local and property geology
7
–Geological Setting and Mineralization
|
31 |
| Signature Date: March 25, 2021 |
|
Technical
Report El Peñón Mine, Chile
Surface
exposures at El Peñón are not common, and much of the mapping for the area is based on float. The property is mostly
underlain by Late Cretaceous to Early Eocene pyroclastic flows and lavas, volcaniclastic breccias, and tuffs of basaltic to rhyolitic
composition. Several thin Early Cretaceous rhyolite tuff and dacite to andesite flow layers occur in the northern part of the
property. These rocks are intruded by Late Cretaceous diorite and monzodiorite stocks and dacite domes.
The
rocks hosting gold-silver mineralization at El Peñón are near-horizontal to gently dipping Paleocene to Eocene basaltic
to rhyolitic volcanic rocks. The stratigraphy consists of a lower sequence of volcanic breccias and andesitic to basaltic flows
overlain by rhyolitic to dacitic pyroclastic rocks, dacitic to andesitic flows, and volcanic breccias. Rhyolitic intrusions, domes,
and associated flows are intercalated with earlier volcanic units.
The
distribution of Cretaceous and Eocene volcanic rocks is controlled by graben structures bounded by north–northeast-trending
faults. These are steeply dipping regional-scale structures with displacements in the order of hundreds of metres. The dominant
orientation of late dykes and many of the highest-grade mineralized faults is parallel to the bounding faults. Mineralized faults
dip steeply eastward on the east side of the property and westward on the west side, in a distribution interpreted as a horst/graben
extensional structure (Figure 7-3).
Most
of the mining takes place along north-trending veins (dipping 75°–85° W or 55°–80° E). A relatively
minor amount of production has also taken place along northeast-striking structures dipping 65°NW. Locally, northeast-trending
shallow-dipping faults dipping 20°SE displace the veins.
7
–Geological Setting and Mineralization
|
32 |
| Signature Date: March 25, 2021 |
|
Technical
Report El Peñón Mine, Chile

Figure
7-3: Schematic geological plan and cross-sections of the El Peñón deposit
7
–Geological Setting and Mineralization
|
33 |
| Signature Date: March 25, 2021 |
|
Technical
Report El Peñón Mine, Chile
The
gold-silver mineralization at El Peñón is hosted in near-horizontal to gently dipping Paleocene to Eocene basaltic
to rhyolitic volcanic rocks. The El Peñón deposit comprises many individual tabular and steeply dipping zones that
are amenable to mining by both underground and surface methods. Vein thickness range from decimetre-scale to more than 20 metres.
The strike length of individual mineralized zones ranges from less than 1 km to 4 km and the down-dip extent reaches up to 350
m. Photographs depicting examples of the gold-silver mineralization at El Peñón are presented in Figure 7-4.
The
known deposit consists of 19 main vein zones and many subsidiary veins. They are grouped in vein systems that have previously
supported, currently support, or are planned to support surface and underground mining operations. The 19 principal mineralized
veins are listed as follows:
| • | Pampa
Augusta Vitoria (PAV) |
| • | Pampa
Campamento/ Sorpresa |
The
veins strike predominantly north-south and dip steeply to the east and west. A small proportion of the deposit is also hosted
in fault zones striking north–northeast to northeast.
Vein
textures often display crustiform textures, although the highest-grade gold and silver mineralization are associated with massive
banded quartz-adularia. Gangue minerals occur as open space filling as well as replacements of primary host rock mineral phases.
Gold
and silver mineralization occurs as disseminated electrum, acanthite, native gold, native silver, silver sulphosalts, and silver
halides; these minerals are hosted in a gangue dominated by quartz, adularia, carbonate, and clay. Precious metals occur mainly
as micron- to millimetre-size subrounded and irregular grains of electrum. Two phases of electrum are present: a primary phase,
which contains approximately 55 to 65% gold, and a secondary phase where the gold content is usually greater than 95%, due to
the supergene remobilization of silver.
Sulphide
minerals are relatively rare, except at the northeastern portion of the El Peñón mine area. This paucity of sulphides
may be due to oxidation, or to an initial overall low abundance of sulphides as would be expected in a low-sulphidation environment.
Iron- and manganese-oxyhydroxides are common, with only trace occurrences of relict sulphides. In order of abundance, trace amounts
of pyrite, galena, sphalerite, chalcocite and covellite occur locally.
7
–Geological Setting and Mineralization
|
34 |
| Signature Date: March 25, 2021 |
|
Technical
Report El Peñón Mine, Chile
Age-dating
of adularia from the veins at El Peñón suggests that mineralization took place at around 52 Ma to 53 Ma (Early Eocene).
Two mineralization and alteration events have been defined from fluid inclusion studies. The principal mineralization event resulted
from circulation of neutral reduced fluids that replaced host-rock phenocrysts and groundmass by quartz, adularia, albite, carbonate,
clays, calcite, and chlorite. It also produced quartz-adularia flooding and breccia-filling in the vicinity of the veins. Another,
more widespread, alteration process was derived from acidic oxidized hydrothermal solutions. This event resulted in the formation
of lithocaps of quartz-alunite alteration, quartz-alunite breccia-filling, with minor copper and silver and little or no gold.

Figure
7-4: Photographs of mineralization in underground exposures and in drill core
7
–Geological Setting and Mineralization
|
35 |
| Signature Date: March 25, 2021 |
|
Technical
Report El Peñón Mine, Chile
El
Peñón is classified as a low- to intermediate-sulphidation epithermal gold-silver deposit associated with steeply
dipping fault-controlled veins emplaced following rhyolite dome emplacement. Gold and silver mineralization consists of disseminations
of electrum, native gold and silver, acanthite, silver sulphosalts, halides, and accessory pyrite occurring with quartz, adularia,
carbonates, and clay minerals (Pearson and Rennie, 2008). Epithermal deposits represent shallow parts of larger, mainly subaerial,
hydrothermal systems (Figure 8-1) formed at temperatures as high as about 300°C and at depths from about 50 to as much as
1,500 m below the water table (John et al., 2010).
Analogous
epithermal gold-silver deposits set in an extensional-transtensional continental-margin arc are the Comstock Lode in Nevada, Martha
Hill in New Zealand, Peñasquito in Mexico, and Hishikari in Japan (John et al., 2010).

Figure
8-1: Generalized gold deposit types and environments
8
–Deposit Types
|
36 |
| Signature Date: March 25, 2021 |
|
Technical
Report El Peñón Mine, Chile
Initial
regional exploration focused on Early to Mid-Eocene volcanic belts in northern Chile and led to their acquisition of the El Peñón
property in 1993. Trenching carried out that year, followed by a 13-hole drilling program, discovered significant gold-silver
mineralization. The next year, the first drill hole of a follow-up program intersected 100 m grading 10.9 g/t gold and 123.4
g/t silver in what eventually became the Quebrada Orito deposit.
Since
2007 Yamana has been successful in expanding the footprint of mineralization through geological mapping, geochemical characterization,
geophysics, and abundant surface and underground drilling within the northeast trend, first starting at the El Peñón
area, with Quebrada Orito in the southwest and ending to Angosta in the northeast.
Exploration
has also been successful at the Fortuna and Pampa Augusta Vitoria (PAV) areas located to the southwest and to the north of El
Peñón, respectively. Geophysical anomalies and positive drill intersections remain to be followed up in all areas.
GoldSpot Discoveries Corp. (GoldSpot) was contracted in 2019 to apply machine learning to target unknown mineralization.
Exploration
work completed to date has defined 40 main mineralized zones and subsidiary veins, within ten geological trends.
The
significant exploration results at El Peñón that are material to this technical report were obtained by surface
and underground core drilling. This work and resulting interpretations are summarized in Sections 10, 14, and 15 of this technical
report.
Exploration
conducted between 2018 and 2020 can be divided into three categories: infill, expansion, and district.
| • | Infill
drilling is designed to replace production by upgrading and extending known mineral resources
with a combination of reverse circulation (RC) and core drilling methodology (ratio of
approximately 70% RC to 30% core drilling). |
| • | Expansion
(or step-out) exploration drilling aims to upgrade inferred mineral resources to measured
or indicated categories, or to transform zones of geological potential into inferred
mineral resources. |
| • | District
exploration is meant to test the extension of little-known areas of mineralization or
to discover new primary structures by testing targets identified in mapping, geochemistry,
geophysics, or machine learning programs. |
9
–Exploration
|
37 |
| Signature Date: March 25, 2021 |
|
Technical
Report El Peñón Mine, Chile
A
total of 384,000 m of drilling has been planned for 2021 through 2023 at a budgeted cost of US$54M. The amount of proposed drilling
is based on the past success rate of adding resources at El Peñón.
Infill
targets in 2020 included Martillo Flat, Pampa Campamento, El Valle, Dorada, Cerro Martillo and La Paloma. Expansion targets tested
in 2020 included Colorada Sur, El Valle-Sorpresa extension, deeper portions of Martillo Flat, Pampa Campamento and La Paloma Profundo.
District targets tested in 2020 included Angosta, Augusta Victoria, Chiquilla Chica, Laguna-Fortuna, and Cerro Seco-Estanque de
Agua.
Exploration
results at El Peñón continue to highlight the expansion potential of the mine and Yamana’s ability to replenish
mineral reserves and mineral resources so as to extend the life of mine past its current mineral reserve base.
9
–Exploration
|
38 |
| Signature Date: March 25, 2021 |
|
Technical
Report El Peñón Mine, Chile
Systematic testing of the gold-silver-bearing zones
was started by Meridian Gold in 1993 and continued until 2007. Yamana has drilled continuously on the property since 2007 to expand
the mineral resources and replace depletion of mineral reserves. To the end of December 2020, over three million metres have been
drilled at El Peñón in the Fortuna, El Peñón, and Pampa Augusta Vitoria (PAV) areas (Table 10-1). This
includes 130,298 m completed in 2020 (71,263 m exploration and 59,035 m infill drilling), with intersections at Colorada Sur,
El Valle, Pampa Campamento, Sorpresa, La Paloma and Dorada veins.
Figure 10-1 illustrates the location of drilling
in the El Peñón area. Significant exploration results and interpretations obtained from surface and underground drilling
are summarized in Sections 14 and 15 of this technical report.
Table 10-1: Exploration
and infill drilling by year and type, 1993 to December 31, 2020
| Year | |
Exploration
(m) | |
Infill
(m) | |
Total
(m) | |
Year | |
Exploration
(m) | |
Infill
(m) | |
Total
(m) |
| 1993 | |
2,507 | |
0 | |
2,507 | |
20071 | |
113,507 | |
70,534 | |
184,041 |
| 1994 | |
16,606 | |
0 | |
16,606 | |
2008 | |
66,917 | |
65,911 | |
132,828 |
| 1995 | |
51,451 | |
0 | |
51,451 | |
2009 | |
93,690 | |
22,592 | |
116,282 |
| 1996 | |
48,370 | |
0 | |
48,370 | |
2010 | |
69,470 | |
77,724 | |
147,194 |
| 1997 | |
85,248 | |
0 | |
85,248 | |
2011 | |
78,746 | |
49,919 | |
128,665 |
| 1998 | |
73,941 | |
0 | |
73,941 | |
2012 | |
65,401 | |
57,937 | |
123,338 |
| 1999 | |
58,561 | |
48,325 | |
106,886 | |
2013 | |
70,323 | |
26,440 | |
96,763 |
| 2000 | |
49,388 | |
134,994 | |
184,382 | |
2014 | |
68,582 | |
57,262 | |
125,844 |
| 2001 | |
101,440 | |
80,905 | |
182,345 | |
2015 | |
40,950 | |
105,807 | |
146,757 |
| 2002 | |
84,753 | |
56,573 | |
141,326 | |
2016 | |
95,701 | |
70,397 | |
166,098 |
| 2003 | |
87,581 | |
39,072 | |
126,653 | |
2017 | |
29,240 | |
82,875 | |
112,115 |
| 2004 | |
99,674 | |
58,498 | |
158,172 | |
2018 | |
31,179 | |
66,630 | |
97,809 |
| 2005 | |
107,443 | |
52,851 | |
160,294 | |
2019 | |
45,325 | |
69,885 | |
115,210 |
| 2006 | |
72,526 | |
107,887 | |
180,413 | |
2020 | |
71,263 | |
59,035 | |
130,298 |
| | |
| |
| |
| |
TOTAL | |
1,879,783 | |
1,462,053 | |
3,341,836 |
| 1. | Acquisition by Yamana in late 2007 |
| 10 –Drilling |
39 |
| |
|
| Signature Date: March 25, 2021 |
|
Technical
Report El Peñón Mine, Chile
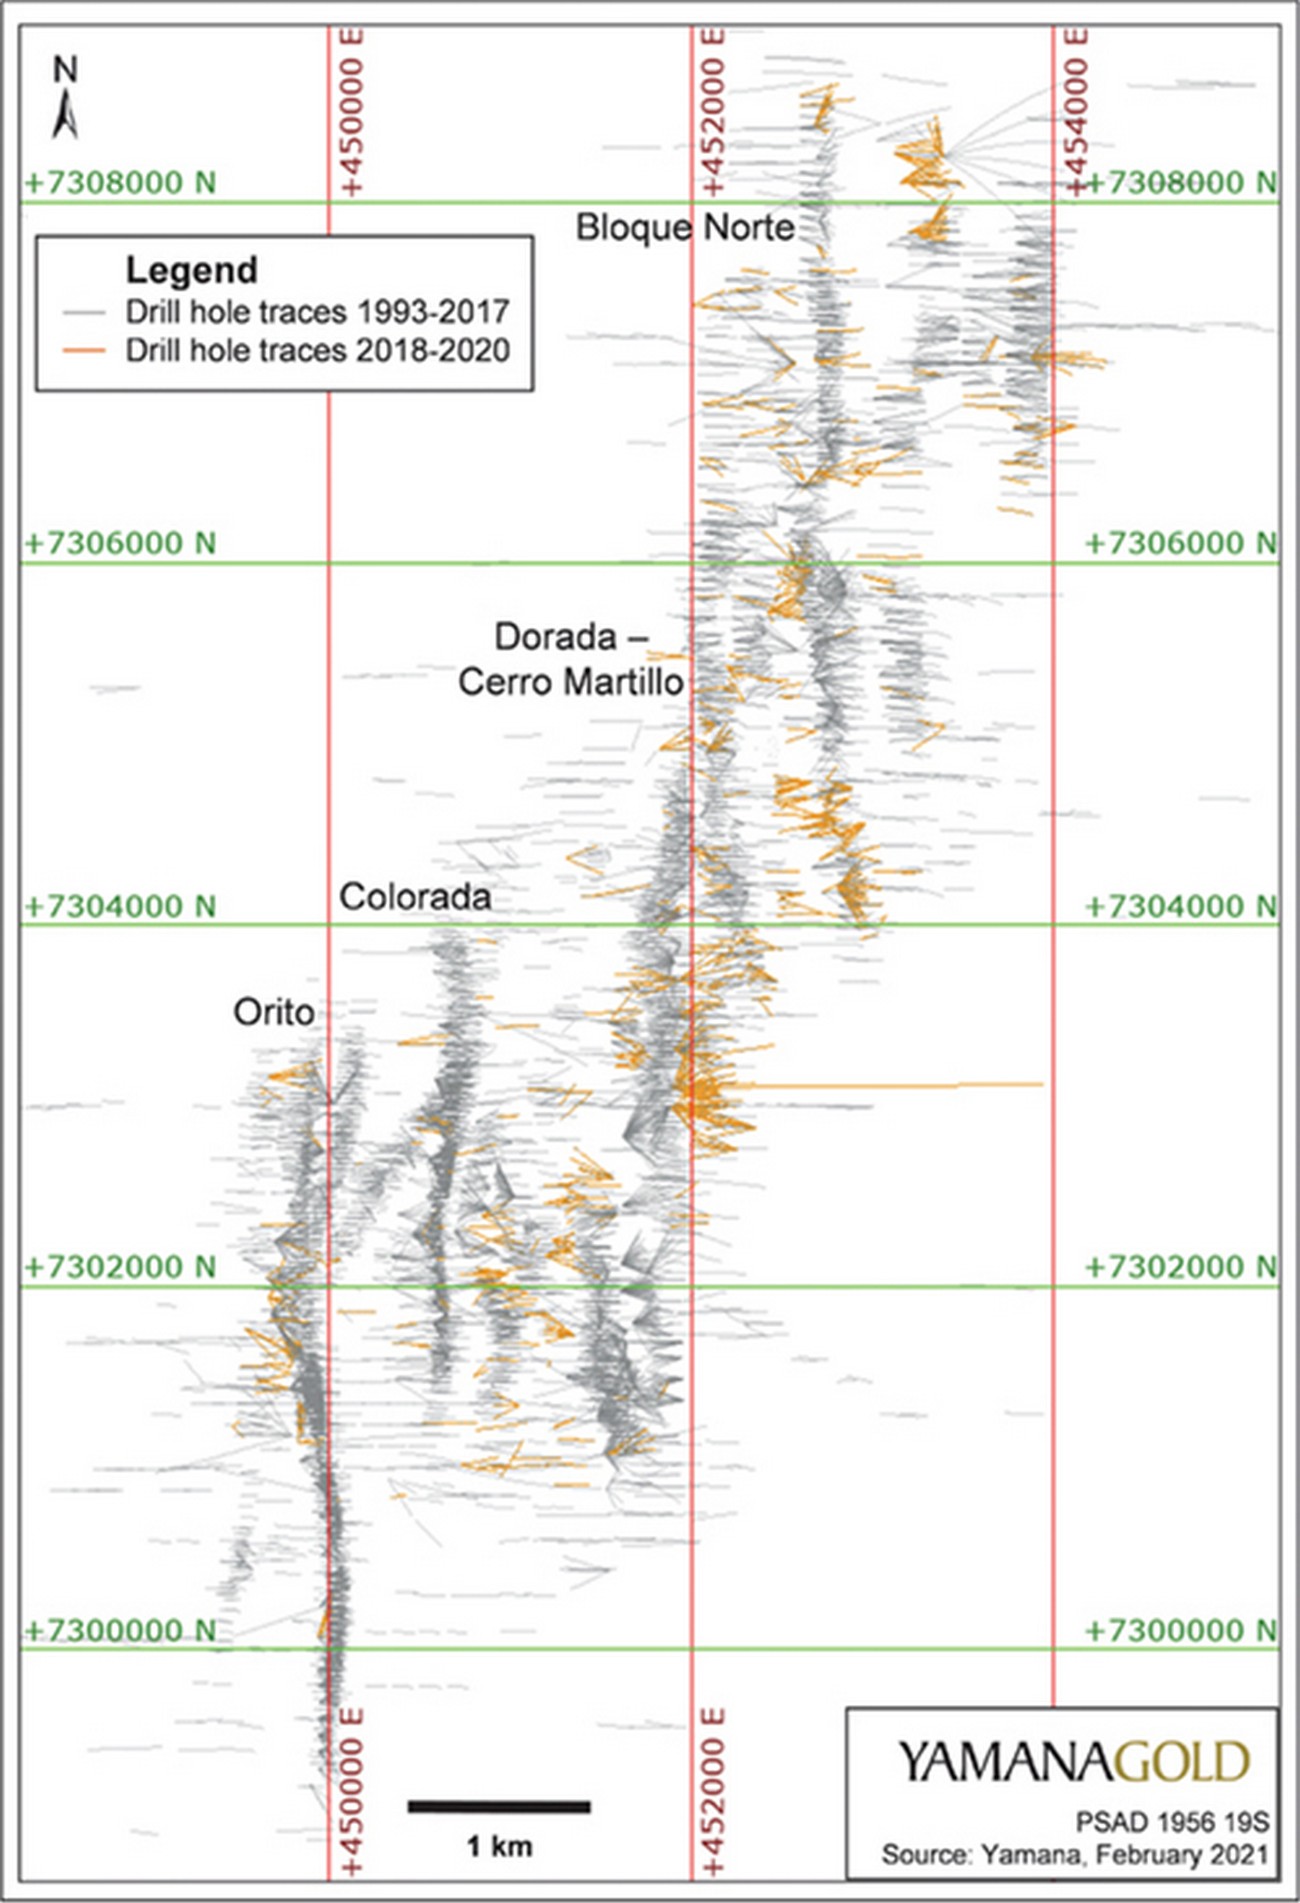
Figure 10-1: Plan view of drill holes in El
Peñón core mine area
| 10 –Drilling |
40 |
| |
|
| Signature Date: March 25, 2021 |
|
Technical
Report El Peñón Mine, Chile
Yamana continually conducts exploration work to
develop drill targets to replenish mineral reserves. Drilling is carried out on a 60 × 60 m grid; infill drill
holes are based on a 30 × 30 m grid pattern. Preliminary mineral resource estimates are made using the drill
information. Later, the mineral resource models are refined using chip sample assays collected from the underground development.
Underground definition core drilling is completed on a 30 × 30 m spacing where required, and short test drill
holes are drilled from underground to locate veins and parallel structures and to assist with mining and grade control.
Surface drilling is mostly collared with reverse
circulation (RC) and converted to core drilling prior to intersecting the mineralized zone. At least one hole per 30 m section
is drilled as a core drill hole for its entire length. Core size is HQ (63.5 mm core diameter), sometimes reduced to NQ (47.6 mm
core diameter). RC holes are drilled with 146 mm-diameter equipment, which produces a hole approximately 152 mm in diameter. Drilling
on the mine property from 2018 to 2020 was performed by AK Drilling International.
The procedures used during drilling programs are
as follows:
| • | The collar locations of all drill holes are surveyed and marked by El Peñón crews. |
| • | Directional deviation (for both azimuth and inclination) is surveyed in each drill hole using
a REFLEX multi-shot survey instrument by IMDEX Ltd for underground drill holes and using a gyroscope survey instrument by Axis
Mining Technology for drill holes drilled from the surface. |
| • | Lithological logging is done on drill core and RC chips. Geotechnical observations are made
by company geologists and technicians. All information is recorded on digital tablets using commercial software and depicts all
downhole data. This includes recording the following items as appropriate for the drilling method: |
| ○ | Percent core recovery record |
| ○ | Rock Quality Designation (RQD) measurements |
| ○ | Intensity of various alteration types |
| ○ | Structural features, such as foliation, fractures, and brecciated zones |
| 10 –Drilling |
41 |
| |
|
| Signature Date: March 25, 2021 |
|
Technical
Report El Peñón Mine, Chile
| ○ | Recording of mineralization, such as quartz type, sulphide type and content |
| ○ | A photographic record of the core taken with a digital camera |
Drill core recoveries are generally good (>95%)
but are moderately lower at the Quebrada Orito and El Valle veins (>85%). The lower core recovery in those veins, however, does
not have significant impact on the quality of the samples.
Collars of surface drill holes are preserved by
a PVC casing. A wooden stake is placed close to each collar; it is affixed with metal plates, on which the code, azimuth, dip,
and other relevant drill hole information is recorded
The qualified person responsible for this section
of the technical report is of the opinion that the logging and recording procedures are comparable to industry standards. There
are no other known drilling, sampling, or recovery factors that could materially impact the accuracy and reliability of results.
| 10 –Drilling |
42 |
| |
|
| Signature Date: March 25, 2021 |
|
Technical
Report El Peñón Mine, Chile
| 11 | Sample
Preparation, Analyses, and Security |
Analytical samples include both drill core and channel
samples. The drill core samples are generated from exploration and infill drilling programs that are conducted on surface and underground;
they are used for target generation and estimation of mineral resources and mineral reserves. The channel samples come from underground
grade-control channels in development drifts; they are used for short-term forecasting and grade control as well as for estimation
of mineral resources and reserves.
| 11.1 | Sample
Preparation and Analysis |
Sample preparation and analysis of drill core and
underground channel samples at El Peñón are carried out according to a series of standard operating procedures (SOPs)
listed in Table 11-1 and are described below.
Table 11-1: Sample preparation and analytical
standard operating procedures
| Procedure Number |
Description |
| GE-P06_R02 |
Sampling of drill core |
| GE-P11_R02 |
Validation of results |
| GE-P14_R01 |
Quality control of exploration samples |
| GE-P37_R02 |
Quality control of Production samples |
| GE-P03_R02 |
Sampling and splitting samples in RC drill holes |
| GE-I02_R02 |
Creation of dispatch forms |
| GE-P04_R03 |
Underground sampling |
| GE-P07_R02 |
QA/QC monthly report |
| GE-P08_R02 |
CRM control |
| GE-P09_R02 |
Sample shipment, storage, and disposal |
| GE-P36_R02 |
Procedure for quality control failures |
| 11.1.1 | Sampling
of Drill Core |
Drill core is received in the logging area by technicians
who first verify depth markers and reassemble the core so that pieces connect with each other; they then apply depth marks to the
core verifying with the wooden block markers placed by the drillers.
Before geological logging, all drill holes are logged
for geotechnical parameters; these include core recovery, rock quality designation (RQD), number of fractures, and if core intervals
include major structures such as faults. Drill holes are not oriented.
| 11 –Sample Preparation, Analyses, and Security |
43 |
| |
|
| Signature Date: March 25, 2021 |
|
Technical
Report El Peñón Mine, Chile
The geological description is then made by an on-site
geologist who enters the data directly into the geological data management system (GDMS). In this step, lithology, alteration,
structures, mineralization and percentage of quartz vein/veinlets are recorded. The limits of each sample interval are marked with
an indelible marker on the core and on the box by the logging geologist. The core boxes are photographed with a digital camera
prior to sampling.
Sampling of Exploration Drill Holes
For exploration drill holes, the complete length
of the drill hole is sampled and sent for analysis. The sample lengths are determined by the presence or absence of quartz veins
or veinlets.
In mineralized zones of Hydrothermal Breccia (unit
HyB) or Massive Quartz Vein (MQV) with abundant sulphides, the minimum sample length is 0.35 m and the maximum samples length is
0.5 m. For drill core without veins or sulphides and in exploration areas, the maximum sample length is 2 m.
The exploration drill cores are cut in half along
the longitudinal axis, using a hydraulic core splitter. Half of the core is placed in previously labelled plastic bags; the other
half is left in the core box as a reference.
Sampling of Infill Drill Holes
For infill drill holes, the minimum and maximum
sample lengths in mineralized zones are 0.2 and 0.5 m, respectively. For each interval, the full drill core is sampled; it is broken
with a hammer and placed in a previously labelled plastic bag.
Sample shipments
The bagged samples are placed in plastic bins to
be sent to the primary laboratory along with the submittal form (Dispatch Order).
In the opinion of the qualified person responsible
for this section of the technical report, the sampling methodologies at El Peñón conform to industry standards and
are adequate for use in mineral resource estimation.
| 11.1.2 | Underground
Channel Sampling |
The sampling of underground faces is carried out
systematically by production geologists and technicians in the advance galleries after each advance. After the face is washed and
secured, the sample is taken from left to right along a line of constant elevation, generally 1.5 m above the floor. The sample
location is determined by measuring the distance and azimuth from the nearest bolt left by the surveying team.
Geological contacts (lithology, alteration, mineralization,
structures, etc.) are identified and sampling intervals respect these contacts. Once the limit of the samples has been defined,
they are marked with red spray paint. The area to be sampled is then delimited by a rectangle. In mineralized zones mapped as MQV
or HyB, the maximum sample length is 1 m, whereas in host rocks the maximum sample length is 2.0 m.
| 11 –Sample Preparation, Analyses, and Security |
44 |
| |
|
| Signature Date: March 25, 2021 |
|
Technical
Report El Peñón Mine, Chile
Sampling is done with a rock hammer or with a mallet
and wedge. The rock fragments that are detached from the wall are collected in a bag on the ground and then placed in plastic bags
properly identified with correlative numbering tags. The samples are then transported to the El Peñón mine laboratory
for preparation and assaying.
The results of the underground channel samples are
used for short-term forecasting and grade control as well as in the grade estimation process for mineral resource models.
In the opinion of the qualified person responsible
for this section of the technical report, the sampling methodologies at El Peñón conform to industry standards and
are adequate for use in mineral resource estimation.
| 11.1.3 | Preparation
and Analytical Procedures |
Primary Exploration and Infill
Drilling Analytical Laboratories 2018 to 2020
As of January 2018, the Geoassay Group Ltda. (Geoassay)
laboratory in Antofagasta, Chile, was the primary laboratory for exploration and infill drilling samples, but only for one final
month as the contract terminated at the end of January 2018. Geossay is independent of Yamana and was not certified at the time.
Starting in February 2018, samples from exploration
and infill drilling were prepared and analyzed at SGS Minerals S.A. (SGS) laboratories in Antofagasta and Santiago, Chile. The
SGS laboratories are independent of Yamana and hold ISO/IEC 17025 certification. SGS moved its headquarters from Antofagasta to
Santiago in September 2019 and transferring the El Peñón samples from Antofagasta to Santiago created significant
delays and problems with accuracy. The samples from exploration drilling were processed at SGS in Antofagasta from February 2018
to September 2019, after which they were processed at the Santiago laboratory until March 2020. Samples from infill drilling were
processed at SGS in Antofagasta from February 2018 to September 2019, after which they were processed in the Santiago laboratory
until May 2020.
For a short period in late 2018, Intertek Caleb
Brett Chile S.A. (Intertek) laboratory in Copiapo was also used as a primary laboratory, in parallel with SGS, to help provide
analytical results in time for year-end reporting. Intertek is independent of Yamana and was certified to ISO9001:2015 standards
by ABS Quality Evaluations.
The primary laboratory for exploration samples was
changed to Geoassay in Antofagasta starting in March 2020. In May 2020, Geoassay became the primary laboratory for both exploration
and infill drilling program samples. Geossay is a local laboratory independent of Yamana and is in the process of being certified
to ISO/IEC 17025 standards.
Umpire Laboratories 2018 to
2020
Umpire laboratory check assays were carried out
at Intertek laboratory in Copiapo, Chile, until February 2019 and at Geoassay’s laboratory in Antofagasta, Chile, until May
2020, when it became the primary laboratory. Intertek is independent of Yamana and was certified to ISO9001:2015 standards by ABS
Quality Evaluations, but not to ISO/IEC 17025 standards. Geoassay is a local laboratory independent of Yamana and is in the process
of being certified to ISO/IEC 17025 standards. The selection process for a new umpire laboratory is ongoing.
| 11 –Sample Preparation, Analyses, and Security |
45 |
| |
|
| Signature Date: March 25, 2021 |
|
Technical
Report El Peñón Mine, Chile
Laboratory for Underground
Laboratory for Channel Samples 2018 to 2020
Samples from underground channels are assayed at
the in-house El Peñón mine laboratory. This laboratory is owned and operated by Yamana and is certified to ISO/IEC
17025 standards.
Analytical Procedures
The following procedures are used for sample preparation
and analysis at SGS, Geoassay, Intertek, and El Peñón laboratories:
| 1. | A submittal form (or Dispatch Form) is filled out by an El Peñón geologist or
technician and is delivered with the samples to the El Peñón or SGS/Geoassay/Intertek laboratories. |
| 2. | Samples are sorted, logged in the laboratory database (LIMS), weighed, and dried in a furnace
at 105°C. |
| 3. | The complete sample is crushed to 85% less than # 10 mesh (passing 2 mm), and riffle split to
obtain 1 kg of material. |
| 4. | A 1 kg sample is pulverized at 95% through # 140 mesh (passing 0.105 mm). |
| 5. | The laboratories clean the crushing and grinding instruments with compressed air between samples,
insert sterile quartz every 10 samples, and perform a granulometric control of crushing and pulverization on at least 3% of the
samples. |
| 6. | Two pulp packages of 250 g each (labelled A and B) are prepared at SGS, Geoassay, or Intertek
laboratories. The master pulp (pulp A) is used for the analysis. Remaining material from pulp A is combined with pulp B, which
is returned to site for storage. At the El Peñón mine laboratory, only a single package of 250 g pulp is prepared
and used for analysis. |
| 7. | To determine the gold content, the samples are analyzed by fire assay (FA) on 30 g samples (prior
to February 2018, the fire assays used a 50 g sample). Fluxes, lead oxide litharge, and silver are mixed and fired at 1,100°C
to 1,170°C for 50 to 60 minutes to separate the precious metals as a molten lead metallic phase. The samples are removed from
the oven and poured into moulds. Next, the slag is removed from the cooled lead button and the button is placed in a cupel and
fired at 920°C to 960°C for an hour to oxidize all the lead and make a precious metal bead. |
| 11 –Sample Preparation, Analyses, and Security |
46 |
| |
|
| Signature Date: March 25, 2021 |
|
Technical
Report El Peñón Mine, Chile
| ○ | The cupels are removed from the furnace and the beads are separated by acid digestion using
nitric and hydrochloric acid to dissolve the precious metals into solution. |
| ○ | At SGS, Geoassay, and Intertek laboratories the sample solutions are analyzed by atomic absorption
spectrometry (AAS) and samples containing more than 5 g/t gold are finished by gravimetry. At the El Peñón mine laboratory,
the analysis is finished by gravimetry. |
| 8. | The silver determination is done by AAS at SGS, Geoassay, and Intertek laboratories and by fire
assay at the internal El Peñón mine laboratory. |
| ○ | At SGS, Geoassay, and Intertek laboratories, a 2 g sample is first digested in a solution of
four acids (nitric, hydrochloric, perchloric, and hydrofluoric). The digested solution is brought to volume with hydrochloric acid
for the quantification of the analytes through AAS. If the sample contains more than 220 g/t silver, the silver content is quantified
by gravimetry. |
| ○ | At the El Peñón mine laboratory, the silver is determined in a manner similar
to gold, using fire assay and finished by gravimetry. |
| 9. | For screened metallic assays, the totality of the coarse fraction is assayed and an aliquot
of the fine fraction is analyzed. The gold concentration of the entire sample is determined by weighted average. |
At SGS and Geoassay laboratories, each analytical
batch contains the following:
| • | 2 preparation blanks (quartz) per batch, one at the beginning and the other at the end of the
batch |
| • | 1 pulp duplicate every 50th sample |
| • | 2 reagent blanks per batch |
| • | 2 Certified Reference Materials (CRMs or standards) per batch |
In addition, the laboratories perform granulometric
control of the crushing and pulverization of 3% of the samples.
At the El Peñón mine laboratory, analytical
batches contain 24 samples, described as follows:
| • | 1 preparation blank (quartz) |
| 11 –Sample Preparation, Analyses, and Security |
47 |
| |
|
| Signature Date: March 25, 2021 |
|
Technical
Report El Peñón Mine, Chile
In addition, the laboratory performs granulometric
controls of the crushing and pulverization every 20th processed sample.
The qualified person responsible for this section
of the technical report is of the opinion that the sample preparation, analytical, and assay procedures of channels and drill core
samples used for production and exploration are consistent with industry standards and adequate for use in the estimation of mineral
resources.
| 11.2 | Quality
Assurance/ Quality Control |
Yamana employs a comprehensive quality assurance/quality
control (QA/QC) program for the El Peñón exploration drilling programs, infill drilling programs, and grade control
channel samples. This program applies the following steps to monitor the accuracy and bias of the gold and silver:
| • | Monitoring of contamination in preparation and analysis by inserting blanks in the preparation
and analytical sampling streams. |
| • | Control of the precision by taking duplicates during preparation and analysis. |
| • | Sending pulp samples for umpire check assaying at secondary laboratories. |
Yamana has protocols in place for describing the
insertion frequency and the type of QA/QC samples as well as failure limits for each type of control sample. The insertion protocol
for control samples states that one blank pulp, one coarse blank and two CRMs per batch of 75 samples should be inserted. This
results in an insertion rate of quality control samples for exploration and infill drilling of approximately 5% (Table 11-2). There
are also established criteria to be followed in case of failure when a failure is flagged in the QA/QC database. The results from
the QA/QC program are reviewed and monitored by a geologist who presents the results in monthly reports.
| 11 –Sample Preparation, Analyses, and Security |
48 |
| |
|
| Signature Date: March 25, 2021 |
|
Technical
Report El Peñón Mine, Chile
Table 11-2: Summary of analytical quality control data
produced between 2018 and 2020
| |
|
Production |
|
|
Exploration and Infill |
|
|
|
| |
|
El Peñón Lab. |
|
|
Intertek |
|
|
SGS |
|
|
Geoassay |
|
|
|
| |
|
Samples |
|
(%) |
|
|
Samples |
|
(%) |
|
|
Samples |
|
(%) |
|
|
Samples |
|
(%) |
|
|
Source |
| Sample Count |
|
121,946 |
|
|
|
3,836 |
|
|
|
130,481 |
|
|
|
62,793 |
|
|
|
|
| Blanks |
|
1,775 |
|
1.5 |
% |
|
70 |
|
1.8 |
% |
|
2,562 |
|
2.0 |
% |
|
1,900 |
|
3.0 |
% |
|
|
| Pulp Blank |
|
|
|
|
|
885 |
|
|
|
53 |
|
|
|
2,265 |
|
|
|
810 |
|
|
|
CDN Laboratories |
| Sterile Blank |
|
|
|
|
|
- |
|
|
|
17 |
|
|
|
36 |
|
|
|
548 |
|
|
|
Core from previous drilling |
| Quartz Blank |
|
|
|
|
|
890 |
|
|
|
- |
|
|
|
261 |
|
|
|
542 |
|
|
|
Winkler milled quartz |
| CRM |
|
Au (g/t) |
|
Ag (g/t) |
|
876 |
|
0.7 |
% |
|
76 |
|
2.0 |
% |
|
2,835 |
|
2.2 |
% |
|
1,214 |
|
1.9 |
% |
|
|
| EP_STD7 |
|
0.52 |
|
48.6 |
|
- |
|
|
|
- |
|
|
|
18 |
|
|
|
536 |
|
|
|
Geoassay from El Peñón material |
| EP_STD1 |
|
0.56 |
|
47.0 |
|
- |
|
|
|
20 |
|
|
|
268 |
|
|
|
- |
|
|
|
INTEM from El Peñón material |
| CDN-GS-P5D |
|
0.64 |
|
66.0 |
|
- |
|
|
|
- |
|
|
|
384 |
|
|
|
41 |
|
|
|
CDN Laboratories |
| CDN-ME-1403 |
|
0.95 |
|
53.9 |
|
- |
|
|
|
- |
|
|
|
481 |
|
|
|
1 |
|
|
|
CDN Laboratories |
| EP_STD8 |
|
1.91 |
|
86.6 |
|
- |
|
|
|
- |
|
|
|
5 |
|
|
|
162 |
|
|
|
Geoassay from El Peñón material |
| CDN-ME-1407 |
|
2.12 |
|
245.0 |
|
- |
|
|
|
- |
|
|
|
273 |
|
|
|
19 |
|
|
|
CDN Laboratories |
| CDN-ME-1605 |
|
2.85 |
|
269.0 |
|
173 |
|
|
|
- |
|
|
|
33 |
|
|
|
- |
|
|
|
CDN Laboratories |
| EP_STD3 |
|
2.88 |
|
184.2 |
|
- |
|
|
|
18 |
|
|
|
335 |
|
|
|
- |
|
|
|
INTEM from El Peñón material |
| EP_STD2 |
|
3.07 |
|
191.4 |
|
15 |
|
|
|
15 |
|
|
|
147 |
|
|
|
- |
|
|
|
INTEM from El Peñón material |
| CDN-ME-1607 |
|
3.33 |
|
150.0 |
|
- |
|
|
|
- |
|
|
|
440 |
|
|
|
5 |
|
|
|
CDN Laboratories |
| EP_STD9 |
|
3.41 |
|
173.1 |
|
- |
|
|
|
- |
|
|
|
23 |
|
|
|
316 |
|
|
|
Geoassay from El Peñón material |
| OREAS 603 |
|
5.18 |
|
284.0 |
|
32 |
|
|
|
- |
|
|
|
56 |
|
|
|
- |
|
|
|
Ore Research |
| EP_STD4 |
|
5.96 |
|
253.2 |
|
49 |
|
|
|
2 |
|
|
|
65 |
|
|
|
- |
|
|
|
INTEM from El Peñón material |
| EP_STD10 |
|
8.00 |
|
341.0 |
|
41 |
|
|
|
- |
|
|
|
2 |
|
|
|
67 |
|
|
|
Geoassay from El Peñón material |
| IN-B156-53 |
|
10.02 |
|
253.0 |
|
47 |
|
|
|
- |
|
|
|
80 |
|
|
|
11 |
|
|
|
INTEM from El Peñón material |
| EP_STD11 |
|
13.11 |
|
501.8 |
|
28 |
|
|
|
- |
|
|
|
4 |
|
|
|
27 |
|
|
|
Geoassay from El Peñón material |
| IN-156-55 |
|
13.37 |
|
429.0 |
|
342 |
|
|
|
- |
|
|
|
113 |
|
|
|
6 |
|
|
|
INTEM from El Peñón material |
| EP_STD5 |
|
14.25 |
|
633.0 |
|
31 |
|
|
|
13 |
|
|
|
58 |
|
|
|
- |
|
|
|
INTEM from El Peñón material |
| EP_STD6 |
|
18.84 |
|
523.5 |
|
99 |
|
|
|
8 |
|
|
|
50 |
|
|
|
- |
|
|
|
INTEM from El Peñón material |
| EP_STD12 |
|
25.54 |
|
923.0 |
|
18 |
|
|
|
- |
|
|
|
- |
|
|
|
23 |
|
|
|
Geoassay from El Peñón material |
| EP_LP30 |
|
30.60 |
|
15.5 |
|
16 |
|
|
|
- |
|
|
|
- |
|
|
|
- |
|
|
|
ALS from La Pepa material |
| Umpire Check Assay Intertek |
|
1,561 |
|
1.1 |
% |
|
- |
|
|
|
317 |
|
0.2 |
% |
|
- |
|
|
|
Inter-laboratory check |
| Umpire Check Assay Geoassay |
|
1,537 |
|
1.1 |
% |
|
- |
|
|
|
585 |
|
0.4 |
% |
|
- |
|
|
|
Inter-laboratory check |
| QA/QC Samples |
|
5,749 |
|
4.7 |
% |
|
146 |
|
3.8 |
% |
|
6,299 |
|
4.8 |
% |
|
3,114 |
|
5.0 |
% |
|
|
| 11 –Sample Preparation, Analyses, and Security |
49 |
| |
|
| Signature Date: March 25, 2021 |
|
Technical
Report El Peñón Mine, Chile
| 11.2.1 | Certified
Reference Materials |
Yamana inserts two CRMs (or standards) for every
75 samples submitted to the primary laboratories (SGS, Geoassay, Intertek, and El Peñón laboratories) to control
accuracy and bias. The majority of reference materials have been manufactured with material from El Peñón. The CRMs
have been prepared by the National Institute of Technology, Standardization and Metrology (INTEM) in Chile, and Geoassay Group,
both in Antofagasta, Chile. Each CRM is provided with a certificate listing the round-robin assay results and the expected standard
deviation. These CRMs are individually packed in paper envelopes (100 to 120 g per envelope), inserted in plastic bags, and vacuum
sealed.
Other reference materials were purchased from Ore
Research & Exploration Pty Ltd in Australia, CDN Resource Laboratories Ltd. in Canada, and one CRM prepared by ALS Chemex with
material from Yamana’s La Pepa project.
El Peñón exploration staff submitted
4,927 CRMs between 2018 and 2020 (Table 11-2). Results from commonly used CRMs at the three primary laboratories are presented
in Figure 11-1.
| 11 –Sample Preparation, Analyses, and Security |
50 |
| |
|
| Signature Date: March 25, 2021 |
|
Technical
Report El Peñón Mine, Chile
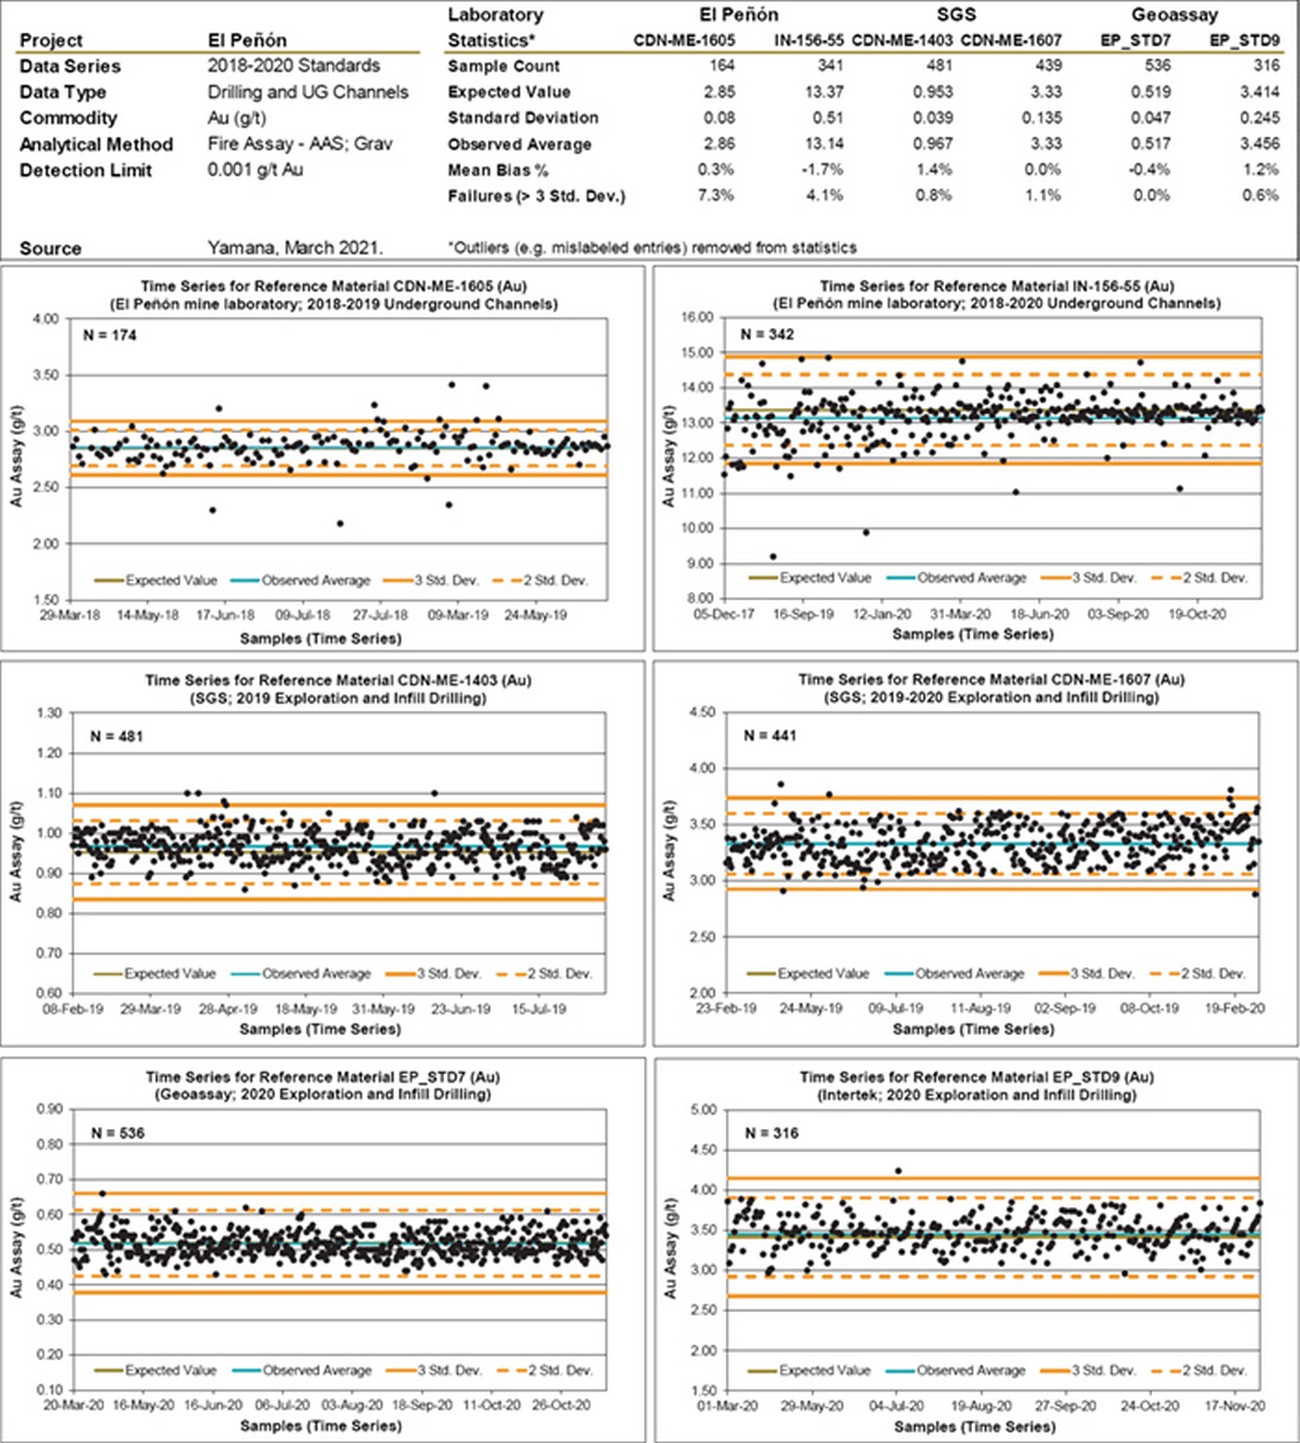
Figure 11-1: Time-series plots: gold assays
of select CRMs by laboratory (2018–2020)
Three types of blank samples are inserted that are
known to contain gold and silver grades that are less than the detection limit of the analytical methods. The first type consists
of pulp blanks purchased from CDN Resource Laboratories Ltd. in British Columbia, Canada. The second type consists of sterile core
from previous drilling campaigns that assayed below detection limit for gold and silver. The third type consists of coarse quartz
purchased from Winkler Ltda in Antofagasta, Chile, with granulometry within 2.00 to 2.83 mm.
| 11 –Sample Preparation, Analyses, and Security |
51 |
| |
|
| Signature Date: March 25, 2021 |
|
Technical
Report El Peñón Mine, Chile
The insertion protocol establishes that one coarse
quartz blank and one pulp blank should be inserted per batch of 75 samples. In addition, a sterile blank should be inserted immediately
after an expected mineralized zone. Between 2018 and 2020, El Peñón exploration staff submitted 6,237 blank samples
with drilling and channel samples (Table 11-2). The criteria for acceptance or rejection of results due to contamination for all
the blank control samples is ten times the lower detection limit (DL x 10) (Table 11-3). Results from select blanks at the three
primary laboratories are shown in Figure 11-2.
Table 11-3: Lower detection limits and acceptance
limits for blanks
| Laboratory |
|
Analyte |
|
Method |
|
Detection Limit |
|
Blank Acceptance Limit |
| |
|
|
(g/t) |
|
(DL x 10) (g/t) |
| El Peñón |
|
Au |
|
FA Grav |
|
0.2 |
|
2 |
| |
Ag |
|
FA Grav |
|
1 |
|
10 |
| SGS |
|
Au |
|
FA AAS |
|
0.02 |
|
0.2 |
| |
|
FA Grav |
|
0.5 |
|
|
| |
Ag |
|
MA AAS |
|
0.5 |
|
5 |
| |
|
Grav |
|
10 |
|
|
| Geoassay |
|
Au |
|
FA AAS |
|
0.02 |
|
0.05 |
| |
|
FA Grav |
|
0.2 |
|
|
| |
Ag |
|
MA AAS |
|
0.5 |
|
5 |
| |
|
Grav |
|
10 |
|
|
| Intertek |
|
Au |
|
FA AAS |
|
0.01 |
|
0.1 |
| |
|
FA Grav |
|
0.2 |
|
|
| |
Ag |
|
MA AAS |
|
0.5 |
|
5 |
| |
|
Grav |
|
10 |
|
|
| 11 –Sample Preparation, Analyses, and Security |
52 |
| |
|
| Signature Date: March 25, 2021 |
|
Technical
Report El Peñón Mine, Chile
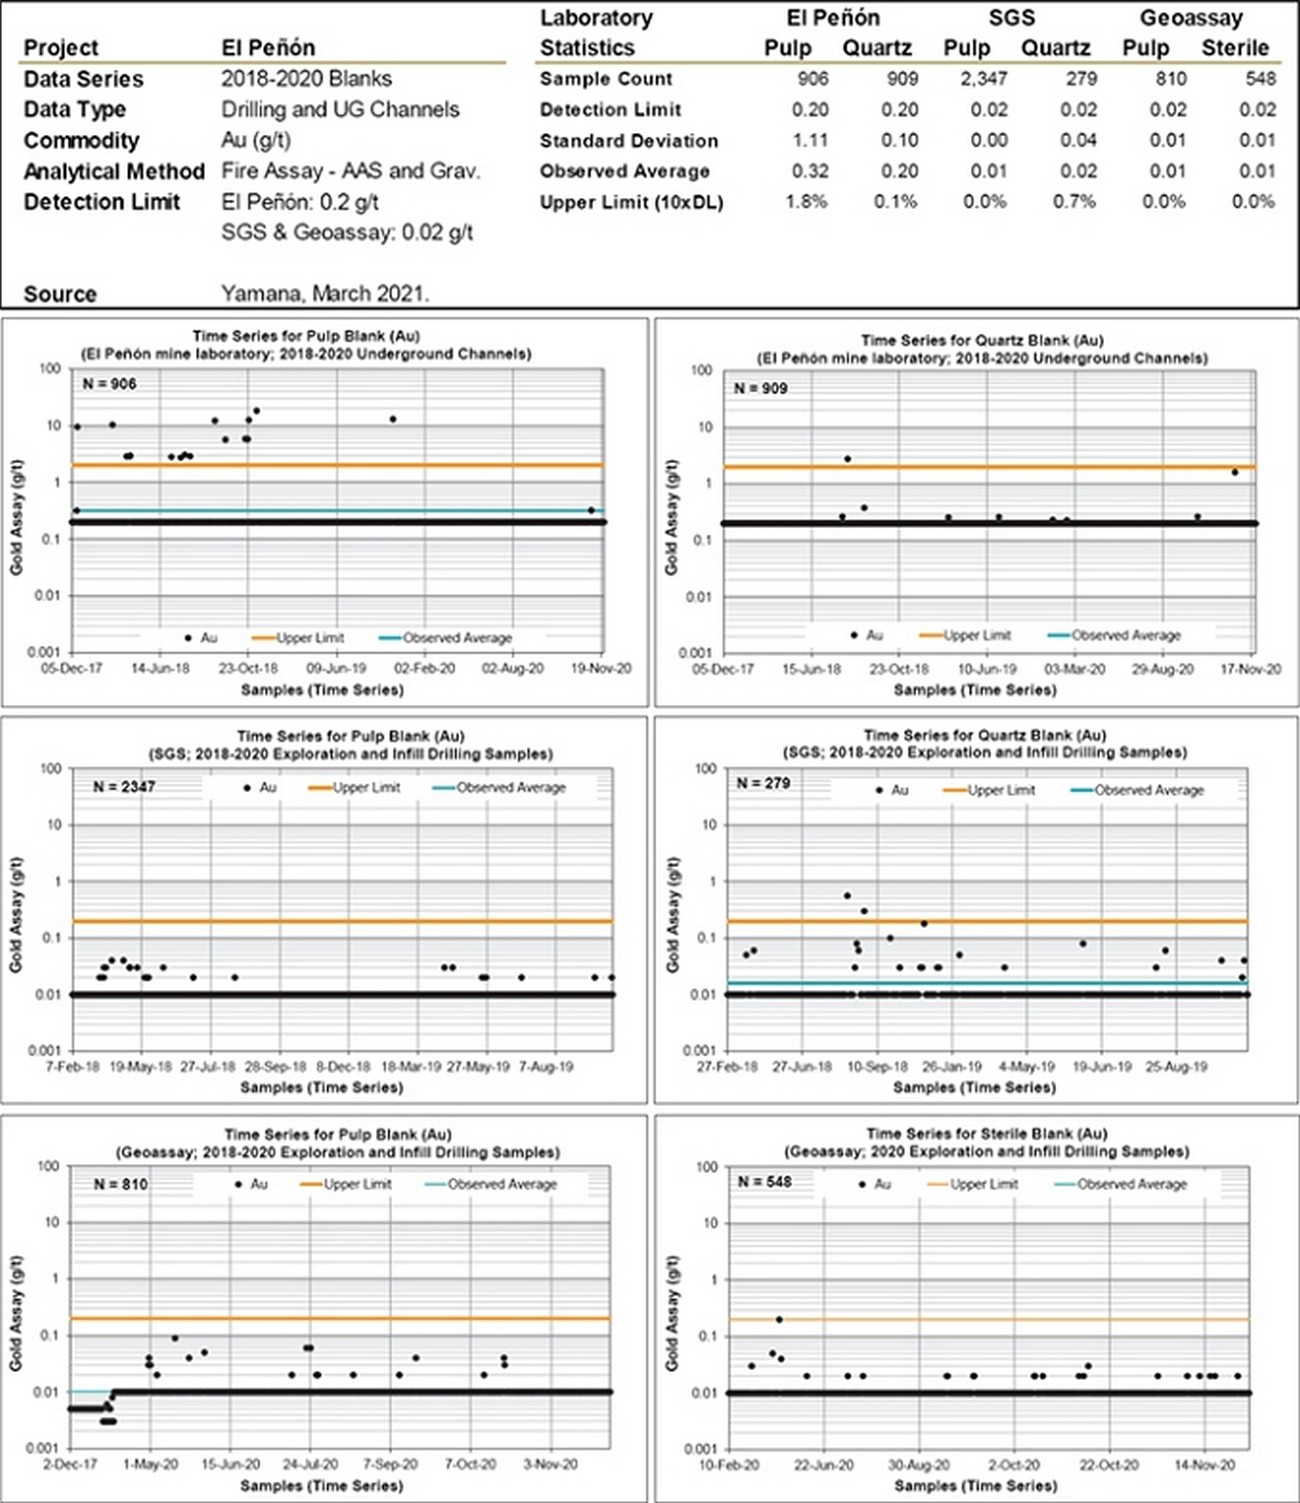
Figure 11-2: Time-series
plots: gold assays of select blanks by type and laboratory (2018–2020)
| 11 –Sample Preparation, Analyses, and Security |
53 |
| |
|
| Signature Date: March 25, 2021 |
|
Technical
Report El Peñón Mine, Chile
| 11.2.3 | Umpire
Laboratory Check Assays |
The primary laboratories are requested to send pulp
samples, as selected by El Peñón staff, on a monthly basis to the secondary laboratory as defined in Section 11.1.3,
for umpire check assays. Analysis of these pulps is useful for measuring the precision of the analytical process of the primary
laboratories, including the in-house mine laboratory, assuring a better degree of accuracy and control on assays. A total of 902
pulp samples from drill core and 3,098 channel pulp samples were sent between January 2018 and May 2020 (Table 11-2). Results of
umpire check assays comparing SGS and Geoassay are shown in Figure 11-3.
| 11 –Sample Preparation, Analyses, and Security |
54 |
| |
|
| Signature Date: March 25, 2021 |
|
Technical
Report El Peñón Mine, Chile
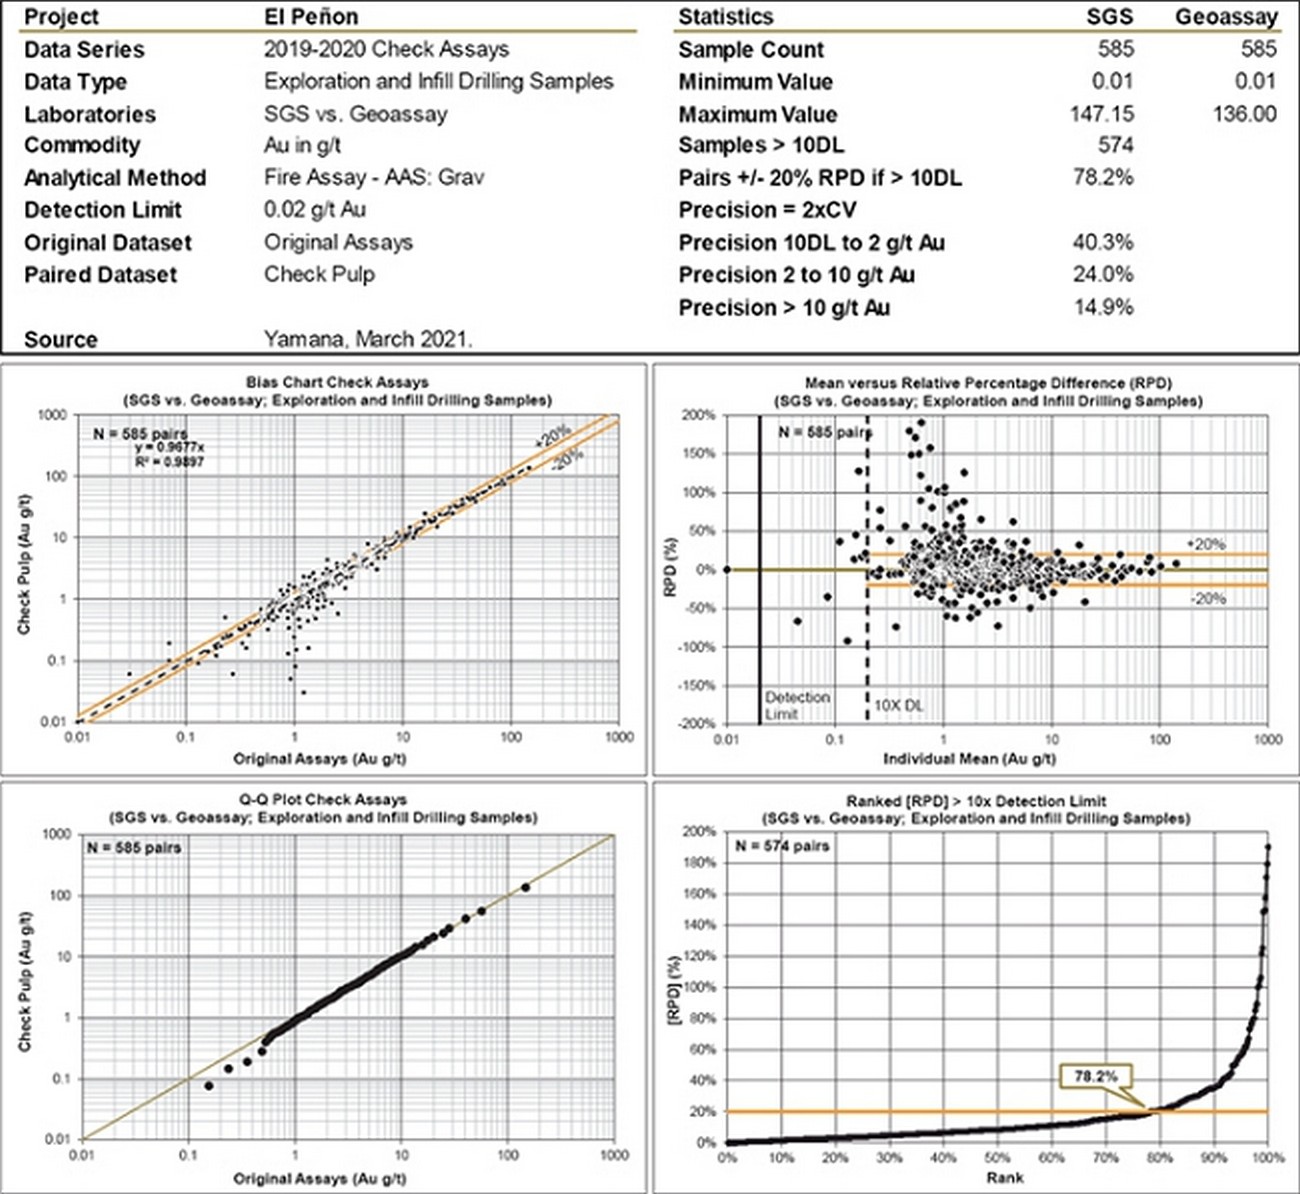
Figure 11-3: Comparison between SGS and Geoassay
umpire gold assays (2019-2020)
Samples are handled only by personnel authorized
by Yamana. Channel samples from the mining operation are delivered directly to the El Peñón mine laboratory each
day upon completion of underground sampling. All drill core from surface and underground drill holes is taken directly to authorized
exploration personnel to a drill logging and sampling area within the secured and guarded mine property. The mineralized core intervals
are logged, sampled, placed in plastic bags properly labelled for identification. Core samples are subsequently delivered to the
primary laboratory in Antofagasta by truck in secured plastic bins along with dispatch forms. The pulps and rejects that are returned
by the laboratory are transported inside the plastic bins, by the same truck that collects the samples at the mine.
| 11 –Sample Preparation, Analyses, and Security |
55 |
| |
|
| Signature Date: March 25, 2021 |
|
Technical
Report El Peñón Mine, Chile
Each sample is assigned a unique sample number that
allows it to be traced through the sampling, database, and analytical procedure workflow, and is validated against the original
sample site. For exploration drill holes, the remaining half of the split core is stored on-site as a control sample, available
for review and resampling if required. The photographic record of all drill holes is kept as reference.
In the opinion of the qualified person responsible
for this section of the technical report, the sample preparation, sample security, and analytical procedures at El Peñón
are adequate and consistent with industry standards.
| 11 –Sample Preparation, Analyses, and Security |
56 |
| |
|
| Signature Date: March 25, 2021 |
|
Technical
Report El Peñón Mine, Chile
The exploration work carried out on the El Peñón
property is conducted by Yamana personnel. Yamana implements a series of routine verification procedures to ensure the collection
of reliable exploration data. All work is conducted by appropriately qualified personnel under the supervision of qualified geologists.
El Peñón staff carried out a data
verification program for the assay tables included in the drill hole databases by spot-checking 5% of the assay data from a selection
of drill holes that intersected the mineralized wireframe domains, thus relevant to the current mineral resource estimate. The
validation was done by comparing the selected information entered in the digital database with that of the original laboratory
certificates.
Additional checks included a comparison of the drill
hole collar location data with the digital models of the surface topography and excavation models, as well as a visual inspection
of the downhole survey information. The validation routines in Leapfrog Geo and Maptek Vulcan software, consisting of checking
for overlapping samples and duplicate records, were also carried out.
The on-site database administrator, under the supervision
of the El Peñón resource geology team, validated the QA/QC results when received from the laboratories. The pre-2018
QA/QC database has been validated by independent consultants, most recently by RPA (2018). The QA/QC database review for the drilling
and underground channel sampling from 2018 to 2020 is described in Section 11.2.
There were no limitations in the ability of the
qualified person to verify the data. In the opinion of the qualified person responsible for this section of the technical report,
the verification of the sampling data, including the data entry and verification procedures, and the analytical quality control
data produced by Yamana for samples submitted to various laboratories, indicate that the analytical results delivered by the laboratories
are sufficiently reliable for the purpose of mineral resource and mineral reserve estimation.
| 12 –Data Verification |
57 |
| |
|
| Signature Date: March 25, 2021 |
|
Technical
Report El Peñón Mine, Chile
| 13 | Mineral
Processing and Metallurgical Testing |
The El Peñón processing plant has
a nominal production capacity of approximately 1.533 Mtpa, or 4,200 tpd, for stockpiled and mined ore. Mineral processing includes
the following principal stages:
| • | Grinding and pre-leaching thickening |
| • | Recovery of concentrate solution from counter-current decantation |
| • | Pregnant solution clarification |
| • | Gold and silver recovery by zinc precipitation (Merrill-Crowe process) |
| • | Filtering of precipitate |
Tailings are filtered to recover water and to obtain tailings with an approximate moisture content of about 20%. These are subsequently loaded on trucks and transported
to the nearby tailings storage area.
Since 2017, the plant throughput has been lower
than design, ranging from 1 Mtpa to 1.3 Mtpa, in line with the mine plan. The lower throughput is beneficial in terms of leach
residence time and results in a marginal increase of both gold and silver recovery. Stockpiled ore can be fed to the plant feed
system to supplement feed if required.
Manganese and silver salts that occur in zones of
high sulphur are deleterious elements that have a negative effect on silver recoveries and therefore on potential economic extraction.
| 13.2 | Metallurgical
Testing |
Significant metallurgical testwork has been carried
out on a continual basis at El Peñón since 2014. Samples, both from drill holes and from chip samples obtained from
faces, have been collected across a range of grades and from different zones that include oxides and material with high and low
sulphur content. The qualified person considers the samples to be representative of the plant feed expected in the life of mine
plan. The following metallurgical tests have been conducted:
| • | Leaching tests to address gold and silver recoveries as well as cyanide consumption |
| • | Sedimentation and filtration tests |
| • | Mill time or Bond Work Index tests |
| 13 –Mineral Processing and Metallurgical Testing |
58 |
| |
|
| Signature Date: March 25, 2021 |
|
Technical
Report El Peñón Mine, Chile
Tests results have allowed obtaining a gold and silver
recovery matrix based by zone, ore type and grade range, which is used to calculate net-smelter returns (NSR) (Section 15.3) on the block
models, is considered for mineral resource and mineral reserve estimation, and is updated continually. The recovery matrices for gold
and silver are shown in Table 13-1 and Table 13-2 respectively.
Table 13-1: Gold recovery by zone, ore type, and grade
category
| |
|
Gold Recovery (%) |
| Zone and Ore Type |
|
Low-Grade Supplementary Ore1
(< 3.0 g/t Au) |
|
Low-Grade
(3.0–6.0 g/t Au) |
|
Medium-Grade
(6.0–15.0 g/t Au) |
|
High-Grade
(> 15.0 g/t Au) |
| El Peñón Core Mine - Oxide |
|
84.13 |
|
94.06 |
|
96.22 |
|
96.64 to 97.38 |
| El Peñón Core Mine - Low Sulphur |
|
84.13 |
|
92.98 |
|
94.75 |
|
92.57 |
| El Peñón Core Mine - High Sulphur |
|
84.13 |
|
91.13 |
|
93.88 |
|
93.49 |
| Fortuna - Oxide |
|
84.13 |
|
90.34 |
|
90.34 |
|
90.34 |
| Fortuna - High Sulphur |
|
84.13 |
|
89.95 |
|
89.95 |
|
89.95 |
| Pampa Augusta Victoria - Oxide |
|
84.13 |
|
86.93 |
|
89.30 |
|
89.30 |
| Pampa Augusta Victoria - High Sulphur |
|
84.13 |
|
84.99 |
|
92.50 |
|
92.50 |
| Laguna - All |
|
84.13 |
|
88.74 |
|
88.74 |
|
88.74 |
| Chiquilla Chica - All |
|
84.13 |
|
89.22 |
|
89.22 |
|
89.22 |
1 Low-grade
supplementary ore is defined in Section 15.2.
Table 13-2: Silver recovery by zone, ore type, and grade
category
| |
|
Silver Recovery (%) |
| Zone and Ore Type |
|
Low-Grade
Supplementary
Ore-1
(< 3.0 g/t Au) |
|
Low-Grade Ore
(3.0–6.0 g/t Au) |
|
Medium-Grade Ore
(6.0–15.0 g/t Au) |
|
High-Grade Ore
(> 15.0 g/t Au) |
| El Peñón Core Mine - Oxide |
|
79.71 |
|
88.92 |
|
90.74 |
|
92.31 to 92.33 |
| El Peñón Core Mine - Low Sulphur |
|
79.71 |
|
90.96 |
|
89.52 |
|
75.23 |
| El Peñón Core Mine - High Sulphur |
|
79.71 |
|
76.49 |
|
74.86 |
|
68.76 |
| Fortuna - Oxide |
|
79.71 |
|
88.24 |
|
88.24 |
|
88.24 |
| Fortuna - High Sulphur |
|
79.71 |
|
82.29 |
|
82.29 |
|
82.29 |
| Pampa Augusta Victoria - Oxide |
|
79.71 |
|
83.98 |
|
83.98 |
|
83.98 |
| Pampa Augusta Victoria - High Sulphur |
|
79.71 |
|
67.06 |
|
56.47 |
|
56.47 |
| Laguna - All |
|
79.71 |
|
64.42 |
|
64.42 |
|
64.42 |
| Chiquilla Chica - All |
|
79.71 |
|
81.67 |
|
81.67 |
|
81.67 |
1 Low-grade
supplementary ore is defined in section 15.2
Results from metallurgical tests inform the geometallurgical
block model utilized for operational and mine planning purposes. The geometallurgical model includes variables for gold and silver
recoveries, cyanide consumption, and sedimentation and filtration rates. Grinding parameters for different ores have also been
established. Typically, the ores are relatively hard, with Bond Work Index values of between 19 and 20 kWh/t.
| 13 –Mineral Processing and Metallurgical Testing |
59 |
| |
|
| Signature Date: March 25, 2021 |
|
Technical
Report El Peñón Mine, Chile
Actual plant-adjusted production figures with gold
and silver recoveries for 2019 and 2020 are presented in Table 13-3 and Table 13-4.
Table 13-3: Processing plant production for 2019
|
|
Tonnage |
|
Gold |
|
Silver |
| Month |
|
Tonnes |
|
Grade |
|
Production |
|
Recovery |
|
Grade |
|
Production |
|
Recovery |
| |
(t) |
|
(g/t Au) |
|
(Au oz) |
|
(% Au) |
|
(g/t Ag) |
|
(Ag oz) |
|
(% Ag) |
| January |
|
109,847 |
|
3.62 |
|
11,964 |
|
93.11 |
|
121.3 |
|
366,197 |
|
84.20 |
| February |
|
92,079 |
|
3.91 |
|
11,011 |
|
93.62 |
|
123.7 |
|
311,695 |
|
83.10 |
| March |
|
114,515 |
|
3.24 |
|
11,050 |
|
92.93 |
|
100.7 |
|
316,917 |
|
85.68 |
| April |
|
96,634 |
|
3.18 |
|
9,238 |
|
93.26 |
|
98.8 |
|
272,944 |
|
87.28 |
| May |
|
96,646 |
|
4.00 |
|
11,769 |
|
94.52 |
|
99.8 |
|
270,618 |
|
87.18 |
| June |
|
112,810 |
|
4.06 |
|
13,639 |
|
93.76 |
|
96.2 |
|
300,023 |
|
86.98 |
| July |
|
100,588 |
|
3.99 |
|
11,938 |
|
92.43 |
|
95.8 |
|
268,973 |
|
87.38 |
| August |
|
109,823 |
|
4.36 |
|
14,660 |
|
94.05 |
|
124.3 |
|
382,258 |
|
88.68 |
| September |
|
108,211 |
|
5.00 |
|
16,116 |
|
94.39 |
|
148.6 |
|
444,704 |
|
86.72 |
| October |
|
117,830 |
|
4.72 |
|
17,156 |
|
94.51 |
|
127.1 |
|
430,110 |
|
86.71 |
| November |
|
111,756 |
|
4.42 |
|
15,086 |
|
94.58 |
|
142.2 |
|
430,206 |
|
86.98 |
| December |
|
119,500 |
|
4.40 |
|
15,888 |
|
94.52 |
|
159.8 |
|
522,646 |
|
84.42 |
| Total 2019 |
|
1,290,239 |
|
4.09 |
|
159,515 |
|
93.96 |
|
120.6 |
|
4,317,292 |
|
86.20 |
Table 13-4: Processing plant production for 2020
|
|
Tonnage |
|
Gold |
|
Silver |
| Month |
|
Tonnes |
|
Grade |
|
Production |
|
Recovery |
|
Grade |
|
Production |
|
Recovery |
| |
(t) |
|
(g/t Au) |
|
(Au oz) |
|
(% Au) |
|
(g/t Ag) |
|
(Ag oz) |
|
(% Ag) |
| January |
|
113,436 |
|
4.57 |
|
15,734 |
|
94.11 |
|
156.1 |
|
493,664 |
|
85.05 |
| February |
|
97,409 |
|
4.63 |
|
13,759 |
|
95.03 |
|
168.8 |
|
458,479 |
|
88.41 |
| March |
|
112,128 |
|
3.72 |
|
12,738 |
|
94.36 |
|
124.9 |
|
403,768 |
|
87.83 |
| April |
|
90,386 |
|
4.53 |
|
12,113 |
|
92.68 |
|
196.1 |
|
474,100 |
|
85.47 |
| May |
|
93,108 |
|
4.24 |
|
12,011 |
|
93.41 |
|
139.1 |
|
370,957 |
|
86.96 |
| June |
|
90,616 |
|
4.50 |
|
11,636 |
|
93.39 |
|
184.1 |
|
432,181 |
|
86.41 |
| July |
|
101,546 |
|
4.52 |
|
14,083 |
|
93.40 |
|
183.3 |
|
536,760 |
|
85.59 |
| August |
|
92,424 |
|
4.40 |
|
12,462 |
|
93.85 |
|
174.7 |
|
467,049 |
|
88.00 |
| September |
|
118,680 |
|
3.65 |
|
12,777 |
|
93.13 |
|
106.9 |
|
357,190 |
|
87.45 |
| October |
|
117,920 |
|
3.59 |
|
12,630 |
|
93.37 |
|
100.1 |
|
323,819 |
|
85.67 |
| November |
|
120,443 |
|
4.04 |
|
14,589 |
|
94.26 |
|
84.2 |
|
292,879 |
|
88.71 |
| December |
|
118,733 |
|
4.57 |
|
16,292 |
|
93.41 |
|
93.5 |
|
306,255 |
|
86.40 |
| Total 2020 |
|
1,266,829 |
|
4.22 |
|
160,824 |
|
93.71 |
|
138.9 |
|
4,917,101 |
|
86.74 |
| 13 –Mineral Processing and Metallurgical Testing |
60 |
| |
|
| Signature Date: March 25, 2021 |
|
Technical
Report El Peñón Mine, Chile
| 14 | Mineral
Resource Estimates |
| 14.1 | Mineral
Resource Summary |
The
mineral resource estimate of El Peñón has been estimated in conformity with generally accepted standards set out
in CIM Mineral Resource and Mineral Reserves Estimation Best Practices Guidelines (November 2019) and has been classified
according to CIM (2014) Standards.
Interpreted
geological wireframes were constructed in Vulcan based on geology sections, assay results, lithological information and structural
data. Assays were composited to one-metre lengths, then interpolated using capping and a high-yield restriction for anomalously
high grades. Gold and silver grades were interpolated into a sub-blocked model with minimum block size of 0.5 × 0.5 ×
0.5 m and a parent block size of 20 × 20 × 20 m. Estimated grades were interpolated into blocks using Inverse Distance
Cubed (ID3) and checked using Nearest Neighbor (NN) methods. Block estimates were validated using industry standard validation
techniques. Classification of blocks was completed following distance-based criteria.
Mineral
resources are reported exclusive of mineral reserves. Mineral resources are not mineral reserves and have not demonstrated economic
viability. Underground mineral resources are estimated within conceptual underground mining shapes at a cut-off value of US$95.31/t,
which corresponds to 75% of the break-even cut-off value used to estimate the mineral reserves. A minimum mining width of 0.60
m as well as 0.30 m of hanging-wall and 0.30 m of footwall overbreak dilution are used to construct the conceptual mining shapes.
Mineral resources are reported fully diluted.
The
Mineral Resource Statement of El Peñón as of December 31, 2020, exclusive of mineral reserves, is presented in Table
14-1.
| 14
–Mineral Resource Estimates |
61 |
| |
|
| Signature
Date: March 25, 2021 |
|
Technical
Report El Peñón Mine, Chile
Table
14-1: El Peñón Mineral Resource Statement as of December 31, 2020
| Mineral
Resources |
|
Category |
|
Tonnage
|
|
Grade |
|
Contained
Metal |
| |
(kt) |
|
Au
(g/t) |
|
Ag
(g/t) |
|
Au
(koz) |
|
Ag
(koz) |
| Underground |
|
Measured |
|
667 |
|
4.81 |
|
143.0 |
|
103 |
|
3,063 |
| |
Indicated |
|
6,355 |
|
3.06 |
|
105.4 |
|
625 |
|
21,535 |
| |
Total
Measured + Indicated |
|
7,022 |
|
3.22 |
|
109.0 |
|
728 |
|
24,599 |
| |
Inferred |
|
5,208 |
|
3.61 |
|
118.0 |
|
605 |
|
19,758 |
| Tailings |
|
Measured |
|
– |
|
– |
|
– |
|
– |
|
– |
| |
Indicated |
|
– |
|
– |
|
– |
|
– |
|
– |
| |
Total
Measured + Indicated |
|
– |
|
– |
|
– |
|
– |
|
– |
| |
Inferred |
|
13,767 |
|
0.55 |
|
18.9 |
|
245 |
|
8,380 |
| Stockpiles |
|
Measured |
|
– |
|
– |
|
– |
|
– |
|
– |
| |
Indicated |
|
1,019 |
|
1.13 |
|
28.8 |
|
37 |
|
942 |
| |
Total
Measured + Indicated |
|
1,019 |
|
1.13 |
|
28.8 |
|
37 |
|
942 |
| |
Inferred |
|
– |
|
– |
|
– |
|
– |
|
– |
| Combined |
|
Measured |
|
667 |
|
4.81 |
|
143.0 |
|
103 |
|
3,063 |
| |
Indicated |
|
7,374 |
|
2.79 |
|
94.8 |
|
662 |
|
22,478 |
| |
Total
Measured + Indicated |
|
8,041 |
|
2.96 |
|
98.8 |
|
765 |
|
25,541 |
| |
Inferred |
|
18,975 |
|
1.39 |
|
46.1 |
|
850 |
|
28,138 |
| 1. | Mineral
resources have been estimated by the El Peñón resource geology team under
the supervision of Marco Velásquez Corrales, Registered Member of the Chilean
Mining Commission, a full-time employee of Minera Meridian Limitada, and a qualified
person as defined by NI 43-101. The estimate conforms to the CIM (2014) Standards. Mineral
resources are reported exclusive of mineral reserves. Mineral resources were evaluated
using an inverse distance weighting algorithm informed by capped composites and constrained
by three-dimensional mineralization wireframes. Mineral resources are not mineral reserves
and have not demonstrated economic viability. Metal price assumptions of US$1,250/oz
for gold and US$18.00/oz for silver were used. |
| 2. | Underground
mineral resources are estimated at a cut-off NSR of US$95.31/t, which corresponds to
75% of the mineral reserves cut-off value. Processing recoveries assumptions range from
84.13% to 97.38% for gold and from 56.47% to 92.33% for silver. The estimation considered
the following cost assumptions: mine operating cost of US$80.10/t; processing cost of
US$29.42/t; sustaining capital cost of US$4.10/t; and G&A costs of US$13.46/t. A
royalty of 2% was also considered for mineral resources contained in the Fortuna zone.
Mineral resources are reported fully diluted; they consider a minimum mining width of
0.60 m and hanging wall and footwall overbreak dilutions of 0.30 m each to determine
reasonable prospects of economic extraction. Bulk densities ranging from 2.36 g/cm3
to 2.57 g/cm3 were used to convert volume to tonnage. |
| 3. | Mineral
resources contained in tailings are reported at a cut-off grade of 0.50 g/t gold-equivalent,
using recoveries of 60% for gold and 30% for silver, operating cost of US$2.39/t, and
processing cost of US$29.42/t. A bulk density value of 1.75 g/cm3 was used
to convert tailings volume to tonnage. |
| 4. | Mineral
resources contained in stockpiles are reported at a cut-off grade of 0.79 g/t gold-equivalent,
using recoveries of 88.0% for gold and 80.8% for silver, operating cost of US$2.39/t,
and processing cost of US$29.42/t. A bulk density value of 1.60 g/cm3 was
used to convert the stockpile volume to tonnage. |
| 5. | Mineral
resources are reported as of December 31, 2020. |
| 6. | All
figures are rounded to reflect the relative accuracy of the estimate. |
| 7. | Numbers
may not add up due to rounding. |
| 14
–Mineral Resource Estimates |
62 |
| |
|
| Signature
Date: March 25, 2021 |
|
Technical
Report El Peñón Mine, Chile
| 14.2 | Resource
Database and Validation |
All
information used for the mineral resource and mineral reserve estimates, including drill core, survey, geological, and assay data,
is verified and approved by the El Peñón geological staff and is maintained in on-site databases. Verification is
done using the Maptek Vulcan software data validation tools. Drill hole data are stored in 6 databases; underground face samples
are stored in 26 databases (one database per mining zone).
| 14.3 | Definition
and Interpretation of Estimation Domains |
The
mineral resource models of El Peñón are supported by geological domains defined by samples logged as either massive
quartz vein (MQV), hydrothermal breccia (HYB), or stockwork (STW). These domains are modelled in the Vulcan software by snapping
the limit of the selected samples in each drill hole or underground face sample. No cut-off grade or value is used to define the
estimation domains. Wireframes are classified into two different zones:
| • | Wireframes
in zones supported by drill hole information extend a maximum of 60 m from the last sample
along the dip and strike directions. |
| • | Wireframes
in zones supported by underground face samples extend 10 m along the dip direction of
the vein and 2 to 3 m along the strike direction. |
The
resultant wireframes define the mineral resource estimation domains at El Peñón (Figure 14-1). Each independent
splay or parallel vein is considered as an independent estimation domain to avoid sharing samples between adjacent structures.
It is important to note that wireframes have to be spatially disconnected to be considered to be an independent structure and
domain.
The
modelling process results in two sets of wireframes per mining zone:
| • | The
first wireframe corresponds to all the interpreted veins located within the zone; the
wireframe is used to code drill hole and channel databases, is used as a hard boundary
for the generation of composites, and is coded into a variable called “shellug”
contained in the composites database. |
| • | The
second wireframe corresponds to each individual vein or vein splay which define the estimation
domains at El Peñón. This second set of wireframes is used to code the
“ug” variable in the composites database according to the position of the
centre of each composite. |
14 –Mineral Resource Estimates
|
63 |
| Signature
Date: March 25, 2021 |
|
Technical
Report El Peñón Mine, Chile

Figure
14-1: Plan view of estimation domains in El Peñón core mine area
14 –Mineral Resource Estimates
|
64 |
| Signature
Date: March 25, 2021 |
|
Technical
Report El Peñón Mine, Chile
A
sample length of 1.0 m is the most common sample length at El Peñón. Therefore, a regular composite length of 1.0
m was selected for all drill holes and channel samples to try to minimize the splitting of assays into different composites. Interpreted
vein wireframes are used as a hard boundary for compositing. Generation of equal-length composites commonly results in fractional
length composites, especially at the last interval of each drill hole contained within the constraining wireframes. Composites
shorter than 0.10 m were discarded for mineral resource estimation purposes.
Before
exploratory data analysis (EDA) is carried out, coordinates of the centre of each composite as well as vein- and splay-codes were
assigned.
Descriptive
statistics were computed for every interpreted vein domain on composite datasets; the exploratory data analysis was done performed
using histograms, probability plots, and box-plots.
Since,
the presence of local high-grade outliers could potentially affect the accuracy of the mineral resource estimate, composite samples
were statistically examined for the presence of grade outliers using a combination of methodologies, such as inspection of probability
plots, histogram analysis, and the Parrish method. Based on historical calibration with production data, outliers were usually
defined for channel samples at the 96th percentile of the cumulative distribution, while for drill hole data this threshold
was generally set at close to the 99th percentile.
Once
defined, both capping and high-yield restriction were used to control the influence of the high-grade composites on the block
model. High-yield restrictions were used by setting the thresholds equal to the capping threshold and by limiting the influence
to a 5.0 × 2.5 × 2.5 m search ellipse, measured along the strike, dip, and width directions, respectively. Threshold
used for capping and high-yield restriction for each zone are summarized in Table 14-2.
Table
14-2: Summary of gold and silver capping values by zone
| Vein |
|
Gold |
|
Silver |
| |
Drill
Hole
Samples (g/t) |
|
UG
Samples (g/t) |
|
Surface
Samples (g/t) |
|
Drill
Hole
Samples (g/t) |
|
UG
Samples (g/t) |
|
Surface
Samples (g/t) |
| 505 |
|
101 |
|
45 |
|
40 |
|
1,000 |
|
537 |
|
520 |
| 506 |
|
60 |
|
40 |
|
N/A |
|
324 |
|
433 |
|
N/A |
| Abundancia |
|
40 |
|
195 |
|
N/A |
|
750 |
|
1,750 |
|
N/A |
| Aleste |
|
50 |
|
145 |
|
N/A |
|
3,500 |
|
4,954 |
|
N/A |
| Angosta |
|
30 |
|
N/A |
|
N/A |
|
500 |
|
N/A |
|
N/A |
| 14
–Mineral Resource Estimates |
65 |
| |
|
| Signature
Date: March 25, 2021 |
|
Technical
Report El Peñón Mine, Chile
| Vein |
|
Gold |
|
Silver |
| |
Drill
Hole
Samples (g/t) |
|
UG
Samples (g/t) |
|
Surface
Samples (g/t) |
|
Drill
Hole
Samples (g/t) |
|
UG
Samples (g/t) |
|
Surface
Samples (g/t) |
| Bermellón |
|
30 |
|
150 |
|
N/A |
|
800 |
|
3,320 |
|
N/A |
| Bermuda |
|
25 |
|
N/A |
|
N/A |
|
400 |
|
N/A |
|
N/A |
| Bonanza |
|
169 |
|
100 |
|
N/A |
|
1,944 |
|
1,150 |
|
N/A |
| Borde
Oeste |
|
70 |
|
N/A |
|
N/A |
|
1,990 |
|
N/A |
|
N/A |
| Caracoles |
|
N/A |
|
N/A |
|
N/A |
|
N/A |
|
N/A |
|
N/A |
| Carmín |
|
90 |
|
157 |
|
N/A |
|
800 |
|
2,020 |
|
N/A |
| Cerro
Martillo |
|
25 |
|
36 |
|
N/A |
|
1,407 |
|
1,311 |
|
N/A |
| Cerro
Martillo Central Sur |
|
36 |
|
137 |
|
N/A |
|
2,346 |
|
6,155 |
|
N/A |
| Chiquilla
Chica |
|
2 |
|
N/A |
|
8 |
|
1,730 |
|
N/A |
|
3,336 |
| Diablada |
|
70 |
|
103 |
|
N/A |
|
312 |
|
438 |
|
N/A |
| Discovery
Wash |
|
25 |
|
20 |
|
N/A |
|
700 |
|
536 |
|
N/A |
| Dominador |
|
45 |
|
35 |
|
N/A |
|
1,540 |
|
920 |
|
N/A |
| Dorada |
|
20 |
|
40 |
|
N/A |
|
1,385 |
|
2,090 |
|
N/A |
| Dorada
SW |
|
29 |
|
47 |
|
N/A |
|
2,281 |
|
3,000 |
|
N/A |
| El
Valle |
|
50 |
|
23 |
|
N/A |
|
1,190 |
|
773 |
|
N/A |
| Elizabeth |
|
15 |
|
65 |
|
N/A |
|
1,420 |
|
10,927 |
|
N/A |
| Esmeralda |
|
40 |
|
137 |
|
N/A |
|
1,517 |
|
5,678 |
|
N/A |
| Esperanza |
|
86 |
|
46 |
|
N/A |
|
1,655 |
|
1,949 |
|
N/A |
| Fortuna
Este |
|
20 |
|
N/A |
|
N/A |
|
1,400 |
|
N/A |
|
N/A |
| Fortuna
Norte |
|
27 |
|
105 |
|
N/A |
|
2,000 |
|
6,200 |
|
N/A |
| Fortuna
Sur |
|
35 |
|
55 |
|
N/A |
|
3,500 |
|
3,675 |
|
N/A |
| La
Paloma |
|
75 |
|
53 |
|
N/A |
|
1,300 |
|
1,110 |
|
N/A |
| Laguna |
|
36 |
|
53 |
|
N/A |
|
370 |
|
524 |
|
N/A |
| Lazo |
|
10 |
|
N/A |
|
N/A |
|
200 |
|
N/A |
|
N/A |
| Magenta |
|
64 |
|
115 |
|
N/A |
|
1,080 |
|
2,140 |
|
N/A |
| Martillo
Flat |
|
60 |
|
44 |
|
N/A |
|
2,131 |
|
2,648 |
|
N/A |
| Orito
Norte |
|
50 |
|
54 |
|
127 |
|
308 |
|
320 |
|
1,357 |
| Orito
Sur |
|
40 |
|
41 |
|
N/A |
|
817 |
|
778 |
|
N/A |
| Orito
West |
|
35 |
|
N/A |
|
N/A |
|
1,500 |
|
N/A |
|
N/A |
| Pampa
Campamento |
|
56 |
|
56 |
|
N/A |
|
1,569 |
|
1,200 |
|
N/A |
| Pampa
Providencia |
|
35 |
|
N/A |
|
N/A |
|
600 |
|
N/A |
|
N/A |
| Providencia |
|
41 |
|
33 |
|
N/A |
|
1,726 |
|
2,001 |
|
N/A |
| Quebrada
Colorada Sur |
|
60 |
|
N/A |
|
N/A |
|
1,200 |
|
N/A |
|
N/A |
| Rieles |
|
N/A |
|
N/A |
|
N/A |
|
N/A |
|
N/A |
|
N/A |
| Sorpresa |
|
40 |
|
47 |
|
N/A |
|
1,561 |
|
1,743 |
|
N/A |
| Ventura |
|
70 |
|
99 |
|
N/A |
|
2,100 |
|
7,246 |
|
N/A |
| Veta
NW |
|
56 |
|
24 |
|
N/A |
|
2,314 |
|
1,054 |
|
N/A |
| Victoria |
|
36 |
|
97 |
|
N/A |
|
1,235 |
|
3,012 |
|
N/A |
| Vista
Norte |
|
63 |
|
90 |
|
N/A |
|
508 |
|
1,041 |
|
N/A |
| 14
–Mineral Resource Estimates |
66 |
| |
|
| Signature
Date: March 25, 2021 |
|
Technical
Report El Peñón Mine, Chile
Specific
gravity (or density) measurements using the water immersion method were performed on core samples and on specimens collected underground.
Approximately 670 samples were analyzed at the University of Antofagasta between September 2011 and July 2014, and 7% of those
samples were cross-checked at Laboratorio Geoanalítica in Antofagasta. Average bulk densities were calculated for each
zone (Table 14-3) and single density values were assigned to the block models for each zone for both mineralization and waste.
Table
14-3: Specific gravity density values assigned to each zone
| Zone |
|
SG |
| 505 |
|
2.36 |
| 506 |
|
2.36 |
| Abundancia |
|
2.40 |
| Aleste |
|
2.57 |
| Angelina |
|
2.44 |
| Angosta |
|
2.40 |
| Bermellón |
|
2.43 |
| Bermuda |
|
2.40 |
| Bonanza |
|
2.57 |
| Borde
Oeste |
|
2.40 |
| Caracoles |
|
2.40 |
| Carmín |
|
2.43 |
| Cerro
Martillo |
|
2.40 |
| Cerro
Martillo CS |
|
2.40 |
| Chiquilla
Chica |
|
2.40 |
| Diablada |
|
2.44 |
| Zone |
|
SG |
| Discovery
Wash |
|
2.43 |
| Dominador |
|
2.40 |
| Dorada |
|
2.40 |
| Dorada
SW |
|
2.40 |
| El
Valle |
|
2.43 |
| Escarlata |
|
2.43 |
| Esmeralda |
|
2.40 |
| Esperanza |
|
2.40 |
| Fortuna |
|
2.40 |
| Fortuna
Este |
|
2.40 |
| Laguna |
|
2.40 |
| Lazo |
|
2.43 |
| Magenta |
|
2.43 |
| Martillo
Flat |
|
2.40 |
| Orito
Norte |
|
2.44 |
| Orito
Sur |
|
2.36 |
| Zone |
|
SG |
| Orito
West |
|
2.44 |
| La
Paloma |
|
2.40 |
| Pampa
Campamento |
|
2.43 |
| Pampa
Providencia |
|
2.40 |
| PAV |
|
2.50 |
| Playa |
|
2.36 |
| Providencia |
|
2.40 |
| Púrpura |
|
2.43 |
| Quebrada
Colorada Sur |
|
2.43 |
| Rieles |
|
2.40 |
| Sorpresa |
|
2.43 |
| Ventura |
|
2.57 |
| Veta
NW |
|
2.40 |
| Vista
Norte |
|
2.44 |
Variography
used at El Peñón for mineral resource estimation is based on the report “Actualización de modelos variográficos
– El Peñón” dated August 5, 2015 and authored by independent consultants Octal Ingeniería y Desarrollo
and Magri Consultores Limitada. The methodology used by the consultants is described below.
Correlograms
were computed for every vein, since, in the presence of high-grade outliers, correlograms are more stable than traditional semi-variograms.
Experimental correlograms were calculated in the strike, dip, and pole direction of each vein using combined drill hole and underground
channel data, considering data from all the splays as part of a single population. Nugget effect values were obtained from “down-the-hole”
correlograms. Typical experimental correlogram calculation parameters are shown in Table 14-4. Examples of typical experimental
correlograms and adjusted models are shown in Figure 14-2 for the 505 and Magenta veins. Variogram model parameters for both zones
are used as examples and are shown in Table 14-5.
| 14
–Mineral Resource Estimates |
67 |
| |
|
| Signature
Date: March 25, 2021 |
|
Technical
Report El Peñón Mine, Chile
Table
14-4: Typical calculation parameters for experimental correlograms
| Color | |
Direction | |
Azimuth Tolerance | |
Azimuth Band | |
Dip Tolerance | |
Dip Band | |
Lag | |
Lag Tolerance |
| Red | |
Dip | |
22.5° | |
15 m | |
22.5° | |
30 m | |
Level Spacing | |
1/2 Lag |
| Green | |
Strike | |
22.5° | |
30 m | |
22.5° | |
1/2 Level Spacing | |
Face Sample Spacing | |
1/2 Lag |
| Blue | |
Pole | |
22.5° | |
10 m | |
22.5° | |
1/2 Level Spacing | |
1m | |
1/2 Lag |
Table
14-5: Correlogram model parameters for 505 and Magenta veins
| Element |
|
Vein |
|
Structure |
|
Contribution |
|
Model |
|
R1x |
|
R1y |
|
R1z |
|
Angle1 |
|
Angle1 |
|
Angle1 |
| |
(m) |
|
(m) |
|
(m) |
|
1
(°) |
|
2
(°) |
|
3
(°) |
| Au |
|
505 |
|
C0 |
|
0.15 |
|
Nugget |
|
- |
|
- |
|
- |
|
- |
|
- |
|
- |
| |
|
C1 |
|
0.67 |
|
Exp |
|
4.0 |
|
1.5 |
|
3.0 |
|
260 |
|
-75 |
|
0 |
| |
|
C2 |
|
0.15 |
|
Exp |
|
32.5 |
|
19.5 |
|
3.0 |
|
260 |
|
-75 |
|
0 |
| |
|
C3 |
|
0.03 |
|
Sph |
|
60.0 |
|
44.0 |
|
3.0 |
|
260 |
|
-75 |
|
0 |
| |
Magenta |
|
C0 |
|
0.60 |
|
Nugget |
|
- |
|
- |
|
- |
|
- |
|
- |
|
- |
| |
|
C1 |
|
0.28 |
|
Exp |
|
25.0 |
|
6.0 |
|
2.0 |
|
275 |
|
-70 |
|
0 |
| |
|
C2 |
|
0.12 |
|
Sph |
|
70.0 |
|
65.0 |
|
2.0 |
|
275 |
|
-70 |
|
0 |
| Ag |
|
505 |
|
C0 |
|
0.20 |
|
Nugget |
|
- |
|
- |
|
- |
|
- |
|
- |
|
- |
| |
|
C1 |
|
0.55 |
|
Exp |
|
16.0 |
|
1.5 |
|
3.0 |
|
260 |
|
-75 |
|
0 |
| |
|
C2 |
|
0.19 |
|
Sph |
|
21.0 |
|
32.0 |
|
13.0 |
|
260 |
|
-75 |
|
0 |
| |
|
C3 |
|
0.06 |
|
Sph |
|
65.0 |
|
60.0 |
|
15.0 |
|
260 |
|
-75 |
|
0 |
| |
Magenta |
|
C0 |
|
0.20 |
|
Nugget |
|
- |
|
- |
|
- |
|
- |
|
- |
|
- |
| |
|
C1 |
|
0.53 |
|
Exp |
|
12.0 |
|
3.0 |
|
2.5 |
|
275 |
|
-70 |
|
0 |
| |
|
C2 |
|
0.19 |
|
Sph |
|
60.0 |
|
52.0 |
|
2.5 |
|
275 |
|
-70 |
|
0 |
| |
|
C3 |
|
0.08 |
|
Sph |
|
95.0 |
|
70.0 |
|
2.5 |
|
275 |
|
-70 |
|
0 |
1
The rotation angles are shown in GSLIB convention.
| 14
–Mineral Resource Estimates |
68 |
| |
|
| Signature
Date: March 25, 2021 |
|
Technical
Report El Peñón Mine, Chile

Figure
14-2: Experimental gold and silver correlograms and fitted correlograms models for the 505 and Magenta veins
| 14
–Mineral Resource Estimates |
69 |
| |
|
| Signature
Date: March 25, 2021 |
|
Technical
Report El Peñón Mine, Chile
A
total of 39 independent block models were constructed for every mining zones at El Peñón. Typical block models contain
one to three main veins. Block models were constructed using a common parent block size of 20 × 20 × 20 m and sub-block
size of 0.5 × 0.5 × 0.5 m. The main block model variables are described in Table 14-6. Additional flag and distance
variables are not shown. A summary of the 39 block models, as well as the zones in which each one is located, are shown in Table
14-7.
Table
14-6: Generalized block model variables
| Variable |
Format |
Description |
| Density |
Float
(Real * 4) |
Bulk
density assigned per vein |
| Shellug |
Integer
(Integer * 4) |
Vein
code |
| ug |
Integer
(Integer * 4) |
Splay
(estimation domain) code |
| au1 |
Float
(Real * 4) |
Estimated
gold grade (g/t) |
| ag1 |
Float
(Real * 4) |
Estimated
silver grade (g/t) |
| Categ |
Integer
(Integer * 4) |
Original
resource classification |
| Class |
Integer
(Integer * 4) |
Resource
classification based on majority criteria |
| aunn1 |
Float
(Real * 4) |
Gold
grade estimated by nearest neighbour (g/t) |
| agnn1 |
Float
(Real * 4) |
Silver
grade estimated by nearest neighbour (g/t) |
| 14
–Mineral Resource Estimates |
70 |
| |
|
| Signature
Date: March 25, 2021 |
|
Technical
Report El Peñón Mine, Chile
Table
14-7: Block models per veins and per mining zones
| Veins |
Mining
Zone |
Model
Name |
| 505
and 506 |
Orito |
ye20_505_506_class.bmf |
| Abundancia |
Bloque
Norte |
ye20_abundancia_class.bmf |
| Aleste |
Bloque
Norte |
ye20_aleste_class.bmf |
| Angelina,
Diablada, Orito Norte |
Orito |
ye20_oritonorte_class.bmf |
| Angosta |
Bloque
Norte |
ye20_angosta_class.bmf |
| Bermellón |
Quebrada
Colorada |
ye20_bermellon_class.bmf |
| Bermuda |
Quebrada
Colorada |
ye20_bermuda_class.bmf |
| Bonanza |
Bloque
Norte |
ye20_Bonanza_class.bmf |
| Borde
Oeste |
Bloque
Norte |
ye20_bordeoeste_class.bmf |
| Caracoles,
Dominador |
Fortuna |
ye20_Dom_Cac_class.bmf |
| Carmín,
Escarlata |
Quebrada
Colorada |
ye20_carmin_class.bmf |
| Cerro
Martillo |
Dorada
- Cerro Martillo |
ye20_cma_class.bmf |
| Cerro
Martillo Central Sur |
Dorada
- Cerro Martillo |
ye20_cmcs_class.bmf |
| Chiquilla
Chica |
Chiquilla
Chica |
ye20_chiquilla_class.bmf |
| Discovery
Wash |
Quebrada
Colorada |
ye20_dwa_class.bmf |
| Dorada |
Dorada
- Cerro Martillo |
ye20_dorada_class_v1.bmf |
| Dorada
SW |
Dorada
- Cerro Martillo |
ye20_dorada-sw_class.bmf |
| El
Valle |
Quebrada
Colorada |
ye20_eva_class.bmf |
| Esmeralda,
Esperanza |
Bloque
Norte |
ye20_esm-esp_class.bmf |
| Fortuna |
Fortuna |
ye20_fortuna_class.bmf |
| Fortuna
Este |
Fortuna |
ye20_fortuna_este_class.bmf |
| Laguna,
Laguna West |
Laguna |
y20_lag_class.bmf |
| Lazo |
Quebrada
Colorada |
ye20_lazo_class.bmf |
| Magenta |
Quebrada
Colorada |
ye20_mag_class.bmf |
| Martillo
Flat |
Dorada
- Cerro Martillo |
ye20_mflt_class_v2.bmf |
| Orito
Sur |
Orito |
ye20_oritosur_class.bmf |
| Orito
West |
Orito |
ye20_orito_west_class.bmf |
| La
Paloma |
Bloque
Norte |
ye20_paloma_class_v2.bmf |
| Pampa
Campamento, Sorpresa |
Quebrada
Colorada |
ye20_pca_sor_class_v1.bmf |
| Pampa
Providencia |
Quebrada
Colorada |
ye20_pprv_class.bmf |
| PAV
(Elizabeth, Victoria) |
Pampa
Augusta Victoria |
ye20_PAV_class.bmf |
| Playa |
Orito |
ye20_playa_class.bmf |
| Providencia |
Dorada
- Cerro Martillo |
ye20_providencia_class_v1.bmf |
| Púrpura |
Quebrada
Colorada |
ye20_purpura_class.bmf |
| Quebrada
Colorada Sur |
Quebrada
Colorada |
ye20_colorada_sur_class.bmf |
| Rieles |
Bloque
Norte |
ye20_rieles_class.bmf |
| Ventura |
Bloque
Norte |
ye20_ventura_class.bmf |
| Veta
NW |
Dorada
- Cerro Martillo |
ye20_vnw_class.bmf |
| Vista
Norte |
Orito |
ye20_vistanorte_class.bmf |
| 14
–Mineral Resource Estimates |
71 |
| |
|
| Signature
Date: March 25, 2021 |
|
Technical
Report El Peñón Mine, Chile
Gold
and silver grades were interpolated into block using ID3, taking into account anisotropic distances for weight calculations and
considering hard boundaries between domains. Search ellipses were rotated to orient the first axis along the strike direction
of the vein, the second axis along the dip direction, and the third axis along the pole direction. Anisotropic distance factors
were generally set equal to 80% to 100% of the range of the correlogram model. A summary of typical estimation and search parameters
is shown in Table 14-8.
Table
14-8: Summary of the typical estimation search parameters
| Estimation Pass1 | |
1st | |
2nd | |
3rd | |
4th | |
5th | |
6th |
| Block type2 | |
ST | |
ST | |
ST | |
LT | |
LT | |
LT |
| Sample type3 | |
CH | |
CH | |
CH | |
CH+DH | |
DH | |
DH |
| Interpolation method | |
ID3 | |
ID3 | |
ID3 | |
ID3 | |
ID3 | |
ID3 |
| Search range X (m) - Along strike | |
5 | |
15 | |
30 | |
15 | |
35 | |
60 |
| Search range Y (m) - Along dip | |
20 | |
30 | |
30 | |
15 | |
35 | |
60 |
| Search range Z (m) - Perpendicular | |
5 | |
10 | |
15 | |
5 | |
10 | |
15 |
| Minimum number of composites | |
6 | |
4 | |
3 | |
4 | |
3 | |
1 |
| Maximum number of composites | |
8 | |
8 | |
8 | |
8 | |
8 | |
8 |
| Octant search | |
No | |
No | |
No | |
No | |
No | |
No |
| Minimum number of octant | |
- | |
- | |
- | |
- | |
- | |
- |
| Minimum number of composites/octant | |
- | |
- | |
- | |
- | |
- | |
- |
| Maximum number of composites/octant | |
- | |
- | |
- | |
- | |
- | |
- |
| Maximum number of composites/DH | |
2 | |
2 | |
2 | |
2 | |
2 | |
- |
1 Parameters can change slightly for some veins
2 ST: Blocks located in zones supported by channels; LT: Blocks located in zones supported by drill holes
3 CH: Channel samples; DH: Drill hole samples
| 14.9 | Block
Model Validation |
Block
models were validated by means of global bias checks (between estimated means and declustered composite means obtained by Nearest
Neighbor estimation), swath-plots against Nearest Neighbor estimates, and graphic analysis of charts showing results displaying
both the estimated grades and the informing composite grades in plan views and long sections. The following tables and figures
illustrate examples of the validations and results obtained for the 505 and Magenta veins. Table 14-9 and Table 14-10 show the
statistical differences between the ID3 and NN model results. Figure 14-3 and Figure 14-4 show swath-plots for the 505 and Magenta
veins, with the average gold grades estimated by ID3 (in red) and by NN (in black), and the informing capped composites (in blue).
The
results of the validation are considered to be adequate, demonstrating that the estimated models honour the input data both visually
and statistically.
| 14
–Mineral Resource Estimates |
72 |
| |
|
| Signature
Date: March 25, 2021 |
|
Technical
Report El Peñón Mine, Chile
Table
14-9: Statistical validation of the estimated block model – 505 Vein
| Vein: 505 | |
ID3 | |
NN |
| Number of Blocks | |
4,769,947 | |
4,769,947 |
| Gold Statistics (Au g/t) | |
| |
|
| Minimum | |
0.01 | |
0.01 |
| Q1 | |
3.72 | |
2.65 |
| Median | |
6.56 | |
5.51 |
| Q3 | |
10.98 | |
10.61 |
| Maximum | |
101.00 | |
101.00 |
| Mean | |
8.62 | |
8.61 |
| Standard Deviation | |
7.70 | |
9.60 |
| Variance | |
59.31 | |
92.07 |
| Coefficient of Variation | |
0.89 | |
1.11 |
Table
14-10: Statistical validation of the estimated block model – Magenta Vein
| Vein: Magenta | |
ID3 | |
NN |
| Number of Blocks | |
4,667,316 | |
4,667,316 |
| Gold Statistics (Au g/t) | |
| |
|
| Minimum | |
0.00 | |
0.00 |
| Q1 | |
0.75 | |
0.39 |
| Median | |
3.91 | |
3.26 |
| Q3 | |
13.10 | |
11.31 |
| Maximum | |
115.46 | |
115.46 |
| Mean | |
11.30 | |
11.55 |
| Standard Deviation | |
18.17 | |
21.16 |
| Variance | |
330.06 | |
447.79 |
| Coefficient of Variation | |
1.61 | |
1.83 |
| 14
–Mineral Resource Estimates |
73 |
| |
|
| Signature
Date: March 25, 2021 |
|
Technical
Report El Peñón Mine, Chile
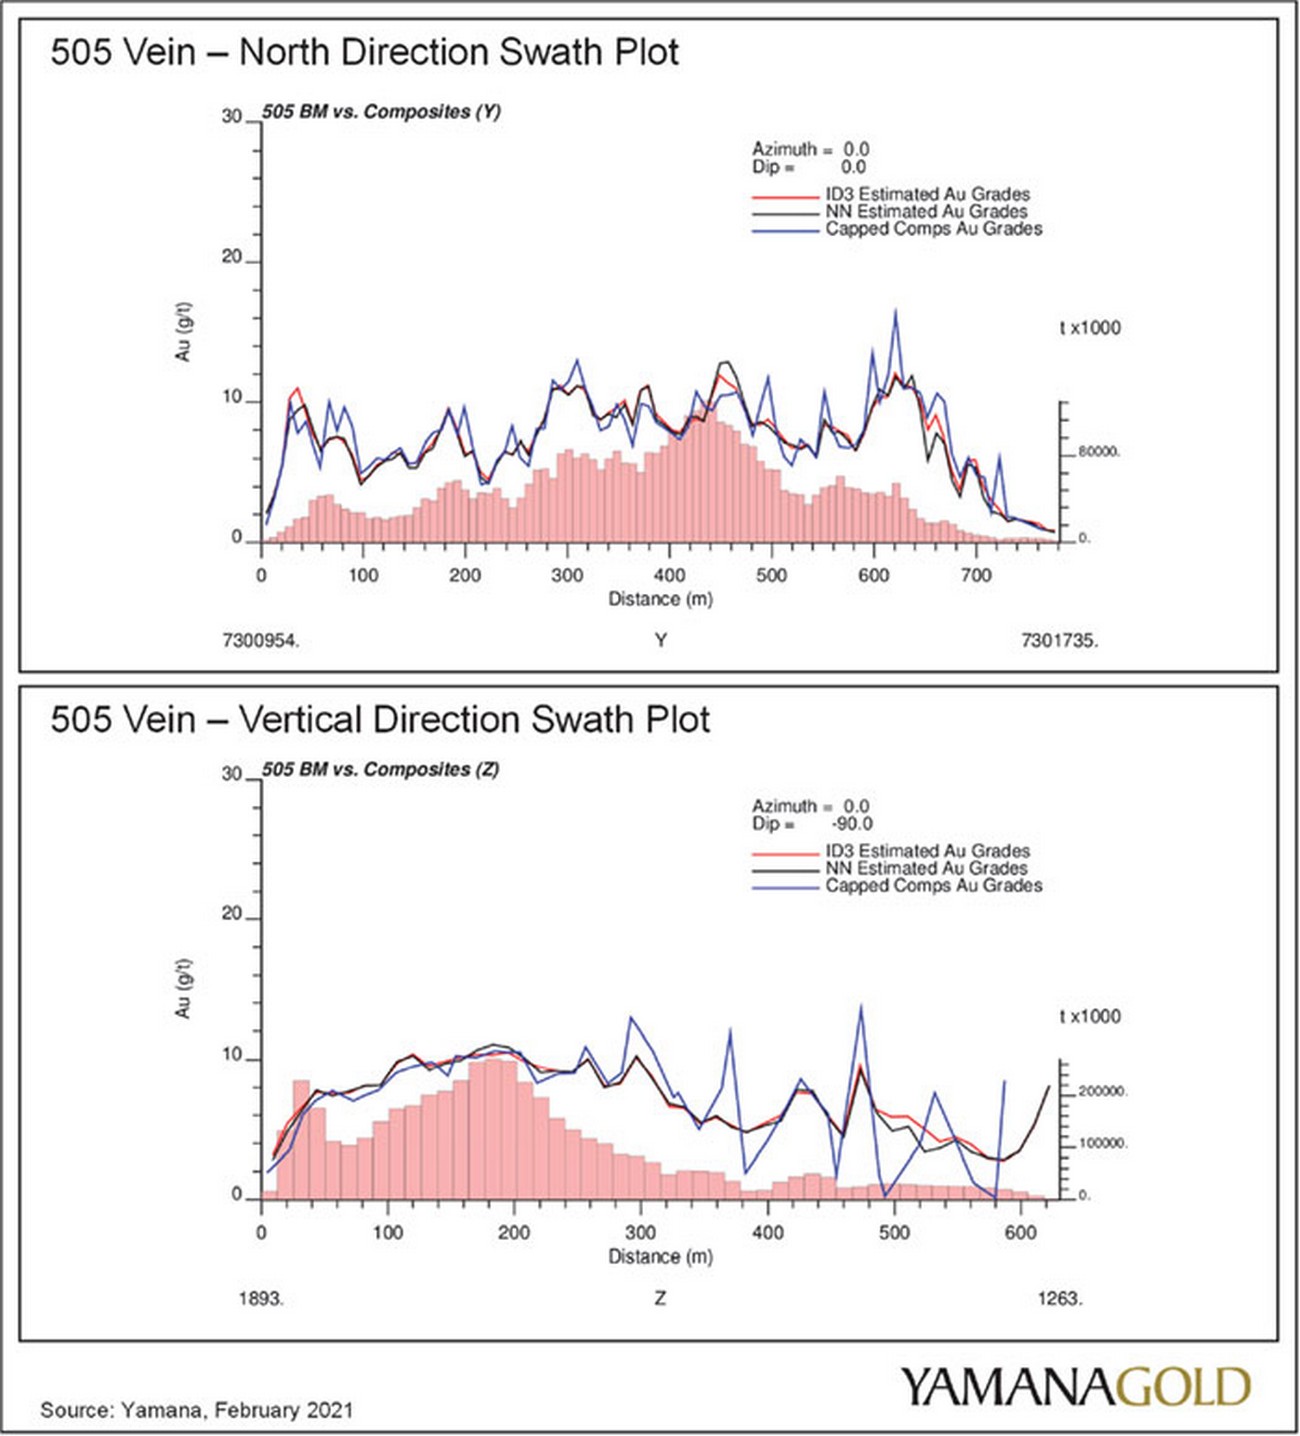
Figure
14-3: Gold swath plots for 505 Vein
| 14
–Mineral Resource Estimates |
74 |
| |
|
| Signature
Date: March 25, 2021 |
|
Technical
Report El Peñón Mine, Chile

Figure
14-4: Gold swath plots for Magenta Vein
| 14
–Mineral Resource Estimates |
75 |
| |
|
| Signature
Date: March 25, 2021 |
|
Technical
Report El Peñón Mine, Chile
| 14.10 | Resource
Classification |
Resource
classification was completed using an in-house algorithm which works according to the following workflow:
| • | Blocks
located in areas supported by underground channel samples are classified as measured
mineral resources. |
| • | Blocks
located in areas supported by drill hole information and that are within a 10 m-radius
from underground channel samples are classified as indicated mineral resources. |
| • | Blocks
supported only by drillholes are classified as indicated mineral resources if they meet
both following criteria: Blocks are contained within a 26.25 m-search square from
a single informing intercept AND the informing intercept is contained within a 52.5 m
search square that includes at least one additional informing intercept. Distances defining
both search squares are measured in the plane of the vein plane (in the strike and dip
directions) and from the center (intercept position) to the edge of the search square. |
| • | The
remainder of the blocks estimated within the interpreted vein wireframes are classified
as inferred mineral resources. |
| • | Blocks
located outside the vein wireframes are not classified and are considered dilution for
mineral resources reporting. |
| • | Finally,
the mineral resource classification results are smoothed, using an in-house algorithm
based on local classification proportions, to remove geometrical artifacts. The local
proportions are calculated in a 10 × 10 m moving window. |
| 14.11 | Resource
Estimation of Stockpiles and Tailings |
In
addition to the 39 block models constructed by applying the methodologies previously described, mineral resources contained within
the Escarlata low-grade stockpile and within tailings are also reported.
In
January 2018, El Peñón commissioned a conceptual metallurgical study to explore alternative extraction processes
to recover metal from tailings. Heap leaching was proposed as a viable option for metal extraction from tailings. Twenty shallow
boreholes were drilled on a 100 m-grid spacing, while the stockpile was drilled by 32 drill holes at a 25 m-grid spacing. Grade
estimations for the tailings and stockpile were based on capped assay data interpolated using ordinary kriging in three estimation
passes. Mineral resources contained in the stockpile are classified as indicated, while mineral resources contained in tailings
are classified as inferred.
| 14.12 | Mineral
Resource Estimate |
The
mineral resources are reported at El Peñón exclusive of mineral reserves and are prepared using conceptual mining
shapes (from Vulcan Stope Optimiser (VSO)) that are based on a cut-off value of US$95.31/t, which corresponds to 75% of the cut-off
value used to estimate mineral reserves (described in Section 15.3). The cut-off value is based on the calculation parameters
shown in Table 14-11.
| 14
–Mineral Resource Estimates |
76 |
| |
|
| Signature
Date: March 25, 2021 |
|
Technical
Report El Peñón Mine, Chile
Mined
out, sterilized (non- mineable blocks), and current mineral reserves are subtracted from the block models. SMUs measuring 5 m-long
× 4 m-high, similar to cut-and-fill SMUs, are then constructed using Vulcan Stope Optimiser (VSO) using a minimum mining
width of 0.60 m and hanging wall and footwall overbreaks of 0.30 m (per side).
Blocks
lying outside the interpreted geological vein wireframes are considered to have zero gold and silver grades for stope optimization.
Subsequently, the constructed SMUs are classified by majority criteria into measured, indicated, or inferred categories, and are
included into the mineral resources inventory and reported fully diluted.
Mineral
resources are reported at cut-off grades of 0.50 g/t gold-equivalent for resources contained in tailings and at 0.79 g/t gold-equivalent
for those contained in stockpiles.
The
use of constraining conceptual mining shapes to report underground mineral resources and cut-offs to report mineral resources
contained in stockpiles and tailings demonstrate that the “reasonable prospects for eventual economic extraction”
criteria, as defined in the CIM (2014) Standards, is met.
Table
14-11: Resource NSR cut-off value calculation parameters
| Parameters | |
Units | |
Value |
| Gold Price | |
US$/oz | |
1,250 |
| Silver Price | |
US$/oz | |
18 |
| Gold Selling Cost | |
US$/oz | |
11.22 |
| Silver Selling Cost | |
US$/oz | |
0.13 |
| Gold Metallurgical Recovery | |
% | |
Model |
| Silver Metallurgical Recovery | |
% | |
Model |
| Underground Mining Cost | |
US$/t ore mined | |
80.10 |
| Process Cost | |
US$/t processed | |
29.42 |
| G&A Cost | |
US$/t processed | |
13.46 |
| Sustaining Capital Cost | |
US$/t processed | |
4.10 |
| Premium on Cut-Off | |
% | |
25 |
| Mineral Resources Cut-Off Value | |
US$/t | |
95.31 |
The
Mineral Resource Statement for El Peñón as of December 31, 2020, exclusive of mineral reserves, is presented at
the beginning of this Section 14 in Table 14-1. A summary of the mineral resources by mining block is presented in Table 14-12.
The
qualified person responsible for this section of the technical report is not aware of any environmental, permitting, legal, title,
taxation, socio-economic, marketing, political or other relevant factors that could materially affect the mineral resource estimate.
| 14
–Mineral Resource Estimates |
77 |
| |
|
| Signature
Date: March 25, 2021 |
|
Technical
Report El Peñón Mine, Chile
Table
14-12: Summary of El Peñón mineral resources by zone, as of December 31, 2020
| Zone
|
|
Tonnage |
|
Au |
|
Ag |
|
Au
|
|
Ag |
| |
(kt) |
|
(g/t)
|
|
(g/t)
|
|
(koz) |
|
(koz) |
| Measured |
| Bloque
Norte |
|
142 |
|
5.59 |
|
212.7 |
|
26 |
|
971 |
| Chiquilla
Chica |
|
9 |
|
0.61 |
|
645.8 |
|
0 |
|
189 |
| Dorada
- Cerro Martillo |
|
109 |
|
3.64 |
|
189 |
|
13 |
|
661 |
| Fortuna |
|
15 |
|
3.62 |
|
240.6 |
|
2 |
|
118 |
| Laguna |
|
8 |
|
7.97 |
|
74.7 |
|
2 |
|
19 |
| Pampa
Augusta Victoria |
|
39 |
|
3.98 |
|
196 |
|
5 |
|
246 |
| Quebrada
Colorada |
|
142 |
|
4.82 |
|
105.1 |
|
22 |
|
479 |
| Quebrada
Orito |
|
203 |
|
5.21 |
|
58.3 |
|
34 |
|
379 |
| Stockpile |
|
– |
|
– |
|
– |
|
– |
|
– |
| Tailings |
|
– |
|
– |
|
– |
|
– |
|
– |
| Total
Measured |
|
667 |
|
4.81 |
|
143 |
|
103 |
|
3,063 |
| Indicated |
| Bloque
Norte |
|
1,194 |
|
3.38 |
|
113.8 |
|
130 |
|
4,370 |
| Chiquilla
Chica |
|
84 |
|
0.42 |
|
298.5 |
|
1 |
|
809 |
| Dorada
- Cerro Martillo |
|
2,645 |
|
2.63 |
|
117 |
|
224 |
|
9,950 |
| Fortuna |
|
251 |
|
2.62 |
|
183.6 |
|
21 |
|
1,485 |
| Laguna |
|
50 |
|
3.52 |
|
30.6 |
|
6 |
|
50 |
| Pampa
Augusta Victoria |
|
213 |
|
2.89 |
|
95.6 |
|
20 |
|
654 |
| Quebrada
Colorada |
|
1,103 |
|
3.17 |
|
84.1 |
|
112 |
|
2,983 |
| Quebrada
Orito |
|
814 |
|
4.25 |
|
47.2 |
|
111 |
|
1,235 |
| Stockpile |
|
1,019 |
|
1.13 |
|
28.8 |
|
37 |
|
942 |
| Tailings |
|
– |
|
– |
|
– |
|
– |
|
– |
| Total
Indicated |
|
7,374 |
|
2.79 |
|
94.8 |
|
662 |
|
22,478 |
| Measured
+ Indicated |
| Bloque
Norte |
|
1,336 |
|
3.61 |
|
124.3 |
|
155 |
|
5,342 |
| Chiquilla
Chica |
|
93 |
|
0.44 |
|
332.4 |
|
1 |
|
999 |
| Dorada
- Cerro Martillo |
|
2,754 |
|
2.67 |
|
119.8 |
|
236 |
|
10,612 |
| Fortuna |
|
267 |
|
2.68 |
|
186.9 |
|
23 |
|
1,602 |
| Laguna |
|
58 |
|
4.13 |
|
36.7 |
|
8 |
|
69 |
| Pampa
Augusta Victoria |
|
252 |
|
3.06 |
|
111.2 |
|
25 |
|
900 |
| Quebrada
Colorada |
|
1,244 |
|
3.36 |
|
86.5 |
|
134 |
|
3,462 |
| Quebrada
Orito |
|
1,017 |
|
4.44 |
|
49.4 |
|
145 |
|
1,614 |
| Stockpile |
|
1,019 |
|
1.13 |
|
28.8 |
|
37 |
|
942 |
| Tailings |
|
– |
|
– |
|
– |
|
– |
|
– |
| Total
M+I |
|
8,041 |
|
2.96 |
|
98.8 |
|
765 |
|
25,541 |
| 14
–Mineral Resource Estimates |
78 |
| |
|
| Signature
Date: March 25, 2021 |
|
Technical
Report El Peñón Mine, Chile
| Zone |
|
Tonnage |
|
Au |
|
Ag |
|
Au
|
|
Ag |
| |
(kt) |
|
(g/t)
|
|
(g/t)
|
|
(koz) |
|
(koz) |
| Inferred |
| Bloque
Norte |
|
1,414 |
|
4.23 |
|
115 |
|
192 |
|
5,227 |
| Chiquilla
Chica |
|
286 |
|
0.31 |
|
288.4 |
|
3 |
|
2,656 |
| Dorada
- Cerro Martillo |
|
1,141 |
|
3.19 |
|
123 |
|
117 |
|
4,510 |
| Fortuna |
|
243 |
|
3.11 |
|
221.8 |
|
24 |
|
1,734 |
| Laguna |
|
18 |
|
2.94 |
|
36.6 |
|
2 |
|
21 |
| Pampa
Augusta Victoria |
|
147 |
|
2.68 |
|
171.3 |
|
13 |
|
810 |
| Quebrada
Colorada |
|
1,291 |
|
3.78 |
|
101.2 |
|
157 |
|
4,198 |
| Quebrada
Orito |
|
668 |
|
4.54 |
|
28 |
|
98 |
|
602 |
| Stockpile |
|
– |
|
– |
|
– |
|
– |
|
– |
| Tailings |
|
13,767 |
|
0.55 |
|
18.9 |
|
245 |
|
8,380 |
| Total
Inferred |
|
18,975 |
|
1.39 |
|
46.1 |
|
850 |
|
28,138 |
| 1. | Mineral
resources are reported exclusive of mineral reserves |
| 2. | Mineral
resources are not mineral reserves and do not have demonstrated economic viability |
| 3. | Underground
mineral resources are estimated at a cut-off NSR of US$95.31/t, which corresponds to
75% of the mineral reserves cut-off value. Underground mineral resources are reported
fully diluted within constraining conceptual mining shapes: they consider a minimum mining
width of 0.60 m and hanging wall and footwall overbreak dilutions of 0.30 m each to determine
reasonable prospects of economic extraction. |
| 4. | Mineral
resources contained in tailings and stockpiles are reported at a cut-off grade of 0.50
g/t and 0.79 g/t gold-equivalent, respectively. |
| 5. | All
figures are rounded to reflect the relative accuracy of the estimate |
| 6. | Numbers
may not add up due to rounding |
| 14
–Mineral Resource Estimates |
79 |
| |
|
| Signature
Date: March 25, 2021 |
|
Technical
Report El Peñón Mine, Chile
| 15 | Mineral
Reserve Estimates |
| 15.1 | Mineral
Reserve Summary |
The
Mineral Reserve Statement of El Peñón as of December 31, 2020, is presented in Table 15-1.
Table
15-1: El Peñón Mineral Reserve Statement as of December 31, 2020
| Mineral
Reserves |
|
Category |
|
Tonnage |
|
Grade |
|
Contained
Metal |
| |
|
(kt) |
|
Au
(g/t) |
|
Ag
(g/t) |
|
Au
(koz) |
|
Ag
(koz) |
| Open
Pit |
|
Proven |
|
– |
|
– |
|
– |
|
– |
|
– |
| |
Probable |
|
53 |
|
0.34 |
|
316.2 |
|
1 |
|
543 |
| |
Total
Open Pit |
|
53 |
|
0.34 |
|
316.2 |
|
1 |
|
543 |
| Underground |
|
Proven |
|
368 |
|
5.73 |
|
213.4 |
|
68 |
|
2,526 |
| |
Probable |
|
5,068 |
|
5.07 |
|
158.6 |
|
826 |
|
25,835 |
| |
Total
Underground |
|
5,436 |
|
5.12 |
|
162.3 |
|
894 |
|
28,361 |
| Stockpile |
|
Proven |
|
9 |
|
1.40 |
|
54.1 |
|
0 |
|
16 |
| |
Probable |
|
651 |
|
1.26 |
|
14.1 |
|
26 |
|
294 |
| |
Total
Stockpile |
|
660 |
|
1.26 |
|
14.6 |
|
27 |
|
310 |
| Combined |
|
Proven |
|
377 |
|
5.63 |
|
209.5 |
|
68 |
|
2,542 |
| |
Probable |
|
5,772 |
|
4.60 |
|
143.7 |
|
853 |
|
26,672 |
| |
Grand
Total |
|
6,149 |
|
4.66 |
|
147.8 |
|
921 |
|
29,214 |
| 1. | Mineral
reserves have been estimated by the El Peñón long-term mine planning team
under the supervision of Sergio Castro, Registered Member of the Chilean Mining Commission,
a full-time employee of Minera Meridian Limitada, and a qualified person as defined by
National Instrument 43-101. The estimate conforms to the CIM Definition Standards on
Mineral Resources and Reserves. Mineral reserves are stated at a mill feed reference
point and allow for dilution and mining losses. Metal price assumptions of US$1,250/oz
for gold and US$18.00/oz for silver were used. |
| 2. | Open-pit
mineral reserves are reported at a cut-off NSR of US$ 49.14/t. Processing recoveries
assumptions range from 84.13% to 89.22% for gold and from 79.71% to 81.67% for silver.
Mine operating (including transport), processing and G&A costs assumptions of US$6.27/t
and US$29.42/t and US$13.46/t were considered, respectively. |
| 3. | Underground
mineral reserves are reported at an NSR cut-off of US$127.08/t (Section 15.3). Processing
recoveries assumptions range from 84.13% to 97.38% for gold and from 56.47% to 92.33%
for silver. The following cost assumptions were considered: mine-operating cost: US$80.10/t;
processing cost: US$29.42/t; sustaining capital cost: US$4.10/t, and G&A cost: US$13.46/t.
A royalty of 2% was considered for reserves planned to be mined in the Fortuna zone. |
| 4. | Mineral
reserves contained in low-grade stockpiles are reported at a cut-off grade of 0.90 g/t
gold-equivalent. Processing recoveries assumptions of 95.2% for gold and 83.0% for silver
were used. Operating and processing costs assumptions of US$2.02/t and US$29.42/t, respectively,
were considered. |
| 5. | Mineral
reserves are reported as of December 31, 2020. |
| 6. | All
figures are rounded to reflect the relative accuracy of the estimate. |
| 7. | Numbers
may not add up due to rounding. |
| 15
–Mineral Reserve Estimates |
80 |
| Signature
Date: March 25, 2021 |
|
Technical
Report El Peñón Mine, Chile
| 15.2 | Conversion
Methodology |
The
methodology used at El Peñón to convert mineral resources to mineral reserves is summarized as follows:
| • | Drift
and bench (stope) selective mining units (SMUs) are designed using Vulcan Stope Optimiser,
based on the design parameters summarized in Table 15-3 and Table 15-4. |
| • | The
metal prices, processing recoveries, and operating costs summarized in Table 15-2 are
used to determine an economic score for each SMU. Only measured and indicated mineral
resources are considered for conversion to mineral reserves. |
| • | SMUs
with positive scores are analyzed for inclusion into the mineral reserve inventory. This
is done by analyzing development costs, considering the capital and auxiliary development
required to enable mining of the designed SMUs, such as the cost of ramps, ventilation,
materials handling, and development of access and infrastructure. |
| • | Before
including SMUs with positive scores in the mineral reserves inventory, geomechanical
considerations are revised, especially in areas with known poor ground conditions or
were pillars between the new stopes and previously backfilled areas are thin. Design
is adjusted when required. |
| • | Finally,
small amounts of supplementary lower-grade drift segment that must be developed to enable
mining of the higher-grade mineral reserves are also included in the mineral reserves
inventory, since this improves the cashflow generation profile. This material represents
approximately 1% of the mineral reserves inventory. |
| • | SMUs
containing a majority portion of measured or indicated blocks are converted to proven
or probable mineral reserves, respectively. |
The
mineral reserves for El Peñón were completed using a break-even cut-off value of US$49.14/t for open pit and US$127.08/t
for underground.
The
cut-off grade used for reporting mineral reserves contained in the low-grade stockpiles was 0.90 g/t gold-equivalent. The parameters
used to determine the NSR cut-off value are summarized in Table 15-2.
| 15
–Mineral Reserve Estimates |
81 |
| Signature
Date: March 25, 2021 |
|
Technical
Report El Peñón Mine, Chile
Table
15-2: NSR cut-off value calculation parameters for mineral reserves
| Parameters | |
Units | |
Value |
| Gold Price | |
US$/oz | |
1,250 |
| Silver Price | |
US$/oz | |
18 |
| Gold Selling Cost | |
US$/oz | |
11.22 |
| Silver Selling Cost | |
US$/oz | |
0.13 |
| Gold Metallurgical Recovery | |
% | |
Model |
| Silver Metallurgical Recovery | |
% | |
Model |
| Underground Mining Cost | |
US$/t ore mined | |
80.10 |
| Process Cost | |
US$/t processed | |
29.42 |
| G&A Cost | |
US$/t processed | |
13.46 |
| Sustaining Capital Cost | |
US$/t processed | |
4.10 |
| Underground NSR Cut-Off Value | |
US$/t | |
127.08 |
| 15.4 | Design,
Dilution, and Mining Recovery Parameters |
Key
stope SMU design parameters used for generating the underground mineral reserves stope shapes are summarized by zone in Table
15-3. Due to the narrow vein width, split-blasting is usually applied at El Peñón, and ore drift SMUs are therefore
designed accordingly. Drift design parameters used for mineral reserve estimation are summarized in Table 15-4.
Table
15-3: Stope SMU design parameters by zone
| | |
Stope
Length | |
Minimum
Mining
Width | |
Minimum
Waste Pillar
Width | |
Hanging
Wall
Overbreak | |
Footwall
Overbreak | |
Mining
Recovery |
| Zone | |
(m) | |
(m) | |
(m) | |
(m) | |
(m) | |
% |
| Bloque Norte | |
5 | |
0.8 to 1.0 | |
3 | |
0.35 to 0.50 | |
0.35 to 0.50 | |
97.5 |
| Dorada - Cerro Martillo | |
5 | |
0.8 to 1.0 | |
3 | |
0.25 to 0.35 | |
0.25 to 0.35 | |
97.5 |
| Fortuna | |
5 | |
0.8 to 1.0 | |
3 | |
0.20 to 0.80 | |
0.20 to 0.80 | |
97.5 |
| Laguna | |
5 | |
0.8 to 1.0 | |
3 | |
0.20 to 0.40 | |
0.20 to 0.40 | |
97.5 |
| Pampa Augusta Victoria | |
5 | |
0.8 to 1.0 | |
3 | |
0.35 to 0.50 | |
0.35 to 0.50 | |
97.5 |
| Quebrada Colorada | |
5 | |
0.8 to 1.0 | |
3 | |
0.30 to 0.60 | |
0.30 to 0.60 | |
97.5 |
| Quebrada Orito | |
5 | |
0.8 to 1.0 | |
3 | |
0.50 to 1.10 | |
0.50 to 1.10 | |
97.5 |
Table
15-4: Drift (split blasting) SMU design parameters
| Parameter | |
Units | |
All Zones |
| Drift Height | |
m | |
4 |
| Drift Length | |
m | |
5 |
| Minimum Mining Width | |
m | |
0.60 |
| Hanging Wall Overbreak | |
m | |
0.25 |
| Footwall Overbreak | |
m | |
0.25 |
| Mining Recovery | |
% | |
100.0 |
| 15
–Mineral Reserve Estimates |
82 |
| Signature
Date: March 25, 2021 |
|
Technical
Report El Peñón Mine, Chile
Hanging
wall and footwall overbreaks are applied to the stope design of mineral reserves. The overbreaks consider actual stope reconciliation
for each zone and the stope span, which is determined by the sub-level spacing and maximum stope length opened before the backfill
cycle is started.
Mining
recovery factors are based on Cavity Monitoring System measurements taken from actual 2020 results.
Mine
to mill reconciliation for the period comprised between January 2018 and December 2020 is presented in Table 15-5. Differences
are within the expected ranges.
Table
15-5: Reconciliation
| Reconciliation
2018-2020 |
|
Tonnage |
|
Au |
|
Ag |
|
| |
(kt) |
|
(g/t)
|
|
(g/t)
|
|
| Total
mined and reclaimed from stockpiles - 2018 |
|
1,104 |
|
4.47 |
|
139.6 |
|
| Processed
feed reported 2018 |
|
1,104 |
|
4.53 |
|
131.3 |
|
| Difference
2018 (%) |
|
0.0 |
% |
1.4 |
% |
-5.9 |
% |
| Total
mined and reclaimed from stockpiles - 2019 |
|
1,290 |
|
4.09 |
|
124.0 |
|
| Processed
feed reported 2019 |
|
1,290 |
|
4.09 |
|
120.7 |
|
| Difference
2019 (%) |
|
0.0 |
% |
0.0 |
% |
-2.7 |
% |
| Total
mined and reclaimed from stockpiles - 2020 |
|
1,267 |
|
4.26 |
|
141.5 |
|
| Processed
feed reported 2020 |
|
1,267 |
|
4.22 |
|
138.9 |
|
| Difference
2020 (%) |
|
0.0 |
% |
-0.9 |
% |
-1.9 |
% |
| Total
mined and reclaimed from stockpiles - 2018 to 2020 |
|
3,661 |
|
4.26 |
|
134.8 |
|
| Processed
feed reported 2018 to 2020 |
|
3,661 |
|
4.27 |
|
130.2 |
|
| Difference
2018 to 2020 (%) |
|
0.0 |
% |
0.1 |
% |
-3.4 |
% |
| 15.6 | Mineral
Reserve Estimate |
The
Mineral Reserve Statement for El Peñón as of December 31, 2020, is presented at the beginning of Section 15 in Table
15-1. A summary of the mineral reserves by mining block is presented in Table 15-6.
The
qualified person responsible for this section of the technical report is not aware of any mining, metallurgical, infrastructure,
permitting, or other relevant factors that could materially affect the mineral reserve estimate.
| 15
–Mineral Reserve Estimates |
83 |
| Signature
Date: March 25, 2021 |
|
Technical
Report El Peñón Mine, Chile
Table
15-6: Summary of El Peñón mineral reserves by zone, as of December 31, 2020
| |
|
Proven |
|
Probable |
|
Proven + Probable |
| |
|
Tonnage |
|
Grade |
|
Contained Metal |
|
Tonnage |
|
Grade |
|
Contained Metal |
|
Tonnage |
|
Grade |
|
Contained Metal |
| |
|
(kt) |
|
Au (g/t) |
|
Ag (g/t) |
|
Au (koz) |
|
Ag (koz) |
|
(kt) |
|
Au (g/t) |
|
Ag (g/t) |
|
Au (koz) |
|
Ag (koz) |
|
(kt) |
|
Au (g/t) |
|
Ag (g/t) |
|
Au (koz) |
|
Ag (koz) |
| Underground |
|
|
|
|
|
|
|
|
|
|
|
|
|
|
|
|
|
|
|
|
|
|
|
|
|
|
|
|
|
|
| Bloque Norte |
|
18 |
|
6.07 |
|
230.4 |
|
3 |
|
132 |
|
1,043 |
|
5.80 |
|
139.7 |
|
195 |
|
4,683 |
|
1,061 |
|
5.81 |
|
141.2 |
|
198 |
|
4,815 |
| Dorada - Cerro Martillo |
|
160 |
|
4.32 |
|
277.1 |
|
22 |
|
1,428 |
|
1,778 |
|
3.93 |
|
200.4 |
|
225 |
|
11,459 |
|
1,939 |
|
3.96 |
|
206.8 |
|
247 |
|
12,887 |
| Fortuna |
|
25 |
|
4.73 |
|
300.2 |
|
4 |
|
238 |
|
240 |
|
4.46 |
|
310.2 |
|
34 |
|
2,390 |
|
264 |
|
4.49 |
|
309.3 |
|
38 |
|
2,628 |
| Laguna |
|
13 |
|
7.94 |
|
61.9 |
|
3 |
|
27 |
|
208 |
|
8.80 |
|
86.7 |
|
59 |
|
581 |
|
222 |
|
8.75 |
|
85.2 |
|
62 |
|
607 |
| Pampa Augusta Victoria |
|
5 |
|
5.93 |
|
279.0 |
|
1 |
|
44 |
|
4 |
|
3.85 |
|
80.9 |
|
1 |
|
11 |
|
9 |
|
4.96 |
|
187.2 |
|
1 |
|
55 |
| Quebrada Colorada |
|
93 |
|
8.09 |
|
181.8 |
|
24 |
|
541 |
|
1,348 |
|
5.29 |
|
132.5 |
|
229 |
|
5,741 |
|
1,441 |
|
5.47 |
|
135.6 |
|
253 |
|
6,283 |
| Quebrada Orito |
|
54 |
|
5.65 |
|
66.1 |
|
10 |
|
116 |
|
446 |
|
5.84 |
|
67.6 |
|
84 |
|
969 |
|
501 |
|
5.82 |
|
67.4 |
|
94 |
|
1,085 |
| Subtotal Underground |
|
368 |
|
5.73 |
|
213.4 |
|
68 |
|
2,526 |
|
5,068 |
|
5.07 |
|
158.6 |
|
826 |
|
25,835 |
|
5,436 |
|
5.12 |
|
162.3 |
|
894 |
|
28,361 |
| Open-Pit |
|
|
|
|
|
|
|
|
|
|
|
|
|
|
|
|
|
|
|
|
|
|
|
|
|
|
|
|
|
|
| Chiquilla Chica |
|
- |
|
- |
|
- |
|
- |
|
- |
|
53 |
|
0.34 |
|
316.2 |
|
1 |
|
543 |
|
53 |
|
0.34 |
|
316.2 |
|
1 |
|
543 |
| Subtotal Open Pit |
|
- |
|
- |
|
- |
|
- |
|
- |
|
53 |
|
0.34 |
|
316.2 |
|
1 |
|
543 |
|
53 |
|
0.34 |
|
316.2 |
|
1 |
|
543 |
| Totals |
|
|
|
|
|
|
|
|
|
|
|
|
|
|
|
|
|
|
|
|
|
|
|
|
|
|
|
|
|
|
| UG and Open-Pit Mine |
|
368 |
|
5.73 |
|
213.4 |
|
68 |
|
2,526 |
|
5,121 |
|
5.02 |
|
160.2 |
|
827 |
|
26,378 |
|
5,489 |
|
5.07 |
|
163.8 |
|
895 |
|
28,904 |
| Stockpile |
|
9 |
|
1.40 |
|
54.1 |
|
0 |
|
16 |
|
651 |
|
1.26 |
|
14.1 |
|
26 |
|
294 |
|
660 |
|
1.26 |
|
14.6 |
|
27 |
|
310 |
| Total Mineral Reserves |
|
377 |
|
5.63 |
|
209.5 |
|
68 |
|
2,542 |
|
5,772 |
|
4.60 |
|
143.7 |
|
853 |
|
26,672 |
|
6,149 |
|
4.66 |
|
147.8 |
|
921 |
|
29,214 |
| 1. | Mineral
reserves are stated at a mill feed reference point and allow for dilution and mining
losses. Metal price assumptions of US$1,250/oz for gold and US$18.00/oz for silver were
used. |
| 15
–Mineral Reserve Estimates |
84 |
| Signature
Date: March 25, 2021 |
|
Technical
Report El Peñón Mine, Chile
| 2. | Open-pit
mineral reserves are reported at a cut-off NSR of US$ 49.14/t. Processing recoveries
assumptions range from 84.13% to 89.22% for gold and from 79.71% to 81.67% for silver.
Mine operating (including transport), processing and G&A costs assumptions of US$6.27/t
and US$29.42/t and US$13.46/t were considered, respectively. |
| 3. | Underground
mineral reserves are reported at an NSR cut-off of US$127.08/t (Section 15.3). Processing
recoveries assumptions range from 84.13% to 97.38% for gold and from 56.47% to 92.33%
for silver. The following cost assumptions were considered: mine-operating cost: US$80.10/t;
processing cost: US$29.42/t; sustaining capital cost: US$4.10/t, and G&A cost: US$13.46/t.
A royalty of 2% was considered for reserves planned to be mined in the Fortuna zone. |
| 4. | Mineral
reserves contained in low-grade stockpiles are reported at a cut-off grade of 0.90 g/t
gold-equivalent. Processing recoveries assumptions of 95.2% for gold and 83.0% for silver
were used. Operating and processing costs assumptions of US$2.02/t and US$29.42/t, respectively,
were considered. |
| 5. | All
figures are rounded to reflect the relative accuracy of the estimate. |
| 6. | Numbers
may not add up due to rounding. |
| 15
–Mineral Reserve Estimates |
85 |
| Signature
Date: March 25, 2021 |
|
Technical
Report El Peñón Mine, Chile
Ore
from underground mines have recently been—and will continue to be—the main source of feed for the El Peñón
mill. Currently, ore is sourced from one small active open pit mine (Chiquilla Chica) and from five of the seven major underground
mining zones.
The
various underground mining zones are accessed by ramps; this type of access is suitable for this mine in light of its shallow
depth. The underground workings of the core mine extend approximately ten kilometres along strike and span a vertical extent of
approximately 500 m, measured from the highest portal collar elevation to the bottom-most mine workings. The ramps provide flexibility
for rapid adjustments for changes in direction and elevation and allow access to the veins at appropriate elevations.
Mining
at El Peñón utilizes mainly the bench-and-fill mining method (B&F); a small percentage of cut-and-fill mining
(C&F) is also applied where required, depending on the characteristics of vein geometry and ground conditions.
Yamana
continue to apply its Operational Excellence program across all departments to increase productivity, minimize dilution, and identify
opportunities to reduce operating costs. Initiatives under this program include testing of smaller drift profiles in specific
sectors, optimization of stoping and of development-face drill patterns, and minimizing the use of consumables.
| 16.1 | Underground
Mining Methods |
The
main mining method utilized at El Peñón is the bench-and-fill method, which is a narrow longhole-stoping method
that uses a combination of rockfill and cemented rockfill. The method involves ore development at regular level intervals, which,
at El Peñón, range generally between 10 and 20 m. Due to the narrow vein widths, a “split-blasting”
technique is used in many areas of the mine to reduce dilution in secondary development of ore zones. The minimum mining width
of a split blast is of 0.6 m, plus 0.5 m of total overbreak, generating a minimum blast void of 1.1 m width. Once
the split-blast ore is mucked out, the remaining waste is slashed out and used for rockfill purposes. A schematic cross-section
of a split blasting face is shown in Figure 16-1. The split-blasting technique has been refined and improved at El Peñón
since 2016, reducing the achievable ore mining width from 2.1 m to 1.1 m, minimizing dilution and ore loss, and improving productivities
for faster face cycle times. The result is increased gold and silver mining grades. In some cases, development rounds that would
have previously been mined as waste if blasted to the full drift dimensions, are now mined selectively as separate ore and waste
rounds, resulting in increased mineral reserves.
| 16 –Mining
Methods |
86 |
| Signature Date: March 25,
2021 |
|
Technical
Report El Peñón Mine, Chile
Stopes
are formed by drilling blast holes between levels. After blasting, the broken ore is extracted from the lower level using conventional
and remotely operated load-haul-dumps (LHDs). Bench-and-fill is a bottom-up method, in which mining takes place above and adjacent
to previously mined and backfilled stope voids. Once the maximum-allowed stope span is reached, and after completion of ore extraction
from the blasted stope, stopes are filled with rockfill and selective use of cemented rockfill.

Figure
16-1: Schematic cross-section of drift and vein showing extent of split-blasting technique
| 16.2 | Underground
Mine Design |
Mine
access is achieved via spiral declines generally located in the footwall of veins. The declines have section dimensions of 4.3
m wide × 4.5 m high at a gradient of up to ± 16% and a minimum turning radius of 15 m. Access to the ore is
made approximately every 10 to 20 vertical metres via crosscuts. Infrastructure generally included at every intersection of declines
with crosscuts consists of service bays, ventilation drifts to connect crosscuts to return air raises, remucks, and dewatering
infrastructure when required.
| 16 –Mining
Methods |
87 |
| Signature Date: March 25,
2021 |
|
Technical
Report El Peñón Mine, Chile
Drifts
are designed at 4.0 m wide x 4.0 m high and are developed, as mentioned in the previous section, using a split-blasting technique
when required. The drift dimensions enable the use of medium-sized equipment for improved productivity. Ore drift development
is guided by geological controls to ensure that development closely follows the mineralization. All ore drifts are therefore sampled
for grade control during every drill, blast, load, and haul cycle, at approximately 3.3 m intervals. These samples are used to
delimit the economic portion of each stope, which generally varies in width between 1.2 and 6.0 m. An example of a bench-and-fill
mining panel is shown in Figure 16-2.

Figure
16-2: Schematic example of bench-and-fill mining method
The
underground mining sequence starts with the development of the spiral decline. Once the ramp decline reaches the required level
elevation, three faces are generated which consist of the continuation of the ramp decline, the access crosscut to the ore and
the service bay, which is located opposite the crosscut at the ramp. The crosscut development continues until the vein is intersected.
During the development of the crosscut, the remuck and the ventilation drift (which is subsequently connected to the upper-level
ventilation drift via drop raising) are also developed. Once services are available at the crosscut, the drift development starts,
generally in both directions along the vein strike. The ramp decline development continues in parallel towards the next level,
where the development sequence is repeated.
For
mining sequence optimization purposes, large mining zones are divided into mining panels, generally consisting of three to four
levels per panel. The bottom-level drift is developed in a 4 m-wide × 6 m-high section; the bottom 2 m is then
filled with 10% cemented rockfill, creating a stable sill pillar to separate mining panels. This allows stoping to commence while
ramp decline development continues and ensures maximum recovery of the mineralization.
| 16 –Mining
Methods |
88 |
| Signature Date: March 25, 2021 |
|
Technical
Report El Peñón Mine, Chile
Once
the drift reaches the vein edge, to start stoping of the ore between levels, vertical slot raises are excavated at both extremities
of the level to generate free faces for production blasting. Once the slot is opened, the stoping sequence retreats towards the
crosscut. Typically, open-stope spans measuring 15 to 60 m along strike can be achieved before backfilling.
The
following procedure is implemented to minimize dilution. When the maximum stope span is reached (as determined by geotechnical
considerations and laser scan measurements), a cemented barricade is constructed and 3% cemented rockfill is placed in the stope
from the upper level until a 2 m-wide solid pillar is generated. Then, the remainder of the stope void is filled with rockfill
from waste development and split-blast slashing. Subsequently, a new slot raise is constructed beside the cemented pillar and
stoping continues towards the access. Backfilled stopes are also used subsequently as working floors for the mining of the upper
levels of the production panel. The sequence is finished when the top level of the panel is mined by undercutting the back, beneath
the overlying panel’s sill pillar.
| 16.4 | Geomechanics
and Ground Support |
The
El Peñón deposit comprises multiple geomechanical domains within the epithermal deposit. The steeply dipping mineralization
is structurally controlled and primarily associated with north-south-trending major faults which cut across the volcanic rock.
Vein dips are moderate to steep, ranging between 50° and 90°.
The
competency of the rock mass is primarily affected by argillic siliceous alteration. Other types of alteration are present but
to a lesser extent. The mineralized veins are associated with intense to moderate argillic alteration haloes which typically result
in a weakened rock mass on the vein margins. This argillic alteration grades into siliceous alteration further away from the veins.
The intense argillic alteration haloes around the mineralized zones vary in thickness (1 to 2 m); the moderate argillic
alteration haloes extend up to 10 m away from the veins.
The
structural model includes major, intermediate, and minor structures. The major structures are persistent faults when compared
to the mine scale and their thickness exceed 10 cm. The mineralization is hosted within these structures. The major faults
are oriented along the primary structural trend but local variations are observed. Intermediate structures are not associated
with specific orientations, have a shorter persistence than the major faults, their thickness does not exceed 10 cm. The minor
discontinuities consist primarily of joints.
The
various combinations of alteration type, alteration intensity, and structures result in highly variable rock mass properties.
The mineralized zone is typically associated with strong fracture intensity and intense alteration which results in a weak rock
mass (RMR89: 15 to 40). The extent of this weak zone varies from 1 to 10 m. Further away from the mineralized veins, the rock
mass is less fractured and without weakening alteration (RMR89: 45 to 70). The mining operation is in a region where the horizontal
stress is slightly higher than vertical stress. The k-ratio is estimated at between 1.1 and 1.4.
| 16 –Mining
Methods |
89 |
| Signature Date: March 25, 2021 |
|
Technical
Report El Peñón Mine, Chile
The
stope design recommendation is based on the stope height, rock mass quality, vein inclination, and unplanned dilution. The recommendations
are generated using the Matthews method to predict the unplanned overbreak. Each abacus is based on a specific stope height while
considering a range of stope lengths, rock mass quality (RMR89), stope inclination, and stope widths. Dilution calculations are
continually calibrated with actual stope reconciliation: these results are integrated into the design parameters applied to the
mineral reserves stope optimization process.
Ground
support for development consists of shotcrete, wire mesh, and rockbolts. Shotcrete (50 mm-thick) is applied to the back and
walls in areas associated with weak rock mass. Where excavations are located in more competent rock, wire mesh is installed along
the back and shoulders. Rock bolts (2.4 to 2.8 m-long) are installed to support the back and sidewalls. The bolt length and spacing
vary depending on the condition of the rock mass and on the dimension of the excavation.
All
underground mining operations are carried out by Yamana, while the open pit mining operations, representing only a very small
proportion of the production over the LOM, are carried out by a contractor.
A
list of the active mine equipment at El Peñón is shown in Table 16-1 and Table 16-2. Equipment varies in types,
models, and ages.
Table
16-1: Underground mobile equipment for development & production
| Underground Equipment |
Model |
Description |
Units |
| Development
Jumbo drills |
Atlas
Copco Boomer S2 |
Jumbo |
3 |
| Development
Jumbo drills |
Atlas
Copco Boomer M2C |
Jumbo |
7 |
| Development
Jumbo drills |
Epiroc
Boomer S1D |
Jumbo |
1 |
| Long
hole production drills |
Atlas
Copco Simba H-1254 |
Simba |
3 |
| Long
hole production drills |
Atlas
Copco Simba S7D |
Simba |
5 |
| Long
hole production drills |
Epiroc
Simba S7C |
Simba |
1 |
| LHD
6 yd3 |
Cat
R-1600G |
Scoop |
8 |
| LHD
6 yd3 |
Cat
R-1600H |
Scoop |
7 |
| LHD
2 yd3 |
TORO
LH-203 |
Scoop |
4 |
| Conventional
trucks |
Scania
P400 |
Trucks |
13 |
| Conventional
trucks |
Mercedes
Benz Arocs 4848K |
Trucks |
4 |
| 16 –Mining
Methods |
90 |
| Signature Date: March 25, 2021 |
|
Technical
Report El Peñón Mine, Chile
| Underground Equipment |
Model |
Description |
Units |
| Conventional
trucks |
Mercedes
Benz Axor 3344 |
Trucks |
4 |
| Ejection
bed trucks |
Cat
AD-30 |
Dumper |
5 |
| Ejection
bed trucks |
Mercedes
Benz Axor 3344 |
Trucks |
2 |
| Bolters |
Boltec
Atlas Apernador H235S |
Boltec |
4 |
| Bolters |
Jumbo
Resemin Bolter 99 |
Boltec |
1 |
| Roboshots |
Normet
Alpha 20 |
Roboshots |
4 |
| Roboshots |
Normet
Alpha 30 |
Roboshots |
3 |
| Mixers |
Normet
Variomec MF050 |
Mixer |
4 |
| Mixers |
Normet
Tornado S2 |
Mixer |
3 |
Table
16-2: Support mobile equipment
| Support
Equipment |
Model |
Description |
Units |
| Wheel
Loaders |
Volvo
L220G |
Wheel
Loaders |
1 |
| Wheel
Loaders |
Volvo
L260H |
Wheel
Loaders |
1 |
| Wheel
Loaders |
Volvo
L120F |
Wheel
Loaders |
4 |
| Wheel
Loaders |
SDLG
LG 968 |
Wheel
Loaders |
1 |
| Scalers |
CAT
416F2 |
Scalers |
8 |
| Telescope
crane |
Manitou
MT1030S |
Crane |
16 |
| Telescope
crane |
Manitou
MT1030ST |
Crane |
2 |
| Scissor
lift |
Normet
Utilift 1430 |
Normet |
1 |
| Grader |
Komatsu
GD675 |
Grader |
2 |
| Grader |
Caterpillar
140H |
Grader |
1 |
| Grader |
Caterpillar
UG20K |
Grader |
1 |
| Service
trucks |
Various |
|
4 |
| Excavators |
Various |
|
2 |
| Water
trucks |
Various |
|
6 |
Three
pumping systems are currently operating at the mine. The auxiliary pumping system collects water at the faces and pumps it to
the secondary pumping stations using Grindex portable pumps; these have a dewatering capacity of 10 L/s, maximum power of 20 kW,
and can handle water columns of up to 40 m. Secondary pumping stations are therefore constructed every 40 vertical metres. These
secondary pumping stations consist of a fibre pool and centrifugal multistage 40 hp pumps of 20 L/s capacity. Water is pumped
from there towards the main pumping stations.
| 16 –Mining
Methods |
91 |
| Signature Date: March 25, 2021 |
|
Technical
Report El Peñón Mine, Chile
The
main pumping stations decant water and pump it to HDPE-lined ponds on surface. The main pumping stations consist of a pond with
multistage centrifugal 220 hp pumps of 30 L/s capacity. These pumps can handle water columns of up to 320 m, which is approximately
equivalent to a maximum operating pressure of 30 bars. The equipment uses a variable frequency drive (VFD) which allows the regulation
of the speed of the motor and the optimization of the electrical and mechanical operation of the pumps.
Ventilation
of the underground mines at El Peñón is provided through the use of primary and secondary ventilation systems. The
primary ventilation system is an exhaust/pull system. Fresh air is supplied through portals, intake ventilation raises, and declines.
Return air is exhausted through return air raises (RAR) to surface by main exhaust-air axial fans usually positioned on surface.
The first section of the vertical RAR, from the surface to the first underground levels, is typically a 2.4 m- or 3.1 m-diameter
raise bore. The remaining RAR connections to the different levels are staggered and excavated via drop-raising.
The
distribution of airflows is different for each mining zone and depends on the elevation of active production levels and the airflows
required by regulations. The sum of the airflow required under maximum expected production rates, plus expected leaking losses,
define the required fan capacity. All the main fans are controlled online via a telemetry system and are equipped with VFD; this
allows for the continuous control of the airflow requirements and for the adjustment of fan power, thereby saving energy.
The
secondary ventilation system is used for ventilation of blind development faces and production faces. This system is a push system
which forces fresh air from declines to the work faces via auxiliary ventilation fans (of varying power and models depending on
the local air flow requirements) through 900 mm-diameter flexible ventilation ducts. Ventilation duct ends are located at a maximum
distance of 30 m from the face. Air flows back through the drift to the RAR, where it is pulled to surface by the main ventilation
system.
An
example of the ventilation circuit of the Pampa Augusta Victoria underground mine is shown in Figure 16-3.
| 16 –Mining
Methods |
92 |
| Signature Date: March 25, 2021 |
|
Technical
Report El Peñón Mine, Chile

Figure
16-3: Ventilation circuit of the Pampa Augusta Victoria underground mine
El
Peñón is connected to the National Electric Grid by a 66 kV transmission line to the Palestina substation.
From
the main substation at El Peñón, at 66 kV / 6.6 kV and 20 MVA, power is distributed to the camp, processing plant,
and administrative facilities as well as to two mine feeders for distribution to areas southeast of the Core mine area. From the
main substation, power is also delivered to three distribution substations:
| • | One
for the Fortuna–Dominador satellite mining zone located west of the core mine area,
at 6.6 kV / 23 kV and 2.5 MVA |
| • | Two
for the areas northeast of the core mine area, at 6.6 kV / 23 kV and 4 MVA each |
Several
underground substations, at 23 kV / 400 V and 750 kVA or 6.6 kV / 400 V and 750 kVA, are used to provide 400 V power and distribute
energy to all electrical loads.
Compressed
air supply is done through a network of carbon steel pipes of 6” diameter on surface and 4” diameter underground,
at a constant pressure of 8 bar. Boosters are installed in remote zones, which are activated when pressure losses occur along
the network. Delivered compressed air is dried and cleaned through a system of networks and purifiers.
| 16 –Mining
Methods |
93 |
| Signature Date: March 25, 2021 |
|
Technical
Report El Peñón Mine, Chile
Two
main compressors are currently active at the El Peñón core mine area; they are located near the Orito and Bonanza
portals. The compressor located near the Orito portal supplies compressed air to the Quebrada Orito, Quebrada Colorada and Dorada
zones, while the compressor located near the Bonanza portal supplies the Cerro Martillo and Bloque Norte zones.
Underground
communications are carried out with the use of a Leaky Feeder system, which keeps mine supervisors in continuous contact with
operating and service crews throughout the different mines.
The
life of mine (LOM) plan is based on an integrated operation producing mainly from underground mines and from the Chiquilla Chica
open pit. The ore produced by the mining operations and reclaimed from stockpiles is fed to the mill. Considering current mineral
reserves, the LOM indicates a total mine life of six years. However, El Peñón has a track-record spanning more than
20 years of replacing mineral reserves through discoveries of new deposits while maintaining 5 to 8 years of mineral reserves.
In recent years, mineral resources converted to mineral reserves have more than offset the depletion of mineral reserves; this
indicates the significant potential of extending the mine life beyond the current LOM and sustaining a strategic mine life of
10 years or more.
The
LOM mining and processing plans are shown in Table 16-3. Mining recovery and dilution factors considered for production scheduling
are disclosed in section 15.4 of this technical report. The LOM aligns with the rightsizing of El Peñón that was
completed in 2017. Continued exploration success would unlock opportunities to leverage on the existing processing capacity of
4,200 tpd (1.533 Mtpa), which would bring forward gold production in the mine plan. Minimal capital investment would be required
to achieve the higher processing rate.
| 16 –Mining
Methods |
94 |
| Signature Date: March 25, 2021 |
|
Technical
Report El Peñón Mine, Chile
Table
16-3: Life of mine plan (LOM)
| LOM |
|
Planned
Production |
|
units |
|
|
2021 |
|
|
2022 |
|
|
2023 |
|
|
2024 |
|
|
2025 |
|
|
2026 |
|
|
Total |
|
Bloque
Norte
|
|
Ore
mined |
|
|
kt |
|
|
|
145 |
|
|
|
141 |
|
|
|
234 |
|
|
|
115 |
|
|
|
159 |
|
|
|
266 |
|
|
|
1,061 |
|
| |
Gold grade |
|
|
g/t |
|
|
|
5.72 |
|
|
|
6.56 |
|
|
|
7.41 |
|
|
|
5.50 |
|
|
|
4.81 |
|
|
|
4.79 |
|
|
|
5.81 |
|
| |
Silver grade |
|
|
g/t |
|
|
|
84.7 |
|
|
|
82.7 |
|
|
|
66.9 |
|
|
|
191.1 |
|
|
|
221.9 |
|
|
|
198.2 |
|
|
|
141.2 |
|
Chiquilla
Chica
(Open
Pit) |
|
Ore mined |
|
|
kt |
|
|
|
53 |
|
|
|
– |
|
|
|
– |
|
|
|
– |
|
|
|
– |
|
|
|
– |
|
|
|
53 |
|
| |
Gold grade |
|
|
g/t |
|
|
|
0.34 |
|
|
|
– |
|
|
|
– |
|
|
|
– |
|
|
|
– |
|
|
|
– |
|
|
|
0.34 |
|
| |
Silver grade |
|
|
g/t |
|
|
|
316.2 |
|
|
|
– |
|
|
|
– |
|
|
|
– |
|
|
|
– |
|
|
|
– |
|
|
|
316.2 |
|
| Dorada - Cerro Martillo |
|
Ore mined |
|
|
kt |
|
|
|
322 |
|
|
|
291 |
|
|
|
376 |
|
|
|
451 |
|
|
|
413 |
|
|
|
85 |
|
|
|
1,939 |
|
| |
Gold grade |
|
|
g/t |
|
|
|
4.26 |
|
|
|
4.40 |
|
|
|
3.99 |
|
|
|
3.83 |
|
|
|
3.51 |
|
|
|
4.09 |
|
|
|
3.96 |
|
| |
Silver grade |
|
|
g/t |
|
|
|
217.0 |
|
|
|
197.0 |
|
|
|
186.9 |
|
|
|
205.4 |
|
|
|
228.3 |
|
|
|
191.8 |
|
|
|
206.8 |
|
| Fortuna |
|
Ore mined |
|
|
kt |
|
|
|
– |
|
|
|
88 |
|
|
|
128 |
|
|
|
49 |
|
|
|
– |
|
|
|
– |
|
|
|
264 |
|
| |
Gold grade |
|
|
g/t |
|
|
|
– |
|
|
|
4.19 |
|
|
|
4.72 |
|
|
|
4.40 |
|
|
|
– |
|
|
|
– |
|
|
|
4.49 |
|
| |
Silver grade |
|
|
g/t |
|
|
|
– |
|
|
|
273.7 |
|
|
|
348.3 |
|
|
|
271.0 |
|
|
|
– |
|
|
|
– |
|
|
|
309.26 |
|
| Laguna |
|
Ore mined |
|
|
kt |
|
|
|
102 |
|
|
|
79 |
|
|
|
42 |
|
|
|
– |
|
|
|
– |
|
|
|
– |
|
|
|
222 |
|
| |
Gold grade |
|
|
g/t |
|
|
|
9.57 |
|
|
|
8.24 |
|
|
|
7.72 |
|
|
|
– |
|
|
|
– |
|
|
|
– |
|
|
|
8.75 |
|
| |
Silver grade |
|
|
g/t |
|
|
|
97.8 |
|
|
|
78.0 |
|
|
|
68.0 |
|
|
|
– |
|
|
|
– |
|
|
|
– |
|
|
|
85.2 |
|
| Quebrada Colorada |
|
Ore mined |
|
|
kt |
|
|
|
360 |
|
|
|
354 |
|
|
|
290 |
|
|
|
241 |
|
|
|
160 |
|
|
|
36 |
|
|
|
1,441 |
|
| |
Gold grade |
|
|
g/t |
|
|
|
6.06 |
|
|
|
6.35 |
|
|
|
5.64 |
|
|
|
4.11 |
|
|
|
4.14 |
|
|
|
4.62 |
|
|
|
5.47 |
|
| |
Silver grade |
|
|
g/t |
|
|
|
131.1 |
|
|
|
103.8 |
|
|
|
120.3 |
|
|
|
145.9 |
|
|
|
203.7 |
|
|
|
248.3 |
|
|
|
135.6 |
|
| Quebrada Orito |
|
Ore mined |
|
|
kt |
|
|
|
106 |
|
|
|
135 |
|
|
|
67 |
|
|
|
111 |
|
|
|
82 |
|
|
|
– |
|
|
|
501 |
|
| |
Gold grade |
|
|
g/t |
|
|
|
5.87 |
|
|
|
4.85 |
|
|
|
6.58 |
|
|
|
5.18 |
|
|
|
7.55 |
|
|
|
– |
|
|
|
5.82 |
|
| |
Silver grade |
|
|
g/t |
|
|
|
38.7 |
|
|
|
60.5 |
|
|
|
37.2 |
|
|
|
111.4 |
|
|
|
81.3 |
|
|
|
– |
|
|
|
67.4 |
|
| Pampa Augusta Victoria |
|
Ore mined |
|
|
kt |
|
|
|
– |
|
|
|
– |
|
|
|
9 |
|
|
|
– |
|
|
|
– |
|
|
|
– |
|
|
|
9 |
|
| |
Gold grade |
|
|
g/t |
|
|
|
– |
|
|
|
– |
|
|
|
4.96 |
|
|
|
– |
|
|
|
– |
|
|
|
– |
|
|
|
4.96 |
|
| |
Silver grade |
|
|
g/t |
|
|
|
– |
|
|
|
– |
|
|
|
187.2 |
|
|
|
– |
|
|
|
– |
|
|
|
– |
|
|
|
187.2 |
|
| Processing |
|
Ore processed |
|
|
kt |
|
|
|
1,319 |
|
|
|
1,312 |
|
|
|
1,159 |
|
|
|
1,098 |
|
|
|
815 |
|
|
|
446 |
|
|
|
6,149 |
|
| |
Gold grade |
|
|
g/t |
|
|
|
4.01 |
|
|
|
4.18 |
|
|
|
4.71 |
|
|
|
4.97 |
|
|
|
6.26 |
|
|
|
4.20 |
|
|
|
4.66 |
|
| |
Silver grade |
|
|
g/t |
|
|
|
119.7 |
|
|
|
117.6 |
|
|
|
141.5 |
|
|
|
146.2 |
|
|
|
206.4 |
|
|
|
232.7 |
|
|
|
147.8 |
|
| |
Gold recovery |
|
|
% |
|
|
|
94.07 |
% |
|
|
93.65 |
% |
|
|
94.00 |
% |
|
|
94.18 |
% |
|
|
94.25 |
% |
|
|
93.86 |
% |
|
|
94.02 |
% |
| |
Silver recovery |
|
|
% |
|
|
|
88.66 |
% |
|
|
88.13 |
% |
|
|
85.36 |
% |
|
|
87.52 |
% |
|
|
88.59 |
% |
|
|
87.26 |
% |
|
|
87.60 |
% |
| |
Gold produced |
|
|
koz |
|
|
|
160 |
|
|
|
165 |
|
|
|
165 |
|
|
|
165 |
|
|
|
155 |
|
|
|
57 |
|
|
|
866 |
|
| |
Silver produced |
|
|
koz |
|
|
|
4,500 |
|
|
|
4,370 |
|
|
|
4,500 |
|
|
|
4,519 |
|
|
|
4,789 |
|
|
|
2,913 |
|
|
|
25,591 |
|
| 16 –Mining
Methods |
95 |
| Signature Date: March 25, 2021 |
|
Technical
Report El Peñón Mine, Chile
The
El Peñón processing plant and associated facilities process run-of-mine as well as stockpiled ore, using the main
processes listed below:
| • | Grinding
and pre-leaching thickening |
| • | Counter-current
decantation (CCD) concentrate solution recovery |
| • | Clarification,
zinc precipitation, and precipitate filtering |
| • | Tailings
filtering and disposal |
The
process flowsheet is shown in Figure 17-1. The processing plant has a nominal production capacity of approximately 1.533 Mtpa.
The plant processed 3,461 tonnes per calendar day (tpd) during 2020.
Run-of-mine
or stockpiled ore is dumped from a 7 m3 capacity (CAT 988H) front-end loader and screened through a 600 mm square-grid
grizzly into a 100 t-capacity hopper. Fine material is collected and transported directly to the conveyor belt that carries primary
crushed material. A 1,500 mm-wide apron feeder is used to transfer ore from the dump hopper to the jaw crusher. Coarse material
is fed into a 950 mm × 1,250 mm jaw crusher and crushed to a P80 size of 63.5 mm. The crushed ore is
transported by a conveyor belt to a 1,500 t-capacity silo. Additionally, an auxiliary stockpile for crushing product is located
to the northwest of the silo. The stockpile has a capacity of 10,800 t and covers an area measuring approximately 40 m × 60 m.
The
ore stored in the silo is transported by a variable-speed mill-feed conveyor belt, which has a nominal capacity of 250 tonnes
per hour (tph), to a transfer chute that discharges onto the conveyor belt that feeds the SAG mill.
The
ore from the auxiliary stockpile is fed via a front-end loader to an encapsulated hopper with suppressor system to mitigate dust
emissions. The hopper discharges onto a belt which transports the ore to the mill-feeder conveyor belt.
| 17 –Recovery
Methods |
96 |
| Signature Date: March 25, 2021 |
|
Technical
Report El Peñón Mine, Chile

Figure
17-1: Mineral processing flowsheet
| 17 –Recovery
Methods |
97 |
| Signature Date: March 25, 2021 |
|
Technical
Report El Peñón Mine, Chile
| 17.2 | Grinding
and Pre-Leach Thickening |
Crushed
ore and sodium cyanide process solution are fed into the SAG mill; the sodium cyanide solution is used as leaching agent.
The
SAG mill operates in series with a ball mill, which feeds a battery of hydrocyclones. The underflow of the hydrocyclones returns
to the SAG mill. Pebbles formed in the SAG mill are discharged by a trommel onto a conveyor belt, which transports the pebbles
to a chute returning them to the mill-feeder conveyor belt. Alternatively, the pebbles can be mixed with crushed material to be
recirculated to the grinding circuit. The density of the pulp fed to the hydrocyclone circuit is controlled online via density
measurements using a nuclear densitometer.
The
classification circuit consists of six hydrocyclones. Generally, four hydrocyclones operate while two remain on standby. The cyclone
overflow pulp contains between 42% and 46% solids with a P80 of 170 µm. Particle size is measured online through
a PSI 300 particle-size analyzer and is controlled by changing hydrocyclones operating pressures. The hydrocyclones overflow is
fed to the grinding thickener and the underflow is recirculated to the SAG mill feed. Spills are pumped to the mill’s discharge
sump using a floor pump located in the area.
Flocculant
is added to the grinding thickener to promote solid-liquid separation by decantation. The underflow of the thickener, containing
50% solids, is pumped to the first leach tank. The thickener underflow discharge has two variable speed pumps (generally one operating
and one on standby) with a flow rate capacity of 250 m3/h and a 31 m discharge height. The pumping rate is controlled
according to the density of the pulp, which is measured online through a nuclear densimeter. The overflow of the grinding thickener,
which is called “unclarified pregnant solution” is sent by gravity to a storage tank.
From
the storage tank, the unclarified pregnant solution is pumped to four clarifying filters which clarify the solution to a maximum
turbidity of 1 NTU. The clarified solution is transported into the clarified pregnant solution tank for the subsequent zinc precipitation
step.
Gold
and silver leaching starts at the SAG mill, where sodium cyanide is added as a leaching agent. An extraction of around 75% is
reached in this step.
Six
reactors, with a combined capacity of 7,279 m3 using mechanical agitators, leach the underflow of the grinding thickener.
Oxygen
is also added to maximize dissolution kinetics. The oxygen is homogenized with the pulp through recirculation pumps that propel
the pulp to an oxygen mixer. Oxygen is supplied from a liquid-oxygen storage tank.
| 17 –Recovery
Methods |
98 |
| Signature Date: March 25, 2021 |
|
Technical
Report El Peñón Mine, Chile
Leach
tanks are arranged in series with cascading heights to facilitate the transport of pulp by gravity. The reactors are fed from
the bottom to reduce the potential for the leach slurry to short-circuit between tanks. Under normal operating conditions, the
discharge of the last reactor is sent to the first thickener of the CCD concentrate solution recovery circuit.
| 17.5 | CCD
Concentrate Solution Recovery |
The
leached pulp, with a concentration of 48% to 55% solids, is transported by gravity to the CCD circuit, which consists of four
high-capacity counter-current thickeners. The objective of this circuit is to wash the pulp and recover the pregnant solution.
The wash-solution flows counter-current to the solids flow, increasing the precious metal concentration of the solution. The overflow
of the first CCD thickener (CCD0) is transported by gravity to the pregnant solution storage tank, while the discharge of the
last CCD thickener (CCD3) is pumped to the filtration area.
| 17.6 | Pregnant
Solution Precipitation |
In
normal operation conditions, the Merrill-Crowe process consists of the following stages:
| • | Deaeration
of the clarified solution by circulating the fluid through a vacuum tower. |
| • | Precipitation
of gold and silver by the addition of zinc to the deaerated solution. |
| • | Filtering
of gold, silver, and zinc precipitates. |
The
clarified pregnant solution (maximum flow of 275 m3/h) is deaerated through a vacuum tower before entering the zinc
precipitation stage. The vacuum tower is a 10.4 m3- capacity reactor which achieves a rich deaerated solution
with an oxygen (O2) concentration of less than 1 ppm. The reject solution that exits the tower is fed to the press
filters.
The
zinc pulp is fed with five peristatic pumps to the feed line of each of the press filters. The contact of the zinc pulp with the
rich deaerated solution occurs in the filter piping feed and causes gold, silver, and impurities to precipitate onto the zinc
surface. The dosage of zinc is controlled by assays of the rich and barren solutions every two hours.
The
filtration stage is carried out in five filter presses. Before feeding a filter press with the solution from the precipitation
stage, 2 m3 of pulp containing 37.5 g/L of diatomaceous earth are recirculated for 45 minutes to form an initial layer
on the filter surface. The diatomaceous earth layer prevents blockage by the very fine undissolved zinc. After the initial layer
is formed, the precipitate solution is filtered. The solution that exits the filter is transported to the barren solution tank.
To unload, a filter press is opened and the material is removed using a spatula and sent to the retort furnaces.
| 17 –Recovery
Methods |
99 |
| Signature Date: March 25, 2021 |
|
Technical
Report El Peñón Mine, Chile
Precipitates
obtained from the filter presses are deposited in trays with a capacity of approximately 50 kg of precipitate with 30% moisture
content. Four retort furnaces eliminate the humidity and the mercury contained in the precipitate. Each furnace is loaded with
eight trays and kept at a temperature of 538°C for about 20 hours under vacuum conditions. The product (calcine) is fed to
the melting furnaces.
A
reverberation furnace, which uses liquefied gas and air/oxygen to reach 1,220°C is used for smelting. Calcine is fed to the
furnace through a screw feeder. The melt consists of two phases:
| • | The
upper part of the slag, which is of lower density (2.5 g/L) and melts at 850°C, is
formed of silica (flux) and impurities such as copper, iron, zinc, and others. |
| • | The
lower phase of the slag consists of doré. This lower phase is of higher density
(15 g/L), melts at 1,000°C, and is mainly composed of silver and gold, with
a small proportion of impurities. |
The
slag is poured into 50 kg-capacity conical steel containers, while the doré is poured into 165 kg-capacity ingot
molds. Emissions from the refining furnace are collected by a hood and pass through a high-temperature bag filter to recover the
precious metal particles contained in the gases. The solidified slag is recirculated to the crushing stage of the plant to recover
any residual gold and silver. The doré is removed from the ingot mold and loaded with a forklift to the bar cleaner to
remove the attached slag. After this process, the bars are removed and stored for weighing and shipping.
| 17.8 | Tailings
Filtering and Disposal |
The
objective of the tailings filtration is to obtain dischargeable tailings containing a moisture content of about 20%. The CCD circuit
and filter cake wash step ensure the liquid contained in the filtered tailings has minimum concentration of cyanide and dissolved
metals. The pulp is pumped to a filtering system consisting of four 54 m2 and one 82 m2 horizontal
vacuum belt filters.
The
filtered tailings are transported by two conveyor belts (equipped with a weight-meter and sampler) to two stockpiles, one for
each belt. The storage area consists of a 220 m2 concrete slab and retaining wall (to protect the belts). A floor
pump is located in the area to collect solutions and cleaning water, which are recycled to the filtration area.
The
collected tailings are loaded on trucks by a front-end loader and transported to the tailings storage area, located approximately
two kilometres away.
| 17 –Recovery
Methods |
100 |
| Signature Date: March 25, 2021 |
|
Technical
Report El Peñón Mine, Chile
| 17.9 | Metallurgical
Reporting |
The
processed tonnes are determined by weight-meter readings that are located on the SAG mill-feed conveyor belt and the tailings
discharge conveyors. Daily analytical results from feed and tailings solids samples and solutions samples of discharged tailings
are used to calculate plant metallurgical performance. Metal sales and inventory contained in the circuit and refinery are determined
at the end of each month and appropriate adjustments are made. The mill reports the back-calculated head grades of the mill feed
from this information
Water
consumption by the processing plant is approximately 0.28 m3/t, while the tailings disposal operations require 0.10
m3/t. The energy consumption by the processing plant is estimated at between 46 and 48 kW/dmt. Other reagents and supplies
consumptions for 2020 are summarized in Table 17-1 and Table 17-2, respectively.
Table
17-1: Consumption of reagents for 2020
| Reagent | |
Consumption | | |
Units |
| Sodium Cyanide | |
| 2.51 | | |
kg/t |
| Zinc | |
| 2.07 | | |
kg/kg (Au+Ag) |
| Lime | |
| 0.36 | | |
kg/t |
| Diatomaceous Earth | |
| 0.49 | | |
kg/t |
| Celite 545 | |
| 18.90 | | |
g/t |
| Celite 7F | |
| 10.10 | | |
g/t |
| Flocculant (CCD) | |
| 79.00 | | |
g/t |
| Filtering Aid | |
| 63.00 | | |
g/t |
| Antiscalant (CCD) | |
| 58.90 | | |
g/t |
| Antiscalant (Precipitation) | |
| 73.30 | | |
g/t |
| Antiscalant (Retort) | |
| 7.90 | | |
g/t |
| Dispersant | |
| 100.00 | | |
g/t |
| Oxygen | |
| 0.34 | | |
l/ t |
| Borax | |
| 0.34 | | |
kg/kg (Au+Ag) |
| Soda Ash | |
| 0.16 | | |
kg/kg (Au+Ag) |
| Gas | |
| 2.54 | | |
l/kg (Au+Ag) |
| 17 –Recovery
Methods |
101 |
| Signature Date: March 25, 2021 |
|
Technical
Report El Peñón Mine, Chile
Table
17-2: Consumption of processing supplies for 2020
| Item | |
Consumption | | |
Units |
| Balls (Ball Mill) | |
| 0.19 | | |
kg/t |
| Balls (SAG Mill) | |
| 1.09 | | |
kg/t |
| Refractories | |
| 2.20 | | |
tpm |
| Doré Packages | |
| 0.008 | | |
Boxes/kg (Au+Ag) |
| Clarifying Filter Fabric | |
| 56 | | |
Fabric/month |
| Press Filter Fabric | |
| 56 | | |
Fabric/month |
| Band Filter Fabric | |
| 1 | | |
Fabric/28,000t |
| 17.11 | Optimization
Opportunities |
In
2021, Yamana initiated a new review of the El Peñón processing plant to identify opportunities for increased throughput,
increased recovery, and reduced operating costs. The review, conducted by Paterson & Cooke from Denver, Colorado, USA, and
the El Peñón processing team, has identified several opportunities as summarized in a preliminary report (Paterson
& Cooke, 2021). Some of these opportunities are summarized below.
The
grinding circuit can be optimized to reduce over-grinding by separating the circuit into primary and secondary grinding. Separating
the circuit would require an additional classification mechanism incorporated between the SAG mill and the ball mill.
In
the leaching circuit, managing the leach solution to decrease the precious metal concentrations can promote a more favorable conditions
for leaching.
Thickener
operation can be improved by adding controls for circuit automation. Improving reagent control will unlock further opportunities
to implement new coagulant/flocculant addition schemes that can limit potential overdosing of flocculant. Installing bed depth
indicators will also improve thickener performance monitoring and enable future advancements in thickener control.
Implementing
an advanced process control system (APC) to the CCD circuit will enable continued optimal performance.
The
viability of each opportunity outlined in the report will be evaluated by the site team. The viable opportunities will be assessed
for qualitative implementation costs, probable benefit, and execution risk. The outputs will be compiled into a solution and opportunities
matrix and an implementation roadmap developed for the highest priority projects.
| 17 –Recovery
Methods |
102 |
| Signature Date: March 25, 2021 |
|
Technical
Report El Peñón Mine, Chile
El
Peñón is accessed by a paved road approximately 165 km southeast of Antofagasta. Travel time from Antofagasta is
approximately 2.5 hours. Antofagasta is the principal source of supplies for the mine. It is a port city with a population of
380,000; it is linked by daily air service to Santiago. Power is supplied to the mine site via national power grid. Auxiliary
or backup power from generators is also available with 10 MW of power capacity on site.
The
mine consists of multiple gold and silver deposits that are mainly mined by underground mining methods. Open-pit production was
extensive in the past, but now comprises a small proportion of the LOM. Four main mining blocks are currently in operation at
the core mine zone. These are: Quebrada Orito, Quebrada Colorada, Dorada-Cerro Martillo and Bloque Norte. Several satellite deposits
are or have been active in the past such as Chiquilla Chica, Laguna, Fortuna-Dominador, located to the south west of the core
mine, and Pampa Augusta Victoria located to the north.
El
Peñón has all the required infrastructure for a mining complex, illustrated in Figure 18-1. The main infrastructure
includes the following features:
| •
Underground and open pit mines with all the associated access, power, ventilation compressed air ventilation, industrial water
supply, and dewatering infrastructure |
| |
|
| •
Process plant and refinery |
•
Telecommunications system |
| |
|
| • Stockpiles
and waste dumps |
• Water ponds |
| |
|
| • Tailings
storage area |
• Water distribution
system |
| |
|
| • Concrete
and cemented backfill plants |
• Workshops
and sheds |
| |
|
| • Groundwater
well system for water supply |
• Materials
storage areas |
| |
|
| • Main administration
building and offices |
• Laboratory |
| |
|
| • Campsite,
cafeterias, and change rooms |
• Core shed |
| |
|
| • Energy
supply and transmission system |
• Sewage
treatment system |
| |
|
| • Storage
areas for explosives |
|
| |
|
| •
Facilities for storage and distribution of fuel, oil, and lubricants |
| |
•
Mine workshops, maintenance facilities, and warehouses
|
| 18 –Project
Infrastructure |
103 |
| Signature Date: March 25, 2021 |
|
Technical
Report El Peñón Mine, Chile

Figure
18-1: Plan map of main infrastructure at El Peñón
18 –Project
Infrastructure
|
104 |
| Signature Date: March 25, 2021 |
|
Technical
Report El Peñón Mine, Chile
| 18.1 | Filtered
Tailings Stack Design and Construction |
The El Peñón filter stack is located 1.5
km southeast of the processing plant and stores approximately 25.4 Mt. (Figure 18-1). The updated TSF designs included in the newest Declaration of Environmental
Impact (DIA) submitted in February 2021 considers a reduction in the ultimate TSF capacity from 58.1 Mt (RCA 270/2010) to 49.8Mt, which
is sufficient capacity for current mineral reserves plus an additional capacity of approximately 18.5 Mt.
The filtered tailings stack is raised in three platforms to an ultimate
elevation ranging between 1835 masl to 1850 masl in the northern section of the facility. Each platform is approximately 10 m in
height with slopes of approximately 1.25H:1V. A 5 m-bench is left between platforms, forming an overall approximate slope angle for the
filtered tailings stack of approximately 2.5H:1V (Figure
18-2).
The
eastern portion of the TSF is raised in only two platforms, each with a maximum height of 10 m and slopes of 1.25H:1V. A 5 m-bench
between each platform allows for a flatter overall stack slope.

Figure
18-2: Schematic cross-section of western face of filtered tailings stack
The
filtered tailings are a non-plastic sandy silt; they consist of about 60% fines with fine- to medium-grained sand particles and
have a volumetric moisture content when leaving the filter plant of about 18% (gravimetric moisture content of about 22%) and
a specific gravity of about 2.63.
18 –Project
Infrastructure
|
105 |
| Signature Date: March 25, 2021 |
|
Technical
Report El Peñón Mine, Chile
Filtered
tailings are transported to two stockpiles by conveyor belts, one for each stockpile. Stockpiled tailings are loaded into haul
trucks by a front-end loader and transported about 2 km to the TSF. At the TSF, tailings are deposited in mounds and spread into
0.15 to 0.3 m-thick layers with a dozer to promote further aeration and cyanide degradation. Tailings are then turned with
a grader and irrigated with process water from the waste water treatment plan to reduce the concentration of cyanide in the solids;
this decreases the in-situ moisture content of the tailings. This aeration-and-water process is repeated until the cyanide concentration
is less than 2 ppm. The density of the tailings is recorded and measured against a target 90% modified proctor. Once compacted,
a new layer of tailings is incorporated into the dry stack and the process is repeated.
Quarterly
operational reports and monthly quality-control reports are generated for the El Peñón TSF. These reports include
test results from samples from every new lift; these tests include in-situ density testing, particle size analysis, and moisture
content. In addition, the cyanide content of the tailing is tested regularly.
Slope
stability assessments of the dry stack facility were conducted by E-Mining and FF GeoMechanics in 2019 and 2020. Results
indicate that the facility is stable under static and seismic conditions. Seismic design criteria assume a peak ground acceleration
(PGA) of 0.49 g. The proposed PGA seems adequate for the region. Undrained stability is not a concern in this facility
as there is no phreatic surface in the filtered stack.
In
addition, stability analysis completed by FF GeoMechanics (2020) indicate a maximum runoff of the dry tailings material, in case
of a slope failure, to be less than 2 m. The mine infrastructure is located approximately 200 m of the facility. As such, a slope
failure of the filtered tailings at El Peñón does not pose a risk to the environment or to people. Regardless, as
a preventive measure, the mine constructed containment berms located 5 m from the toe of the TSF stack to prevent the spread of
tailings, should a localized slope failure occur. These berms also divert surface runoff away from the filtered tailings toe,
in the unlikely event of a strong precipitation event in the region.
A
dam inspection by a third-party geotechnical specialist is planned for 2021 to confirm that the current designs align with evolving
international best industry practices proposed for this type of structures. In addition, the site needs to develop an updated
Operations, Maintenance, and Surveillance (OMS) manual that aligns with the latest guidelines from the Mining Association of Canada
on tailings management. In addition, it is recommended for site to update the closure plan for the TSF area, considering potential
changes to the design, such as stack final geometry, water management, long-term geochemical effects, management frameworks and
requirements for regulatory compliance and closure permitting.
18 –Project
Infrastructure
|
106 |
| Signature Date: March 25, 2021 |
|
Technical
Report El Peñón Mine, Chile
| 19 | Market
Studies and Contracts |
The
principal commodities produced at El Peñón are gold and silver in the form of doré bars, which are freely
traded, at prices that are widely known, so that prospects for sale of any production are virtually assured. Gold prices of US$1,250/oz
and silver prices of US$18/oz were used for mineral reserve estimation as well as for completing the economic analysis outlined
in Section 22 of this technical report, which ensures the project is cash-flow positive and therefore supports the mineral reserve
estimate.
Yamana,
via its subsidiary Minera Meridian, has four collective bargaining agreements currently in place. The maximum term allowed for
collective bargaining agreements by the current legislation is of 36 months. The following agreements are currently in place:
| • | Union
#1A – Mine. Feb.1, 2020, to January 31, 2023: 36-month term (512 employees) |
| • | Union
#1B – Plant. July 23, 2018, to July 22, 2021: 36-month term (194 employees) |
| • | Union
#2 – Plant. Oct. 13, 2020, to Oct. 12, 2023: 36-month term (351 employees) |
| • | Union
#3 – Supervisors. March 1, 2020, to Feb. 23, 2023: 36-month term (121 employees) |
Yamana
also has contracts in place for the operation of the Chiquilla Chica open-pit project; electrical power supply; personnel transport
services; catering and camp services; fuel supply services; exploration drilling; and for mine and plant consumables, including
drilling products, explosives and cyanide supply.
Average
prices for consumables during 2020 were as follows:
The
qualified person responsible for this section of the technical report has reviewed the market studies and contracts. The results
of the review support the assumptions laid out in the technical report. The terms, rates, or charges for material contracts are
within industry norms.
19 –Market
Studies and Contracts
|
107 |
| Signature Date: March 25, 2021 |
|
Technical
Report El Peñón Mine, Chile
| 20 | Environmental
Studies, Permitting, and Social or Community Impact |
The
information presented in this section is based on a review of previous technical reports available for the site and on discussions
with Yamana’s Health, Safety, Environment, and Community (HSEC) team.
| 20.1 | Project
Permitting and Authorizations |
The
first Environmental Impact Assessment (EIA1) was submitted to the Chilean Environmental Impact Assessment System
(SEIA) in 1997. The Environmental Commission of the Region of Antofagasta (Comision Regional de Medio Ambiente de Antofagasta)
approved the application with Exempt Resolution Nr. 043 in 1998.
El
Peñón has undergone a series of modifications since its original EIA submission. Required Environmental Qualification
Resolutions (RCAs) were granted through a series of Declaration of Environmental Impacts2 (DIAs). A DIA was approved
in 2019 to extend the life of mine until 2023; a new DIA was recently presented in February 2021 considering a life of mine extension
until 2026 and closure by 2028. Approval is expected in 2021.
El
Peñón consists of historical open pits, underground mining operations, a process plant, and other support infrastructure,
including waste dumps and a filtered tailings facility with a total storage capacity of 49.8 Mt. The approved
plant capacity is 4,800 tpd.
Table
20-1 list resolutions granted to El Peñón since 1998. This list was reviewed and confirmed with HSEC management
team in El Peñón.
1
An EIA must be submitted by the proponent for projects or project modifications where significant environmental impacts
are expected to occur, and where specific measures for impact avoidance, mitigation or compensation will need to be agreed upon.
2
A DIA must be submitted by the proponent for projects or project modifications that are significant enough to warrant environmental
review, but which are not expected to result in significant environmental impacts, as these are defined legally.
20 –Environmental
Studies, Permitting, and Social or Community Impact
|
108 |
| Signature Date: March 25, 2021 |
|
Technical
Report El Peñón Mine, Chile
Table
20-1: Summary of environmental resolutions since 1998
| Resolutions |
|
Activities |
| Resolution
043-98 El Peñón Project |
|
Health
report |
| |
Change
in land use |
| |
Tailings
storage |
| |
Waste
dumps |
| |
Construction
waste disposal |
| |
Household
waste disposal |
| |
Sewage
treatment and disposal |
| Resolution
086-99 Power Supply |
|
Power
supply |
| Resolution
0179-02 Explosive Handling |
|
Explosives
|
| Resolution
050-03 and 227- 04 Extension of Underground Mine |
|
Mine
expansion |
| Resolution
0163-07 Expansion and Optimization El Peñón Mine |
|
Tailings
storage area construction |
| Resolution
0192-07 and 056-2011 Production Fortuna Area |
|
Waste
dumps |
| |
Sewage
treatment and disposal |
| |
Change
in land use |
| Resolution
106- 2010 Extension of Bonanza and Expansion of Transport and Handling of Explosives |
|
Waste
dumps |
| |
Sewage
treatment and disposal |
| |
Household
waste treatment and disposal |
| |
Industrial
designation |
| |
Change
in land use |
| Resolution
0270-2010 Expansion of Tailings Storage Area until 2021 |
|
Tailings
storage area |
| Resolution
0233-2012 Open-Pit Mine Production Pampa Augusta Victoria |
|
Waste
dumps |
| |
Construction
waste disposal |
| |
Mining
waste disposal |
| |
Sewage
treatment and disposal |
| |
Household
waste disposal |
| |
Industrial
designation |
| |
Change
in land use |
| Resolution
0229-14 Underground Mine Production Pampa Augusta Victoria |
|
Waste
dumps |
| |
Sewage
treatment and disposal |
| |
Industrial
designation |
| |
Change
in land use |
| Resolution
206 -2018 Production Laguna Underground Mine |
|
New
underground mine operation |
| Resolution
168 -2019 Extension of Process Plant Operations and Ancillary Infrastructure until 2023 |
|
Process
plant |
| |
Tailings
facility |
| |
Waste
dump |
| |
Ancillary
infrastructure |
20 –Environmental
Studies, Permitting, and Social or Community Impact
|
109 |
| Signature Date: March 25, 2021 |
|
Technical
Report El Peñón Mine, Chile
Other
sectoral licences and permits have been obtained and applications for renewals have been filed. These permits are granted by some
of the following agencies:
| • | Dirección
General de Aguas (DGA) |
| • | Servicio
Nacional de Geología y Minería, (SERNAGEOMIN) |
| • | Ministerio
de Salud de Chile |
| • | Concejo
de Monumentos Nacionales (CMN) |
| • | Comisión
y Servicio de Evaluación Ambiental |
| • | Dirección
de Obras Hidráulicas |
| • | Superintendencia
de Electricidad y Combustibles (SEC) |
| • | Servicio
de Salud de Antofagasta (SSA) |
| • | Ministerio
de Defensa Nacional (MDN) |
| • | Municipalidad
de Antofagasta |
| • | Dirección
General de Movilización Nacional (DGMN) |
| • | Ministerio
de Vivienda y Urbanismo |
| • | Servicio
Agrícola y Ganadero (SAG) |
The
operation has not been subject to sanctioning for environmental compliance by any of the regulatory agencies.
| 20.2 | Environmental
Management |
| 20.2.1 | Environmental
Management System |
El
Peñón has implemented an integrated management system covering health, safety, environment, and community through
internationally accredited systems that include the ISO 14001 Environment Management System and the OSHAS 18001 Occupational Health
and Safety Management System. A risk assessment matrix has been developed for El Peñón that integrates risk matrices
for ISO 14001:2015 and OHSAS 18001:2007.
Activities
for 2021 include the process of certification for ISO 45001 (replacing OSHAS 18001) and recertification of the ISO 14001 Environment
Management System. In addition, Yamana is signatory to the International Cyanide Management Code. A standard for operational processes
has been developed for the management of other hazardous and non-hazardous solid waste (Certified NCh-ISO 17025 INN – Instituto
de Normalizacion Chilena)
20 –Environmental
Studies, Permitting, and Social or Community Impact
|
110 |
| Signature Date: March 25, 2021 |
|
Technical
Report El Peñón Mine, Chile
In
2016, Yamana updated its Integrated Management System by developing a Health, Safety, Environment, and Community (HSEC) (2016)
framework that was integrated in the company’s approach to health & safety, environmental management, and management
of social risk. The framework establishes a common understanding across Yamana operations of its general approach to HSEC management
and indicates how to achieve its vision. Yamana acknowledges that every operation is at a unique stage of development and is situated
in unique socio-political and legal contexts. Yamana provides this framework to offer the following guidance:
| • | Outline
industry best practices for HSEC management. |
| • | Guide
the development of new tools, processes, procedures, policies, and/or standards, either
at the site or at the corporate level. |
| • | Assist
operations in any evaluations or self-evaluations of their current state of practice. |
| • | Improve
the overall integration of HSEC into the operations. |
Beginning
in 2020, El Peñón also began the implementation of the Mining Association of Canada’s Towards Sustainable
Mining framework as well as the World Gold Council’s Responsible Gold Mining Principles, each of which included
internal assessments and will require external audits within a 3-year timeframe.
| 20.2.2 | Tailings
Management |
Yamana
prioritizes the management of tailings and it is currently in the process of aligning the company’s tailings management
system with best practices proposed by the Mining Association of Canada (MAC), Canadian Dam Association (CDA) guidelines, and
other international standards, including technical guidance provided by the International Committee of Large Dams (ICOLD). Yamana
currently has a dedicated Corporate Director whose sole responsibility is the governance of the tailings management system and
to provide technical guidance and support.
Since
2017, Yamana has implemented a tailings management system known as SYGBAR. The system is built on a six-point management system
that focuses on the following protocols:
| • | Standards
for design and construction, and the use of design reviews |
| • | Constant
TSF monitoring and site-specific key performance indicators for development and performance
management |
| • | Periodic
safety inspection |
| • | Documentation
and monthly reporting |
| • | Training
and continuous improvement |
| • | Emergency
response plans with dam failure analysis |
As
a member of the MAC, Yamana is updating its current tailings management systems considering the recommendations included in the
tailings framework proposed in MAC (2019). MAC’s tailings management systems and guidelines have been adopted by mining
associations in Canada, Argentina, and Brazil, among others, in recent years. The MAC systems include the completion of a Dam Safety Review (DSR)
that follows the guidelines and recommendations provided in CDA dam safety guidelines (CDA, 2007) and its corresponding mining
bulletin.
20 –Environmental
Studies, Permitting, and Social or Community Impact
|
111 |
| Signature Date: March 25, 2021 |
|
Technical
Report El Peñón Mine, Chile
The
tailings produced at the El Peñón mill are presently stored in a filtered tailings stack in operations since 1998.
The TSF is monitored on an ongoing basis for chemical and physical stability conditions by collecting data on cyanide and by conducting
visual inspections and regular surveys for potential signs of deformation or other physical instabilities. Volumes of deposited
tailings, grain size distribution, and tailings density are recorded on a regular basis. Samples are collected and tested by a
registered third-party laboratory. In addition, a network of monitoring wells is used for monitoring any changes in water levels
and water quality in the area of the mine, including in the TSF area. Section 20.2.3 outlines additional details on water management
and monitoring.
As
part of the mine’s tailings management system, a geotechnical stability inspection was completed by FF Geomechanics, an
independent specialized firm, in 2019 and 2020. The review confirmed the filtered tailings stack are stable and safe.
The
current closure plan for the TSF area is presently at a conceptual level and will be updated to
reflect the most recent TSF designs, corresponding budgets, and implementation schedules.
Water
conservation is a primary focus at El Peñón. The water management system at El Peñón has been designed
as a closed circuit. Process water from the mill is recovered in the tailings filter plant and recirculated back to the processing
plant.
Pampa
Buenos Aires Aquifer
The
Pampa Buenos Aires aquifer is the main source of fresh water for El Peñón; the aquifer is located 25 km from the
mine; eight pumping wells intersect the aquifer. The mine has been approved by the regional water authority (DGA) for a consumption
of up to 50.4 L/s. Daily consumption to date averages less than half of the approved amount: the average flowrate recorded for
2020 was 22 L/s.
Considering
the desert characteristics of the area, no risks of groundwater contamination from the mine operations have been identified in
the reviewed documentation.
A
detailed hydrogeological model has been developed for the Pampa Buenos Aires aquifer to monitor and assess recharge, specific
yield, storativity, and other important hydrogeological parameters. This model is continually updated to reflect the most recent
conditions.
Water
levels and water chemistry information collected for the Pampa Buenos Aires aquifer is shared with the regional water authority
via their online portal every 15 days.
Water
recycled from Underground Developments
El
Peñón recycles the water that accumulates in underground mines; this water derives from mining operations and not
from a regional aquifer, as the underground mines at El Peñón are at shallower depths than the regional aquifers,
therefore do not intersect them.
20 –Environmental
Studies, Permitting, and Social or Community Impact
|
112 |
| Signature Date: March 25, 2021 |
|
Technical
Report El Peñón Mine, Chile
Water
collected in the underground mine is conveyed through a complex drainage system and pumped into fully lined collection ponds.
This water is then recirculated to the process plant as needed by the operation. The system is managed, controlled, and monitored
using an automatized system.
Waste
Dumps and Water Management
El
Peñón has several mine waste dumps in the core mine area (illustrated in Figure 18-1) as well as at the satellite
deposits of Fortuna, Pampa Augusta Vitoria, Laguna, and Chiquilla Chica. Several of these dumps are not being operated and are
in temporary closure. Although precipitation in the area is low, a surface water management system is in place in all dumps as
a preventive measure; it consists of a surface water collection and drainage system to collect contact water and a system of contour
channels for diversion of non-contact water.
No
acid rock drainage (ARD) and metal leaching (ML) issues associated with the operation and with waste dumps have been identified.
Waste rock material does not contain pyrite. Various acid-base accounting (ABA) tests results for the site confirm these observations.
In addition, the low precipitation typical for this arid region does not promote acid generation.
Monitoring
To
comply with environmental legislation and applicable standards, El Peñón carries out environmental monitoring in
all areas influenced by the operation. Monitoring is performed by internal and external staff who are qualified for execution
and evaluation of the monitoring activities. Key current monitoring is ongoing for water, air, noise, soil, impact on wildlife,
and cultural resources.
The
monitoring program at El Peñón relies on 8 groundwater wells, 4 air quality stations, and a weather station located
in the camp area. Water quality samples are analyzed for chlorine, pH, and free cyanide in a certified laboratory located at El
Peñón. In addition, El Peñón has samples regularly tested for these and other parameters at certified
third-party laboratories.
No
surface water streams exist in the area, and no groundwater quality issues were reported for El Peñón. It is important
to note that the risk of groundwater contamination from the waste rock dumps in El Peñón is negligible as aquifers
are located at great depths and precipitation in the area is low. In addition, waste rock material in the dumps has a low pyrite
content and the mine has implemented adequate controls and environmental monitoring systems.
Archeological
inspections are completed annually by third-party experts. There is no permanent wildlife in the area, but the site has implemented
a visual inspection protocol. Fauna that are rescued are taken to the Wild Fauna Rescue and Rehabilitation Centre at the University
of Antofagasta.
20 –Environmental
Studies, Permitting, and Social or Community Impact
|
113 |
| Signature Date: March 25, 2021 |
|
Technical
Report El Peñón Mine, Chile
| 20.3.1 | General
Social Context |
There
are no communities in the immediate vicinity of El Peñón. The city of Antofagasta, located approximately 160 km
northwest of the mine, is the main source of labour supply. It is a port city with a population of approximately 380,000 inhabitants,
and hosts a large number of manufacturers and suppliers that serve the mining industry.
| 20.3.2 | Social
and Environmental Assessment and Management Systems |
At
the corporate level, Yamana has an Integrated Health, Safety, Environment and Community (HSEC) Framework (2016), which provides
guidance across operations to meet the following goals:
| • | Outline
evolving international best practice for HSEC management. |
| • | Guide
the development of new tools, processes, procedures, policies and/or standards. |
| • | Assist
operations in any evaluations or self-evaluations of their current state of practice. |
| • | Improve
the overall integration of HSEC into the operations. |
The
HSEC Framework includes guidance for (1) Health and Safety, (2) Environmental Management, and (3) Social Risk Management. The
HSEC Framework provides guidance to Yamana and its operations on the collection of information on relevant stakeholders, assessment
of potential impacts, and development of mitigation measures.
Of
relevance to this technical report and this section is the HSEC Framework guidance for Social Risk Management, which includes
the components listed in Table 20-2.
Table
20-2: Social risk management element of Yamana’s HSEC Framework (2016)
| Management
Element |
|
Component |
| Stakeholder
Engagement |
|
Stakeholder
identification and analysis (mapping) |
| |
Stakeholder
engagement |
| |
Issues
identification |
| |
Feedback
management |
| Impact
Management |
|
Impact
identification |
| |
Impact
management |
| |
Community
baseline information tracking |
| |
Plans
for closure |
| Benefit
Management |
|
Expectation
management |
| |
Local
employment and procurement |
| |
Community
investment |
20 –Environmental
Studies, Permitting, and Social or Community Impact
|
114 |
| Signature Date: March 25, 2021 |
|
Technical
Report El Peñón Mine, Chile
In
accordance with these guidance documents, Yamana has been tracking stakeholder issues and risks related to El Peñón
and communicates project activities and other programs with stakeholders and members of the public on an ongoing basis.
El
Peñón has developed and implemented a site-level grievance mechanism; there have been no complaints registered in
recent years, in part due to the fact that there are no host communities located in proximity to the operation. The mine continues
to engage with communities located a distance from the mine, including Taltal, and to support community initiatives such as education
and cultural projects.
| 20.3.3 | Workplace
Health and Safety |
El
Peñón prioritizes providing a safe and healthy workplace and building an exceptional safety culture. A number of
guidance documents provide the framework for health and safety measures at El Peñón. Yamana’s HSEC Framework
(2016) provides guidance to the company and its operations on the development of site-specific health and safety procedures and
on how to improve operations, based on monitoring and health and safety performance.
Of
relevance to this report and this section is the guidance for Health and Safety, which includes the components listed in Table
20-3.
Table
20-3: Health and safety management elements of Yamana’s HSEC Framework (2016)
| Management
Element |
|
Component |
| Leadership |
|
Positive
recognition |
| |
Leadership
training |
| Risk
and Hazard Management |
|
Hazard
identification |
| |
Job
hazard analysis |
| |
Field-level
risk assessment |
| |
Employee
reporting and at-risk behaviour |
| |
Standard
operating procedures |
| |
Hazardous
materials |
| |
Safety
design reviews |
| Health,
Hygiene and Medical |
|
Health
and hygiene |
| |
Medical |
| |
Drug
and alcohol |
Furthermore,
El Peñón has established a system to promote worker health and safety, including ISO 14001 and 45001 environmental
management and occupational health and safety (OH&S) standards, respectively.
20 –Environmental
Studies, Permitting, and Social or Community Impact
|
115 |
| Signature Date: March 25, 2021 |
|
Technical
Report El Peñón Mine, Chile
Regular
audits and reports on worker health and safety are conducted for El Peñón and recommendations are made to improve
performance based on the audit findings. Monthly and annual audit reports are generated, presenting a number of safety performance
indicators that include the following information:
| • | Frequency
of accidents with injury |
| • | Severity
and frequency of accidents with and without loss of time |
| • | Accidents
by type and company |
| 20.3.4 | Support
for Community Priorities |
Even
though no communities are located near to El Peñón, Yamana has made a number of commitments to the well-being, health,
safety, and development of the communities in the area. As such, the social and community activities conducted by Yamana are concentrated
in the Taltal District and support educational, health-related and cultural priorities. A summary of activities completed in a
typical year include the following:
| • | Open
door policy: visits of 100 stakeholders to mining facilities |
| • | High
school scholarships for 10 students |
| • | Free
pre-university for students who take the Taltal district University Selection Test |
| • | Support
of medical services in Taltal |
| • | Participation
in the Business Advisory Council of the Liceo Politécnico |
| • | Broadcasting
radio tips to the Taltal community on environmental care and precautions to consider
for risks in the home |
| • | Integration
Day: a fair held in December in Taltal |
| • | Donations
in infrastructure, services, and equipment: donations to kindergartens, schools, dance
groups, among others |
| • | Partnership
seminar: partnerships with 7 local groups to provide economic development |
| • | Meetings
with communities: the main activities developed in support of the commune of Taltal are
presented to the community and stakeholders. The following list enumerates some of the
topics agreed upon: the application for Partnership Seminar projects, scholarships, free
pre-university, medical operation campaigns, and others. |
| • | A
socio-economic diagnostic report of the areas of influence within the Taltal region |
| • | Entrepreneurship
project to help vulnerable students in the region develop competencies and skills and
undertake new projects |
20 –Environmental
Studies, Permitting, and Social or Community Impact
|
116 |
| Signature Date: March 25, 2021 |
|
Technical
Report El Peñón Mine, Chile
In
the area of the El Peñón operation and its surroundings, 15 archaeological sites have been identified. They are
protected by fencing and are monitored twice annually to verify their state of conservation by a professional archeologist recognized
by the local cultural agency (Consejo de monumentos).
El
Peñón has developed a closure plan and cost estimate covering all current and approved facilities; this plan is
in accordance with applicable legal requirements, specifically Law 20.551/2011 and Supreme Decree N°41/2012, and is updated
regularly as the life of mine is extended. The competent authority for approving mine closure plans in Chile is SERNAGEOMIN. Under
current law, mining projects with an extraction capacity of over 10,000 tonnes per month (tpm) must provide a financial guarantee,
the amount of which is to be determined based on the periodic re-evaluation of the closure plan implementation and management
costs. The amount of the guarantee must be determined in UF currency (Chilean Unit of Account) from the present-value estimated
cost of implementing all measures covered by the closure plan. The latest closure plan for El Peñón was approved
through Exempt Resolution Nº 2658/2019. Updates to the closure plan are required whenever the life of mine is extended.
The
approved 2019 mine closure plan addresses progressive and final closure actions, post-closure inspections, and monitoring. Based
on the increase in mineral reserves over the past three years, a new DIA was submitted in February 2021 for an extended life of
mine plan. The mine closure costs will be updated according to the extended life of mine.
The
2019 closure plan is subdivided by area and includes consideration for the underground operations, waste dumps, tailings facility,
infrastructure, and ancillary facilities. It also considers the following post-closure activities:
| • | Physical
stability monitoring in waste dumps |
| • | Biannual
monitoring (twice per year) and inspection of downstream control wells and dumps |
| • | Biannual
monitoring (twice per year) of control wells associated with the TSF |
| • | Annual
monitoring of the El Peñón landfill |
| • | Visual
inspection, cleaning, and maintenance of signage, walls, and perimeter closure |
The
closure plan costs are summarized in Table 20-4.
20 –Environmental
Studies, Permitting, and Social or Community Impact
|
117 |
| Signature Date: March 25, 2021 |
|
Technical
Report El Peñón Mine, Chile
Table
20-4: Mine closure costs
| |
Total Cost | |
| Mine Closure | |
(US$M) | |
| Direct costs | |
| 17.3 | |
| Indirect cost and administration | |
| 3.5 | |
| Contingency | |
| 5.2 | |
| Chilean sales tax (19%) | |
| 4.9 | |
| Subtotal closure measures | |
| 30.8 | |
| Post-closure monitoring | |
| 6.5 | |
| Total mine closure cost | |
| 37.4 | |
No
environmental or permitting issues were identified from the documentation available for review that could materially impact the
ability to extract the mineral resources and mineral reserves.
20 –Environmental
Studies, Permitting, and Social or Community Impact
|
118 |
| Signature Date: March 25, 2021 |
|
Technical
Report El Peñón Mine, Chile
| 21 | Capital
and Operating Costs |
The
capital and operating costs outlined in this section of the technical report are based on the LOM presented in section 16.7 of
this technical report. The capital and operating cost estimates were prepared based on recent operating performance and on Yamana’s
current budget forecast. All costs in this section are in US dollars and are based on an exchange rate assumption of 800 CLP:
1 USD.
The
LOM capital cost estimate is approximately US$167M and is assumed to support sustaining capital requirements for the mining and
processing of mineral reserves over the project’s six-year LOM as well as a small amount of expansionary underground mine
development. A summary of the LOM capital costs for El Peñón is given in Table 21-1.
Table
21-1: Life of mine capital costs
| | |
Total LOM | |
| Item | |
(US$000) | |
| Mine Development | |
| 138,304 | |
| Building and Infrastructure | |
| 3,348 | |
| Hardware and Software | |
| 592 | |
| Machinery and Equipment | |
| 1,132 | |
| Vehicles | |
| 23,262 | |
| Sustaining Capital Cost | |
| 166,637 | |
| Expansionary Capital Cost | |
| 579 | |
| Total | |
| 167,217 | |
Capitalized
development consists of 52,324 m, or an average of 10,718 m per year, over the first four years and subsequently declining towards
the end of the mine life. Mine closure costs are listed in Table 20-4 in section 20.4 of this technical report and consider progressive
and final closure actions as well as post-closure inspection and monitoring.
The
expected run rate for sustaining capital, including infrastructure, equipment, and mine development is averaged at US$32M per
year for the next five years, with spending decreasing in the last year of the mine life.
The
following are excluded from the capital cost estimate:
| • | Project
financing and interest charges |
21 –Capital
and Operating Costs
|
119 |
| Signature Date: March 25, 2021 |
|
Technical
Report El Peñón Mine, Chile
Operating
costs are defined as the direct operating costs and include mining, processing as well as general and administrative costs.
The
production plan drove the calculation of the mining and processing costs, as the mining mobile equipment fleet, manpower, contractors,
power, and consumables requirements were calculated based on specific consumption rates. Consumable prices and labour rates are
based on current contracts and agreements.
Mining
operating costs are forecasted to average US$80.18/t mined over the LOM period, or US$71.57/t processed, when including the 660,000
tonnes of stockpile planned to be reclaimed over the LOM period. Total operating costs are forecasted to average US$116.49/t processed
as set out in Table 21-2.
Table
21-2: LOM average unit operating costs
| Item | | |
Total
LOM (US$/t
processed) | |
| Mining | | |
| 71.57 | |
| Process | | |
| 29.72 | |
| G&A | | |
| 15.20 | |
| Total | | |
| 116.49 | |
21 –Capital
and Operating Costs
|
120 |
| Signature Date: March 25, 2021 |
|
Technical
Report El Peñón Mine, Chile
Financial
information has been excluded from this technical report as Yamana is a producing issuer and El Peñón is currently
in production.
Yamana
has performed an economic analysis of the current project using a gold price of US$1,250/oz at the forecasted production rates,
metal recoveries, and capital and operating cost estimated in this technical report.
Yamana
confirms that the outcome is a positive cash flow that supports the mineral reserve estimate. Due to the nature of the mining
business, these conditions can change significantly over relatively short periods of time. Consequently, actual results may be
significantly more or less favourable.
22 –Economic
Analysis
|
121 |
| Signature Date: March 25, 2021 |
|
Technical
Report El Peñón Mine, Chile
There
are no adjacent properties that are relevant to this technical report.
23 –Adjacent
Properties
|
122 |
| Signature Date: March 25, 2021 |
|
Technical
Report El Peñón Mine, Chile
| 24 | Other
Relevant Data and Information |
There
is no other relevant data or information regarding El Peñón.
24 –Other
Relevant Data and Information
|
123 |
| Signature Date: March 25, 2021 |
|
Technical
Report El Peñón Mine, Chile
| 25 | Interpretation
and Conclusions |
More
than 5.3 Moz of gold and 134 Moz of silver has been produced at El Peñón since commercial production commenced in
2000. El Peñón’s current production rate, the result of the rightsizing of the operation initiated in late
2016, increased free cash flow generation, reduced capital expenditures while ensuring the long-term sustainability of the mine
matching production rate with mineral reserves and mineral resources replacement.
Exploration
results at El Peñón continue to highlight the expansion potential of the mine and Yamana’s ability to replenish
mineral reserves and mineral resources so as to extend the LOM past its current mineral reserve base. Drilling is effective at
adding mineral resources and mineral reserves at El Peñón. Similar to drilling results from the previous two years,
the 2020 drilling successfully replenished the 2020 depletion of gold mineral reserves. Based on this successful track record,
a drilling program totalling 384,000 m is planned from 2021 to 2023.
El
Peñón mineral resources and mineral reserves have been estimated in conformity with generally accepted CIM Estimation
of Mineral Resources and Mineral Reserves Best Practice Guidelines (November 2019) and classified in accordance with CIM (2014)
Standards. The total proven and probable mineral reserve at El Peñón as of December 31, 2020, is 6.1 Mt averaging
4.66 g/t gold and 147.8 g/t silver, with a metal content of approximately 0.921 Moz of gold and 29.21 Moz of silver. In addition,
measured and indicated mineral resources are estimated at 8.0 Mt grading 2.96 g/t gold (0.765 Moz gold) and 98.8 g/t silver (25.5
Moz silver), and inferred mineral resources are estimated at 18.98 Mt grading 1.39 g/t gold (0.850 Moz gold) and 46.1 g/t silver
(28.1 Moz silver).
The
mineral reserves supporting the LOM plan consists of an integrated operation, mining mainly underground ore and a small amount
of ore from the Chiquilla Chica open pit. The ore produced by the mining operations and reclaimed from stockpiles is fed to the
mill to sustain a six-year mine life. LOM production is estimated at 866 koz gold and 25,591 koz silver.
Yamana
is confident that, based on required infill drilling, the future conversion of mineral resources to mineral reserves will continue
to show positive results. In recent years, mineral resources converted to mineral reserves have more than offset the depletion
of mineral reserves; this indicates the significant potential of extending the mine life beyond the current LOM and sustain a
strategic mine life of 10 years or more.
The
capital and operating cost estimates are based on mine budget data and operating experience, and are appropriate for the known
mining methods and production schedule. Under the assumptions in this technical report, El Peñón has positive project
economics until the end of mine life, which supports the mineral reserve estimate. Capital costs over the LOM period are estimated
at US$167M consisting mainly of sustaining underground mine development (83%) and capital required for equipment replacement (14%).
An additional US$37M are estimated for mine closure purposes.
25 –Interpretation
and Conclusions
|
124 |
| Signature Date: March 25, 2021 |
|
Technical
Report El Peñón Mine, Chile
No
environmental or social issues were identified that could materially impact the ability to extract the mineral resources and mineral
reserves. Yamana has implemented an integrated HSEC management system covering health, safety, environment, and community through
internationally accredited systems that include the ISO 14001 Environment Management System and the OSHAS 18001 Occupational Health
and Safety Management System. El Peñón has all the operational licences required for operation according to the
national legislation. The approved licences address the authority’s requirements for mining extraction and operation activities.
The
results of this technical report are subject to variations in operational conditions including, but not limited to the following:
| • | Assumptions
related to commodity and foreign exchange (in particular, the relative movement of gold
and the Chilean peso/US dollar exchange rate) |
| • | Unanticipated
inflation of capital or operating costs |
| • | Significant
changes in equipment productivities |
| • | Geological
continuity of the mineralized structures |
| • | Geotechnical
assumptions in pit and underground designs |
| • | Throughput
and recovery rate assumptions |
| • | Changes
in political and regulatory requirements that may affect the operation or future closure
plans |
| • | Changes
in closure plan costs |
| • | Availability
of financing and changes in modelled taxes |
In
the opinion of the qualified persons, there are no reasonably foreseen inputs from risks and uncertainties identified in the technical
report that could affect the project’s continued economic viability.
25 –Interpretation
and Conclusions
|
125 |
| Signature Date: March 25, 2021 |
|
Technical
Report El Peñón Mine, Chile
Based
on the information presented in this technical report, the qualified persons recommend the following action items.
Over
the past 20 years, El Peñón has established an exploration strategy to continually replace depletion of mineral
reserves and extend mine life. The strategy involves maintaining a pipeline of mineral resources and exploration potential to
maintain a rolling mine life visibility of at least 10 years. To continue this trend, drilling programs should continue to be
carried out with the following objectives:
| • | Infill
drilling to replace production by upgrading and extending known mineral resources. |
| • | Expansion
exploration drilling to upgrade inferred mineral resources to measured or indicated categories,
or to transform zones of geological potential into inferred mineral resources. |
| • | District
exploration to test the extension of little-known areas of mineralization or to discover
new primary structures by testing targets identified in mapping, geochemistry, geophysics,
or machine learning programs. |
Ongoing
exploration success could also unlock the opportunity to leverage the available processing capacity which could increase annual
gold and silver production and reduce unit costs.
Yamana
instituted an Operational Excellence program to improve productivity and control costs. El Peñón should continue
to evaluate and prioritize processing plant optimization opportunities and develop an action plan for their implementation.
In
the underground mine, El Peñón should continue the implementation of Operational Excellence initiatives with an
objective to increase productivity, minimize dilution, and reduce operating costs. Mining initiatives include testing of smaller
drift profiles for specific sectors, optimized stoping and development face drill patterns, and opportunities to reduce specific
consumption of consumables.
In
2021, El Peñón should initiate the process of certification for ISO 45001 (replacing OSHAS 18001) and recertification
of the ISO 14001 Environment Management System; it should also continue the implementation of the Mining Association of Canada’s
Towards Sustainable Mining framework as well as the World Gold Council’s Responsible Gold Mining Principles.
26 –Recommendations
|
126 |
| Signature Date: March 25, 2021 |
|
Technical
Report El Peñón Mine, Chile
Astudillo,
N.; Ferrando, R.; Montecino, D.; Espinoza, F.; Venegas, C.; Matthews, S.; Cornejo, P.; Arévalo, C. 2017: Carta Augusta
Victoria, Región de Antofagasta.Servicio Nacional de Geología y Minería, Carta Geológica de Chile,
Serie Geología Básica 189: 97 p., 1 mapa escala 1:100.000. Santiago.
Bottinelli,
O. C. A., and Valencia, A. M. E., 2016: Informe Técnico de Vida Útil de la Operación Minera (para Ley N°
20.551 sobre Cierre de Faenas e Instalaciones Mineras); Ley N° 20.819 que modifica Ley N° 20.551; Revisión N°
3, August 1, 2016.
Canadian
Dam Association Dam Safety Guidelines 2007 (2013 Edition). Report available at www.cda.ca
Chacón,
M. E., Pérez, S. C. M., 2017: Yamana Gold, El Peñón Mine, Region of Antofagasta, Chile, NI 43-101 Technical
Report, 144 pp., May 23, 2017.
Collins,
S. E., Moore, C. M., and Scott, K. C., 2010: Technical Report on the El Peñón Mine, Northern Chile, prepared for
Yamana Gold Inc., 132 pp., December 7, 2010.
Commission
for the Geological Map of the World (CGMW), 2019: Tectonic Map of South America. Second edition, scale 1:5 000 000. ISBN 978-2-917310-26-7.
Cornejo,
P.; Mpodozis, C.; Rivera, O. & Matthews, S.J., 2006: Carta Exploradora, Regiones de Antofagasta y Atacama. Servicio Nacional
de Geología y Minería (SERNAGEOMIN), Santiago, Chile, Carta Geológica de Chile, Serie Geológica Básica,
1:100.000.
Donoso,
F., 2012: Caracterización Mineralógica de las vetas Bonanza-Aleste y sus implicancias geometalúrgicas, Mina
El Peñón, Región de Antofagasta, Memoria para optar al título de Geólogo, Universidad Católica
del Norte, Antofagasta, Chile.
E-Mining
Technology S.A., 2010: Proyecto de Expansion del Deposito de Relaves Filtrado El Peñón. Report prepared for Yamana
Gold Inc., April 2010.
Ferrando,
R.; Espinoza, F.; Matthews, S.; Cornejo, P.; Arévalo, C., 2013: Carta Aguas Blancas, Región de Antofagasta. Servicio
Nacional de Geología y Minería, Carta Geológica de Chile, Serie Geología Básica 160. 1 mapa
escala 1:100.000. Santiago.
FF
GeoMechanics Ing. Ltda., 2020: Informe Tecnico de Estabilidad Deposito de Relaves Filtrados El Peñón, Rev 2. Report
prepared for Minera Meridian Ltda., January 2020.
Gosselin,
P., Dubé, B., 2005: Gold deposits of the world: distribution, geological parameters and gold content. Geological Survey
of Canada, Open File 4895, 1 CD-ROM.
27 –References
|
127 |
| Signature Date: March 25, 2021 |
|
Technical
Report El Peñón Mine, Chile
Jorquera,
H., 2016: QAQC Annual Report 2016, prepared for Minera Meridian Ltda., 36 pp., December 15, 2016.
John,
D.A., Vikre, P.G., du Bray, E.A., Blakely, R.J., Fey, D.L., Rockwell, B.W., Mauk, J.L., Anderson, E.D., and Graybeal, F.T., 2018:
Descriptive models for epithermal gold-silver deposits: U.S. Geological Survey Scientific Investigations Report 2010–5070–Q,
247 p., https://doi.org/10.3133/sir20105070Q.
Minera
Meridian Ltda., 2017: various presentations, procedures, and spreadsheets for El Peñón Mine.
Octal
Ingeniería y Desarrollo and Magri Consultores Limitada, 2015: Actualización de modelos variográficos –
El Peñón, prepared for Yamana Gold Inc., August 5, 2015.
Órdenes,
J., 2014: Influencia de la Mineralogía de la veta Bonanza en el Procesos Hidrometalúrgico de Lixiviación
de Au y Ag, Yacimiento El Peñón, Chile. Tesis para optar al grado de Magíster en Geometalurgia. Universidad
Católica del Norte, Antofagasta, Chile, 168 p.
Paterson
& Cooke, 2021: El Peñon Process Audits. Report prepared for Yamana Gold Inc. Dated February 22, 2021. P&C Project
No.: YMA-31-1256. 14p.
Pearson,
J. L., and Rennie, D. W., 2008: Technical Report on the El Peñón Mine, Chile, Resource Audit, prepared for Yamana
Gold Inc., 130 pp., February 11, 2008.
Pérez,
M., 1999: Alteración Hidrotermal en el Depósito Epitermal de Au-Ag El Peñón, II Región Antofagasta.
Memoria para optar al título de Geólogo. Universidad de Chile, Santiago, Chile, 109 p.
Robbins,
C.H., 2000: Geology of El Peñón Gold-silver Deposit, Northern Chile: The Great Basin and beyond, Geological Society
of Nevada, Symposium, Reno 2000, Proceedings, pp. 249-264.
RPA,
2018: Technical Report on the El Peñón Mine, Antofagasta Region (II), Chile. NI 43-101 Technical Report prepared
by H. Krutzelmann, N. Lecuyer, C.M. Moore, for Yamana Gold Inc. 170 p. March 2, 2018. Available at www.sedar.com.
Warren,
I., 2005: Geology, Geochemistry and Ore of the El Peñón Epithermal Au-Ag Deposit, Northern Chile: Characteristics
of a bonanza-grade deposit and techniques for exploration. PhD Thesis – Geology, University of Auckland.
Warren,
I., Zuluaga, J. I., Robbins, C. H., Wulftange, W. H., and Simmons, S. F., 2004: Geology and Geochemistry of Epithermal Au-Ag Mineralization
in the El Peñón District, Northern Chile; Society of Economic Geologists, Special Publication 11, pp. 113-139.
Vega,
A. M., 2015: QAQC Annual Report 2015, prepared for Minera Meridian Ltda., 46 pp., December 15, 2015.
27 –References
|
128 |
| Signature Date: March 25, 2021 |
|
Technical
Report El Peñón Mine, Chile
Vega,
A. M., 2014: QAQC Annual Report 2014, prepared for Minera Meridian Ltda., 34 pp., November 2014.
Yamana,
2016: Integrated HSEC Framework. Internal document prepared by Yamana, 21 pp., April 2016.
Zuluaga,
J.I. (2004): Geología y Mineralización del Distrito El Peñón, Segunda Región de Antofagasta,
Chile. Tesis de Magíster en Geología Económica, Universidad Católica del Norte, Antofagasta, Chile,
150 p.
27 –References
|
129 |
| Signature Date: March 25, 2021 |
|
Technical
Report El Peñón Mine, Chile
| 28 | Certificates
of Qualified Persons |
28 –Certificates
of Qualified Persons
|
130 |
| Signature Date: March 25, 2021 |
|
Technical
Report El Peñón Mine, Chile
Certificate
of qualified person – Sergio Castro
I,
Sergio Castro, Registered Member of the Chilean Mining Commission, as an author of this report entitled “NI 43-101
Technical Report, El Peñón Gold-Silver Mine, Antofagasta Region, Chile” prepared for Yamana Gold Inc. (the
Issuer) and dated effective as of December 31, 2020 (the Technical Report), do hereby certify the following:
| 1. | I
am Technical Services Manager, El Peñón Mine, at Minera Meridian Limitada, a subsidiary of the Issuer, with an office
at Cerro Colorado 5240, Torre Parque II, 9th Floor, Las Condes, Santiago, Chile. |
| 2. | I
graduated from the Universidad de Antofagasta in 1997 with a degree in Mining Civil Engineering. I am a member of the Chilean
Institute of Mining Engineers of Chile and a member of the Chilean Mining Commission N°0225. I have worked as a mining engineer
for approximately 23 years since my graduation. My relevant experience for the purpose of the Technical Report is over ten years
of experience at El Peñón as mining engineer, currently focused on planning and developing mineral reserves, as
well as estimating economic scenarios for short-term, medium-term, and long-term planning. |
| 3. | I
have read the definition of “qualified person” set out in National Instrument 43-101 – Standards of Disclosure
for Mineral Projects (NI 43-101) and certify that by reason of my education, affiliation with a professional association (as
defined in NI 43-101) and past relevant work experience, I fulfill the requirements to be a “qualified person” for the
purposes of NI 43-101. |
| 4. | I
work at El Peñón on a weekly basis and was most recently at the project on March 25, 2021. |
| 5. | I
am responsible for Sections 13, 15 to 19 (excluding sub-section 18.1), 21, 22 and 24, and share responsibility for related disclosure
in Sections 1, 25, 26, and 27 of the Technical Report. |
| 6. | I
am not independent of the Issuer. I am a full-time employee of Minera Meridian Limitada, a subsidiary of the Issuer. |
| 7. | I
have had prior involvement with the property that is the subject of the Technical Report in my role at Minera Meridian Limitada
since 2009. |
| 8. | I
have read NI 43-101 and the sections of the Technical Report for which I am responsible have been prepared in compliance with
NI 43-101 and Form 43-101F1. |
| 9. | At
the effective date of the Technical Report, to the best of my knowledge, information, and belief, Sections 13, 15 to 19 (excluding
sub-section 18.1), 21, 22 and 24 and related disclosure in Sections 1, 25, 26, and 27 in the Technical Report for which I am responsible
contain all scientific and technical information that is required to be disclosed to make the Technical Report not misleading. |
| “Signature” |
|
| Sergio
Castro, Registered Member CMC |
Dated this 25th day of March, 2021 |
28 –Certificates
of Qualified Persons
|
131 |
| Signature Date: March 25, 2021 |
|
Technical
Report El Peñón Mine, Chile
Certificate
of qualified person – Marco Velásquez Corrales
I,
Marco Velásquez Corrales, Registered Member of the Chilean Mining Commission, as an author of this report entitled “NI
43-101 Technical Report, El Peñón Gold-Silver Mine, Antofagasta Region, Chile” prepared for Yamana Gold Inc.
(the Issuer) and dated effective as of December 31, 2020 (the Technical Report), do hereby certify the following:
| 1. | I
am Chief Resource Geologist, El Peñón Mine, at Minera Meridian Limitada,
a subsidiary of the Issuer, with an office at Cerro Colorado 5240, Torre Parque II, 9th
Floor, Las Condes, Santiago, Chile. |
| 2. | I
graduated from the Universidad Catolica Del Norte in Antofagasta, Chile in 1995 with
a degree in Geology. I am a member of the Chilean Mining Commission N°402. I have
practiced my profession continuously since 1995. My relevant experience for the purpose
of the Technical Report is: |
| • | Resource
geologist since 2009 at El Peñón underground/open-pit gold-silver mine
Antofagasta, Chile. I am currently the Chief Resource Geologist at the mine. |
| • | Senior
production geologist and resource geologist with mining companies in Chile (Mantos Blancos,
Minera El Abra, Cerro Colorado), focusing on data quality, sampling, reconciliation,
geological modelling, and resource estimation. |
| 3. | I
have read the definition of “qualified person” set out in National Instrument
43-101 – Standards of Disclosure for Mineral Projects (NI 43-101) and certify
that by reason of my education, affiliation with a professional association (as defined
in NI 43-101) and past relevant work experience, I fulfill the requirements to be a “qualified
person” for the purposes of NI 43-101. |
| 4. | I work at El
Peñón on a weekly basis and was most recently at the project on March 25, 2021. |
| 5. | I
am responsible for Section 11, 12, and 14, and share responsibility for related disclosure
in Sections 1, 25, 26, and 27 of the Technical Report. |
| 6. | I
am not independent of the Issuer. I am a full-time employee of Minera Meridian Limitada,
a subsidiary of the Issuer. |
| 7. | I
have had prior involvement with the property that is the subject of the Technical Report
in my role at Minera Meridian Limitada since 2009. |
| 8. | I
have read NI 43-101 and the sections of the Technical Report for which I am responsible
have been prepared in compliance with NI 43-101 and Form 43-101F1. |
| 9. | At
the effective date of the Technical Report, to the best of my knowledge, information,
and belief, Section 11, 12, and 14, and related disclosure in Sections 1, 25, 26, and
27 in the Technical Report for which I am responsible contain all scientific and technical
information that is required to be disclosed to make the Technical Report not misleading. |
| “Signature” |
|
| Marco
Velásquez Corrales, Registered Member CMC |
Dated this 25th day of March, 2021 |
28 –Certificates
of Qualified Persons
|
132 |
| Signature Date: March 25, 2021 |
|
Technical
Report El Peñón Mine, Chile
Certificate
of qualified person – Henry Marsden
I,
Henry Marsden, P.Geo., as an author of this report entitled “NI 43-101 Technical Report, El Peñón Gold-Silver
Mine, Antofagasta Region, Chile” prepared for Yamana Gold Inc. (the Issuer) and dated effective as of December 31, 2020
(the Technical Report), do hereby certify the following:
| 1. | I
am Senior Vice President, Exploration of the Issuer, with an office at Royal Bank Plaza,
North Tower, 200 Bay Street, Suite 2200, Toronto, Ontario M5J 2J3 |
| 2. | I
am a graduate of Carleton University, Ottawa, Ontario, with a Master of Science degree
in Earth Sciences in 1991, and of the University of British Columbia with a Bachelor
of Science degree in Geology in 1987. I am a Professional Geologist, registered the Association
of Professional Geoscientists of Ontario (APGO #0885). My relevant experience for the
purpose of the Technical Report is: |
| • | I
have worked as a geologist for over 30 years since my graduation including over 20 years
as a consulting geologist working with a variety of clients and focusing on field exploration
work. |
| • | I
have played a key role in the discovery and advancement of several mineral deposits including
Rio Blanco and Pico Machay in Peru, and the Timmins West gold deposit in Timmins, Ontario. |
| 3. | I
have read the definition of “qualified person” set out in National Instrument
43-101 – Standards of Disclosure for Mineral Projects (NI 43-101) and certify
that by reason of my education, affiliation with a professional association (as defined
in NI 43-101) and past relevant work experience, I fulfill the requirements to be a “qualified
person” for the purposes of NI 43-101. |
| 4. | I
visited the El Peñón project on many occasions since January 2016 and most
recently between March 11 and 13, 2020. |
| 5. | I
am responsible for Sections 2 to 10, 23, and share responsibility for related disclosure
in Sections 1, 25, 26, and 27 of the Technical Report. |
| 6. | I
am not independent of the Issuer. I am a full-time employee of the Issuer. |
| 7. | I
have had prior involvement on the property in my role with the Issuer and as a consultant
geologist on contract in 2016. |
| 8. | I
have read NI 43-101, and the sections of Technical Report for which I am responsible
have been prepared in compliance with NI 43-101 and Form 43-101F1. |
| 9. | At
the effective date of the Technical Report, to the best of my knowledge, information,
and belief, Sections 2 to 10, 23, and related disclosure in Sections 1, 25, 26, and 27
in the Technical Report for which I am responsible contain all scientific and technical
information that is required to be disclosed to make the Technical Report not misleading. |
| “Signature” |
|
| Henry
Marsden, P.Geo. |
Dated this 25th day of March, 2021 |
28 –Certificates
of Qualified Persons
|
133 |
| Signature Date: March 25, 2021 |
|
Technical
Report El Peñón Mine, Chile
Certificate
of qualified person – Carlos Iturralde
I,
Carlos Iturralde, P.Eng., as an author of this report entitled “NI 43-101 Technical Report, El Peñón Gold-Silver
Mine, Antofagasta Region, Chile” prepared for Yamana Gold Inc. (the Issuer) and dated effective as of December 31, 2020
(the Technical Report), do hereby certify the following:
| 1. | I
am Director, Tailings of the Issuer, with an office at Royal Bank Plaza, North Tower,200
Bay Street, Suite 2200, Toronto, Ontario M5J 2J3 |
| 2. | I
graduated from the University of Kansas with a dual major in Civil Engineering and Mathematics
in 2002. I received a MSc. from the University of Tübingen in Applied Environmental
Geosciences in 2007. I am a professional engineer with Engineers and Geoscientist British
Columbia since 2010 (License # 40153). I have over 18 years of professional experience
in the mining industry in technical and management aspects related to tailings management
and related infrastructure, including: |
| • | Completion
of designs and engineering studies and dam safety reviews of tailings facilities |
| • | Best
management practices following the Mining Association of Canada (MAC) and Canadian Dam
Association (CDA) proposed framework and dam safety criteria. |
| • | Implementation
of risk management and quality management strategies, including QA/QC programs and risk
evaluation and mitigation through identification of critical controls. |
| • | Since
2015 I have been an active member of MAC’s tailings working group (TWG) and participated
in the development of the 3rd edition of MAC’s tailings management guidelines. |
| 3. | I
have read the definition of “qualified person” set out in National Instrument
43-101 – Standards of Disclosure for Mineral Projects (NI 43-101) and certify
that by reason of my education, affiliation with a professional association (as defined
in NI 43-101) and past relevant work experience, I fulfill the requirements to be a “qualified
person” for the purposes of NI 43-101. |
| 4. | I
have not visited the El Peñón project due to travel restrictions related
to the global COVID-19 pandemic. |
| 5. | I
am responsible for Sections 18.1 and 20 and share responsibility for related disclosure
in Sections 1, 25, 26, and 27 of the Technical Report. |
| 6. | I
am not independent of the Issuer. I am a full-time employee of the Issuer. |
| 7. | I
have had no prior involvement with the property that is the subject of the Technical
Report. |
| 8. | I
have read NI 43-101, and the sections of Technical Report for which I am responsible
have been prepared in compliance with NI 43-101 and Form 43-101F1. |
| 9. | At
the effective date of the Technical Report, to the best of my knowledge, information,
and belief, Sections 18.1 and 20 and related disclosure in Sections 1, 25, 26, and 27
in the Technical Report for which I am responsible contain all scientific and technical
information that is required to be disclosed to make the Technical Report not misleading. |
| “Signature” |
|
| Carlos
Iturralde, P.Eng. |
Dated this 25th day of March, 2021 |
28 –Certificates
of Qualified Persons
|
134 |
| Signature Date: March 25, 2021 |
|
Exhibit 99.2
Filed by SEDAR
Sergio Castro
Yamana Gold Inc.
Royal Bank Plaza, North Tower
200 Bay Street, Suite 2200
Toronto, Ontario M5J 2J3
CONSENT OF QUALIFIED PERSON
I, Sergio Castro, Registered Member Chilean Mining
Commission, consent to the public filing of the technical report titled “NI 43-101 Technical Report, El Peñón Gold-Silver
Mine, Antofagasta Region, Chile” and dated effective December 31, 2020 (the “Technical Report”) by Yamana Gold Inc.
I also consent to any extracts from, or a summary
of, the Technical Report in the annual information form for the year ended December 31, 2020 dated March 25, 2021 of Yamana Gold Inc.
(the “Annual Information Form”).
I certify that I have read the Annual Information
Form and that it fairly and accurately represents the information in the sections of the Technical Report for which I am responsible.
Dated this 25th day of March, 2021.
| “Sergio Castro” |
|
| Sergio Castro, Registered Member Chilean Mining Commission |
|
Exhibit 99.3
Filed by SEDAR
Carlos Iturralde
Yamana Gold Inc.
Royal Bank Plaza, North Tower
200 Bay Street, Suite 2200
Toronto, Ontario M5J 2J3
CONSENT OF QUALIFIED PERSON
I, Carlos Iturralde, P.Eng., consent to the public
filing of the technical report titled “NI 43-101 Technical Report, El Peñón Gold-Silver Mine, Antofagasta Region,
Chile” and dated effective December 31, 2020 (the “Technical Report”) by Yamana Gold Inc.
I also consent to any extracts from, or a summary
of, the Technical Report in the annual information form for the year ended December 31, 2020 dated March 25, 2021 of Yamana Gold Inc.
(the “Annual Information Form”).
I certify that I have read the Annual Information
Form and that it fairly and accurately represents the information in the sections of the Technical Report for which I am responsible.
Dated this 25th day of March, 2021.
| “Carlos Iturralde” |
|
| Carlos Iturralde, P.Eng. |
|
Exhibit 99.4
Filed by SEDAR
Henry Marsden
Yamana Gold Inc.
Royal Bank Plaza, North Tower
200 Bay Street, Suite 2200
Toronto, Ontario M5J 2J3
CONSENT OF QUALIFIED PERSON
I, Henry Marsden, P.Geo, consent to the public
filing of the technical report titled “NI 43-101 Technical Report, El Peñón Gold-Silver Mine, Antofagasta Region,
Chile” and dated effective December 31, 2020 (the “Technical Report”) by Yamana Gold Inc.
I also consent to any extracts from, or a summary
of, the Technical Report in the annual information form for the year ended December 31, 2020 dated March 25, 2021 of Yamana Gold Inc.
(the “Annual Information Form”).
I certify that I have read the Annual Information
Form and that it fairly and accurately represents the information in the sections of the Technical Report for which I am responsible.
Dated this 25th day of March, 2021.
| “Henry Marsden” |
|
| Henry Marsden, P.Geo |
|
Exhibit 99.5
Filed by SEDAR
Marco Velásquez Corrales
Yamana Gold Inc.
Royal Bank Plaza, North Tower
200 Bay Street, Suite 2200
Toronto, Ontario M5J 2J3
CONSENT OF QUALIFIED PERSON
I, Marco Velásquez Corrales, Registered
Member Chilean Mining Commission, consent to the public filing of the technical report titled “NI 43-101 Technical Report, El Peñón
Gold-Silver Mine, Antofagasta Region, Chile” and dated effective December 31, 2020 (the “Technical Report”) by Yamana
Gold Inc.
I also consent to any extracts from, or a summary
of, the Technical Report in the annual information form for the year ended December 31, 2020 dated March 25, 2021 of Yamana Gold Inc.
(the “Annual Information Form”).
I certify that I have read the Annual Information
Form and that it fairly and accurately represents the information in the sections of the Technical Report for which I am responsible.
Dated this 25th day of March, 2021.
| “Marco Velásquez” |
|
| Marco Velásquez Corrales, Registered Member Chilean Mining Commission |
|
Pan American Silver (NYSE:PAAS)
Historical Stock Chart
From Mar 2024 to Apr 2024

Pan American Silver (NYSE:PAAS)
Historical Stock Chart
From Apr 2023 to Apr 2024
