0001081745
false
--12-31
Q2
0001081745
2023-01-01
2023-06-30
0001081745
2023-08-11
0001081745
2023-06-30
0001081745
2022-12-31
0001081745
us-gaap:NonrelatedPartyMember
2023-06-30
0001081745
us-gaap:NonrelatedPartyMember
2022-12-31
0001081745
us-gaap:RelatedPartyMember
2023-06-30
0001081745
us-gaap:RelatedPartyMember
2022-12-31
0001081745
2023-04-01
2023-06-30
0001081745
2022-04-01
2022-06-30
0001081745
2022-01-01
2022-06-30
0001081745
INLX:SaleOfSoftwareMember
2023-04-01
2023-06-30
0001081745
INLX:SaleOfSoftwareMember
2022-04-01
2022-06-30
0001081745
INLX:SaleOfSoftwareMember
2023-01-01
2023-06-30
0001081745
INLX:SaleOfSoftwareMember
2022-01-01
2022-06-30
0001081745
INLX:SoftwareAsAServiceMember
2023-04-01
2023-06-30
0001081745
INLX:SoftwareAsAServiceMember
2022-04-01
2022-06-30
0001081745
INLX:SoftwareAsAServiceMember
2023-01-01
2023-06-30
0001081745
INLX:SoftwareAsAServiceMember
2022-01-01
2022-06-30
0001081745
INLX:SoftwareMaintenanceServicesMember
2023-04-01
2023-06-30
0001081745
INLX:SoftwareMaintenanceServicesMember
2022-04-01
2022-06-30
0001081745
INLX:SoftwareMaintenanceServicesMember
2023-01-01
2023-06-30
0001081745
INLX:SoftwareMaintenanceServicesMember
2022-01-01
2022-06-30
0001081745
INLX:ProfessionalServicesMember
2023-04-01
2023-06-30
0001081745
INLX:ProfessionalServicesMember
2022-04-01
2022-06-30
0001081745
INLX:ProfessionalServicesMember
2023-01-01
2023-06-30
0001081745
INLX:ProfessionalServicesMember
2022-01-01
2022-06-30
0001081745
INLX:StorageandRetrievalServicesMember
2023-04-01
2023-06-30
0001081745
INLX:StorageandRetrievalServicesMember
2022-04-01
2022-06-30
0001081745
INLX:StorageandRetrievalServicesMember
2023-01-01
2023-06-30
0001081745
INLX:StorageandRetrievalServicesMember
2022-01-01
2022-06-30
0001081745
us-gaap:CommonStockMember
2022-03-31
0001081745
us-gaap:AdditionalPaidInCapitalMember
2022-03-31
0001081745
us-gaap:RetainedEarningsMember
2022-03-31
0001081745
2022-03-31
0001081745
us-gaap:CommonStockMember
2023-03-31
0001081745
us-gaap:AdditionalPaidInCapitalMember
2023-03-31
0001081745
us-gaap:RetainedEarningsMember
2023-03-31
0001081745
2023-03-31
0001081745
us-gaap:CommonStockMember
2021-12-31
0001081745
us-gaap:AdditionalPaidInCapitalMember
2021-12-31
0001081745
us-gaap:RetainedEarningsMember
2021-12-31
0001081745
2021-12-31
0001081745
us-gaap:CommonStockMember
2022-12-31
0001081745
us-gaap:AdditionalPaidInCapitalMember
2022-12-31
0001081745
us-gaap:RetainedEarningsMember
2022-12-31
0001081745
us-gaap:CommonStockMember
2022-04-01
2022-06-30
0001081745
us-gaap:AdditionalPaidInCapitalMember
2022-04-01
2022-06-30
0001081745
us-gaap:RetainedEarningsMember
2022-04-01
2022-06-30
0001081745
us-gaap:CommonStockMember
2023-04-01
2023-06-30
0001081745
us-gaap:AdditionalPaidInCapitalMember
2023-04-01
2023-06-30
0001081745
us-gaap:RetainedEarningsMember
2023-04-01
2023-06-30
0001081745
us-gaap:CommonStockMember
2022-01-01
2022-06-30
0001081745
us-gaap:AdditionalPaidInCapitalMember
2022-01-01
2022-06-30
0001081745
us-gaap:RetainedEarningsMember
2022-01-01
2022-06-30
0001081745
us-gaap:CommonStockMember
2023-01-01
2023-06-30
0001081745
us-gaap:AdditionalPaidInCapitalMember
2023-01-01
2023-06-30
0001081745
us-gaap:RetainedEarningsMember
2023-01-01
2023-06-30
0001081745
us-gaap:CommonStockMember
2022-06-30
0001081745
us-gaap:AdditionalPaidInCapitalMember
2022-06-30
0001081745
us-gaap:RetainedEarningsMember
2022-06-30
0001081745
2022-06-30
0001081745
us-gaap:CommonStockMember
2023-06-30
0001081745
us-gaap:AdditionalPaidInCapitalMember
2023-06-30
0001081745
us-gaap:RetainedEarningsMember
2023-06-30
0001081745
INLX:IntellineticsOhioAndGraphicSciencesMember
2023-06-30
0001081745
us-gaap:SoftwareDevelopmentMember
2022-04-01
2022-06-30
0001081745
us-gaap:SoftwareDevelopmentMember
2022-01-01
2022-06-30
0001081745
us-gaap:SoftwareDevelopmentMember
2023-04-01
2023-06-30
0001081745
us-gaap:SoftwareDevelopmentMember
2023-01-01
2023-06-30
0001081745
us-gaap:AccountingStandardsUpdate201613Member
2023-06-30
0001081745
2022-01-01
2022-12-31
0001081745
us-gaap:AccountsReceivableMember
2022-12-31
0001081745
us-gaap:AccountsReceivableMember
2023-01-01
2023-06-30
0001081745
us-gaap:AccountsReceivableMember
2023-06-30
0001081745
us-gaap:AccountsReceivableMember
2021-12-31
0001081745
us-gaap:AccountsReceivableMember
2022-01-01
2022-06-30
0001081745
us-gaap:AccountsReceivableMember
2022-06-30
0001081745
INLX:AccountsReceivableUnbilledMember
2022-12-31
0001081745
INLX:AccountsReceivableUnbilledMember
2023-01-01
2023-06-30
0001081745
INLX:AccountsReceivableUnbilledMember
2023-06-30
0001081745
INLX:AccountsReceivableUnbilledMember
2021-12-31
0001081745
INLX:AccountsReceivableUnbilledMember
2022-01-01
2022-06-30
0001081745
INLX:AccountsReceivableUnbilledMember
2022-06-30
0001081745
INLX:ContractAssestsMember
2022-12-31
0001081745
INLX:ContractAssestsMember
2023-01-01
2023-06-30
0001081745
INLX:ContractAssestsMember
2023-06-30
0001081745
INLX:ContractAssestsMember
2021-12-31
0001081745
INLX:ContractAssestsMember
2022-01-01
2022-06-30
0001081745
INLX:ContractAssestsMember
2022-06-30
0001081745
INLX:DocumentManagementMember
2023-04-01
2023-06-30
0001081745
INLX:DocumentManagementMember
2022-04-01
2022-06-30
0001081745
INLX:DocumentManagementMember
2023-01-01
2023-06-30
0001081745
INLX:DocumentManagementMember
2022-01-01
2022-06-30
0001081745
INLX:DocumentConversionMember
2023-04-01
2023-06-30
0001081745
INLX:DocumentConversionMember
2022-04-01
2022-06-30
0001081745
INLX:DocumentConversionMember
2023-01-01
2023-06-30
0001081745
INLX:DocumentConversionMember
2022-01-01
2022-06-30
0001081745
INLX:DocumentManagementMember
2023-06-30
0001081745
INLX:DocumentManagementMember
2022-12-31
0001081745
INLX:DocumentConversionMember
2023-06-30
0001081745
INLX:DocumentConversionMember
2022-12-31
0001081745
2022-04-01
0001081745
INLX:YellowFolderMember
2023-04-01
2023-06-30
0001081745
INLX:YellowFolderMember
2023-01-01
2023-06-30
0001081745
INLX:YellowFolderMember
2022-04-01
2022-06-30
0001081745
INLX:YellowFolderMember
2022-01-01
2022-06-30
0001081745
us-gaap:TradeNamesMember
2023-06-30
0001081745
INLX:ProprietaryTechnologyMember
2023-06-30
0001081745
us-gaap:CustomerRelationshipsMember
srt:MinimumMember
2023-06-30
0001081745
us-gaap:CustomerRelationshipsMember
srt:MaximumMember
2023-06-30
0001081745
us-gaap:CustomerRelationshipsMember
2023-06-30
0001081745
us-gaap:TradeNamesMember
2022-12-31
0001081745
INLX:ProprietaryTechnologyMember
2022-12-31
0001081745
us-gaap:CustomerRelationshipsMember
srt:MinimumMember
2022-12-31
0001081745
us-gaap:CustomerRelationshipsMember
srt:MaximumMember
2022-12-31
0001081745
us-gaap:CustomerRelationshipsMember
2022-12-31
0001081745
INLX:TwoThousandTwentyTwoUnrelatedNotesMember
us-gaap:NonrelatedPartyMember
2023-06-30
0001081745
INLX:TwoThousandTwentyTwoUnrelatedNotesMember
us-gaap:NonrelatedPartyMember
2022-12-31
0001081745
INLX:TwoThousandTwentyNotesMember
us-gaap:NonrelatedPartyMember
2023-06-30
0001081745
INLX:TwoThousandTwentyNotesMember
us-gaap:NonrelatedPartyMember
2022-12-31
0001081745
INLX:TwoThousandTwentyTwoUnrelatedNotesMember
2023-01-01
2023-06-30
0001081745
INLX:TwoThousandTwentyTwoUnrelatedNotesMember
2023-06-30
0001081745
INLX:TwoThousandTwentyNotesMember
2023-01-01
2023-06-30
0001081745
INLX:TwoThousandTwentyNotesMember
2023-06-30
0001081745
us-gaap:RelatedPartyMember
INLX:TwoThousandTwentyTwoRelatedNotesMember
2023-06-30
0001081745
us-gaap:RelatedPartyMember
INLX:TwoThousandTwentyTwoRelatedNotesMember
2022-12-31
0001081745
INLX:AccreditedInvestorsMember
INLX:TwelvePercentageSubordinatedNotesMember
2020-03-01
2020-03-02
0001081745
INLX:TwelvePercentageSubordinatedNotesMember
INLX:AccreditedInvestorsMember
2023-04-01
2023-06-30
0001081745
INLX:TwelvePercentageSubordinatedNotesMember
INLX:AccreditedInvestorsMember
2022-04-01
2022-06-30
0001081745
INLX:TwelvePercentageSubordinatedNotesMember
INLX:AccreditedInvestorsMember
2023-01-01
2023-06-30
0001081745
INLX:TwelvePercentageSubordinatedNotesMember
INLX:AccreditedInvestorsMember
2022-01-01
2022-06-30
0001081745
us-gaap:RelatedPartyMember
2023-01-01
2023-06-30
0001081745
us-gaap:RelatedPartyMember
2023-06-30
0001081745
us-gaap:RelatedPartyMember
2022-12-31
0001081745
us-gaap:RelatedPartyMember
2022-01-01
2022-06-30
0001081745
INLX:ColumbusOHMember
2023-06-30
0001081745
INLX:ColumbusOHMember
2023-01-01
2023-06-30
0001081745
INLX:MadisonHeightsMIMember
2023-06-30
0001081745
INLX:MadisonHeightsMIMember
2023-01-01
2023-06-30
0001081745
INLX:SterlingHeightsMIMember
2023-06-30
0001081745
INLX:SterlingHeightsMIMember
2023-01-01
2023-06-30
0001081745
INLX:TraverseCityMIMember
2023-06-30
0001081745
INLX:TraverseCityMIMember
2023-01-01
2023-06-30
0001081745
INLX:MadisonHeightsMITemporarySpaceMember
2023-06-30
0001081745
INLX:MadisonHeightsMITemporarySpaceMember
2023-01-01
2023-06-30
0001081745
INLX:ExerciseOfOutstandingWarrantsMember
2023-06-30
0001081745
INLX:TwoThousandFifteenEquityIncentivePlanMember
2023-06-30
0001081745
us-gaap:PrivatePlacementMember
2023-04-01
2023-06-30
0001081745
us-gaap:PrivatePlacementMember
2023-01-01
2023-06-30
0001081745
us-gaap:PrivatePlacementMember
2022-04-01
2022-06-30
0001081745
us-gaap:PrivatePlacementMember
2022-01-01
2022-06-30
0001081745
INLX:PrivatePlacement2022Member
2023-01-01
2023-06-30
0001081745
INLX:PrivatePlacement2022Member
2023-06-30
0001081745
INLX:PrivatePlacement2020Member
2023-01-01
2023-06-30
0001081745
INLX:PrivatePlacement2020Member
2023-06-30
0001081745
INLX:WarrantExercisePriceOneMember
2023-06-30
0001081745
INLX:WarrantExercisePriceOneMember
2023-01-01
2023-06-30
0001081745
INLX:WarrantExercisePriceTwoMember
2023-06-30
0001081745
INLX:WarrantExercisePriceTwoMember
2023-01-01
2023-06-30
0001081745
INLX:WarrantExercisePriceThreeMember
2023-06-30
0001081745
INLX:WarrantExercisePriceThreeMember
2023-01-01
2023-06-30
0001081745
INLX:WarrantExercisePriceFourMember
2023-06-30
0001081745
INLX:WarrantExercisePriceFourMember
2023-01-01
2023-06-30
0001081745
INLX:WarrantExercisePriceFiveMember
2023-06-30
0001081745
INLX:WarrantExercisePriceFiveMember
2023-01-01
2023-06-30
0001081745
INLX:PlacementAgentMember
us-gaap:MeasurementInputRiskFreeInterestRateMember
2022-04-01
0001081745
INLX:PlacementAgentMember
us-gaap:MeasurementInputExpectedTermMember
2022-04-01
0001081745
INLX:PlacementAgentMember
us-gaap:MeasurementInputPriceVolatilityMember
2022-04-01
0001081745
INLX:PlacementAgentMember
us-gaap:MeasurementInputExpectedDividendRateMember
2022-04-01
0001081745
us-gaap:RestrictedStockMember
2022-01-05
2022-01-06
0001081745
us-gaap:RestrictedStockMember
2022-01-01
2022-06-30
0001081745
INLX:EmployeeMember
2022-04-13
2022-04-14
0001081745
INLX:EmployeeMember
2022-04-14
0001081745
INLX:GrantDateAprilFourteenTwoThousandTwentyTwoMember
2022-01-01
2022-06-30
0001081745
us-gaap:StockOptionMember
2022-12-31
0001081745
us-gaap:StockOptionMember
2022-01-01
2022-12-31
0001081745
us-gaap:StockOptionMember
2022-01-01
2022-06-30
0001081745
us-gaap:StockOptionMember
2023-01-01
2023-06-30
0001081745
us-gaap:StockOptionMember
2023-06-30
0001081745
us-gaap:StockOptionMember
2021-12-31
0001081745
us-gaap:StockOptionMember
2022-06-30
0001081745
INLX:StateOfMichiganMember
us-gaap:SalesRevenueNetMember
us-gaap:CustomerConcentrationRiskMember
2023-04-01
2023-06-30
0001081745
INLX:StateOfMichiganMember
us-gaap:SalesRevenueNetMember
us-gaap:CustomerConcentrationRiskMember
2022-04-01
2022-06-30
0001081745
INLX:RocketMortgageMember
us-gaap:SalesRevenueNetMember
us-gaap:CustomerConcentrationRiskMember
2023-04-01
2023-06-30
0001081745
INLX:RocketMortgageMember
us-gaap:SalesRevenueNetMember
us-gaap:CustomerConcentrationRiskMember
2022-04-01
2022-06-30
0001081745
INLX:StateOfMichiganMember
us-gaap:SalesRevenueNetMember
us-gaap:CustomerConcentrationRiskMember
2023-01-01
2023-06-30
0001081745
INLX:StateOfMichiganMember
us-gaap:SalesRevenueNetMember
us-gaap:CustomerConcentrationRiskMember
2022-01-01
2022-06-30
0001081745
INLX:RocketMortgageMember
us-gaap:SalesRevenueNetMember
us-gaap:CustomerConcentrationRiskMember
2023-01-01
2023-06-30
0001081745
INLX:RocketMortgageMember
us-gaap:SalesRevenueNetMember
us-gaap:CustomerConcentrationRiskMember
2022-01-01
2022-06-30
0001081745
INLX:GovernmentContractsMember
us-gaap:SalesRevenueNetMember
us-gaap:CustomerConcentrationRiskMember
2023-04-01
2023-06-30
0001081745
INLX:GovernmentContractsMember
us-gaap:SalesRevenueNetMember
us-gaap:CustomerConcentrationRiskMember
2022-04-01
2022-06-30
0001081745
INLX:GovernmentContractsMember
us-gaap:SalesRevenueNetMember
us-gaap:CustomerConcentrationRiskMember
2023-01-01
2023-06-30
0001081745
INLX:GovernmentContractsMember
us-gaap:SalesRevenueNetMember
us-gaap:CustomerConcentrationRiskMember
2022-01-01
2022-06-30
0001081745
INLX:CustomerOneMember
us-gaap:AccountsReceivableMember
us-gaap:CustomerConcentrationRiskMember
2023-01-01
2023-06-30
0001081745
INLX:CustomerTwoMember
us-gaap:AccountsReceivableMember
us-gaap:CustomerConcentrationRiskMember
2023-01-01
2023-06-30
0001081745
INLX:CustomerOneMember
us-gaap:AccountsReceivableMember
us-gaap:CustomerConcentrationRiskMember
2022-01-01
2022-12-31
0001081745
INLX:CustomerTwoMember
us-gaap:AccountsReceivableMember
us-gaap:CustomerConcentrationRiskMember
2022-01-01
2022-12-31
iso4217:USD
xbrli:shares
iso4217:USD
xbrli:shares
xbrli:pure
utr:sqft
INLX:Segment
UNITED
STATES
SECURITIES
AND EXCHANGE COMMISSION
WASHINGTON,
D.C. 20549
FORM
10-Q
(Mark
One)
| ☒ |
QUARTERLY
REPORT PURSUANT TO SECTION 13 OR 15(d) OF THE SECURITIES EXCHANGE ACT OF 1934 |
For
the Quarterly Period Ended June 30, 2023
| ☐ |
TRANSITION
REPORT PURSUANT TO SECTION 13 OR 15(d) OF THE SECURITIES EXCHANGE ACT OF 1934 |
For
the transition period from _____________________to _________________________
Commission
file number: 001-41495
INTELLINETICS,
INC.
(Exact
name of registrant as specified in its charter)
| Nevada |
|
87-0613716 |
(State
or Other Jurisdiction of
Incorporation
or Organization) |
|
(I.R.S.
Employer
Identification
No.) |
| 2190
Dividend Drive |
|
|
| Columbus,
Ohio |
|
43228 |
| (Address
of Principal Executive Offices) |
|
(Zip
Code) |
(614)
921-8170
(Registrant’s
telephone number, including area code)
(Former
name and former address, if changed since last report)
Securities
registered pursuant to Section 12(b) of the Act:
| Title
of each class |
|
Trading
Symbol(s) |
|
Name
of each exchange on which registered |
| Common
Stock, $0.001 par value |
|
INLX |
|
NYSE
American |
Indicate
by check mark whether the registrant: (1) has filed all reports required to be filed by Section 13 or 15(d) of the Securities Exchange
Act of 1934 during the preceding 12 months (or for such shorter period that the registrant was required to file such reports), and (2)
has been subject to such filing requirements for the past 90 days. Yes ☒ No ☐
Indicate
by check mark whether the registrant has submitted electronically every Interactive Data File required to be submitted pursuant to Rule
405 of Regulation S-T (§232.405 of this chapter) during the preceding 12 months (or for such shorter period that the registrant
was required to submit such files). Yes ☒ No ☐
Indicate
by check mark whether the registrant is a large accelerated filer, an accelerated filer, a non-accelerated filer, a smaller reporting
company, or an emerging growth company. See definitions of “large accelerated filer,” “accelerated filer,” “smaller
reporting company,” and “emerging growth company” in Rule 12b- 2 of the Exchange Act.
| Large
accelerated filer |
☐ |
(Do
not check if a smaller reporting company) |
Accelerated
filer |
☐ |
| Non-accelerated
filer |
☐ |
|
Smaller
reporting company |
☒ |
| Emerging
growth company |
☐ |
|
|
|
If
an emerging growth company, indicate by check mark if the registrant has elected not to use the extended transition period for complying
with any new or revised financial accounting standards provided pursuant to Section 13(a) of the Exchange Act. ☐
Indicate
by check mark whether the registrant is a shell company (as defined in Rule 12b-2 of the Exchange Act): Yes ☐ No ☒
As
of August 11, 2023, there were 4,073,757 shares of the issuer’s common stock outstanding, each with a par value of $0.001 per
share.
INTELLINETICS,
INC.
Form
10-Q
June
30, 2023
TABLE
OF CONTENTS
CAUTIONARY
NOTE REGARDING FORWARD-LOOKING STATEMENTS
This
Quarterly Report on Form 10-Q and the documents incorporated into this report by reference contain forward-looking statements. In addition,
from time to time we may make additional forward-looking statements in presentations, at conferences, in press releases, in other reports
and filings and otherwise. Forward-looking statements are all statements other than statements of historical facts, including statements
that refer to plans, intentions, objectives, goals, targets, strategies, hopes, beliefs, projections, prospects, expectations or other
characterizations of future events or performance, and assumptions underlying the foregoing. The words “may,” “could,”
“should,” “would,” “will,” “project,” “intend,” “continue,” “believe,”
“anticipate,” “estimate,” “forecast,” “expect,” “plan,” “potential,”
“opportunity,” “scheduled,” “goal,” “target,” and “future,” variations of
such words, and other comparable terminology and similar expressions and references to future periods are often, but not always, used
to identify forward-looking statements. Examples of forward-looking statements include, among other things, statements about the following:
| |
● |
the
effects on our business, financial condition, and results of operations of current and future economic, business, market and regulatory
conditions, including the current global inflation, economic downturn, and other economic and market conditions, and their effects
on our customers and their capital spending and ability to finance purchases of our products, services, technologies and systems; |
| |
|
|
| |
● |
our
prospects, including our future business, revenues, recurring revenues, expenses, net income, earnings per share, margins, profitability,
cash flow, cash position, liquidity, financial condition and results of operations, backlog of orders and revenue, our targeted growth
rate, our goals for future revenues and earnings, and our expectations about realizing the revenues in our backlog and in our sales
pipeline; |
| |
|
|
| |
● |
our
expectation that the shift from an offline to online world will continue to benefit our business; |
| |
|
|
| |
● |
our
ability to integrate our recent acquisitions and any future acquisitions, grow their businesses and obtain the expected financial
and operational benefits from those businesses; |
| |
|
|
| |
● |
the
effects of fluctuations in sales on our business, revenues, expenses, net income, earnings per share, margins, profitability, cash
flow, capital expenditures, liquidity, financial condition and results of operations; |
| |
|
|
| |
● |
our
products, services, technologies and systems, including their quality and performance in absolute terms and as compared to competitive
alternatives, their benefits to our customers and their ability to meet our customers’ requirements, and our ability to successfully
develop and market new products, services, technologies and systems; |
| |
|
|
| |
● |
our
markets, including our market position and our market share; |
| |
|
|
| |
● |
our
ability to successfully develop, operate, grow and diversify our operations and businesses; |
| |
|
|
| |
● |
our
business plans, strategies, goals and objectives, and our ability to successfully achieve them; |
| |
|
|
| |
● |
the
sufficiency of our capital resources, including our cash and cash equivalents, funds generated from operations, availability credit
and financing arrangements and other capital resources, to meet our future working capital, capital expenditure, lease and debt service
and business growth needs; |
| |
|
|
| |
● |
the
value of our assets and businesses, including the revenues, profits and cash flow they are capable of delivering in the future; |
| |
|
|
| |
● |
the
amount and timing of revenue recognition from customer contracts with commitments for performance obligations, including our estimate
of the remaining amount of commitments and when we expect to recognize revenues; |
| |
|
|
| |
● |
industry
trends and customer preferences and the demand for our products, services, technologies and systems; and |
| |
|
|
| |
● |
the
nature and intensity of our competition, and our ability to successfully compete in our markets. |
Any
forward-looking statements we make are based on our current plans, intentions, objectives, strategies, projections and expectations,
as well as assumptions made by and information currently available to management. Forward-looking statements are not guarantees of future
performance or events, but are subject to and qualified by substantial risks, uncertainties and other factors, which are difficult to
predict and are often beyond our control. Forward-looking statements will be affected by assumptions and expectations we might make that
do not materialize or that prove to be incorrect and by known and unknown risks, uncertainties and other factors that could cause actual
results to differ materially from those expressed, anticipated or implied by such forward-looking statements. These risks, uncertainties
and other factors include, but are not limited to, those described in Part I, Item 1A, “Risk Factors,” of our Annual Report
on Form 10-K for the fiscal year ended December 31, 2022, filed on March 27, 2023, as well as other risks, uncertainties and factors
discussed elsewhere in this Quarterly Report, in documents that we include as exhibits to or incorporate by reference in this report,
and in other reports and documents we from time to time file with or furnish to the Securities and Exchange Commission (the “SEC”).
In light of these risks and uncertainties, you are cautioned not to place undue reliance on any forward-looking statements that we make.
Any
forward-looking statements contained in this report speak only as of the date of this report, and any other forward-looking statements
we make from time to time in the future speak only as of the date they are made. We undertake no duty or obligation to update or revise
any forward-looking statement or to publicly disclose any update or revision for any reason, whether as a result of changes in our expectations
or the underlying assumptions, the receipt of new information, the occurrence of future or unanticipated events, circumstances or conditions
or otherwise.
As
used in this Quarterly Report, unless the context indicates otherwise:
| |
● |
the
terms “Intellinetics,” “Company,” “the company” “us,” “we,” “our,”
and similar terms refer to Intellinetics, Inc., a Nevada corporation, and its subsidiaries; |
| |
● |
“Intellinetics
Ohio” refers to Intellinetics, Inc., an Ohio corporation and a wholly-owned subsidiary of Intellinetics; and |
| |
● |
“Graphic
Sciences” refers to Graphic Sciences, Inc., a Michigan corporation and a wholly-owned subsidiary of Intellinetics. |
PART
I – FINANCIAL INFORMATION
Item
1. Financial Statements
INTELLINETICS,
INC. and SUBSIDIARIES
Condensed
Consolidated Balance Sheets
| | |
(unaudited) | | |
| |
| | |
June 30, 2023 | | |
December 31, 2022 | |
| ASSETS | |
| | | |
| | |
| Current assets: | |
| | | |
| | |
| Cash | |
$ | 1,130,487 | | |
$ | 2,696,481 | |
| Accounts receivable, net | |
| 1,326,986 | | |
| 1,121,083 | |
| Accounts receivable, unbilled | |
| 1,038,013 | | |
| 596,410 | |
| Parts and supplies, net | |
| 72,569 | | |
| 73,221 | |
| Contract assets | |
| 96,470 | | |
| 80,378 | |
| Prepaid expenses and other current assets | |
| 337,373 | | |
| 325,466 | |
| Total current assets | |
| 4,001,898 | | |
| 4,893,039 | |
| | |
| | | |
| | |
| Property and equipment, net | |
| 1,024,776 | | |
| 1,068,706 | |
| Right of use assets, operating | |
| 2,895,784 | | |
| 3,200,191 | |
| Right of use asset, finance | |
| 170,194 | | |
| 154,282 | |
| Intangible assets, net | |
| 4,164,492 | | |
| 4,419,646 | |
| Goodwill | |
| 5,789,821 | | |
| 5,789,821 | |
| Other assets | |
| 540,121 | | |
| 417,457 | |
| Total assets | |
$ | 18,587,086 | | |
$ | 19,943,142 | |
| | |
| | | |
| | |
| LIABILITIES AND STOCKHOLDERS’ EQUITY | |
| | | |
| | |
| | |
| | | |
| | |
| Current liabilities: | |
| | | |
| | |
| Accounts payable | |
$ | 356,545 | | |
$ | 370,300 | |
| Accrued compensation | |
| 336,317 | | |
| 411,683 | |
| Accrued expenses | |
| 181,961 | | |
| 114,902 | |
| Lease liabilities, operating - current | |
| 711,229 | | |
| 692,074 | |
| Lease liability, finance - current | |
| 28,303 | | |
| 22,493 | |
| Deferred revenues | |
| 2,067,744 | | |
| 2,754,064 | |
| Earnout liabilities - current | |
| - | | |
| 700,000 | |
| Notes payable - current | |
| 709,083 | | |
| 936,966 | |
| Total current liabilities | |
| 4,391,182 | | |
| 6,002,482 | |
| | |
| | | |
| | |
| Long-term liabilities: | |
| | | |
| | |
| Notes payable - net of current portion | |
| 2,147,139 | | |
| 2,085,035 | |
| Notes payable - related party | |
| 544,843 | | |
| 529,084 | |
| Lease liabilities, operating - net of current portion | |
| 2,307,326 | | |
| 2,624,608 | |
| Lease liability, finance - net of current portion | |
| 145,880 | | |
| 133,131 | |
| Total long-term liabilities | |
| 5,145,188 | | |
| 5,371,858 | |
| Total liabilities | |
| 9,536,370 | | |
| 11,374,340 | |
| | |
| | | |
| | |
| Stockholders’ equity: | |
| | | |
| | |
| Common stock, $0.001 par value, 25,000,000 shares authorized; 4,073,757 shares issued and outstanding at June 30, 2023 and December 31, 2022 | |
| 4,074 | | |
| 4,074 | |
| Additional paid-in capital | |
| 30,412,634 | | |
| 30,179,017 | |
| Accumulated deficit | |
| (21,365,992 | ) | |
| (21,614,289 | ) |
| Total stockholders’ equity | |
| 9,050,716 | | |
| 8,568,802 | |
| Total liabilities and stockholders’ equity | |
$ | 18,587,086 | | |
$ | 19,943,142 | |
See
Notes to these condensed consolidated financial statements
INTELLINETICS,
INC. and SUBSIDIARIES
Condensed
Consolidated Statements of Operations
(unaudited)
| | |
2023 | | |
2022 | | |
2023 | | |
2022 | |
| | |
For the Three Months Ended
June 30, | | |
For the Six Months Ended
June 30, | |
| | |
2023 | | |
2022 | | |
2023 | | |
2022 | |
| | |
| | |
| | |
| | |
| |
| Revenues: | |
| | | |
| | | |
| | | |
| | |
| Sale of software | |
$ | 63,646 | | |
$ | 11,105 | | |
$ | 78,939 | | |
$ | 75,596 | |
| Software as a service | |
| 1,277,918 | | |
| 1,158,456 | | |
| 2,516,350 | | |
| 1,589,677 | |
| Software maintenance services | |
| 349,139 | | |
| 343,881 | | |
| 698,681 | | |
| 680,483 | |
| Professional services | |
| 2,298,316 | | |
| 1,625,765 | | |
| 4,597,605 | | |
| 3,213,713 | |
| Storage and retrieval services | |
| 269,411 | | |
| 276,436 | | |
| 553,688 | | |
| 559,686 | |
| Total revenues | |
| 4,258,430 | | |
| 3,415,643 | | |
| 8,445,263 | | |
| 6,119,155 | |
| | |
| | | |
| | | |
| | | |
| | |
| Cost of revenues: | |
| | | |
| | | |
| | | |
| | |
| Sale of software | |
| 7,344 | | |
| 7,392 | | |
| 15,525 | | |
| 33,585 | |
| Software as a service | |
| 258,382 | | |
| 191,188 | | |
| 479,022 | | |
| 282,437 | |
| Software maintenance services | |
| 15,117 | | |
| 19,185 | | |
| 31,833 | | |
| 37,485 | |
| Professional services | |
| 1,307,341 | | |
| 918,542 | | |
| 2,494,457 | | |
| 1,766,709 | |
| Storage and retrieval services | |
| 79,813 | | |
| 90,318 | | |
| 188,154 | | |
| 178,084 | |
| Total cost of revenues | |
| 1,667,997 | | |
| 1,226,625 | | |
| 3,208,991 | | |
| 2,298,300 | |
| | |
| | | |
| | | |
| | | |
| | |
| Gross profit | |
| 2,590,433 | | |
| 2,189,018 | | |
| 5,236,272 | | |
| 3,820,855 | |
| | |
| | | |
| | | |
| | | |
| | |
| Operating expenses: | |
| | | |
| | | |
| | | |
| | |
| General and administrative | |
| 1,561,939 | | |
| 1,254,862 | | |
| 3,116,550 | | |
| 2,190,553 | |
| Change in fair value of earnout liabilities | |
| - | | |
| 52,301 | | |
| - | | |
| 116,505 | |
| Transaction costs | |
| - | | |
| 285,230 | | |
| - | | |
| 355,281 | |
| Sales and marketing | |
| 492,303 | | |
| 529,405 | | |
| 1,071,814 | | |
| 881,519 | |
| Depreciation and amortization | |
| 239,803 | | |
| 200,919 | | |
| 467,521 | | |
| 318,221 | |
| | |
| | | |
| | | |
| | | |
| | |
| Total operating expenses | |
| 2,294,045 | | |
| 2,322,717 | | |
| 4,655,885 | | |
| 3,862,079 | |
| | |
| | | |
| | | |
| | | |
| | |
| Income (loss) from operations | |
| 296,388 | | |
| (133,699 | ) | |
| 580,387 | | |
| (41,224 | ) |
| | |
| | | |
| | | |
| | | |
| | |
| Interest expense | |
| (160,654 | ) | |
| (240,468 | ) | |
| (332,090 | ) | |
| (353,069 | ) |
| | |
| | | |
| | | |
| | | |
| | |
| Net income (loss) | |
$ | 135,734 | | |
$ | (374,167 | ) | |
$ | 248,297 | | |
$ | (394,293 | ) |
| | |
| | | |
| | | |
| | | |
| | |
| Basic net income (loss) per share: | |
$ | 0.03 | | |
$ | (0.09 | ) | |
$ | 0.06 | | |
$ | (0.11 | ) |
| Diluted net income (loss) per share: | |
$ | 0.03 | | |
$ | (0.09 | ) | |
$ | 0.06 | | |
$ | (0.11 | ) |
| | |
| | | |
| | | |
| | | |
| | |
| Weighted average number of common shares outstanding - basic | |
| 4,073,757 | | |
| 4,073,757 | | |
| 4,073,757 | | |
| 3,455,761 | |
| Weighted average number of common shares outstanding - diluted | |
| 4,073,757 | | |
| 4,073,757 | | |
| 4,073,757 | | |
| 3,455,761 | |
See
Notes to these condensed consolidated financial statements
INTELLINETICS,
INC. and SUBSIDIARIES
Condensed
Consolidated Statement of Stockholders’ Equity
For
the Three and Six Months Ended June, 2023 and 2022
(unaudited)
| | |
Shares | | |
Amount | | |
Capital | | |
Deficit | | |
Total | |
| | |
Common Stock | | |
Additional Paid-in | | |
Accumulated | | |
| |
| | |
Shares | | |
Amount | | |
Capital | | |
Deficit | | |
Total | |
| | |
| | |
| | |
| | |
| | |
| |
| Balance, March 31, 2022 | |
| 2,831,169 | | |
$ | 2,831 | | |
$ | 24,377,681 | | |
$ | (21,658,442 | ) | |
$ | 2,722,070 | |
| | |
| | | |
| | | |
| | | |
| | | |
| | |
| Stock Option Compensation | |
| - | | |
| - | | |
| 102,992 | | |
| - | | |
| 102,992 | |
| | |
| | | |
| | | |
| | | |
| | | |
| | |
| Stock Issued | |
| 1,242,588 | | |
| 1,243 | | |
| 5,739,515 | | |
| - | | |
| 5,740,758 | |
| | |
| | | |
| | | |
| | | |
| | | |
| | |
| Equity Issuance Costs | |
| - | | |
| - | | |
| (492,182 | ) | |
| - | | |
| (492,182 | ) |
| | |
| | | |
| | | |
| | | |
| | | |
| | |
| Note Offer Warrants | |
| - | | |
| - | | |
| 213,013 | | |
| - | | |
| 213,013 | |
| | |
| | | |
| | | |
| | | |
| | | |
| | |
| Net Loss | |
| - | | |
| - | | |
| - | | |
| (374,167 | ) | |
| (374,167 | ) |
| | |
| | | |
| | | |
| | | |
| | | |
| | |
| Balance, June 30, 2022 | |
| 4,073,757 | | |
$ | 4,074 | | |
$ | 29,941,019 | | |
$ | (22,032,609 | ) | |
$ | 7,912,484 | |
| | |
| | | |
| | | |
| | | |
| | | |
| | |
| Balance, March 31, 2023 | |
| 4,073,757 | | |
$ | 4,074 | | |
$ | 30,297,179 | | |
$ | (21,501,726 | ) | |
$ | 8,799,527 | |
| | |
| | | |
| | | |
| | | |
| | | |
| | |
| Stock Option Compensation | |
| - | | |
| - | | |
| 115,455 | | |
| - | | |
| 115,455 | |
| | |
| | | |
| | | |
| | | |
| | | |
| | |
| Net Income | |
| - | | |
| - | | |
| - | | |
| 135,734 | | |
| 135,734 | |
| | |
| | | |
| | | |
| | | |
| | | |
| | |
| Balance, June 30, 2023 | |
| 4,073,757 | | |
$ | 4,074 | | |
$ | 30,412,634 | | |
$ | (21,365,992 | ) | |
$ | 9,050,716 | |
| | |
Common Stock | | |
Additional Paid-in | | |
Accumulated | | |
| |
| | |
Shares | | |
Amount | | |
Capital | | |
Deficit | | |
Total | |
| | |
| | |
| | |
| | |
| | |
| |
| Balance, December 31, 2021 | |
| 2,823,072 | | |
$ | 2,823 | | |
$ | 24,297,229 | | |
$ | (21,638,316 | ) | |
$ | 2,661,736 | |
| | |
| | | |
| | | |
| | | |
| | | |
| | |
| Stock Issued to Directors | |
| 8,097 | | |
| 8 | | |
| 57,492 | | |
| - | | |
| 57,500 | |
| | |
| | | |
| | | |
| | | |
| | | |
| | |
| Stock Option Compensation | |
| - | | |
| - | | |
| 125,952 | | |
| - | | |
| 125,952 | |
| | |
| | | |
| | | |
| | | |
| | | |
| | |
| Stock Issued | |
| 1,242,588 | | |
| 1,243 | | |
| 5,739,515 | | |
| - | | |
| 5,740,758 | |
| | |
| | | |
| | | |
| | | |
| | | |
| | |
| Equity Issuance Costs | |
| - | | |
| - | | |
| (492,182 | ) | |
| - | | |
| (492,182 | ) |
| | |
| | | |
| | | |
| | | |
| | | |
| | |
| Note Offer Warrants | |
| - | | |
| - | | |
| 213,013 | | |
| - | | |
| 213,013 | |
| | |
| | | |
| | | |
| | | |
| | | |
| | |
| Net Loss | |
| - | | |
| - | | |
| - | | |
| (394,293 | ) | |
| (394,293 | ) |
| | |
| | | |
| | | |
| | | |
| | | |
| | |
| Balance, June 30, 2022 | |
| 4,073,757 | | |
$ | 4,074 | | |
$ | 29,941,019 | | |
$ | (22,032,609 | ) | |
$ | 7,912,484 | |
| | |
| | | |
| | | |
| | | |
| | | |
| | |
| Balance, December 31, 2022 | |
| 4,073,757 | | |
$ | 4,074 | | |
$ | 30,179,017 | | |
$ | (21,614,289 | ) | |
$ | 8,568,802 | |
| | |
| | | |
| | | |
| | | |
| | | |
| | |
| Stock Option Compensation | |
| - | | |
| - | | |
| 233,617 | | |
| - | | |
| 233,617 | |
| | |
| | | |
| | | |
| | | |
| | | |
| | |
| Net Income | |
| - | | |
| - | | |
| - | | |
| 248,297 | | |
| 248,297 | |
| Net Income (Loss) | |
| - | | |
| - | | |
| - | | |
| 248,297 | | |
| 248,297 | |
| | |
| | | |
| | | |
| | | |
| | | |
| | |
| Balance, June 30, 2023 | |
| 4,073,757 | | |
$ | 4,074 | | |
$ | 30,412,634 | | |
$ | (21,365,992 | ) | |
$ | 9,050,716 | |
See
Notes to these condensed consolidated financial statements
INTELLINETICS,
INC. and SUBSIDIARIES
Condensed
Consolidated Statements of Cash Flows
(unaudited)
| | |
2023 | | |
2022 | |
| | |
For the Six Months Ended June 30, | |
| | |
2023 | | |
2022 | |
| | |
| | |
| |
| Cash flows from operating activities: | |
| | | |
| | |
| Net income (loss) | |
$ | 248,297 | | |
$ | (394,293 | ) |
| Adjustments to reconcile net income (loss) to net cash used in / provided by operating activities: | |
| | | |
| | |
| Depreciation and amortization | |
| 467,521 | | |
| 318,221 | |
| Bad debt expense | |
| 27,528 | | |
| 2,327 | |
| Amortization of deferred financing costs | |
| 95,152 | | |
| 90,801 | |
| Amortization of debt discount | |
| 17,778 | | |
| 53,332 | |
| Amortization of right of use asset, financing | |
| 14,959 | | |
| - | |
| Stock issued for services | |
| - | | |
| 57,500 | |
| Stock option compensation | |
| 233,617 | | |
| 125,952 | |
| Change in fair value of earnout liabilities | |
| - | | |
| 116,505 | |
| Changes in operating assets and liabilities: | |
| | | |
| | |
| Accounts receivable | |
| (233,431 | ) | |
| 370,617 | |
| Accounts receivable, unbilled | |
| (441,603 | ) | |
| 9,703 | |
| Parts and supplies | |
| 652 | | |
| (8,442 | ) |
| Prepaid expenses and other current assets | |
| (27,999 | ) | |
| (146,026 | ) |
| Accounts payable and accrued expenses | |
| (22,062 | ) | |
| 64,641 | |
| Operating lease assets and liabilities, net | |
| 6,280 | | |
| 15,333 | |
| Deferred compensation | |
| - | | |
| (50,414 | ) |
| Deferred revenues | |
| (686,320 | ) | |
| (553,108 | ) |
| Total adjustments | |
| (547,928 | ) | |
| 466,942 | |
| Net cash (used in) provided by operating activities | |
| (299,631 | ) | |
| 72,649 | |
| | |
| | | |
| | |
| Cash flows from investing activities: | |
| | | |
| | |
| Cash paid to acquire business, net | |
| - | | |
| (6,383,269 | ) |
| Capitalization of internal use software | |
| (208,417 | ) | |
| (171,205 | ) |
| Purchases of property and equipment | |
| (82,684 | ) | |
| (98,199 | ) |
| Net cash used in investing activities | |
| (291,101 | ) | |
| (6,652,673 | ) |
| | |
| | | |
| | |
| Cash flows from financing activities: | |
| | | |
| | |
| Payment of earnout liabilities | |
| (700,000 | ) | |
| (1,018,333 | ) |
| Proceeds from issuance of common stock | |
| - | | |
| 5,740,758 | |
| Offering costs paid on issuance of common stock and notes | |
| - | | |
| (746,342 | ) |
| Proceeds from notes payable | |
| - | | |
| 2,364,500 | |
| Proceeds from notes payable - related parties | |
| - | | |
| 600,000 | |
| Principal payments on financing lease liability | |
| (12,312 | ) | |
| - | |
| Repayment of notes payable | |
| (262,950 | ) | |
| - | |
| Net cash (used in) provided by financing activities | |
| (975,262 | ) | |
| 6,940,583 | |
| | |
| | | |
| | |
| Net (decrease) increase in cash | |
| (1,565,994 | ) | |
| 360,559 | |
| Cash - beginning of period | |
| 2,696,481 | | |
| 1,752,630 | |
| Cash - end of period | |
$ | 1,130,487 | | |
$ | 2,113,189 | |
| | |
| | | |
| | |
| Supplemental disclosure of cash flow information: | |
| | | |
| | |
| Cash paid during the period for interest | |
$ | 226,570 | | |
$ | 208,935 | |
| Cash paid during the period for income taxes | |
$ | 7,708 | | |
$ | 9,576 | |
| | |
| | | |
| | |
| Supplemental disclosure of non-cash financing activities: | |
| | | |
| | |
| Discount on notes payable for warrants | |
$ | - | | |
$ | 169,900 | |
| Discount on notes payable - related parties for warrants | |
| - | | |
| 43,113 | |
| Warrants issued and extended for common stock issuance costs | |
| - | | |
| 412,500 | |
| | |
| | | |
| | |
| Supplemental disclosure of non-cash investing activities relating to business acquisitions: | |
| | | |
| | |
| Accounts receivable | |
$ | - | | |
$ | 68,380 | |
| Prepaid expenses | |
| - | | |
| 38,913 | |
| Property and equipment | |
| - | | |
| 30,018 | |
| Intangible assets | |
| - | | |
| 3,888,000 | |
| Goodwill | |
| - | | |
| 3,466,934 | |
| Accounts payable | |
| - | | |
| (36,446 | ) |
| Deferred revenues | |
| - | | |
| (1,072,530 | ) |
| Net assets acquired in acquisition | |
| - | | |
| 6,383,269 | |
| Cash used in business acquisition | |
$ | - | | |
$ | 6,383,269 | |
See
Notes to these condensed consolidated financial statements
INTELLINETICS,
INC. AND SUBSIDIARIES
Notes
to Condensed Consolidated Financial Statements
(Unaudited)
1.
Business Organization and Nature of Operations
Intellinetics,
Inc., formerly known as GlobalWise Investments, Inc., is a Nevada corporation incorporated in 1997, with two wholly-owned subsidiaries:
Intellinetics, Inc., an Ohio corporation (“Intellinetics Ohio”), and Graphic Sciences, Inc., a Michigan corporation (“Graphic
Sciences”). Intellinetics Ohio was incorporated in 1996, and on February 10, 2012, Intellinetics Ohio became our sole operating
subsidiary as a result of a reverse merger and recapitalization. On March 2, 2020, we purchased all the outstanding capital stock of
Graphic Sciences.
Our
digital transformation products and services are provided through two reporting segments: Document Management and Document Conversion.
Our Document Management segment, which includes the Yellow Folder, LLC (“Yellow Folder”) asset acquisition in April 2022
and the CEO Imaging Systems, Inc. (“CEO Image”) asset acquisition in April 2020, consists primarily of solutions involving
our software platform, allowing customers to capture and manage their documents across operations such as scanned hard-copy documents
and digital documents including those from Microsoft Office 365, digital images, audio, video and emails. Our Document Conversion segment,
which includes and primarily consists of the Graphic Sciences acquisition, provides assistance to customers as a part of their overall
document strategy to convert documents from one medium to another, predominantly paper to digital, including migration to our software
solutions, as well as long-term storage and retrieval services. Our solutions create value for customers by making it easy to connect
business-critical documents to the people who need them by making those documents easy to find and access, while also being secure and
compliant with the customers’ audit requirements. Solutions are sold both directly to end-users and through resellers.
2.
Basis of Presentation
The
accompanying unaudited condensed consolidated financial statements have been prepared in accordance with United States generally accepted
accounting principles (“GAAP”).
The
financial statements presented in this Quarterly Report on Form 10-Q are unaudited. However, in the opinion of management, these unaudited
condensed consolidated financial statements include all adjustments, consisting solely of normal recurring adjustments, necessary to
present fairly the financial position, results of operations and cash flows for the periods presented in conformity with GAAP applicable
to interim periods. The financial data and other financial information disclosed in these notes to the accompanying condensed consolidated
financial statements are also unaudited. As such, certain information and footnote disclosures normally included in financial statements
prepared in accordance with GAAP have been condensed or omitted pursuant to applicable rules and regulations thereunder.
Operating
results for the interim periods presented are not necessarily indicative of the results that may be expected for the full fiscal year
ending December 31, 2023 or any other future period.
These
unaudited interim condensed consolidated financial statements should be read in conjunction with the consolidated financial statements
and the related notes included in our Annual Report on Form 10-K for the fiscal year ended December 31, 2022 filed with the SEC filed
on March 27, 2023.
3.
Summary of Significant Accounting Policies
Principles
of Consolidation
The
condensed consolidated financial statements accompanying these notes include the accounts of Intellinetics and the accounts of all its
subsidiaries in which it holds a controlling interest. Under GAAP, consolidation is generally required for investments of more than 50%
of the outstanding voting stock of an investee, except when control is not held by the majority owner. We have two subsidiaries: Intellinetics
Ohio and Graphic Sciences. We consider the criteria established under Financial Accounting Standards Board (“FASB”) Accounting
Standard Codification (“ASC”) 810, “Consolidations” in the consolidation process. All significant intercompany
balances and transactions have been eliminated in consolidation.
Concentrations
of Credit Risk
We
maintain our cash with high credit quality financial institutions. At times, our cash and cash equivalents may be uninsured or in deposit
accounts that exceed the Federal Deposit Insurance Corporation insurance limit.
We
do not generally require collateral or other security to support customer receivables; however, we may require customers to provide retainers,
up-front deposits or irrevocable letters-of-credit when considered necessary to mitigate credit risks. We have established an allowance
for credit losses based upon facts surrounding the credit risk of specific customers and expected future collections. Credit losses have
been within management’s expectations. At June 30, 2023 and December 31, 2022, our allowance for credit losses was $114,219 and
$88,331, respectively.
Contract
balances
The
following table present changes in our contract assets during the six months ended June 30, 2023 and 2022:
Schedule of Changes in Contract Assets
| | |
| | |
Addition | | |
| | |
| | |
| |
| | |
Balance at | | |
from | | |
| | |
| | |
Balance at | |
| | |
Beginning | | |
acquisition | | |
| | |
Recognized | | |
End of | |
| | |
of Period | | |
(Note 4) | | |
Billings | | |
Revenue | | |
Period | |
| Six months ended June 30, 2023 | |
| | | |
| | | |
| | | |
| | | |
| | |
| Accounts receivable | |
$ | 1,121,083 | | |
$ | - | | |
$ | 7,342,400 | | |
$ | (7,136,497 | ) | |
$ | 1,326,986 | |
| | |
| | | |
| | | |
| | | |
| | | |
| | |
| Six months ended June 30, 2022 | |
| | | |
| | | |
| | | |
| | | |
| | |
| Accounts receivable | |
$ | 1,176,059 | | |
$ | 68,380 | | |
$ | 5,604,581 | | |
$ | (5,977,525 | ) | |
$ | 871,495 | |
| | |
Balance at Beginning of Period | | |
Revenue Recognized in Advance of Billings | | |
Billings | | |
Balance at End of Period | |
| Six months ended June 30, 2023 | |
| | | |
| | | |
| | | |
| | |
| Accounts receivable, unbilled | |
$ | 596,410 | | |
$ | 2,703,932 | | |
$ | (2,262,329 | ) | |
$ | 1,038,013 | |
| | |
| | | |
| | | |
| | | |
| | |
| Six months ended June 30, 2022 | |
| | | |
| | | |
| | | |
| | |
| Accounts receivable, unbilled | |
$ | 444,782 | | |
$ | 1,501,726 | | |
$ | (1,511,429 | ) | |
$ | 435,079 | |
| | |
Balance at Beginning of Period | | |
Commissions Paid | | |
Commissions Recognized | | |
Balance at End of Period | |
| Six months ended June 30, 2023 | |
| | | |
| | | |
| | | |
| | |
| Other contract assets | |
$ | 80,378 | | |
$ | 80,077 | | |
$ | (63,985 | ) | |
$ | 96,470 | |
| | |
| | | |
| | | |
| | | |
| | |
| Six months ended June 30, 2022 | |
| | | |
| | | |
| | | |
| | |
| Other contract assets | |
$ | 78,556 | | |
$ | 52,310 | | |
$ | (29,708 | ) | |
$ | 101,158 | |
Deferred
revenue
Amounts
that have been invoiced are recognized in accounts receivable, deferred revenue or revenue, depending on whether the revenue recognition
criteria have been met. Deferred revenue represents amounts billed for which revenue has not yet been recognized. Deferred revenues typically
relate to maintenance and software-as-a-service agreements which have been paid for by customers prior to the performance of those services,
and payments received for professional services and license arrangements and software-as-a-service performance obligations that have
been deferred until fulfilled under our revenue recognition policy.
Remaining
performance obligations represent the transaction price from contracts for which work has not been performed or goods and services have
not been delivered. We expect to recognize revenue on approximately 97% of the remaining performance obligations over the next 12 months,
with the remainder recognized thereafter. As of June 30, 2023, the aggregate amount of the transaction price allocated to remaining performance
obligations for software as a service and software maintenance contracts with a duration greater than one year was $59,499. As of December
31, 2022, the aggregate amount of the transaction price allocated to remaining performance obligations for software as a service and
software maintenance contracts with a duration greater than one year was $74,448. This does not include revenue related to performance
obligations that are part of a contract whose original expected duration is one year or less.
The
following table presents changes in our contract liabilities during the six months ended June 30, 2023 and 2022:
| | |
| | |
Addition | | |
| | |
| | |
| |
| | |
Balance at | | |
from | | |
| | |
| | |
Balance at | |
| | |
Beginning | | |
acquisition | | |
| | |
Recognized | | |
End of | |
| |
of Period | | |
(Note 4) | | |
Billings | | |
Revenue | | |
Period | |
| Six months ended June 30, 2023 | |
| | |
| | |
| | |
| | |
| |
| Contract liabilities: Deferred revenue | |
$ | 2,754,064 | | |
$ | - | | |
$ | 3,522,274 | | |
$ | (4,208,594 | ) | |
$ | 2,067,744 | |
| | |
| | | |
| | | |
| | | |
| | | |
| | |
| Six months ended June 30, 2022 | |
| | | |
| | | |
| | | |
| | | |
| | |
| Contract liabilities: Deferred revenue | |
$ | 1,194,649 | | |
$ | 860,456 | | |
$ | 3,166,205 | | |
$ | (3,507,239 | ) | |
$ | 1,714,071 | |
Leases
We have made an accounting policy election to not
record a right-of-use asset and lease liability for short-term leases, which are defined as leases with a lease term of 12 months or less.
Instead, the lease payments are recognized as rent expense in the general and administrative expenses on the statement of operations.
Software
Development Costs
We
design, develop, test, market, license, and support new software products and enhancements of current products. We continuously
monitor our software products and enhancements to remain compatible with standard platforms and file formats. In accordance with ASC
985-20 “Costs of Software to be Sold, Leased or Otherwise Marketed,” we expense software development costs, including
costs to develop software products or the software component of products to be sold, leased, or marketed to external users, before
technological feasibility is reached. Once technological feasibility has been established, certain software development costs
incurred during the application development stage are eligible for capitalization. Based on our software development process,
technical feasibility is established upon completion of a working model. Technological feasibility is typically reached shortly
before the release of such products. No such costs were capitalized during the six-month period 2023. Such costs in the amount of
$43,771
were capitalized during the three and six-month period 2022.
In
accordance with ASC 350-40, “Internal-Use Software,” we capitalize purchase and implementation costs of internal use software.
Once an application has reached development stage, internal and external costs, if direct and incremental, are capitalized until the
software is substantially complete and ready for its intended use. Capitalization ceases upon completion of all substantial testing.
We also capitalize costs related to specific upgrades and enhancements when it is probable that the expenditure will result in additional
functionality. Such costs in the amount of $96,209 and $208,417 were capitalized during the three and six months ended June 30, 2023.
Such costs in the amount of $98,037 and $127,434 were capitalized during the three and six months ended June 30, 2022.
Capitalized
costs are stated at cost less accumulated amortization. Amortization is computed over the estimated useful lives of the related assets
on a straight-line basis, which is three years. At June 30, 2023 and December 31, 2022, our condensed consolidated balance sheets included
$525,337 and $402,673, respectively, in other long-term assets.
For
the three and six months ended June 30, 2023 and 2022, our expensed software development costs were $140,003 and $271,746, respectively,
and $62,208 and $114,959, respectively.
Recently
Issued Accounting Pronouncements
In
June 2016, the FASB issued ASU No. 2016-13 “Credit Losses - Measurement of Credit Losses on Financial Instruments.” ASU No.
2016-13 significantly changes how entities measure credit losses for most financial assets, including accounts receivable and held-to-maturity
marketable securities, by replacing today’s “incurred loss” approach with an “expected loss” model under
which allowances will be recognized based on expected rather than incurred losses. ASU No. 2016-13 became effective for us in the first
quarter of 2023. The adoption of ASU No. 2016-13 resulted in an initial reduction in the allowance for doubtful accounts of $11,662, and the current calculation is reflected in the accompanying condensed consolidated
financial statements.
Advertising
We
expense the cost of advertising as incurred. Advertising expense for the three and six months ended June 30, 2023 and 2022 amounted to
$6,123 and $12,243, respectively, and $9,052 and $9,500, respectively.
Earnings
(Loss) Per Share
Basic
income or loss per share is computed by dividing net income or loss by the weighted average number of shares of common stock outstanding
during the period. Diluted income or loss per share is computed by dividing net income or loss by the diluted weighted average number
of shares of common stock outstanding during the period. The diluted weighted average number of shares gives effect to all dilutive potential
common shares outstanding during the period using the treasury stock method. Diluted earnings per share exclude all diluted potential
shares if their effect is anti-dilutive, including warrants or options which are out-of-the-money and for those periods with a net loss.
We
have outstanding warrants and stock options which have not been included in the calculation of diluted net loss per share for the three
and six months ended June 30, 2023 and 2022 because to do so would be anti-dilutive. As such, the numerator and the denominator used
in computing both basic and diluted net loss per share for each period are the same.
Income
Taxes
We
file a consolidated federal income tax return with our subsidiaries. The provision for income taxes is computed by applying statutory
rates to income before taxes.
Deferred
income taxes are recognized for the tax consequences in future years of temporary differences between the financial reporting and tax
bases of assets and liabilities as of each period-end based on enacted tax laws and statutory rates. Valuation allowances are established
when necessary to reduce deferred tax assets to the amount expected to be realized. A 100% valuation allowance has been established on
deferred tax assets at June 30, 2023 and December 31, 2022, due to the uncertainty of our ability to realize future taxable income.
We
account for uncertainty in income taxes in our financial statements as required under ASC 740, “Income Taxes.” The standard
prescribes a recognition threshold and measurement attribute for the financial statement recognition and measurement of a tax position
taken or expected to be taken in a tax return. The standard also provides guidance on de-recognition, classification, interest and penalties,
accounting in interim periods, disclosure and transition accounting. Management determined there were no material uncertain positions
taken by us in our tax returns.
Segment
Information
Operating
segments are defined in the criteria established under ASC 280, “Segment Reporting,” as components of public entities that
engage in business activities from which they may earn revenues and incur expenses for which separate financial information is available
and which is evaluated regularly by our chief operating decision maker (“CODM”) in deciding how to assess performance and
allocate resources. Our CODM assesses performance and allocates resources based on two operating segments: Document Management and Document
Conversion. These segments contain individual business components that have been combined on the basis of common management, customers,
solutions offered, service processes and other economic characteristics. We currently have immaterial intersegment sales. We evaluate
the performance of our segments based on gross profits.
The
Document Management Segment provides cloud-based and premise-based content services software. Its modular suite of solutions complements
existing operating and accounting systems to serve a mission-critical role for organizations to make content secure, compliant, and process-ready.
This segment conducts its primary operations in the United States. Markets served include highly regulated, risk and compliance-intensive
markets in healthcare, K-12 education, public safety, other public sector, risk management, financial services, and others. Solutions
are sold both directly to end-users and through resellers.
The
Document Conversion Segment provides services for scanning and indexing, converting images from paper to digital, paper to microfilm,
and microfiche to microfilm, as well as long-term physical document storage and retrieval. This segment conducts its primary operations
in the United States. Markets served include businesses and federal, county, and municipal governments. Solutions are sold both directly
to end-users and through a reseller distributor.
Information
by operating segment is as follows:
Schedule of Segment Information
| | |
2022 | | |
2021 | | |
2022 | | |
2021 | |
| | |
For the three months ended June 30, | | |
For the six months ended June 30, | |
| | |
2023 | | |
2022 | | |
2023 | | |
2022 | |
| Revenues | |
| | |
| | |
| | |
| |
| Document Management | |
$ | 1,879,369 | | |
$ | 1,572,854 | | |
$ | 3,705,103 | | |
$ | 2,487,804 | |
| Document Conversion | |
| 2,379,061 | | |
| 1,842,789 | | |
| 4,740,160 | | |
| 3,631,351 | |
| Total revenues | |
$ | 4,258,430 | | |
$ | 3,415,643 | | |
$ | 8,445,263 | | |
$ | 6,119,155 | |
| | |
| | | |
| | | |
| | | |
| | |
| Gross profit | |
| | | |
| | | |
| | | |
| | |
| Document Management | |
$ | 1,536,385 | | |
$ | 1,326,345 | | |
$ | 3,053,746 | | |
$ | 2,012,823 | |
| Document Conversion | |
| 1,054,048 | | |
| 862,673 | | |
| 2,182,526 | | |
| 1,808,032 | |
| Total gross profit | |
$ | 2,590,433 | | |
$ | 2,189,018 | | |
$ | 5,236,272 | | |
$ | 3,820,855 | |
| | |
| | | |
| | | |
| | | |
| | |
| Capital additions, net | |
| | | |
| | | |
| | | |
| | |
| Document Management | |
$ | 96,209 | | |
$ | 144,717 | | |
$ | 212,250 | | |
$ | 175,801 | |
| Document Conversion | |
| 60,323 | | |
| 39,244 | | |
| 78,851 | | |
| 93,600 | |
| Total capital additions, net | |
$ | 156,532 | | |
$ | 183,961 | | |
$ | 291,101 | | |
$ | 269,401 | |
| | |
June 30, 2023 | | |
December 31, 2022 | |
| Goodwill | |
| | |
| |
| Document Management | |
$ | 3,989,645 | | |
$ | 3,989,645 | |
| Document Conversion | |
| 1,800,176 | | |
| 1,800,176 | |
| Total goodwill | |
$ | 5,789,821 | | |
$ | 5,789,821 | |
| | |
June 30, 2023 | | |
December 31, 2022 | |
| Total assets | |
| | | |
| | |
| Document Management | |
$ | 9,706,315 | | |
$ | 10,284,183 | |
| Document Conversion | |
| 8,880,771 | | |
| 9,658,959 | |
| Total assets | |
$ | 18,587,086 | | |
$ | 19,943,142 | |
Statement
of Cash Flows
For
purposes of reporting cash flows, cash includes cash on hand and demand deposits held by banks.
Reclassifications
Certain
amounts reported in prior filings of the condensed consolidated financial statements have been reclassified to conform to current presentation.
4.
Business Combinations
On
April 1, 2022, we entered into an asset purchase agreement to acquire substantially all of the assets of Yellow Folder. The acquisition
was accounted for in accordance with GAAP and was made to expand our market share in the digital transformation industry and due to synergies
of product lines and services between the Companies.
The
purchase price has been preliminarily allocated to assets acquired and liabilities assumed based on the estimated fair value of such
assets and liabilities at the date of acquisitions as follows:
Schedule
of Fair Value of Assets Acquired and Liabilities Assumed
| Assets acquired: | |
| |
| Accounts receivable | |
$ | 68,380 | |
| Prepaid expenses | |
| 38,913 | |
| Property and equipment | |
| 30,018 | |
| Intangible assets (see Note 5) | |
| 3,888,000 | |
| Assets | |
| 4,025,311 | |
| Liabilities assumed: | |
| | |
| Accounts payable | |
| 36,446 | |
| Deferred revenue | |
| 1,072,530 | |
| Liabilities | |
| 1,108,976 | |
| | |
| | |
| Total identifiable net assets | |
| 2,916,335 | |
| | |
| | |
| Purchase price | |
| 6,383,269 | |
| | |
| | |
| Goodwill - Excess of purchase price over fair value of net assets acquired | |
$ | 3,466,934 | |
The
purchase price of $6,383,269 was paid in cash. Goodwill in the amount of $3,466,934 was recognized in the acquisition of Yellow Folder
and is attributable to the cash flows of the business derived from our potential to outperform the market due to its existing relationship
and other synergies created within the Company.
The
following unaudited pro forma information presents a summary of the condensed consolidated results of operations for the Company as if
the acquisition of Yellow Folder had occurred on January 1, 2022.
Schedule of Pro Forma Information
| | |
June 30, 2023 | | |
June 30, 2022 | |
| | |
For the three months ended | |
| | |
(unaudited) | | |
(unaudited) | |
| | |
June 30, 2023 | | |
June 30, 2022 | |
| Total revenues | |
$ | 4,258,430 | | |
$ | 3,415,643 | |
| | |
| | | |
| | |
| Net income (loss) | |
$ | 135,734 | | |
$ | (374,167 | ) |
| | |
| | | |
| | |
| Basic and diluted net income (loss) per share | |
$ | 0.03 | | |
$ | (0.09 | ) |
| Basic net income (loss) per share | |
$ | 0.03 | | |
$ | (0.09 | ) |
| | |
June 30, 2023 | | |
June 30, 2022 | |
| | |
For the six months ended | |
| | |
(unaudited) | | |
(unaudited) | |
| | |
June 30, 2023 | | |
June 30, 2022 | |
| Total revenues | |
$ | 8,445,263 | | |
$ | 6,897,007 | |
| | |
| | | |
| | |
| Net (loss) income | |
$ | 248,297 | | |
$ | (359,777 | ) |
| | |
| | | |
| | |
| Basic and diluted net income (loss) per share | |
$ | 0.06 | | |
$ | (0.09 | ) |
| Basic net income (loss) per share | |
$ | 0.06 | | |
$ | (0.09 | ) |
The
unaudited pro forma condensed consolidated results are based on our historical financial statements and those of Yellow Folder and do
not necessarily indicate the results of operations that would have resulted had the acquisition actually been completed at the beginning
of the applicable period presented. The pro forma financial information assumes that the companies were combined as of January 1, 2022.
The
following tables present the amounts of revenue and earnings of Yellow Folder since the acquisition date included in the condensed consolidated
income statement for the reporting periods.
| | |
For the | | |
For the | |
| | |
three months ended | | |
six months ended | |
| | |
June 30, 2023 | | |
June 30, 2023 | |
| Yellow Folder: | |
| | | |
| | |
| Total revenues | |
$ | 864,331 | | |
$ | 1,738,893 | |
| Net income | |
$ | 85,408 | | |
$ | 271,111 | |
| | |
For the
three months ended
June 30, 2022 | | |
For the
six months ended
June 30, 2022 | |
| Yellow Folder: | |
| | | |
| | |
| Total revenues | |
$ | 790,368 | | |
$ | 790,368 | |
| Net income | |
$ | 196,559 | | |
$ | 196,559 | |
| Net income (loss) | |
$ | 196,559 | | |
$ | 196,559 | |
5.
Intangible Assets, Net
At
June 30, 2023, intangible assets consisted of the following:
Schedule of Intangible Assets
| | |
Estimated | |
| | |
Accumulated | | |
| |
| | |
Useful Life | |
Costs | | |
Amortization | | |
Net | |
| Trade names | |
10 years | |
$ | 297,000 | | |
$ | (61,917 | ) | |
$ | 235,083 | |
| Proprietary technology | |
10 years | |
| 861,000 | | |
| (107,625 | ) | |
| 753,375 | |
| Customer relationships | |
5-15 years | |
| 4,091,000 | | |
| (914,966 | ) | |
| 3,176,034 | |
| | |
| |
$ | 5,249,000 | | |
$ | (1,084,508 | ) | |
$ | 4,164,492 | |
At
December 31, 2022, intangible assets consisted of the following:
| | |
Estimated | |
| | |
Accumulated | | |
| |
| | |
Useful Life | |
Costs | | |
Amortization | | |
Net | |
| Trade names | |
10 years | |
$ | 297,000 | | |
$ | (47,067 | ) | |
$ | 249,933 | |
| Proprietary technology | |
10 years | |
| 861,000 | | |
| (64,575 | ) | |
| 796,425 | |
| Customer relationships | |
5-15 years | |
| 4,091,000 | | |
| (717,712 | ) | |
| 3,373,288 | |
| | |
| |
$ | 5,249,000 | | |
$ | (829,354 | ) | |
$ | 4,419,646 | |
Amortization
expense for the three and six months ended June 30, 2023 and June 30, 2022, amounted to $127,577 and $255,154, respectively, and $127,577
and $181,696, respectively. The following table represents future amortization expense for intangible assets subject to amortization.
Schedule of Amortization Expense for Intangible Assets
| For the Twelve Months Ending June 30, | |
Amount | |
| 2024 | |
$ | 510,308 | |
| 2025 | |
| 505,941 | |
| 2026 | |
| 431,441 | |
| 2027 | |
| 326,108 | |
| 2028 | |
| 319,316 | |
| Thereafter | |
| 2,071,378 | |
| Intangible assets | |
$ | 4,164,492 | |
6.
Fair Value Measurements
We
paid our final earnout liability in January 2023 and as of June 30, 2023, we have no earnout liabilities remaining. As of December 31,
2022 we had earnout liabilities related to one of our two 2020 acquisitions which were measured on a recurring basis and recorded at
fair value, measured using probability-weighted analysis and discounted using a rate that appropriately captures the risks associated
with the obligation. The inputs used to calculate the fair value of the earnout liabilities were considered to be Level 3 inputs due
to the lack of relevant market activity and significant management judgment. Key unobservable inputs included revenue growth rates, which
ranged from 0% to 7%, and volatility rates, which were 20% for gross profits.
The
following table provides a summary of the changes in fair value of the earnout liabilities for the six months ended June 30, 2023 and 2022:
Summary
of Changes in Fair Value of Earnout Liabilities
| | |
June 30, 2023 | |
| Fair value at December 31, 2022 | |
$ | 700,000 | |
| Fair value, beginning balance | |
$ | 700,000 | |
| Payments | |
| (700,000 | ) |
| Change in fair value | |
| | |
| Fair value at June 30, 2023 | |
$ | - | |
| Fair value, ending balance | |
$ | - | |
| | |
Six months | |
| | |
ended | |
| | |
June 30, 2022 | |
| Fair value at December 31, 2021 | |
$ | 1,630,681 | |
| Fair value, beginning balance | |
$ | 1,630,681 | |
| Payment | |
| (1,018,333 | ) |
| Change in fair value | |
| 116,505 | |
| Fair value at June 30, 2022 | |
$ | 728,853 | |
| Fair value, ending balance | |
$ | 728,853 | |
The
fair values of earnout liabilities amounts owed were recorded in current liabilities in our condensed consolidated balance sheet as of
December 31, 2022. Changes in fair value are recorded in change in fair value of earnout liabilities in our condensed consolidated statements
of operations.
7.
Property and Equipment
Property
and equipment are comprised of the following:
Schedule of Property and Equipment
| | |
June 30, 2023 | | |
December 31, 2022 | |
| Computer hardware and purchased software | |
$ | 1,661,438 | | |
$ | 1,595,652 | |
| Leasehold improvements | |
| 395,919 | | |
| 395,918 | |
| Furniture and fixtures | |
| 71,325 | | |
| 71,325 | |
| Property and equipment, gross | |
| 2,128,682 | | |
| 2,062,895 | |
| Less: accumulated depreciation | |
| (1,103,906 | ) | |
| (994,189 | ) |
| Property and equipment, net | |
$ | 1,024,776 | | |
$ | 1,068,706 | |
Total
depreciation expense on our property and equipment for the three and six months ended June 30, 2023 and 2022 amounted to $64,675 and
$126,614, respectively, and $67,699 and $127,691, respectively.
8.
Notes Payable – Unrelated Parties
Summary
of Notes Payable to Unrelated Parties
The
tables below summarize all notes payable at June 30, 2023 and December 31, 2022, respectively, with the exception of related party notes
disclosed in Note 9 “Notes Payable - Related Parties.”
Schedule
of Notes Payable
| | |
June 30, 2023 | | |
December 31, 2022 | |
| 2022 Unrelated Notes | |
$ | 2,364,500 | | |
$ | 2,364,500 | |
| 2020 Notes | |
| 717,500 | | |
| 980,450 | |
| Total notes payable | |
$ | 3,082,000 | | |
$ | 3,344,950 | |
| Less unamortized debt issuance costs | |
| (221,511 | ) | |
| (300,904 | ) |
| Less unamortized debt discount | |
| (4,267 | ) | |
| (22,045 | ) |
| Less current portion | |
| (709,083 | ) | |
| (936,966 | ) |
| Long-term portion of notes payable | |
$ | 2,147,139 | | |
$ | 2,085,035 | |
| Subordinated Notes Payable | |
Issue Date | |
Interest Rate | | |
Interest Due | |
Principal Due |
| 2022 Unrelated Notes | |
April 1, 2022 | |
| 12 | % | |
Quarterly | |
March 30, 2025 |
| 2020 Notes | |
March 2, 2020 | |
| 12 | % | |
Quarterly | |
August 31, 2023 |
Future
minimum principal payments of the Notes Payable to Unrelated Parties are as follows:
Schedule
of Future Minimum Principal Payments of Notes Payable
| As of June 30, | |
Amount | |
| 2024 | |
$ | 717,500 | |
| 2025 | |
| 2,364,500 | |
| Total | |
$ | 3,082,000 | |
As
of June 30, 2023 and December 31, 2022, accrued interest for these notes payable with the exception of the related party notes in Note
9, “Notes Payable - Related Parties,” was $0. As of June 30, 2023 and December 31, 2022, unamortized deferred financing costs
and unamortized debt discount were reflected within short and long term liabilities on the condensed consolidated balance sheets, netted
with the corresponding notes payable balance.
With
respect to all notes outstanding (other than the notes to related parties), interest expense, including the amortization of debt issuance
costs and debt discount, for the three and six months ended June 30, 2023 and 2022 was $136,136
and $287,741,
respectively, and $214,589 and
$327,190,
respectively.
We recognized a debt discount of $320,000 for 80,000 shares issued
in conjunction with the 2020 Notes. The amortization of the debt discount, which will be recognized over the life of the 2020 Notes as interest
expense, for the three and six months ended June 30, 2023 and 2022 was $6,400 and $17,778, and $26,667 and $53,333, respectively.
9.
Notes Payable - Related Parties
Summary
of Notes Payable to Related Parties
The
tables below summarize all notes payable to related parties at June 30, 2023 and December 31, 2022:
Schedule
of Notes Payable
| | |
June 30, 2023 | | |
December 31, 2022 | |
| Notes payable – “2022 Related Note” | |
$ | 600,000 | | |
$ | 600,000 | |
| Notes payable – “2022
Related Note” | |
$ | 600,000 | | |
$ | 600,000 | |
| Less unamortized debt issuance costs | |
| (55,157 | ) | |
| (70,916 | ) |
| Long-term portion of notes payable | |
$ | 544,843 | | |
$ | 529,084 | |
| Subordinated Notes Payable | |
Issue Date | |
Interest Rate | | |
Interest Due | |
Principal Due |
| 2022 Related Note | |
April 1, 2022 | |
| 12 | % | |
Quarterly | |
March 30, 2025 |
Future
minimum principal payments of the 2022 Notes to related parties are as follows:
Schedule
of Future Minimum Principal Payments of Notes Payable
| As of June 30, | |
Amount | |
| 2025 | |
$ | 600,000 | |
| Total | |
$ | 600,000 | |
As
of June 30, 2023 and December 31, 2022, accrued interest for these notes payable – related parties was $0. As of June 30, 2023
and December 31, 2022, unamortized deferred financing costs and unamortized debt discount were reflected within long term liabilities
on the condensed consolidated balance sheets.
With
respect to all notes payable – related parties outstanding, interest expense, including the amortization of debt issuance costs,
for the three and six months ended June 30, 2023 was $25,880
and $51,759,
respectively. For the three and six months ended June 30, 2022 interest expense in connection with notes payable – related parties
was $25,879.
10.
Deferred Compensation
Pursuant
to an employment agreement, we had accrued incentive cash compensation for one of our founders which was fully paid as of December 31,
2022. During the three and six months ended June 30, 2022, we paid $30,248 and $50,414, respectively, in deferred incentive compensation,
which amount was reflected as a reduction in our deferred compensation liability.
11.
Commitments and Contingencies
From
time to time we are involved in legal proceedings, claims and litigation related to employee claims, contractual disputes and taxes in
the ordinary course of business. Although we cannot predict the outcome of such matters, currently we have no reason to believe the disposition
of any current matter could reasonably be expected to have a material adverse impact on our financial position, results of operations
or the ability to carry on any of our business activities.
Operating
Leases
For
each of the below listed leases, management has determined it will utilize the base rental period and have not considered any renewal
periods.
Schedule
of Operating Leases
| Location | |
Square Feet | | |
Monthly Rent | | |
Lease Expiry |
| Columbus, OH | |
| 6,000 | | |
$ | 5,100 | | |
December 31, 2028 |
| Madison Heights, MI | |
| 36,000 | | |
$ | 43,185 | | |
August 31, 2026 |
| Sterling Heights, MI | |
| 37,000 | | |
$ | 21,072 | | |
April 30, 2028 |
| Traverse City, MI | |
| 5,200 | | |
$ | 4,500 | | |
January 31, 2024 |
| | |
| | | |
| | | |
|
| Temporary space | |
| | | |
| | | |
|
| Madison Heights, MI | |
| 3,200 | | |
$ | 1,605 | | |
month to month |
| | |
| | | |
| | | |
|
| Vehicles | |
| | | |
| | | |
|
| various | |
| n/a | | |
$ | 2,708 | | |
September 30, 2028 |
The
following table sets forth the future minimum lease payments under our leases:
Schedule
of Future Rental Payments for Operating Leases
| For the twelve months ending June 30, | |
Finance Lease | | |
Operating Leases | |
| 2024 | |
$ | 41,259 | | |
$ | 930,559 | |
| 2025 | |
| 41,259 | | |
| 891,357 | |
| 2026 | |
| 41,259 | | |
| 901,152 | |
| 2027 | |
| 41,259 | | |
| 443,008 | |
| 2028 | |
| 39,243 | | |
| 311,010 | |
| Thereafter | |
| 8,299 | | |
| 35,100 | |
| Less Imputed Interest |
|
|
(38,395) |
|
|
|
(488,818) |
|
| Less Short-term lease payments |
|
|
|
|
|
|
(4,813) |
|
| | |
$ | 174,183 | | |
$ | 3,018,555 | |
The
following table summarizes the components of lease expense:
Summary
of Components of Lease Expense
| For the three months ending June 30, | |
2023 | | |
2022 | |
| Finance lease expense: | |
| | | |
| | |
| Amortization of ROU asset | |
$ | 8,252 | | |
$ | - | |
| Interest on lease liabilities | |
| 3,594 | | |
| - | |
| Operating lease expense | |
| 238,864 | | |
| 238,487 | |
| Short-term lease expense | |
| 4,814 | | |
| 4,814 | |
| For the six months ending June 30, | |
2023 | | |
2022 | |
| Finance lease expense: | |
| | | |
| | |
| Amortization of ROU asset | |
$ | 14,959 | | |
$ | - | |
| Interest on lease liabilities | |
| 6,426 | | |
| - | |
| Operating lease expense | |
| 476,312 | | |
| 476,975 | |
| Short-term lease expense | |
| 9,627 | | |
| 9,627 | |
The
following tables set forth additional information pertaining to our leases:
Schedule
of Additional Information Pertaining to Leases
| For the six months ending June 30, | |
2023 | | |
2022 | |
| Cash paid for amounts included in the measurement of lease liabilities: | |
| | | |
| | |
| Financing cash flows from finance leases (interest) | |
$ | 6,426 | | |
$ | - | |
| Financing cash flows from finance leases (principal) | |
| 12,312 | | |
| - | |
| Operating cash flows from operating leases | |
| 348,284 | | |
| 307,471 | |
| Weighted average remaining lease term – finance leases | |
| 5.2 years | | |
| - | |
| Weighted average remaining lease term – operating leases | |
| 4.0 years | | |
| 4.9 years | |
| Weighted average discount rate – finance leases | |
| 8.25 | % | |
| - | |
| Weighted average discount rate – operating leases | |
| 6.95 | % | |
| 7.01 | % |
Schedule
of Operating and Finance Leases
| | |
June 30, 2023 | | |
December 31, 2022 | |
| Operating leases: | |
| | | |
| | |
| Right-of-use assets, operating | |
$ | 2,895,784 | | |
$ | 3,200,191 | |
| Lease liabilities, operating – current | |
| 711,229 | | |
| 692,074 | |
| Lease liabilities, operating – net of current | |
| 2,307,326 | | |
| 2,624,608 | |
| Total operating lease liabilities | |
$ | 3,018,555 | | |
$ | 3,316,682 | |
| | |
| | | |
| | |
| Finance leases: | |
| | | |
| | |
| Right-of-use asset, finance | |
$ | 191,862 | | |
$ | 160,990 | |
| Accumulated amortization | |
| (21,668 | ) | |
| (6,708 | ) |
| Right-of-use asset, finance, net | |
$ | 170,194 | | |
$ | 154,282 | |
| | |
| | | |
| | |
| Lease liability, finance – current | |
$ | 28,303 | | |
$ | 22,493 | |
| Lease liability, finance – net of current | |
| 145,880 | | |
| 133,131 | |
| Total finance lease liability | |
$ | 174,183 | | |
$ | 155,624 | |
12.
Stockholders’ Equity
Common
Stock
As
of June 30, 2023, 4,073,757 shares of common stock were issued and outstanding, 255,958 shares of common stock were reserved for issuance
upon the exercise of outstanding warrants, and 497,330 shares of common stock were reserved for issuance under our 2015 Equity Incentive
Plan, as amended (the “2015 Plan”).
The
following table describes the shares and warrants issued as part of our 2022 and 2020 private placements:
Schedule
of Shares and Warrants Issued
| Issuance of Common Stock | |
Issue Date | |
Shares Issued | | |
Price per share | | |
Warrants Issued | | |
Warrant Exercise Price | | |
Warrant Fair Value | |
| Private Placement 2022 | |
April 1, 2022 | |
| 1,242,588 | | |
$ | 4.62 | | |
| 124,258 | | |
$ | 4.62 | | |
$ | 3.91 | |
| Private Placement 2020 | |
March 2, 2020 | |
| 955,000 | | |
$ | 4.00 | | |
| 95,500 | | |
$ | 4.00 | | |
$ | 3.90 | |
Amortization
of the debt issuance costs for the Private Placement 2020 offering was recorded at $6,224
and $17,290
for the three and six months ended June 30, 2023,
and at $25,935
and $51,869
for the three and six months ended June 30, 2022.
Warrants
The
following sets forth the warrants to purchase our common stock that were outstanding as of June 30, 2023:
Schedule
of Warrants to Purchase Common Stock
| Warrants Outstanding | | |
Warrant Exercise Price | | |
Warranty Expiry |
| | 124,258 | | |
$ | 4.62 | | |
March 30, 2027 |
| | 95,500 | | |
$ | 4.00 | | |
March 30, 2027 |
| | 16,000 | | |
$ | 9.00 | | |
March 30, 2027 |
| | 17,200 | | |
$ | 12.50 | | |
March 30, 2027 |
| | 3,000 | | |
$ | 15.00 | | |
March 30, 2027 |
The estimated
value of the warrants issued during the six months ended June 30, 2022, as well as the assumptions that were used in calculating such
values, were based on estimates at the issuance date in the table below.
Schedule
of Estimated Values of Warrants Valuation Assumptions
| | |
Warrants Issued | |
| | |
April 1, 2022 | |
| Risk-free interest rate | |
| 2.55 | % |
| Weighted average expected term | |
| 5 years | |
| Expected volatility | |
| 116.32 | % |
| Expected dividend yield | |
| 0.00 | % |
13.
Stock-Based Compensation
From
time to time, we issue stock options and restricted stock as compensation for services rendered by our directors and employees.
Restricted
Stock
On
January 6, 2022, we issued 8,097 shares of restricted common stock to our directors as part of their annual compensation plan. The grants
of restricted common stock were made outside the 2015 Plan and were not subject to vesting. Stock compensation of $57,500 was recorded
on the issuance of the common stock for the six months ended June 30, 2022.
Stock
Options
We
did not make any stock option grants during the six months ended June 30, 2023. On April 14, 2022, we granted employees stock options
to purchase 220,587 shares at an exercise price of $6.08 per share in accordance with the 2015 Plan, with vesting continuing until 2025.
The total fair value of $1,152,470 for these stock options is being recognized over the requisite service period.
The
weighted-average grant date fair value of options granted during the three and six months ended June 30, 2022 was $5.22. The weighted
average assumptions that were used in calculating such values during the six months ended June 30, 2022, as well as the assumptions that
were used in calculating such values, were based on estimates at the grant date in the table as follows:
Schedule
of Estimated Values of Stock Option Grants Valuation Assumptions
| | |
Grant Date | |
| | |
April 1, 2022 | |
| Risk-free interest rate | |
| 2.82 | % |
| Weighted average expected term | |
| 6 years | |
| Expected volatility | |
| 116.60 | % |
| Expected dividend yield | |
| 0.00 | % |
A
summary of stock option activity during the six months ended June 30, 2023 and 2022 is as follows:
Schedule of Stock Option Activity
| | |
| | |
| | |
Weighted- | | |
| |
| | |
| | |
Weighted- | | |
Average | | |
| |
| | |
Shares | | |
Average | | |
Remaining | | |
Aggregate | |
| | |
Under | | |
Exercise | | |
Contractual | | |
Intrinsic | |
| | |
Option | | |
Price | | |
Life | | |
Value | |
| Outstanding at January 1, 2023 | |
| 365,447 | | |
$ | 5.89 | | |
| 8 years | | |
$ | 19,200 | |
| Granted | |
| 220,587 | | |
| 6.08 | | |
| | | |
| | |
| Forfeited | |
| (5,000 | ) | |
| 4.00 | | |
| | | |
| | |
| Outstanding at June 30, 2023 | |
| 360,447 | | |
$ | 5.92 | | |
| 8 years | | |
$ | 19,200 | |
| | |
| | | |
| | | |
| | | |
| | |
| Exercisable at June, 2023 | |
| 165,654 | | |
$ | 6.32 | | |
| 7 years | | |
$ | 19,200 | |
| | |
| | |
| | |
Weighted- | | |
| |
| | |
| | |
Weighted- | | |
Average | | |
| |
| | |
Shares | | |
Average | | |
Remaining | | |
Aggregate | |
| | |
Under | | |
Exercise | | |
Contractual | | |
Intrinsic | |
| | |
Option | | |
Price | | |
Life | | |
Value | |
| Outstanding at January 1, 2022 | |
| 144,860 | | |
$ | 5.61 | | |
| 8 years | | |
$ | 19,200 | |
| Granted | |
| 220,587 | | |
| 6.08 | | |
| | | |
| | |
| Outstanding at June 30, 2022 | |
| 365,447 | | |
$ | 5.89 | | |
| 9 years | | |
$ | 19,200 | |
| | |
| | | |
| | | |
| | | |
| | |
| Exercisable at June 30, 2022 | |
| 68,335 | | |
$ | 7.32 | | |
| 7 years | | |
$ | 19,200 | |
During
the three and six months ended June 30, 2023 and 2022, stock-based compensation for options was $115,456
and $233,618,
respectively, and $22,960 and $102,992, respectively.
As
of June 30, 2023 and December 31, 2022, there were $778,893 and $1,019,140, respectively, of total unrecognized compensation costs related
to stock options granted under our stock option agreements. The unrecognized compensation cost is expected to be recognized over a weighted-average
period of two years. The total fair value of stock options that vested during the six months ended June 30, 2023 and 2022 was $390,221
and $10,238, respectively.
14.
Concentrations
Revenues
from a limited number of customers have accounted for a substantial percentage of our total revenues. During the three months ended June
30, 2023 and 2022, our largest customer, the State of Michigan, accounted for 36% and 35%, respectively, of our total revenues, and our
second largest customer, Rocket Mortgage, accounted for 5% and 6%, respectively, of our total revenues. During the six months ended June
30, 2023 and 2022, our largest customer, the State of Michigan, accounted for 35% and 37%, respectively, of our total revenues, and our
second largest customer, Rocket Mortgage, accounted for 5% and 8%, respectively, of our total revenues.
For
the three months ended June 30, 2023 and 2022, government contracts, including K-12 education, represented approximately 79% and 77%, respectively, of our net revenues.
For the six months ended June 30, 2023 and 2022, government contracts, including K-12 education, represented approximately 76% and 72%, respectively, of our net
revenues. A significant portion of our sales to resellers represent ultimate sales to government agencies.
As
of June 30, 2023, accounts receivable concentrations from our two largest customers were 37%
and 10%
of our gross accounts receivable, respectively by customer. Accounts receivable balances from our two largest customers at June 30, 2023
have been partially collected. As of December 31, 2022, accounts receivable concentrations from our two largest customers were 44%
and 7%
of gross accounts receivable, respectively by customer.
| ITEM
2 |
MANAGEMENT’S
DISCUSSION AND ANALYSIS OF FINANCIAL CONDITION AND RESULTS OF OPERATIONS |
The
following discussion and analysis of our financial conditions and results of operations should be read together with our condensed
consolidated financial statements and notes thereto included in Part I, Item 1, “Financial Statements,” of this
Quarterly Report on Form 10-Q, and with the condensed consolidated financial statements and notes thereto and Management’s
Discussion and Analysis of Financial Condition and Results of Operations contained in our Annual Report on Form 10-K for the fiscal
year ended December 31, 2022. Historical results and percentage relationships among any amounts in the financial statements are not
necessarily indicative of trends in operating results for any future periods. Any forward-looking statements in this discussion and
analysis should be read in conjunction with the information set forth in “Note Regarding Forward-Looking Statements”
elsewhere herein. In this Quarterly Report, we sometimes refer to the three and six-month periods ended June 30, 2023 as the second
quarter 2023 and the six-month period 2023 respectively, and to the three and six-month periods ended June 30, 2022 as the second
quarter 2022 and the six-month period 2022.
Company
Overview
We
are a document services and software solutions company serving both the small-to-medium business and governmental sectors with their
digital transformation and process automation initiatives. On April 1, 2022, we made a significant business acquisition that has significantly
impacted our financial operations and grown our business operations. For further information about this acquisition, please see Note
4 to our condensed consolidated financial statements included in Item 1, Part I of this Quarterly Report.
Our
digital transformation products and services are provided through two reporting segments: Document Management and Document Conversion.
Our Document Management segment, which includes the Yellow Folder, LLC (“Yellow Folder”) asset acquisition in April 2022,
consists primarily of solutions involving our software platform, allowing customers to capture and manage their documents across operations
such as scanned hard-copy documents and digital documents including those from Microsoft Office 365, digital images, audio, video and
emails. Our Document Conversion segment provides assistance to customers as a part of their overall document strategy to convert documents
from one medium to another, predominantly paper to digital, including migration to our software solutions, as well as long-term storage
and retrieval services. Our solutions create value for customers by making it easy to connect business-critical documents to the people
who need them by making those documents easy to find and access, while also being secure and compliant with the customers’ audit
requirements. Solutions are sold both directly to end-users and through resellers.
Our
customers use our software by one of two methods: purchasing our software and installing it onto their own equipment, which we refer
to as a “premise” model, or licensing and accessing our platform via the Internet, which we refer to as a “software
as a service” or “SaaS” model and also as a “cloud-based” model. Licensing of our software through our
SaaS model has become increasingly popular among our customers, especially in light of the increased deployment of remote workforce policies,
and is a key ingredient in our revenue growth strategy. Our SaaS products are hosted with Amazon Web Services, Expedient, and Evocative,
providing our customers with reliable hosting services that we believe are consistent with industry best practices in data security and
performance.
We
operate a U.S.-based business with concentrated sales to the State of Michigan for our Document Conversion segment, complemented by our
diverse set of document management software solutions and services. We hold or compete for leading positions regionally in select markets
and attribute this leadership to several factors including the strength of our brand name and reputation, our comprehensive offering
of innovative solutions, and the quality of our service support. Net growth in sales of software as a service in recent years reflects
market demand for these solutions over traditional sales of on-premise software. We expect to continue to benefit from our select niche
leadership market positions, innovative product offering, growing customer base, and the impact of our sales and marketing programs.
Examples of these programs include identifying and investing in growth and expanded market penetration opportunities, more effective
products and services pricing strategies, demonstrating superior value to customers, increasing our sales force effectiveness through
improved guidance and measurement, and continuing to optimize our lead generation and lead nurturing processes.
For
further information about our consolidated revenue and earnings, please see our condensed consolidated financial statements included
in Part I, Item 1 of this Quarterly Report.
How
We Evaluate our Business Performance and Opportunities
There
has been no material change during the six-month period 2023 to the major qualitative and quantitative factors we consider in the
evaluation of our operating results as set forth in Part II, Item 7, “Management’s Discussion and Analysis of Financial
Condition and Results of Operations — How We Evaluate our Business Performance and Opportunities” of our Annual
Report on Form 10-K for the fiscal year ended December 31, 2022.
Executive
Overview of Results
The
biggest factors in the changes in our results of operations during the six-month period 2023 compared to the six-month period 2022
was our acquisition of Yellow Folder on April 1, 2022. Our results for the second quarter and six-month period 2023 include the
results of Yellow Folder operations for the full periods reported, while our six-month period 2022 results include only the second
quarter results of Yellow Folder operations. Our strong professional services performance was not impacted meaningfully by the
acquisition of Yellow Folder, and the second quarter 2023 continued our strong first quarter growth, at over 40% for the six-month
period 2023. This growth was partially offset by lingering softer demand for the transactional portion of our storage and retrieval
services from a significant customer in the home mortgage lending industry.
Below
are our key financial results for the second quarter 2023 (consolidated unless otherwise noted):
| |
● |
Revenues
were $4,258,430, representing revenue growth of 25% year over year. |
| |
|
|
| |
● |
Cost
of revenues was $1,667,997, an increase of 36% year over year. |
| |
|
|
| |
● |
Operating
expenses (excluding cost of revenues) were $2,294,045, a decrease of 1% year over year, driven by reduced transaction costs and no
fair value adjustments for earnout liabilities compared to second quarter 2022. |
| |
|
|
| |
● |
Income
from operations was $296,388, compared to loss from operations of $133,699 in second quarter 2022. |
| |
|
|
| |
● |
Net
income was $135,734 with basic and diluted net income per share of $0.03, compared to net loss of $374,167 in second quarter 2022. |
| |
● |
Second
quarter 2022 included $285,230 of transaction costs and $52,301 of earnout fair
value adjustments |
| |
● |
Operating
cash used was $125,274, compared to $403,522 in second quarter 2022. |
| |
|
|
| |
● |
Capital
expenditures were $156,532, compared to $213,361 in second quarter 2022. |
Below
are our key financial results for the six-month period 2023 (consolidated unless otherwise noted):
| |
● |
Revenues
were $8,445,263, representing revenue growth of 38% year over year. |
| |
|
|
| |
● |
Cost
of revenues was $3,208,991, an increase of 40% year over year. |
| |
|
|
| |
● |
Operating
expenses (excluding cost of revenues) were $4,655,885, an increase of 21% year over year. |
| |
● |
Income
from operations was $580,387, compared to loss from operations of $41,224 for the six-month period 2022. |
| |
|
|
| |
● |
Net
income was $248,297 with basic and diluted net income per share of $0.6, compared to net loss of $394,293 with basic and diluted net
loss per share of $0.11 for the six-month period 2022. |
| |
● |
Six-month
period 2022 included $355,281 of transaction costs and $116,505 of earnout fair value adjustments. |
| |
● |
Net
cash used by operating activities was $299,631, compared to net cash provided by operating activities of $72,649 for the six-month
period 2022. |
| |
|
|
| |
● |
Capital
expenditures were $291,101, compared to $269,404 for the six-month period 2022. |
| |
|
|
| |
● |
As
of June 30, 2023, we had 170 employees, including 26 part-time employees, compared to 139 employees, including 26 part-time employees,
as of June 30, 2022. |
Financial
Impact of Current Economic Conditions
Our
overall performance depends on economic conditions, including the current inflationary environment and the widespread expectation of
near-term global recession.
Employee
wages, our largest expense, have recently increased due to wage inflation. These increased labor costs have slightly decreased our
profit margin over 2022 and into 2023, but we continue to mitigate this by appropriately increasing customer renewal rates whenever
we have the contractual ability to do so. More significantly, general wage inflation in the market has resulted in a slower hiring
process as we grew our staff during 2022 and 2023, particularly for our Document Conversion segment. These hiring and staffing
challenges slowed our ability to complete project-based work backlog and reduced our revenue in the first part of 2022. However, we
ended the six-month period 2023 with more staff than 2022. We anticipate that the inflationary effect on our wages has
stabilized.
Other
volatility, particularly from global supply chain disruptions, has had and are expected to continue to have a minimal impact on us as
we consume relatively little in raw materials. A global recession may affect our customers’ and potential customers’ budgets
for technology procurement, but as of the date of this report, we have not experienced diminished customer demand due to adverse economic
conditions. Absent global economic disruptions, and based on the current trend of our business operations and our continued focus on
strategic initiatives to grow our customer base, we believe in the strength of our brand and that our focus on our strategic priorities
will deliver consistent growth.
Uncertainties,
Trends, and Risks that can cause Fluctuations in our Operating Results
Our
operating results have fluctuated significantly in the past and are expected to continue to fluctuate in the future due to a variety
of factors, in addition to economic conditions, that are discussed in Part II, Item 7, “Management’s Discussion and Analysis
of Financial Condition and Results of Operations - Uncertainties, Trends, and Risks that can cause Fluctuations in our Operating Results”
of our Annual Report on Form 10-K for the fiscal year ended December 31, 2022. Due to all these factors and the other risks discussed
in Part II, Item 1 of this Quarterly Report, and Part I, Item IA, “Risk Factors” of our Annual Report on Form 10-K
for the fiscal year ended December 31, 2022, our past results of operations should not be relied upon as an indication of our future
performance. Comparisons of our operating results with prior periods is not necessarily meaningful or indicative of future performance.
Reportable
Segments
We
have two reportable segments: Document Management and Document Conversion. These reportable segments are discussed above under “Company
Overview.”
Results
of Operations
Revenues
The
following table sets forth our revenues by reportable segment for the periods indicated:
| | |
For the three months ended | | |
For the six months ended | |
| | |
June 30, | | |
June 30, | |
| | |
2023 | | |
2022 | | |
2023 | | |
2022 | |
| Revenues by segment | |
| | | |
| | | |
| | | |
| | |
| Document Management | |
$ | 1,879,369 | | |
$ | 1,572,854 | | |
$ | 3,705,103 | | |
$ | 2,487,804 | |
| Document Conversion | |
| 2,379,061 | | |
| 1,842,789 | | |
| 4,740,160 | | |
| 3,631,351 | |
| Total revenues | |
$ | 4,258,430 | | |
$ | 3,415,643 | | |
$ | 8,445,263 | | |
$ | 6,119,155 | |
| | |
| | | |
| | | |
| | | |
| | |
| Gross profit by segment | |
| | | |
| | | |
| | | |
| | |
| Document Management | |
$ | 1,536,385 | | |
$ | 1,326,345 | | |
$ | 3,053,746 | | |
$ | 2,012,823 | |
| Document Conversion | |
| 1,054,048 | | |
| 862,673 | | |
| 2,182,526 | | |
| 1,808,302 | |
| Total gross profit | |
$ | 2,590,433 | | |
$ | 2,189,018 | | |
$ | 5,236,272 | | |
$ | 3,820,855 | |
The
following table sets forth our revenues by revenue source for the periods indicated:
| | |
For the Three Months Ended | | |
For the Six Months Ended | |
| | |
June 30, | | |
June 30, | |
| | |
2023 | | |
2022 | | |
2023 | | |
2022 | |
| | |
| | |
| | |
| | |
| |
| Revenues: | |
| | | |
| | | |
| | | |
| | |
| Sale of software | |
$ | 63,646 | | |
$ | 11,105 | | |
$ | 78,939 | | |
$ | 75,596 | |
| Software as a service | |
| 1,277,918 | | |
| 1,158,456 | | |
| 2,516,350 | | |
| 1,589,677 | |
| Software maintenance services | |
| 349,139 | | |
| 343,881 | | |
| 698,681 | | |
| 680,483 | |
| Professional services | |
| 2,298,316 | | |
| 1,625,765 | | |
| 4,597,605 | | |
| 3,213,713 | |
| Storage and retrieval services | |
| 269,411 | | |
| 276,436 | | |
| 553,688 | | |
| 559,686 | |
| Total revenues | |
$ | 4,258,430 | | |
$ | 3,415,643 | | |
$ | 8,445,263 | | |
$ | 6,119,155 | |
Our
total revenues in the second quarter 2023 increased by 842,787, or 25%, over our second quarter 2022 revenues, driven primarily by the
strong professional services in our Document Conversion segment, as further described below. The increase in total revenues for the six months ended June 30, 2023 is driven by the same factors
as well as two quarters of Yellow Folder in 2023 and only one quarter in 2022.
Sale
of Software Revenues
Revenues
from the sale of software principally consist of sales of additional or upgraded software licenses and applications to existing customers
and resellers. Yellow Folder does not sell revenue in this category. Revenues from the sale of software, which are reported as part of
our Document Management segment, increased by $52,541, or 473%, the second quarter 2023 compared to the second quarter 2022, and increased
by $3,343, or 4% during the six-month period 2023 compared to the six-month period 2022.
This
small increase for the six-month period was as expected, and large increase quarter over quarter was due to timing of direct sales
projects. We expect the volatility of this revenue line item to continue as project timing is unpredictable and the frequency of
on-premise software solution sales decreases over time.
Software
as a Service Revenues
We
provide access to our software solutions as a service, accessible through the internet. Our customers typically enter into our
software as a service agreement for periods of one year or more. Under these agreements, we generally provide access to the
applicable software, data storage and related customer assistance and support. Revenues from the sale of software as a service,
which are reported as part of our Document Management segment increased by $119,462, or 10%, in the second quarter 2023 compared to
the second quarter 2022 and increased by $926,673, or 58% in the six-month period 2023 compared to the six-month period 2022. The
six-month period increase was primarily the result of the Yellow Folder acquisition, which contributed $785,481, or 85% of the
increase, plus organic growth in our cloud-based solutions, as well as expanded data storage, user seats, and hosting fees for
existing customers.
Software
Maintenance Services Revenues
Software
maintenance services revenues consist of fees for post-contract customer support services provided to license (premise-based)
holders through support and maintenance agreements. These agreements allow our customers to receive technical support, enhancements
and upgrades to new versions of our software products when and if available. A substantial portion of these revenues were generated
from renewals of maintenance agreements, which typically run on a year-to-year basis. Yellow Folder does not sell revenue in this
category. Revenues from the sale of software maintenance services, which are reported as part of our Document Management segment,
increased by $5,258, or 2%, in the second quarter 2023 compared to the second quarter 2022 and increased by $18,198, or 3%, in the
six-month period 2023 compared to the six-month period 2022. This small increase in these revenues in 2023 compared to the 2022 was
driven by expansion of services with existing customers and price increases being partially offset by normal attrition and certain
customers migrating their premise solution to our cloud solution, resulting maintenance and support agreements decreasing and
software as a service increasing.
Professional
Services Revenues
Professional
services revenues consist of revenues from document scanning and conversion services, consulting, discovery, training, and advisory
services to assist customers with document management needs, as well as repair and maintenance services for customer equipment.
These revenues include arrangements that do not involve the sale of software. Of our professional services revenues during the
second quarter 2023 and six-month period 2023, $2,143,613 and $4,254,336, respectively, were derived from our Document Conversion
operations and $154,703 and $343,269, respectively, were derived from our Document Management operations. Our overall professional
services revenues increased by $672,551, or 41%, in the second quarter 2023 compared to the second quarter 2022 and increased by
$1,383,892, or 43%, in the six-month period 2023 compared to the six-month period 2022. This increase is primarily the result of the
strong recovery in our Document Conversion segment in the six-month period 2023 from the softer demand of early 2022. The six-month
period increase includes the contribution of $110,316 in revenue from the Yellow Folder acquisition from the first quarter 2023,
which did not contribute in the first quarter 2022.
Storage
and Retrieval Services Revenues
We
provide document storage and retrieval services to customers, primarily in Michigan. Revenues from storage and retrieval services,
which are reported as part of our Document Conversion segment, decreased by $7,025, or 3%, in the second quarter 2023 compared to
the second quarter 2022 and decreased by $5,998, or 1%, during the six-month period 2023 compared to the six-month period 2022. This
decrease was the result of a continued reduction in volume of work from our largest storage and retrieval customer, Rocket Mortgage,
due to the significant slowdown in the home mortgage and refinancing industry. Yellow Folder revenue partially offset the decrease
by $35,799 in revenue contribution in the first quarter 2023.
Costs
of Revenues and Gross Profits
The
following table sets forth our cost of revenues by reportable segment for the periods indicated:
| | |
For the three months ended | | |
For the six months ended | |
| | |
June 30, | | |
June 30, | |
| | |
2023 | | |
2022 | | |
2023 | | |
2022 | |
| Cost of revenues by segment | |
| | |
| | |
| | |
| |
| Document Management | |
$ | 342,984 | | |
$ | 246,509 | | |
$ | 651,357 | | |
$ | 474,981 | |
| Document Conversion | |
| 1,325,013 | | |
| 980,116 | | |
| 2,557,634 | | |
| 1,823,319 | |
| Total cost of revenues | |
$ | 1,667,997 | | |
$ | 1,226,625 | | |
$ | 3,208,991 | | |
$ | 2,298,300 | |
The
following table sets forth our cost of revenues, by revenue source, for the periods indicated:
| | |
For the three months ended | | |
For the six months ended | |
| | |
June 30, | | |
June 30, | |
| | |
2023 | | |
2022 | | |
2023 | | |
2022 | |
| | |
| | |
| | |
| | |
| |
| Cost of revenues: | |
| | | |
| | | |
| | | |
| | |
| Sale of software | |
$ | 7,344 | | |
$ | 7,392 | | |
$ | 15,525 | | |
$ | 33,585 | |
| Software as a service | |
| 258,382 | | |
| 191,188 | | |
| 479,022 | | |
| 282,437 | |
| Software maintenance services | |
| 15,117 | | |
| 19,185 | | |
| 31,833 | | |
| 37,485 | |
| Professional services | |
| 1,307,341 | | |
| 918,542 | | |
| 2,494,457 | | |
| 1,766,709 | |
| Storage and retrieval services | |
| 79,813 | | |
| 90,318 | | |
| 188,154 | | |
| 178,084 | |
| Total cost of revenues | |
$ | 1,667,997 | | |
$ | 1,226,625 | | |
$ | 3,208,991 | | |
$ | 2,298,300 | |
Our total cost of revenues during the second quarter 2023 increased by
$441,372, or 36%, over second quarter 2022 and increased by $910,691, or 40%, during the six-month period 2023 over the six-month period
2022. Our cost of revenues for our Document Management segment increased by $96,475, or 39%, in the second quarter 2023 compared to the
second quarter 2022 and increased $176,376, or 37%, in the six-month period 2023 compared to the six-month period 2022 primarily due to
the six-month impact of Yellow Folder in that segment. Our cost of revenues for our Document Conversion segment increased by $344,897,
or 35%, in the second quarter 2023 compared to the second quarter 2022 and increased by $734,315, or 40%, during the six-month period
2023 compared to the six-month period 2022 primarily due to the staffing ramp up to accommodate more work volume.
| | |
For the three months ended | | |
For the six months ended | |
| | |
June 30, | | |
June 30, | |
| | |
2023 | | |
2022 | | |
2023 | | |
2022 | |
| | |
| | |
| | |
| | |
| |
| Gross profit: | |
| | | |
| | | |
| | | |
| | |
| Sale of software | |
$ | 56,302 | | |
$ | 3,713 | | |
$ | 63,414 | | |
$ | 42,011 | |
| Software as a service | |
| 1,019,536 | | |
| 967,268 | | |
| 2,037,328 | | |
| 1,307,240 | |
| Software maintenance services | |
| 334,022 | | |
| 324,696 | | |
| 666,848 | | |
| 642,998 | |
| Professional services | |
| 990,975 | | |
| 707,223 | | |
| 2,103,148 | | |
| 1,447,004 | |
| Storage and retrieval services | |
| 189,598 | | |
| 186,118 | | |
| 365,534 | | |
| 381,602 | |
| Total gross profit | |
$ | 2,590,433 | | |
$ | 2,189,018 | | |
$ | 5,236,272 | | |
$ | 3,820,855 | |
| | |
| | | |
| | | |
| | | |
| | |
| Gross profit percentage: | |
| | | |
| | | |
| | | |
| | |
| Sale of software | |
| 88.5 | % | |
| 33.4 | % | |
| 80.3 | % | |
| 55.6 | % |
| Software as a service | |
| 79.8 | % | |
| 83.5 | % | |
| 81.0 | % | |
| 82.2 | % |
| Software maintenance services | |
| 95.7 | % | |
| 94.4 | % | |
| 95.4 | % | |
| 94.5 | % |
| Professional services | |
| 43.1 | % | |
| 43.5 | % | |
| 45.7 | % | |
| 45.0 | % |
| Storage and retrieval services | |
| 70.4 | % | |
| 67.3 | % | |
| 66.0 | % | |
| 68.2 | % |
| Total gross profit percentage | |
| 60.8 | % | |
| 64.1 | % | |
| 62.0 | % | |
| 62.4 | % |
Our
overall gross profit decreased to 60.8% in the second quarter 2023 from 64.1% in the second quarter 2022, and decreased to 62.0% in
the second quarter 2023 from 62.4% for the six-month period 2023 and the six-month period 2022. The increase in the mix of
professional services revenue was the principal driver of the decrease, due to the significant growth in our Document Conversion
segment, and exacerbated by a slight erosion in software as a service margins due to staffing increases to accommodate growth at
Yellow Folder.
Cost
of Software Revenues
Cost
of software revenues consists primarily of labor costs of our software engineers and implementation consultants and third-party
software licenses that are sold in connection with our core software applications. Cost of software revenues during the second
quarter 2023 decreased by $48, or 1%, from the second quarter 2022, and decreased by $18,060, or 54%, from the six-month period
2022, due to stronger margin projects sold in 2023. Our gross margin for software revenues increased to 88.5% from 33.4% in the
second quarter 2022 and increased to 80.3% from 55.6% the six-month period 2022. The increase in margin percent in the second
quarter 2023 was driven by favorable changes in the software solution mix with stronger margin solutions, and impacted by larger
percentage swings on small dollar values. Yellow Folder had no impact to this category.
Cost
of Software as a Service
Cost
of software as a service, or SaaS, consists primarily of technical support personnel, hosting services, and related costs. Cost of
software as a service during the second quarter 2023 increased by $67,194, or 35%, over the second quarter 2022 and increased by
$196,585, or 70%, during the six-month period 2023 over the six-month period 2022. This increase in the cost of SaaS was due to
increased staffing allocations, so our gross margin in the second quarter 2023 decreased to 79.8% compared to 83.5% in the second
quarter 2022 and to 81.0% in the six-month period 2022 compared to 82.2% during the six-month period 2022.
Cost
of Software Maintenance Services
Cost
of software maintenance services consists primarily of technical support personnel and related costs. Cost of software maintenance
services during the second quarter 2023 decreased by $4,068, or 21%, over the second quarter 2022 and decreased by $5,652, or 15%,
in the six-month period 2023 over the six-month period 2022, due primarily to reduced support activity. As a result, our gross
margin for software maintenance services increased to 95.7% and 95.4% in the second quarter 2023 and the six-month period 2022,
respectively, compared to 94.4% and 94.5% in the second quarter 2022 and the six-month period 2022, respectively.
Cost
of Professional Services
Cost
of professional services consists primarily of compensation for employees performing the document conversion services, compensation
of our software engineers and implementation consultants and related third-party costs. Cost of professional services during the
second quarter 2023 increased by $388,799, or 42%, over the second quarter 2022 and increased in the six-month period 2023 by
$727,748, or 41%, over the six-month period 2022, primarily due to growing the Document Conversion staff to meet the growing backlog
of orders. Our gross margins in professional services decreased to 43.1% in the second quarter 2023 compared to 43.5% in the second
quarter 2022 and increased to 45.7% during the six-month period 2023 compared to 45.0% in the six-month period 2022. Gross margins
related to consulting services may vary widely, depending upon the nature of the digital conversion or consulting project and the
amount of labor it takes to complete a project. During 2023, improvements in our Document Management professional services
consulting efficiencies largely deterioration in our Document Conversion professional services related to digital conversion, as a
result of staffing up and training new hires.
Cost
of Storage and Retrieval Services
Cost
of storage and retrieval services consists primarily of compensation for employees performing the document storage and retrieval
services, including logistics, provided primarily by our Michigan operations and to a much lesser extent, Yellow Folder. Cost of
storage and retrieval services decreased by $10,505, or 12%, in the second quarter 2023 compared to the second quarter 2022, and
increased by $10,070, or 6%, during the six-month period 2023 compared to the six-month period 2022. The decrease was due to a
reduction in transaction events in the second quarter 2023 compared to 2022, offset for the six-month period by general wage
inflation and fuel cost increases. Gross margins for our storage and retrieval services, which exclude the cost of facilities
rental, maintenance, and related overheads, increased to 70.4% in the second quarter 2023 compared to 67.3% in the second quarter
2022 and decreased to 66% during six-month period 2023 compared to 68.2% in the six-month period 2022. Yellow Folder did not have a
material impact to this category in 2023 or 2022.
Operating
Expenses
The
following table sets forth our operating expenses for the periods indicated:
| | |
For the Three Months Ended | | |
For the Six Months Ended | |
| | |
June 30, | | |
June 30, | |
| | |
2023 | | |
2022 | | |
2023 | | |
2022 | |
| | |
| | |
| | |
| | |
| |
| Operating expenses: | |
| | | |
| | | |
| | | |
| | |
| General and administrative | |
$ | 1,561,939 | | |
$ | 1,260,504 | | |
$ | 3,116,550 | | |
$ | 2,199,387 | |
| Change in fair value of earnout liabilities | |
| - | | |
| 52,301 | | |
| - | | |
| 116,505 | |
| Transaction costs | |
| - | | |
| 285,230 | | |
| - | | |
| 355,281 | |
| Sales and marketing | |
| 492,303 | | |
| 529,405 | | |
| 1,071,814 | | |
| 881,519 | |
| Depreciation and amortization | |
| 239,803 | | |
| 195,277 | | |
| 467,521 | | |
| 309,387 | |
| | |
| | | |
| | | |
| | | |
| | |
| Total operating expenses | |
$ | 2,294,045 | | |
$ | 2,322,717 | | |
$ | 4,655,885 | | |
$ | 3,862,079 | |
General
and Administrative Expenses
General
and administrative expenses during the second quarter 2023 increased by $307,077, or 24%, over the second quarter 2022, and
increased in the six-month period 2023 by $925,997, or 42%, over the six-month period 2022, principally related to the addition of
Yellow Folder expenses in the first quarter 2023, resulting in six months of expenses in 2023 compared to three months of expenses
in 2022. This was primarily reflected in our Document Management segment, in which our general and administrative expenses increased
to $794,718 and $1,597,846 in the second quarter 2023 and the six-month period 2023, respectively, from $688,861 and $1,083,124 in
the second quarter 2022 and the six-month period 2022, respectively. In our Document Conversion segment, our general and
administrative expenses increased to $767,221 in the second quarter 2023 compared to $571,643 in the second quarter 2022, and
increased to $1,518,704 in the six-month period 2023 compared to $1,116,263 in the six-month period 2022.
Change
in Fair Value of Earnout Liabilities
The
final earnout liabilities were paid in January 2023 and there were no changes in fair value in 2023. Fair value adjustments amounted
to $52,301 in the second quarter 2022 and $116,505 for the six-month period 2022. The fair value adjustments were driven by updated
assumptions to reflect the improved performance of the affected acquisitions against their threshold targets and the decreasing
impact of present value discounting.
Transaction
Costs
There
were no transaction costs during the second quarter 2023 and six-month period 2023. The transactions costs during the second quarter
and six-month period 2022 were comprised of investment banker success fees, as well as legal and consulting fees, in connection with
our acquisition of Yellow Folder, consummated on April 1, 2022.
Sales
and Marketing Expenses
Sales
and marketing expenses during the second quarter 2023 decreased by $37,102, or 7%, from the second quarter 2022 and increased by
$190,295, or 22%, during the six-month period 2023 over the six-month period 2022. The six-month increase was primarily driven by
the inclusion of the sales and marketing expenses Yellow Folder during the full six-month period 2023, compared to only the second
quarter 2022.
Depreciation
and Amortization
Depreciation
and amortization during the second quarter 2023 increased by $38,884, or 19%, over the second quarter 2022 and increased by
$149,300, or 47%, during the six-month period 2023 over the six-month period 2022 as a result of amortization of new intangible
assets related to the Yellow Folder acquisition, as well as increased amortization of capitalized software costs.
Other
Items of Income and Expense
Interest
Expense, Net
Interest
expense decreased by $79,814, or 33%, in the second quarter 2023 as compared to the second quarter 2022, and decreased by $20,979, or
6% during the six-month period 2023 as compared to the six-month period 2022. The decrease resulted from partial principal repayment
of the 2020 Notes on December 1, 2022 and February 28, 2023.
Liquidity
and Capital Resources
We
have financed our operations primarily through a combination of cash on hand, cash generated from operations, borrowings from third parties
and related parties, and proceeds from private sales of equity. Since 2012, and including our private offering in April 2022, we have
raised a total of approximately $25.2 million in cash through issuances of debt and equity securities, net of $1.3 million in debt repayments.
As of June 30, 2023, we had approximately $1.1 million in cash and cash equivalents, net working capital deficit of $0.4 million, and
an accumulated deficit of $21.4 million. In January 2023, we paid $0.7 million in final earnout payments and in February 2023 and December
2022 we prepaid approximately $1.3 million in principal, which was due in February 2023.
In
2023 and 2022, we engaged in several actions that significantly improved our liquidity and cash flows, including (i) effective October 1, 2023 through May 30, 2025, securing a renewal contract with our largest customer, the State
of Michigan, containing an estimated net rate increase of approximately 21%, compared to the current rates in effect for the contract
period commencing June 1, 2018 and (ii), on April 1,
2022:
| |
● |
acquiring
the positive cash flow generated by Yellow Folder, |
| |
|
|
| |
● |
receiving
aggregate gross proceeds of approximately $5.7 million from the private placement of our common stock (all which was used to acquire
Yellow Folder), and |
| |
|
|
| |
● |
receiving
approximately $3.0 million in proceeds from the issuance of 12% subordinated promissory notes due March 30, 2025, which we refer
to as the 2022 Notes (some of which was used to acquire Yellow Folder, with the remainder used for general working capital). |
Of
our existing debt as of June 30, 2023, $0.7 million is due August 31, 2023, and approximately $3 million is due March 30, 2025. Our operating
cash flow alone may be insufficient to meet the debt obligations in full in 2023. We believe we could seek additional debt or equity
financing on acceptable terms. We believe that our balance sheet and financial statements would support a full or partial refinancing
or other appropriate modification of the current promissory notes, such as an extension or conversion to equity. We are confident in
our ability to prudently manage our current debt on terms acceptable to us.
Our
ability to meet our capital needs in the short term will depend on many factors, including maintaining and enhancing our operating cash
flow, successfully managing the transition of our recent acquisition of Yellow Folder, successfully retaining and growing our client
base in the midst of global inflation and general economic uncertainty.
Based
on our current plans and assumptions, we believe our capital resources, including our cash and cash equivalents, along with funds expected
to be generated from our operations and potential financing options, will be sufficient to meet our anticipated cash needs arising in
the ordinary course of business for at least the next 12 months, including to satisfy our expected working capital needs and capital
and debt service commitments.
Our
ability to meet our capital needs further into the future will depend primarily on strategically managing the business and successfully
retaining our client base.
Indebtedness
As
of June 30, 2023, our outstanding long-term indebtedness consisted of:
| |
● |
The
2020 Notes issued to accredited investors on March 2, 2020, with an aggregate outstanding principal balance of $717,500 and accrued
interest of $0. |
| |
|
|
| |
● |
The
2022 Notes issued to accredited investors on April 1, 2022, with an aggregate outstanding principal balance of $2,964,500 and accrued
interest of $0. |
See
Note 8 and Note 9 to our condensed consolidated financial statements included in Part 1, Item 1 of this Quarterly Report for further
information on the 2020 and 2022 notes.
Capital
Expenditures
There
were no material commitments for capital expenditures at June 30, 2023.
Cash
Used in and Provided by Operating Activities
Net
cash used in operating activities during the six-month period 2023 was $299,631, primarily attributable to the net income adjusted for
non-cash expenses of $856,555, an increase in operating assets of $702,381 and a decrease in operating liabilities of $702,102. Net cash
provided by operating activities during the six-month period 2022 was $72,649, primarily attributable to the net loss adjusted for non-cash
expenses of $764,638, a decrease in operating assets of $225,852 and a decrease in operating liabilities of $523,548.
Cash
Used by Investing Activities
Net
cash used in investing activities in the six-month period 2023 was $291,101, including $208,417 in capitalized software. Net cash
used in investing activities in the six-month period 2022 was $6,652,673, primarily $6,383,269 related to cash paid to acquire
Yellow Folder, as well as $171,205 in capitalized software.
Cash
Used in and Provided by Financing Activities
Net
cash used by financing activities during the six-month period 2023 amounted to $700,000 in earnout liability payments, $262,950 in
repayment of notes payable, and $12,312 in the principal portion of a finance lease liability. Net cash provided by financing
activities during the six-month period 2022 amounted to $6,940,583, as the result of cash generated from the sale of common stock of
$5,740,758 and from new borrowings of $2,964,500, partially offset by issuance costs of $746,342, as well as a further offset of
$1,018,333 in earnout liability payments.
Critical
Accounting Policies and Estimates
The
preparation of our condensed consolidated financial statements in accordance GAAP requires us to make estimates and assumptions that
affect the reported amounts of assets and liabilities at the date of the financial statements and the reported amounts of revenue and
expenses in the reporting period. We monitor and analyze these items for changes in facts and circumstances, and material changes in
these estimates could occur in the future. We base our estimates and assumptions on current facts, historical experience and various
other factors that we believe to be reasonable under the circumstances, the results of which form the basis for making judgments about
the carrying values of assets and liabilities and the accrual of costs and expenses that are not readily apparent from other sources.
Changes in estimates are reflected in reported results for the period in which they become known. The actual results experienced by us
may differ materially from our estimates. To the extent there are material differences between our estimates and the actual results,
our future results of operations will be affected.
Our
critical accounting policies and estimates are set forth in Part II, Item 7, “Management’s Discussion and Analysis of Financial
Condition and Results of Operations – Critical Accounting Policies and Estimates” in our Annual Report on Form 10-K for the
fiscal year ended December 31, 2022. There were no material changes to our critical accounting policies and estimates during the second
quarter 2023.
ITEM
3. QUANTITATIVE AND QUALITATIVE DISCLOSURES ABOUT MARKET RISK.
Not
applicable to smaller reporting companies.
ITEM
4. CONTROLS AND PROCEDURES.
Evaluation
of Disclosure Controls and Procedures
Our
management, with the participation of our Chief Executive Officer and Chief Financial Officer, evaluated the effectiveness of our disclosure
controls and procedures (as defined in Rules 13a-15(e) and 15d-15(e) under the Securities Exchange Act of 1934, as amended (the “Exchange
Act”)) at the end of the period covered by this Quarterly Report.
Based
on this evaluation, we concluded that, as of June 30, 2023, our disclosure controls and procedures were effective to provide reasonable
assurance that the information required to be disclosed by us in the reports we file or submit under the Exchange Act is recorded, processed,
summarized and reported within the time periods specified in the SEC’s rules and forms, and that such information is accumulated
and communicated to management, including our Chief Executive Officer and Chief Financial Officer, as appropriate, to allow timely decisions
regarding required disclosure.
In
designing and evaluating our disclosure controls and procedures, management recognizes that any controls system, no matter how well designed
and operated, can provide only reasonable assurance of achieving its desired objectives. In addition, the design of disclosure controls
and procedures must reflect resource constraints and that management is required to apply its judgment in evaluating the benefits of
possible controls and procedures relative to their costs.
Changes
in Internal Control Over Financial Reporting
There
were no changes in our internal control over financial reporting that occurred during the period covered by this Quarterly Report that
materially affected, or are reasonably likely to materially affect, our internal control over financial reporting (as defined in Rules
13a-15(f) and 15d-15(f) under the Exchange Act).
We
regularly review our internal control over financial reporting and, from time to time, we have made changes as we deemed appropriate
to maintain and enhance the effectiveness of our internal controls over financial reporting, although these changes do not have a material
effect on our overall internal control.
PART
II — OTHER INFORMATION
ITEM
1. LEGAL PROCEEDINGS.
None.
ITEM
1A. RISK FACTORS.
Our
business and operating results are subject to many risks, uncertainties and other factors. If any of these risks were to occur, our business,
affairs, assets, financial condition, results of operations, cash flows and prospects could be materially and adversely affected. There
have been no material changes to the risk factors set forth in Part I, Item 1A, “Risk Factors,” of our Annual Report
on Form 10-K for the fiscal year ended December 31, 2022.
ITEM
2. UNREGISTERED SALES OF EQUITY SECURITIES AND USE OF PROCEEDS.
None.
ITEM
3. DEFAULT UPON SENIOR SECURITIES.
None.
ITEM
4. MINE SAFETY DISCLOSURES.
Not
Applicable.
ITEM
5. OTHER INFORMATION.
On
August 3, 2023, we entered into a renewal extension, effective October 1, 2023 through May 30, 2025, with our largest customer, the State
of Michigan, containing an estimated net rate increase of approximately 21%, compared to the current rates in effect for the contract
period commencing June 1, 2018. The contract extension is included as Exhibit 10.1 to this Report.
ITEM
6. EXHIBITS.
The
following is a list of exhibits filed as part of this Quarterly Report on Form 10-Q.
*
Filed herewith.
SIGNATURES
Pursuant
to the requirements of the Securities Exchange Act of 1934, the registrant has duly caused this report to be signed on its behalf by
the undersigned, thereunto duly authorized.
| INTELLINETICS,
INC. |
|
| |
|
|
| Dated: |
August
14, 2023 |
|
| |
|
|
| By: |
/s/
James F. DeSocio |
|
| |
James
F. DeSocio |
|
| |
President
and Chief Executive Officer |
|
| |
|
|
| Dated:
|
August
14, 2023 |
|
| |
|
|
| By: |
/s/
Joseph D. Spain |
|
| |
Joseph
D. Spain |
|
| |
Chief
Financial Officer |
|
Exhibit 10.1

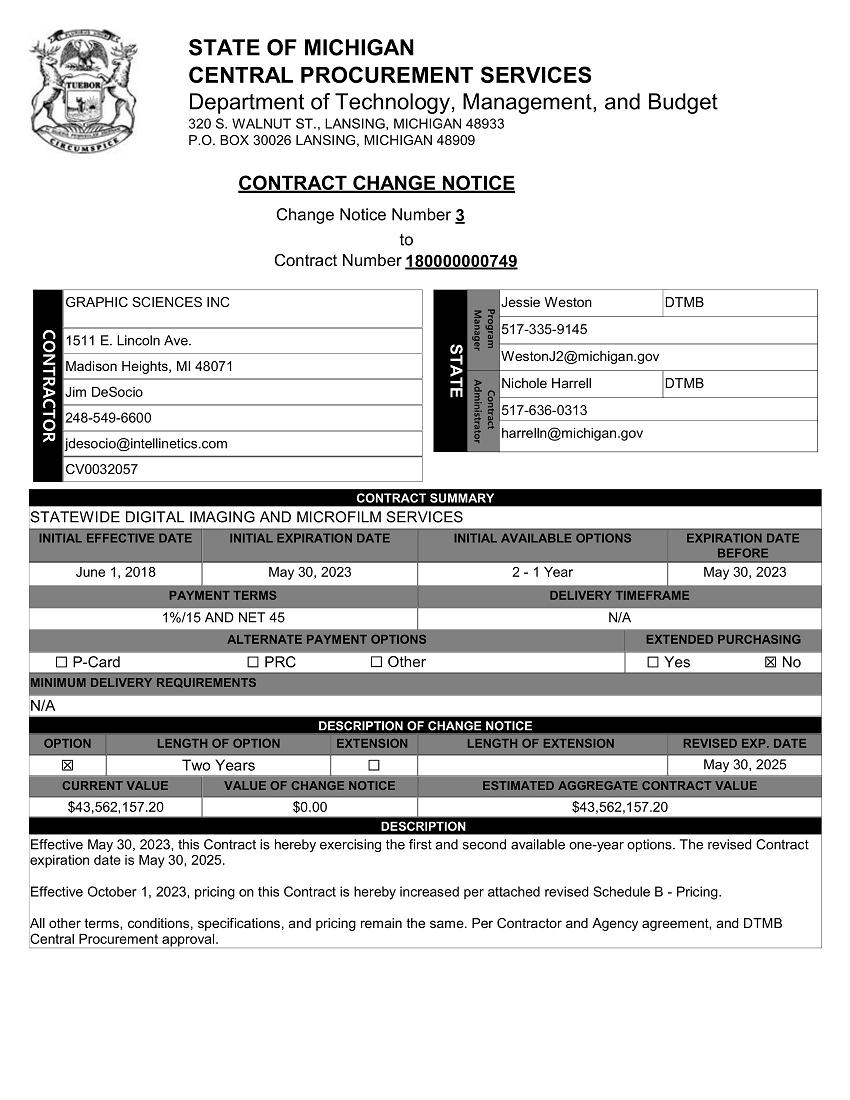

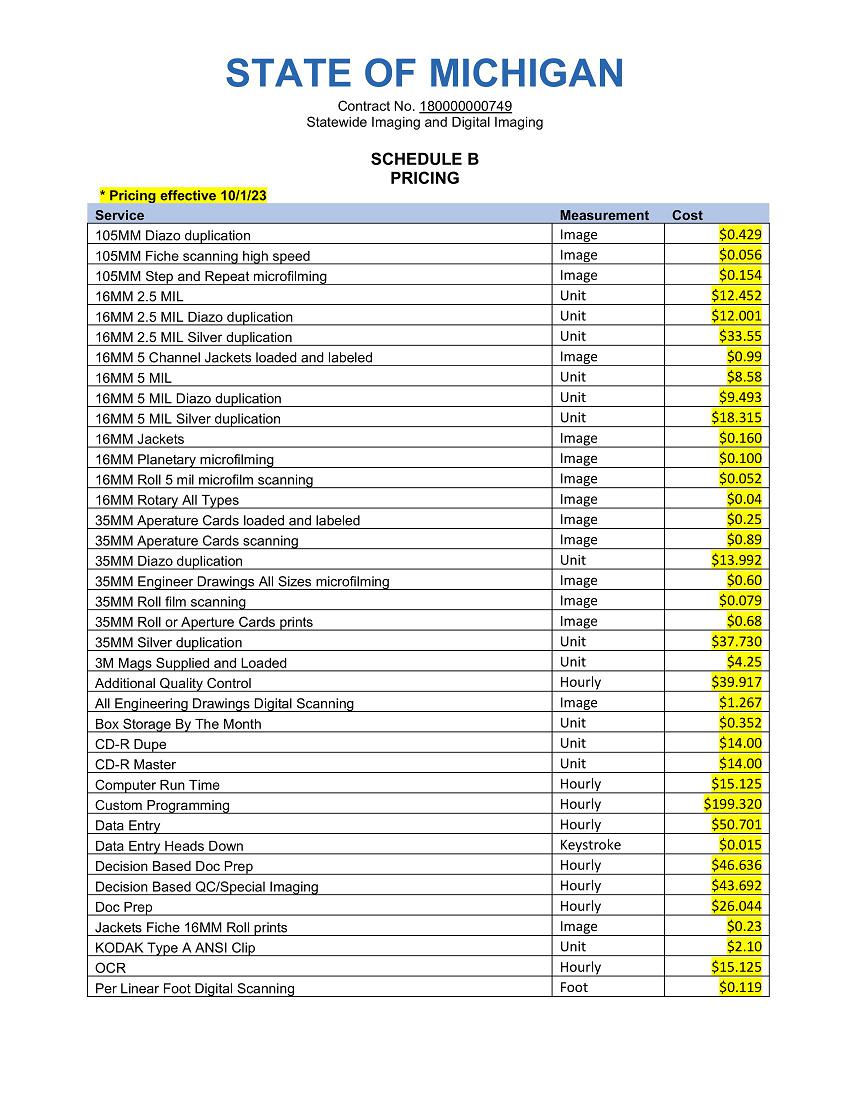
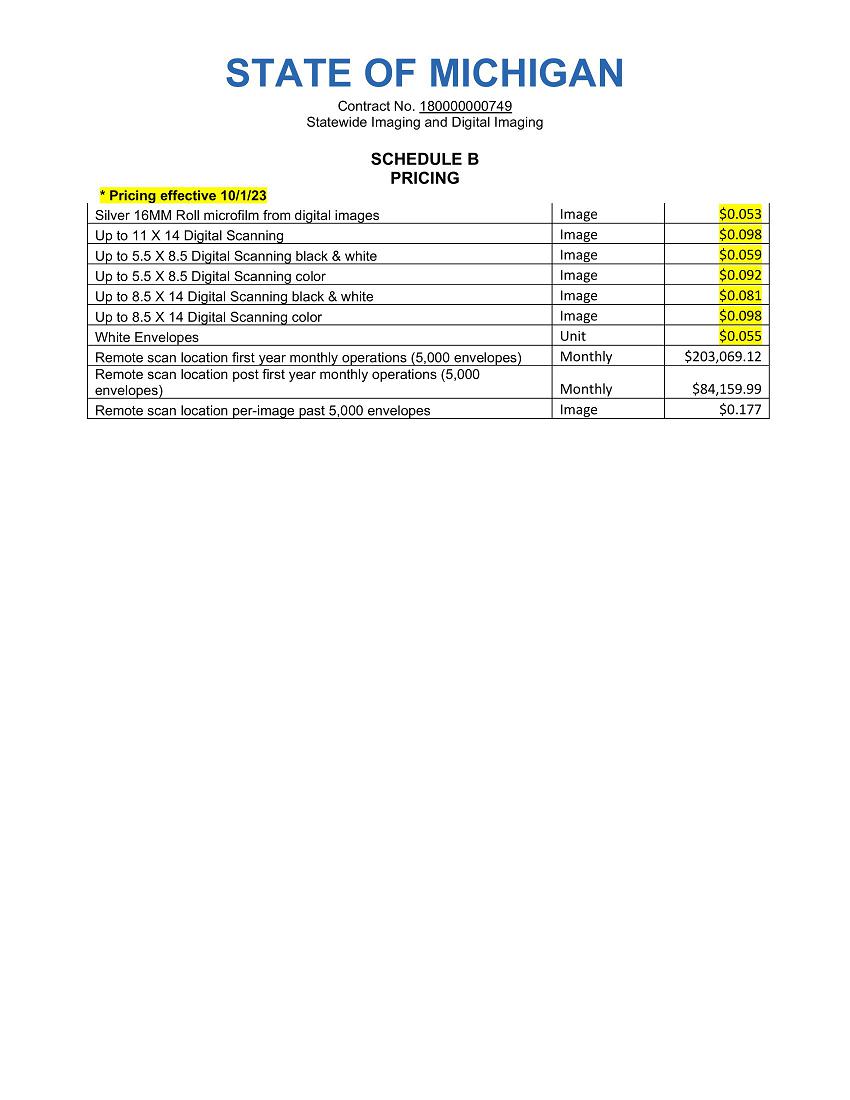
Exhibit
31.1
Certification
Pursuant to Section 302 of the Sarbanes-Oxley Act of 2002
I,
James F. DeSocio, certify that:
| 1.
|
I
have reviewed this Quarterly Report on Form 10-Q of Intellinetics, Inc.; |
| |
|
| 2.
|
Based
on my knowledge, this report does not contain any untrue statement of a material fact or omit to state a material fact necessary
to make the statements made, in light of the circumstances under which such statements were made, not misleading with respect to
the period covered by this report; |
| |
|
| 3.
|
Based
on my knowledge, the financial statements, and other financial information included in this report, fairly present in all material
respects the financial condition, results of operations and cash flows of the registrant as of, and for, the periods presented in
this report; |
| |
|
| 4.
|
The
registrant’s other certifying officer and I are responsible for establishing and maintaining disclosure controls and procedures
(as defined in Exchange Act Rules 13a-15(e) and 15d-15(e)) and internal control over financial reporting (as defined in Exchange
Act Rules 13a-15(f) and 15d-15(f)) for the registrant and have: |
| |
(a)
|
Designed
such disclosure controls and procedures, or caused such disclosure controls and procedures to be designed under our supervision,
to ensure that material information relating to the registrant, including its consolidated subsidiaries, is made known to us by others
within those entities, particularly during the period in which this report is being prepared; |
| |
|
|
| |
(b)
|
Designed
such internal control over financial reporting, or caused such internal control over financial reporting to be designed under our
supervision, to provide reasonable assurance regarding the reliability of financial reporting and the preparation of financial statements
for external purposes in accordance with generally accepted accounting principles; |
| |
|
|
| |
(c)
|
Evaluated
the effectiveness of the registrant’s disclosure controls and procedures and presented in this report our conclusions about
the effectiveness of the disclosure controls and procedures, as of the end of the period covered by this report based on such evaluation;
and |
| |
|
|
| |
(d)
|
Disclosed
in this report any change in the registrant’s internal control over financial reporting that occurred during the registrant’s
most recent fiscal quarter (the registrant’s fourth fiscal quarter in the case of an annual report) that has materially affected,
or is reasonably likely to materially affect, the registrant’s internal control over financial reporting; and |
| 5.
|
The
registrant’s other certifying officer and I have disclosed, based on our most recent evaluation of internal control over financial
reporting, to the registrant’s auditors and the audit committee of registrant’s board of directors (or persons performing
the equivalent functions): |
| |
(a)
|
All
significant deficiencies and material weaknesses in the design or operation of internal control over financial reporting which are
reasonably likely to adversely affect the registrant’s ability to record, process, summarize and report financial information;
and |
| |
|
|
| |
(b)
|
Any
fraud, whether or not material, that involves management or other employees who have a significant role in the registrant’s
internal control over financial reporting. |
Date:
August 14, 2023
| By: |
/s/
James F. DeSocio |
|
| |
President
and Chief Executive Officer |
|
Exhibit
31.2
Certification
Pursuant to Section 302 of the Sarbanes-Oxley Act of 2002
I,
Joseph D. Spain, certify that:
| 1.
|
I
have reviewed this Quarterly Report on Form 10-Q of Intellinetics, Inc.; |
| |
|
| 2.
|
Based
on my knowledge, this report does not contain any untrue statement of a material fact or omit to state a material fact necessary
to make the statements made, in light of the circumstances under which such statements were made, not misleading with respect to
the period covered by this report; |
| |
|
| 3.
|
Based
on my knowledge, the financial statements, and other financial information included in this report, fairly present in all material
respects the financial condition, results of operations and cash flows of the registrant as of, and for, the periods presented in
this report; |
| |
|
| 4.
|
The
registrant’s other certifying officer and I are responsible for establishing and maintaining disclosure controls and procedures
(as defined in Exchange Act Rules 13a-15(e) and 15d-15(e)) and internal control over financial reporting (as defined in Exchange
Act Rules 13a-15(f) and 15d-15(f)) for the registrant and have: |
| |
(a)
|
Designed
such disclosure controls and procedures, or caused such disclosure controls and procedures to be designed under our supervision,
to ensure that material information relating to the registrant, including its consolidated subsidiaries, is made known to us by others
within those entities, particularly during the period in which this report is being prepared; |
| |
|
|
| |
(b)
|
Designed
such internal control over financial reporting, or caused such internal control over financial reporting to be designed under our
supervision, to provide reasonable assurance regarding the reliability of financial reporting and the preparation of financial statements
for external purposes in accordance with generally accepted accounting principles; |
| |
|
|
| |
(c)
|
Evaluated
the effectiveness of the registrant’s disclosure controls and procedures and presented in this report our conclusions about
the effectiveness of the disclosure controls and procedures, as of the end of the period covered by this report based on such evaluation;
and |
| |
|
|
| |
(d)
|
Disclosed
in this report any change in the registrant’s internal control over financial reporting that occurred during the registrant’s
most recent fiscal quarter (the registrant’s fourth fiscal quarter in the case of an annual report) that has materially affected,
or is reasonably likely to materially affect, the registrant’s internal control over financial reporting; and |
| 5.
|
The
registrant’s other certifying officer and I have disclosed, based on our most recent evaluation of internal control over financial
reporting, to the registrant’s auditors and the audit committee of registrant’s board of directors (or persons performing
the equivalent functions): |
| |
(a)
|
All
significant deficiencies and material weaknesses in the design or operation of internal control over financial reporting which are
reasonably likely to adversely affect the registrant’s ability to record, process, summarize and report financial information;
and |
| |
|
|
| |
(b)
|
Any
fraud, whether or not material, that involves management or other employees who have a significant role in the registrant’s
internal control over financial reporting. |
Date:
August 14, 2023
| By: |
/s/
Joseph D. Spain |
|
| |
Chief
Financial Officer |
|
Exhibit
32.1
CERTIFICATION
PURSUANT TO
18
U.S.C. SECTION 1350,
AS
ADOPTED PURSUANT TO
SECTION
906 OF THE SARBANES-OXLEY ACT OF 2002
In
connection with the Quarterly Report of Intellinetics, Inc. (the “Company”) on Form 10-Q for the quarter ended June 30, 2023,
as filed with the Securities and Exchange Commission on the date hereof (the “Report”), I, James F. DeSocio, President and
Chief Executive Officer of the Company, certify, pursuant to 18 U.S.C. §1350, as adopted pursuant to §906 of the Sarbanes-Oxley
Act of 2002, that:
(1)
The Report fully complies with the requirements of Section 13(a) or 15(d) of the Securities Exchange Act of 1934; and
(2)
The information contained in the Report fairly presents, in all material respects, the financial condition and results of operations
of the Company.
Dated:
August 14, 2023
| /s/
James F. DeSocio |
|
| President
and Chief Executive Officer |
|
This
Certification is being furnished solely to accompany the Report pursuant to 18 U.S.C. § 1350, as adopted pursuant to Section 906
of the Sarbanes-Oxley Act of 2002, and shall not be deemed “filed” by the Company for purposes of Section 18 of the Securities
Exchange Act of 1934, as amended, and shall not be incorporated by reference into any filing of the Company under the Securities Act
of 1933, as amended, or the Securities Exchange Act of 1934, as amended, whether made before or after the date of this Report, irrespective
of any general incorporation language contained in such filing.
Exhibit
32.2
CERTIFICATION
PURSUANT TO
18
U.S.C. SECTION 1350,
AS
ADOPTED PURSUANT TO
SECTION
906 OF THE SARBANES-OXLEY ACT OF 2002
In
connection with the Quarterly Report of Intellinetics, Inc. (the “Company”) on Form 10-Q for the quarter ended June 30, 2023,
as filed with the Securities and Exchange Commission (the “Report”), I, Joseph D. Spain, Chief Financial Officer of the Company,
certify, pursuant to 18 U.S.C. §1350, as adopted pursuant to §906 of the Sarbanes-Oxley Act of 2002, that:
(1)
The Report fully complies with the requirements of Section 13(a) or 15(d) of the Securities Exchange Act of 1934; and
(2)
The information contained in the Report fairly presents, in all material respects, the financial condition and results of operations
of the Company.
Dated:
August 14, 2023
| /s/
Joseph D. Spain |
|
| Chief
Financial Officer |
|
This
Certification is being furnished solely to accompany the Report pursuant to 18 U.S.C. § 1350, as adopted pursuant to Section 906
of the Sarbanes-Oxley Act of 2002, and shall not be deemed “filed” by the Company for purposes of Section 18 of the Securities
Exchange Act of 1934, as amended, and shall not be incorporated by reference into any filing of the Company under the Securities Act
of 1933, as amended, or the Securities Exchange Act of 1934, as amended, whether made before or after the date of this Report, irrespective
of any general incorporation language contained in such filing.
v3.23.2
Cover - shares
|
6 Months Ended |
|
Jun. 30, 2023 |
Aug. 11, 2023 |
| Cover [Abstract] |
|
|
| Document Type |
10-Q
|
|
| Amendment Flag |
false
|
|
| Document Quarterly Report |
true
|
|
| Document Transition Report |
false
|
|
| Document Period End Date |
Jun. 30, 2023
|
|
| Document Fiscal Period Focus |
Q2
|
|
| Document Fiscal Year Focus |
2023
|
|
| Current Fiscal Year End Date |
--12-31
|
|
| Entity File Number |
001-41495
|
|
| Entity Registrant Name |
INTELLINETICS,
INC.
|
|
| Entity Central Index Key |
0001081745
|
|
| Entity Tax Identification Number |
87-0613716
|
|
| Entity Incorporation, State or Country Code |
NV
|
|
| Entity Address, Address Line One |
2190
Dividend Drive
|
|
| Entity Address, City or Town |
Columbus
|
|
| Entity Address, State or Province |
OH
|
|
| Entity Address, Postal Zip Code |
43228
|
|
| City Area Code |
(614)
|
|
| Local Phone Number |
921-8170
|
|
| Title of 12(b) Security |
Common
Stock, $0.001 par value
|
|
| Trading Symbol |
INLX
|
|
| Security Exchange Name |
NYSEAMER
|
|
| Entity Current Reporting Status |
Yes
|
|
| Entity Interactive Data Current |
Yes
|
|
| Entity Filer Category |
Accelerated Filer
|
|
| Entity Small Business |
true
|
|
| Entity Emerging Growth Company |
false
|
|
| Entity Shell Company |
false
|
|
| Entity Common Stock, Shares Outstanding |
|
4,073,757
|
| X |
- DefinitionBoolean flag that is true when the XBRL content amends previously-filed or accepted submission.
| Name: |
dei_AmendmentFlag |
| Namespace Prefix: |
dei_ |
| Data Type: |
xbrli:booleanItemType |
| Balance Type: |
na |
| Period Type: |
duration |
|
| X |
- DefinitionEnd date of current fiscal year in the format --MM-DD.
| Name: |
dei_CurrentFiscalYearEndDate |
| Namespace Prefix: |
dei_ |
| Data Type: |
xbrli:gMonthDayItemType |
| Balance Type: |
na |
| Period Type: |
duration |
|
| X |
- DefinitionFiscal period values are FY, Q1, Q2, and Q3. 1st, 2nd and 3rd quarter 10-Q or 10-QT statements have value Q1, Q2, and Q3 respectively, with 10-K, 10-KT or other fiscal year statements having FY.
| Name: |
dei_DocumentFiscalPeriodFocus |
| Namespace Prefix: |
dei_ |
| Data Type: |
dei:fiscalPeriodItemType |
| Balance Type: |
na |
| Period Type: |
duration |
|
| X |
- DefinitionThis is focus fiscal year of the document report in YYYY format. For a 2006 annual report, which may also provide financial information from prior periods, fiscal 2006 should be given as the fiscal year focus. Example: 2006.
| Name: |
dei_DocumentFiscalYearFocus |
| Namespace Prefix: |
dei_ |
| Data Type: |
xbrli:gYearItemType |
| Balance Type: |
na |
| Period Type: |
duration |
|
| X |
- DefinitionFor the EDGAR submission types of Form 8-K: the date of the report, the date of the earliest event reported; for the EDGAR submission types of Form N-1A: the filing date; for all other submission types: the end of the reporting or transition period. The format of the date is YYYY-MM-DD.
| Name: |
dei_DocumentPeriodEndDate |
| Namespace Prefix: |
dei_ |
| Data Type: |
xbrli:dateItemType |
| Balance Type: |
na |
| Period Type: |
duration |
|
| X |
- DefinitionBoolean flag that is true only for a form used as an quarterly report. Reference 1: http://www.xbrl.org/2003/role/presentationRef
-Publisher SEC
-Name Form 10-Q
-Number 240
-Section 308
-Subsection a
| Name: |
dei_DocumentQuarterlyReport |
| Namespace Prefix: |
dei_ |
| Data Type: |
xbrli:booleanItemType |
| Balance Type: |
na |
| Period Type: |
duration |
|
| X |
- DefinitionBoolean flag that is true only for a form used as a transition report. Reference 1: http://www.xbrl.org/2003/role/presentationRef
-Publisher SEC
-Name Forms 10-K, 10-Q, 20-F
-Number 240
-Section 13
-Subsection a-1
| Name: |
dei_DocumentTransitionReport |
| Namespace Prefix: |
dei_ |
| Data Type: |
xbrli:booleanItemType |
| Balance Type: |
na |
| Period Type: |
duration |
|
| X |
- DefinitionThe type of document being provided (such as 10-K, 10-Q, 485BPOS, etc). The document type is limited to the same value as the supporting SEC submission type, or the word 'Other'.
| Name: |
dei_DocumentType |
| Namespace Prefix: |
dei_ |
| Data Type: |
dei:submissionTypeItemType |
| Balance Type: |
na |
| Period Type: |
duration |
|
| X |
- DefinitionAddress Line 1 such as Attn, Building Name, Street Name
| Name: |
dei_EntityAddressAddressLine1 |
| Namespace Prefix: |
dei_ |
| Data Type: |
xbrli:normalizedStringItemType |
| Balance Type: |
na |
| Period Type: |
duration |
|
| X |
- Definition
+ References
+ Details
| Name: |
dei_EntityAddressCityOrTown |
| Namespace Prefix: |
dei_ |
| Data Type: |
xbrli:normalizedStringItemType |
| Balance Type: |
na |
| Period Type: |
duration |
|
| X |
- DefinitionCode for the postal or zip code
| Name: |
dei_EntityAddressPostalZipCode |
| Namespace Prefix: |
dei_ |
| Data Type: |
xbrli:normalizedStringItemType |
| Balance Type: |
na |
| Period Type: |
duration |
|
| X |
- DefinitionName of the state or province.
| Name: |
dei_EntityAddressStateOrProvince |
| Namespace Prefix: |
dei_ |
| Data Type: |
dei:stateOrProvinceItemType |
| Balance Type: |
na |
| Period Type: |
duration |
|
| X |
- DefinitionA unique 10-digit SEC-issued value to identify entities that have filed disclosures with the SEC. It is commonly abbreviated as CIK. Reference 1: http://www.xbrl.org/2003/role/presentationRef
-Publisher SEC
-Name Exchange Act
-Number 240
-Section 12
-Subsection b-2
| Name: |
dei_EntityCentralIndexKey |
| Namespace Prefix: |
dei_ |
| Data Type: |
dei:centralIndexKeyItemType |
| Balance Type: |
na |
| Period Type: |
duration |
|
| X |
- DefinitionIndicate number of shares or other units outstanding of each of registrant's classes of capital or common stock or other ownership interests, if and as stated on cover of related periodic report. Where multiple classes or units exist define each class/interest by adding class of stock items such as Common Class A [Member], Common Class B [Member] or Partnership Interest [Member] onto the Instrument [Domain] of the Entity Listings, Instrument.
| Name: |
dei_EntityCommonStockSharesOutstanding |
| Namespace Prefix: |
dei_ |
| Data Type: |
xbrli:sharesItemType |
| Balance Type: |
na |
| Period Type: |
instant |
|
| X |
- DefinitionIndicate 'Yes' or 'No' whether registrants (1) have filed all reports required to be filed by Section 13 or 15(d) of the Securities Exchange Act of 1934 during the preceding 12 months (or for such shorter period that registrants were required to file such reports), and (2) have been subject to such filing requirements for the past 90 days. This information should be based on the registrant's current or most recent filing containing the related disclosure.
| Name: |
dei_EntityCurrentReportingStatus |
| Namespace Prefix: |
dei_ |
| Data Type: |
dei:yesNoItemType |
| Balance Type: |
na |
| Period Type: |
duration |
|
| X |
- DefinitionIndicate if registrant meets the emerging growth company criteria. Reference 1: http://www.xbrl.org/2003/role/presentationRef
-Publisher SEC
-Name Exchange Act
-Number 240
-Section 12
-Subsection b-2
| Name: |
dei_EntityEmergingGrowthCompany |
| Namespace Prefix: |
dei_ |
| Data Type: |
xbrli:booleanItemType |
| Balance Type: |
na |
| Period Type: |
duration |
|
| X |
- DefinitionCommission file number. The field allows up to 17 characters. The prefix may contain 1-3 digits, the sequence number may contain 1-8 digits, the optional suffix may contain 1-4 characters, and the fields are separated with a hyphen.
| Name: |
dei_EntityFileNumber |
| Namespace Prefix: |
dei_ |
| Data Type: |
dei:fileNumberItemType |
| Balance Type: |
na |
| Period Type: |
duration |
|
| X |
- DefinitionIndicate whether the registrant is one of the following: Large Accelerated Filer, Accelerated Filer, Non-accelerated Filer. Definitions of these categories are stated in Rule 12b-2 of the Exchange Act. This information should be based on the registrant's current or most recent filing containing the related disclosure. Reference 1: http://www.xbrl.org/2003/role/presentationRef
-Publisher SEC
-Name Exchange Act
-Number 240
-Section 12
-Subsection b-2
| Name: |
dei_EntityFilerCategory |
| Namespace Prefix: |
dei_ |
| Data Type: |
dei:filerCategoryItemType |
| Balance Type: |
na |
| Period Type: |
duration |
|
| X |
- DefinitionTwo-character EDGAR code representing the state or country of incorporation.
| Name: |
dei_EntityIncorporationStateCountryCode |
| Namespace Prefix: |
dei_ |
| Data Type: |
dei:edgarStateCountryItemType |
| Balance Type: |
na |
| Period Type: |
duration |
|
| X |
- DefinitionBoolean flag that is true when the registrant has submitted electronically every Interactive Data File required to be submitted pursuant to Rule 405 of Regulation S-T during the preceding 12 months (or for such shorter period that the registrant was required to submit such files). Reference 1: http://www.xbrl.org/2003/role/presentationRef
-Publisher SEC
-Name Regulation S-T
-Number 232
-Section 405
| Name: |
dei_EntityInteractiveDataCurrent |
| Namespace Prefix: |
dei_ |
| Data Type: |
dei:yesNoItemType |
| Balance Type: |
na |
| Period Type: |
duration |
|
| X |
- DefinitionThe exact name of the entity filing the report as specified in its charter, which is required by forms filed with the SEC. Reference 1: http://www.xbrl.org/2003/role/presentationRef
-Publisher SEC
-Name Exchange Act
-Number 240
-Section 12
-Subsection b-2
| Name: |
dei_EntityRegistrantName |
| Namespace Prefix: |
dei_ |
| Data Type: |
xbrli:normalizedStringItemType |
| Balance Type: |
na |
| Period Type: |
duration |
|
| X |
- DefinitionBoolean flag that is true when the registrant is a shell company as defined in Rule 12b-2 of the Exchange Act. Reference 1: http://www.xbrl.org/2003/role/presentationRef
-Publisher SEC
-Name Exchange Act
-Number 240
-Section 12
-Subsection b-2
| Name: |
dei_EntityShellCompany |
| Namespace Prefix: |
dei_ |
| Data Type: |
xbrli:booleanItemType |
| Balance Type: |
na |
| Period Type: |
duration |
|
| X |
- DefinitionIndicates that the company is a Smaller Reporting Company (SRC). Reference 1: http://www.xbrl.org/2003/role/presentationRef
-Publisher SEC
-Name Exchange Act
-Number 240
-Section 12
-Subsection b-2
| Name: |
dei_EntitySmallBusiness |
| Namespace Prefix: |
dei_ |
| Data Type: |
xbrli:booleanItemType |
| Balance Type: |
na |
| Period Type: |
duration |
|
| X |
- DefinitionThe Tax Identification Number (TIN), also known as an Employer Identification Number (EIN), is a unique 9-digit value assigned by the IRS. Reference 1: http://www.xbrl.org/2003/role/presentationRef
-Publisher SEC
-Name Exchange Act
-Number 240
-Section 12
-Subsection b-2
| Name: |
dei_EntityTaxIdentificationNumber |
| Namespace Prefix: |
dei_ |
| Data Type: |
dei:employerIdItemType |
| Balance Type: |
na |
| Period Type: |
duration |
|
| X |
- DefinitionLocal phone number for entity.
| Name: |
dei_LocalPhoneNumber |
| Namespace Prefix: |
dei_ |
| Data Type: |
xbrli:normalizedStringItemType |
| Balance Type: |
na |
| Period Type: |
duration |
|
| X |
- DefinitionTitle of a 12(b) registered security. Reference 1: http://www.xbrl.org/2003/role/presentationRef
-Publisher SEC
-Name Exchange Act
-Number 240
-Section 12
-Subsection b
| Name: |
dei_Security12bTitle |
| Namespace Prefix: |
dei_ |
| Data Type: |
dei:securityTitleItemType |
| Balance Type: |
na |
| Period Type: |
duration |
|
| X |
- DefinitionName of the Exchange on which a security is registered. Reference 1: http://www.xbrl.org/2003/role/presentationRef
-Publisher SEC
-Name Exchange Act
-Number 240
-Section 12
-Subsection d1-1
| Name: |
dei_SecurityExchangeName |
| Namespace Prefix: |
dei_ |
| Data Type: |
dei:edgarExchangeCodeItemType |
| Balance Type: |
na |
| Period Type: |
duration |
|
| X |
- DefinitionTrading symbol of an instrument as listed on an exchange.
| Name: |
dei_TradingSymbol |
| Namespace Prefix: |
dei_ |
| Data Type: |
dei:tradingSymbolItemType |
| Balance Type: |
na |
| Period Type: |
duration |
|
v3.23.2
Condensed Consolidated Balance Sheets - USD ($)
|
Jun. 30, 2023 |
Dec. 31, 2022 |
| Current assets: |
|
|
| Cash |
$ 1,130,487
|
$ 2,696,481
|
| Accounts receivable, net |
1,326,986
|
1,121,083
|
| Accounts receivable, unbilled |
1,038,013
|
596,410
|
| Parts and supplies, net |
72,569
|
73,221
|
| Contract assets |
96,470
|
80,378
|
| Prepaid expenses and other current assets |
337,373
|
325,466
|
| Total current assets |
4,001,898
|
4,893,039
|
| Property and equipment, net |
1,024,776
|
1,068,706
|
| Right of use assets, operating |
2,895,784
|
3,200,191
|
| Right of use asset, finance |
170,194
|
154,282
|
| Intangible assets, net |
4,164,492
|
4,419,646
|
| Goodwill |
5,789,821
|
5,789,821
|
| Other assets |
540,121
|
417,457
|
| Total assets |
18,587,086
|
19,943,142
|
| Current liabilities: |
|
|
| Accounts payable |
356,545
|
370,300
|
| Accrued compensation |
336,317
|
411,683
|
| Accrued expenses |
181,961
|
114,902
|
| Lease liabilities, operating - current |
711,229
|
692,074
|
| Lease liability, finance - current |
28,303
|
22,493
|
| Deferred revenues |
2,067,744
|
2,754,064
|
| Earnout liabilities - current |
|
700,000
|
| Notes payable - current |
709,083
|
936,966
|
| Total current liabilities |
4,391,182
|
6,002,482
|
| Long-term liabilities: |
|
|
| Lease liabilities, operating - net of current portion |
2,307,326
|
2,624,608
|
| Lease liability, finance - net of current portion |
145,880
|
133,131
|
| Total long-term liabilities |
5,145,188
|
5,371,858
|
| Total liabilities |
9,536,370
|
11,374,340
|
| Stockholders’ equity: |
|
|
| Common stock, $0.001 par value, 25,000,000 shares authorized; 4,073,757 shares issued and outstanding at June 30, 2023 and December 31, 2022 |
4,074
|
4,074
|
| Additional paid-in capital |
30,412,634
|
30,179,017
|
| Accumulated deficit |
(21,365,992)
|
(21,614,289)
|
| Total stockholders’ equity |
9,050,716
|
8,568,802
|
| Total liabilities and stockholders’ equity |
18,587,086
|
19,943,142
|
| Nonrelated Party [Member] |
|
|
| Current liabilities: |
|
|
| Notes payable - current |
709,083
|
936,966
|
| Long-term liabilities: |
|
|
| Notes payable - related party |
2,147,139
|
2,085,035
|
| Related Party [Member] |
|
|
| Long-term liabilities: |
|
|
| Notes payable - related party |
$ 544,843
|
$ 529,084
|
| X |
- DefinitionEarnout liabilities current.
| Name: |
INLX_EarnoutLiabilitiesCurrent |
| Namespace Prefix: |
INLX_ |
| Data Type: |
xbrli:monetaryItemType |
| Balance Type: |
credit |
| Period Type: |
instant |
|
| X |
- DefinitionCarrying value as of the balance sheet date of liabilities incurred (and for which invoices have typically been received) and payable to vendors for goods and services received that are used in an entity's business. Used to reflect the current portion of the liabilities (due within one year or within the normal operating cycle if longer). Reference 1: http://www.xbrl.org/2003/role/exampleRef
-Topic 852
-SubTopic 10
-Name Accounting Standards Codification
-Section 55
-Paragraph 10
-Publisher FASB
-URI https://asc.fasb.org//1943274/2147481372/852-10-55-10
Reference 2: http://fasb.org/us-gaap/role/ref/legacyRef
-Name Accounting Standards Codification
-Topic 210
-SubTopic 10
-Section S99
-Paragraph 1
-Subparagraph (SX 210.5-02.19(a))
-Publisher FASB
-URI https://asc.fasb.org//1943274/2147480566/210-10-S99-1
| Name: |
us-gaap_AccountsPayableCurrent |
| Namespace Prefix: |
us-gaap_ |
| Data Type: |
xbrli:monetaryItemType |
| Balance Type: |
credit |
| Period Type: |
instant |
|
| X |
- DefinitionAmount, after allowance for credit loss, of right to consideration from customer for product sold and service rendered in normal course of business, classified as current. Reference 1: http://www.xbrl.org/2003/role/disclosureRef
-Topic 310
-SubTopic 10
-Name Accounting Standards Codification
-Section 45
-Paragraph 2
-Publisher FASB
-URI https://asc.fasb.org//1943274/2147481990/310-10-45-2
Reference 2: http://www.xbrl.org/2003/role/disclosureRef
-Topic 310
-SubTopic 10
-Name Accounting Standards Codification
-Section 45
-Paragraph 9
-Publisher FASB
-URI https://asc.fasb.org//1943274/2147481990/310-10-45-9
| Name: |
us-gaap_AccountsReceivableNetCurrent |
| Namespace Prefix: |
us-gaap_ |
| Data Type: |
xbrli:monetaryItemType |
| Balance Type: |
debit |
| Period Type: |
instant |
|
| X |
- DefinitionCarrying value as of the balance sheet date of obligations incurred and payable, pertaining to costs that are statutory in nature, are incurred on contractual obligations, or accumulate over time and for which invoices have not yet been received or will not be rendered. Examples include taxes, interest, rent and utilities. Used to reflect the current portion of the liabilities (due within one year or within the normal operating cycle if longer). Reference 1: http://fasb.org/us-gaap/role/ref/legacyRef
-Name Accounting Standards Codification
-Topic 210
-SubTopic 10
-Section S99
-Paragraph 1
-Subparagraph (SX 210.5-02.20)
-Publisher FASB
-URI https://asc.fasb.org//1943274/2147480566/210-10-S99-1
| Name: |
us-gaap_AccruedLiabilitiesCurrent |
| Namespace Prefix: |
us-gaap_ |
| Data Type: |
xbrli:monetaryItemType |
| Balance Type: |
credit |
| Period Type: |
instant |
|
| X |
- DefinitionValue received from shareholders in common stock-related transactions that are in excess of par value or stated value and amounts received from other stock-related transactions. Includes only common stock transactions (excludes preferred stock transactions). May be called contributed capital, capital in excess of par, capital surplus, or paid-in capital. Reference 1: http://fasb.org/us-gaap/role/ref/legacyRef
-Topic 210
-SubTopic 10
-Name Accounting Standards Codification
-Section S99
-Paragraph 1
-Subparagraph (SX 210.5-02(30)(a)(1))
-Publisher FASB
-URI https://asc.fasb.org//1943274/2147480566/210-10-S99-1
| Name: |
us-gaap_AdditionalPaidInCapitalCommonStock |
| Namespace Prefix: |
us-gaap_ |
| Data Type: |
xbrli:monetaryItemType |
| Balance Type: |
credit |
| Period Type: |
instant |
|
| X |
- DefinitionSum of the carrying amounts as of the balance sheet date of all assets that are recognized. Assets are probable future economic benefits obtained or controlled by an entity as a result of past transactions or events. Reference 1: http://www.xbrl.org/2003/role/disclosureRef
-Topic 810
-SubTopic 10
-Name Accounting Standards Codification
-Section 50
-Paragraph 3
-Subparagraph (bb)
-Publisher FASB
-URI https://asc.fasb.org//1943274/2147481203/810-10-50-3
Reference 2: http://www.xbrl.org/2003/role/disclosureRef
-Topic 810
-SubTopic 10
-Name Accounting Standards Codification
-Section 45
-Paragraph 25
-Subparagraph (a)
-Publisher FASB
-URI https://asc.fasb.org//1943274/2147481231/810-10-45-25
Reference 3: http://www.xbrl.org/2003/role/disclosureRef
-Topic 235
-SubTopic 10
-Name Accounting Standards Codification
-Section S99
-Paragraph 1
-Subparagraph (SX 210.4-08(g)(1)(ii))
-Publisher FASB
-URI https://asc.fasb.org//1943274/2147480678/235-10-S99-1
Reference 4: http://www.xbrl.org/2003/role/disclosureRef
-Topic 323
-SubTopic 10
-Name Accounting Standards Codification
-Section 50
-Paragraph 3
-Subparagraph (c)
-Publisher FASB
-URI https://asc.fasb.org//1943274/2147481687/323-10-50-3
Reference 5: http://www.xbrl.org/2003/role/disclosureRef
-Topic 825
-SubTopic 10
-Name Accounting Standards Codification
-Section 50
-Paragraph 28
-Subparagraph (f)
-Publisher FASB
-URI https://asc.fasb.org//1943274/2147482907/825-10-50-28
Reference 6: http://www.xbrl.org/2003/role/exampleRef
-Topic 852
-SubTopic 10
-Name Accounting Standards Codification
-Section 55
-Paragraph 10
-Publisher FASB
-URI https://asc.fasb.org//1943274/2147481372/852-10-55-10
Reference 7: http://www.xbrl.org/2003/role/exampleRef
-Topic 946
-SubTopic 830
-Name Accounting Standards Codification
-Section 55
-Paragraph 12
-Publisher FASB
-URI https://asc.fasb.org//1943274/2147480167/946-830-55-12
Reference 8: http://www.xbrl.org/2003/role/disclosureRef
-Topic 944
-SubTopic 210
-Name Accounting Standards Codification
-Section S99
-Paragraph 1
-Subparagraph (SX 210.7-03(a)(12))
-Publisher FASB
-URI https://asc.fasb.org//1943274/2147479440/944-210-S99-1
Reference 9: http://www.xbrl.org/2003/role/disclosureRef
-Topic 280
-SubTopic 10
-Name Accounting Standards Codification
-Section 50
-Paragraph 22
-Publisher FASB
-URI https://asc.fasb.org//1943274/2147482810/280-10-50-22
Reference 10: http://www.xbrl.org/2003/role/disclosureRef
-Topic 946
-SubTopic 210
-Name Accounting Standards Codification
-Section S99
-Paragraph 1
-Subparagraph (SX 210.6-04(8))
-Publisher FASB
-URI https://asc.fasb.org//1943274/2147479617/946-210-S99-1
Reference 11: http://www.xbrl.org/2003/role/disclosureRef
-Topic 210
-SubTopic 10
-Name Accounting Standards Codification
-Section S99
-Paragraph 1
-Subparagraph (SX 210.5-02(18))
-Publisher FASB
-URI https://asc.fasb.org//1943274/2147480566/210-10-S99-1
Reference 12: http://www.xbrl.org/2003/role/disclosureRef
-Topic 470
-SubTopic 10
-Name Accounting Standards Codification
-Section S99
-Paragraph 1A
-Subparagraph (SX 210.13-01(a)(4)(i))
-Publisher FASB
-URI https://asc.fasb.org//1943274/2147480097/470-10-S99-1A
Reference 13: http://www.xbrl.org/2009/role/commonPracticeRef
-Topic 470
-SubTopic 10
-Name Accounting Standards Codification
-Section S99
-Paragraph 1A
-Subparagraph (SX 210.13-01(a)(4)(ii))
-Publisher FASB
-URI https://asc.fasb.org//1943274/2147480097/470-10-S99-1A
Reference 14: http://www.xbrl.org/2009/role/commonPracticeRef
-Topic 470
-SubTopic 10
-Name Accounting Standards Codification
-Section S99
-Paragraph 1A
-Subparagraph (SX 210.13-01(a)(4)(iii))
-Publisher FASB
-URI https://asc.fasb.org//1943274/2147480097/470-10-S99-1A
Reference 15: http://www.xbrl.org/2003/role/disclosureRef
-Topic 470
-SubTopic 10
-Name Accounting Standards Codification
-Section S99
-Paragraph 1A
-Subparagraph (SX 210.13-01(a)(4)(iii)(A))
-Publisher FASB
-URI https://asc.fasb.org//1943274/2147480097/470-10-S99-1A
Reference 16: http://www.xbrl.org/2003/role/disclosureRef
-Topic 470
-SubTopic 10
-Name Accounting Standards Codification
-Section S99
-Paragraph 1A
-Subparagraph (SX 210.13-01(a)(4)(iv))
-Publisher FASB
-URI https://asc.fasb.org//1943274/2147480097/470-10-S99-1A
Reference 17: http://www.xbrl.org/2003/role/disclosureRef
-Topic 470
-SubTopic 10
-Name Accounting Standards Codification
-Section S99
-Paragraph 1A
-Subparagraph (SX 210.13-01(a)(5))
-Publisher FASB
-URI https://asc.fasb.org//1943274/2147480097/470-10-S99-1A
Reference 18: http://www.xbrl.org/2003/role/disclosureRef
-Topic 470
-SubTopic 10
-Name Accounting Standards Codification
-Section S99
-Paragraph 1B
-Subparagraph (SX 210.13-02(a)(4)(i))
-Publisher FASB
-URI https://asc.fasb.org//1943274/2147480097/470-10-S99-1B
Reference 19: http://www.xbrl.org/2003/role/disclosureRef
-Topic 470
-SubTopic 10
-Name Accounting Standards Codification
-Section S99
-Paragraph 1B
-Subparagraph (SX 210.13-02(a)(4)(iii)(A))
-Publisher FASB
-URI https://asc.fasb.org//1943274/2147480097/470-10-S99-1B
Reference 20: http://www.xbrl.org/2003/role/disclosureRef
-Topic 470
-SubTopic 10
-Name Accounting Standards Codification
-Section S99
-Paragraph 1B
-Subparagraph (SX 210.13-02(a)(4)(iii)(B))
-Publisher FASB
-URI https://asc.fasb.org//1943274/2147480097/470-10-S99-1B
Reference 21: http://www.xbrl.org/2003/role/disclosureRef
-Topic 470
-SubTopic 10
-Name Accounting Standards Codification
-Section S99
-Paragraph 1B
-Subparagraph (SX 210.13-02(a)(4)(iv))
-Publisher FASB
-URI https://asc.fasb.org//1943274/2147480097/470-10-S99-1B
Reference 22: http://www.xbrl.org/2003/role/disclosureRef
-Topic 470
-SubTopic 10
-Name Accounting Standards Codification
-Section S99
-Paragraph 1B
-Subparagraph (SX 210.13-02(a)(5))
-Publisher FASB
-URI https://asc.fasb.org//1943274/2147480097/470-10-S99-1B
Reference 23: http://www.xbrl.org/2009/role/commonPracticeRef
-Topic 852
-SubTopic 10
-Name Accounting Standards Codification
-Section 50
-Paragraph 7
-Subparagraph (a)
-Publisher FASB
-URI https://asc.fasb.org//1943274/2147481404/852-10-50-7
Reference 24: http://www.xbrl.org/2003/role/disclosureRef
-Topic 280
-SubTopic 10
-Name Accounting Standards Codification
-Section 50
-Paragraph 30
-Subparagraph (c)
-Publisher FASB
-URI https://asc.fasb.org//1943274/2147482810/280-10-50-30
Reference 25: http://www.xbrl.org/2003/role/disclosureRef
-Topic 280
-SubTopic 10
-Name Accounting Standards Codification
-Section 50
-Paragraph 32
-Subparagraph (d)
-Publisher FASB
-URI https://asc.fasb.org//1943274/2147482810/280-10-50-32
Reference 26: http://fasb.org/us-gaap/role/ref/legacyRef
-Topic 942
-SubTopic 210
-Name Accounting Standards Codification
-Section S99
-Paragraph 1
-Subparagraph (SX 210.9-03(11))
-Publisher FASB
-URI https://asc.fasb.org//1943274/2147479853/942-210-S99-1
| Name: |
us-gaap_Assets |
| Namespace Prefix: |
us-gaap_ |
| Data Type: |
xbrli:monetaryItemType |
| Balance Type: |
debit |
| Period Type: |
instant |
|
| X |
- DefinitionSum of the carrying amounts as of the balance sheet date of all assets that are expected to be realized in cash, sold, or consumed within one year (or the normal operating cycle, if longer). Assets are probable future economic benefits obtained or controlled by an entity as a result of past transactions or events. Reference 1: http://www.xbrl.org/2003/role/disclosureRef
-Topic 810
-SubTopic 10
-Name Accounting Standards Codification
-Section 50
-Paragraph 3
-Subparagraph (bb)
-Publisher FASB
-URI https://asc.fasb.org//1943274/2147481203/810-10-50-3
Reference 2: http://www.xbrl.org/2003/role/disclosureRef
-Topic 810
-SubTopic 10
-Name Accounting Standards Codification
-Section 45
-Paragraph 25
-Subparagraph (a)
-Publisher FASB
-URI https://asc.fasb.org//1943274/2147481231/810-10-45-25
Reference 3: http://www.xbrl.org/2003/role/disclosureRef
-Topic 235
-SubTopic 10
-Name Accounting Standards Codification
-Section S99
-Paragraph 1
-Subparagraph (SX 210.4-08(g)(1)(ii))
-Publisher FASB
-URI https://asc.fasb.org//1943274/2147480678/235-10-S99-1
Reference 4: http://www.xbrl.org/2003/role/disclosureRef
-Topic 323
-SubTopic 10
-Name Accounting Standards Codification
-Section 50
-Paragraph 3
-Subparagraph (c)
-Publisher FASB
-URI https://asc.fasb.org//1943274/2147481687/323-10-50-3
Reference 5: http://www.xbrl.org/2003/role/disclosureRef
-Topic 825
-SubTopic 10
-Name Accounting Standards Codification
-Section 50
-Paragraph 28
-Subparagraph (f)
-Publisher FASB
-URI https://asc.fasb.org//1943274/2147482907/825-10-50-28
Reference 6: http://www.xbrl.org/2003/role/exampleRef
-Topic 852
-SubTopic 10
-Name Accounting Standards Codification
-Section 55
-Paragraph 10
-Publisher FASB
-URI https://asc.fasb.org//1943274/2147481372/852-10-55-10
Reference 7: http://www.xbrl.org/2003/role/disclosureRef
-Topic 210
-SubTopic 10
-Name Accounting Standards Codification
-Section 45
-Paragraph 1
-Publisher FASB
-URI https://asc.fasb.org//1943274/2147483467/210-10-45-1
Reference 8: http://www.xbrl.org/2003/role/disclosureRef
-Topic 210
-SubTopic 10
-Name Accounting Standards Codification
-Section S99
-Paragraph 1
-Subparagraph (SX 210.5-02(9))
-Publisher FASB
-URI https://asc.fasb.org//1943274/2147480566/210-10-S99-1
Reference 9: http://www.xbrl.org/2003/role/disclosureRef
-Topic 470
-SubTopic 10
-Name Accounting Standards Codification
-Section S99
-Paragraph 1A
-Subparagraph (SX 210.13-01(a)(4)(i))
-Publisher FASB
-URI https://asc.fasb.org//1943274/2147480097/470-10-S99-1A
Reference 10: http://www.xbrl.org/2009/role/commonPracticeRef
-Topic 470
-SubTopic 10
-Name Accounting Standards Codification
-Section S99
-Paragraph 1A
-Subparagraph (SX 210.13-01(a)(4)(ii))
-Publisher FASB
-URI https://asc.fasb.org//1943274/2147480097/470-10-S99-1A
Reference 11: http://www.xbrl.org/2009/role/commonPracticeRef
-Topic 470
-SubTopic 10
-Name Accounting Standards Codification
-Section S99
-Paragraph 1A
-Subparagraph (SX 210.13-01(a)(4)(iii))
-Publisher FASB
-URI https://asc.fasb.org//1943274/2147480097/470-10-S99-1A
Reference 12: http://www.xbrl.org/2003/role/disclosureRef
-Topic 470
-SubTopic 10
-Name Accounting Standards Codification
-Section S99
-Paragraph 1A
-Subparagraph (SX 210.13-01(a)(4)(iii)(A))
-Publisher FASB
-URI https://asc.fasb.org//1943274/2147480097/470-10-S99-1A
Reference 13: http://www.xbrl.org/2003/role/disclosureRef
-Topic 470
-SubTopic 10
-Name Accounting Standards Codification
-Section S99
-Paragraph 1A
-Subparagraph (SX 210.13-01(a)(4)(iv))
-Publisher FASB
-URI https://asc.fasb.org//1943274/2147480097/470-10-S99-1A
Reference 14: http://www.xbrl.org/2003/role/disclosureRef
-Topic 470
-SubTopic 10
-Name Accounting Standards Codification
-Section S99
-Paragraph 1A
-Subparagraph (SX 210.13-01(a)(5))
-Publisher FASB
-URI https://asc.fasb.org//1943274/2147480097/470-10-S99-1A
Reference 15: http://www.xbrl.org/2003/role/disclosureRef
-Topic 470
-SubTopic 10
-Name Accounting Standards Codification
-Section S99
-Paragraph 1B
-Subparagraph (SX 210.13-02(a)(4)(i))
-Publisher FASB
-URI https://asc.fasb.org//1943274/2147480097/470-10-S99-1B
Reference 16: http://www.xbrl.org/2003/role/disclosureRef
-Topic 470
-SubTopic 10
-Name Accounting Standards Codification
-Section S99
-Paragraph 1B
-Subparagraph (SX 210.13-02(a)(4)(iii)(A))
-Publisher FASB
-URI https://asc.fasb.org//1943274/2147480097/470-10-S99-1B
Reference 17: http://www.xbrl.org/2003/role/disclosureRef
-Topic 470
-SubTopic 10
-Name Accounting Standards Codification
-Section S99
-Paragraph 1B
-Subparagraph (SX 210.13-02(a)(4)(iii)(B))
-Publisher FASB
-URI https://asc.fasb.org//1943274/2147480097/470-10-S99-1B
Reference 18: http://www.xbrl.org/2003/role/disclosureRef
-Topic 470
-SubTopic 10
-Name Accounting Standards Codification
-Section S99
-Paragraph 1B
-Subparagraph (SX 210.13-02(a)(4)(iv))
-Publisher FASB
-URI https://asc.fasb.org//1943274/2147480097/470-10-S99-1B
Reference 19: http://www.xbrl.org/2003/role/disclosureRef
-Topic 470
-SubTopic 10
-Name Accounting Standards Codification
-Section S99
-Paragraph 1B
-Subparagraph (SX 210.13-02(a)(5))
-Publisher FASB
-URI https://asc.fasb.org//1943274/2147480097/470-10-S99-1B
Reference 20: http://www.xbrl.org/2009/role/commonPracticeRef
-Topic 852
-SubTopic 10
-Name Accounting Standards Codification
-Section 50
-Paragraph 7
-Subparagraph (a)
-Publisher FASB
-URI https://asc.fasb.org//1943274/2147481404/852-10-50-7
| Name: |
us-gaap_AssetsCurrent |
| Namespace Prefix: |
us-gaap_ |
| Data Type: |
xbrli:monetaryItemType |
| Balance Type: |
debit |
| Period Type: |
instant |
|
| X |
- References
+ Details
| Name: |
us-gaap_AssetsCurrentAbstract |
| Namespace Prefix: |
us-gaap_ |
| Data Type: |
xbrli:stringItemType |
| Balance Type: |
na |
| Period Type: |
duration |
|
| X |
- DefinitionAmount of currency on hand as well as demand deposits with banks or financial institutions. Includes other kinds of accounts that have the general characteristics of demand deposits. Also includes short-term, highly liquid investments that are both readily convertible to known amounts of cash and so near their maturity that they present insignificant risk of changes in value because of changes in interest rates. Excludes cash and cash equivalents within disposal group and discontinued operation. Reference 1: http://www.xbrl.org/2003/role/disclosureRef
-Topic 210
-SubTopic 10
-Name Accounting Standards Codification
-Section S99
-Paragraph 1
-Subparagraph (SX 210.5-02(1))
-Publisher FASB
-URI https://asc.fasb.org//1943274/2147480566/210-10-S99-1
Reference 2: http://www.xbrl.org/2003/role/exampleRef
-Topic 210
-SubTopic 10
-Name Accounting Standards Codification
-Section 45
-Paragraph 1
-Subparagraph (a)
-Publisher FASB
-URI https://asc.fasb.org//1943274/2147483467/210-10-45-1
Reference 3: http://fasb.org/us-gaap/role/ref/legacyRef
-Name Accounting Standards Codification
-Topic 230
-SubTopic 10
-Section 45
-Paragraph 4
-Publisher FASB
-URI https://asc.fasb.org//1943274/2147482740/230-10-45-4
| Name: |
us-gaap_CashAndCashEquivalentsAtCarryingValue |
| Namespace Prefix: |
us-gaap_ |
| Data Type: |
xbrli:monetaryItemType |
| Balance Type: |
debit |
| Period Type: |
instant |
|
| X |
- DefinitionAggregate par or stated value of issued nonredeemable common stock (or common stock redeemable solely at the option of the issuer). This item includes treasury stock repurchased by the entity. Note: elements for number of nonredeemable common shares, par value and other disclosure concepts are in another section within stockholders' equity. Reference 1: http://www.xbrl.org/2003/role/exampleRef
-Topic 852
-SubTopic 10
-Name Accounting Standards Codification
-Section 55
-Paragraph 10
-Publisher FASB
-URI https://asc.fasb.org//1943274/2147481372/852-10-55-10
Reference 2: http://www.xbrl.org/2003/role/disclosureRef
-Topic 944
-SubTopic 210
-Name Accounting Standards Codification
-Section S99
-Paragraph 1
-Subparagraph (SX 210.7-03(a)(22))
-Publisher FASB
-URI https://asc.fasb.org//1943274/2147479440/944-210-S99-1
Reference 3: http://fasb.org/us-gaap/role/ref/legacyRef
-Topic 210
-SubTopic 10
-Name Accounting Standards Codification
-Section S99
-Paragraph 1
-Subparagraph (SX 210.5-02(29))
-Publisher FASB
-URI https://asc.fasb.org//1943274/2147480566/210-10-S99-1
| Name: |
us-gaap_CommonStockValue |
| Namespace Prefix: |
us-gaap_ |
| Data Type: |
xbrli:monetaryItemType |
| Balance Type: |
credit |
| Period Type: |
instant |
|
| X |
- DefinitionAmount, after allowance for credit loss, of right to consideration in exchange for good or service transferred to customer when right is conditioned on something other than passage of time, classified as current. Reference 1: http://www.xbrl.org/2003/role/disclosureRef
-Topic 606
-SubTopic 10
-Name Accounting Standards Codification
-Section 45
-Paragraph 3
-Publisher FASB
-URI https://asc.fasb.org//1943274/2147479837/606-10-45-3
Reference 2: http://www.xbrl.org/2003/role/disclosureRef
-Topic 606
-SubTopic 10
-Name Accounting Standards Codification
-Section 45
-Paragraph 1
-Publisher FASB
-URI https://asc.fasb.org//1943274/2147479837/606-10-45-1
Reference 3: http://www.xbrl.org/2003/role/disclosureRef
-Topic 606
-SubTopic 10
-Name Accounting Standards Codification
-Section 50
-Paragraph 8
-Subparagraph (a)
-Publisher FASB
-URI https://asc.fasb.org//1943274/2147479806/606-10-50-8
| Name: |
us-gaap_ContractWithCustomerAssetNetCurrent |
| Namespace Prefix: |
us-gaap_ |
| Data Type: |
xbrli:monetaryItemType |
| Balance Type: |
debit |
| Period Type: |
instant |
|
| X |
- DefinitionAmount of obligation to transfer good or service to customer for which consideration has been received or is receivable, classified as current. Reference 1: http://www.xbrl.org/2003/role/disclosureRef
-Topic 606
-SubTopic 10
-Name Accounting Standards Codification
-Section 45
-Paragraph 1
-Publisher FASB
-URI https://asc.fasb.org//1943274/2147479837/606-10-45-1
Reference 2: http://www.xbrl.org/2003/role/disclosureRef
-Topic 606
-SubTopic 10
-Name Accounting Standards Codification
-Section 50
-Paragraph 8
-Subparagraph (a)
-Publisher FASB
-URI https://asc.fasb.org//1943274/2147479806/606-10-50-8
Reference 3: http://www.xbrl.org/2003/role/disclosureRef
-Topic 606
-SubTopic 10
-Name Accounting Standards Codification
-Section 45
-Paragraph 2
-Publisher FASB
-URI https://asc.fasb.org//1943274/2147479837/606-10-45-2
| Name: |
us-gaap_ContractWithCustomerLiabilityCurrent |
| Namespace Prefix: |
us-gaap_ |
| Data Type: |
xbrli:monetaryItemType |
| Balance Type: |
credit |
| Period Type: |
instant |
|
| X |
- DefinitionPresent value of lessee's discounted obligation for lease payments from finance lease, classified as current. Reference 1: http://www.xbrl.org/2003/role/disclosureRef
-Topic 842
-SubTopic 20
-Name Accounting Standards Codification
-Section 45
-Paragraph 1
-Subparagraph (b)
-Publisher FASB
-URI https://asc.fasb.org//1943274/2147479041/842-20-45-1
| Name: |
us-gaap_FinanceLeaseLiabilityCurrent |
| Namespace Prefix: |
us-gaap_ |
| Data Type: |
xbrli:monetaryItemType |
| Balance Type: |
credit |
| Period Type: |
instant |
|
| X |
- DefinitionPresent value of lessee's discounted obligation for lease payments from finance lease, classified as noncurrent. Reference 1: http://www.xbrl.org/2003/role/disclosureRef
-Topic 842
-SubTopic 20
-Name Accounting Standards Codification
-Section 45
-Paragraph 1
-Subparagraph (b)
-Publisher FASB
-URI https://asc.fasb.org//1943274/2147479041/842-20-45-1
| Name: |
us-gaap_FinanceLeaseLiabilityNoncurrent |
| Namespace Prefix: |
us-gaap_ |
| Data Type: |
xbrli:monetaryItemType |
| Balance Type: |
credit |
| Period Type: |
instant |
|
| X |
- DefinitionAmount, after accumulated amortization, of right-of-use asset from finance lease. Reference 1: http://www.xbrl.org/2003/role/disclosureRef
-Topic 842
-SubTopic 20
-Name Accounting Standards Codification
-Section 45
-Paragraph 1
-Subparagraph (a)
-Publisher FASB
-URI https://asc.fasb.org//1943274/2147479041/842-20-45-1
| Name: |
us-gaap_FinanceLeaseRightOfUseAsset |
| Namespace Prefix: |
us-gaap_ |
| Data Type: |
xbrli:monetaryItemType |
| Balance Type: |
debit |
| Period Type: |
instant |
|
| X |
- DefinitionAmount after accumulated impairment loss of an asset representing future economic benefits arising from other assets acquired in a business combination that are not individually identified and separately recognized. Reference 1: http://www.xbrl.org/2003/role/exampleRef
-Topic 852
-SubTopic 10
-Name Accounting Standards Codification
-Section 55
-Paragraph 10
-Publisher FASB
-URI https://asc.fasb.org//1943274/2147481372/852-10-55-10
Reference 2: http://www.xbrl.org/2003/role/exampleRef
-Topic 350
-SubTopic 20
-Name Accounting Standards Codification
-Section 55
-Paragraph 24
-Publisher FASB
-URI https://asc.fasb.org//1943274/2147482548/350-20-55-24
Reference 3: http://www.xbrl.org/2003/role/disclosureRef
-Topic 210
-SubTopic 10
-Name Accounting Standards Codification
-Section S99
-Paragraph 1
-Subparagraph (SX 210.5-02(15))
-Publisher FASB
-URI https://asc.fasb.org//1943274/2147480566/210-10-S99-1
Reference 4: http://www.xbrl.org/2003/role/disclosureRef
-Topic 350
-SubTopic 20
-Name Accounting Standards Codification
-Section 45
-Paragraph 1
-Publisher FASB
-URI https://asc.fasb.org//1943274/2147482598/350-20-45-1
Reference 5: http://www.xbrl.org/2009/role/commonPracticeRef
-Topic 350
-SubTopic 20
-Name Accounting Standards Codification
-Section 50
-Paragraph 1
-Subparagraph (a)
-Publisher FASB
-URI https://asc.fasb.org//1943274/2147482573/350-20-50-1
Reference 6: http://www.xbrl.org/2009/role/commonPracticeRef
-Topic 350
-SubTopic 20
-Name Accounting Standards Codification
-Section 50
-Paragraph 1
-Subparagraph (h)
-Publisher FASB
-URI https://asc.fasb.org//1943274/2147482573/350-20-50-1
Reference 7: http://www.xbrl.org/2003/role/disclosureRef
-Topic 942
-SubTopic 210
-Name Accounting Standards Codification
-Section S99
-Paragraph 1
-Subparagraph (SX 210.9-03(10)(1))
-Publisher FASB
-URI https://asc.fasb.org//1943274/2147479853/942-210-S99-1
| Name: |
us-gaap_Goodwill |
| Namespace Prefix: |
us-gaap_ |
| Data Type: |
xbrli:monetaryItemType |
| Balance Type: |
debit |
| Period Type: |
instant |
|
| X |
- DefinitionSum of the carrying amounts of all intangible assets, excluding goodwill, as of the balance sheet date, net of accumulated amortization and impairment charges. Reference 1: http://fasb.org/us-gaap/role/ref/legacyRef
-Name Accounting Standards Codification
-Topic 350
-SubTopic 30
-Section 50
-Paragraph 2
-Subparagraph ((a)(1),(b))
-Publisher FASB
-URI https://asc.fasb.org//1943274/2147482665/350-30-50-2
Reference 2: http://fasb.org/us-gaap/role/ref/legacyRef
-Name Accounting Standards Codification
-Topic 350
-SubTopic 30
-Section 45
-Paragraph 1
-Publisher FASB
-URI https://asc.fasb.org//1943274/2147482686/350-30-45-1
| Name: |
us-gaap_IntangibleAssetsNetExcludingGoodwill |
| Namespace Prefix: |
us-gaap_ |
| Data Type: |
xbrli:monetaryItemType |
| Balance Type: |
debit |
| Period Type: |
instant |
|
| X |
- DefinitionAmount after valuation and LIFO reserves of inventory expected to be sold, or consumed within one year or operating cycle, if longer. Reference 1: http://www.xbrl.org/2003/role/exampleRef
-Topic 852
-SubTopic 10
-Name Accounting Standards Codification
-Section 55
-Paragraph 10
-Publisher FASB
-URI https://asc.fasb.org//1943274/2147481372/852-10-55-10
Reference 2: http://www.xbrl.org/2003/role/exampleRef
-Topic 210
-SubTopic 10
-Name Accounting Standards Codification
-Section 45
-Paragraph 1
-Subparagraph (b)
-Publisher FASB
-URI https://asc.fasb.org//1943274/2147483467/210-10-45-1
Reference 3: http://www.xbrl.org/2003/role/disclosureRef
-Topic 210
-SubTopic 10
-Name Accounting Standards Codification
-Section S99
-Paragraph 1
-Subparagraph (SX 210.5-02(6))
-Publisher FASB
-URI https://asc.fasb.org//1943274/2147480566/210-10-S99-1
| Name: |
us-gaap_InventoryNet |
| Namespace Prefix: |
us-gaap_ |
| Data Type: |
xbrli:monetaryItemType |
| Balance Type: |
debit |
| Period Type: |
instant |
|
| X |
- DefinitionSum of the carrying amounts as of the balance sheet date of all liabilities that are recognized. Liabilities are probable future sacrifices of economic benefits arising from present obligations of an entity to transfer assets or provide services to other entities in the future. Reference 1: http://www.xbrl.org/2003/role/disclosureRef
-Topic 810
-SubTopic 10
-Name Accounting Standards Codification
-Section 50
-Paragraph 3
-Subparagraph (c)
-Publisher FASB
-URI https://asc.fasb.org//1943274/2147481203/810-10-50-3
Reference 2: http://www.xbrl.org/2003/role/disclosureRef
-Topic 810
-SubTopic 10
-Name Accounting Standards Codification
-Section 45
-Paragraph 25
-Subparagraph (b)
-Publisher FASB
-URI https://asc.fasb.org//1943274/2147481231/810-10-45-25
Reference 3: http://www.xbrl.org/2003/role/disclosureRef
-Topic 810
-SubTopic 10
-Name Accounting Standards Codification
-Section 50
-Paragraph 3
-Subparagraph (bb)
-Publisher FASB
-URI https://asc.fasb.org//1943274/2147481203/810-10-50-3
Reference 4: http://www.xbrl.org/2003/role/disclosureRef
-Topic 235
-SubTopic 10
-Name Accounting Standards Codification
-Section S99
-Paragraph 1
-Subparagraph (SX 210.4-08(g)(1)(ii))
-Publisher FASB
-URI https://asc.fasb.org//1943274/2147480678/235-10-S99-1
Reference 5: http://www.xbrl.org/2003/role/disclosureRef
-Topic 323
-SubTopic 10
-Name Accounting Standards Codification
-Section 50
-Paragraph 3
-Subparagraph (c)
-Publisher FASB
-URI https://asc.fasb.org//1943274/2147481687/323-10-50-3
Reference 6: http://www.xbrl.org/2003/role/disclosureRef
-Topic 825
-SubTopic 10
-Name Accounting Standards Codification
-Section 50
-Paragraph 28
-Subparagraph (f)
-Publisher FASB
-URI https://asc.fasb.org//1943274/2147482907/825-10-50-28
Reference 7: http://www.xbrl.org/2003/role/exampleRef
-Topic 946
-SubTopic 830
-Name Accounting Standards Codification
-Section 55
-Paragraph 12
-Publisher FASB
-URI https://asc.fasb.org//1943274/2147480167/946-830-55-12
Reference 8: http://www.xbrl.org/2003/role/disclosureRef
-Topic 946
-SubTopic 210
-Name Accounting Standards Codification
-Section S99
-Paragraph 1
-Subparagraph (SX 210.6-04(14))
-Publisher FASB
-URI https://asc.fasb.org//1943274/2147479617/946-210-S99-1
Reference 9: http://www.xbrl.org/2003/role/disclosureRef
-Topic 470
-SubTopic 10
-Name Accounting Standards Codification
-Section S99
-Paragraph 1A
-Subparagraph (SX 210.13-01(a)(4)(i))
-Publisher FASB
-URI https://asc.fasb.org//1943274/2147480097/470-10-S99-1A
Reference 10: http://www.xbrl.org/2009/role/commonPracticeRef
-Topic 470
-SubTopic 10
-Name Accounting Standards Codification
-Section S99
-Paragraph 1A
-Subparagraph (SX 210.13-01(a)(4)(ii))
-Publisher FASB
-URI https://asc.fasb.org//1943274/2147480097/470-10-S99-1A
Reference 11: http://www.xbrl.org/2003/role/disclosureRef
-Topic 470
-SubTopic 10
-Name Accounting Standards Codification
-Section S99
-Paragraph 1A
-Subparagraph (SX 210.13-01(a)(4)(iii)(A))
-Publisher FASB
-URI https://asc.fasb.org//1943274/2147480097/470-10-S99-1A
Reference 12: http://www.xbrl.org/2003/role/disclosureRef
-Topic 470
-SubTopic 10
-Name Accounting Standards Codification
-Section S99
-Paragraph 1A
-Subparagraph (SX 210.13-01(a)(4)(iv))
-Publisher FASB
-URI https://asc.fasb.org//1943274/2147480097/470-10-S99-1A
Reference 13: http://www.xbrl.org/2003/role/disclosureRef
-Topic 470
-SubTopic 10
-Name Accounting Standards Codification
-Section S99
-Paragraph 1A
-Subparagraph (SX 210.13-01(a)(5))
-Publisher FASB
-URI https://asc.fasb.org//1943274/2147480097/470-10-S99-1A
Reference 14: http://www.xbrl.org/2003/role/disclosureRef
-Topic 470
-SubTopic 10
-Name Accounting Standards Codification
-Section S99
-Paragraph 1B
-Subparagraph (SX 210.13-02(a)(4)(i))
-Publisher FASB
-URI https://asc.fasb.org//1943274/2147480097/470-10-S99-1B
Reference 15: http://www.xbrl.org/2003/role/disclosureRef
-Topic 470
-SubTopic 10
-Name Accounting Standards Codification
-Section S99
-Paragraph 1B
-Subparagraph (SX 210.13-02(a)(4)(iii)(A))
-Publisher FASB
-URI https://asc.fasb.org//1943274/2147480097/470-10-S99-1B
Reference 16: http://www.xbrl.org/2003/role/disclosureRef
-Topic 470
-SubTopic 10
-Name Accounting Standards Codification
-Section S99
-Paragraph 1B
-Subparagraph (SX 210.13-02(a)(4)(iii)(B))
-Publisher FASB
-URI https://asc.fasb.org//1943274/2147480097/470-10-S99-1B
Reference 17: http://www.xbrl.org/2003/role/disclosureRef
-Topic 470
-SubTopic 10
-Name Accounting Standards Codification
-Section S99
-Paragraph 1B
-Subparagraph (SX 210.13-02(a)(4)(iv))
-Publisher FASB
-URI https://asc.fasb.org//1943274/2147480097/470-10-S99-1B
Reference 18: http://www.xbrl.org/2003/role/disclosureRef
-Topic 470
-SubTopic 10
-Name Accounting Standards Codification
-Section S99
-Paragraph 1B
-Subparagraph (SX 210.13-02(a)(5))
-Publisher FASB
-URI https://asc.fasb.org//1943274/2147480097/470-10-S99-1B
Reference 19: http://www.xbrl.org/2009/role/commonPracticeRef
-Topic 852
-SubTopic 10
-Name Accounting Standards Codification
-Section 50
-Paragraph 7
-Subparagraph (a)
-Publisher FASB
-URI https://asc.fasb.org//1943274/2147481404/852-10-50-7
Reference 20: http://www.xbrl.org/2009/role/commonPracticeRef
-Topic 852
-SubTopic 10
-Name Accounting Standards Codification
-Section 50
-Paragraph 7
-Subparagraph (b)
-Publisher FASB
-URI https://asc.fasb.org//1943274/2147481404/852-10-50-7
Reference 21: http://www.xbrl.org/2003/role/exampleRef
-Topic 280
-SubTopic 10
-Name Accounting Standards Codification
-Section 50
-Paragraph 30
-Subparagraph (d)
-Publisher FASB
-URI https://asc.fasb.org//1943274/2147482810/280-10-50-30
Reference 22: http://fasb.org/us-gaap/role/ref/legacyRef
-Name Accounting Standards Codification
-Topic 210
-SubTopic 10
-Section S99
-Paragraph 1
-Subparagraph (SX 210.5-02.19-26)
-Publisher FASB
-URI https://asc.fasb.org//1943274/2147480566/210-10-S99-1
| Name: |
us-gaap_Liabilities |
| Namespace Prefix: |
us-gaap_ |
| Data Type: |
xbrli:monetaryItemType |
| Balance Type: |
credit |
| Period Type: |
instant |
|
| X |
- DefinitionAmount of liabilities and equity items, including the portion of equity attributable to noncontrolling interests, if any. Reference 1: http://www.xbrl.org/2003/role/exampleRef
-Topic 852
-SubTopic 10
-Name Accounting Standards Codification
-Section 55
-Paragraph 10
-Publisher FASB
-URI https://asc.fasb.org//1943274/2147481372/852-10-55-10
Reference 2: http://www.xbrl.org/2003/role/disclosureRef
-Topic 944
-SubTopic 210
-Name Accounting Standards Codification
-Section S99
-Paragraph 1
-Subparagraph (SX 210.7-03(a)(25))
-Publisher FASB
-URI https://asc.fasb.org//1943274/2147479440/944-210-S99-1
Reference 3: http://www.xbrl.org/2009/role/commonPracticeRef
-Topic 235
-SubTopic 10
-Name Accounting Standards Codification
-Section S99
-Paragraph 1
-Subparagraph (SX 210.4-08(g)(1)(ii))
-Publisher FASB
-URI https://asc.fasb.org//1943274/2147480678/235-10-S99-1
Reference 4: http://www.xbrl.org/2009/role/commonPracticeRef
-Topic 323
-SubTopic 10
-Name Accounting Standards Codification
-Section 50
-Paragraph 3
-Subparagraph (c)
-Publisher FASB
-URI https://asc.fasb.org//1943274/2147481687/323-10-50-3
Reference 5: http://www.xbrl.org/2009/role/commonPracticeRef
-Topic 825
-SubTopic 10
-Name Accounting Standards Codification
-Section 50
-Paragraph 28
-Subparagraph (f)
-Publisher FASB
-URI https://asc.fasb.org//1943274/2147482907/825-10-50-28
Reference 6: http://fasb.org/us-gaap/role/ref/legacyRef
-Topic 942
-SubTopic 210
-Name Accounting Standards Codification
-Section S99
-Paragraph 1
-Subparagraph (SX 210.9-03(23))
-Publisher FASB
-URI https://asc.fasb.org//1943274/2147479853/942-210-S99-1
Reference 7: http://fasb.org/us-gaap/role/ref/legacyRef
-Topic 210
-SubTopic 10
-Name Accounting Standards Codification
-Section S99
-Paragraph 1
-Subparagraph (SX 210.5-02(32))
-Publisher FASB
-URI https://asc.fasb.org//1943274/2147480566/210-10-S99-1
| Name: |
us-gaap_LiabilitiesAndStockholdersEquity |
| Namespace Prefix: |
us-gaap_ |
| Data Type: |
xbrli:monetaryItemType |
| Balance Type: |
credit |
| Period Type: |
instant |
|
| X |
- DefinitionTotal obligations incurred as part of normal operations that are expected to be paid during the following twelve months or within one business cycle, if longer. Reference 1: http://www.xbrl.org/2003/role/disclosureRef
-Topic 810
-SubTopic 10
-Name Accounting Standards Codification
-Section 50
-Paragraph 3
-Subparagraph (c)
-Publisher FASB
-URI https://asc.fasb.org//1943274/2147481203/810-10-50-3
Reference 2: http://www.xbrl.org/2003/role/disclosureRef
-Topic 810
-SubTopic 10
-Name Accounting Standards Codification
-Section 45
-Paragraph 25
-Subparagraph (b)
-Publisher FASB
-URI https://asc.fasb.org//1943274/2147481231/810-10-45-25
Reference 3: http://www.xbrl.org/2003/role/disclosureRef
-Topic 810
-SubTopic 10
-Name Accounting Standards Codification
-Section 50
-Paragraph 3
-Subparagraph (bb)
-Publisher FASB
-URI https://asc.fasb.org//1943274/2147481203/810-10-50-3
Reference 4: http://www.xbrl.org/2003/role/disclosureRef
-Topic 235
-SubTopic 10
-Name Accounting Standards Codification
-Section S99
-Paragraph 1
-Subparagraph (SX 210.4-08(g)(1)(ii))
-Publisher FASB
-URI https://asc.fasb.org//1943274/2147480678/235-10-S99-1
Reference 5: http://www.xbrl.org/2003/role/disclosureRef
-Topic 323
-SubTopic 10
-Name Accounting Standards Codification
-Section 50
-Paragraph 3
-Subparagraph (c)
-Publisher FASB
-URI https://asc.fasb.org//1943274/2147481687/323-10-50-3
Reference 6: http://www.xbrl.org/2003/role/disclosureRef
-Topic 825
-SubTopic 10
-Name Accounting Standards Codification
-Section 50
-Paragraph 28
-Subparagraph (f)
-Publisher FASB
-URI https://asc.fasb.org//1943274/2147482907/825-10-50-28
Reference 7: http://www.xbrl.org/2003/role/exampleRef
-Topic 852
-SubTopic 10
-Name Accounting Standards Codification
-Section 55
-Paragraph 10
-Publisher FASB
-URI https://asc.fasb.org//1943274/2147481372/852-10-55-10
Reference 8: http://www.xbrl.org/2003/role/disclosureRef
-Topic 210
-SubTopic 10
-Name Accounting Standards Codification
-Section 45
-Paragraph 5
-Publisher FASB
-URI https://asc.fasb.org//1943274/2147483467/210-10-45-5
Reference 9: http://www.xbrl.org/2003/role/disclosureRef
-Topic 470
-SubTopic 10
-Name Accounting Standards Codification
-Section S99
-Paragraph 1A
-Subparagraph (SX 210.13-01(a)(4)(i))
-Publisher FASB
-URI https://asc.fasb.org//1943274/2147480097/470-10-S99-1A
Reference 10: http://www.xbrl.org/2009/role/commonPracticeRef
-Topic 470
-SubTopic 10
-Name Accounting Standards Codification
-Section S99
-Paragraph 1A
-Subparagraph (SX 210.13-01(a)(4)(ii))
-Publisher FASB
-URI https://asc.fasb.org//1943274/2147480097/470-10-S99-1A
Reference 11: http://www.xbrl.org/2003/role/disclosureRef
-Topic 470
-SubTopic 10
-Name Accounting Standards Codification
-Section S99
-Paragraph 1A
-Subparagraph (SX 210.13-01(a)(4)(iii)(A))
-Publisher FASB
-URI https://asc.fasb.org//1943274/2147480097/470-10-S99-1A
Reference 12: http://www.xbrl.org/2003/role/disclosureRef
-Topic 470
-SubTopic 10
-Name Accounting Standards Codification
-Section S99
-Paragraph 1A
-Subparagraph (SX 210.13-01(a)(4)(iv))
-Publisher FASB
-URI https://asc.fasb.org//1943274/2147480097/470-10-S99-1A
Reference 13: http://www.xbrl.org/2003/role/disclosureRef
-Topic 470
-SubTopic 10
-Name Accounting Standards Codification
-Section S99
-Paragraph 1A
-Subparagraph (SX 210.13-01(a)(5))
-Publisher FASB
-URI https://asc.fasb.org//1943274/2147480097/470-10-S99-1A
Reference 14: http://www.xbrl.org/2003/role/disclosureRef
-Topic 470
-SubTopic 10
-Name Accounting Standards Codification
-Section S99
-Paragraph 1B
-Subparagraph (SX 210.13-02(a)(4)(i))
-Publisher FASB
-URI https://asc.fasb.org//1943274/2147480097/470-10-S99-1B
Reference 15: http://www.xbrl.org/2003/role/disclosureRef
-Topic 470
-SubTopic 10
-Name Accounting Standards Codification
-Section S99
-Paragraph 1B
-Subparagraph (SX 210.13-02(a)(4)(iii)(A))
-Publisher FASB
-URI https://asc.fasb.org//1943274/2147480097/470-10-S99-1B
Reference 16: http://www.xbrl.org/2003/role/disclosureRef
-Topic 470
-SubTopic 10
-Name Accounting Standards Codification
-Section S99
-Paragraph 1B
-Subparagraph (SX 210.13-02(a)(4)(iii)(B))
-Publisher FASB
-URI https://asc.fasb.org//1943274/2147480097/470-10-S99-1B
Reference 17: http://www.xbrl.org/2003/role/disclosureRef
-Topic 470
-SubTopic 10
-Name Accounting Standards Codification
-Section S99
-Paragraph 1B
-Subparagraph (SX 210.13-02(a)(4)(iv))
-Publisher FASB
-URI https://asc.fasb.org//1943274/2147480097/470-10-S99-1B
Reference 18: http://www.xbrl.org/2003/role/disclosureRef
-Topic 470
-SubTopic 10
-Name Accounting Standards Codification
-Section S99
-Paragraph 1B
-Subparagraph (SX 210.13-02(a)(5))
-Publisher FASB
-URI https://asc.fasb.org//1943274/2147480097/470-10-S99-1B
Reference 19: http://www.xbrl.org/2009/role/commonPracticeRef
-Topic 852
-SubTopic 10
-Name Accounting Standards Codification
-Section 50
-Paragraph 7
-Subparagraph (a)
-Publisher FASB
-URI https://asc.fasb.org//1943274/2147481404/852-10-50-7
Reference 20: http://www.xbrl.org/2009/role/commonPracticeRef
-Topic 852
-SubTopic 10
-Name Accounting Standards Codification
-Section 50
-Paragraph 7
-Subparagraph (b)
-Publisher FASB
-URI https://asc.fasb.org//1943274/2147481404/852-10-50-7
Reference 21: http://fasb.org/us-gaap/role/ref/legacyRef
-Name Accounting Standards Codification
-Topic 210
-SubTopic 10
-Section S99
-Paragraph 1
-Subparagraph (SX 210.5-02.21)
-Publisher FASB
-URI https://asc.fasb.org//1943274/2147480566/210-10-S99-1
| Name: |
us-gaap_LiabilitiesCurrent |
| Namespace Prefix: |
us-gaap_ |
| Data Type: |
xbrli:monetaryItemType |
| Balance Type: |
credit |
| Period Type: |
instant |
|
| X |
- References
+ Details
| Name: |
us-gaap_LiabilitiesCurrentAbstract |
| Namespace Prefix: |
us-gaap_ |
| Data Type: |
xbrli:stringItemType |
| Balance Type: |
na |
| Period Type: |
duration |
|
| X |
- DefinitionAmount of obligation due after one year or beyond the normal operating cycle, if longer. Reference 1: http://fasb.org/us-gaap/role/ref/legacyRef
-Name Accounting Standards Codification
-Section S99
-Paragraph 1
-Subparagraph (SX 210.5-02(22))
-SubTopic 10
-Topic 210
-Publisher FASB
-URI https://asc.fasb.org//1943274/2147480566/210-10-S99-1
Reference 2: http://www.xbrl.org/2003/role/disclosureRef
-Topic 810
-SubTopic 10
-Name Accounting Standards Codification
-Section 50
-Paragraph 3
-Subparagraph (c)
-Publisher FASB
-URI https://asc.fasb.org//1943274/2147481203/810-10-50-3
Reference 3: http://www.xbrl.org/2003/role/disclosureRef
-Topic 810
-SubTopic 10
-Name Accounting Standards Codification
-Section 45
-Paragraph 25
-Subparagraph (b)
-Publisher FASB
-URI https://asc.fasb.org//1943274/2147481231/810-10-45-25
Reference 4: http://www.xbrl.org/2003/role/disclosureRef
-Topic 810
-SubTopic 10
-Name Accounting Standards Codification
-Section 50
-Paragraph 3
-Subparagraph (bb)
-Publisher FASB
-URI https://asc.fasb.org//1943274/2147481203/810-10-50-3
Reference 5: http://www.xbrl.org/2003/role/disclosureRef
-Topic 235
-SubTopic 10
-Name Accounting Standards Codification
-Section S99
-Paragraph 1
-Subparagraph (SX 210.4-08(g)(1)(ii))
-Publisher FASB
-URI https://asc.fasb.org//1943274/2147480678/235-10-S99-1
Reference 6: http://www.xbrl.org/2003/role/disclosureRef
-Topic 323
-SubTopic 10
-Name Accounting Standards Codification
-Section 50
-Paragraph 3
-Subparagraph (c)
-Publisher FASB
-URI https://asc.fasb.org//1943274/2147481687/323-10-50-3
Reference 7: http://www.xbrl.org/2003/role/disclosureRef
-Topic 825
-SubTopic 10
-Name Accounting Standards Codification
-Section 50
-Paragraph 28
-Subparagraph (f)
-Publisher FASB
-URI https://asc.fasb.org//1943274/2147482907/825-10-50-28
Reference 8: http://www.xbrl.org/2003/role/disclosureRef
-Topic 470
-SubTopic 10
-Name Accounting Standards Codification
-Section S99
-Paragraph 1A
-Subparagraph (SX 210.13-01(a)(4)(i))
-Publisher FASB
-URI https://asc.fasb.org//1943274/2147480097/470-10-S99-1A
Reference 9: http://www.xbrl.org/2009/role/commonPracticeRef
-Topic 470
-SubTopic 10
-Name Accounting Standards Codification
-Section S99
-Paragraph 1A
-Subparagraph (SX 210.13-01(a)(4)(ii))
-Publisher FASB
-URI https://asc.fasb.org//1943274/2147480097/470-10-S99-1A
Reference 10: http://www.xbrl.org/2003/role/disclosureRef
-Topic 470
-SubTopic 10
-Name Accounting Standards Codification
-Section S99
-Paragraph 1A
-Subparagraph (SX 210.13-01(a)(4)(iii)(A))
-Publisher FASB
-URI https://asc.fasb.org//1943274/2147480097/470-10-S99-1A
Reference 11: http://www.xbrl.org/2003/role/disclosureRef
-Topic 470
-SubTopic 10
-Name Accounting Standards Codification
-Section S99
-Paragraph 1A
-Subparagraph (SX 210.13-01(a)(4)(iv))
-Publisher FASB
-URI https://asc.fasb.org//1943274/2147480097/470-10-S99-1A
Reference 12: http://www.xbrl.org/2003/role/disclosureRef
-Topic 470
-SubTopic 10
-Name Accounting Standards Codification
-Section S99
-Paragraph 1A
-Subparagraph (SX 210.13-01(a)(5))
-Publisher FASB
-URI https://asc.fasb.org//1943274/2147480097/470-10-S99-1A
Reference 13: http://www.xbrl.org/2003/role/disclosureRef
-Topic 470
-SubTopic 10
-Name Accounting Standards Codification
-Section S99
-Paragraph 1B
-Subparagraph (SX 210.13-02(a)(4)(i))
-Publisher FASB
-URI https://asc.fasb.org//1943274/2147480097/470-10-S99-1B
Reference 14: http://www.xbrl.org/2003/role/disclosureRef
-Topic 470
-SubTopic 10
-Name Accounting Standards Codification
-Section S99
-Paragraph 1B
-Subparagraph (SX 210.13-02(a)(4)(iii)(A))
-Publisher FASB
-URI https://asc.fasb.org//1943274/2147480097/470-10-S99-1B
Reference 15: http://www.xbrl.org/2003/role/disclosureRef
-Topic 470
-SubTopic 10
-Name Accounting Standards Codification
-Section S99
-Paragraph 1B
-Subparagraph (SX 210.13-02(a)(4)(iii)(B))
-Publisher FASB
-URI https://asc.fasb.org//1943274/2147480097/470-10-S99-1B
Reference 16: http://www.xbrl.org/2003/role/disclosureRef
-Topic 470
-SubTopic 10
-Name Accounting Standards Codification
-Section S99
-Paragraph 1B
-Subparagraph (SX 210.13-02(a)(4)(iv))
-Publisher FASB
-URI https://asc.fasb.org//1943274/2147480097/470-10-S99-1B
Reference 17: http://www.xbrl.org/2003/role/disclosureRef
-Topic 470
-SubTopic 10
-Name Accounting Standards Codification
-Section S99
-Paragraph 1B
-Subparagraph (SX 210.13-02(a)(5))
-Publisher FASB
-URI https://asc.fasb.org//1943274/2147480097/470-10-S99-1B
Reference 18: http://www.xbrl.org/2009/role/commonPracticeRef
-Topic 852
-SubTopic 10
-Name Accounting Standards Codification
-Section 50
-Paragraph 7
-Subparagraph (a)
-Publisher FASB
-URI https://asc.fasb.org//1943274/2147481404/852-10-50-7
Reference 19: http://www.xbrl.org/2009/role/commonPracticeRef
-Topic 852
-SubTopic 10
-Name Accounting Standards Codification
-Section 50
-Paragraph 7
-Subparagraph (b)
-Publisher FASB
-URI https://asc.fasb.org//1943274/2147481404/852-10-50-7
Reference 20: http://fasb.org/us-gaap/role/ref/legacyRef
-Topic 210
-SubTopic 10
-Name Accounting Standards Codification
-Section S99
-Paragraph 1
-Subparagraph (SX 210.5-02(23))
-Publisher FASB
-URI https://asc.fasb.org//1943274/2147480566/210-10-S99-1
Reference 21: http://fasb.org/us-gaap/role/ref/legacyRef
-Topic 210
-SubTopic 10
-Name Accounting Standards Codification
-Section S99
-Paragraph 1
-Subparagraph (SX 201.5-02(24))
-Publisher FASB
-URI https://asc.fasb.org//1943274/2147480566/210-10-S99-1
Reference 22: http://fasb.org/us-gaap/role/ref/legacyRef
-Topic 210
-SubTopic 10
-Name Accounting Standards Codification
-Section S99
-Paragraph 1
-Subparagraph (SX 201.5-02(25))
-Publisher FASB
-URI https://asc.fasb.org//1943274/2147480566/210-10-S99-1
Reference 23: http://fasb.org/us-gaap/role/ref/legacyRef
-Topic 210
-SubTopic 10
-Name Accounting Standards Codification
-Section S99
-Paragraph 1
-Subparagraph (SX 201.5-02(26))
-Publisher FASB
-URI https://asc.fasb.org//1943274/2147480566/210-10-S99-1
| Name: |
us-gaap_LiabilitiesNoncurrent |
| Namespace Prefix: |
us-gaap_ |
| Data Type: |
xbrli:monetaryItemType |
| Balance Type: |
credit |
| Period Type: |
instant |
|
| X |
- References
+ Details
| Name: |
us-gaap_LiabilitiesNoncurrentAbstract |
| Namespace Prefix: |
us-gaap_ |
| Data Type: |
xbrli:stringItemType |
| Balance Type: |
na |
| Period Type: |
duration |
|
| X |
- DefinitionCarrying value as of the balance sheet date of notes payable (with maturities initially due after one year or beyond the operating cycle if longer), excluding current portion. Reference 1: http://fasb.org/us-gaap/role/ref/legacyRef
-Name Accounting Standards Codification
-Topic 210
-SubTopic 10
-Section S99
-Paragraph 1
-Subparagraph (SX 210.5-02.22)
-Publisher FASB
-URI https://asc.fasb.org//1943274/2147480566/210-10-S99-1
| Name: |
us-gaap_LongTermNotesPayable |
| Namespace Prefix: |
us-gaap_ |
| Data Type: |
xbrli:monetaryItemType |
| Balance Type: |
credit |
| Period Type: |
instant |
|
| X |
- DefinitionSum of the carrying values as of the balance sheet date of the portions of long-term notes payable due within one year or the operating cycle if longer. Reference 1: http://fasb.org/us-gaap/role/ref/legacyRef
-Name Accounting Standards Codification
-Topic 210
-SubTopic 10
-Section S99
-Paragraph 1
-Subparagraph (SX 210.5-02.19,20)
-Publisher FASB
-URI https://asc.fasb.org//1943274/2147480566/210-10-S99-1
| Name: |
us-gaap_NotesPayableCurrent |
| Namespace Prefix: |
us-gaap_ |
| Data Type: |
xbrli:monetaryItemType |
| Balance Type: |
credit |
| Period Type: |
instant |
|
| X |
- DefinitionPresent value of lessee's discounted obligation for lease payments from operating lease, classified as current. Reference 1: http://www.xbrl.org/2003/role/disclosureRef
-Topic 842
-SubTopic 20
-Name Accounting Standards Codification
-Section 45
-Paragraph 1
-Subparagraph (b)
-Publisher FASB
-URI https://asc.fasb.org//1943274/2147479041/842-20-45-1
| Name: |
us-gaap_OperatingLeaseLiabilityCurrent |
| Namespace Prefix: |
us-gaap_ |
| Data Type: |
xbrli:monetaryItemType |
| Balance Type: |
credit |
| Period Type: |
instant |
|
| X |
- DefinitionPresent value of lessee's discounted obligation for lease payments from operating lease, classified as noncurrent. Reference 1: http://www.xbrl.org/2003/role/disclosureRef
-Topic 842
-SubTopic 20
-Name Accounting Standards Codification
-Section 45
-Paragraph 1
-Subparagraph (b)
-Publisher FASB
-URI https://asc.fasb.org//1943274/2147479041/842-20-45-1
| Name: |
us-gaap_OperatingLeaseLiabilityNoncurrent |
| Namespace Prefix: |
us-gaap_ |
| Data Type: |
xbrli:monetaryItemType |
| Balance Type: |
credit |
| Period Type: |
instant |
|
| X |
- DefinitionAmount of lessee's right to use underlying asset under operating lease. Reference 1: http://www.xbrl.org/2003/role/disclosureRef
-Topic 842
-SubTopic 20
-Name Accounting Standards Codification
-Section 45
-Paragraph 1
-Subparagraph (a)
-Publisher FASB
-URI https://asc.fasb.org//1943274/2147479041/842-20-45-1
| Name: |
us-gaap_OperatingLeaseRightOfUseAsset |
| Namespace Prefix: |
us-gaap_ |
| Data Type: |
xbrli:monetaryItemType |
| Balance Type: |
debit |
| Period Type: |
instant |
|
| X |
- DefinitionAmount of noncurrent assets classified as other. Reference 1: http://www.xbrl.org/2003/role/disclosureRef
-Topic 210
-SubTopic 10
-Name Accounting Standards Codification
-Section S99
-Paragraph 1
-Subparagraph (SX 210.5-02(17))
-Publisher FASB
-URI https://asc.fasb.org//1943274/2147480566/210-10-S99-1
| Name: |
us-gaap_OtherAssetsNoncurrent |
| Namespace Prefix: |
us-gaap_ |
| Data Type: |
xbrli:monetaryItemType |
| Balance Type: |
debit |
| Period Type: |
instant |
|
| X |
- DefinitionAmount of asset related to consideration paid in advance for costs that provide economic benefits in future periods, and amount of other assets that are expected to be realized or consumed within one year or the normal operating cycle, if longer. Reference 1: http://www.xbrl.org/2009/role/commonPracticeRef
-Topic 210
-SubTopic 10
-Name Accounting Standards Codification
-Section S99
-Paragraph 1
-Subparagraph (SX 210.5-02(9))
-Publisher FASB
-URI https://asc.fasb.org//1943274/2147480566/210-10-S99-1
| Name: |
us-gaap_PrepaidExpenseAndOtherAssetsCurrent |
| Namespace Prefix: |
us-gaap_ |
| Data Type: |
xbrli:monetaryItemType |
| Balance Type: |
debit |
| Period Type: |
instant |
|
| X |
- DefinitionAmount after accumulated depreciation, depletion and amortization of physical assets used in the normal conduct of business to produce goods and services and not intended for resale. Examples include, but are not limited to, land, buildings, machinery and equipment, office equipment, and furniture and fixtures. Reference 1: http://fasb.org/us-gaap/role/ref/legacyRef
-Name Accounting Standards Codification
-Section 50
-Paragraph 1
-SubTopic 10
-Topic 360
-Publisher FASB
-URI https://asc.fasb.org//1943274/2147482099/360-10-50-1
Reference 2: http://www.xbrl.org/2003/role/exampleRef
-Topic 852
-SubTopic 10
-Name Accounting Standards Codification
-Section 55
-Paragraph 10
-Publisher FASB
-URI https://asc.fasb.org//1943274/2147481372/852-10-55-10
Reference 3: http://www.xbrl.org/2003/role/disclosureRef
-Topic 944
-SubTopic 210
-Name Accounting Standards Codification
-Section S99
-Paragraph 1
-Subparagraph (SX 210.7-03(a)(8))
-Publisher FASB
-URI https://asc.fasb.org//1943274/2147479440/944-210-S99-1
Reference 4: http://www.xbrl.org/2003/role/disclosureRef
-Topic 942
-SubTopic 360
-Name Accounting Standards Codification
-Section 50
-Paragraph 1
-Publisher FASB
-URI https://asc.fasb.org//1943274/2147480842/942-360-50-1
| Name: |
us-gaap_PropertyPlantAndEquipmentNet |
| Namespace Prefix: |
us-gaap_ |
| Data Type: |
xbrli:monetaryItemType |
| Balance Type: |
debit |
| Period Type: |
instant |
|
| X |
- DefinitionAmount of accumulated undistributed earnings (deficit). Reference 1: http://www.xbrl.org/2003/role/exampleRef
-Topic 852
-SubTopic 10
-Name Accounting Standards Codification
-Section 55
-Paragraph 10
-Publisher FASB
-URI https://asc.fasb.org//1943274/2147481372/852-10-55-10
Reference 2: http://www.xbrl.org/2003/role/disclosureRef
-Topic 944
-SubTopic 40
-Name Accounting Standards Codification
-Section 65
-Paragraph 2
-Subparagraph (g)(2)(i)
-Publisher FASB
-URI https://asc.fasb.org//1943274/2147480016/944-40-65-2
Reference 3: http://www.xbrl.org/2003/role/disclosureRef
-Topic 944
-SubTopic 40
-Name Accounting Standards Codification
-Section 65
-Paragraph 2
-Subparagraph (h)(2)
-Publisher FASB
-URI https://asc.fasb.org//1943274/2147480016/944-40-65-2
Reference 4: http://www.xbrl.org/2003/role/disclosureRef
-Topic 946
-SubTopic 20
-Name Accounting Standards Codification
-Section 50
-Paragraph 11
-Publisher FASB
-URI https://asc.fasb.org//1943274/2147480990/946-20-50-11
Reference 5: http://www.xbrl.org/2003/role/disclosureRef
-Topic 944
-SubTopic 210
-Name Accounting Standards Codification
-Section S99
-Paragraph 1
-Subparagraph (SX 210.7-03(a)(23)(a)(4))
-Publisher FASB
-URI https://asc.fasb.org//1943274/2147479440/944-210-S99-1
Reference 6: http://www.xbrl.org/2003/role/disclosureRef
-Topic 946
-SubTopic 210
-Name Accounting Standards Codification
-Section S99
-Paragraph 1
-Subparagraph (SX 210.6-04(17))
-Publisher FASB
-URI https://asc.fasb.org//1943274/2147479617/946-210-S99-1
Reference 7: http://fasb.org/us-gaap/role/ref/legacyRef
-Topic 505
-SubTopic 10
-Name Accounting Standards Codification
-Section S99
-Paragraph 1
-Subparagraph (SX 210.3-04)
-Publisher FASB
-URI https://asc.fasb.org//1943274/2147480008/505-10-S99-1
Reference 8: http://fasb.org/us-gaap/role/ref/legacyRef
-Topic 210
-SubTopic 10
-Name Accounting Standards Codification
-Section S99
-Paragraph 1
-Subparagraph (SX 210.5-02(30)(a)(3))
-Publisher FASB
-URI https://asc.fasb.org//1943274/2147480566/210-10-S99-1
| Name: |
us-gaap_RetainedEarningsAccumulatedDeficit |
| Namespace Prefix: |
us-gaap_ |
| Data Type: |
xbrli:monetaryItemType |
| Balance Type: |
credit |
| Period Type: |
instant |
|
| X |
- DefinitionAmount of equity (deficit) attributable to parent. Excludes temporary equity and equity attributable to noncontrolling interest. Reference 1: http://www.xbrl.org/2003/role/exampleRef
-Topic 852
-SubTopic 10
-Name Accounting Standards Codification
-Section 55
-Paragraph 10
-Publisher FASB
-URI https://asc.fasb.org//1943274/2147481372/852-10-55-10
Reference 2: http://www.xbrl.org/2003/role/exampleRef
-Topic 946
-SubTopic 830
-Name Accounting Standards Codification
-Section 55
-Paragraph 12
-Publisher FASB
-URI https://asc.fasb.org//1943274/2147480167/946-830-55-12
Reference 3: http://www.xbrl.org/2003/role/disclosureRef
-Topic 946
-SubTopic 210
-Name Accounting Standards Codification
-Section S99
-Paragraph 1
-Subparagraph (SX 210.6-04(19))
-Publisher FASB
-URI https://asc.fasb.org//1943274/2147479617/946-210-S99-1
Reference 4: http://www.xbrl.org/2003/role/disclosureRef
-Topic 946
-SubTopic 210
-Name Accounting Standards Codification
-Section S99
-Paragraph 2
-Subparagraph (SX 210.6-05(4))
-Publisher FASB
-URI https://asc.fasb.org//1943274/2147479617/946-210-S99-2
Reference 5: http://www.xbrl.org/2009/role/commonPracticeRef
-Topic 946
-SubTopic 220
-Name Accounting Standards Codification
-Section S99
-Paragraph 3
-Subparagraph (SX 210.6-09(4)(b))
-Publisher FASB
-URI https://asc.fasb.org//1943274/2147483575/946-220-S99-3
Reference 6: http://www.xbrl.org/2003/role/disclosureRef
-Topic 946
-SubTopic 220
-Name Accounting Standards Codification
-Section S99
-Paragraph 3
-Subparagraph (SX 210.6-09(6))
-Publisher FASB
-URI https://asc.fasb.org//1943274/2147483575/946-220-S99-3
Reference 7: http://www.xbrl.org/2003/role/disclosureRef
-Topic 946
-SubTopic 220
-Name Accounting Standards Codification
-Section S99
-Paragraph 3
-Subparagraph (SX 210.6-09(7))
-Publisher FASB
-URI https://asc.fasb.org//1943274/2147483575/946-220-S99-3
Reference 8: http://www.xbrl.org/2009/role/commonPracticeRef
-Topic 235
-SubTopic 10
-Name Accounting Standards Codification
-Section S99
-Paragraph 1
-Subparagraph (SX 210.4-08(g)(1)(ii))
-Publisher FASB
-URI https://asc.fasb.org//1943274/2147480678/235-10-S99-1
Reference 9: http://www.xbrl.org/2009/role/commonPracticeRef
-Topic 323
-SubTopic 10
-Name Accounting Standards Codification
-Section 50
-Paragraph 3
-Subparagraph (c)
-Publisher FASB
-URI https://asc.fasb.org//1943274/2147481687/323-10-50-3
Reference 10: http://www.xbrl.org/2009/role/commonPracticeRef
-Topic 825
-SubTopic 10
-Name Accounting Standards Codification
-Section 50
-Paragraph 28
-Subparagraph (f)
-Publisher FASB
-URI https://asc.fasb.org//1943274/2147482907/825-10-50-28
Reference 11: http://fasb.org/us-gaap/role/ref/legacyRef
-Topic 210
-SubTopic 10
-Name Accounting Standards Codification
-Section S99
-Paragraph 1
-Subparagraph (SX 210.5-02(29))
-Publisher FASB
-URI https://asc.fasb.org//1943274/2147480566/210-10-S99-1
Reference 12: http://fasb.org/us-gaap/role/ref/legacyRef
-Topic 210
-SubTopic 10
-Name Accounting Standards Codification
-Section S99
-Paragraph 1
-Subparagraph (SX 210.5-02(31))
-Publisher FASB
-URI https://asc.fasb.org//1943274/2147480566/210-10-S99-1
Reference 13: http://fasb.org/us-gaap/role/ref/legacyRef
-Topic 210
-SubTopic 10
-Name Accounting Standards Codification
-Section S99
-Paragraph 1
-Subparagraph (SX 210.5-02(30))
-Publisher FASB
-URI https://asc.fasb.org//1943274/2147480566/210-10-S99-1
Reference 14: http://fasb.org/us-gaap/role/ref/legacyRef
-Topic 310
-SubTopic 10
-Name Accounting Standards Codification
-Section S99
-Paragraph 2
-Subparagraph (SAB Topic 4.E)
-Publisher FASB
-URI https://asc.fasb.org//1943274/2147480418/310-10-S99-2
| Name: |
us-gaap_StockholdersEquity |
| Namespace Prefix: |
us-gaap_ |
| Data Type: |
xbrli:monetaryItemType |
| Balance Type: |
credit |
| Period Type: |
instant |
|
| X |
- References
+ Details
| Name: |
us-gaap_StockholdersEquityAbstract |
| Namespace Prefix: |
us-gaap_ |
| Data Type: |
xbrli:stringItemType |
| Balance Type: |
na |
| Period Type: |
duration |
|
| X |
- DefinitionAmount received for services rendered and products shipped, but not yet billed, for non-contractual agreements due within one year or the normal operating cycle, if longer.
| Name: |
us-gaap_UnbilledReceivablesCurrent |
| Namespace Prefix: |
us-gaap_ |
| Data Type: |
xbrli:monetaryItemType |
| Balance Type: |
debit |
| Period Type: |
instant |
|
| X |
- DefinitionCarrying value as of the balance sheet date of obligations and payables pertaining to claims incurred of a workers compensation nature. Used to reflect the current portion of the liabilities (due within one year or within the normal operating cycle if longer). Reference 1: http://fasb.org/us-gaap/role/ref/legacyRef
-Name Accounting Standards Codification
-Topic 210
-SubTopic 10
-Section S99
-Paragraph 1
-Subparagraph (SX 210.5-02.20)
-Publisher FASB
-URI https://asc.fasb.org//1943274/2147480566/210-10-S99-1
| Name: |
us-gaap_WorkersCompensationLiabilityCurrent |
| Namespace Prefix: |
us-gaap_ |
| Data Type: |
xbrli:monetaryItemType |
| Balance Type: |
credit |
| Period Type: |
instant |
|
v3.23.2
Condensed Consolidated Balance Sheets (Parenthetical) - $ / shares
|
Jun. 30, 2023 |
Dec. 31, 2022 |
| Statement of Financial Position [Abstract] |
|
|
| Common stock, par value |
$ 0.001
|
$ 0.001
|
| Common stock, shares authorized |
25,000,000
|
25,000,000
|
| Common stock, shares issued |
4,073,757
|
4,073,757
|
| Common stock, shares outstanding |
4,073,757
|
4,073,757
|
| X |
- DefinitionFace amount or stated value per share of common stock. Reference 1: http://fasb.org/us-gaap/role/ref/legacyRef
-Topic 210
-SubTopic 10
-Name Accounting Standards Codification
-Section S99
-Paragraph 1
-Subparagraph (SX 210.5-02(29))
-Publisher FASB
-URI https://asc.fasb.org//1943274/2147480566/210-10-S99-1
| Name: |
us-gaap_CommonStockParOrStatedValuePerShare |
| Namespace Prefix: |
us-gaap_ |
| Data Type: |
dtr-types:perShareItemType |
| Balance Type: |
na |
| Period Type: |
instant |
|
| X |
- DefinitionThe maximum number of common shares permitted to be issued by an entity's charter and bylaws. Reference 1: http://www.xbrl.org/2003/role/disclosureRef
-Topic 946
-SubTopic 210
-Name Accounting Standards Codification
-Section S99
-Paragraph 1
-Subparagraph (SX 210.6-04(16)(a))
-Publisher FASB
-URI https://asc.fasb.org//1943274/2147479617/946-210-S99-1
Reference 2: http://fasb.org/us-gaap/role/ref/legacyRef
-Topic 210
-SubTopic 10
-Name Accounting Standards Codification
-Section S99
-Paragraph 1
-Subparagraph (SX 210.5-02(29))
-Publisher FASB
-URI https://asc.fasb.org//1943274/2147480566/210-10-S99-1
| Name: |
us-gaap_CommonStockSharesAuthorized |
| Namespace Prefix: |
us-gaap_ |
| Data Type: |
xbrli:sharesItemType |
| Balance Type: |
na |
| Period Type: |
instant |
|
| X |
- DefinitionTotal number of common shares of an entity that have been sold or granted to shareholders (includes common shares that were issued, repurchased and remain in the treasury). These shares represent capital invested by the firm's shareholders and owners, and may be all or only a portion of the number of shares authorized. Shares issued include shares outstanding and shares held in the treasury. Reference 1: http://fasb.org/us-gaap/role/ref/legacyRef
-Topic 210
-SubTopic 10
-Name Accounting Standards Codification
-Section S99
-Paragraph 1
-Subparagraph (SX 210.5-02(29))
-Publisher FASB
-URI https://asc.fasb.org//1943274/2147480566/210-10-S99-1
| Name: |
us-gaap_CommonStockSharesIssued |
| Namespace Prefix: |
us-gaap_ |
| Data Type: |
xbrli:sharesItemType |
| Balance Type: |
na |
| Period Type: |
instant |
|
| X |
- DefinitionNumber of shares of common stock outstanding. Common stock represent the ownership interest in a corporation. Reference 1: http://fasb.org/us-gaap/role/ref/legacyRef
-Name Accounting Standards Codification
-Section 50
-Paragraph 2
-SubTopic 10
-Topic 505
-Publisher FASB
-URI https://asc.fasb.org//1943274/2147481112/505-10-50-2
Reference 2: http://www.xbrl.org/2003/role/disclosureRef
-Topic 946
-SubTopic 210
-Name Accounting Standards Codification
-Section S99
-Paragraph 2
-Subparagraph (SX 210.6-05(4))
-Publisher FASB
-URI https://asc.fasb.org//1943274/2147479617/946-210-S99-2
Reference 3: http://www.xbrl.org/2009/role/commonPracticeRef
-Topic 946
-SubTopic 220
-Name Accounting Standards Codification
-Section S99
-Paragraph 3
-Subparagraph (SX 210.6-09(4)(b))
-Publisher FASB
-URI https://asc.fasb.org//1943274/2147483575/946-220-S99-3
Reference 4: http://www.xbrl.org/2003/role/disclosureRef
-Topic 946
-SubTopic 210
-Name Accounting Standards Codification
-Section S99
-Paragraph 1
-Subparagraph (SX 210.6-04(16)(a))
-Publisher FASB
-URI https://asc.fasb.org//1943274/2147479617/946-210-S99-1
Reference 5: http://www.xbrl.org/2009/role/commonPracticeRef
-Topic 946
-SubTopic 220
-Name Accounting Standards Codification
-Section S99
-Paragraph 3
-Subparagraph (SX 210.6-09(7))
-Publisher FASB
-URI https://asc.fasb.org//1943274/2147483575/946-220-S99-3
Reference 6: http://fasb.org/us-gaap/role/ref/legacyRef
-Topic 210
-SubTopic 10
-Name Accounting Standards Codification
-Section S99
-Paragraph 1
-Subparagraph (SX 210.5-02(29))
-Publisher FASB
-URI https://asc.fasb.org//1943274/2147480566/210-10-S99-1
| Name: |
us-gaap_CommonStockSharesOutstanding |
| Namespace Prefix: |
us-gaap_ |
| Data Type: |
xbrli:sharesItemType |
| Balance Type: |
na |
| Period Type: |
instant |
|
| X |
- References
+ Details
| Name: |
us-gaap_StatementOfFinancialPositionAbstract |
| Namespace Prefix: |
us-gaap_ |
| Data Type: |
xbrli:stringItemType |
| Balance Type: |
na |
| Period Type: |
duration |
|
v3.23.2
Condensed Consolidated Statements of Operations (Unaudited) - USD ($)
|
3 Months Ended |
6 Months Ended |
Jun. 30, 2023 |
Jun. 30, 2022 |
Jun. 30, 2023 |
Jun. 30, 2022 |
| Revenues: |
|
|
|
|
| Total revenues |
$ 4,258,430
|
$ 3,415,643
|
$ 8,445,263
|
$ 6,119,155
|
| Cost of revenues: |
|
|
|
|
| Total cost of revenues |
1,667,997
|
1,226,625
|
3,208,991
|
2,298,300
|
| Gross profit |
2,590,433
|
2,189,018
|
5,236,272
|
3,820,855
|
| Operating expenses: |
|
|
|
|
| General and administrative |
1,561,939
|
1,254,862
|
3,116,550
|
2,190,553
|
| Change in fair value of earnout liabilities |
|
52,301
|
|
116,505
|
| Transaction costs |
|
285,230
|
|
355,281
|
| Sales and marketing |
492,303
|
529,405
|
1,071,814
|
881,519
|
| Depreciation and amortization |
239,803
|
200,919
|
467,521
|
318,221
|
| Total operating expenses |
2,294,045
|
2,322,717
|
4,655,885
|
3,862,079
|
| Income (loss) from operations |
296,388
|
(133,699)
|
580,387
|
(41,224)
|
| Interest expense |
(160,654)
|
(240,468)
|
(332,090)
|
(353,069)
|
| Net income (loss) |
$ 135,734
|
$ (374,167)
|
$ 248,297
|
$ (394,293)
|
| Basic net income (loss) per share: |
$ 0.03
|
$ (0.09)
|
$ 0.06
|
$ (0.11)
|
| Diluted net income (loss) per share: |
$ 0.03
|
$ (0.09)
|
$ 0.06
|
$ (0.11)
|
| Weighted average number of common shares outstanding - basic |
4,073,757
|
4,073,757
|
4,073,757
|
3,455,761
|
| Weighted average number of common shares outstanding - diluted |
4,073,757
|
4,073,757
|
4,073,757
|
3,455,761
|
| Sale of Software [Member] |
|
|
|
|
| Revenues: |
|
|
|
|
| Total revenues |
$ 63,646
|
$ 11,105
|
$ 78,939
|
$ 75,596
|
| Cost of revenues: |
|
|
|
|
| Total cost of revenues |
7,344
|
7,392
|
15,525
|
33,585
|
| Software As a Service [Member] |
|
|
|
|
| Revenues: |
|
|
|
|
| Total revenues |
1,277,918
|
1,158,456
|
2,516,350
|
1,589,677
|
| Cost of revenues: |
|
|
|
|
| Total cost of revenues |
258,382
|
191,188
|
479,022
|
282,437
|
| Software Maintenance Services [Member] |
|
|
|
|
| Revenues: |
|
|
|
|
| Total revenues |
349,139
|
343,881
|
698,681
|
680,483
|
| Cost of revenues: |
|
|
|
|
| Total cost of revenues |
15,117
|
19,185
|
31,833
|
37,485
|
| Professional Services [Member] |
|
|
|
|
| Revenues: |
|
|
|
|
| Total revenues |
2,298,316
|
1,625,765
|
4,597,605
|
3,213,713
|
| Cost of revenues: |
|
|
|
|
| Total cost of revenues |
1,307,341
|
918,542
|
2,494,457
|
1,766,709
|
| Storage and Retrieval Services [Member] |
|
|
|
|
| Revenues: |
|
|
|
|
| Total revenues |
269,411
|
276,436
|
553,688
|
559,686
|
| Cost of revenues: |
|
|
|
|
| Total cost of revenues |
$ 79,813
|
$ 90,318
|
$ 188,154
|
$ 178,084
|
| X |
- DefinitionAdjustment to fair value of contingent consideration earnout.
| Name: |
INLX_AdjustmentToFairValueOfContingentConsiderationEarnout |
| Namespace Prefix: |
INLX_ |
| Data Type: |
xbrli:monetaryItemType |
| Balance Type: |
debit |
| Period Type: |
duration |
|
| X |
- DefinitionThe capitalized costs incurred during the period (excluded from amortization) to purchase, lease or otherwise acquire an unproved property, including costs of lease bonuses and options to purchase or lease properties, the portion of costs applicable to minerals when land including mineral rights is purchased in fee, brokers' fees, recording fees, legal costs, and other costs incurred in acquiring properties. Reference 1: http://fasb.org/us-gaap/role/ref/legacyRef
-Topic 932
-SubTopic 10
-Name Accounting Standards Codification
-Section S99
-Paragraph 1
-Subparagraph (SX 210.4-10(c)(7)(ii))
-Publisher FASB
-URI https://asc.fasb.org//1943274/2147479664/932-10-S99-1
Reference 2: http://fasb.org/us-gaap/role/ref/legacyRef
-Topic 932
-SubTopic 10
-Name Accounting Standards Codification
-Section S99
-Paragraph 1
-Subparagraph (SX 210.4-10(c)(3)(ii)(A))
-Publisher FASB
-URI https://asc.fasb.org//1943274/2147479664/932-10-S99-1
| Name: |
us-gaap_AcquisitionCosts |
| Namespace Prefix: |
us-gaap_ |
| Data Type: |
xbrli:monetaryItemType |
| Balance Type: |
debit |
| Period Type: |
duration |
|
| X |
- DefinitionThe aggregate cost of goods produced and sold and services rendered during the reporting period. Reference 1: http://www.xbrl.org/2003/role/disclosureRef
-Topic 235
-SubTopic 10
-Name Accounting Standards Codification
-Section S99
-Paragraph 1
-Subparagraph (SX 210.4-08(g)(1)(ii))
-Publisher FASB
-URI https://asc.fasb.org//1943274/2147480678/235-10-S99-1
Reference 2: http://www.xbrl.org/2003/role/disclosureRef
-Topic 323
-SubTopic 10
-Name Accounting Standards Codification
-Section 50
-Paragraph 3
-Subparagraph (c)
-Publisher FASB
-URI https://asc.fasb.org//1943274/2147481687/323-10-50-3
Reference 3: http://www.xbrl.org/2003/role/disclosureRef
-Topic 825
-SubTopic 10
-Name Accounting Standards Codification
-Section 50
-Paragraph 28
-Subparagraph (f)
-Publisher FASB
-URI https://asc.fasb.org//1943274/2147482907/825-10-50-28
Reference 4: http://www.xbrl.org/2003/role/disclosureRef
-Topic 470
-SubTopic 10
-Name Accounting Standards Codification
-Section S99
-Paragraph 1A
-Subparagraph (SX 210.13-01(a)(4)(i))
-Publisher FASB
-URI https://asc.fasb.org//1943274/2147480097/470-10-S99-1A
Reference 5: http://www.xbrl.org/2009/role/commonPracticeRef
-Topic 470
-SubTopic 10
-Name Accounting Standards Codification
-Section S99
-Paragraph 1A
-Subparagraph (SX 210.13-01(a)(4)(ii))
-Publisher FASB
-URI https://asc.fasb.org//1943274/2147480097/470-10-S99-1A
Reference 6: http://www.xbrl.org/2003/role/disclosureRef
-Topic 470
-SubTopic 10
-Name Accounting Standards Codification
-Section S99
-Paragraph 1A
-Subparagraph (SX 210.13-01(a)(4)(iii)(A))
-Publisher FASB
-URI https://asc.fasb.org//1943274/2147480097/470-10-S99-1A
Reference 7: http://www.xbrl.org/2003/role/disclosureRef
-Topic 470
-SubTopic 10
-Name Accounting Standards Codification
-Section S99
-Paragraph 1A
-Subparagraph (SX 210.13-01(a)(4)(iv))
-Publisher FASB
-URI https://asc.fasb.org//1943274/2147480097/470-10-S99-1A
Reference 8: http://www.xbrl.org/2003/role/disclosureRef
-Topic 470
-SubTopic 10
-Name Accounting Standards Codification
-Section S99
-Paragraph 1A
-Subparagraph (SX 210.13-01(a)(5))
-Publisher FASB
-URI https://asc.fasb.org//1943274/2147480097/470-10-S99-1A
Reference 9: http://www.xbrl.org/2003/role/disclosureRef
-Topic 470
-SubTopic 10
-Name Accounting Standards Codification
-Section S99
-Paragraph 1B
-Subparagraph (SX 210.13-02(a)(4)(i))
-Publisher FASB
-URI https://asc.fasb.org//1943274/2147480097/470-10-S99-1B
Reference 10: http://www.xbrl.org/2003/role/disclosureRef
-Topic 470
-SubTopic 10
-Name Accounting Standards Codification
-Section S99
-Paragraph 1B
-Subparagraph (SX 210.13-02(a)(4)(iii)(A))
-Publisher FASB
-URI https://asc.fasb.org//1943274/2147480097/470-10-S99-1B
Reference 11: http://www.xbrl.org/2003/role/disclosureRef
-Topic 470
-SubTopic 10
-Name Accounting Standards Codification
-Section S99
-Paragraph 1B
-Subparagraph (SX 210.13-02(a)(4)(iii)(B))
-Publisher FASB
-URI https://asc.fasb.org//1943274/2147480097/470-10-S99-1B
Reference 12: http://www.xbrl.org/2003/role/disclosureRef
-Topic 470
-SubTopic 10
-Name Accounting Standards Codification
-Section S99
-Paragraph 1B
-Subparagraph (SX 210.13-02(a)(4)(iv))
-Publisher FASB
-URI https://asc.fasb.org//1943274/2147480097/470-10-S99-1B
Reference 13: http://www.xbrl.org/2003/role/disclosureRef
-Topic 470
-SubTopic 10
-Name Accounting Standards Codification
-Section S99
-Paragraph 1B
-Subparagraph (SX 210.13-02(a)(5))
-Publisher FASB
-URI https://asc.fasb.org//1943274/2147480097/470-10-S99-1B
Reference 14: http://fasb.org/us-gaap/role/ref/legacyRef
-Topic 220
-SubTopic 10
-Name Accounting Standards Codification
-Section S99
-Paragraph 2
-Subparagraph (SX 210.5-03.2)
-Publisher FASB
-URI https://asc.fasb.org//1943274/2147483621/220-10-S99-2
| Name: |
us-gaap_CostOfRevenue |
| Namespace Prefix: |
us-gaap_ |
| Data Type: |
xbrli:monetaryItemType |
| Balance Type: |
debit |
| Period Type: |
duration |
|
| X |
- References
+ Details
| Name: |
us-gaap_CostOfRevenueAbstract |
| Namespace Prefix: |
us-gaap_ |
| Data Type: |
xbrli:stringItemType |
| Balance Type: |
na |
| Period Type: |
duration |
|
| X |
- DefinitionThe current period expense charged against earnings on long-lived, physical assets not used in production, and which are not intended for resale, to allocate or recognize the cost of such assets over their useful lives; or to record the reduction in book value of an intangible asset over the benefit period of such asset; or to reflect consumption during the period of an asset that is not used in production. Reference 1: http://fasb.org/us-gaap/role/ref/legacyRef
-Name Accounting Standards Codification
-Section 45
-Paragraph 28
-Subparagraph (b)
-SubTopic 10
-Topic 230
-Publisher FASB
-URI https://asc.fasb.org//1943274/2147482740/230-10-45-28
Reference 2: http://fasb.org/us-gaap/role/ref/legacyRef
-Name Accounting Standards Codification
-Topic 360
-SubTopic 10
-Section 50
-Paragraph 1
-Subparagraph (a)
-Publisher FASB
-URI https://asc.fasb.org//1943274/2147482099/360-10-50-1
| Name: |
us-gaap_DepreciationAndAmortization |
| Namespace Prefix: |
us-gaap_ |
| Data Type: |
xbrli:monetaryItemType |
| Balance Type: |
debit |
| Period Type: |
duration |
|
| X |
- DefinitionThe amount of net income (loss) for the period per each share of common stock or unit outstanding during the reporting period. Reference 1: http://www.xbrl.org/2003/role/disclosureRef
-Topic 250
-SubTopic 10
-Name Accounting Standards Codification
-Section 50
-Paragraph 3
-Publisher FASB
-URI https://asc.fasb.org//1943274/2147483443/250-10-50-3
Reference 2: http://www.xbrl.org/2003/role/disclosureRef
-Topic 260
-SubTopic 10
-Name Accounting Standards Codification
-Section 55
-Paragraph 15
-Publisher FASB
-URI https://asc.fasb.org//1943274/2147482635/260-10-55-15
Reference 3: http://www.xbrl.org/2003/role/disclosureRef
-Topic 815
-SubTopic 40
-Name Accounting Standards Codification
-Section 65
-Paragraph 1
-Subparagraph (e)(4)
-Publisher FASB
-URI https://asc.fasb.org//1943274/2147480175/815-40-65-1
Reference 4: http://www.xbrl.org/2003/role/disclosureRef
-Topic 815
-SubTopic 40
-Name Accounting Standards Codification
-Section 65
-Paragraph 1
-Subparagraph (f)
-Publisher FASB
-URI https://asc.fasb.org//1943274/2147480175/815-40-65-1
Reference 5: http://www.xbrl.org/2003/role/disclosureRef
-Topic 250
-SubTopic 10
-Name Accounting Standards Codification
-Section 50
-Paragraph 11
-Subparagraph (a)
-Publisher FASB
-URI https://asc.fasb.org//1943274/2147483443/250-10-50-11
Reference 6: http://www.xbrl.org/2003/role/disclosureRef
-Topic 250
-SubTopic 10
-Name Accounting Standards Codification
-Section 50
-Paragraph 11
-Subparagraph (b)
-Publisher FASB
-URI https://asc.fasb.org//1943274/2147483443/250-10-50-11
Reference 7: http://www.xbrl.org/2003/role/disclosureRef
-Topic 250
-SubTopic 10
-Name Accounting Standards Codification
-Section 50
-Paragraph 7
-Subparagraph (a)
-Publisher FASB
-URI https://asc.fasb.org//1943274/2147483443/250-10-50-7
Reference 8: http://www.xbrl.org/2003/role/disclosureRef
-Topic 260
-SubTopic 10
-Name Accounting Standards Codification
-Section 45
-Paragraph 2
-Publisher FASB
-URI https://asc.fasb.org//1943274/2147482689/260-10-45-2
Reference 9: http://www.xbrl.org/2003/role/disclosureRef
-Topic 260
-SubTopic 10
-Name Accounting Standards Codification
-Section 45
-Paragraph 60B
-Subparagraph (d)
-Publisher FASB
-URI https://asc.fasb.org//1943274/2147482689/260-10-45-60B
Reference 10: http://www.xbrl.org/2003/role/disclosureRef
-Topic 250
-SubTopic 10
-Name Accounting Standards Codification
-Section 50
-Paragraph 4
-Publisher FASB
-URI https://asc.fasb.org//1943274/2147483443/250-10-50-4
Reference 11: http://www.xbrl.org/2003/role/disclosureRef
-Topic 260
-SubTopic 10
-Name Accounting Standards Codification
-Section 50
-Paragraph 1
-Subparagraph (a)
-Publisher FASB
-URI https://asc.fasb.org//1943274/2147482662/260-10-50-1
Reference 12: http://www.xbrl.org/2003/role/disclosureRef
-Topic 260
-SubTopic 10
-Name Accounting Standards Codification
-Section 45
-Paragraph 10
-Publisher FASB
-URI https://asc.fasb.org//1943274/2147482689/260-10-45-10
Reference 13: http://www.xbrl.org/2003/role/disclosureRef
-Topic 220
-SubTopic 10
-Name Accounting Standards Codification
-Section S99
-Paragraph 2
-Subparagraph (SX 210.5-03(25))
-Publisher FASB
-URI https://asc.fasb.org//1943274/2147483621/220-10-S99-2
Reference 14: http://www.xbrl.org/2003/role/disclosureRef
-Topic 942
-SubTopic 220
-Name Accounting Standards Codification
-Section S99
-Paragraph 1
-Subparagraph (SX 210.9-04(27))
-Publisher FASB
-URI https://asc.fasb.org//1943274/2147483589/942-220-S99-1
Reference 15: http://www.xbrl.org/2003/role/disclosureRef
-Topic 944
-SubTopic 220
-Name Accounting Standards Codification
-Section S99
-Paragraph 1
-Subparagraph (SX 210.7-04(23))
-Publisher FASB
-URI https://asc.fasb.org//1943274/2147483586/944-220-S99-1
Reference 16: http://www.xbrl.org/2003/role/exampleRef
-Topic 260
-SubTopic 10
-Name Accounting Standards Codification
-Section 55
-Paragraph 52
-Publisher FASB
-URI https://asc.fasb.org//1943274/2147482635/260-10-55-52
Reference 17: http://www.xbrl.org/2003/role/disclosureRef
-Topic 260
-SubTopic 10
-Name Accounting Standards Codification
-Section 45
-Paragraph 7
-Publisher FASB
-URI https://asc.fasb.org//1943274/2147482689/260-10-45-7
| Name: |
us-gaap_EarningsPerShareBasic |
| Namespace Prefix: |
us-gaap_ |
| Data Type: |
dtr-types:perShareItemType |
| Balance Type: |
na |
| Period Type: |
duration |
|
| X |
- DefinitionThe amount of net income (loss) for the period available to each share of common stock or common unit outstanding during the reporting period and to each share or unit that would have been outstanding assuming the issuance of common shares or units for all dilutive potential common shares or units outstanding during the reporting period. Reference 1: http://www.xbrl.org/2003/role/disclosureRef
-Topic 250
-SubTopic 10
-Name Accounting Standards Codification
-Section 50
-Paragraph 3
-Publisher FASB
-URI https://asc.fasb.org//1943274/2147483443/250-10-50-3
Reference 2: http://www.xbrl.org/2003/role/disclosureRef
-Topic 260
-SubTopic 10
-Name Accounting Standards Codification
-Section 55
-Paragraph 15
-Publisher FASB
-URI https://asc.fasb.org//1943274/2147482635/260-10-55-15
Reference 3: http://www.xbrl.org/2003/role/disclosureRef
-Topic 815
-SubTopic 40
-Name Accounting Standards Codification
-Section 65
-Paragraph 1
-Subparagraph (e)(4)
-Publisher FASB
-URI https://asc.fasb.org//1943274/2147480175/815-40-65-1
Reference 4: http://www.xbrl.org/2003/role/disclosureRef
-Topic 815
-SubTopic 40
-Name Accounting Standards Codification
-Section 65
-Paragraph 1
-Subparagraph (f)
-Publisher FASB
-URI https://asc.fasb.org//1943274/2147480175/815-40-65-1
Reference 5: http://www.xbrl.org/2003/role/disclosureRef
-Topic 250
-SubTopic 10
-Name Accounting Standards Codification
-Section 50
-Paragraph 11
-Subparagraph (a)
-Publisher FASB
-URI https://asc.fasb.org//1943274/2147483443/250-10-50-11
Reference 6: http://www.xbrl.org/2003/role/disclosureRef
-Topic 250
-SubTopic 10
-Name Accounting Standards Codification
-Section 50
-Paragraph 11
-Subparagraph (b)
-Publisher FASB
-URI https://asc.fasb.org//1943274/2147483443/250-10-50-11
Reference 7: http://www.xbrl.org/2003/role/disclosureRef
-Topic 250
-SubTopic 10
-Name Accounting Standards Codification
-Section 50
-Paragraph 7
-Subparagraph (a)
-Publisher FASB
-URI https://asc.fasb.org//1943274/2147483443/250-10-50-7
Reference 8: http://www.xbrl.org/2003/role/disclosureRef
-Topic 260
-SubTopic 10
-Name Accounting Standards Codification
-Section 45
-Paragraph 2
-Publisher FASB
-URI https://asc.fasb.org//1943274/2147482689/260-10-45-2
Reference 9: http://www.xbrl.org/2003/role/disclosureRef
-Topic 260
-SubTopic 10
-Name Accounting Standards Codification
-Section 45
-Paragraph 60B
-Subparagraph (d)
-Publisher FASB
-URI https://asc.fasb.org//1943274/2147482689/260-10-45-60B
Reference 10: http://www.xbrl.org/2003/role/disclosureRef
-Topic 250
-SubTopic 10
-Name Accounting Standards Codification
-Section 50
-Paragraph 4
-Publisher FASB
-URI https://asc.fasb.org//1943274/2147483443/250-10-50-4
Reference 11: http://www.xbrl.org/2003/role/disclosureRef
-Topic 260
-SubTopic 10
-Name Accounting Standards Codification
-Section 50
-Paragraph 1
-Subparagraph (a)
-Publisher FASB
-URI https://asc.fasb.org//1943274/2147482662/260-10-50-1
Reference 12: http://www.xbrl.org/2003/role/disclosureRef
-Topic 220
-SubTopic 10
-Name Accounting Standards Codification
-Section S99
-Paragraph 2
-Subparagraph (SX 210.5-03(25))
-Publisher FASB
-URI https://asc.fasb.org//1943274/2147483621/220-10-S99-2
Reference 13: http://www.xbrl.org/2003/role/disclosureRef
-Topic 942
-SubTopic 220
-Name Accounting Standards Codification
-Section S99
-Paragraph 1
-Subparagraph (SX 210.9-04(27))
-Publisher FASB
-URI https://asc.fasb.org//1943274/2147483589/942-220-S99-1
Reference 14: http://www.xbrl.org/2003/role/disclosureRef
-Topic 944
-SubTopic 220
-Name Accounting Standards Codification
-Section S99
-Paragraph 1
-Subparagraph (SX 210.7-04(23))
-Publisher FASB
-URI https://asc.fasb.org//1943274/2147483586/944-220-S99-1
Reference 15: http://www.xbrl.org/2003/role/exampleRef
-Topic 260
-SubTopic 10
-Name Accounting Standards Codification
-Section 55
-Paragraph 52
-Publisher FASB
-URI https://asc.fasb.org//1943274/2147482635/260-10-55-52
Reference 16: http://www.xbrl.org/2003/role/disclosureRef
-Topic 260
-SubTopic 10
-Name Accounting Standards Codification
-Section 45
-Paragraph 7
-Publisher FASB
-URI https://asc.fasb.org//1943274/2147482689/260-10-45-7
| Name: |
us-gaap_EarningsPerShareDiluted |
| Namespace Prefix: |
us-gaap_ |
| Data Type: |
dtr-types:perShareItemType |
| Balance Type: |
na |
| Period Type: |
duration |
|
| X |
- DefinitionThe aggregate total of expenses of managing and administering the affairs of an entity, including affiliates of the reporting entity, which are not directly or indirectly associated with the manufacture, sale or creation of a product or product line. Reference 1: http://www.xbrl.org/2003/role/disclosureRef
-Topic 946
-SubTopic 220
-Name Accounting Standards Codification
-Section S99
-Paragraph 1
-Subparagraph (SX 210.6-07(2)(a))
-Publisher FASB
-URI https://asc.fasb.org//1943274/2147483575/946-220-S99-1
Reference 2: http://fasb.org/us-gaap/role/ref/legacyRef
-Topic 220
-SubTopic 10
-Name Accounting Standards Codification
-Section S99
-Paragraph 2
-Subparagraph (SX 210.5-03.4)
-Publisher FASB
-URI https://asc.fasb.org//1943274/2147483621/220-10-S99-2
| Name: |
us-gaap_GeneralAndAdministrativeExpense |
| Namespace Prefix: |
us-gaap_ |
| Data Type: |
xbrli:monetaryItemType |
| Balance Type: |
debit |
| Period Type: |
duration |
|
| X |
- DefinitionAggregate revenue less cost of goods and services sold or operating expenses directly attributable to the revenue generation activity. Reference 1: http://www.xbrl.org/2003/role/disclosureRef
-Topic 235
-SubTopic 10
-Name Accounting Standards Codification
-Section S99
-Paragraph 1
-Subparagraph (SX 210.4-08(g)(1)(ii))
-Publisher FASB
-URI https://asc.fasb.org//1943274/2147480678/235-10-S99-1
Reference 2: http://www.xbrl.org/2003/role/disclosureRef
-Topic 323
-SubTopic 10
-Name Accounting Standards Codification
-Section 50
-Paragraph 3
-Subparagraph (c)
-Publisher FASB
-URI https://asc.fasb.org//1943274/2147481687/323-10-50-3
Reference 3: http://www.xbrl.org/2003/role/disclosureRef
-Topic 825
-SubTopic 10
-Name Accounting Standards Codification
-Section 50
-Paragraph 28
-Subparagraph (f)
-Publisher FASB
-URI https://asc.fasb.org//1943274/2147482907/825-10-50-28
Reference 4: http://www.xbrl.org/2003/role/disclosureRef
-Topic 280
-SubTopic 10
-Name Accounting Standards Codification
-Section 50
-Paragraph 22
-Publisher FASB
-URI https://asc.fasb.org//1943274/2147482810/280-10-50-22
Reference 5: http://www.xbrl.org/2003/role/disclosureRef
-Topic 470
-SubTopic 10
-Name Accounting Standards Codification
-Section S99
-Paragraph 1A
-Subparagraph (SX 210.13-01(a)(4)(i))
-Publisher FASB
-URI https://asc.fasb.org//1943274/2147480097/470-10-S99-1A
Reference 6: http://www.xbrl.org/2009/role/commonPracticeRef
-Topic 470
-SubTopic 10
-Name Accounting Standards Codification
-Section S99
-Paragraph 1A
-Subparagraph (SX 210.13-01(a)(4)(ii))
-Publisher FASB
-URI https://asc.fasb.org//1943274/2147480097/470-10-S99-1A
Reference 7: http://www.xbrl.org/2003/role/disclosureRef
-Topic 470
-SubTopic 10
-Name Accounting Standards Codification
-Section S99
-Paragraph 1A
-Subparagraph (SX 210.13-01(a)(4)(iii)(A))
-Publisher FASB
-URI https://asc.fasb.org//1943274/2147480097/470-10-S99-1A
Reference 8: http://www.xbrl.org/2003/role/disclosureRef
-Topic 470
-SubTopic 10
-Name Accounting Standards Codification
-Section S99
-Paragraph 1A
-Subparagraph (SX 210.13-01(a)(4)(iv))
-Publisher FASB
-URI https://asc.fasb.org//1943274/2147480097/470-10-S99-1A
Reference 9: http://www.xbrl.org/2003/role/disclosureRef
-Topic 470
-SubTopic 10
-Name Accounting Standards Codification
-Section S99
-Paragraph 1A
-Subparagraph (SX 210.13-01(a)(5))
-Publisher FASB
-URI https://asc.fasb.org//1943274/2147480097/470-10-S99-1A
Reference 10: http://www.xbrl.org/2003/role/disclosureRef
-Topic 470
-SubTopic 10
-Name Accounting Standards Codification
-Section S99
-Paragraph 1B
-Subparagraph (SX 210.13-02(a)(4)(i))
-Publisher FASB
-URI https://asc.fasb.org//1943274/2147480097/470-10-S99-1B
Reference 11: http://www.xbrl.org/2003/role/disclosureRef
-Topic 470
-SubTopic 10
-Name Accounting Standards Codification
-Section S99
-Paragraph 1B
-Subparagraph (SX 210.13-02(a)(4)(iii)(A))
-Publisher FASB
-URI https://asc.fasb.org//1943274/2147480097/470-10-S99-1B
Reference 12: http://www.xbrl.org/2003/role/disclosureRef
-Topic 470
-SubTopic 10
-Name Accounting Standards Codification
-Section S99
-Paragraph 1B
-Subparagraph (SX 210.13-02(a)(4)(iii)(B))
-Publisher FASB
-URI https://asc.fasb.org//1943274/2147480097/470-10-S99-1B
Reference 13: http://www.xbrl.org/2003/role/disclosureRef
-Topic 470
-SubTopic 10
-Name Accounting Standards Codification
-Section S99
-Paragraph 1B
-Subparagraph (SX 210.13-02(a)(4)(iv))
-Publisher FASB
-URI https://asc.fasb.org//1943274/2147480097/470-10-S99-1B
Reference 14: http://www.xbrl.org/2003/role/disclosureRef
-Topic 470
-SubTopic 10
-Name Accounting Standards Codification
-Section S99
-Paragraph 1B
-Subparagraph (SX 210.13-02(a)(5))
-Publisher FASB
-URI https://asc.fasb.org//1943274/2147480097/470-10-S99-1B
Reference 15: http://www.xbrl.org/2003/role/disclosureRef
-Topic 280
-SubTopic 10
-Name Accounting Standards Codification
-Section 50
-Paragraph 30
-Subparagraph (b)
-Publisher FASB
-URI https://asc.fasb.org//1943274/2147482810/280-10-50-30
Reference 16: http://www.xbrl.org/2003/role/disclosureRef
-Topic 280
-SubTopic 10
-Name Accounting Standards Codification
-Section 50
-Paragraph 32
-Subparagraph (f)
-Publisher FASB
-URI https://asc.fasb.org//1943274/2147482810/280-10-50-32
Reference 17: http://www.xbrl.org/2003/role/exampleRef
-Topic 280
-SubTopic 10
-Name Accounting Standards Codification
-Section 50
-Paragraph 31
-Publisher FASB
-URI https://asc.fasb.org//1943274/2147482810/280-10-50-31
Reference 18: http://www.xbrl.org/2003/role/disclosureRef
-Topic 280
-SubTopic 10
-Name Accounting Standards Codification
-Section 50
-Paragraph 32
-Subparagraph (c)
-Publisher FASB
-URI https://asc.fasb.org//1943274/2147482810/280-10-50-32
Reference 19: http://fasb.org/us-gaap/role/ref/legacyRef
-Topic 220
-SubTopic 10
-Name Accounting Standards Codification
-Section S99
-Paragraph 2
-Subparagraph (SX 210.5-03.1,2)
-Publisher FASB
-URI https://asc.fasb.org//1943274/2147483621/220-10-S99-2
| Name: |
us-gaap_GrossProfit |
| Namespace Prefix: |
us-gaap_ |
| Data Type: |
xbrli:monetaryItemType |
| Balance Type: |
credit |
| Period Type: |
duration |
|
| X |
- DefinitionAmount of the cost of borrowed funds accounted for as interest expense. Reference 1: http://www.xbrl.org/2003/role/exampleRef
-Topic 946
-SubTopic 830
-Name Accounting Standards Codification
-Section 55
-Paragraph 10
-Publisher FASB
-URI https://asc.fasb.org//1943274/2147480167/946-830-55-10
Reference 2: http://www.xbrl.org/2009/role/commonPracticeRef
-Topic 946
-SubTopic 220
-Name Accounting Standards Codification
-Section 45
-Paragraph 3
-Subparagraph (i)
-Publisher FASB
-URI https://asc.fasb.org//1943274/2147483581/946-220-45-3
Reference 3: http://www.xbrl.org/2003/role/disclosureRef
-Topic 946
-SubTopic 220
-Name Accounting Standards Codification
-Section S99
-Paragraph 1
-Subparagraph (SX 210.6-07(3))
-Publisher FASB
-URI https://asc.fasb.org//1943274/2147483575/946-220-S99-1
Reference 4: http://www.xbrl.org/2003/role/disclosureRef
-Topic 280
-SubTopic 10
-Name Accounting Standards Codification
-Section 50
-Paragraph 22
-Subparagraph (d)
-Publisher FASB
-URI https://asc.fasb.org//1943274/2147482810/280-10-50-22
Reference 5: http://fasb.org/us-gaap/role/ref/legacyRef
-Name Accounting Standards Codification
-Topic 835
-SubTopic 30
-Section 45
-Paragraph 3
-Publisher FASB
-URI https://asc.fasb.org//1943274/2147482925/835-30-45-3
Reference 6: http://fasb.org/us-gaap/role/ref/legacyRef
-Topic 942
-SubTopic 220
-Name Accounting Standards Codification
-Section S99
-Paragraph 1
-Subparagraph (SX 210.9-04.9)
-Publisher FASB
-URI https://asc.fasb.org//1943274/2147483589/942-220-S99-1
Reference 7: http://www.xbrl.org/2003/role/disclosureRef
-Topic 220
-SubTopic 10
-Name Accounting Standards Codification
-Section S99
-Paragraph 2
-Subparagraph (210.5-03(11))
-Publisher FASB
-URI https://asc.fasb.org//1943274/2147483621/220-10-S99-2
Reference 8: http://www.xbrl.org/2003/role/disclosureRef
-Topic 835
-SubTopic 20
-Name Accounting Standards Codification
-Section 50
-Paragraph 1
-Subparagraph (a)
-Publisher FASB
-URI https://asc.fasb.org//1943274/2147483013/835-20-50-1
| Name: |
us-gaap_InterestExpense |
| Namespace Prefix: |
us-gaap_ |
| Data Type: |
xbrli:monetaryItemType |
| Balance Type: |
debit |
| Period Type: |
duration |
|
| X |
- DefinitionThe portion of profit or loss for the period, net of income taxes, which is attributable to the parent. Reference 1: http://www.xbrl.org/2003/role/disclosureRef
-Topic 235
-SubTopic 10
-Name Accounting Standards Codification
-Section S99
-Paragraph 1
-Subparagraph (SX 210.4-08(g)(1)(ii))
-Publisher FASB
-URI https://asc.fasb.org//1943274/2147480678/235-10-S99-1
Reference 2: http://www.xbrl.org/2003/role/disclosureRef
-Topic 323
-SubTopic 10
-Name Accounting Standards Codification
-Section 50
-Paragraph 3
-Subparagraph (c)
-Publisher FASB
-URI https://asc.fasb.org//1943274/2147481687/323-10-50-3
Reference 3: http://www.xbrl.org/2003/role/disclosureRef
-Topic 825
-SubTopic 10
-Name Accounting Standards Codification
-Section 50
-Paragraph 28
-Subparagraph (f)
-Publisher FASB
-URI https://asc.fasb.org//1943274/2147482907/825-10-50-28
Reference 4: http://www.xbrl.org/2003/role/disclosureRef
-Topic 220
-SubTopic 10
-Name Accounting Standards Codification
-Section 50
-Paragraph 6
-Publisher FASB
-URI https://asc.fasb.org//1943274/2147482765/220-10-50-6
Reference 5: http://www.xbrl.org/2003/role/disclosureRef
-Topic 250
-SubTopic 10
-Name Accounting Standards Codification
-Section 50
-Paragraph 3
-Publisher FASB
-URI https://asc.fasb.org//1943274/2147483443/250-10-50-3
Reference 6: http://www.xbrl.org/2003/role/disclosureRef
-Topic 250
-SubTopic 10
-Name Accounting Standards Codification
-Section 50
-Paragraph 1
-Subparagraph (b)(2)
-Publisher FASB
-URI https://asc.fasb.org//1943274/2147483443/250-10-50-1
Reference 7: http://www.xbrl.org/2003/role/disclosureRef
-Topic 815
-SubTopic 40
-Name Accounting Standards Codification
-Section 65
-Paragraph 1
-Subparagraph (f)
-Publisher FASB
-URI https://asc.fasb.org//1943274/2147480175/815-40-65-1
Reference 8: http://www.xbrl.org/2003/role/disclosureRef
-Topic 250
-SubTopic 10
-Name Accounting Standards Codification
-Section 50
-Paragraph 8
-Publisher FASB
-URI https://asc.fasb.org//1943274/2147483443/250-10-50-8
Reference 9: http://www.xbrl.org/2003/role/disclosureRef
-Topic 250
-SubTopic 10
-Name Accounting Standards Codification
-Section 50
-Paragraph 9
-Publisher FASB
-URI https://asc.fasb.org//1943274/2147483443/250-10-50-9
Reference 10: http://www.xbrl.org/2003/role/disclosureRef
-Topic 250
-SubTopic 10
-Name Accounting Standards Codification
-Section 50
-Paragraph 11
-Subparagraph (a)
-Publisher FASB
-URI https://asc.fasb.org//1943274/2147483443/250-10-50-11
Reference 11: http://www.xbrl.org/2003/role/disclosureRef
-Topic 250
-SubTopic 10
-Name Accounting Standards Codification
-Section 50
-Paragraph 11
-Subparagraph (b)
-Publisher FASB
-URI https://asc.fasb.org//1943274/2147483443/250-10-50-11
Reference 12: http://www.xbrl.org/2003/role/disclosureRef
-Topic 250
-SubTopic 10
-Name Accounting Standards Codification
-Section 50
-Paragraph 4
-Publisher FASB
-URI https://asc.fasb.org//1943274/2147483443/250-10-50-4
Reference 13: http://www.xbrl.org/2003/role/exampleRef
-Topic 946
-SubTopic 830
-Name Accounting Standards Codification
-Section 55
-Paragraph 10
-Publisher FASB
-URI https://asc.fasb.org//1943274/2147480167/946-830-55-10
Reference 14: http://www.xbrl.org/2003/role/disclosureRef
-Topic 946
-SubTopic 220
-Name Accounting Standards Codification
-Section 45
-Paragraph 7
-Publisher FASB
-URI https://asc.fasb.org//1943274/2147483581/946-220-45-7
Reference 15: http://www.xbrl.org/2003/role/disclosureRef
-Topic 944
-SubTopic 220
-Name Accounting Standards Codification
-Section S99
-Paragraph 1
-Subparagraph (SX 210.7-04(18))
-Publisher FASB
-URI https://asc.fasb.org//1943274/2147483586/944-220-S99-1
Reference 16: http://www.xbrl.org/2003/role/disclosureRef
-Topic 280
-SubTopic 10
-Name Accounting Standards Codification
-Section 50
-Paragraph 22
-Publisher FASB
-URI https://asc.fasb.org//1943274/2147482810/280-10-50-22
Reference 17: http://www.xbrl.org/2003/role/disclosureRef
-Topic 946
-SubTopic 220
-Name Accounting Standards Codification
-Section S99
-Paragraph 1
-Subparagraph (SX 210.6-07(9))
-Publisher FASB
-URI https://asc.fasb.org//1943274/2147483575/946-220-S99-1
Reference 18: http://www.xbrl.org/2003/role/disclosureRef
-Topic 946
-SubTopic 220
-Name Accounting Standards Codification
-Section S99
-Paragraph 3
-Subparagraph (SX 210.6-09(1)(d))
-Publisher FASB
-URI https://asc.fasb.org//1943274/2147483575/946-220-S99-3
Reference 19: http://www.xbrl.org/2003/role/disclosureRef
-Topic 470
-SubTopic 10
-Name Accounting Standards Codification
-Section S99
-Paragraph 1A
-Subparagraph (SX 210.13-01(a)(4)(i))
-Publisher FASB
-URI https://asc.fasb.org//1943274/2147480097/470-10-S99-1A
Reference 20: http://www.xbrl.org/2009/role/commonPracticeRef
-Topic 470
-SubTopic 10
-Name Accounting Standards Codification
-Section S99
-Paragraph 1A
-Subparagraph (SX 210.13-01(a)(4)(ii))
-Publisher FASB
-URI https://asc.fasb.org//1943274/2147480097/470-10-S99-1A
Reference 21: http://www.xbrl.org/2003/role/disclosureRef
-Topic 470
-SubTopic 10
-Name Accounting Standards Codification
-Section S99
-Paragraph 1A
-Subparagraph (SX 210.13-01(a)(4)(iii)(A))
-Publisher FASB
-URI https://asc.fasb.org//1943274/2147480097/470-10-S99-1A
Reference 22: http://www.xbrl.org/2003/role/disclosureRef
-Topic 470
-SubTopic 10
-Name Accounting Standards Codification
-Section S99
-Paragraph 1A
-Subparagraph (SX 210.13-01(a)(4)(iv))
-Publisher FASB
-URI https://asc.fasb.org//1943274/2147480097/470-10-S99-1A
Reference 23: http://www.xbrl.org/2003/role/disclosureRef
-Topic 470
-SubTopic 10
-Name Accounting Standards Codification
-Section S99
-Paragraph 1A
-Subparagraph (SX 210.13-01(a)(5))
-Publisher FASB
-URI https://asc.fasb.org//1943274/2147480097/470-10-S99-1A
Reference 24: http://www.xbrl.org/2003/role/disclosureRef
-Topic 470
-SubTopic 10
-Name Accounting Standards Codification
-Section S99
-Paragraph 1B
-Subparagraph (SX 210.13-02(a)(4)(i))
-Publisher FASB
-URI https://asc.fasb.org//1943274/2147480097/470-10-S99-1B
Reference 25: http://www.xbrl.org/2003/role/disclosureRef
-Topic 470
-SubTopic 10
-Name Accounting Standards Codification
-Section S99
-Paragraph 1B
-Subparagraph (SX 210.13-02(a)(4)(iii)(A))
-Publisher FASB
-URI https://asc.fasb.org//1943274/2147480097/470-10-S99-1B
Reference 26: http://www.xbrl.org/2003/role/disclosureRef
-Topic 470
-SubTopic 10
-Name Accounting Standards Codification
-Section S99
-Paragraph 1B
-Subparagraph (SX 210.13-02(a)(4)(iii)(B))
-Publisher FASB
-URI https://asc.fasb.org//1943274/2147480097/470-10-S99-1B
Reference 27: http://www.xbrl.org/2003/role/disclosureRef
-Topic 470
-SubTopic 10
-Name Accounting Standards Codification
-Section S99
-Paragraph 1B
-Subparagraph (SX 210.13-02(a)(4)(iv))
-Publisher FASB
-URI https://asc.fasb.org//1943274/2147480097/470-10-S99-1B
Reference 28: http://www.xbrl.org/2003/role/disclosureRef
-Topic 470
-SubTopic 10
-Name Accounting Standards Codification
-Section S99
-Paragraph 1B
-Subparagraph (SX 210.13-02(a)(5))
-Publisher FASB
-URI https://asc.fasb.org//1943274/2147480097/470-10-S99-1B
Reference 29: http://www.xbrl.org/2003/role/disclosureRef
-Topic 280
-SubTopic 10
-Name Accounting Standards Codification
-Section 50
-Paragraph 30
-Subparagraph (b)
-Publisher FASB
-URI https://asc.fasb.org//1943274/2147482810/280-10-50-30
Reference 30: http://www.xbrl.org/2003/role/disclosureRef
-Topic 280
-SubTopic 10
-Name Accounting Standards Codification
-Section 50
-Paragraph 32
-Subparagraph (f)
-Publisher FASB
-URI https://asc.fasb.org//1943274/2147482810/280-10-50-32
Reference 31: http://www.xbrl.org/2003/role/disclosureRef
-Topic 260
-SubTopic 10
-Name Accounting Standards Codification
-Section 45
-Paragraph 60B
-Subparagraph (a)
-Publisher FASB
-URI https://asc.fasb.org//1943274/2147482689/260-10-45-60B
Reference 32: http://www.xbrl.org/2003/role/exampleRef
-Topic 280
-SubTopic 10
-Name Accounting Standards Codification
-Section 50
-Paragraph 31
-Publisher FASB
-URI https://asc.fasb.org//1943274/2147482810/280-10-50-31
Reference 33: http://www.xbrl.org/2003/role/disclosureRef
-Topic 280
-SubTopic 10
-Name Accounting Standards Codification
-Section 50
-Paragraph 32
-Subparagraph (c)
-Publisher FASB
-URI https://asc.fasb.org//1943274/2147482810/280-10-50-32
Reference 34: http://www.xbrl.org/2003/role/disclosureRef
-Topic 205
-SubTopic 20
-Name Accounting Standards Codification
-Section 50
-Paragraph 7
-Publisher FASB
-URI https://asc.fasb.org//1943274/2147483499/205-20-50-7
Reference 35: http://fasb.org/us-gaap/role/ref/legacyRef
-Topic 230
-SubTopic 10
-Name Accounting Standards Codification
-Section 45
-Paragraph 28
-Publisher FASB
-URI https://asc.fasb.org//1943274/2147482740/230-10-45-28
Reference 36: http://www.xbrl.org/2003/role/disclosureRef
-Topic 220
-SubTopic 10
-Name Accounting Standards Codification
-Section 45
-Paragraph 1A
-Subparagraph (a)
-Publisher FASB
-URI https://asc.fasb.org//1943274/2147482790/220-10-45-1A
Reference 37: http://www.xbrl.org/2003/role/disclosureRef
-Topic 220
-SubTopic 10
-Name Accounting Standards Codification
-Section 45
-Paragraph 1B
-Subparagraph (a)
-Publisher FASB
-URI https://asc.fasb.org//1943274/2147482790/220-10-45-1B
Reference 38: http://fasb.org/us-gaap/role/ref/legacyRef
-Topic 220
-SubTopic 10
-Name Accounting Standards Codification
-Section S99
-Paragraph 2
-Subparagraph (SX 210.5-03(20))
-Publisher FASB
-URI https://asc.fasb.org//1943274/2147483621/220-10-S99-2
Reference 39: http://fasb.org/us-gaap/role/ref/legacyRef
-Topic 942
-SubTopic 220
-Name Accounting Standards Codification
-Section S99
-Paragraph 1
-Subparagraph (SX 210.9-04(22))
-Publisher FASB
-URI https://asc.fasb.org//1943274/2147483589/942-220-S99-1
| Name: |
us-gaap_NetIncomeLoss |
| Namespace Prefix: |
us-gaap_ |
| Data Type: |
xbrli:monetaryItemType |
| Balance Type: |
credit |
| Period Type: |
duration |
|
| X |
- DefinitionGenerally recurring costs associated with normal operations except for the portion of these expenses which can be clearly related to production and included in cost of sales or services. Includes selling, general and administrative expense.
| Name: |
us-gaap_OperatingExpenses |
| Namespace Prefix: |
us-gaap_ |
| Data Type: |
xbrli:monetaryItemType |
| Balance Type: |
debit |
| Period Type: |
duration |
|
| X |
- References
+ Details
| Name: |
us-gaap_OperatingExpensesAbstract |
| Namespace Prefix: |
us-gaap_ |
| Data Type: |
xbrli:stringItemType |
| Balance Type: |
na |
| Period Type: |
duration |
|
| X |
- DefinitionThe net result for the period of deducting operating expenses from operating revenues. Reference 1: http://www.xbrl.org/2003/role/disclosureRef
-Topic 280
-SubTopic 10
-Name Accounting Standards Codification
-Section 50
-Paragraph 22
-Publisher FASB
-URI https://asc.fasb.org//1943274/2147482810/280-10-50-22
Reference 2: http://www.xbrl.org/2003/role/disclosureRef
-Topic 280
-SubTopic 10
-Name Accounting Standards Codification
-Section 50
-Paragraph 30
-Subparagraph (b)
-Publisher FASB
-URI https://asc.fasb.org//1943274/2147482810/280-10-50-30
Reference 3: http://www.xbrl.org/2003/role/disclosureRef
-Topic 280
-SubTopic 10
-Name Accounting Standards Codification
-Section 50
-Paragraph 32
-Subparagraph (f)
-Publisher FASB
-URI https://asc.fasb.org//1943274/2147482810/280-10-50-32
Reference 4: http://www.xbrl.org/2003/role/exampleRef
-Topic 280
-SubTopic 10
-Name Accounting Standards Codification
-Section 50
-Paragraph 31
-Publisher FASB
-URI https://asc.fasb.org//1943274/2147482810/280-10-50-31
Reference 5: http://www.xbrl.org/2003/role/disclosureRef
-Topic 280
-SubTopic 10
-Name Accounting Standards Codification
-Section 50
-Paragraph 32
-Subparagraph (c)
-Publisher FASB
-URI https://asc.fasb.org//1943274/2147482810/280-10-50-32
| Name: |
us-gaap_OperatingIncomeLoss |
| Namespace Prefix: |
us-gaap_ |
| Data Type: |
xbrli:monetaryItemType |
| Balance Type: |
credit |
| Period Type: |
duration |
|
| X |
- DefinitionAmount, excluding tax collected from customer, of revenue from satisfaction of performance obligation by transferring promised good or service to customer. Tax collected from customer is tax assessed by governmental authority that is both imposed on and concurrent with specific revenue-producing transaction, including, but not limited to, sales, use, value added and excise. Reference 1: http://www.xbrl.org/2003/role/disclosureRef
-Topic 924
-SubTopic 10
-Name Accounting Standards Codification
-Section S99
-Paragraph 1
-Subparagraph (SAB Topic 11.L)
-Publisher FASB
-URI https://asc.fasb.org//1943274/2147479941/924-10-S99-1
Reference 2: http://www.xbrl.org/2003/role/disclosureRef
-Topic 606
-SubTopic 10
-Name Accounting Standards Codification
-Section 50
-Paragraph 5
-Publisher FASB
-URI https://asc.fasb.org//1943274/2147479806/606-10-50-5
Reference 3: http://www.xbrl.org/2003/role/disclosureRef
-Topic 280
-SubTopic 10
-Name Accounting Standards Codification
-Section 50
-Paragraph 30
-Subparagraph (a)
-Publisher FASB
-URI https://asc.fasb.org//1943274/2147482810/280-10-50-30
Reference 4: http://www.xbrl.org/2003/role/disclosureRef
-Topic 280
-SubTopic 10
-Name Accounting Standards Codification
-Section 50
-Paragraph 42
-Publisher FASB
-URI https://asc.fasb.org//1943274/2147482810/280-10-50-42
Reference 5: http://www.xbrl.org/2003/role/disclosureRef
-Topic 280
-SubTopic 10
-Name Accounting Standards Codification
-Section 50
-Paragraph 22
-Subparagraph (b)
-Publisher FASB
-URI https://asc.fasb.org//1943274/2147482810/280-10-50-22
Reference 6: http://www.xbrl.org/2003/role/disclosureRef
-Topic 280
-SubTopic 10
-Name Accounting Standards Codification
-Section 50
-Paragraph 32
-Subparagraph (b)
-Publisher FASB
-URI https://asc.fasb.org//1943274/2147482810/280-10-50-32
Reference 7: http://www.xbrl.org/2003/role/disclosureRef
-Topic 280
-SubTopic 10
-Name Accounting Standards Codification
-Section 50
-Paragraph 40
-Publisher FASB
-URI https://asc.fasb.org//1943274/2147482810/280-10-50-40
Reference 8: http://www.xbrl.org/2003/role/disclosureRef
-Topic 280
-SubTopic 10
-Name Accounting Standards Codification
-Section 50
-Paragraph 22
-Subparagraph (a)
-Publisher FASB
-URI https://asc.fasb.org//1943274/2147482810/280-10-50-22
Reference 9: http://www.xbrl.org/2003/role/disclosureRef
-Topic 280
-SubTopic 10
-Name Accounting Standards Codification
-Section 50
-Paragraph 32
-Subparagraph (a)
-Publisher FASB
-URI https://asc.fasb.org//1943274/2147482810/280-10-50-32
Reference 10: http://www.xbrl.org/2003/role/disclosureRef
-Topic 280
-SubTopic 10
-Name Accounting Standards Codification
-Section 50
-Paragraph 41
-Subparagraph (a)
-Publisher FASB
-URI https://asc.fasb.org//1943274/2147482810/280-10-50-41
Reference 11: http://www.xbrl.org/2003/role/disclosureRef
-Topic 606
-SubTopic 10
-Name Accounting Standards Codification
-Section 50
-Paragraph 4
-Subparagraph (a)
-Publisher FASB
-URI https://asc.fasb.org//1943274/2147479806/606-10-50-4
| Name: |
us-gaap_RevenueFromContractWithCustomerExcludingAssessedTax |
| Namespace Prefix: |
us-gaap_ |
| Data Type: |
xbrli:monetaryItemType |
| Balance Type: |
credit |
| Period Type: |
duration |
|
| X |
- References
+ Details
| Name: |
us-gaap_RevenuesAbstract |
| Namespace Prefix: |
us-gaap_ |
| Data Type: |
xbrli:stringItemType |
| Balance Type: |
na |
| Period Type: |
duration |
|
| X |
- DefinitionThe aggregate total amount of expenses directly related to the marketing or selling of products or services.
| Name: |
us-gaap_SellingAndMarketingExpense |
| Namespace Prefix: |
us-gaap_ |
| Data Type: |
xbrli:monetaryItemType |
| Balance Type: |
debit |
| Period Type: |
duration |
|
| X |
- DefinitionThe average number of shares or units issued and outstanding that are used in calculating diluted EPS or earnings per unit (EPU), determined based on the timing of issuance of shares or units in the period. Reference 1: http://www.xbrl.org/2003/role/disclosureRef
-Topic 260
-SubTopic 10
-Name Accounting Standards Codification
-Section 50
-Paragraph 1
-Subparagraph (a)
-Publisher FASB
-URI https://asc.fasb.org//1943274/2147482662/260-10-50-1
Reference 2: http://www.xbrl.org/2003/role/disclosureRef
-Topic 260
-SubTopic 10
-Name Accounting Standards Codification
-Section 45
-Paragraph 16
-Publisher FASB
-URI https://asc.fasb.org//1943274/2147482689/260-10-45-16
| Name: |
us-gaap_WeightedAverageNumberOfDilutedSharesOutstanding |
| Namespace Prefix: |
us-gaap_ |
| Data Type: |
xbrli:sharesItemType |
| Balance Type: |
na |
| Period Type: |
duration |
|
| X |
- DefinitionNumber of [basic] shares or units, after adjustment for contingently issuable shares or units and other shares or units not deemed outstanding, determined by relating the portion of time within a reporting period that common shares or units have been outstanding to the total time in that period. Reference 1: http://www.xbrl.org/2003/role/disclosureRef
-Topic 260
-SubTopic 10
-Name Accounting Standards Codification
-Section 50
-Paragraph 1
-Subparagraph (a)
-Publisher FASB
-URI https://asc.fasb.org//1943274/2147482662/260-10-50-1
Reference 2: http://www.xbrl.org/2003/role/disclosureRef
-Topic 260
-SubTopic 10
-Name Accounting Standards Codification
-Section 45
-Paragraph 10
-Publisher FASB
-URI https://asc.fasb.org//1943274/2147482689/260-10-45-10
| Name: |
us-gaap_WeightedAverageNumberOfSharesOutstandingBasic |
| Namespace Prefix: |
us-gaap_ |
| Data Type: |
xbrli:sharesItemType |
| Balance Type: |
na |
| Period Type: |
duration |
|
| X |
- Details
| Name: |
srt_ProductOrServiceAxis=INLX_SaleOfSoftwareMember |
| Namespace Prefix: |
|
| Data Type: |
na |
| Balance Type: |
|
| Period Type: |
|
|
| X |
- Details
| Name: |
srt_ProductOrServiceAxis=INLX_SoftwareAsAServiceMember |
| Namespace Prefix: |
|
| Data Type: |
na |
| Balance Type: |
|
| Period Type: |
|
|
| X |
- Details
| Name: |
srt_ProductOrServiceAxis=INLX_SoftwareMaintenanceServicesMember |
| Namespace Prefix: |
|
| Data Type: |
na |
| Balance Type: |
|
| Period Type: |
|
|
| X |
- Details
| Name: |
srt_ProductOrServiceAxis=INLX_ProfessionalServicesMember |
| Namespace Prefix: |
|
| Data Type: |
na |
| Balance Type: |
|
| Period Type: |
|
|
| X |
- Details
| Name: |
srt_ProductOrServiceAxis=INLX_StorageandRetrievalServicesMember |
| Namespace Prefix: |
|
| Data Type: |
na |
| Balance Type: |
|
| Period Type: |
|
|
v3.23.2
Condensed Consolidated Statement of Stockholders' Equity (Unaudited) - USD ($)
|
Common Stock [Member] |
Additional Paid-in Capital [Member] |
Retained Earnings [Member] |
Total |
| Beginning balance, value at Dec. 31, 2021 |
$ 2,823
|
$ 24,297,229
|
$ (21,638,316)
|
$ 2,661,736
|
| Beginning balance, shares at Dec. 31, 2021 |
2,823,072
|
|
|
|
| Stock Option Compensation |
|
125,952
|
|
125,952
|
| Stock Issued |
$ 1,243
|
5,739,515
|
|
5,740,758
|
| Stock Issued, shares |
1,242,588
|
|
|
|
| Equity Issuance Costs |
|
(492,182)
|
|
(492,182)
|
| Note Offer Warrants |
|
213,013
|
|
213,013
|
| Net Income (Loss) |
|
|
(394,293)
|
(394,293)
|
| Stock Issued to Directors |
$ 8
|
57,492
|
|
57,500
|
| Stock Issued to Directors, shares |
8,097
|
|
|
|
| Ending balance, value at Jun. 30, 2022 |
$ 4,074
|
29,941,019
|
(22,032,609)
|
7,912,484
|
| Ending balance, shares at Jun. 30, 2022 |
4,073,757
|
|
|
|
| Beginning balance, value at Mar. 31, 2022 |
$ 2,831
|
24,377,681
|
(21,658,442)
|
2,722,070
|
| Beginning balance, shares at Mar. 31, 2022 |
2,831,169
|
|
|
|
| Stock Option Compensation |
|
102,992
|
|
102,992
|
| Stock Issued |
$ 1,243
|
5,739,515
|
|
5,740,758
|
| Stock Issued, shares |
1,242,588
|
|
|
|
| Equity Issuance Costs |
|
(492,182)
|
|
(492,182)
|
| Note Offer Warrants |
|
213,013
|
|
213,013
|
| Net Income (Loss) |
|
|
(374,167)
|
(374,167)
|
| Ending balance, value at Jun. 30, 2022 |
$ 4,074
|
29,941,019
|
(22,032,609)
|
7,912,484
|
| Ending balance, shares at Jun. 30, 2022 |
4,073,757
|
|
|
|
| Beginning balance, value at Dec. 31, 2022 |
$ 4,074
|
30,179,017
|
(21,614,289)
|
8,568,802
|
| Beginning balance, shares at Dec. 31, 2022 |
4,073,757
|
|
|
|
| Stock Option Compensation |
|
233,617
|
|
233,617
|
| Net Income (Loss) |
|
|
248,297
|
248,297
|
| Ending balance, value at Jun. 30, 2023 |
$ 4,074
|
30,412,634
|
(21,365,992)
|
9,050,716
|
| Ending balance, shares at Jun. 30, 2023 |
4,073,757
|
|
|
|
| Beginning balance, value at Mar. 31, 2023 |
$ 4,074
|
30,297,179
|
(21,501,726)
|
8,799,527
|
| Beginning balance, shares at Mar. 31, 2023 |
4,073,757
|
|
|
|
| Stock Option Compensation |
|
115,455
|
|
115,455
|
| Net Income (Loss) |
|
|
135,734
|
135,734
|
| Ending balance, value at Jun. 30, 2023 |
$ 4,074
|
$ 30,412,634
|
$ (21,365,992)
|
$ 9,050,716
|
| Ending balance, shares at Jun. 30, 2023 |
4,073,757
|
|
|
|
| X |
- DefinitionStock Issued to Directors, shares.
| Name: |
INLX_StockIssuedDuringPeriodSharesIssuedToDirectors |
| Namespace Prefix: |
INLX_ |
| Data Type: |
xbrli:sharesItemType |
| Balance Type: |
na |
| Period Type: |
duration |
|
| X |
- DefinitionStock Issued to Directors.
| Name: |
INLX_StockIssuedDuringPeriodValueIssuedToDirectors |
| Namespace Prefix: |
INLX_ |
| Data Type: |
xbrli:monetaryItemType |
| Balance Type: |
credit |
| Period Type: |
duration |
|
| X |
- DefinitionAmount of increase to additional paid-in capital (APIC) for recognition of cost for option under share-based payment arrangement.
| Name: |
us-gaap_AdjustmentsToAdditionalPaidInCapitalShareBasedCompensationStockOptionsRequisiteServicePeriodRecognition |
| Namespace Prefix: |
us-gaap_ |
| Data Type: |
xbrli:monetaryItemType |
| Balance Type: |
credit |
| Period Type: |
duration |
|
| X |
- DefinitionAmount of decrease in additional paid in capital (APIC) resulting from direct costs associated with issuing stock. Includes, but is not limited to, legal and accounting fees and direct costs associated with stock issues under a shelf registration. Reference 1: http://fasb.org/us-gaap/role/ref/legacyRef
-Name Accounting Standards Codification
-Section 50
-Paragraph 2
-SubTopic 10
-Topic 505
-Publisher FASB
-URI https://asc.fasb.org//1943274/2147481112/505-10-50-2
Reference 2: http://fasb.org/us-gaap/role/ref/legacyRef
-Topic 505
-SubTopic 10
-Name Accounting Standards Codification
-Section S99
-Paragraph 1
-Subparagraph (SX 210.3-04)
-Publisher FASB
-URI https://asc.fasb.org//1943274/2147480008/505-10-S99-1
| Name: |
us-gaap_AdjustmentsToAdditionalPaidInCapitalStockIssuedIssuanceCosts |
| Namespace Prefix: |
us-gaap_ |
| Data Type: |
xbrli:monetaryItemType |
| Balance Type: |
debit |
| Period Type: |
duration |
|
| X |
- DefinitionAmount of increase in additional paid in capital (APIC) resulting from the issuance of warrants. Includes allocation of proceeds of debt securities issued with detachable stock purchase warrants. Reference 1: http://fasb.org/us-gaap/role/ref/legacyRef
-Name Accounting Standards Codification
-Section 50
-Paragraph 2
-SubTopic 10
-Topic 505
-Publisher FASB
-URI https://asc.fasb.org//1943274/2147481112/505-10-50-2
Reference 2: http://fasb.org/us-gaap/role/ref/legacyRef
-Topic 505
-SubTopic 10
-Name Accounting Standards Codification
-Section S99
-Paragraph 1
-Subparagraph (SX 210.3-04)
-Publisher FASB
-URI https://asc.fasb.org//1943274/2147480008/505-10-S99-1
Reference 3: http://fasb.org/us-gaap/role/ref/legacyRef
-Name Accounting Standards Codification
-Topic 470
-SubTopic 20
-Section 25
-Paragraph 2
-Publisher FASB
-URI https://asc.fasb.org//1943274/2147481284/470-20-25-2
| Name: |
us-gaap_AdjustmentsToAdditionalPaidInCapitalWarrantIssued |
| Namespace Prefix: |
us-gaap_ |
| Data Type: |
xbrli:monetaryItemType |
| Balance Type: |
credit |
| Period Type: |
duration |
|
| X |
- DefinitionThe portion of profit or loss for the period, net of income taxes, which is attributable to the parent. Reference 1: http://www.xbrl.org/2003/role/disclosureRef
-Topic 235
-SubTopic 10
-Name Accounting Standards Codification
-Section S99
-Paragraph 1
-Subparagraph (SX 210.4-08(g)(1)(ii))
-Publisher FASB
-URI https://asc.fasb.org//1943274/2147480678/235-10-S99-1
Reference 2: http://www.xbrl.org/2003/role/disclosureRef
-Topic 323
-SubTopic 10
-Name Accounting Standards Codification
-Section 50
-Paragraph 3
-Subparagraph (c)
-Publisher FASB
-URI https://asc.fasb.org//1943274/2147481687/323-10-50-3
Reference 3: http://www.xbrl.org/2003/role/disclosureRef
-Topic 825
-SubTopic 10
-Name Accounting Standards Codification
-Section 50
-Paragraph 28
-Subparagraph (f)
-Publisher FASB
-URI https://asc.fasb.org//1943274/2147482907/825-10-50-28
Reference 4: http://www.xbrl.org/2003/role/disclosureRef
-Topic 220
-SubTopic 10
-Name Accounting Standards Codification
-Section 50
-Paragraph 6
-Publisher FASB
-URI https://asc.fasb.org//1943274/2147482765/220-10-50-6
Reference 5: http://www.xbrl.org/2003/role/disclosureRef
-Topic 250
-SubTopic 10
-Name Accounting Standards Codification
-Section 50
-Paragraph 3
-Publisher FASB
-URI https://asc.fasb.org//1943274/2147483443/250-10-50-3
Reference 6: http://www.xbrl.org/2003/role/disclosureRef
-Topic 250
-SubTopic 10
-Name Accounting Standards Codification
-Section 50
-Paragraph 1
-Subparagraph (b)(2)
-Publisher FASB
-URI https://asc.fasb.org//1943274/2147483443/250-10-50-1
Reference 7: http://www.xbrl.org/2003/role/disclosureRef
-Topic 815
-SubTopic 40
-Name Accounting Standards Codification
-Section 65
-Paragraph 1
-Subparagraph (f)
-Publisher FASB
-URI https://asc.fasb.org//1943274/2147480175/815-40-65-1
Reference 8: http://www.xbrl.org/2003/role/disclosureRef
-Topic 250
-SubTopic 10
-Name Accounting Standards Codification
-Section 50
-Paragraph 8
-Publisher FASB
-URI https://asc.fasb.org//1943274/2147483443/250-10-50-8
Reference 9: http://www.xbrl.org/2003/role/disclosureRef
-Topic 250
-SubTopic 10
-Name Accounting Standards Codification
-Section 50
-Paragraph 9
-Publisher FASB
-URI https://asc.fasb.org//1943274/2147483443/250-10-50-9
Reference 10: http://www.xbrl.org/2003/role/disclosureRef
-Topic 250
-SubTopic 10
-Name Accounting Standards Codification
-Section 50
-Paragraph 11
-Subparagraph (a)
-Publisher FASB
-URI https://asc.fasb.org//1943274/2147483443/250-10-50-11
Reference 11: http://www.xbrl.org/2003/role/disclosureRef
-Topic 250
-SubTopic 10
-Name Accounting Standards Codification
-Section 50
-Paragraph 11
-Subparagraph (b)
-Publisher FASB
-URI https://asc.fasb.org//1943274/2147483443/250-10-50-11
Reference 12: http://www.xbrl.org/2003/role/disclosureRef
-Topic 250
-SubTopic 10
-Name Accounting Standards Codification
-Section 50
-Paragraph 4
-Publisher FASB
-URI https://asc.fasb.org//1943274/2147483443/250-10-50-4
Reference 13: http://www.xbrl.org/2003/role/exampleRef
-Topic 946
-SubTopic 830
-Name Accounting Standards Codification
-Section 55
-Paragraph 10
-Publisher FASB
-URI https://asc.fasb.org//1943274/2147480167/946-830-55-10
Reference 14: http://www.xbrl.org/2003/role/disclosureRef
-Topic 946
-SubTopic 220
-Name Accounting Standards Codification
-Section 45
-Paragraph 7
-Publisher FASB
-URI https://asc.fasb.org//1943274/2147483581/946-220-45-7
Reference 15: http://www.xbrl.org/2003/role/disclosureRef
-Topic 944
-SubTopic 220
-Name Accounting Standards Codification
-Section S99
-Paragraph 1
-Subparagraph (SX 210.7-04(18))
-Publisher FASB
-URI https://asc.fasb.org//1943274/2147483586/944-220-S99-1
Reference 16: http://www.xbrl.org/2003/role/disclosureRef
-Topic 280
-SubTopic 10
-Name Accounting Standards Codification
-Section 50
-Paragraph 22
-Publisher FASB
-URI https://asc.fasb.org//1943274/2147482810/280-10-50-22
Reference 17: http://www.xbrl.org/2003/role/disclosureRef
-Topic 946
-SubTopic 220
-Name Accounting Standards Codification
-Section S99
-Paragraph 1
-Subparagraph (SX 210.6-07(9))
-Publisher FASB
-URI https://asc.fasb.org//1943274/2147483575/946-220-S99-1
Reference 18: http://www.xbrl.org/2003/role/disclosureRef
-Topic 946
-SubTopic 220
-Name Accounting Standards Codification
-Section S99
-Paragraph 3
-Subparagraph (SX 210.6-09(1)(d))
-Publisher FASB
-URI https://asc.fasb.org//1943274/2147483575/946-220-S99-3
Reference 19: http://www.xbrl.org/2003/role/disclosureRef
-Topic 470
-SubTopic 10
-Name Accounting Standards Codification
-Section S99
-Paragraph 1A
-Subparagraph (SX 210.13-01(a)(4)(i))
-Publisher FASB
-URI https://asc.fasb.org//1943274/2147480097/470-10-S99-1A
Reference 20: http://www.xbrl.org/2009/role/commonPracticeRef
-Topic 470
-SubTopic 10
-Name Accounting Standards Codification
-Section S99
-Paragraph 1A
-Subparagraph (SX 210.13-01(a)(4)(ii))
-Publisher FASB
-URI https://asc.fasb.org//1943274/2147480097/470-10-S99-1A
Reference 21: http://www.xbrl.org/2003/role/disclosureRef
-Topic 470
-SubTopic 10
-Name Accounting Standards Codification
-Section S99
-Paragraph 1A
-Subparagraph (SX 210.13-01(a)(4)(iii)(A))
-Publisher FASB
-URI https://asc.fasb.org//1943274/2147480097/470-10-S99-1A
Reference 22: http://www.xbrl.org/2003/role/disclosureRef
-Topic 470
-SubTopic 10
-Name Accounting Standards Codification
-Section S99
-Paragraph 1A
-Subparagraph (SX 210.13-01(a)(4)(iv))
-Publisher FASB
-URI https://asc.fasb.org//1943274/2147480097/470-10-S99-1A
Reference 23: http://www.xbrl.org/2003/role/disclosureRef
-Topic 470
-SubTopic 10
-Name Accounting Standards Codification
-Section S99
-Paragraph 1A
-Subparagraph (SX 210.13-01(a)(5))
-Publisher FASB
-URI https://asc.fasb.org//1943274/2147480097/470-10-S99-1A
Reference 24: http://www.xbrl.org/2003/role/disclosureRef
-Topic 470
-SubTopic 10
-Name Accounting Standards Codification
-Section S99
-Paragraph 1B
-Subparagraph (SX 210.13-02(a)(4)(i))
-Publisher FASB
-URI https://asc.fasb.org//1943274/2147480097/470-10-S99-1B
Reference 25: http://www.xbrl.org/2003/role/disclosureRef
-Topic 470
-SubTopic 10
-Name Accounting Standards Codification
-Section S99
-Paragraph 1B
-Subparagraph (SX 210.13-02(a)(4)(iii)(A))
-Publisher FASB
-URI https://asc.fasb.org//1943274/2147480097/470-10-S99-1B
Reference 26: http://www.xbrl.org/2003/role/disclosureRef
-Topic 470
-SubTopic 10
-Name Accounting Standards Codification
-Section S99
-Paragraph 1B
-Subparagraph (SX 210.13-02(a)(4)(iii)(B))
-Publisher FASB
-URI https://asc.fasb.org//1943274/2147480097/470-10-S99-1B
Reference 27: http://www.xbrl.org/2003/role/disclosureRef
-Topic 470
-SubTopic 10
-Name Accounting Standards Codification
-Section S99
-Paragraph 1B
-Subparagraph (SX 210.13-02(a)(4)(iv))
-Publisher FASB
-URI https://asc.fasb.org//1943274/2147480097/470-10-S99-1B
Reference 28: http://www.xbrl.org/2003/role/disclosureRef
-Topic 470
-SubTopic 10
-Name Accounting Standards Codification
-Section S99
-Paragraph 1B
-Subparagraph (SX 210.13-02(a)(5))
-Publisher FASB
-URI https://asc.fasb.org//1943274/2147480097/470-10-S99-1B
Reference 29: http://www.xbrl.org/2003/role/disclosureRef
-Topic 280
-SubTopic 10
-Name Accounting Standards Codification
-Section 50
-Paragraph 30
-Subparagraph (b)
-Publisher FASB
-URI https://asc.fasb.org//1943274/2147482810/280-10-50-30
Reference 30: http://www.xbrl.org/2003/role/disclosureRef
-Topic 280
-SubTopic 10
-Name Accounting Standards Codification
-Section 50
-Paragraph 32
-Subparagraph (f)
-Publisher FASB
-URI https://asc.fasb.org//1943274/2147482810/280-10-50-32
Reference 31: http://www.xbrl.org/2003/role/disclosureRef
-Topic 260
-SubTopic 10
-Name Accounting Standards Codification
-Section 45
-Paragraph 60B
-Subparagraph (a)
-Publisher FASB
-URI https://asc.fasb.org//1943274/2147482689/260-10-45-60B
Reference 32: http://www.xbrl.org/2003/role/exampleRef
-Topic 280
-SubTopic 10
-Name Accounting Standards Codification
-Section 50
-Paragraph 31
-Publisher FASB
-URI https://asc.fasb.org//1943274/2147482810/280-10-50-31
Reference 33: http://www.xbrl.org/2003/role/disclosureRef
-Topic 280
-SubTopic 10
-Name Accounting Standards Codification
-Section 50
-Paragraph 32
-Subparagraph (c)
-Publisher FASB
-URI https://asc.fasb.org//1943274/2147482810/280-10-50-32
Reference 34: http://www.xbrl.org/2003/role/disclosureRef
-Topic 205
-SubTopic 20
-Name Accounting Standards Codification
-Section 50
-Paragraph 7
-Publisher FASB
-URI https://asc.fasb.org//1943274/2147483499/205-20-50-7
Reference 35: http://fasb.org/us-gaap/role/ref/legacyRef
-Topic 230
-SubTopic 10
-Name Accounting Standards Codification
-Section 45
-Paragraph 28
-Publisher FASB
-URI https://asc.fasb.org//1943274/2147482740/230-10-45-28
Reference 36: http://www.xbrl.org/2003/role/disclosureRef
-Topic 220
-SubTopic 10
-Name Accounting Standards Codification
-Section 45
-Paragraph 1A
-Subparagraph (a)
-Publisher FASB
-URI https://asc.fasb.org//1943274/2147482790/220-10-45-1A
Reference 37: http://www.xbrl.org/2003/role/disclosureRef
-Topic 220
-SubTopic 10
-Name Accounting Standards Codification
-Section 45
-Paragraph 1B
-Subparagraph (a)
-Publisher FASB
-URI https://asc.fasb.org//1943274/2147482790/220-10-45-1B
Reference 38: http://fasb.org/us-gaap/role/ref/legacyRef
-Topic 220
-SubTopic 10
-Name Accounting Standards Codification
-Section S99
-Paragraph 2
-Subparagraph (SX 210.5-03(20))
-Publisher FASB
-URI https://asc.fasb.org//1943274/2147483621/220-10-S99-2
Reference 39: http://fasb.org/us-gaap/role/ref/legacyRef
-Topic 942
-SubTopic 220
-Name Accounting Standards Codification
-Section S99
-Paragraph 1
-Subparagraph (SX 210.9-04(22))
-Publisher FASB
-URI https://asc.fasb.org//1943274/2147483589/942-220-S99-1
| Name: |
us-gaap_NetIncomeLoss |
| Namespace Prefix: |
us-gaap_ |
| Data Type: |
xbrli:monetaryItemType |
| Balance Type: |
credit |
| Period Type: |
duration |
|
| X |
- DefinitionNumber of shares issued which are neither cancelled nor held in the treasury.
| Name: |
us-gaap_SharesOutstanding |
| Namespace Prefix: |
us-gaap_ |
| Data Type: |
xbrli:sharesItemType |
| Balance Type: |
na |
| Period Type: |
instant |
|
| X |
- DefinitionNumber of new stock issued during the period. Reference 1: http://fasb.org/us-gaap/role/ref/legacyRef
-Name Accounting Standards Codification
-Section 50
-Paragraph 2
-SubTopic 10
-Topic 505
-Publisher FASB
-URI https://asc.fasb.org//1943274/2147481112/505-10-50-2
Reference 2: http://www.xbrl.org/2003/role/disclosureRef
-Topic 946
-SubTopic 505
-Name Accounting Standards Codification
-Section 50
-Paragraph 2
-Subparagraph (a)
-Publisher FASB
-URI https://asc.fasb.org//1943274/2147481004/946-505-50-2
Reference 3: http://www.xbrl.org/2003/role/disclosureRef
-Topic 946
-SubTopic 220
-Name Accounting Standards Codification
-Section S99
-Paragraph 3
-Subparagraph (SX 210.6-09(4)(b))
-Publisher FASB
-URI https://asc.fasb.org//1943274/2147483575/946-220-S99-3
Reference 4: http://www.xbrl.org/2003/role/disclosureRef
-Topic 946
-SubTopic 10
-Name Accounting Standards Codification
-Section S99
-Paragraph 3
-Subparagraph (SX 210.6-03(i)(1))
-Publisher FASB
-URI https://asc.fasb.org//1943274/2147479886/946-10-S99-3
Reference 5: http://fasb.org/us-gaap/role/ref/legacyRef
-Topic 210
-SubTopic 10
-Name Accounting Standards Codification
-Section S99
-Paragraph 1
-Subparagraph (SX 210.5-02(28))
-Publisher FASB
-URI https://asc.fasb.org//1943274/2147480566/210-10-S99-1
Reference 6: http://fasb.org/us-gaap/role/ref/legacyRef
-Topic 505
-SubTopic 10
-Name Accounting Standards Codification
-Section S99
-Paragraph 1
-Subparagraph (SX 210.3-04)
-Publisher FASB
-URI https://asc.fasb.org//1943274/2147480008/505-10-S99-1
Reference 7: http://fasb.org/us-gaap/role/ref/legacyRef
-Topic 210
-SubTopic 10
-Name Accounting Standards Codification
-Section S99
-Paragraph 1
-Subparagraph (SX 210.5-02(29))
-Publisher FASB
-URI https://asc.fasb.org//1943274/2147480566/210-10-S99-1
| Name: |
us-gaap_StockIssuedDuringPeriodSharesNewIssues |
| Namespace Prefix: |
us-gaap_ |
| Data Type: |
xbrli:sharesItemType |
| Balance Type: |
na |
| Period Type: |
duration |
|
| X |
- DefinitionEquity impact of the value of new stock issued during the period. Includes shares issued in an initial public offering or a secondary public offering. Reference 1: http://fasb.org/us-gaap/role/ref/legacyRef
-Name Accounting Standards Codification
-Section 50
-Paragraph 2
-SubTopic 10
-Topic 505
-Publisher FASB
-URI https://asc.fasb.org//1943274/2147481112/505-10-50-2
Reference 2: http://www.xbrl.org/2003/role/exampleRef
-Topic 946
-SubTopic 830
-Name Accounting Standards Codification
-Section 55
-Paragraph 11
-Publisher FASB
-URI https://asc.fasb.org//1943274/2147480167/946-830-55-11
Reference 3: http://www.xbrl.org/2003/role/disclosureRef
-Topic 946
-SubTopic 205
-Name Accounting Standards Codification
-Section 45
-Paragraph 4
-Subparagraph (a)
-Publisher FASB
-URI https://asc.fasb.org//1943274/2147480767/946-205-45-4
Reference 4: http://www.xbrl.org/2003/role/disclosureRef
-Topic 946
-SubTopic 505
-Name Accounting Standards Codification
-Section 50
-Paragraph 2
-Subparagraph (a)
-Publisher FASB
-URI https://asc.fasb.org//1943274/2147481004/946-505-50-2
Reference 5: http://www.xbrl.org/2003/role/disclosureRef
-Topic 946
-SubTopic 220
-Name Accounting Standards Codification
-Section S99
-Paragraph 3
-Subparagraph (SX 210.6-09(4)(b))
-Publisher FASB
-URI https://asc.fasb.org//1943274/2147483575/946-220-S99-3
Reference 6: http://fasb.org/us-gaap/role/ref/legacyRef
-Topic 210
-SubTopic 10
-Name Accounting Standards Codification
-Section S99
-Paragraph 1
-Subparagraph (SX 210.5-02(28))
-Publisher FASB
-URI https://asc.fasb.org//1943274/2147480566/210-10-S99-1
Reference 7: http://fasb.org/us-gaap/role/ref/legacyRef
-Topic 505
-SubTopic 10
-Name Accounting Standards Codification
-Section S99
-Paragraph 1
-Subparagraph (SX 210.3-04)
-Publisher FASB
-URI https://asc.fasb.org//1943274/2147480008/505-10-S99-1
Reference 8: http://fasb.org/us-gaap/role/ref/legacyRef
-Topic 210
-SubTopic 10
-Name Accounting Standards Codification
-Section S99
-Paragraph 1
-Subparagraph (SX 210.5-02(29))
-Publisher FASB
-URI https://asc.fasb.org//1943274/2147480566/210-10-S99-1
| Name: |
us-gaap_StockIssuedDuringPeriodValueNewIssues |
| Namespace Prefix: |
us-gaap_ |
| Data Type: |
xbrli:monetaryItemType |
| Balance Type: |
credit |
| Period Type: |
duration |
|
| X |
- DefinitionAmount of equity (deficit) attributable to parent. Excludes temporary equity and equity attributable to noncontrolling interest. Reference 1: http://www.xbrl.org/2003/role/exampleRef
-Topic 852
-SubTopic 10
-Name Accounting Standards Codification
-Section 55
-Paragraph 10
-Publisher FASB
-URI https://asc.fasb.org//1943274/2147481372/852-10-55-10
Reference 2: http://www.xbrl.org/2003/role/exampleRef
-Topic 946
-SubTopic 830
-Name Accounting Standards Codification
-Section 55
-Paragraph 12
-Publisher FASB
-URI https://asc.fasb.org//1943274/2147480167/946-830-55-12
Reference 3: http://www.xbrl.org/2003/role/disclosureRef
-Topic 946
-SubTopic 210
-Name Accounting Standards Codification
-Section S99
-Paragraph 1
-Subparagraph (SX 210.6-04(19))
-Publisher FASB
-URI https://asc.fasb.org//1943274/2147479617/946-210-S99-1
Reference 4: http://www.xbrl.org/2003/role/disclosureRef
-Topic 946
-SubTopic 210
-Name Accounting Standards Codification
-Section S99
-Paragraph 2
-Subparagraph (SX 210.6-05(4))
-Publisher FASB
-URI https://asc.fasb.org//1943274/2147479617/946-210-S99-2
Reference 5: http://www.xbrl.org/2009/role/commonPracticeRef
-Topic 946
-SubTopic 220
-Name Accounting Standards Codification
-Section S99
-Paragraph 3
-Subparagraph (SX 210.6-09(4)(b))
-Publisher FASB
-URI https://asc.fasb.org//1943274/2147483575/946-220-S99-3
Reference 6: http://www.xbrl.org/2003/role/disclosureRef
-Topic 946
-SubTopic 220
-Name Accounting Standards Codification
-Section S99
-Paragraph 3
-Subparagraph (SX 210.6-09(6))
-Publisher FASB
-URI https://asc.fasb.org//1943274/2147483575/946-220-S99-3
Reference 7: http://www.xbrl.org/2003/role/disclosureRef
-Topic 946
-SubTopic 220
-Name Accounting Standards Codification
-Section S99
-Paragraph 3
-Subparagraph (SX 210.6-09(7))
-Publisher FASB
-URI https://asc.fasb.org//1943274/2147483575/946-220-S99-3
Reference 8: http://www.xbrl.org/2009/role/commonPracticeRef
-Topic 235
-SubTopic 10
-Name Accounting Standards Codification
-Section S99
-Paragraph 1
-Subparagraph (SX 210.4-08(g)(1)(ii))
-Publisher FASB
-URI https://asc.fasb.org//1943274/2147480678/235-10-S99-1
Reference 9: http://www.xbrl.org/2009/role/commonPracticeRef
-Topic 323
-SubTopic 10
-Name Accounting Standards Codification
-Section 50
-Paragraph 3
-Subparagraph (c)
-Publisher FASB
-URI https://asc.fasb.org//1943274/2147481687/323-10-50-3
Reference 10: http://www.xbrl.org/2009/role/commonPracticeRef
-Topic 825
-SubTopic 10
-Name Accounting Standards Codification
-Section 50
-Paragraph 28
-Subparagraph (f)
-Publisher FASB
-URI https://asc.fasb.org//1943274/2147482907/825-10-50-28
Reference 11: http://fasb.org/us-gaap/role/ref/legacyRef
-Topic 210
-SubTopic 10
-Name Accounting Standards Codification
-Section S99
-Paragraph 1
-Subparagraph (SX 210.5-02(29))
-Publisher FASB
-URI https://asc.fasb.org//1943274/2147480566/210-10-S99-1
Reference 12: http://fasb.org/us-gaap/role/ref/legacyRef
-Topic 210
-SubTopic 10
-Name Accounting Standards Codification
-Section S99
-Paragraph 1
-Subparagraph (SX 210.5-02(31))
-Publisher FASB
-URI https://asc.fasb.org//1943274/2147480566/210-10-S99-1
Reference 13: http://fasb.org/us-gaap/role/ref/legacyRef
-Topic 210
-SubTopic 10
-Name Accounting Standards Codification
-Section S99
-Paragraph 1
-Subparagraph (SX 210.5-02(30))
-Publisher FASB
-URI https://asc.fasb.org//1943274/2147480566/210-10-S99-1
Reference 14: http://fasb.org/us-gaap/role/ref/legacyRef
-Topic 310
-SubTopic 10
-Name Accounting Standards Codification
-Section S99
-Paragraph 2
-Subparagraph (SAB Topic 4.E)
-Publisher FASB
-URI https://asc.fasb.org//1943274/2147480418/310-10-S99-2
| Name: |
us-gaap_StockholdersEquity |
| Namespace Prefix: |
us-gaap_ |
| Data Type: |
xbrli:monetaryItemType |
| Balance Type: |
credit |
| Period Type: |
instant |
|
v3.23.2
Condensed Consolidated Statements of Cash Flows (Unaudited) - USD ($)
|
6 Months Ended |
Jun. 30, 2023 |
Jun. 30, 2022 |
| Cash flows from operating activities: |
|
|
| Net income (loss) |
$ 248,297
|
$ (394,293)
|
| Adjustments to reconcile net income (loss) to net cash used in / provided by operating activities: |
|
|
| Depreciation and amortization |
467,521
|
318,221
|
| Bad debt expense |
27,528
|
2,327
|
| Amortization of deferred financing costs |
95,152
|
90,801
|
| Amortization of debt discount |
17,778
|
53,332
|
| Amortization of right of use asset, financing |
14,959
|
|
| Stock issued for services |
|
57,500
|
| Stock option compensation |
233,617
|
125,952
|
| Change in fair value of earnout liabilities |
|
116,505
|
| Changes in operating assets and liabilities: |
|
|
| Accounts receivable |
(233,431)
|
370,617
|
| Accounts receivable, unbilled |
(441,603)
|
9,703
|
| Parts and supplies |
652
|
(8,442)
|
| Prepaid expenses and other current assets |
(27,999)
|
(146,026)
|
| Accounts payable and accrued expenses |
(22,062)
|
64,641
|
| Operating lease assets and liabilities, net |
6,280
|
15,333
|
| Deferred compensation |
|
(50,414)
|
| Deferred revenues |
(686,320)
|
(553,108)
|
| Total adjustments |
(547,928)
|
466,942
|
| Net cash (used in) provided by operating activities |
(299,631)
|
72,649
|
| Cash flows from investing activities: |
|
|
| Cash paid to acquire business, net |
|
(6,383,269)
|
| Capitalization of internal use software |
(208,417)
|
(171,205)
|
| Purchases of property and equipment |
(82,684)
|
(98,199)
|
| Net cash used in investing activities |
(291,101)
|
(6,652,673)
|
| Cash flows from financing activities: |
|
|
| Payment of earnout liabilities |
(700,000)
|
(1,018,333)
|
| Proceeds from issuance of common stock |
|
5,740,758
|
| Offering costs paid on issuance of common stock and notes |
|
(746,342)
|
| Proceeds from notes payable |
|
2,364,500
|
| Proceeds from notes payable - related parties |
|
600,000
|
| Principal payments on financing lease liability |
(12,312)
|
|
| Repayment of notes payable |
(262,950)
|
|
| Net cash (used in) provided by financing activities |
(975,262)
|
6,940,583
|
| Net (decrease) increase in cash |
(1,565,994)
|
360,559
|
| Cash - beginning of period |
2,696,481
|
1,752,630
|
| Cash - end of period |
1,130,487
|
2,113,189
|
| Supplemental disclosure of cash flow information: |
|
|
| Cash paid during the period for interest |
226,570
|
208,935
|
| Cash paid during the period for income taxes |
7,708
|
9,576
|
| Supplemental disclosure of non-cash financing activities: |
|
|
| Discount on notes payable for warrants |
|
169,900
|
| Discount on notes payable - related parties for warrants |
|
43,113
|
| Warrants issued and extended for common stock issuance costs |
|
412,500
|
| Supplemental disclosure of non-cash investing activities relating to business acquisitions: |
|
|
| Accounts receivable |
|
68,380
|
| Prepaid expenses |
|
38,913
|
| Property and equipment |
|
30,018
|
| Intangible assets |
|
3,888,000
|
| Goodwill |
|
3,466,934
|
| Accounts payable |
|
(36,446)
|
| Deferred revenues |
|
(1,072,530)
|
| Net assets acquired in acquisition |
|
6,383,269
|
| Cash used in business acquisition |
|
$ 6,383,269
|
| X |
- DefinitionChange in fair value of earnout liabilities.
| Name: |
INLX_ChangeInFairValueOfEarnoutLiabilities |
| Namespace Prefix: |
INLX_ |
| Data Type: |
xbrli:monetaryItemType |
| Balance Type: |
credit |
| Period Type: |
duration |
|
| X |
- DefinitionDiscount on notes payable for warrants.
| Name: |
INLX_DiscountOnNotesPayableForWarrants |
| Namespace Prefix: |
INLX_ |
| Data Type: |
xbrli:monetaryItemType |
| Balance Type: |
credit |
| Period Type: |
duration |
|
| X |
- DefinitionIncrease decrease in unbilled receivable.
| Name: |
INLX_IncreaseDecreaseInUnbilledReceivable |
| Namespace Prefix: |
INLX_ |
| Data Type: |
xbrli:monetaryItemType |
| Balance Type: |
credit |
| Period Type: |
duration |
|
| X |
- DefinitionNon cash financing accounts receivable.
| Name: |
INLX_NonCashFinancingAccountsReceivable |
| Namespace Prefix: |
INLX_ |
| Data Type: |
xbrli:monetaryItemType |
| Balance Type: |
debit |
| Period Type: |
duration |
|
| X |
- DefinitionNon cash financing activities accounts payable.
| Name: |
INLX_NonCashFinancingActivitiesAccountsPayable |
| Namespace Prefix: |
INLX_ |
| Data Type: |
xbrli:monetaryItemType |
| Balance Type: |
credit |
| Period Type: |
duration |
|
| X |
- DefinitionNon cash financing activities cash used in business acquisitions.
| Name: |
INLX_NonCashFinancingActivitiesCashUsedInBusinessAcquisitions |
| Namespace Prefix: |
INLX_ |
| Data Type: |
xbrli:monetaryItemType |
| Balance Type: |
debit |
| Period Type: |
duration |
|
| X |
- DefinitionNon cash financing activities deferred revenues.
| Name: |
INLX_NonCashFinancingActivitiesDeferredRevenues |
| Namespace Prefix: |
INLX_ |
| Data Type: |
xbrli:monetaryItemType |
| Balance Type: |
debit |
| Period Type: |
duration |
|
| X |
- DefinitionNon cash financing activities goodwill.
| Name: |
INLX_NonCashFinancingActivitiesGoodwill |
| Namespace Prefix: |
INLX_ |
| Data Type: |
xbrli:monetaryItemType |
| Balance Type: |
debit |
| Period Type: |
duration |
|
| X |
- DefinitionNon cash financing activities intangible assets.
| Name: |
INLX_NonCashFinancingActivitiesIntangibleAssets |
| Namespace Prefix: |
INLX_ |
| Data Type: |
xbrli:monetaryItemType |
| Balance Type: |
debit |
| Period Type: |
duration |
|
| X |
- DefinitionNon cash financing activities net assets acquired in acquisition.
| Name: |
INLX_NonCashFinancingActivitiesNetAssetsAcquiredInAcquisition |
| Namespace Prefix: |
INLX_ |
| Data Type: |
xbrli:monetaryItemType |
| Balance Type: |
debit |
| Period Type: |
duration |
|
| X |
- DefinitionNon cash financing activities prepaid expenses.
| Name: |
INLX_NonCashFinancingActivitiesPrepaidExpenses |
| Namespace Prefix: |
INLX_ |
| Data Type: |
xbrli:monetaryItemType |
| Balance Type: |
debit |
| Period Type: |
duration |
|
| X |
- DefinitionNon cash financing activities property and equipment.
| Name: |
INLX_NonCashFinancingActivitiesPropertyAndEquipment |
| Namespace Prefix: |
INLX_ |
| Data Type: |
xbrli:monetaryItemType |
| Balance Type: |
debit |
| Period Type: |
duration |
|
| X |
- DefinitionPayment of earnout liabilities.
| Name: |
INLX_PaymentOfEarnoutLiabilities |
| Namespace Prefix: |
INLX_ |
| Data Type: |
xbrli:monetaryItemType |
| Balance Type: |
credit |
| Period Type: |
duration |
|
| X |
- DefinitionSupplemental disclosure of Non cash financing activities relating to business acquisition abstract
| Name: |
INLX_SupplementalDisclosureOfNoncashFinancingActivitiesRelatingToBusinessAcquisitionAbstract |
| Namespace Prefix: |
INLX_ |
| Data Type: |
xbrli:stringItemType |
| Balance Type: |
na |
| Period Type: |
duration |
|
| X |
- DefinitionWarrants issued and extended for common stock issuance costs.
| Name: |
INLX_WarrantsIssuedAndExtendedForCommonStockIssuanceCosts |
| Namespace Prefix: |
INLX_ |
| Data Type: |
xbrli:monetaryItemType |
| Balance Type: |
credit |
| Period Type: |
duration |
|
| X |
- DefinitionThe sum of adjustments which are added to or deducted from net income or loss, including the portion attributable to noncontrolling interest, to reflect cash provided by or used in operating activities, in accordance with the indirect cash flow method. Reference 1: http://fasb.org/us-gaap/role/ref/legacyRef
-Topic 230
-SubTopic 10
-Name Accounting Standards Codification
-Section 45
-Paragraph 28
-Publisher FASB
-URI https://asc.fasb.org//1943274/2147482740/230-10-45-28
| Name: |
us-gaap_AdjustmentsToReconcileNetIncomeLossToCashProvidedByUsedInOperatingActivities |
| Namespace Prefix: |
us-gaap_ |
| Data Type: |
xbrli:monetaryItemType |
| Balance Type: |
debit |
| Period Type: |
duration |
|
| X |
- References
+ Details
| Name: |
us-gaap_AdjustmentsToReconcileNetIncomeLossToCashProvidedByUsedInOperatingActivitiesAbstract |
| Namespace Prefix: |
us-gaap_ |
| Data Type: |
xbrli:stringItemType |
| Balance Type: |
na |
| Period Type: |
duration |
|
| X |
- DefinitionAmount of noncash expense included in interest expense to amortize debt discount and premium associated with the related debt instruments. Excludes amortization of financing costs. Alternate captions include noncash interest expense. Reference 1: http://fasb.org/us-gaap/role/ref/legacyRef
-Name Accounting Standards Codification
-Section 45
-Paragraph 28
-Subparagraph (b)
-SubTopic 10
-Topic 230
-Publisher FASB
-URI https://asc.fasb.org//1943274/2147482740/230-10-45-28
Reference 2: http://www.xbrl.org/2003/role/disclosureRef
-Topic 470
-SubTopic 20
-Name Accounting Standards Codification
-Section 50
-Paragraph 1F
-Subparagraph (b)(2)
-Publisher FASB
-URI https://asc.fasb.org//1943274/2147481139/470-20-50-1F
Reference 3: http://fasb.org/us-gaap/role/ref/legacyRef
-Name Accounting Standards Codification
-Topic 835
-SubTopic 30
-Section 45
-Paragraph 1A
-Publisher FASB
-URI https://asc.fasb.org//1943274/2147482925/835-30-45-1A
Reference 4: http://fasb.org/us-gaap/role/ref/legacyRef
-Topic 220
-SubTopic 10
-Name Accounting Standards Codification
-Section S99
-Paragraph 2
-Subparagraph (SX 210.5-03.8)
-Publisher FASB
-URI https://asc.fasb.org//1943274/2147483621/220-10-S99-2
| Name: |
us-gaap_AmortizationOfDebtDiscountPremium |
| Namespace Prefix: |
us-gaap_ |
| Data Type: |
xbrli:monetaryItemType |
| Balance Type: |
debit |
| Period Type: |
duration |
|
| X |
- DefinitionAmount of amortization expense attributable to debt issuance costs. Reference 1: http://www.xbrl.org/2003/role/disclosureRef
-Topic 470
-SubTopic 20
-Name Accounting Standards Codification
-Section 50
-Paragraph 1F
-Subparagraph (b)(2)
-Publisher FASB
-URI https://asc.fasb.org//1943274/2147481139/470-20-50-1F
Reference 2: http://www.xbrl.org/2009/role/commonPracticeRef
-Topic 230
-SubTopic 10
-Name Accounting Standards Codification
-Section 45
-Paragraph 28
-Subparagraph (b)
-Publisher FASB
-URI https://asc.fasb.org//1943274/2147482740/230-10-45-28
Reference 3: http://www.xbrl.org/2003/role/disclosureRef
-Topic 835
-SubTopic 30
-Name Accounting Standards Codification
-Section 45
-Paragraph 3
-Publisher FASB
-URI https://asc.fasb.org//1943274/2147482925/835-30-45-3
Reference 4: http://fasb.org/us-gaap/role/ref/legacyRef
-Topic 220
-SubTopic 10
-Name Accounting Standards Codification
-Section S99
-Paragraph 2
-Subparagraph (SX 210.5-03(8))
-Publisher FASB
-URI https://asc.fasb.org//1943274/2147483621/220-10-S99-2
| Name: |
us-gaap_AmortizationOfFinancingCosts |
| Namespace Prefix: |
us-gaap_ |
| Data Type: |
xbrli:monetaryItemType |
| Balance Type: |
debit |
| Period Type: |
duration |
|
| X |
- DefinitionAmount of cash and cash equivalents, and cash and cash equivalents restricted to withdrawal or usage; including, but not limited to, disposal group and discontinued operations. Cash includes, but is not limited to, currency on hand, demand deposits with banks or financial institutions, and other accounts with general characteristics of demand deposits. Cash equivalents include, but are not limited to, short-term, highly liquid investments that are both readily convertible to known amounts of cash and so near their maturity that they present insignificant risk of changes in value because of changes in interest rates. Reference 1: http://www.xbrl.org/2003/role/disclosureRef
-Topic 230
-SubTopic 10
-Name Accounting Standards Codification
-Section 50
-Paragraph 8
-Publisher FASB
-URI https://asc.fasb.org//1943274/2147482913/230-10-50-8
Reference 2: http://fasb.org/us-gaap/role/ref/legacyRef
-Topic 230
-SubTopic 10
-Name Accounting Standards Codification
-Section 45
-Paragraph 24
-Publisher FASB
-URI https://asc.fasb.org//1943274/2147482740/230-10-45-24
Reference 3: http://fasb.org/us-gaap/role/ref/legacyRef
-Name Accounting Standards Codification
-Topic 230
-SubTopic 10
-Section 45
-Paragraph 4
-Publisher FASB
-URI https://asc.fasb.org//1943274/2147482740/230-10-45-4
| Name: |
us-gaap_CashCashEquivalentsRestrictedCashAndRestrictedCashEquivalentsIncludingDisposalGroupAndDiscontinuedOperations |
| Namespace Prefix: |
us-gaap_ |
| Data Type: |
xbrli:monetaryItemType |
| Balance Type: |
debit |
| Period Type: |
instant |
|
| X |
- DefinitionAmount of increase (decrease) in cash, cash equivalents, and cash and cash equivalents restricted to withdrawal or usage; including effect from exchange rate change. Cash includes, but is not limited to, currency on hand, demand deposits with banks or financial institutions, and other accounts with general characteristics of demand deposits. Cash equivalents include, but are not limited to, short-term, highly liquid investments that are both readily convertible to known amounts of cash and so near their maturity that they present insignificant risk of changes in value because of changes in interest rates. Reference 1: http://fasb.org/us-gaap/role/ref/legacyRef
-Topic 230
-SubTopic 10
-Name Accounting Standards Codification
-Section 45
-Paragraph 24
-Publisher FASB
-URI https://asc.fasb.org//1943274/2147482740/230-10-45-24
Reference 2: http://fasb.org/us-gaap/role/ref/legacyRef
-Name Accounting Standards Codification
-Section 45
-Paragraph 1
-SubTopic 230
-Topic 830
-Publisher FASB
-URI https://asc.fasb.org//1943274/2147481877/830-230-45-1
| Name: |
us-gaap_CashCashEquivalentsRestrictedCashAndRestrictedCashEquivalentsPeriodIncreaseDecreaseIncludingExchangeRateEffect |
| Namespace Prefix: |
us-gaap_ |
| Data Type: |
xbrli:monetaryItemType |
| Balance Type: |
debit |
| Period Type: |
duration |
|
| X |
- References
+ Details
| Name: |
us-gaap_CashFlowNoncashInvestingAndFinancingActivitiesDisclosureAbstract |
| Namespace Prefix: |
us-gaap_ |
| Data Type: |
xbrli:stringItemType |
| Balance Type: |
na |
| Period Type: |
duration |
|
| X |
- DefinitionThe current period expense charged against earnings on long-lived, physical assets not used in production, and which are not intended for resale, to allocate or recognize the cost of such assets over their useful lives; or to record the reduction in book value of an intangible asset over the benefit period of such asset; or to reflect consumption during the period of an asset that is not used in production. Reference 1: http://fasb.org/us-gaap/role/ref/legacyRef
-Name Accounting Standards Codification
-Section 45
-Paragraph 28
-Subparagraph (b)
-SubTopic 10
-Topic 230
-Publisher FASB
-URI https://asc.fasb.org//1943274/2147482740/230-10-45-28
Reference 2: http://fasb.org/us-gaap/role/ref/legacyRef
-Name Accounting Standards Codification
-Topic 360
-SubTopic 10
-Section 50
-Paragraph 1
-Subparagraph (a)
-Publisher FASB
-URI https://asc.fasb.org//1943274/2147482099/360-10-50-1
| Name: |
us-gaap_DepreciationAndAmortization |
| Namespace Prefix: |
us-gaap_ |
| Data Type: |
xbrli:monetaryItemType |
| Balance Type: |
debit |
| Period Type: |
duration |
|
| X |
- DefinitionAmount of cash outflow for principal payment on finance lease. Reference 1: http://www.xbrl.org/2003/role/disclosureRef
-Topic 842
-SubTopic 20
-Name Accounting Standards Codification
-Section 50
-Paragraph 4
-Subparagraph (g)(1)
-Publisher FASB
-URI https://asc.fasb.org//1943274/2147478964/842-20-50-4
Reference 2: http://www.xbrl.org/2003/role/disclosureRef
-Topic 842
-SubTopic 20
-Name Accounting Standards Codification
-Section 45
-Paragraph 5
-Subparagraph (a)
-Publisher FASB
-URI https://asc.fasb.org//1943274/2147479041/842-20-45-5
| Name: |
us-gaap_FinanceLeasePrincipalPayments |
| Namespace Prefix: |
us-gaap_ |
| Data Type: |
xbrli:monetaryItemType |
| Balance Type: |
credit |
| Period Type: |
duration |
|
| X |
- DefinitionAmount of amortization expense attributable to right-of-use asset from finance lease. Reference 1: http://www.xbrl.org/2003/role/exampleRef
-Topic 842
-SubTopic 20
-Name Accounting Standards Codification
-Section 55
-Paragraph 53
-Publisher FASB
-URI https://asc.fasb.org//1943274/2147479589/842-20-55-53
Reference 2: http://www.xbrl.org/2003/role/disclosureRef
-Topic 842
-SubTopic 20
-Name Accounting Standards Codification
-Section 45
-Paragraph 4
-Subparagraph (a)
-Publisher FASB
-URI https://asc.fasb.org//1943274/2147479041/842-20-45-4
Reference 3: http://www.xbrl.org/2003/role/disclosureRef
-Topic 842
-SubTopic 20
-Name Accounting Standards Codification
-Section 50
-Paragraph 4
-Subparagraph (a)
-Publisher FASB
-URI https://asc.fasb.org//1943274/2147478964/842-20-50-4
| Name: |
us-gaap_FinanceLeaseRightOfUseAssetAmortization |
| Namespace Prefix: |
us-gaap_ |
| Data Type: |
xbrli:monetaryItemType |
| Balance Type: |
debit |
| Period Type: |
duration |
|
| X |
- DefinitionThe increase (decrease) during the reporting period in the amounts payable to vendors for goods and services received and the amount of obligations and expenses incurred but not paid. Reference 1: http://fasb.org/us-gaap/role/ref/legacyRef
-Name Accounting Standards Codification
-Section 45
-Paragraph 28
-Subparagraph (a)
-SubTopic 10
-Topic 230
-Publisher FASB
-URI https://asc.fasb.org//1943274/2147482740/230-10-45-28
| Name: |
us-gaap_IncreaseDecreaseInAccountsPayableAndAccruedLiabilities |
| Namespace Prefix: |
us-gaap_ |
| Data Type: |
xbrli:monetaryItemType |
| Balance Type: |
debit |
| Period Type: |
duration |
|
| X |
- DefinitionThe increase (decrease) during the reporting period in amount due within one year (or one business cycle) from customers for the credit sale of goods and services. Reference 1: http://fasb.org/us-gaap/role/ref/legacyRef
-Name Accounting Standards Codification
-Section 45
-Paragraph 28
-Subparagraph (a)
-SubTopic 10
-Topic 230
-Publisher FASB
-URI https://asc.fasb.org//1943274/2147482740/230-10-45-28
| Name: |
us-gaap_IncreaseDecreaseInAccountsReceivable |
| Namespace Prefix: |
us-gaap_ |
| Data Type: |
xbrli:monetaryItemType |
| Balance Type: |
credit |
| Period Type: |
duration |
|
| X |
- DefinitionAmount of increase (decrease) in obligation to transfer good or service to customer for which consideration has been received or is receivable. Reference 1: http://www.xbrl.org/2003/role/disclosureRef
-Topic 912
-SubTopic 310
-Name Accounting Standards Codification
-Section 45
-Paragraph 11
-Subparagraph (b)
-Publisher FASB
-URI https://asc.fasb.org//1943274/2147482312/912-310-45-11
Reference 2: http://www.xbrl.org/2009/role/commonPracticeRef
-Topic 230
-SubTopic 10
-Name Accounting Standards Codification
-Section 45
-Paragraph 28
-Subparagraph (a)
-Publisher FASB
-URI https://asc.fasb.org//1943274/2147482740/230-10-45-28
| Name: |
us-gaap_IncreaseDecreaseInContractWithCustomerLiability |
| Namespace Prefix: |
us-gaap_ |
| Data Type: |
xbrli:monetaryItemType |
| Balance Type: |
debit |
| Period Type: |
duration |
|
| X |
- DefinitionThe increase (decrease) during the reporting period in the obligation created by employee agreements whereby earned compensation will be paid in the future. Reference 1: http://fasb.org/us-gaap/role/ref/legacyRef
-Name Accounting Standards Codification
-Section 45
-Paragraph 28
-Subparagraph (a)
-SubTopic 10
-Topic 230
-Publisher FASB
-URI https://asc.fasb.org//1943274/2147482740/230-10-45-28
| Name: |
us-gaap_IncreaseDecreaseInDeferredCompensation |
| Namespace Prefix: |
us-gaap_ |
| Data Type: |
xbrli:monetaryItemType |
| Balance Type: |
debit |
| Period Type: |
duration |
|
| X |
- DefinitionThe increase (decrease) during the reporting period in the aggregate value of all inventory held by the reporting entity, associated with underlying transactions that are classified as operating activities. Reference 1: http://fasb.org/us-gaap/role/ref/legacyRef
-Name Accounting Standards Codification
-Section 45
-Paragraph 28
-Subparagraph (a)
-SubTopic 10
-Topic 230
-Publisher FASB
-URI https://asc.fasb.org//1943274/2147482740/230-10-45-28
| Name: |
us-gaap_IncreaseDecreaseInInventories |
| Namespace Prefix: |
us-gaap_ |
| Data Type: |
xbrli:monetaryItemType |
| Balance Type: |
credit |
| Period Type: |
duration |
|
| X |
- References
+ Details
| Name: |
us-gaap_IncreaseDecreaseInOperatingCapitalAbstract |
| Namespace Prefix: |
us-gaap_ |
| Data Type: |
xbrli:stringItemType |
| Balance Type: |
na |
| Period Type: |
duration |
|
| X |
- DefinitionAmount of increase (decrease) in obligation for operating lease. Reference 1: http://www.xbrl.org/2009/role/commonPracticeRef
-Topic 230
-SubTopic 10
-Name Accounting Standards Codification
-Section 45
-Paragraph 28
-Subparagraph (a)
-Publisher FASB
-URI https://asc.fasb.org//1943274/2147482740/230-10-45-28
Reference 2: http://www.xbrl.org/2009/role/commonPracticeRef
-Name Accounting Standards Codification
-Section 50
-Paragraph 4
-Subparagraph (g)(1)
-SubTopic 20
-Topic 842
-Publisher FASB
-URI https://asc.fasb.org//1943274/2147478964/842-20-50-4
| Name: |
us-gaap_IncreaseDecreaseInOperatingLeaseLiability |
| Namespace Prefix: |
us-gaap_ |
| Data Type: |
xbrli:monetaryItemType |
| Balance Type: |
debit |
| Period Type: |
duration |
|
| X |
- DefinitionAmount of increase (decrease) in prepaid expenses, and assets classified as other. Reference 1: http://fasb.org/us-gaap/role/ref/legacyRef
-Name Accounting Standards Codification
-Section 45
-Paragraph 28
-Subparagraph (a)
-SubTopic 10
-Topic 230
-Publisher FASB
-URI https://asc.fasb.org//1943274/2147482740/230-10-45-28
| Name: |
us-gaap_IncreaseDecreaseInPrepaidDeferredExpenseAndOtherAssets |
| Namespace Prefix: |
us-gaap_ |
| Data Type: |
xbrli:monetaryItemType |
| Balance Type: |
credit |
| Period Type: |
duration |
|
| X |
- DefinitionAmount of cash paid for interest, excluding capitalized interest, classified as operating activity. Includes, but is not limited to, payment to settle zero-coupon bond for accreted interest of debt discount and debt instrument with insignificant coupon interest rate in relation to effective interest rate of borrowing attributable to accreted interest of debt discount. Reference 1: http://www.xbrl.org/2003/role/disclosureRef
-Topic 230
-SubTopic 10
-Name Accounting Standards Codification
-Section 45
-Paragraph 17
-Subparagraph (d)
-Publisher FASB
-URI https://asc.fasb.org//1943274/2147482740/230-10-45-17
Reference 2: http://www.xbrl.org/2003/role/disclosureRef
-Topic 230
-SubTopic 10
-Name Accounting Standards Codification
-Section 45
-Paragraph 25
-Subparagraph (e)
-Publisher FASB
-URI https://asc.fasb.org//1943274/2147482740/230-10-45-25
Reference 3: http://www.xbrl.org/2003/role/disclosureRef
-Topic 230
-SubTopic 10
-Name Accounting Standards Codification
-Section 50
-Paragraph 2
-Publisher FASB
-URI https://asc.fasb.org//1943274/2147482913/230-10-50-2
| Name: |
us-gaap_InterestPaidNet |
| Namespace Prefix: |
us-gaap_ |
| Data Type: |
xbrli:monetaryItemType |
| Balance Type: |
credit |
| Period Type: |
duration |
|
| X |
- DefinitionFair value of share-based compensation granted to nonemployees as payment for services rendered or acknowledged claims. Reference 1: http://fasb.org/us-gaap/role/ref/legacyRef
-Name Accounting Standards Codification
-Section 45
-Paragraph 28
-Subparagraph (b)
-SubTopic 10
-Topic 230
-Publisher FASB
-URI https://asc.fasb.org//1943274/2147482740/230-10-45-28
| Name: |
us-gaap_IssuanceOfStockAndWarrantsForServicesOrClaims |
| Namespace Prefix: |
us-gaap_ |
| Data Type: |
xbrli:monetaryItemType |
| Balance Type: |
debit |
| Period Type: |
duration |
|
| X |
- DefinitionAmount of cash inflow (outflow) from financing activities, including discontinued operations. Financing activity cash flows include obtaining resources from owners and providing them with a return on, and a return of, their investment; borrowing money and repaying amounts borrowed, or settling the obligation; and obtaining and paying for other resources obtained from creditors on long-term credit. Reference 1: http://www.xbrl.org/2003/role/disclosureRef
-Topic 230
-SubTopic 10
-Name Accounting Standards Codification
-Section 45
-Paragraph 24
-Publisher FASB
-URI https://asc.fasb.org//1943274/2147482740/230-10-45-24
| Name: |
us-gaap_NetCashProvidedByUsedInFinancingActivities |
| Namespace Prefix: |
us-gaap_ |
| Data Type: |
xbrli:monetaryItemType |
| Balance Type: |
debit |
| Period Type: |
duration |
|
| X |
- References
+ Details
| Name: |
us-gaap_NetCashProvidedByUsedInFinancingActivitiesAbstract |
| Namespace Prefix: |
us-gaap_ |
| Data Type: |
xbrli:stringItemType |
| Balance Type: |
na |
| Period Type: |
duration |
|
| X |
- DefinitionAmount of cash inflow (outflow) from investing activities, including discontinued operations. Investing activity cash flows include making and collecting loans and acquiring and disposing of debt or equity instruments and property, plant, and equipment and other productive assets. Reference 1: http://www.xbrl.org/2003/role/disclosureRef
-Topic 230
-SubTopic 10
-Name Accounting Standards Codification
-Section 45
-Paragraph 24
-Publisher FASB
-URI https://asc.fasb.org//1943274/2147482740/230-10-45-24
| Name: |
us-gaap_NetCashProvidedByUsedInInvestingActivities |
| Namespace Prefix: |
us-gaap_ |
| Data Type: |
xbrli:monetaryItemType |
| Balance Type: |
debit |
| Period Type: |
duration |
|
| X |
- References
+ Details
| Name: |
us-gaap_NetCashProvidedByUsedInInvestingActivitiesAbstract |
| Namespace Prefix: |
us-gaap_ |
| Data Type: |
xbrli:stringItemType |
| Balance Type: |
na |
| Period Type: |
duration |
|
| X |
- DefinitionAmount of cash inflow (outflow) from operating activities, including discontinued operations. Operating activity cash flows include transactions, adjustments, and changes in value not defined as investing or financing activities. Reference 1: http://fasb.org/us-gaap/role/ref/legacyRef
-Topic 230
-SubTopic 10
-Name Accounting Standards Codification
-Section 45
-Paragraph 28
-Publisher FASB
-URI https://asc.fasb.org//1943274/2147482740/230-10-45-28
Reference 2: http://fasb.org/us-gaap/role/ref/legacyRef
-Topic 230
-SubTopic 10
-Name Accounting Standards Codification
-Section 45
-Paragraph 24
-Publisher FASB
-URI https://asc.fasb.org//1943274/2147482740/230-10-45-24
Reference 3: http://fasb.org/us-gaap/role/ref/legacyRef
-Topic 230
-SubTopic 10
-Name Accounting Standards Codification
-Section 45
-Paragraph 25
-Publisher FASB
-URI https://asc.fasb.org//1943274/2147482740/230-10-45-25
| Name: |
us-gaap_NetCashProvidedByUsedInOperatingActivities |
| Namespace Prefix: |
us-gaap_ |
| Data Type: |
xbrli:monetaryItemType |
| Balance Type: |
na |
| Period Type: |
duration |
|
| X |
- References
+ Details
| Name: |
us-gaap_NetCashProvidedByUsedInOperatingActivitiesAbstract |
| Namespace Prefix: |
us-gaap_ |
| Data Type: |
xbrli:stringItemType |
| Balance Type: |
na |
| Period Type: |
duration |
|
| X |
- DefinitionThe portion of profit or loss for the period, net of income taxes, which is attributable to the parent. Reference 1: http://www.xbrl.org/2003/role/disclosureRef
-Topic 235
-SubTopic 10
-Name Accounting Standards Codification
-Section S99
-Paragraph 1
-Subparagraph (SX 210.4-08(g)(1)(ii))
-Publisher FASB
-URI https://asc.fasb.org//1943274/2147480678/235-10-S99-1
Reference 2: http://www.xbrl.org/2003/role/disclosureRef
-Topic 323
-SubTopic 10
-Name Accounting Standards Codification
-Section 50
-Paragraph 3
-Subparagraph (c)
-Publisher FASB
-URI https://asc.fasb.org//1943274/2147481687/323-10-50-3
Reference 3: http://www.xbrl.org/2003/role/disclosureRef
-Topic 825
-SubTopic 10
-Name Accounting Standards Codification
-Section 50
-Paragraph 28
-Subparagraph (f)
-Publisher FASB
-URI https://asc.fasb.org//1943274/2147482907/825-10-50-28
Reference 4: http://www.xbrl.org/2003/role/disclosureRef
-Topic 220
-SubTopic 10
-Name Accounting Standards Codification
-Section 50
-Paragraph 6
-Publisher FASB
-URI https://asc.fasb.org//1943274/2147482765/220-10-50-6
Reference 5: http://www.xbrl.org/2003/role/disclosureRef
-Topic 250
-SubTopic 10
-Name Accounting Standards Codification
-Section 50
-Paragraph 3
-Publisher FASB
-URI https://asc.fasb.org//1943274/2147483443/250-10-50-3
Reference 6: http://www.xbrl.org/2003/role/disclosureRef
-Topic 250
-SubTopic 10
-Name Accounting Standards Codification
-Section 50
-Paragraph 1
-Subparagraph (b)(2)
-Publisher FASB
-URI https://asc.fasb.org//1943274/2147483443/250-10-50-1
Reference 7: http://www.xbrl.org/2003/role/disclosureRef
-Topic 815
-SubTopic 40
-Name Accounting Standards Codification
-Section 65
-Paragraph 1
-Subparagraph (f)
-Publisher FASB
-URI https://asc.fasb.org//1943274/2147480175/815-40-65-1
Reference 8: http://www.xbrl.org/2003/role/disclosureRef
-Topic 250
-SubTopic 10
-Name Accounting Standards Codification
-Section 50
-Paragraph 8
-Publisher FASB
-URI https://asc.fasb.org//1943274/2147483443/250-10-50-8
Reference 9: http://www.xbrl.org/2003/role/disclosureRef
-Topic 250
-SubTopic 10
-Name Accounting Standards Codification
-Section 50
-Paragraph 9
-Publisher FASB
-URI https://asc.fasb.org//1943274/2147483443/250-10-50-9
Reference 10: http://www.xbrl.org/2003/role/disclosureRef
-Topic 250
-SubTopic 10
-Name Accounting Standards Codification
-Section 50
-Paragraph 11
-Subparagraph (a)
-Publisher FASB
-URI https://asc.fasb.org//1943274/2147483443/250-10-50-11
Reference 11: http://www.xbrl.org/2003/role/disclosureRef
-Topic 250
-SubTopic 10
-Name Accounting Standards Codification
-Section 50
-Paragraph 11
-Subparagraph (b)
-Publisher FASB
-URI https://asc.fasb.org//1943274/2147483443/250-10-50-11
Reference 12: http://www.xbrl.org/2003/role/disclosureRef
-Topic 250
-SubTopic 10
-Name Accounting Standards Codification
-Section 50
-Paragraph 4
-Publisher FASB
-URI https://asc.fasb.org//1943274/2147483443/250-10-50-4
Reference 13: http://www.xbrl.org/2003/role/exampleRef
-Topic 946
-SubTopic 830
-Name Accounting Standards Codification
-Section 55
-Paragraph 10
-Publisher FASB
-URI https://asc.fasb.org//1943274/2147480167/946-830-55-10
Reference 14: http://www.xbrl.org/2003/role/disclosureRef
-Topic 946
-SubTopic 220
-Name Accounting Standards Codification
-Section 45
-Paragraph 7
-Publisher FASB
-URI https://asc.fasb.org//1943274/2147483581/946-220-45-7
Reference 15: http://www.xbrl.org/2003/role/disclosureRef
-Topic 944
-SubTopic 220
-Name Accounting Standards Codification
-Section S99
-Paragraph 1
-Subparagraph (SX 210.7-04(18))
-Publisher FASB
-URI https://asc.fasb.org//1943274/2147483586/944-220-S99-1
Reference 16: http://www.xbrl.org/2003/role/disclosureRef
-Topic 280
-SubTopic 10
-Name Accounting Standards Codification
-Section 50
-Paragraph 22
-Publisher FASB
-URI https://asc.fasb.org//1943274/2147482810/280-10-50-22
Reference 17: http://www.xbrl.org/2003/role/disclosureRef
-Topic 946
-SubTopic 220
-Name Accounting Standards Codification
-Section S99
-Paragraph 1
-Subparagraph (SX 210.6-07(9))
-Publisher FASB
-URI https://asc.fasb.org//1943274/2147483575/946-220-S99-1
Reference 18: http://www.xbrl.org/2003/role/disclosureRef
-Topic 946
-SubTopic 220
-Name Accounting Standards Codification
-Section S99
-Paragraph 3
-Subparagraph (SX 210.6-09(1)(d))
-Publisher FASB
-URI https://asc.fasb.org//1943274/2147483575/946-220-S99-3
Reference 19: http://www.xbrl.org/2003/role/disclosureRef
-Topic 470
-SubTopic 10
-Name Accounting Standards Codification
-Section S99
-Paragraph 1A
-Subparagraph (SX 210.13-01(a)(4)(i))
-Publisher FASB
-URI https://asc.fasb.org//1943274/2147480097/470-10-S99-1A
Reference 20: http://www.xbrl.org/2009/role/commonPracticeRef
-Topic 470
-SubTopic 10
-Name Accounting Standards Codification
-Section S99
-Paragraph 1A
-Subparagraph (SX 210.13-01(a)(4)(ii))
-Publisher FASB
-URI https://asc.fasb.org//1943274/2147480097/470-10-S99-1A
Reference 21: http://www.xbrl.org/2003/role/disclosureRef
-Topic 470
-SubTopic 10
-Name Accounting Standards Codification
-Section S99
-Paragraph 1A
-Subparagraph (SX 210.13-01(a)(4)(iii)(A))
-Publisher FASB
-URI https://asc.fasb.org//1943274/2147480097/470-10-S99-1A
Reference 22: http://www.xbrl.org/2003/role/disclosureRef
-Topic 470
-SubTopic 10
-Name Accounting Standards Codification
-Section S99
-Paragraph 1A
-Subparagraph (SX 210.13-01(a)(4)(iv))
-Publisher FASB
-URI https://asc.fasb.org//1943274/2147480097/470-10-S99-1A
Reference 23: http://www.xbrl.org/2003/role/disclosureRef
-Topic 470
-SubTopic 10
-Name Accounting Standards Codification
-Section S99
-Paragraph 1A
-Subparagraph (SX 210.13-01(a)(5))
-Publisher FASB
-URI https://asc.fasb.org//1943274/2147480097/470-10-S99-1A
Reference 24: http://www.xbrl.org/2003/role/disclosureRef
-Topic 470
-SubTopic 10
-Name Accounting Standards Codification
-Section S99
-Paragraph 1B
-Subparagraph (SX 210.13-02(a)(4)(i))
-Publisher FASB
-URI https://asc.fasb.org//1943274/2147480097/470-10-S99-1B
Reference 25: http://www.xbrl.org/2003/role/disclosureRef
-Topic 470
-SubTopic 10
-Name Accounting Standards Codification
-Section S99
-Paragraph 1B
-Subparagraph (SX 210.13-02(a)(4)(iii)(A))
-Publisher FASB
-URI https://asc.fasb.org//1943274/2147480097/470-10-S99-1B
Reference 26: http://www.xbrl.org/2003/role/disclosureRef
-Topic 470
-SubTopic 10
-Name Accounting Standards Codification
-Section S99
-Paragraph 1B
-Subparagraph (SX 210.13-02(a)(4)(iii)(B))
-Publisher FASB
-URI https://asc.fasb.org//1943274/2147480097/470-10-S99-1B
Reference 27: http://www.xbrl.org/2003/role/disclosureRef
-Topic 470
-SubTopic 10
-Name Accounting Standards Codification
-Section S99
-Paragraph 1B
-Subparagraph (SX 210.13-02(a)(4)(iv))
-Publisher FASB
-URI https://asc.fasb.org//1943274/2147480097/470-10-S99-1B
Reference 28: http://www.xbrl.org/2003/role/disclosureRef
-Topic 470
-SubTopic 10
-Name Accounting Standards Codification
-Section S99
-Paragraph 1B
-Subparagraph (SX 210.13-02(a)(5))
-Publisher FASB
-URI https://asc.fasb.org//1943274/2147480097/470-10-S99-1B
Reference 29: http://www.xbrl.org/2003/role/disclosureRef
-Topic 280
-SubTopic 10
-Name Accounting Standards Codification
-Section 50
-Paragraph 30
-Subparagraph (b)
-Publisher FASB
-URI https://asc.fasb.org//1943274/2147482810/280-10-50-30
Reference 30: http://www.xbrl.org/2003/role/disclosureRef
-Topic 280
-SubTopic 10
-Name Accounting Standards Codification
-Section 50
-Paragraph 32
-Subparagraph (f)
-Publisher FASB
-URI https://asc.fasb.org//1943274/2147482810/280-10-50-32
Reference 31: http://www.xbrl.org/2003/role/disclosureRef
-Topic 260
-SubTopic 10
-Name Accounting Standards Codification
-Section 45
-Paragraph 60B
-Subparagraph (a)
-Publisher FASB
-URI https://asc.fasb.org//1943274/2147482689/260-10-45-60B
Reference 32: http://www.xbrl.org/2003/role/exampleRef
-Topic 280
-SubTopic 10
-Name Accounting Standards Codification
-Section 50
-Paragraph 31
-Publisher FASB
-URI https://asc.fasb.org//1943274/2147482810/280-10-50-31
Reference 33: http://www.xbrl.org/2003/role/disclosureRef
-Topic 280
-SubTopic 10
-Name Accounting Standards Codification
-Section 50
-Paragraph 32
-Subparagraph (c)
-Publisher FASB
-URI https://asc.fasb.org//1943274/2147482810/280-10-50-32
Reference 34: http://www.xbrl.org/2003/role/disclosureRef
-Topic 205
-SubTopic 20
-Name Accounting Standards Codification
-Section 50
-Paragraph 7
-Publisher FASB
-URI https://asc.fasb.org//1943274/2147483499/205-20-50-7
Reference 35: http://fasb.org/us-gaap/role/ref/legacyRef
-Topic 230
-SubTopic 10
-Name Accounting Standards Codification
-Section 45
-Paragraph 28
-Publisher FASB
-URI https://asc.fasb.org//1943274/2147482740/230-10-45-28
Reference 36: http://www.xbrl.org/2003/role/disclosureRef
-Topic 220
-SubTopic 10
-Name Accounting Standards Codification
-Section 45
-Paragraph 1A
-Subparagraph (a)
-Publisher FASB
-URI https://asc.fasb.org//1943274/2147482790/220-10-45-1A
Reference 37: http://www.xbrl.org/2003/role/disclosureRef
-Topic 220
-SubTopic 10
-Name Accounting Standards Codification
-Section 45
-Paragraph 1B
-Subparagraph (a)
-Publisher FASB
-URI https://asc.fasb.org//1943274/2147482790/220-10-45-1B
Reference 38: http://fasb.org/us-gaap/role/ref/legacyRef
-Topic 220
-SubTopic 10
-Name Accounting Standards Codification
-Section S99
-Paragraph 2
-Subparagraph (SX 210.5-03(20))
-Publisher FASB
-URI https://asc.fasb.org//1943274/2147483621/220-10-S99-2
Reference 39: http://fasb.org/us-gaap/role/ref/legacyRef
-Topic 942
-SubTopic 220
-Name Accounting Standards Codification
-Section S99
-Paragraph 1
-Subparagraph (SX 210.9-04(22))
-Publisher FASB
-URI https://asc.fasb.org//1943274/2147483589/942-220-S99-1
| Name: |
us-gaap_NetIncomeLoss |
| Namespace Prefix: |
us-gaap_ |
| Data Type: |
xbrli:monetaryItemType |
| Balance Type: |
credit |
| Period Type: |
duration |
|
| X |
- DefinitionThe cash outflow for cost incurred directly with the issuance of an equity security. Reference 1: http://fasb.org/us-gaap/role/ref/legacyRef
-Name Accounting Standards Codification
-Topic 230
-SubTopic 10
-Section 45
-Paragraph 15
-Publisher FASB
-URI https://asc.fasb.org//1943274/2147482740/230-10-45-15
| Name: |
us-gaap_PaymentsOfStockIssuanceCosts |
| Namespace Prefix: |
us-gaap_ |
| Data Type: |
xbrli:monetaryItemType |
| Balance Type: |
credit |
| Period Type: |
duration |
|
| X |
- DefinitionThe cash outflow associated with the acquisition of business during the period. The cash portion only of the acquisition price. Reference 1: http://www.xbrl.org/2003/role/disclosureRef
-Topic 805
-SubTopic 30
-Name Accounting Standards Codification
-Section 50
-Paragraph 1
-Subparagraph (b)(1)
-Publisher FASB
-URI https://asc.fasb.org//1943274/2147479581/805-30-50-1
Reference 2: http://fasb.org/us-gaap/role/ref/legacyRef
-Name Accounting Standards Codification
-Topic 230
-SubTopic 10
-Section 45
-Paragraph 13
-Subparagraph (b)
-Publisher FASB
-URI https://asc.fasb.org//1943274/2147482740/230-10-45-13
| Name: |
us-gaap_PaymentsToAcquireBusinessesGross |
| Namespace Prefix: |
us-gaap_ |
| Data Type: |
xbrli:monetaryItemType |
| Balance Type: |
credit |
| Period Type: |
duration |
|
| X |
- DefinitionThe cash outflow associated with the acquisition of long-lived, physical assets that are used in the normal conduct of business to produce goods and services and not intended for resale; includes cash outflows to pay for construction of self-constructed assets. Reference 1: http://fasb.org/us-gaap/role/ref/legacyRef
-Topic 230
-SubTopic 10
-Name Accounting Standards Codification
-Section 45
-Paragraph 13
-Subparagraph (c)
-Publisher FASB
-URI https://asc.fasb.org//1943274/2147482740/230-10-45-13
| Name: |
us-gaap_PaymentsToAcquirePropertyPlantAndEquipment |
| Namespace Prefix: |
us-gaap_ |
| Data Type: |
xbrli:monetaryItemType |
| Balance Type: |
credit |
| Period Type: |
duration |
|
| X |
- DefinitionThe cash outflow associated with the acquisition from vendors of software programs or applications for internal use (that is, not to be sold, leased or otherwise marketed to others) that qualify for capitalization. Reference 1: http://fasb.org/us-gaap/role/ref/legacyRef
-Topic 230
-SubTopic 10
-Name Accounting Standards Codification
-Section 45
-Paragraph 13
-Subparagraph (c)
-Publisher FASB
-URI https://asc.fasb.org//1943274/2147482740/230-10-45-13
| Name: |
us-gaap_PaymentsToAcquireSoftware |
| Namespace Prefix: |
us-gaap_ |
| Data Type: |
xbrli:monetaryItemType |
| Balance Type: |
credit |
| Period Type: |
duration |
|
| X |
- DefinitionThe cash inflow from the additional capital contribution to the entity. Reference 1: http://fasb.org/us-gaap/role/ref/legacyRef
-Name Accounting Standards Codification
-Section 45
-Paragraph 14
-Subparagraph (a)
-SubTopic 10
-Topic 230
-Publisher FASB
-URI https://asc.fasb.org//1943274/2147482740/230-10-45-14
| Name: |
us-gaap_ProceedsFromIssuanceOfCommonStock |
| Namespace Prefix: |
us-gaap_ |
| Data Type: |
xbrli:monetaryItemType |
| Balance Type: |
debit |
| Period Type: |
duration |
|
| X |
- DefinitionThe cash inflow from a borrowing supported by a written promise to pay an obligation. Reference 1: http://fasb.org/us-gaap/role/ref/legacyRef
-Name Accounting Standards Codification
-Topic 230
-SubTopic 10
-Section 45
-Paragraph 14
-Subparagraph (b)
-Publisher FASB
-URI https://asc.fasb.org//1943274/2147482740/230-10-45-14
| Name: |
us-gaap_ProceedsFromNotesPayable |
| Namespace Prefix: |
us-gaap_ |
| Data Type: |
xbrli:monetaryItemType |
| Balance Type: |
debit |
| Period Type: |
duration |
|
| X |
- DefinitionAmount of expense (reversal of expense) for expected credit loss on accounts receivable. Reference 1: http://www.xbrl.org/2003/role/disclosureRef
-Topic 326
-SubTopic 20
-Name Accounting Standards Codification
-Section 50
-Paragraph 13
-Subparagraph (b)
-Publisher FASB
-URI https://asc.fasb.org//1943274/2147479319/326-20-50-13
Reference 2: http://www.xbrl.org/2003/role/disclosureRef
-Topic 220
-SubTopic 10
-Name Accounting Standards Codification
-Section S99
-Paragraph 2
-Subparagraph (SX 210.5-03(5))
-Publisher FASB
-URI https://asc.fasb.org//1943274/2147483621/220-10-S99-2
| Name: |
us-gaap_ProvisionForDoubtfulAccounts |
| Namespace Prefix: |
us-gaap_ |
| Data Type: |
xbrli:monetaryItemType |
| Balance Type: |
debit |
| Period Type: |
duration |
|
| X |
- DefinitionThe cash outflow for a borrowing supported by a written promise to pay an obligation. Reference 1: http://fasb.org/us-gaap/role/ref/legacyRef
-Name Accounting Standards Codification
-Topic 230
-SubTopic 10
-Section 45
-Paragraph 15
-Subparagraph (b)
-Publisher FASB
-URI https://asc.fasb.org//1943274/2147482740/230-10-45-15
| Name: |
us-gaap_RepaymentsOfNotesPayable |
| Namespace Prefix: |
us-gaap_ |
| Data Type: |
xbrli:monetaryItemType |
| Balance Type: |
credit |
| Period Type: |
duration |
|
| X |
- DefinitionAmount of noncash expense for option under share-based payment arrangement. Reference 1: http://fasb.org/us-gaap/role/ref/legacyRef
-Name Accounting Standards Codification
-Section 45
-Paragraph 28
-Subparagraph (b)
-SubTopic 10
-Topic 230
-Publisher FASB
-URI https://asc.fasb.org//1943274/2147482740/230-10-45-28
| Name: |
us-gaap_StockOptionPlanExpense |
| Namespace Prefix: |
us-gaap_ |
| Data Type: |
xbrli:monetaryItemType |
| Balance Type: |
debit |
| Period Type: |
duration |
|
v3.23.2
Business Organization and Nature of Operations
|
6 Months Ended |
Jun. 30, 2023 |
|---|
| Organization, Consolidation and Presentation of Financial Statements [Abstract] |
|
| Business Organization and Nature of Operations |
1.
Business Organization and Nature of Operations
Intellinetics,
Inc., formerly known as GlobalWise Investments, Inc., is a Nevada corporation incorporated in 1997, with two wholly-owned subsidiaries:
Intellinetics, Inc., an Ohio corporation (“Intellinetics Ohio”), and Graphic Sciences, Inc., a Michigan corporation (“Graphic
Sciences”). Intellinetics Ohio was incorporated in 1996, and on February 10, 2012, Intellinetics Ohio became our sole operating
subsidiary as a result of a reverse merger and recapitalization. On March 2, 2020, we purchased all the outstanding capital stock of
Graphic Sciences.
Our
digital transformation products and services are provided through two reporting segments: Document Management and Document Conversion.
Our Document Management segment, which includes the Yellow Folder, LLC (“Yellow Folder”) asset acquisition in April 2022
and the CEO Imaging Systems, Inc. (“CEO Image”) asset acquisition in April 2020, consists primarily of solutions involving
our software platform, allowing customers to capture and manage their documents across operations such as scanned hard-copy documents
and digital documents including those from Microsoft Office 365, digital images, audio, video and emails. Our Document Conversion segment,
which includes and primarily consists of the Graphic Sciences acquisition, provides assistance to customers as a part of their overall
document strategy to convert documents from one medium to another, predominantly paper to digital, including migration to our software
solutions, as well as long-term storage and retrieval services. Our solutions create value for customers by making it easy to connect
business-critical documents to the people who need them by making those documents easy to find and access, while also being secure and
compliant with the customers’ audit requirements. Solutions are sold both directly to end-users and through resellers.
|
| X |
- DefinitionThe entire disclosure for the nature of an entity's business, major products or services, principal markets including location, and the relative importance of its operations in each business and the basis for the determination, including but not limited to, assets, revenues, or earnings. For an entity that has not commenced principal operations, disclosures about the risks and uncertainties related to the activities in which the entity is currently engaged and an understanding of what those activities are being directed toward. Reference 1: http://www.xbrl.org/2003/role/disclosureRef
-Name Accounting Standards Codification
-Topic 275
-Publisher FASB
-URI https://asc.fasb.org//275/tableOfContent
Reference 2: http://www.xbrl.org/2003/role/disclosureRef
-Name Accounting Standards Codification
-Section 50
-Paragraph 1
-Subparagraph (a)
-SubTopic 10
-Topic 275
-Publisher FASB
-URI https://asc.fasb.org//1943274/2147482861/275-10-50-1
| Name: |
us-gaap_NatureOfOperations |
| Namespace Prefix: |
us-gaap_ |
| Data Type: |
dtr-types:textBlockItemType |
| Balance Type: |
na |
| Period Type: |
duration |
|
| X |
- References
+ Details
| Name: |
us-gaap_OrganizationConsolidationAndPresentationOfFinancialStatementsAbstract |
| Namespace Prefix: |
us-gaap_ |
| Data Type: |
xbrli:stringItemType |
| Balance Type: |
na |
| Period Type: |
duration |
|
v3.23.2
Basis of Presentation
|
6 Months Ended |
Jun. 30, 2023 |
|---|
| Organization, Consolidation and Presentation of Financial Statements [Abstract] |
|
| Basis of Presentation |
2.
Basis of Presentation
The
accompanying unaudited condensed consolidated financial statements have been prepared in accordance with United States generally accepted
accounting principles (“GAAP”).
The
financial statements presented in this Quarterly Report on Form 10-Q are unaudited. However, in the opinion of management, these unaudited
condensed consolidated financial statements include all adjustments, consisting solely of normal recurring adjustments, necessary to
present fairly the financial position, results of operations and cash flows for the periods presented in conformity with GAAP applicable
to interim periods. The financial data and other financial information disclosed in these notes to the accompanying condensed consolidated
financial statements are also unaudited. As such, certain information and footnote disclosures normally included in financial statements
prepared in accordance with GAAP have been condensed or omitted pursuant to applicable rules and regulations thereunder.
Operating
results for the interim periods presented are not necessarily indicative of the results that may be expected for the full fiscal year
ending December 31, 2023 or any other future period.
These
unaudited interim condensed consolidated financial statements should be read in conjunction with the consolidated financial statements
and the related notes included in our Annual Report on Form 10-K for the fiscal year ended December 31, 2022 filed with the SEC filed
on March 27, 2023.
|
| X |
- DefinitionThe entire disclosure for the basis of accounting, or basis of presentation, used to prepare the financial statements (for example, US Generally Accepted Accounting Principles, Other Comprehensive Basis of Accounting, IFRS). Reference 1: http://fasb.org/us-gaap/role/ref/legacyRef
-Topic 235
-Name Accounting Standards Codification
-Publisher FASB
-URI https://asc.fasb.org//235/tableOfContent
| Name: |
us-gaap_BasisOfAccounting |
| Namespace Prefix: |
us-gaap_ |
| Data Type: |
dtr-types:textBlockItemType |
| Balance Type: |
na |
| Period Type: |
duration |
|
| X |
- References
+ Details
| Name: |
us-gaap_OrganizationConsolidationAndPresentationOfFinancialStatementsAbstract |
| Namespace Prefix: |
us-gaap_ |
| Data Type: |
xbrli:stringItemType |
| Balance Type: |
na |
| Period Type: |
duration |
|
v3.23.2
Summary of Significant Accounting Policies
|
6 Months Ended |
Jun. 30, 2023 |
|---|
| Accounting Policies [Abstract] |
|
| Summary of Significant Accounting Policies |
3.
Summary of Significant Accounting Policies
Principles
of Consolidation
The
condensed consolidated financial statements accompanying these notes include the accounts of Intellinetics and the accounts of all its
subsidiaries in which it holds a controlling interest. Under GAAP, consolidation is generally required for investments of more than 50%
of the outstanding voting stock of an investee, except when control is not held by the majority owner. We have two subsidiaries: Intellinetics
Ohio and Graphic Sciences. We consider the criteria established under Financial Accounting Standards Board (“FASB”) Accounting
Standard Codification (“ASC”) 810, “Consolidations” in the consolidation process. All significant intercompany
balances and transactions have been eliminated in consolidation.
Concentrations
of Credit Risk
We
maintain our cash with high credit quality financial institutions. At times, our cash and cash equivalents may be uninsured or in deposit
accounts that exceed the Federal Deposit Insurance Corporation insurance limit.
We
do not generally require collateral or other security to support customer receivables; however, we may require customers to provide retainers,
up-front deposits or irrevocable letters-of-credit when considered necessary to mitigate credit risks. We have established an allowance
for credit losses based upon facts surrounding the credit risk of specific customers and expected future collections. Credit losses have
been within management’s expectations. At June 30, 2023 and December 31, 2022, our allowance for credit losses was $114,219 and
$88,331, respectively.
Contract
balances
The
following table present changes in our contract assets during the six months ended June 30, 2023 and 2022:
Schedule of Changes in Contract Assets
| | |
| | |
Addition | | |
| | |
| | |
| |
| | |
Balance at | | |
from | | |
| | |
| | |
Balance at | |
| | |
Beginning | | |
acquisition | | |
| | |
Recognized | | |
End of | |
| | |
of Period | | |
(Note 4) | | |
Billings | | |
Revenue | | |
Period | |
| Six months ended June 30, 2023 | |
| | | |
| | | |
| | | |
| | | |
| | |
| Accounts receivable | |
$ | 1,121,083 | | |
$ | - | | |
$ | 7,342,400 | | |
$ | (7,136,497 | ) | |
$ | 1,326,986 | |
| | |
| | | |
| | | |
| | | |
| | | |
| | |
| Six months ended June 30, 2022 | |
| | | |
| | | |
| | | |
| | | |
| | |
| Accounts receivable | |
$ | 1,176,059 | | |
$ | 68,380 | | |
$ | 5,604,581 | | |
$ | (5,977,525 | ) | |
$ | 871,495 | |
| | |
Balance at Beginning of Period | | |
Revenue Recognized in Advance of Billings | | |
Billings | | |
Balance at End of Period | |
| Six months ended June 30, 2023 | |
| | | |
| | | |
| | | |
| | |
| Accounts receivable, unbilled | |
$ | 596,410 | | |
$ | 2,703,932 | | |
$ | (2,262,329 | ) | |
$ | 1,038,013 | |
| | |
| | | |
| | | |
| | | |
| | |
| Six months ended June 30, 2022 | |
| | | |
| | | |
| | | |
| | |
| Accounts receivable, unbilled | |
$ | 444,782 | | |
$ | 1,501,726 | | |
$ | (1,511,429 | ) | |
$ | 435,079 | |
| | |
Balance at Beginning of Period | | |
Commissions Paid | | |
Commissions Recognized | | |
Balance at End of Period | |
| Six months ended June 30, 2023 | |
| | | |
| | | |
| | | |
| | |
| Other contract assets | |
$ | 80,378 | | |
$ | 80,077 | | |
$ | (63,985 | ) | |
$ | 96,470 | |
| | |
| | | |
| | | |
| | | |
| | |
| Six months ended June 30, 2022 | |
| | | |
| | | |
| | | |
| | |
| Other contract assets | |
$ | 78,556 | | |
$ | 52,310 | | |
$ | (29,708 | ) | |
$ | 101,158 | |
Deferred
revenue
Amounts
that have been invoiced are recognized in accounts receivable, deferred revenue or revenue, depending on whether the revenue recognition
criteria have been met. Deferred revenue represents amounts billed for which revenue has not yet been recognized. Deferred revenues typically
relate to maintenance and software-as-a-service agreements which have been paid for by customers prior to the performance of those services,
and payments received for professional services and license arrangements and software-as-a-service performance obligations that have
been deferred until fulfilled under our revenue recognition policy.
Remaining
performance obligations represent the transaction price from contracts for which work has not been performed or goods and services have
not been delivered. We expect to recognize revenue on approximately 97% of the remaining performance obligations over the next 12 months,
with the remainder recognized thereafter. As of June 30, 2023, the aggregate amount of the transaction price allocated to remaining performance
obligations for software as a service and software maintenance contracts with a duration greater than one year was $59,499. As of December
31, 2022, the aggregate amount of the transaction price allocated to remaining performance obligations for software as a service and
software maintenance contracts with a duration greater than one year was $74,448. This does not include revenue related to performance
obligations that are part of a contract whose original expected duration is one year or less.
The
following table presents changes in our contract liabilities during the six months ended June 30, 2023 and 2022:
| | |
| | |
Addition | | |
| | |
| | |
| |
| | |
Balance at | | |
from | | |
| | |
| | |
Balance at | |
| | |
Beginning | | |
acquisition | | |
| | |
Recognized | | |
End of | |
| |
of Period | | |
(Note 4) | | |
Billings | | |
Revenue | | |
Period | |
| Six months ended June 30, 2023 | |
| | |
| | |
| | |
| | |
| |
| Contract liabilities: Deferred revenue | |
$ | 2,754,064 | | |
$ | - | | |
$ | 3,522,274 | | |
$ | (4,208,594 | ) | |
$ | 2,067,744 | |
| | |
| | | |
| | | |
| | | |
| | | |
| | |
| Six months ended June 30, 2022 | |
| | | |
| | | |
| | | |
| | | |
| | |
| Contract liabilities: Deferred revenue | |
$ | 1,194,649 | | |
$ | 860,456 | | |
$ | 3,166,205 | | |
$ | (3,507,239 | ) | |
$ | 1,714,071 | |
Leases
We have made an accounting policy election to not
record a right-of-use asset and lease liability for short-term leases, which are defined as leases with a lease term of 12 months or less.
Instead, the lease payments are recognized as rent expense in the general and administrative expenses on the statement of operations.
Software
Development Costs
We
design, develop, test, market, license, and support new software products and enhancements of current products. We continuously
monitor our software products and enhancements to remain compatible with standard platforms and file formats. In accordance with ASC
985-20 “Costs of Software to be Sold, Leased or Otherwise Marketed,” we expense software development costs, including
costs to develop software products or the software component of products to be sold, leased, or marketed to external users, before
technological feasibility is reached. Once technological feasibility has been established, certain software development costs
incurred during the application development stage are eligible for capitalization. Based on our software development process,
technical feasibility is established upon completion of a working model. Technological feasibility is typically reached shortly
before the release of such products. No such costs were capitalized during the six-month period 2023. Such costs in the amount of
$43,771
were capitalized during the three and six-month period 2022.
In
accordance with ASC 350-40, “Internal-Use Software,” we capitalize purchase and implementation costs of internal use software.
Once an application has reached development stage, internal and external costs, if direct and incremental, are capitalized until the
software is substantially complete and ready for its intended use. Capitalization ceases upon completion of all substantial testing.
We also capitalize costs related to specific upgrades and enhancements when it is probable that the expenditure will result in additional
functionality. Such costs in the amount of $96,209 and $208,417 were capitalized during the three and six months ended June 30, 2023.
Such costs in the amount of $98,037 and $127,434 were capitalized during the three and six months ended June 30, 2022.
Capitalized
costs are stated at cost less accumulated amortization. Amortization is computed over the estimated useful lives of the related assets
on a straight-line basis, which is three years. At June 30, 2023 and December 31, 2022, our condensed consolidated balance sheets included
$525,337 and $402,673, respectively, in other long-term assets.
For
the three and six months ended June 30, 2023 and 2022, our expensed software development costs were $140,003 and $271,746, respectively,
and $62,208 and $114,959, respectively.
Recently
Issued Accounting Pronouncements
In
June 2016, the FASB issued ASU No. 2016-13 “Credit Losses - Measurement of Credit Losses on Financial Instruments.” ASU No.
2016-13 significantly changes how entities measure credit losses for most financial assets, including accounts receivable and held-to-maturity
marketable securities, by replacing today’s “incurred loss” approach with an “expected loss” model under
which allowances will be recognized based on expected rather than incurred losses. ASU No. 2016-13 became effective for us in the first
quarter of 2023. The adoption of ASU No. 2016-13 resulted in an initial reduction in the allowance for doubtful accounts of $11,662, and the current calculation is reflected in the accompanying condensed consolidated
financial statements.
Advertising
We
expense the cost of advertising as incurred. Advertising expense for the three and six months ended June 30, 2023 and 2022 amounted to
$6,123 and $12,243, respectively, and $9,052 and $9,500, respectively.
Earnings
(Loss) Per Share
Basic
income or loss per share is computed by dividing net income or loss by the weighted average number of shares of common stock outstanding
during the period. Diluted income or loss per share is computed by dividing net income or loss by the diluted weighted average number
of shares of common stock outstanding during the period. The diluted weighted average number of shares gives effect to all dilutive potential
common shares outstanding during the period using the treasury stock method. Diluted earnings per share exclude all diluted potential
shares if their effect is anti-dilutive, including warrants or options which are out-of-the-money and for those periods with a net loss.
We
have outstanding warrants and stock options which have not been included in the calculation of diluted net loss per share for the three
and six months ended June 30, 2023 and 2022 because to do so would be anti-dilutive. As such, the numerator and the denominator used
in computing both basic and diluted net loss per share for each period are the same.
Income
Taxes
We
file a consolidated federal income tax return with our subsidiaries. The provision for income taxes is computed by applying statutory
rates to income before taxes.
Deferred
income taxes are recognized for the tax consequences in future years of temporary differences between the financial reporting and tax
bases of assets and liabilities as of each period-end based on enacted tax laws and statutory rates. Valuation allowances are established
when necessary to reduce deferred tax assets to the amount expected to be realized. A 100% valuation allowance has been established on
deferred tax assets at June 30, 2023 and December 31, 2022, due to the uncertainty of our ability to realize future taxable income.
We
account for uncertainty in income taxes in our financial statements as required under ASC 740, “Income Taxes.” The standard
prescribes a recognition threshold and measurement attribute for the financial statement recognition and measurement of a tax position
taken or expected to be taken in a tax return. The standard also provides guidance on de-recognition, classification, interest and penalties,
accounting in interim periods, disclosure and transition accounting. Management determined there were no material uncertain positions
taken by us in our tax returns.
Segment
Information
Operating
segments are defined in the criteria established under ASC 280, “Segment Reporting,” as components of public entities that
engage in business activities from which they may earn revenues and incur expenses for which separate financial information is available
and which is evaluated regularly by our chief operating decision maker (“CODM”) in deciding how to assess performance and
allocate resources. Our CODM assesses performance and allocates resources based on two operating segments: Document Management and Document
Conversion. These segments contain individual business components that have been combined on the basis of common management, customers,
solutions offered, service processes and other economic characteristics. We currently have immaterial intersegment sales. We evaluate
the performance of our segments based on gross profits.
The
Document Management Segment provides cloud-based and premise-based content services software. Its modular suite of solutions complements
existing operating and accounting systems to serve a mission-critical role for organizations to make content secure, compliant, and process-ready.
This segment conducts its primary operations in the United States. Markets served include highly regulated, risk and compliance-intensive
markets in healthcare, K-12 education, public safety, other public sector, risk management, financial services, and others. Solutions
are sold both directly to end-users and through resellers.
The
Document Conversion Segment provides services for scanning and indexing, converting images from paper to digital, paper to microfilm,
and microfiche to microfilm, as well as long-term physical document storage and retrieval. This segment conducts its primary operations
in the United States. Markets served include businesses and federal, county, and municipal governments. Solutions are sold both directly
to end-users and through a reseller distributor.
Information
by operating segment is as follows:
Schedule of Segment Information
| | |
2022 | | |
2021 | | |
2022 | | |
2021 | |
| | |
For the three months ended June 30, | | |
For the six months ended June 30, | |
| | |
2023 | | |
2022 | | |
2023 | | |
2022 | |
| Revenues | |
| | |
| | |
| | |
| |
| Document Management | |
$ | 1,879,369 | | |
$ | 1,572,854 | | |
$ | 3,705,103 | | |
$ | 2,487,804 | |
| Document Conversion | |
| 2,379,061 | | |
| 1,842,789 | | |
| 4,740,160 | | |
| 3,631,351 | |
| Total revenues | |
$ | 4,258,430 | | |
$ | 3,415,643 | | |
$ | 8,445,263 | | |
$ | 6,119,155 | |
| | |
| | | |
| | | |
| | | |
| | |
| Gross profit | |
| | | |
| | | |
| | | |
| | |
| Document Management | |
$ | 1,536,385 | | |
$ | 1,326,345 | | |
$ | 3,053,746 | | |
$ | 2,012,823 | |
| Document Conversion | |
| 1,054,048 | | |
| 862,673 | | |
| 2,182,526 | | |
| 1,808,032 | |
| Total gross profit | |
$ | 2,590,433 | | |
$ | 2,189,018 | | |
$ | 5,236,272 | | |
$ | 3,820,855 | |
| | |
| | | |
| | | |
| | | |
| | |
| Capital additions, net | |
| | | |
| | | |
| | | |
| | |
| Document Management | |
$ | 96,209 | | |
$ | 144,717 | | |
$ | 212,250 | | |
$ | 175,801 | |
| Document Conversion | |
| 60,323 | | |
| 39,244 | | |
| 78,851 | | |
| 93,600 | |
| Total capital additions, net | |
$ | 156,532 | | |
$ | 183,961 | | |
$ | 291,101 | | |
$ | 269,401 | |
| | |
June 30, 2023 | | |
December 31, 2022 | |
| Goodwill | |
| | |
| |
| Document Management | |
$ | 3,989,645 | | |
$ | 3,989,645 | |
| Document Conversion | |
| 1,800,176 | | |
| 1,800,176 | |
| Total goodwill | |
$ | 5,789,821 | | |
$ | 5,789,821 | |
| | |
June 30, 2023 | | |
December 31, 2022 | |
| Total assets | |
| | | |
| | |
| Document Management | |
$ | 9,706,315 | | |
$ | 10,284,183 | |
| Document Conversion | |
| 8,880,771 | | |
| 9,658,959 | |
| Total assets | |
$ | 18,587,086 | | |
$ | 19,943,142 | |
Statement
of Cash Flows
For
purposes of reporting cash flows, cash includes cash on hand and demand deposits held by banks.
Reclassifications
Certain
amounts reported in prior filings of the condensed consolidated financial statements have been reclassified to conform to current presentation.
|
| X |
- References
+ Details
| Name: |
us-gaap_AccountingPoliciesAbstract |
| Namespace Prefix: |
us-gaap_ |
| Data Type: |
xbrli:stringItemType |
| Balance Type: |
na |
| Period Type: |
duration |
|
| X |
- DefinitionThe entire disclosure for all significant accounting policies of the reporting entity. Reference 1: http://www.xbrl.org/2003/role/disclosureRef
-Topic 235
-SubTopic 10
-Name Accounting Standards Codification
-Section 50
-Paragraph 1
-Publisher FASB
-URI https://asc.fasb.org//1943274/2147483426/235-10-50-1
Reference 2: http://fasb.org/us-gaap/role/ref/legacyRef
-Topic 235
-Name Accounting Standards Codification
-Publisher FASB
-URI https://asc.fasb.org//235/tableOfContent
| Name: |
us-gaap_SignificantAccountingPoliciesTextBlock |
| Namespace Prefix: |
us-gaap_ |
| Data Type: |
dtr-types:textBlockItemType |
| Balance Type: |
na |
| Period Type: |
duration |
|
v3.23.2
Business Combinations
|
6 Months Ended |
Jun. 30, 2023 |
|---|
| Business Combination and Asset Acquisition [Abstract] |
|
| Business Combinations |
4.
Business Combinations
On
April 1, 2022, we entered into an asset purchase agreement to acquire substantially all of the assets of Yellow Folder. The acquisition
was accounted for in accordance with GAAP and was made to expand our market share in the digital transformation industry and due to synergies
of product lines and services between the Companies.
The
purchase price has been preliminarily allocated to assets acquired and liabilities assumed based on the estimated fair value of such
assets and liabilities at the date of acquisitions as follows:
Schedule
of Fair Value of Assets Acquired and Liabilities Assumed
| Assets acquired: | |
| |
| Accounts receivable | |
$ | 68,380 | |
| Prepaid expenses | |
| 38,913 | |
| Property and equipment | |
| 30,018 | |
| Intangible assets (see Note 5) | |
| 3,888,000 | |
| Assets | |
| 4,025,311 | |
| Liabilities assumed: | |
| | |
| Accounts payable | |
| 36,446 | |
| Deferred revenue | |
| 1,072,530 | |
| Liabilities | |
| 1,108,976 | |
| | |
| | |
| Total identifiable net assets | |
| 2,916,335 | |
| | |
| | |
| Purchase price | |
| 6,383,269 | |
| | |
| | |
| Goodwill - Excess of purchase price over fair value of net assets acquired | |
$ | 3,466,934 | |
The
purchase price of $6,383,269 was paid in cash. Goodwill in the amount of $3,466,934 was recognized in the acquisition of Yellow Folder
and is attributable to the cash flows of the business derived from our potential to outperform the market due to its existing relationship
and other synergies created within the Company.
The
following unaudited pro forma information presents a summary of the condensed consolidated results of operations for the Company as if
the acquisition of Yellow Folder had occurred on January 1, 2022.
Schedule of Pro Forma Information
| | |
June 30, 2023 | | |
June 30, 2022 | |
| | |
For the three months ended | |
| | |
(unaudited) | | |
(unaudited) | |
| | |
June 30, 2023 | | |
June 30, 2022 | |
| Total revenues | |
$ | 4,258,430 | | |
$ | 3,415,643 | |
| | |
| | | |
| | |
| Net income (loss) | |
$ | 135,734 | | |
$ | (374,167 | ) |
| | |
| | | |
| | |
| Basic and diluted net income (loss) per share | |
$ | 0.03 | | |
$ | (0.09 | ) |
| Basic net income (loss) per share | |
$ | 0.03 | | |
$ | (0.09 | ) |
| | |
June 30, 2023 | | |
June 30, 2022 | |
| | |
For the six months ended | |
| | |
(unaudited) | | |
(unaudited) | |
| | |
June 30, 2023 | | |
June 30, 2022 | |
| Total revenues | |
$ | 8,445,263 | | |
$ | 6,897,007 | |
| | |
| | | |
| | |
| Net (loss) income | |
$ | 248,297 | | |
$ | (359,777 | ) |
| | |
| | | |
| | |
| Basic and diluted net income (loss) per share | |
$ | 0.06 | | |
$ | (0.09 | ) |
| Basic net income (loss) per share | |
$ | 0.06 | | |
$ | (0.09 | ) |
The
unaudited pro forma condensed consolidated results are based on our historical financial statements and those of Yellow Folder and do
not necessarily indicate the results of operations that would have resulted had the acquisition actually been completed at the beginning
of the applicable period presented. The pro forma financial information assumes that the companies were combined as of January 1, 2022.
The
following tables present the amounts of revenue and earnings of Yellow Folder since the acquisition date included in the condensed consolidated
income statement for the reporting periods.
| | |
For the | | |
For the | |
| | |
three months ended | | |
six months ended | |
| | |
June 30, 2023 | | |
June 30, 2023 | |
| Yellow Folder: | |
| | | |
| | |
| Total revenues | |
$ | 864,331 | | |
$ | 1,738,893 | |
| Net income | |
$ | 85,408 | | |
$ | 271,111 | |
| | |
For the
three months ended
June 30, 2022 | | |
For the
six months ended
June 30, 2022 | |
| Yellow Folder: | |
| | | |
| | |
| Total revenues | |
$ | 790,368 | | |
$ | 790,368 | |
| Net income | |
$ | 196,559 | | |
$ | 196,559 | |
| Net income (loss) | |
$ | 196,559 | | |
$ | 196,559 | |
|
| X |
- References
+ Details
| Name: |
us-gaap_BusinessCombinationAndAssetAcquisitionAbstract |
| Namespace Prefix: |
us-gaap_ |
| Data Type: |
xbrli:stringItemType |
| Balance Type: |
na |
| Period Type: |
duration |
|
| X |
- DefinitionThe entire disclosure for a business combination (or series of individually immaterial business combinations) completed during the period, including background, timing, and recognized assets and liabilities. The disclosure may include leverage buyout transactions (as applicable). Reference 1: http://www.xbrl.org/2003/role/disclosureRef
-Topic 805
-SubTopic 20
-Name Accounting Standards Codification
-Section 50
-Paragraph 5
-Subparagraph (b)
-Publisher FASB
-URI https://asc.fasb.org//1943274/2147479907/805-20-50-5
Reference 2: http://fasb.org/us-gaap/role/ref/legacyRef
-Topic 805
-Name Accounting Standards Codification
-Publisher FASB
-URI https://asc.fasb.org//805/tableOfContent
| Name: |
us-gaap_BusinessCombinationDisclosureTextBlock |
| Namespace Prefix: |
us-gaap_ |
| Data Type: |
dtr-types:textBlockItemType |
| Balance Type: |
na |
| Period Type: |
duration |
|
v3.23.2
Intangible Assets, Net
|
6 Months Ended |
Jun. 30, 2023 |
|---|
| Goodwill and Intangible Assets Disclosure [Abstract] |
|
| Intangible Assets, Net |
5.
Intangible Assets, Net
At
June 30, 2023, intangible assets consisted of the following:
Schedule of Intangible Assets
| | |
Estimated | |
| | |
Accumulated | | |
| |
| | |
Useful Life | |
Costs | | |
Amortization | | |
Net | |
| Trade names | |
10 years | |
$ | 297,000 | | |
$ | (61,917 | ) | |
$ | 235,083 | |
| Proprietary technology | |
10 years | |
| 861,000 | | |
| (107,625 | ) | |
| 753,375 | |
| Customer relationships | |
5-15 years | |
| 4,091,000 | | |
| (914,966 | ) | |
| 3,176,034 | |
| | |
| |
$ | 5,249,000 | | |
$ | (1,084,508 | ) | |
$ | 4,164,492 | |
At
December 31, 2022, intangible assets consisted of the following:
| | |
Estimated | |
| | |
Accumulated | | |
| |
| | |
Useful Life | |
Costs | | |
Amortization | | |
Net | |
| Trade names | |
10 years | |
$ | 297,000 | | |
$ | (47,067 | ) | |
$ | 249,933 | |
| Proprietary technology | |
10 years | |
| 861,000 | | |
| (64,575 | ) | |
| 796,425 | |
| Customer relationships | |
5-15 years | |
| 4,091,000 | | |
| (717,712 | ) | |
| 3,373,288 | |
| | |
| |
$ | 5,249,000 | | |
$ | (829,354 | ) | |
$ | 4,419,646 | |
Amortization
expense for the three and six months ended June 30, 2023 and June 30, 2022, amounted to $127,577 and $255,154, respectively, and $127,577
and $181,696, respectively. The following table represents future amortization expense for intangible assets subject to amortization.
Schedule of Amortization Expense for Intangible Assets
| For the Twelve Months Ending June 30, | |
Amount | |
| 2024 | |
$ | 510,308 | |
| 2025 | |
| 505,941 | |
| 2026 | |
| 431,441 | |
| 2027 | |
| 326,108 | |
| 2028 | |
| 319,316 | |
| Thereafter | |
| 2,071,378 | |
| Intangible assets | |
$ | 4,164,492 | |
|
| X |
- References
+ Details
| Name: |
us-gaap_GoodwillAndIntangibleAssetsDisclosureAbstract |
| Namespace Prefix: |
us-gaap_ |
| Data Type: |
xbrli:stringItemType |
| Balance Type: |
na |
| Period Type: |
duration |
|
| X |
- DefinitionThe entire disclosure for all or part of the information related to intangible assets. Reference 1: http://www.xbrl.org/2003/role/disclosureRef
-Topic 350
-SubTopic 30
-Name Accounting Standards Codification
-Publisher FASB
-URI https://asc.fasb.org//350-30/tableOfContent
| Name: |
us-gaap_IntangibleAssetsDisclosureTextBlock |
| Namespace Prefix: |
us-gaap_ |
| Data Type: |
dtr-types:textBlockItemType |
| Balance Type: |
na |
| Period Type: |
duration |
|
v3.23.2
Fair Value Measurements
|
6 Months Ended |
Jun. 30, 2023 |
|---|
| Fair Value Disclosures [Abstract] |
|
| Fair Value Measurements |
6.
Fair Value Measurements
We
paid our final earnout liability in January 2023 and as of June 30, 2023, we have no earnout liabilities remaining. As of December 31,
2022 we had earnout liabilities related to one of our two 2020 acquisitions which were measured on a recurring basis and recorded at
fair value, measured using probability-weighted analysis and discounted using a rate that appropriately captures the risks associated
with the obligation. The inputs used to calculate the fair value of the earnout liabilities were considered to be Level 3 inputs due
to the lack of relevant market activity and significant management judgment. Key unobservable inputs included revenue growth rates, which
ranged from 0% to 7%, and volatility rates, which were 20% for gross profits.
The
following table provides a summary of the changes in fair value of the earnout liabilities for the six months ended June 30, 2023 and 2022:
Summary
of Changes in Fair Value of Earnout Liabilities
| | |
June 30, 2023 | |
| Fair value at December 31, 2022 | |
$ | 700,000 | |
| Fair value, beginning balance | |
$ | 700,000 | |
| Payments | |
| (700,000 | ) |
| Change in fair value | |
| | |
| Fair value at June 30, 2023 | |
$ | - | |
| Fair value, ending balance | |
$ | - | |
| | |
Six months | |
| | |
ended | |
| | |
June 30, 2022 | |
| Fair value at December 31, 2021 | |
$ | 1,630,681 | |
| Fair value, beginning balance | |
$ | 1,630,681 | |
| Payment | |
| (1,018,333 | ) |
| Change in fair value | |
| 116,505 | |
| Fair value at June 30, 2022 | |
$ | 728,853 | |
| Fair value, ending balance | |
$ | 728,853 | |
The
fair values of earnout liabilities amounts owed were recorded in current liabilities in our condensed consolidated balance sheet as of
December 31, 2022. Changes in fair value are recorded in change in fair value of earnout liabilities in our condensed consolidated statements
of operations.
|
| X |
- References
+ Details
| Name: |
us-gaap_FairValueDisclosuresAbstract |
| Namespace Prefix: |
us-gaap_ |
| Data Type: |
xbrli:stringItemType |
| Balance Type: |
na |
| Period Type: |
duration |
|
| X |
- DefinitionThe entire disclosure for the fair value of financial instruments (as defined), including financial assets and financial liabilities (collectively, as defined), and the measurements of those instruments as well as disclosures related to the fair value of non-financial assets and liabilities. Such disclosures about the financial instruments, assets, and liabilities would include: (1) the fair value of the required items together with their carrying amounts (as appropriate); (2) for items for which it is not practicable to estimate fair value, disclosure would include: (a) information pertinent to estimating fair value (including, carrying amount, effective interest rate, and maturity, and (b) the reasons why it is not practicable to estimate fair value; (3) significant concentrations of credit risk including: (a) information about the activity, region, or economic characteristics identifying a concentration, (b) the maximum amount of loss the entity is exposed to based on the gross fair value of the related item, (c) policy for requiring collateral or other security and information as to accessing such collateral or security, and (d) the nature and brief description of such collateral or security; (4) quantitative information about market risks and how such risks are managed; (5) for items measured on both a recurring and nonrecurring basis information regarding the inputs used to develop the fair value measurement; and (6) for items presented in the financial statement for which fair value measurement is elected: (a) information necessary to understand the reasons for the election, (b) discussion of the effect of fair value changes on earnings, (c) a description of [similar groups] items for which the election is made and the relation thereof to the balance sheet, the aggregate carrying value of items included in the balance sheet that are not eligible for the election; (7) all other required (as defined) and desired information. Reference 1: http://www.xbrl.org/2003/role/disclosureRef
-Topic 820
-SubTopic 10
-Name Accounting Standards Codification
-Section 50
-Paragraph 2
-Publisher FASB
-URI https://asc.fasb.org//1943274/2147482106/820-10-50-2
| Name: |
us-gaap_FairValueDisclosuresTextBlock |
| Namespace Prefix: |
us-gaap_ |
| Data Type: |
dtr-types:textBlockItemType |
| Balance Type: |
na |
| Period Type: |
duration |
|
v3.23.2
Property and Equipment
|
6 Months Ended |
Jun. 30, 2023 |
|---|
| Property, Plant and Equipment [Abstract] |
|
| Property and Equipment |
7.
Property and Equipment
Property
and equipment are comprised of the following:
Schedule of Property and Equipment
| | |
June 30, 2023 | | |
December 31, 2022 | |
| Computer hardware and purchased software | |
$ | 1,661,438 | | |
$ | 1,595,652 | |
| Leasehold improvements | |
| 395,919 | | |
| 395,918 | |
| Furniture and fixtures | |
| 71,325 | | |
| 71,325 | |
| Property and equipment, gross | |
| 2,128,682 | | |
| 2,062,895 | |
| Less: accumulated depreciation | |
| (1,103,906 | ) | |
| (994,189 | ) |
| Property and equipment, net | |
$ | 1,024,776 | | |
$ | 1,068,706 | |
Total
depreciation expense on our property and equipment for the three and six months ended June 30, 2023 and 2022 amounted to $64,675 and
$126,614, respectively, and $67,699 and $127,691, respectively.
|
| X |
- References
+ Details
| Name: |
us-gaap_PropertyPlantAndEquipmentAbstract |
| Namespace Prefix: |
us-gaap_ |
| Data Type: |
xbrli:stringItemType |
| Balance Type: |
na |
| Period Type: |
duration |
|
| X |
- DefinitionThe entire disclosure for long-lived, physical asset used in normal conduct of business and not intended for resale. Includes, but is not limited to, work of art, historical treasure, and similar asset classified as collections. Reference 1: http://fasb.org/us-gaap/role/ref/legacyRef
-Topic 360
-Name Accounting Standards Codification
-Publisher FASB
-URI https://asc.fasb.org//360/tableOfContent
Reference 2: http://www.xbrl.org/2003/role/disclosureRef
-Name Accounting Standards Codification
-Section 50
-Paragraph 6
-SubTopic 360
-Topic 958
-Publisher FASB
-URI https://asc.fasb.org//1943274/2147480321/958-360-50-6
Reference 3: http://www.xbrl.org/2003/role/disclosureRef
-Name Accounting Standards Codification
-Section 50
-Paragraph 1
-Subparagraph (d)
-SubTopic 360
-Topic 958
-Publisher FASB
-URI https://asc.fasb.org//1943274/2147480321/958-360-50-1
Reference 4: http://www.xbrl.org/2003/role/disclosureRef
-Name Accounting Standards Codification
-Section 50
-Paragraph 7
-SubTopic 360
-Topic 958
-Publisher FASB
-URI https://asc.fasb.org//1943274/2147480321/958-360-50-7
| Name: |
us-gaap_PropertyPlantAndEquipmentDisclosureTextBlock |
| Namespace Prefix: |
us-gaap_ |
| Data Type: |
dtr-types:textBlockItemType |
| Balance Type: |
na |
| Period Type: |
duration |
|
v3.23.2
Notes Payable – Unrelated Parties
|
6 Months Ended |
Jun. 30, 2023 |
|---|
| Debt Disclosure [Abstract] |
|
| Notes Payable – Unrelated Parties |
8.
Notes Payable – Unrelated Parties
Summary
of Notes Payable to Unrelated Parties
The
tables below summarize all notes payable at June 30, 2023 and December 31, 2022, respectively, with the exception of related party notes
disclosed in Note 9 “Notes Payable - Related Parties.”
Schedule
of Notes Payable
| | |
June 30, 2023 | | |
December 31, 2022 | |
| 2022 Unrelated Notes | |
$ | 2,364,500 | | |
$ | 2,364,500 | |
| 2020 Notes | |
| 717,500 | | |
| 980,450 | |
| Total notes payable | |
$ | 3,082,000 | | |
$ | 3,344,950 | |
| Less unamortized debt issuance costs | |
| (221,511 | ) | |
| (300,904 | ) |
| Less unamortized debt discount | |
| (4,267 | ) | |
| (22,045 | ) |
| Less current portion | |
| (709,083 | ) | |
| (936,966 | ) |
| Long-term portion of notes payable | |
$ | 2,147,139 | | |
$ | 2,085,035 | |
| Subordinated Notes Payable | |
Issue Date | |
Interest Rate | | |
Interest Due | |
Principal Due |
| 2022 Unrelated Notes | |
April 1, 2022 | |
| 12 | % | |
Quarterly | |
March 30, 2025 |
| 2020 Notes | |
March 2, 2020 | |
| 12 | % | |
Quarterly | |
August 31, 2023 |
Future
minimum principal payments of the Notes Payable to Unrelated Parties are as follows:
Schedule
of Future Minimum Principal Payments of Notes Payable
| As of June 30, | |
Amount | |
| 2024 | |
$ | 717,500 | |
| 2025 | |
| 2,364,500 | |
| Total | |
$ | 3,082,000 | |
As
of June 30, 2023 and December 31, 2022, accrued interest for these notes payable with the exception of the related party notes in Note
9, “Notes Payable - Related Parties,” was $0. As of June 30, 2023 and December 31, 2022, unamortized deferred financing costs
and unamortized debt discount were reflected within short and long term liabilities on the condensed consolidated balance sheets, netted
with the corresponding notes payable balance.
With
respect to all notes outstanding (other than the notes to related parties), interest expense, including the amortization of debt issuance
costs and debt discount, for the three and six months ended June 30, 2023 and 2022 was $136,136
and $287,741,
respectively, and $214,589 and
$327,190,
respectively.
We recognized a debt discount of $320,000 for 80,000 shares issued
in conjunction with the 2020 Notes. The amortization of the debt discount, which will be recognized over the life of the 2020 Notes as interest
expense, for the three and six months ended June 30, 2023 and 2022 was $6,400 and $17,778, and $26,667 and $53,333, respectively.
|
| X |
- References
+ Details
| Name: |
us-gaap_DebtDisclosureAbstract |
| Namespace Prefix: |
us-gaap_ |
| Data Type: |
xbrli:stringItemType |
| Balance Type: |
na |
| Period Type: |
duration |
|
| X |
- DefinitionThe entire disclosure for information about short-term and long-term debt arrangements, which includes amounts of borrowings under each line of credit, note payable, commercial paper issue, bonds indenture, debenture issue, own-share lending arrangements and any other contractual agreement to repay funds, and about the underlying arrangements, rationale for a classification as long-term, including repayment terms, interest rates, collateral provided, restrictions on use of assets and activities, whether or not in compliance with debt covenants, and other matters important to users of the financial statements, such as the effects of refinancing and noncompliance with debt covenants. Reference 1: http://www.xbrl.org/2003/role/disclosureRef
-Topic 470
-SubTopic 20
-Name Accounting Standards Codification
-Section 50
-Paragraph 1B
-Subparagraph (h)
-Publisher FASB
-URI https://asc.fasb.org//1943274/2147481139/470-20-50-1B
Reference 2: http://www.xbrl.org/2003/role/disclosureRef
-Topic 235
-SubTopic 10
-Name Accounting Standards Codification
-Section S99
-Paragraph 1
-Subparagraph (SX 210.4-08(c))
-Publisher FASB
-URI https://asc.fasb.org//1943274/2147480678/235-10-S99-1
Reference 3: http://fasb.org/us-gaap/role/ref/legacyRef
-Topic 470
-Name Accounting Standards Codification
-Publisher FASB
-URI https://asc.fasb.org//470/tableOfContent
Reference 4: http://www.xbrl.org/2003/role/disclosureRef
-Topic 470
-SubTopic 20
-Name Accounting Standards Codification
-Section 50
-Paragraph 1B
-Publisher FASB
-URI https://asc.fasb.org//1943274/2147481139/470-20-50-1B
Reference 5: http://www.xbrl.org/2003/role/disclosureRef
-Topic 470
-SubTopic 20
-Name Accounting Standards Codification
-Section 50
-Paragraph 1B
-Subparagraph (g)
-Publisher FASB
-URI https://asc.fasb.org//1943274/2147481139/470-20-50-1B
Reference 6: http://www.xbrl.org/2003/role/disclosureRef
-Topic 470
-SubTopic 20
-Name Accounting Standards Codification
-Section 50
-Paragraph 1B
-Subparagraph (i)
-Publisher FASB
-URI https://asc.fasb.org//1943274/2147481139/470-20-50-1B
Reference 7: http://www.xbrl.org/2003/role/disclosureRef
-Topic 470
-SubTopic 20
-Name Accounting Standards Codification
-Section 50
-Paragraph 1C
-Subparagraph (a)
-Publisher FASB
-URI https://asc.fasb.org//1943274/2147481139/470-20-50-1C
Reference 8: http://www.xbrl.org/2003/role/disclosureRef
-Topic 470
-SubTopic 20
-Name Accounting Standards Codification
-Section 50
-Paragraph 1C
-Subparagraph (b)
-Publisher FASB
-URI https://asc.fasb.org//1943274/2147481139/470-20-50-1C
Reference 9: http://www.xbrl.org/2003/role/disclosureRef
-Topic 470
-SubTopic 20
-Name Accounting Standards Codification
-Section 50
-Paragraph 1C
-Subparagraph (c)
-Publisher FASB
-URI https://asc.fasb.org//1943274/2147481139/470-20-50-1C
Reference 10: http://www.xbrl.org/2003/role/disclosureRef
-Topic 470
-SubTopic 20
-Name Accounting Standards Codification
-Section 50
-Paragraph 1E
-Subparagraph (b)
-Publisher FASB
-URI https://asc.fasb.org//1943274/2147481139/470-20-50-1E
Reference 11: http://www.xbrl.org/2003/role/disclosureRef
-Topic 470
-SubTopic 20
-Name Accounting Standards Codification
-Section 50
-Paragraph 1I
-Subparagraph (a)
-Publisher FASB
-URI https://asc.fasb.org//1943274/2147481139/470-20-50-1I
Reference 12: http://www.xbrl.org/2003/role/disclosureRef
-Topic 470
-SubTopic 20
-Name Accounting Standards Codification
-Section 50
-Paragraph 1I
-Subparagraph (b)
-Publisher FASB
-URI https://asc.fasb.org//1943274/2147481139/470-20-50-1I
Reference 13: http://www.xbrl.org/2003/role/disclosureRef
-Topic 470
-SubTopic 20
-Name Accounting Standards Codification
-Section 50
-Paragraph 1I
-Subparagraph (d)
-Publisher FASB
-URI https://asc.fasb.org//1943274/2147481139/470-20-50-1I
| Name: |
us-gaap_DebtDisclosureTextBlock |
| Namespace Prefix: |
us-gaap_ |
| Data Type: |
dtr-types:textBlockItemType |
| Balance Type: |
na |
| Period Type: |
duration |
|
v3.23.2
Notes Payable - Related Parties
|
6 Months Ended |
Jun. 30, 2023 |
|---|
| Related Party Transaction [Line Items] |
|
| Notes Payable - Related Parties |
8.
Notes Payable – Unrelated Parties
Summary
of Notes Payable to Unrelated Parties
The
tables below summarize all notes payable at June 30, 2023 and December 31, 2022, respectively, with the exception of related party notes
disclosed in Note 9 “Notes Payable - Related Parties.”
Schedule
of Notes Payable
| | |
June 30, 2023 | | |
December 31, 2022 | |
| 2022 Unrelated Notes | |
$ | 2,364,500 | | |
$ | 2,364,500 | |
| 2020 Notes | |
| 717,500 | | |
| 980,450 | |
| Total notes payable | |
$ | 3,082,000 | | |
$ | 3,344,950 | |
| Less unamortized debt issuance costs | |
| (221,511 | ) | |
| (300,904 | ) |
| Less unamortized debt discount | |
| (4,267 | ) | |
| (22,045 | ) |
| Less current portion | |
| (709,083 | ) | |
| (936,966 | ) |
| Long-term portion of notes payable | |
$ | 2,147,139 | | |
$ | 2,085,035 | |
| Subordinated Notes Payable | |
Issue Date | |
Interest Rate | | |
Interest Due | |
Principal Due |
| 2022 Unrelated Notes | |
April 1, 2022 | |
| 12 | % | |
Quarterly | |
March 30, 2025 |
| 2020 Notes | |
March 2, 2020 | |
| 12 | % | |
Quarterly | |
August 31, 2023 |
Future
minimum principal payments of the Notes Payable to Unrelated Parties are as follows:
Schedule
of Future Minimum Principal Payments of Notes Payable
| As of June 30, | |
Amount | |
| 2024 | |
$ | 717,500 | |
| 2025 | |
| 2,364,500 | |
| Total | |
$ | 3,082,000 | |
As
of June 30, 2023 and December 31, 2022, accrued interest for these notes payable with the exception of the related party notes in Note
9, “Notes Payable - Related Parties,” was $0. As of June 30, 2023 and December 31, 2022, unamortized deferred financing costs
and unamortized debt discount were reflected within short and long term liabilities on the condensed consolidated balance sheets, netted
with the corresponding notes payable balance.
With
respect to all notes outstanding (other than the notes to related parties), interest expense, including the amortization of debt issuance
costs and debt discount, for the three and six months ended June 30, 2023 and 2022 was $136,136
and $287,741,
respectively, and $214,589 and
$327,190,
respectively.
We recognized a debt discount of $320,000 for 80,000 shares issued
in conjunction with the 2020 Notes. The amortization of the debt discount, which will be recognized over the life of the 2020 Notes as interest
expense, for the three and six months ended June 30, 2023 and 2022 was $6,400 and $17,778, and $26,667 and $53,333, respectively.
|
| Related Party [Member] |
|
| Related Party Transaction [Line Items] |
|
| Notes Payable - Related Parties |
9.
Notes Payable - Related Parties
Summary
of Notes Payable to Related Parties
The
tables below summarize all notes payable to related parties at June 30, 2023 and December 31, 2022:
Schedule
of Notes Payable
| | |
June 30, 2023 | | |
December 31, 2022 | |
| Notes payable – “2022 Related Note” | |
$ | 600,000 | | |
$ | 600,000 | |
| Notes payable – “2022
Related Note” | |
$ | 600,000 | | |
$ | 600,000 | |
| Less unamortized debt issuance costs | |
| (55,157 | ) | |
| (70,916 | ) |
| Long-term portion of notes payable | |
$ | 544,843 | | |
$ | 529,084 | |
| Subordinated Notes Payable | |
Issue Date | |
Interest Rate | | |
Interest Due | |
Principal Due |
| 2022 Related Note | |
April 1, 2022 | |
| 12 | % | |
Quarterly | |
March 30, 2025 |
Future
minimum principal payments of the 2022 Notes to related parties are as follows:
Schedule
of Future Minimum Principal Payments of Notes Payable
| As of June 30, | |
Amount | |
| 2025 | |
$ | 600,000 | |
| Total | |
$ | 600,000 | |
As
of June 30, 2023 and December 31, 2022, accrued interest for these notes payable – related parties was $0. As of June 30, 2023
and December 31, 2022, unamortized deferred financing costs and unamortized debt discount were reflected within long term liabilities
on the condensed consolidated balance sheets.
With
respect to all notes payable – related parties outstanding, interest expense, including the amortization of debt issuance costs,
for the three and six months ended June 30, 2023 was $25,880
and $51,759,
respectively. For the three and six months ended June 30, 2022 interest expense in connection with notes payable – related parties
was $25,879.
|
| X |
- DefinitionThe entire disclosure for information about short-term and long-term debt arrangements, which includes amounts of borrowings under each line of credit, note payable, commercial paper issue, bonds indenture, debenture issue, own-share lending arrangements and any other contractual agreement to repay funds, and about the underlying arrangements, rationale for a classification as long-term, including repayment terms, interest rates, collateral provided, restrictions on use of assets and activities, whether or not in compliance with debt covenants, and other matters important to users of the financial statements, such as the effects of refinancing and noncompliance with debt covenants. Reference 1: http://www.xbrl.org/2003/role/disclosureRef
-Topic 470
-SubTopic 20
-Name Accounting Standards Codification
-Section 50
-Paragraph 1B
-Subparagraph (h)
-Publisher FASB
-URI https://asc.fasb.org//1943274/2147481139/470-20-50-1B
Reference 2: http://www.xbrl.org/2003/role/disclosureRef
-Topic 235
-SubTopic 10
-Name Accounting Standards Codification
-Section S99
-Paragraph 1
-Subparagraph (SX 210.4-08(c))
-Publisher FASB
-URI https://asc.fasb.org//1943274/2147480678/235-10-S99-1
Reference 3: http://fasb.org/us-gaap/role/ref/legacyRef
-Topic 470
-Name Accounting Standards Codification
-Publisher FASB
-URI https://asc.fasb.org//470/tableOfContent
Reference 4: http://www.xbrl.org/2003/role/disclosureRef
-Topic 470
-SubTopic 20
-Name Accounting Standards Codification
-Section 50
-Paragraph 1B
-Publisher FASB
-URI https://asc.fasb.org//1943274/2147481139/470-20-50-1B
Reference 5: http://www.xbrl.org/2003/role/disclosureRef
-Topic 470
-SubTopic 20
-Name Accounting Standards Codification
-Section 50
-Paragraph 1B
-Subparagraph (g)
-Publisher FASB
-URI https://asc.fasb.org//1943274/2147481139/470-20-50-1B
Reference 6: http://www.xbrl.org/2003/role/disclosureRef
-Topic 470
-SubTopic 20
-Name Accounting Standards Codification
-Section 50
-Paragraph 1B
-Subparagraph (i)
-Publisher FASB
-URI https://asc.fasb.org//1943274/2147481139/470-20-50-1B
Reference 7: http://www.xbrl.org/2003/role/disclosureRef
-Topic 470
-SubTopic 20
-Name Accounting Standards Codification
-Section 50
-Paragraph 1C
-Subparagraph (a)
-Publisher FASB
-URI https://asc.fasb.org//1943274/2147481139/470-20-50-1C
Reference 8: http://www.xbrl.org/2003/role/disclosureRef
-Topic 470
-SubTopic 20
-Name Accounting Standards Codification
-Section 50
-Paragraph 1C
-Subparagraph (b)
-Publisher FASB
-URI https://asc.fasb.org//1943274/2147481139/470-20-50-1C
Reference 9: http://www.xbrl.org/2003/role/disclosureRef
-Topic 470
-SubTopic 20
-Name Accounting Standards Codification
-Section 50
-Paragraph 1C
-Subparagraph (c)
-Publisher FASB
-URI https://asc.fasb.org//1943274/2147481139/470-20-50-1C
Reference 10: http://www.xbrl.org/2003/role/disclosureRef
-Topic 470
-SubTopic 20
-Name Accounting Standards Codification
-Section 50
-Paragraph 1E
-Subparagraph (b)
-Publisher FASB
-URI https://asc.fasb.org//1943274/2147481139/470-20-50-1E
Reference 11: http://www.xbrl.org/2003/role/disclosureRef
-Topic 470
-SubTopic 20
-Name Accounting Standards Codification
-Section 50
-Paragraph 1I
-Subparagraph (a)
-Publisher FASB
-URI https://asc.fasb.org//1943274/2147481139/470-20-50-1I
Reference 12: http://www.xbrl.org/2003/role/disclosureRef
-Topic 470
-SubTopic 20
-Name Accounting Standards Codification
-Section 50
-Paragraph 1I
-Subparagraph (b)
-Publisher FASB
-URI https://asc.fasb.org//1943274/2147481139/470-20-50-1I
Reference 13: http://www.xbrl.org/2003/role/disclosureRef
-Topic 470
-SubTopic 20
-Name Accounting Standards Codification
-Section 50
-Paragraph 1I
-Subparagraph (d)
-Publisher FASB
-URI https://asc.fasb.org//1943274/2147481139/470-20-50-1I
| Name: |
us-gaap_DebtDisclosureTextBlock |
| Namespace Prefix: |
us-gaap_ |
| Data Type: |
dtr-types:textBlockItemType |
| Balance Type: |
na |
| Period Type: |
duration |
|
v3.23.2
Deferred Compensation
|
6 Months Ended |
Jun. 30, 2023 |
|---|
| Compensation Related Costs [Abstract] |
|
| Deferred Compensation |
10.
Deferred Compensation
Pursuant
to an employment agreement, we had accrued incentive cash compensation for one of our founders which was fully paid as of December 31,
2022. During the three and six months ended June 30, 2022, we paid $30,248 and $50,414, respectively, in deferred incentive compensation,
which amount was reflected as a reduction in our deferred compensation liability.
|
| X |
- DefinitionThe entire disclosure for compensation costs, including compensated absences accruals, compensated absences liability, deferred compensation arrangements and income statement compensation items. Deferred compensation arrangements may include a description of an arrangement with an individual employee, which is generally an employment contract between the entity and a selected officer or key employee containing a promise by the employer to pay certain amounts at designated future dates, usually including a period after retirement, upon compliance with stipulated requirements. This type of arrangement is distinguished from broader based employee benefit plans as it is usually tailored to the employee. Disclosure also typically includes the amount of related compensation expense recognized during the reporting period, the number of shares (units) issued during the period under such arrangements, and the carrying amount as of the balance sheet date of the related liability. Reference 1: http://www.xbrl.org/2003/role/disclosureRef
-Topic 710
-Name Accounting Standards Codification
-Publisher FASB
-URI https://asc.fasb.org//710/tableOfContent
Reference 2: http://www.xbrl.org/2003/role/disclosureRef
-Topic 710
-SubTopic 10
-Name Accounting Standards Codification
-Section 50
-Paragraph 1
-Publisher FASB
-URI https://asc.fasb.org//1943274/2147482969/710-10-50-1
| Name: |
us-gaap_CompensationRelatedCostsGeneralTextBlock |
| Namespace Prefix: |
us-gaap_ |
| Data Type: |
dtr-types:textBlockItemType |
| Balance Type: |
na |
| Period Type: |
duration |
|
v3.23.2
Commitments and Contingencies
|
6 Months Ended |
Jun. 30, 2023 |
|---|
| Commitments and Contingencies Disclosure [Abstract] |
|
| Commitments and Contingencies |
11.
Commitments and Contingencies
From
time to time we are involved in legal proceedings, claims and litigation related to employee claims, contractual disputes and taxes in
the ordinary course of business. Although we cannot predict the outcome of such matters, currently we have no reason to believe the disposition
of any current matter could reasonably be expected to have a material adverse impact on our financial position, results of operations
or the ability to carry on any of our business activities.
Operating
Leases
For
each of the below listed leases, management has determined it will utilize the base rental period and have not considered any renewal
periods.
Schedule
of Operating Leases
| Location | |
Square Feet | | |
Monthly Rent | | |
Lease Expiry |
| Columbus, OH | |
| 6,000 | | |
$ | 5,100 | | |
December 31, 2028 |
| Madison Heights, MI | |
| 36,000 | | |
$ | 43,185 | | |
August 31, 2026 |
| Sterling Heights, MI | |
| 37,000 | | |
$ | 21,072 | | |
April 30, 2028 |
| Traverse City, MI | |
| 5,200 | | |
$ | 4,500 | | |
January 31, 2024 |
| | |
| | | |
| | | |
|
| Temporary space | |
| | | |
| | | |
|
| Madison Heights, MI | |
| 3,200 | | |
$ | 1,605 | | |
month to month |
| | |
| | | |
| | | |
|
| Vehicles | |
| | | |
| | | |
|
| various | |
| n/a | | |
$ | 2,708 | | |
September 30, 2028 |
The
following table sets forth the future minimum lease payments under our leases:
Schedule
of Future Rental Payments for Operating Leases
| For the twelve months ending June 30, | |
Finance Lease | | |
Operating Leases | |
| 2024 | |
$ | 41,259 | | |
$ | 930,559 | |
| 2025 | |
| 41,259 | | |
| 891,357 | |
| 2026 | |
| 41,259 | | |
| 901,152 | |
| 2027 | |
| 41,259 | | |
| 443,008 | |
| 2028 | |
| 39,243 | | |
| 311,010 | |
| Thereafter | |
| 8,299 | | |
| 35,100 | |
| Less Imputed Interest |
|
|
(38,395) |
|
|
|
(488,818) |
|
| Less Short-term lease payments |
|
|
|
|
|
|
(4,813) |
|
| | |
$ | 174,183 | | |
$ | 3,018,555 | |
The
following table summarizes the components of lease expense:
Summary
of Components of Lease Expense
| For the three months ending June 30, | |
2023 | | |
2022 | |
| Finance lease expense: | |
| | | |
| | |
| Amortization of ROU asset | |
$ | 8,252 | | |
$ | - | |
| Interest on lease liabilities | |
| 3,594 | | |
| - | |
| Operating lease expense | |
| 238,864 | | |
| 238,487 | |
| Short-term lease expense | |
| 4,814 | | |
| 4,814 | |
| For the six months ending June 30, | |
2023 | | |
2022 | |
| Finance lease expense: | |
| | | |
| | |
| Amortization of ROU asset | |
$ | 14,959 | | |
$ | - | |
| Interest on lease liabilities | |
| 6,426 | | |
| - | |
| Operating lease expense | |
| 476,312 | | |
| 476,975 | |
| Short-term lease expense | |
| 9,627 | | |
| 9,627 | |
The
following tables set forth additional information pertaining to our leases:
Schedule
of Additional Information Pertaining to Leases
| For the six months ending June 30, | |
2023 | | |
2022 | |
| Cash paid for amounts included in the measurement of lease liabilities: | |
| | | |
| | |
| Financing cash flows from finance leases (interest) | |
$ | 6,426 | | |
$ | - | |
| Financing cash flows from finance leases (principal) | |
| 12,312 | | |
| - | |
| Operating cash flows from operating leases | |
| 348,284 | | |
| 307,471 | |
| Weighted average remaining lease term – finance leases | |
| 5.2 years | | |
| - | |
| Weighted average remaining lease term – operating leases | |
| 4.0 years | | |
| 4.9 years | |
| Weighted average discount rate – finance leases | |
| 8.25 | % | |
| - | |
| Weighted average discount rate – operating leases | |
| 6.95 | % | |
| 7.01 | % |
Schedule
of Operating and Finance Leases
| | |
June 30, 2023 | | |
December 31, 2022 | |
| Operating leases: | |
| | | |
| | |
| Right-of-use assets, operating | |
$ | 2,895,784 | | |
$ | 3,200,191 | |
| Lease liabilities, operating – current | |
| 711,229 | | |
| 692,074 | |
| Lease liabilities, operating – net of current | |
| 2,307,326 | | |
| 2,624,608 | |
| Total operating lease liabilities | |
$ | 3,018,555 | | |
$ | 3,316,682 | |
| | |
| | | |
| | |
| Finance leases: | |
| | | |
| | |
| Right-of-use asset, finance | |
$ | 191,862 | | |
$ | 160,990 | |
| Accumulated amortization | |
| (21,668 | ) | |
| (6,708 | ) |
| Right-of-use asset, finance, net | |
$ | 170,194 | | |
$ | 154,282 | |
| | |
| | | |
| | |
| Lease liability, finance – current | |
$ | 28,303 | | |
$ | 22,493 | |
| Lease liability, finance – net of current | |
| 145,880 | | |
| 133,131 | |
| Total finance lease liability | |
$ | 174,183 | | |
$ | 155,624 | |
|
| X |
- References
+ Details
| Name: |
us-gaap_CommitmentsAndContingenciesDisclosureAbstract |
| Namespace Prefix: |
us-gaap_ |
| Data Type: |
xbrli:stringItemType |
| Balance Type: |
na |
| Period Type: |
duration |
|
| X |
- DefinitionThe entire disclosure for commitments and contingencies. Reference 1: http://www.xbrl.org/2003/role/disclosureRef
-Topic 440
-SubTopic 10
-Name Accounting Standards Codification
-Section 50
-Paragraph 4
-Subparagraph (a)
-Publisher FASB
-URI https://asc.fasb.org//1943274/2147482648/440-10-50-4
Reference 2: http://www.xbrl.org/2009/role/commonPracticeRef
-Topic 450
-Name Accounting Standards Codification
-Publisher FASB
-URI https://asc.fasb.org//450/tableOfContent
Reference 3: http://www.xbrl.org/2003/role/disclosureRef
-Topic 954
-SubTopic 440
-Name Accounting Standards Codification
-Section 50
-Paragraph 1
-Subparagraph (a)
-Publisher FASB
-URI https://asc.fasb.org//1943274/2147480327/954-440-50-1
Reference 4: http://www.xbrl.org/2003/role/disclosureRef
-Topic 440
-SubTopic 10
-Name Accounting Standards Codification
-Section 50
-Paragraph 4
-Subparagraph (c)
-Publisher FASB
-URI https://asc.fasb.org//1943274/2147482648/440-10-50-4
Reference 5: http://fasb.org/us-gaap/role/ref/legacyRef
-Topic 440
-Name Accounting Standards Codification
-Publisher FASB
-URI https://asc.fasb.org//440/tableOfContent
| Name: |
us-gaap_CommitmentsAndContingenciesDisclosureTextBlock |
| Namespace Prefix: |
us-gaap_ |
| Data Type: |
dtr-types:textBlockItemType |
| Balance Type: |
na |
| Period Type: |
duration |
|
v3.23.2
Stockholders’ Equity
|
6 Months Ended |
Jun. 30, 2023 |
|---|
| Equity [Abstract] |
|
| Stockholders’ Equity |
12.
Stockholders’ Equity
Common
Stock
As
of June 30, 2023, 4,073,757 shares of common stock were issued and outstanding, 255,958 shares of common stock were reserved for issuance
upon the exercise of outstanding warrants, and 497,330 shares of common stock were reserved for issuance under our 2015 Equity Incentive
Plan, as amended (the “2015 Plan”).
The
following table describes the shares and warrants issued as part of our 2022 and 2020 private placements:
Schedule
of Shares and Warrants Issued
| Issuance of Common Stock | |
Issue Date | |
Shares Issued | | |
Price per share | | |
Warrants Issued | | |
Warrant Exercise Price | | |
Warrant Fair Value | |
| Private Placement 2022 | |
April 1, 2022 | |
| 1,242,588 | | |
$ | 4.62 | | |
| 124,258 | | |
$ | 4.62 | | |
$ | 3.91 | |
| Private Placement 2020 | |
March 2, 2020 | |
| 955,000 | | |
$ | 4.00 | | |
| 95,500 | | |
$ | 4.00 | | |
$ | 3.90 | |
Amortization
of the debt issuance costs for the Private Placement 2020 offering was recorded at $6,224
and $17,290
for the three and six months ended June 30, 2023,
and at $25,935
and $51,869
for the three and six months ended June 30, 2022.
Warrants
The
following sets forth the warrants to purchase our common stock that were outstanding as of June 30, 2023:
Schedule
of Warrants to Purchase Common Stock
| Warrants Outstanding | | |
Warrant Exercise Price | | |
Warranty Expiry |
| | 124,258 | | |
$ | 4.62 | | |
March 30, 2027 |
| | 95,500 | | |
$ | 4.00 | | |
March 30, 2027 |
| | 16,000 | | |
$ | 9.00 | | |
March 30, 2027 |
| | 17,200 | | |
$ | 12.50 | | |
March 30, 2027 |
| | 3,000 | | |
$ | 15.00 | | |
March 30, 2027 |
The estimated
value of the warrants issued during the six months ended June 30, 2022, as well as the assumptions that were used in calculating such
values, were based on estimates at the issuance date in the table below.
Schedule
of Estimated Values of Warrants Valuation Assumptions
| | |
Warrants Issued | |
| | |
April 1, 2022 | |
| Risk-free interest rate | |
| 2.55 | % |
| Weighted average expected term | |
| 5 years | |
| Expected volatility | |
| 116.32 | % |
| Expected dividend yield | |
| 0.00 | % |
|
| X |
- References
+ Details
| Name: |
us-gaap_EquityAbstract |
| Namespace Prefix: |
us-gaap_ |
| Data Type: |
xbrli:stringItemType |
| Balance Type: |
na |
| Period Type: |
duration |
|
| X |
- DefinitionThe entire disclosure for equity. Reference 1: http://www.xbrl.org/2003/role/disclosureRef
-Topic 505
-SubTopic 10
-Name Accounting Standards Codification
-Section 50
-Paragraph 13
-Subparagraph (b)
-Publisher FASB
-URI https://asc.fasb.org//1943274/2147481112/505-10-50-13
Reference 2: http://www.xbrl.org/2003/role/disclosureRef
-Topic 505
-SubTopic 10
-Name Accounting Standards Codification
-Section 50
-Paragraph 13
-Subparagraph (h)
-Publisher FASB
-URI https://asc.fasb.org//1943274/2147481112/505-10-50-13
Reference 3: http://www.xbrl.org/2003/role/disclosureRef
-Topic 505
-SubTopic 10
-Name Accounting Standards Codification
-Section 50
-Paragraph 14
-Subparagraph (b)
-Publisher FASB
-URI https://asc.fasb.org//1943274/2147481112/505-10-50-14
Reference 4: http://www.xbrl.org/2003/role/disclosureRef
-Topic 946
-SubTopic 235
-Name Accounting Standards Codification
-Section 50
-Paragraph 2
-Subparagraph (a)
-Publisher FASB
-URI https://asc.fasb.org//1943274/2147481062/946-235-50-2
Reference 5: http://www.xbrl.org/2003/role/disclosureRef
-Topic 946
-SubTopic 235
-Name Accounting Standards Codification
-Section 50
-Paragraph 2
-Subparagraph (d)
-Publisher FASB
-URI https://asc.fasb.org//1943274/2147481062/946-235-50-2
Reference 6: http://www.xbrl.org/2003/role/disclosureRef
-Topic 946
-SubTopic 505
-Name Accounting Standards Codification
-Section 50
-Paragraph 6
-Publisher FASB
-URI https://asc.fasb.org//1943274/2147481004/946-505-50-6
Reference 7: http://www.xbrl.org/2003/role/disclosureRef
-Topic 815
-SubTopic 40
-Name Accounting Standards Codification
-Section 50
-Paragraph 6
-Subparagraph (a)
-Publisher FASB
-URI https://asc.fasb.org//1943274/2147480237/815-40-50-6
Reference 8: http://www.xbrl.org/2003/role/disclosureRef
-Topic 505
-SubTopic 10
-Name Accounting Standards Codification
-Section S99
-Paragraph 1
-Subparagraph (SX 210.3-04)
-Publisher FASB
-URI https://asc.fasb.org//1943274/2147480008/505-10-S99-1
Reference 9: http://www.xbrl.org/2003/role/disclosureRef
-Topic 235
-SubTopic 10
-Name Accounting Standards Codification
-Section S99
-Paragraph 1
-Subparagraph (SX 210.4-08(e)(1))
-Publisher FASB
-URI https://asc.fasb.org//1943274/2147480678/235-10-S99-1
Reference 10: http://fasb.org/us-gaap/role/ref/legacyRef
-Topic 505
-Name Accounting Standards Codification
-Publisher FASB
-URI https://asc.fasb.org//505/tableOfContent
Reference 11: http://www.xbrl.org/2003/role/disclosureRef
-Topic 505
-SubTopic 10
-Name Accounting Standards Codification
-Section 50
-Paragraph 13
-Publisher FASB
-URI https://asc.fasb.org//1943274/2147481112/505-10-50-13
Reference 12: http://www.xbrl.org/2003/role/disclosureRef
-Topic 505
-SubTopic 10
-Name Accounting Standards Codification
-Section 50
-Paragraph 13
-Subparagraph (g)
-Publisher FASB
-URI https://asc.fasb.org//1943274/2147481112/505-10-50-13
Reference 13: http://www.xbrl.org/2003/role/disclosureRef
-Topic 505
-SubTopic 10
-Name Accounting Standards Codification
-Section 50
-Paragraph 13
-Subparagraph (i)
-Publisher FASB
-URI https://asc.fasb.org//1943274/2147481112/505-10-50-13
Reference 14: http://www.xbrl.org/2003/role/disclosureRef
-Topic 505
-SubTopic 10
-Name Accounting Standards Codification
-Section 50
-Paragraph 14
-Subparagraph (a)
-Publisher FASB
-URI https://asc.fasb.org//1943274/2147481112/505-10-50-14
Reference 15: http://www.xbrl.org/2003/role/disclosureRef
-Topic 505
-SubTopic 10
-Name Accounting Standards Codification
-Section 50
-Paragraph 14
-Subparagraph (c)
-Publisher FASB
-URI https://asc.fasb.org//1943274/2147481112/505-10-50-14
Reference 16: http://www.xbrl.org/2003/role/disclosureRef
-Topic 505
-SubTopic 10
-Name Accounting Standards Codification
-Section 50
-Paragraph 16
-Subparagraph (b)
-Publisher FASB
-URI https://asc.fasb.org//1943274/2147481112/505-10-50-16
Reference 17: http://www.xbrl.org/2003/role/disclosureRef
-Topic 505
-SubTopic 10
-Name Accounting Standards Codification
-Section 50
-Paragraph 18
-Subparagraph (a)
-Publisher FASB
-URI https://asc.fasb.org//1943274/2147481112/505-10-50-18
Reference 18: http://www.xbrl.org/2003/role/disclosureRef
-Topic 505
-SubTopic 10
-Name Accounting Standards Codification
-Section 50
-Paragraph 18
-Subparagraph (b)
-Publisher FASB
-URI https://asc.fasb.org//1943274/2147481112/505-10-50-18
Reference 19: http://www.xbrl.org/2003/role/disclosureRef
-Topic 505
-SubTopic 10
-Name Accounting Standards Codification
-Section 50
-Paragraph 18
-Subparagraph (d)
-Publisher FASB
-URI https://asc.fasb.org//1943274/2147481112/505-10-50-18
| Name: |
us-gaap_StockholdersEquityNoteDisclosureTextBlock |
| Namespace Prefix: |
us-gaap_ |
| Data Type: |
dtr-types:textBlockItemType |
| Balance Type: |
na |
| Period Type: |
duration |
|
v3.23.2
Stock-Based Compensation
|
6 Months Ended |
Jun. 30, 2023 |
|---|
| Share-Based Payment Arrangement [Abstract] |
|
| Stock-Based Compensation |
13.
Stock-Based Compensation
From
time to time, we issue stock options and restricted stock as compensation for services rendered by our directors and employees.
Restricted
Stock
On
January 6, 2022, we issued 8,097 shares of restricted common stock to our directors as part of their annual compensation plan. The grants
of restricted common stock were made outside the 2015 Plan and were not subject to vesting. Stock compensation of $57,500 was recorded
on the issuance of the common stock for the six months ended June 30, 2022.
Stock
Options
We
did not make any stock option grants during the six months ended June 30, 2023. On April 14, 2022, we granted employees stock options
to purchase 220,587 shares at an exercise price of $6.08 per share in accordance with the 2015 Plan, with vesting continuing until 2025.
The total fair value of $1,152,470 for these stock options is being recognized over the requisite service period.
The
weighted-average grant date fair value of options granted during the three and six months ended June 30, 2022 was $5.22. The weighted
average assumptions that were used in calculating such values during the six months ended June 30, 2022, as well as the assumptions that
were used in calculating such values, were based on estimates at the grant date in the table as follows:
Schedule
of Estimated Values of Stock Option Grants Valuation Assumptions
| | |
Grant Date | |
| | |
April 1, 2022 | |
| Risk-free interest rate | |
| 2.82 | % |
| Weighted average expected term | |
| 6 years | |
| Expected volatility | |
| 116.60 | % |
| Expected dividend yield | |
| 0.00 | % |
A
summary of stock option activity during the six months ended June 30, 2023 and 2022 is as follows:
Schedule of Stock Option Activity
| | |
| | |
| | |
Weighted- | | |
| |
| | |
| | |
Weighted- | | |
Average | | |
| |
| | |
Shares | | |
Average | | |
Remaining | | |
Aggregate | |
| | |
Under | | |
Exercise | | |
Contractual | | |
Intrinsic | |
| | |
Option | | |
Price | | |
Life | | |
Value | |
| Outstanding at January 1, 2023 | |
| 365,447 | | |
$ | 5.89 | | |
| 8 years | | |
$ | 19,200 | |
| Granted | |
| 220,587 | | |
| 6.08 | | |
| | | |
| | |
| Forfeited | |
| (5,000 | ) | |
| 4.00 | | |
| | | |
| | |
| Outstanding at June 30, 2023 | |
| 360,447 | | |
$ | 5.92 | | |
| 8 years | | |
$ | 19,200 | |
| | |
| | | |
| | | |
| | | |
| | |
| Exercisable at June, 2023 | |
| 165,654 | | |
$ | 6.32 | | |
| 7 years | | |
$ | 19,200 | |
| | |
| | |
| | |
Weighted- | | |
| |
| | |
| | |
Weighted- | | |
Average | | |
| |
| | |
Shares | | |
Average | | |
Remaining | | |
Aggregate | |
| | |
Under | | |
Exercise | | |
Contractual | | |
Intrinsic | |
| | |
Option | | |
Price | | |
Life | | |
Value | |
| Outstanding at January 1, 2022 | |
| 144,860 | | |
$ | 5.61 | | |
| 8 years | | |
$ | 19,200 | |
| Granted | |
| 220,587 | | |
| 6.08 | | |
| | | |
| | |
| Outstanding at June 30, 2022 | |
| 365,447 | | |
$ | 5.89 | | |
| 9 years | | |
$ | 19,200 | |
| | |
| | | |
| | | |
| | | |
| | |
| Exercisable at June 30, 2022 | |
| 68,335 | | |
$ | 7.32 | | |
| 7 years | | |
$ | 19,200 | |
During
the three and six months ended June 30, 2023 and 2022, stock-based compensation for options was $115,456
and $233,618,
respectively, and $22,960 and $102,992, respectively.
As
of June 30, 2023 and December 31, 2022, there were $778,893 and $1,019,140, respectively, of total unrecognized compensation costs related
to stock options granted under our stock option agreements. The unrecognized compensation cost is expected to be recognized over a weighted-average
period of two years. The total fair value of stock options that vested during the six months ended June 30, 2023 and 2022 was $390,221
and $10,238, respectively.
|
| X |
- DefinitionThe entire disclosure for share-based payment arrangement. Reference 1: http://www.xbrl.org/2003/role/exampleRef
-Topic 718
-SubTopic 10
-Name Accounting Standards Codification
-Section 50
-Paragraph 2
-Subparagraph (a)(1)
-Publisher FASB
-URI https://asc.fasb.org//1943274/2147480429/718-10-50-2
Reference 2: http://www.xbrl.org/2003/role/disclosureRef
-Topic 718
-Name Accounting Standards Codification
-Publisher FASB
-URI https://asc.fasb.org//718/tableOfContent
Reference 3: http://www.xbrl.org/2003/role/disclosureRef
-Topic 718
-SubTopic 10
-Name Accounting Standards Codification
-Section 50
-Paragraph 2
-Subparagraph (a)
-Publisher FASB
-URI https://asc.fasb.org//1943274/2147480429/718-10-50-2
Reference 4: http://www.xbrl.org/2003/role/disclosureRef
-Topic 718
-SubTopic 10
-Name Accounting Standards Codification
-Section 50
-Paragraph 2
-Subparagraph (h)(2)
-Publisher FASB
-URI https://asc.fasb.org//1943274/2147480429/718-10-50-2
Reference 5: http://www.xbrl.org/2003/role/disclosureRef
-Topic 718
-SubTopic 10
-Name Accounting Standards Codification
-Section 50
-Paragraph 2
-Subparagraph (h)(2)(i)
-Publisher FASB
-URI https://asc.fasb.org//1943274/2147480429/718-10-50-2
Reference 6: http://www.xbrl.org/2003/role/disclosureRef
-Topic 718
-SubTopic 10
-Name Accounting Standards Codification
-Section 50
-Paragraph 2
-Subparagraph (l)
-Publisher FASB
-URI https://asc.fasb.org//1943274/2147480429/718-10-50-2
| Name: |
us-gaap_DisclosureOfCompensationRelatedCostsShareBasedPaymentsTextBlock |
| Namespace Prefix: |
us-gaap_ |
| Data Type: |
dtr-types:textBlockItemType |
| Balance Type: |
na |
| Period Type: |
duration |
|
v3.23.2
Concentrations
|
6 Months Ended |
Jun. 30, 2023 |
|---|
| Risks and Uncertainties [Abstract] |
|
| Concentrations |
14.
Concentrations
Revenues
from a limited number of customers have accounted for a substantial percentage of our total revenues. During the three months ended June
30, 2023 and 2022, our largest customer, the State of Michigan, accounted for 36% and 35%, respectively, of our total revenues, and our
second largest customer, Rocket Mortgage, accounted for 5% and 6%, respectively, of our total revenues. During the six months ended June
30, 2023 and 2022, our largest customer, the State of Michigan, accounted for 35% and 37%, respectively, of our total revenues, and our
second largest customer, Rocket Mortgage, accounted for 5% and 8%, respectively, of our total revenues.
For
the three months ended June 30, 2023 and 2022, government contracts, including K-12 education, represented approximately 79% and 77%, respectively, of our net revenues.
For the six months ended June 30, 2023 and 2022, government contracts, including K-12 education, represented approximately 76% and 72%, respectively, of our net
revenues. A significant portion of our sales to resellers represent ultimate sales to government agencies.
As
of June 30, 2023, accounts receivable concentrations from our two largest customers were 37%
and 10%
of our gross accounts receivable, respectively by customer. Accounts receivable balances from our two largest customers at June 30, 2023
have been partially collected. As of December 31, 2022, accounts receivable concentrations from our two largest customers were 44%
and 7%
of gross accounts receivable, respectively by customer.
|
| X |
- DefinitionThe entire disclosure for any concentrations existing at the date of the financial statements that make an entity vulnerable to a reasonably possible, near-term, severe impact. This disclosure informs financial statement users about the general nature of the risk associated with the concentration, and may indicate the percentage of concentration risk as of the balance sheet date. Reference 1: http://fasb.org/us-gaap/role/ref/legacyRef
-Topic 275
-Name Accounting Standards Codification
-Publisher FASB
-URI https://asc.fasb.org//275/tableOfContent
| Name: |
us-gaap_ConcentrationRiskDisclosureTextBlock |
| Namespace Prefix: |
us-gaap_ |
| Data Type: |
dtr-types:textBlockItemType |
| Balance Type: |
na |
| Period Type: |
duration |
|
| X |
- References
+ Details
| Name: |
us-gaap_RisksAndUncertaintiesAbstract |
| Namespace Prefix: |
us-gaap_ |
| Data Type: |
xbrli:stringItemType |
| Balance Type: |
na |
| Period Type: |
duration |
|
v3.23.2
Summary of Significant Accounting Policies (Policies)
|
6 Months Ended |
Jun. 30, 2023 |
|---|
| Accounting Policies [Abstract] |
|
| Principles of Consolidation |
Principles
of Consolidation
The
condensed consolidated financial statements accompanying these notes include the accounts of Intellinetics and the accounts of all its
subsidiaries in which it holds a controlling interest. Under GAAP, consolidation is generally required for investments of more than 50%
of the outstanding voting stock of an investee, except when control is not held by the majority owner. We have two subsidiaries: Intellinetics
Ohio and Graphic Sciences. We consider the criteria established under Financial Accounting Standards Board (“FASB”) Accounting
Standard Codification (“ASC”) 810, “Consolidations” in the consolidation process. All significant intercompany
balances and transactions have been eliminated in consolidation.
|
| Concentrations of Credit Risk |
Concentrations
of Credit Risk
We
maintain our cash with high credit quality financial institutions. At times, our cash and cash equivalents may be uninsured or in deposit
accounts that exceed the Federal Deposit Insurance Corporation insurance limit.
We
do not generally require collateral or other security to support customer receivables; however, we may require customers to provide retainers,
up-front deposits or irrevocable letters-of-credit when considered necessary to mitigate credit risks. We have established an allowance
for credit losses based upon facts surrounding the credit risk of specific customers and expected future collections. Credit losses have
been within management’s expectations. At June 30, 2023 and December 31, 2022, our allowance for credit losses was $114,219 and
$88,331, respectively.
Contract
balances
The
following table present changes in our contract assets during the six months ended June 30, 2023 and 2022:
Schedule of Changes in Contract Assets
| | |
| | |
Addition | | |
| | |
| | |
| |
| | |
Balance at | | |
from | | |
| | |
| | |
Balance at | |
| | |
Beginning | | |
acquisition | | |
| | |
Recognized | | |
End of | |
| | |
of Period | | |
(Note 4) | | |
Billings | | |
Revenue | | |
Period | |
| Six months ended June 30, 2023 | |
| | | |
| | | |
| | | |
| | | |
| | |
| Accounts receivable | |
$ | 1,121,083 | | |
$ | - | | |
$ | 7,342,400 | | |
$ | (7,136,497 | ) | |
$ | 1,326,986 | |
| | |
| | | |
| | | |
| | | |
| | | |
| | |
| Six months ended June 30, 2022 | |
| | | |
| | | |
| | | |
| | | |
| | |
| Accounts receivable | |
$ | 1,176,059 | | |
$ | 68,380 | | |
$ | 5,604,581 | | |
$ | (5,977,525 | ) | |
$ | 871,495 | |
| | |
Balance at Beginning of Period | | |
Revenue Recognized in Advance of Billings | | |
Billings | | |
Balance at End of Period | |
| Six months ended June 30, 2023 | |
| | | |
| | | |
| | | |
| | |
| Accounts receivable, unbilled | |
$ | 596,410 | | |
$ | 2,703,932 | | |
$ | (2,262,329 | ) | |
$ | 1,038,013 | |
| | |
| | | |
| | | |
| | | |
| | |
| Six months ended June 30, 2022 | |
| | | |
| | | |
| | | |
| | |
| Accounts receivable, unbilled | |
$ | 444,782 | | |
$ | 1,501,726 | | |
$ | (1,511,429 | ) | |
$ | 435,079 | |
| | |
Balance at Beginning of Period | | |
Commissions Paid | | |
Commissions Recognized | | |
Balance at End of Period | |
| Six months ended June 30, 2023 | |
| | | |
| | | |
| | | |
| | |
| Other contract assets | |
$ | 80,378 | | |
$ | 80,077 | | |
$ | (63,985 | ) | |
$ | 96,470 | |
| | |
| | | |
| | | |
| | | |
| | |
| Six months ended June 30, 2022 | |
| | | |
| | | |
| | | |
| | |
| Other contract assets | |
$ | 78,556 | | |
$ | 52,310 | | |
$ | (29,708 | ) | |
$ | 101,158 | |
Deferred
revenue
Amounts
that have been invoiced are recognized in accounts receivable, deferred revenue or revenue, depending on whether the revenue recognition
criteria have been met. Deferred revenue represents amounts billed for which revenue has not yet been recognized. Deferred revenues typically
relate to maintenance and software-as-a-service agreements which have been paid for by customers prior to the performance of those services,
and payments received for professional services and license arrangements and software-as-a-service performance obligations that have
been deferred until fulfilled under our revenue recognition policy.
Remaining
performance obligations represent the transaction price from contracts for which work has not been performed or goods and services have
not been delivered. We expect to recognize revenue on approximately 97% of the remaining performance obligations over the next 12 months,
with the remainder recognized thereafter. As of June 30, 2023, the aggregate amount of the transaction price allocated to remaining performance
obligations for software as a service and software maintenance contracts with a duration greater than one year was $59,499. As of December
31, 2022, the aggregate amount of the transaction price allocated to remaining performance obligations for software as a service and
software maintenance contracts with a duration greater than one year was $74,448. This does not include revenue related to performance
obligations that are part of a contract whose original expected duration is one year or less.
The
following table presents changes in our contract liabilities during the six months ended June 30, 2023 and 2022:
| | |
| | |
Addition | | |
| | |
| | |
| |
| | |
Balance at | | |
from | | |
| | |
| | |
Balance at | |
| | |
Beginning | | |
acquisition | | |
| | |
Recognized | | |
End of | |
| |
of Period | | |
(Note 4) | | |
Billings | | |
Revenue | | |
Period | |
| Six months ended June 30, 2023 | |
| | |
| | |
| | |
| | |
| |
| Contract liabilities: Deferred revenue | |
$ | 2,754,064 | | |
$ | - | | |
$ | 3,522,274 | | |
$ | (4,208,594 | ) | |
$ | 2,067,744 | |
| | |
| | | |
| | | |
| | | |
| | | |
| | |
| Six months ended June 30, 2022 | |
| | | |
| | | |
| | | |
| | | |
| | |
| Contract liabilities: Deferred revenue | |
$ | 1,194,649 | | |
$ | 860,456 | | |
$ | 3,166,205 | | |
$ | (3,507,239 | ) | |
$ | 1,714,071 | |
|
| Leases |
Leases
We have made an accounting policy election to not
record a right-of-use asset and lease liability for short-term leases, which are defined as leases with a lease term of 12 months or less.
Instead, the lease payments are recognized as rent expense in the general and administrative expenses on the statement of operations.
|
| Software Development Costs |
Software
Development Costs
We
design, develop, test, market, license, and support new software products and enhancements of current products. We continuously
monitor our software products and enhancements to remain compatible with standard platforms and file formats. In accordance with ASC
985-20 “Costs of Software to be Sold, Leased or Otherwise Marketed,” we expense software development costs, including
costs to develop software products or the software component of products to be sold, leased, or marketed to external users, before
technological feasibility is reached. Once technological feasibility has been established, certain software development costs
incurred during the application development stage are eligible for capitalization. Based on our software development process,
technical feasibility is established upon completion of a working model. Technological feasibility is typically reached shortly
before the release of such products. No such costs were capitalized during the six-month period 2023. Such costs in the amount of
$43,771
were capitalized during the three and six-month period 2022.
In
accordance with ASC 350-40, “Internal-Use Software,” we capitalize purchase and implementation costs of internal use software.
Once an application has reached development stage, internal and external costs, if direct and incremental, are capitalized until the
software is substantially complete and ready for its intended use. Capitalization ceases upon completion of all substantial testing.
We also capitalize costs related to specific upgrades and enhancements when it is probable that the expenditure will result in additional
functionality. Such costs in the amount of $96,209 and $208,417 were capitalized during the three and six months ended June 30, 2023.
Such costs in the amount of $98,037 and $127,434 were capitalized during the three and six months ended June 30, 2022.
Capitalized
costs are stated at cost less accumulated amortization. Amortization is computed over the estimated useful lives of the related assets
on a straight-line basis, which is three years. At June 30, 2023 and December 31, 2022, our condensed consolidated balance sheets included
$525,337 and $402,673, respectively, in other long-term assets.
For
the three and six months ended June 30, 2023 and 2022, our expensed software development costs were $140,003 and $271,746, respectively,
and $62,208 and $114,959, respectively.
|
| Recently Issued Accounting Pronouncements |
Recently
Issued Accounting Pronouncements
In
June 2016, the FASB issued ASU No. 2016-13 “Credit Losses - Measurement of Credit Losses on Financial Instruments.” ASU No.
2016-13 significantly changes how entities measure credit losses for most financial assets, including accounts receivable and held-to-maturity
marketable securities, by replacing today’s “incurred loss” approach with an “expected loss” model under
which allowances will be recognized based on expected rather than incurred losses. ASU No. 2016-13 became effective for us in the first
quarter of 2023. The adoption of ASU No. 2016-13 resulted in an initial reduction in the allowance for doubtful accounts of $11,662, and the current calculation is reflected in the accompanying condensed consolidated
financial statements.
|
| Advertising |
Advertising
We
expense the cost of advertising as incurred. Advertising expense for the three and six months ended June 30, 2023 and 2022 amounted to
$6,123 and $12,243, respectively, and $9,052 and $9,500, respectively.
|
| Earnings (Loss) Per Share |
Earnings
(Loss) Per Share
Basic
income or loss per share is computed by dividing net income or loss by the weighted average number of shares of common stock outstanding
during the period. Diluted income or loss per share is computed by dividing net income or loss by the diluted weighted average number
of shares of common stock outstanding during the period. The diluted weighted average number of shares gives effect to all dilutive potential
common shares outstanding during the period using the treasury stock method. Diluted earnings per share exclude all diluted potential
shares if their effect is anti-dilutive, including warrants or options which are out-of-the-money and for those periods with a net loss.
We
have outstanding warrants and stock options which have not been included in the calculation of diluted net loss per share for the three
and six months ended June 30, 2023 and 2022 because to do so would be anti-dilutive. As such, the numerator and the denominator used
in computing both basic and diluted net loss per share for each period are the same.
|
| Income Taxes |
Income
Taxes
We
file a consolidated federal income tax return with our subsidiaries. The provision for income taxes is computed by applying statutory
rates to income before taxes.
Deferred
income taxes are recognized for the tax consequences in future years of temporary differences between the financial reporting and tax
bases of assets and liabilities as of each period-end based on enacted tax laws and statutory rates. Valuation allowances are established
when necessary to reduce deferred tax assets to the amount expected to be realized. A 100% valuation allowance has been established on
deferred tax assets at June 30, 2023 and December 31, 2022, due to the uncertainty of our ability to realize future taxable income.
We
account for uncertainty in income taxes in our financial statements as required under ASC 740, “Income Taxes.” The standard
prescribes a recognition threshold and measurement attribute for the financial statement recognition and measurement of a tax position
taken or expected to be taken in a tax return. The standard also provides guidance on de-recognition, classification, interest and penalties,
accounting in interim periods, disclosure and transition accounting. Management determined there were no material uncertain positions
taken by us in our tax returns.
|
| Segment Information |
Segment
Information
Operating
segments are defined in the criteria established under ASC 280, “Segment Reporting,” as components of public entities that
engage in business activities from which they may earn revenues and incur expenses for which separate financial information is available
and which is evaluated regularly by our chief operating decision maker (“CODM”) in deciding how to assess performance and
allocate resources. Our CODM assesses performance and allocates resources based on two operating segments: Document Management and Document
Conversion. These segments contain individual business components that have been combined on the basis of common management, customers,
solutions offered, service processes and other economic characteristics. We currently have immaterial intersegment sales. We evaluate
the performance of our segments based on gross profits.
The
Document Management Segment provides cloud-based and premise-based content services software. Its modular suite of solutions complements
existing operating and accounting systems to serve a mission-critical role for organizations to make content secure, compliant, and process-ready.
This segment conducts its primary operations in the United States. Markets served include highly regulated, risk and compliance-intensive
markets in healthcare, K-12 education, public safety, other public sector, risk management, financial services, and others. Solutions
are sold both directly to end-users and through resellers.
The
Document Conversion Segment provides services for scanning and indexing, converting images from paper to digital, paper to microfilm,
and microfiche to microfilm, as well as long-term physical document storage and retrieval. This segment conducts its primary operations
in the United States. Markets served include businesses and federal, county, and municipal governments. Solutions are sold both directly
to end-users and through a reseller distributor.
Information
by operating segment is as follows:
Schedule of Segment Information
| | |
2022 | | |
2021 | | |
2022 | | |
2021 | |
| | |
For the three months ended June 30, | | |
For the six months ended June 30, | |
| | |
2023 | | |
2022 | | |
2023 | | |
2022 | |
| Revenues | |
| | |
| | |
| | |
| |
| Document Management | |
$ | 1,879,369 | | |
$ | 1,572,854 | | |
$ | 3,705,103 | | |
$ | 2,487,804 | |
| Document Conversion | |
| 2,379,061 | | |
| 1,842,789 | | |
| 4,740,160 | | |
| 3,631,351 | |
| Total revenues | |
$ | 4,258,430 | | |
$ | 3,415,643 | | |
$ | 8,445,263 | | |
$ | 6,119,155 | |
| | |
| | | |
| | | |
| | | |
| | |
| Gross profit | |
| | | |
| | | |
| | | |
| | |
| Document Management | |
$ | 1,536,385 | | |
$ | 1,326,345 | | |
$ | 3,053,746 | | |
$ | 2,012,823 | |
| Document Conversion | |
| 1,054,048 | | |
| 862,673 | | |
| 2,182,526 | | |
| 1,808,032 | |
| Total gross profit | |
$ | 2,590,433 | | |
$ | 2,189,018 | | |
$ | 5,236,272 | | |
$ | 3,820,855 | |
| | |
| | | |
| | | |
| | | |
| | |
| Capital additions, net | |
| | | |
| | | |
| | | |
| | |
| Document Management | |
$ | 96,209 | | |
$ | 144,717 | | |
$ | 212,250 | | |
$ | 175,801 | |
| Document Conversion | |
| 60,323 | | |
| 39,244 | | |
| 78,851 | | |
| 93,600 | |
| Total capital additions, net | |
$ | 156,532 | | |
$ | 183,961 | | |
$ | 291,101 | | |
$ | 269,401 | |
| | |
June 30, 2023 | | |
December 31, 2022 | |
| Goodwill | |
| | |
| |
| Document Management | |
$ | 3,989,645 | | |
$ | 3,989,645 | |
| Document Conversion | |
| 1,800,176 | | |
| 1,800,176 | |
| Total goodwill | |
$ | 5,789,821 | | |
$ | 5,789,821 | |
| | |
June 30, 2023 | | |
December 31, 2022 | |
| Total assets | |
| | | |
| | |
| Document Management | |
$ | 9,706,315 | | |
$ | 10,284,183 | |
| Document Conversion | |
| 8,880,771 | | |
| 9,658,959 | |
| Total assets | |
$ | 18,587,086 | | |
$ | 19,943,142 | |
|
| Statement of Cash Flows |
Statement
of Cash Flows
For
purposes of reporting cash flows, cash includes cash on hand and demand deposits held by banks.
|
| Reclassifications |
Reclassifications
Certain
amounts reported in prior filings of the condensed consolidated financial statements have been reclassified to conform to current presentation.
|
| X |
- DefinitionCondensed cash flow statement [Policy Text Block]
| Name: |
INLX_CondensedCashFlowStatementPolicyTextBlock |
| Namespace Prefix: |
INLX_ |
| Data Type: |
dtr-types:textBlockItemType |
| Balance Type: |
na |
| Period Type: |
duration |
|
| X |
- DefinitionRecently issued accounting pronouncements not yet effective [Policy Text Block]
| Name: |
INLX_RecentlyIssuedAccountingPronouncementsNotYetEffectivePolicyTextBlock |
| Namespace Prefix: |
INLX_ |
| Data Type: |
dtr-types:textBlockItemType |
| Balance Type: |
na |
| Period Type: |
duration |
|
| X |
- References
+ Details
| Name: |
us-gaap_AccountingPoliciesAbstract |
| Namespace Prefix: |
us-gaap_ |
| Data Type: |
xbrli:stringItemType |
| Balance Type: |
na |
| Period Type: |
duration |
|
| X |
- DefinitionDisclosure of accounting policy for advertising cost. Reference 1: http://www.xbrl.org/2003/role/disclosureRef
-Name Accounting Standards Codification
-Section 50
-Paragraph 1
-Subparagraph (a)
-SubTopic 35
-Topic 720
-Publisher FASB
-URI https://asc.fasb.org//1943274/2147483406/720-35-50-1
| Name: |
us-gaap_AdvertisingCostsPolicyTextBlock |
| Namespace Prefix: |
us-gaap_ |
| Data Type: |
dtr-types:textBlockItemType |
| Balance Type: |
na |
| Period Type: |
duration |
|
| X |
- DefinitionDisclosure of accounting policy for credit risk. Reference 1: http://fasb.org/us-gaap/role/ref/legacyRef
-Name Accounting Standards Codification
-Topic 942
-SubTopic 825
-Section 50
-Paragraph 1
-Publisher FASB
-URI https://asc.fasb.org//1943274/2147480981/942-825-50-1
Reference 2: http://www.xbrl.org/2003/role/disclosureRef
-Name Accounting Standards Codification
-Section 50
-Paragraph 1
-Subparagraph (d)
-SubTopic 10
-Topic 275
-Publisher FASB
-URI https://asc.fasb.org//1943274/2147482861/275-10-50-1
| Name: |
us-gaap_ConcentrationRiskCreditRisk |
| Namespace Prefix: |
us-gaap_ |
| Data Type: |
dtr-types:textBlockItemType |
| Balance Type: |
na |
| Period Type: |
duration |
|
| X |
- DefinitionDisclosure of accounting policy regarding (1) the principles it follows in consolidating or combining the separate financial statements, including the principles followed in determining the inclusion or exclusion of subsidiaries or other entities in the consolidated or combined financial statements and (2) its treatment of interests (for example, common stock, a partnership interest or other means of exerting influence) in other entities, for example consolidation or use of the equity or cost methods of accounting. The accounting policy may also address the accounting treatment for intercompany accounts and transactions, noncontrolling interest, and the income statement treatment in consolidation for issuances of stock by a subsidiary. Reference 1: http://www.xbrl.org/2003/role/exampleRef
-Topic 235
-SubTopic 10
-Name Accounting Standards Codification
-Section 50
-Paragraph 4
-Subparagraph (a)
-Publisher FASB
-URI https://asc.fasb.org//1943274/2147483426/235-10-50-4
Reference 2: http://fasb.org/us-gaap/role/ref/legacyRef
-Name Accounting Standards Codification
-Topic 810
-SubTopic 10
-Section 50
-Paragraph 1
-Publisher FASB
-URI https://asc.fasb.org//1943274/2147481203/810-10-50-1
| Name: |
us-gaap_ConsolidationPolicyTextBlock |
| Namespace Prefix: |
us-gaap_ |
| Data Type: |
dtr-types:textBlockItemType |
| Balance Type: |
na |
| Period Type: |
duration |
|
| X |
- DefinitionDisclosure of accounting policy for computing basic and diluted earnings or loss per share for each class of common stock and participating security. Addresses all significant policy factors, including any antidilutive items that have been excluded from the computation and takes into account stock dividends, splits and reverse splits that occur after the balance sheet date of the latest reporting period but before the issuance of the financial statements. Reference 1: http://fasb.org/us-gaap/role/ref/legacyRef
-Name Accounting Standards Codification
-Topic 260
-SubTopic 10
-Section 50
-Paragraph 1
-Subparagraph (c)
-Publisher FASB
-URI https://asc.fasb.org//1943274/2147482662/260-10-50-1
Reference 2: http://fasb.org/us-gaap/role/ref/legacyRef
-Name Accounting Standards Codification
-Topic 260
-SubTopic 10
-Section 50
-Paragraph 2
-Publisher FASB
-URI https://asc.fasb.org//1943274/2147482662/260-10-50-2
| Name: |
us-gaap_EarningsPerSharePolicyTextBlock |
| Namespace Prefix: |
us-gaap_ |
| Data Type: |
dtr-types:textBlockItemType |
| Balance Type: |
na |
| Period Type: |
duration |
|
| X |
- DefinitionDisclosure of accounting policy for income taxes, which may include its accounting policies for recognizing and measuring deferred tax assets and liabilities and related valuation allowances, recognizing investment tax credits, operating loss carryforwards, tax credit carryforwards, and other carryforwards, methodologies for determining its effective income tax rate and the characterization of interest and penalties in the financial statements. Reference 1: http://www.xbrl.org/2003/role/disclosureRef
-Topic 946
-SubTopic 10
-Name Accounting Standards Codification
-Section S99
-Paragraph 3
-Subparagraph (SX 210.6-03(h)(1))
-Publisher FASB
-URI https://asc.fasb.org//1943274/2147479886/946-10-S99-3
Reference 2: http://www.xbrl.org/2003/role/disclosureRef
-Topic 740
-SubTopic 10
-Name Accounting Standards Codification
-Section 50
-Paragraph 17
-Subparagraph (b)
-Publisher FASB
-URI https://asc.fasb.org//1943274/2147482685/740-10-50-17
Reference 3: http://www.xbrl.org/2003/role/disclosureRef
-Topic 740
-SubTopic 10
-Name Accounting Standards Codification
-Section 50
-Paragraph 9
-Publisher FASB
-URI https://asc.fasb.org//1943274/2147482685/740-10-50-9
Reference 4: http://www.xbrl.org/2003/role/disclosureRef
-Topic 740
-SubTopic 10
-Name Accounting Standards Codification
-Section 45
-Paragraph 25
-Publisher FASB
-URI https://asc.fasb.org//1943274/2147482525/740-10-45-25
Reference 5: http://www.xbrl.org/2003/role/disclosureRef
-Topic 740
-SubTopic 10
-Name Accounting Standards Codification
-Section 45
-Paragraph 28
-Publisher FASB
-URI https://asc.fasb.org//1943274/2147482525/740-10-45-28
Reference 6: http://www.xbrl.org/2003/role/disclosureRef
-Topic 740
-SubTopic 10
-Name Accounting Standards Codification
-Section 50
-Paragraph 19
-Publisher FASB
-URI https://asc.fasb.org//1943274/2147482685/740-10-50-19
Reference 7: http://www.xbrl.org/2003/role/disclosureRef
-Topic 220
-SubTopic 10
-Name Accounting Standards Codification
-Section 50
-Paragraph 1
-Publisher FASB
-URI https://asc.fasb.org//1943274/2147482765/220-10-50-1
Reference 8: http://www.xbrl.org/2003/role/disclosureRef
-Topic 740
-SubTopic 10
-Name Accounting Standards Codification
-Section 50
-Paragraph 20
-Publisher FASB
-URI https://asc.fasb.org//1943274/2147482685/740-10-50-20
| Name: |
us-gaap_IncomeTaxPolicyTextBlock |
| Namespace Prefix: |
us-gaap_ |
| Data Type: |
dtr-types:textBlockItemType |
| Balance Type: |
na |
| Period Type: |
duration |
|
| X |
- DefinitionDisclosure of accounting policy for leasing arrangement entered into by lessee. Reference 1: http://www.xbrl.org/2003/role/disclosureRef
-Topic 842
-SubTopic 20
-Name Accounting Standards Codification
-Section 50
-Paragraph 1
-Subparagraph (b)
-Publisher FASB
-URI https://asc.fasb.org//1943274/2147478964/842-20-50-1
| Name: |
us-gaap_LesseeLeasesPolicyTextBlock |
| Namespace Prefix: |
us-gaap_ |
| Data Type: |
dtr-types:textBlockItemType |
| Balance Type: |
na |
| Period Type: |
duration |
|
| X |
- DefinitionDisclosure of accounting policy for reclassification affecting comparability of financial statement. Excludes amendment to accounting standards, other change in accounting principle, and correction of error. Reference 1: http://www.xbrl.org/2009/role/commonPracticeRef
-Topic 205
-SubTopic 10
-Name Accounting Standards Codification
-Section 50
-Paragraph 1
-Publisher FASB
-URI https://asc.fasb.org//1943274/2147483504/205-10-50-1
| Name: |
us-gaap_PriorPeriodReclassificationAdjustmentDescription |
| Namespace Prefix: |
us-gaap_ |
| Data Type: |
dtr-types:textBlockItemType |
| Balance Type: |
na |
| Period Type: |
duration |
|
| X |
- DefinitionDisclosure of accounting policy for its research and development and computer software activities including the accounting treatment for costs incurred for (1) research and development activities, (2) development of computer software for internal use, (3) computer software to be sold, leased or otherwise marketed as a separate product or as part of a product or process and (4) in-process research and development acquired in a purchase business combination. Reference 1: http://fasb.org/us-gaap/role/ref/legacyRef
-Name Accounting Standards Codification
-Topic 985
-SubTopic 20
-Section 50
-Paragraph 1
-Publisher FASB
-URI https://asc.fasb.org//1943274/2147481283/985-20-50-1
Reference 2: http://fasb.org/us-gaap/role/ref/legacyRef
-Name Accounting Standards Codification
-Section 25
-Paragraph 4
-SubTopic 50
-Topic 350
-Publisher FASB
-URI https://asc.fasb.org//1943274/2147482610/350-50-25-4
Reference 3: http://fasb.org/us-gaap/role/ref/legacyRef
-Name Accounting Standards Codification
-Section 30
-Paragraph 1
-SubTopic 40
-Topic 350
-Publisher FASB
-URI https://asc.fasb.org//1943274/2147482633/350-40-30-1
| Name: |
us-gaap_ResearchDevelopmentAndComputerSoftwarePolicyTextBlock |
| Namespace Prefix: |
us-gaap_ |
| Data Type: |
dtr-types:textBlockItemType |
| Balance Type: |
na |
| Period Type: |
duration |
|
| X |
- DefinitionDisclosure of accounting policy for segment reporting. Reference 1: http://www.xbrl.org/2003/role/exampleRef
-Topic 280
-SubTopic 10
-Name Accounting Standards Codification
-Section 55
-Paragraph 47
-Subparagraph (b)
-Publisher FASB
-URI https://asc.fasb.org//1943274/2147482785/280-10-55-47
Reference 2: http://www.xbrl.org/2003/role/disclosureRef
-Topic 280
-SubTopic 10
-Name Accounting Standards Codification
-Section 50
-Paragraph 29
-Subparagraph (d)
-Publisher FASB
-URI https://asc.fasb.org//1943274/2147482810/280-10-50-29
Reference 3: http://www.xbrl.org/2003/role/disclosureRef
-Topic 280
-SubTopic 10
-Name Accounting Standards Codification
-Section 50
-Paragraph 41
-Subparagraph (a)
-Publisher FASB
-URI https://asc.fasb.org//1943274/2147482810/280-10-50-41
Reference 4: http://www.xbrl.org/2003/role/disclosureRef
-Topic 280
-SubTopic 10
-Name Accounting Standards Codification
-Section 50
-Paragraph 29
-Publisher FASB
-URI https://asc.fasb.org//1943274/2147482810/280-10-50-29
Reference 5: http://www.xbrl.org/2003/role/disclosureRef
-Topic 280
-SubTopic 10
-Name Accounting Standards Codification
-Section 50
-Paragraph 29
-Subparagraph (a)
-Publisher FASB
-URI https://asc.fasb.org//1943274/2147482810/280-10-50-29
Reference 6: http://www.xbrl.org/2003/role/disclosureRef
-Topic 280
-SubTopic 10
-Name Accounting Standards Codification
-Section 50
-Paragraph 29
-Subparagraph (b)
-Publisher FASB
-URI https://asc.fasb.org//1943274/2147482810/280-10-50-29
Reference 7: http://www.xbrl.org/2003/role/disclosureRef
-Topic 280
-SubTopic 10
-Name Accounting Standards Codification
-Section 50
-Paragraph 29
-Subparagraph (c)
-Publisher FASB
-URI https://asc.fasb.org//1943274/2147482810/280-10-50-29
Reference 8: http://www.xbrl.org/2003/role/disclosureRef
-Topic 280
-SubTopic 10
-Name Accounting Standards Codification
-Section 50
-Paragraph 29
-Subparagraph (e)
-Publisher FASB
-URI https://asc.fasb.org//1943274/2147482810/280-10-50-29
| Name: |
us-gaap_SegmentReportingPolicyPolicyTextBlock |
| Namespace Prefix: |
us-gaap_ |
| Data Type: |
dtr-types:textBlockItemType |
| Balance Type: |
na |
| Period Type: |
duration |
|
v3.23.2
Summary of Significant Accounting Policies (Tables)
|
6 Months Ended |
Jun. 30, 2023 |
|---|
| Accounting Policies [Abstract] |
|
| Schedule of Changes in Contract Assets |
Schedule of Changes in Contract Assets
| | |
| | |
Addition | | |
| | |
| | |
| |
| | |
Balance at | | |
from | | |
| | |
| | |
Balance at | |
| | |
Beginning | | |
acquisition | | |
| | |
Recognized | | |
End of | |
| | |
of Period | | |
(Note 4) | | |
Billings | | |
Revenue | | |
Period | |
| Six months ended June 30, 2023 | |
| | | |
| | | |
| | | |
| | | |
| | |
| Accounts receivable | |
$ | 1,121,083 | | |
$ | - | | |
$ | 7,342,400 | | |
$ | (7,136,497 | ) | |
$ | 1,326,986 | |
| | |
| | | |
| | | |
| | | |
| | | |
| | |
| Six months ended June 30, 2022 | |
| | | |
| | | |
| | | |
| | | |
| | |
| Accounts receivable | |
$ | 1,176,059 | | |
$ | 68,380 | | |
$ | 5,604,581 | | |
$ | (5,977,525 | ) | |
$ | 871,495 | |
| | |
Balance at Beginning of Period | | |
Revenue Recognized in Advance of Billings | | |
Billings | | |
Balance at End of Period | |
| Six months ended June 30, 2023 | |
| | | |
| | | |
| | | |
| | |
| Accounts receivable, unbilled | |
$ | 596,410 | | |
$ | 2,703,932 | | |
$ | (2,262,329 | ) | |
$ | 1,038,013 | |
| | |
| | | |
| | | |
| | | |
| | |
| Six months ended June 30, 2022 | |
| | | |
| | | |
| | | |
| | |
| Accounts receivable, unbilled | |
$ | 444,782 | | |
$ | 1,501,726 | | |
$ | (1,511,429 | ) | |
$ | 435,079 | |
| | |
Balance at Beginning of Period | | |
Commissions Paid | | |
Commissions Recognized | | |
Balance at End of Period | |
| Six months ended June 30, 2023 | |
| | | |
| | | |
| | | |
| | |
| Other contract assets | |
$ | 80,378 | | |
$ | 80,077 | | |
$ | (63,985 | ) | |
$ | 96,470 | |
| | |
| | | |
| | | |
| | | |
| | |
| Six months ended June 30, 2022 | |
| | | |
| | | |
| | | |
| | |
| Other contract assets | |
$ | 78,556 | | |
$ | 52,310 | | |
$ | (29,708 | ) | |
$ | 101,158 | |
The
following table presents changes in our contract liabilities during the six months ended June 30, 2023 and 2022:
| | |
| | |
Addition | | |
| | |
| | |
| |
| | |
Balance at | | |
from | | |
| | |
| | |
Balance at | |
| | |
Beginning | | |
acquisition | | |
| | |
Recognized | | |
End of | |
| |
of Period | | |
(Note 4) | | |
Billings | | |
Revenue | | |
Period | |
| Six months ended June 30, 2023 | |
| | |
| | |
| | |
| | |
| |
| Contract liabilities: Deferred revenue | |
$ | 2,754,064 | | |
$ | - | | |
$ | 3,522,274 | | |
$ | (4,208,594 | ) | |
$ | 2,067,744 | |
| | |
| | | |
| | | |
| | | |
| | | |
| | |
| Six months ended June 30, 2022 | |
| | | |
| | | |
| | | |
| | | |
| | |
| Contract liabilities: Deferred revenue | |
$ | 1,194,649 | | |
$ | 860,456 | | |
$ | 3,166,205 | | |
$ | (3,507,239 | ) | |
$ | 1,714,071 | |
|
| Schedule of Segment Information |
Information
by operating segment is as follows:
Schedule of Segment Information
| | |
2022 | | |
2021 | | |
2022 | | |
2021 | |
| | |
For the three months ended June 30, | | |
For the six months ended June 30, | |
| | |
2023 | | |
2022 | | |
2023 | | |
2022 | |
| Revenues | |
| | |
| | |
| | |
| |
| Document Management | |
$ | 1,879,369 | | |
$ | 1,572,854 | | |
$ | 3,705,103 | | |
$ | 2,487,804 | |
| Document Conversion | |
| 2,379,061 | | |
| 1,842,789 | | |
| 4,740,160 | | |
| 3,631,351 | |
| Total revenues | |
$ | 4,258,430 | | |
$ | 3,415,643 | | |
$ | 8,445,263 | | |
$ | 6,119,155 | |
| | |
| | | |
| | | |
| | | |
| | |
| Gross profit | |
| | | |
| | | |
| | | |
| | |
| Document Management | |
$ | 1,536,385 | | |
$ | 1,326,345 | | |
$ | 3,053,746 | | |
$ | 2,012,823 | |
| Document Conversion | |
| 1,054,048 | | |
| 862,673 | | |
| 2,182,526 | | |
| 1,808,032 | |
| Total gross profit | |
$ | 2,590,433 | | |
$ | 2,189,018 | | |
$ | 5,236,272 | | |
$ | 3,820,855 | |
| | |
| | | |
| | | |
| | | |
| | |
| Capital additions, net | |
| | | |
| | | |
| | | |
| | |
| Document Management | |
$ | 96,209 | | |
$ | 144,717 | | |
$ | 212,250 | | |
$ | 175,801 | |
| Document Conversion | |
| 60,323 | | |
| 39,244 | | |
| 78,851 | | |
| 93,600 | |
| Total capital additions, net | |
$ | 156,532 | | |
$ | 183,961 | | |
$ | 291,101 | | |
$ | 269,401 | |
| | |
June 30, 2023 | | |
December 31, 2022 | |
| Goodwill | |
| | |
| |
| Document Management | |
$ | 3,989,645 | | |
$ | 3,989,645 | |
| Document Conversion | |
| 1,800,176 | | |
| 1,800,176 | |
| Total goodwill | |
$ | 5,789,821 | | |
$ | 5,789,821 | |
| | |
June 30, 2023 | | |
December 31, 2022 | |
| Total assets | |
| | | |
| | |
| Document Management | |
$ | 9,706,315 | | |
$ | 10,284,183 | |
| Document Conversion | |
| 8,880,771 | | |
| 9,658,959 | |
| Total assets | |
$ | 18,587,086 | | |
$ | 19,943,142 | |
|
| X |
- References
+ Details
| Name: |
us-gaap_AccountingPoliciesAbstract |
| Namespace Prefix: |
us-gaap_ |
| Data Type: |
xbrli:stringItemType |
| Balance Type: |
na |
| Period Type: |
duration |
|
| X |
- DefinitionTabular disclosure of receivable, contract asset, and contract liability from contract with customer. Includes, but is not limited to, change in contract asset and contract liability. Reference 1: http://www.xbrl.org/2009/role/commonPracticeRef
-Topic 606
-SubTopic 10
-Name Accounting Standards Codification
-Section 50
-Paragraph 10
-Publisher FASB
-URI https://asc.fasb.org//1943274/2147479806/606-10-50-10
| Name: |
us-gaap_ContractWithCustomerAssetAndLiabilityTableTextBlock |
| Namespace Prefix: |
us-gaap_ |
| Data Type: |
dtr-types:textBlockItemType |
| Balance Type: |
na |
| Period Type: |
duration |
|
| X |
- DefinitionTabular disclosure of the profit or loss and total assets for each reportable segment. An entity discloses certain information on each reportable segment if the amounts (a) are included in the measure of segment profit or loss reviewed by the chief operating decision maker or (b) are otherwise regularly provided to the chief operating decision maker, even if not included in that measure of segment profit or loss. Reference 1: http://fasb.org/us-gaap/role/ref/legacyRef
-Name Accounting Standards Codification
-Topic 350
-SubTopic 20
-Section 50
-Paragraph 1
-Publisher FASB
-URI https://asc.fasb.org//1943274/2147482573/350-20-50-1
Reference 2: http://fasb.org/us-gaap/role/ref/legacyRef
-Name Accounting Standards Codification
-Topic 280
-SubTopic 10
-Section 50
-Paragraph 25
-Publisher FASB
-URI https://asc.fasb.org//1943274/2147482810/280-10-50-25
Reference 3: http://fasb.org/us-gaap/role/ref/legacyRef
-Name Accounting Standards Codification
-Topic 280
-SubTopic 10
-Section 50
-Paragraph 22
-Publisher FASB
-URI https://asc.fasb.org//1943274/2147482810/280-10-50-22
Reference 4: http://fasb.org/us-gaap/role/ref/legacyRef
-Name Accounting Standards Codification
-Topic 280
-SubTopic 10
-Section 50
-Paragraph 30
-Publisher FASB
-URI https://asc.fasb.org//1943274/2147482810/280-10-50-30
| Name: |
us-gaap_ScheduleOfSegmentReportingInformationBySegmentTextBlock |
| Namespace Prefix: |
us-gaap_ |
| Data Type: |
dtr-types:textBlockItemType |
| Balance Type: |
na |
| Period Type: |
duration |
|
v3.23.2
Business Combinations (Tables)
|
6 Months Ended |
Jun. 30, 2023 |
|---|
| Business Combination and Asset Acquisition [Abstract] |
|
| Schedule of Fair Value of Assets Acquired and Liabilities Assumed |
The
purchase price has been preliminarily allocated to assets acquired and liabilities assumed based on the estimated fair value of such
assets and liabilities at the date of acquisitions as follows:
Schedule
of Fair Value of Assets Acquired and Liabilities Assumed
| Assets acquired: | |
| |
| Accounts receivable | |
$ | 68,380 | |
| Prepaid expenses | |
| 38,913 | |
| Property and equipment | |
| 30,018 | |
| Intangible assets (see Note 5) | |
| 3,888,000 | |
| Assets | |
| 4,025,311 | |
| Liabilities assumed: | |
| | |
| Accounts payable | |
| 36,446 | |
| Deferred revenue | |
| 1,072,530 | |
| Liabilities | |
| 1,108,976 | |
| | |
| | |
| Total identifiable net assets | |
| 2,916,335 | |
| | |
| | |
| Purchase price | |
| 6,383,269 | |
| | |
| | |
| Goodwill - Excess of purchase price over fair value of net assets acquired | |
$ | 3,466,934 | |
|
| Schedule of Pro Forma Information |
The
following unaudited pro forma information presents a summary of the condensed consolidated results of operations for the Company as if
the acquisition of Yellow Folder had occurred on January 1, 2022.
Schedule of Pro Forma Information
| | |
June 30, 2023 | | |
June 30, 2022 | |
| | |
For the three months ended | |
| | |
(unaudited) | | |
(unaudited) | |
| | |
June 30, 2023 | | |
June 30, 2022 | |
| Total revenues | |
$ | 4,258,430 | | |
$ | 3,415,643 | |
| | |
| | | |
| | |
| Net income (loss) | |
$ | 135,734 | | |
$ | (374,167 | ) |
| | |
| | | |
| | |
| Basic and diluted net income (loss) per share | |
$ | 0.03 | | |
$ | (0.09 | ) |
| Basic net income (loss) per share | |
$ | 0.03 | | |
$ | (0.09 | ) |
| | |
June 30, 2023 | | |
June 30, 2022 | |
| | |
For the six months ended | |
| | |
(unaudited) | | |
(unaudited) | |
| | |
June 30, 2023 | | |
June 30, 2022 | |
| Total revenues | |
$ | 8,445,263 | | |
$ | 6,897,007 | |
| | |
| | | |
| | |
| Net (loss) income | |
$ | 248,297 | | |
$ | (359,777 | ) |
| | |
| | | |
| | |
| Basic and diluted net income (loss) per share | |
$ | 0.06 | | |
$ | (0.09 | ) |
| Basic net income (loss) per share | |
$ | 0.06 | | |
$ | (0.09 | ) |
| | |
For the | | |
For the | |
| | |
three months ended | | |
six months ended | |
| | |
June 30, 2023 | | |
June 30, 2023 | |
| Yellow Folder: | |
| | | |
| | |
| Total revenues | |
$ | 864,331 | | |
$ | 1,738,893 | |
| Net income | |
$ | 85,408 | | |
$ | 271,111 | |
| | |
For the
three months ended
June 30, 2022 | | |
For the
six months ended
June 30, 2022 | |
| Yellow Folder: | |
| | | |
| | |
| Total revenues | |
$ | 790,368 | | |
$ | 790,368 | |
| Net income | |
$ | 196,559 | | |
$ | 196,559 | |
| Net income (loss) | |
$ | 196,559 | | |
$ | 196,559 | |
|
| X |
- DefinitionTabular disclosure of pro forma results of operations for a material business acquisition or series of individually immaterial business acquisitions that are material in the aggregate. Reference 1: http://www.xbrl.org/2009/role/commonPracticeRef
-Name Accounting Standards Codification
-Section 50
-Paragraph 2
-Subparagraph (h)(2)
-SubTopic 10
-Topic 805
-Publisher FASB
-URI https://asc.fasb.org//1943274/2147479328/805-10-50-2
Reference 2: http://www.xbrl.org/2009/role/commonPracticeRef
-Name Accounting Standards Codification
-Section 50
-Paragraph 2
-Subparagraph (h)(3)
-SubTopic 10
-Topic 805
-Publisher FASB
-URI https://asc.fasb.org//1943274/2147479328/805-10-50-2
| Name: |
us-gaap_BusinessAcquisitionProFormaInformationTextBlock |
| Namespace Prefix: |
us-gaap_ |
| Data Type: |
dtr-types:textBlockItemType |
| Balance Type: |
na |
| Period Type: |
duration |
|
| X |
- References
+ Details
| Name: |
us-gaap_BusinessCombinationAndAssetAcquisitionAbstract |
| Namespace Prefix: |
us-gaap_ |
| Data Type: |
xbrli:stringItemType |
| Balance Type: |
na |
| Period Type: |
duration |
|
| X |
- DefinitionTabular disclosure of the amounts recognized as of the acquisition date for each major class of assets acquired and liabilities assumed. May include but not limited to the following: (a) acquired receivables; (b) contingencies recognized at the acquisition date; and (c) the fair value of noncontrolling interests in the acquiree. Reference 1: http://fasb.org/us-gaap/role/ref/legacyRef
-Topic 805
-SubTopic 20
-Name Accounting Standards Codification
-Paragraph 1
-Section 50
-Publisher FASB
-URI https://asc.fasb.org//1943274/2147479907/805-20-50-1
| Name: |
us-gaap_ScheduleOfRecognizedIdentifiedAssetsAcquiredAndLiabilitiesAssumedTableTextBlock |
| Namespace Prefix: |
us-gaap_ |
| Data Type: |
dtr-types:textBlockItemType |
| Balance Type: |
na |
| Period Type: |
duration |
|
v3.23.2
Intangible Assets, Net (Tables)
|
6 Months Ended |
Jun. 30, 2023 |
|---|
| Goodwill and Intangible Assets Disclosure [Abstract] |
|
| Schedule of Intangible Assets |
At
June 30, 2023, intangible assets consisted of the following:
Schedule of Intangible Assets
| | |
Estimated | |
| | |
Accumulated | | |
| |
| | |
Useful Life | |
Costs | | |
Amortization | | |
Net | |
| Trade names | |
10 years | |
$ | 297,000 | | |
$ | (61,917 | ) | |
$ | 235,083 | |
| Proprietary technology | |
10 years | |
| 861,000 | | |
| (107,625 | ) | |
| 753,375 | |
| Customer relationships | |
5-15 years | |
| 4,091,000 | | |
| (914,966 | ) | |
| 3,176,034 | |
| | |
| |
$ | 5,249,000 | | |
$ | (1,084,508 | ) | |
$ | 4,164,492 | |
At
December 31, 2022, intangible assets consisted of the following:
| | |
Estimated | |
| | |
Accumulated | | |
| |
| | |
Useful Life | |
Costs | | |
Amortization | | |
Net | |
| Trade names | |
10 years | |
$ | 297,000 | | |
$ | (47,067 | ) | |
$ | 249,933 | |
| Proprietary technology | |
10 years | |
| 861,000 | | |
| (64,575 | ) | |
| 796,425 | |
| Customer relationships | |
5-15 years | |
| 4,091,000 | | |
| (717,712 | ) | |
| 3,373,288 | |
| | |
| |
$ | 5,249,000 | | |
$ | (829,354 | ) | |
$ | 4,419,646 | |
|
| Schedule of Amortization Expense for Intangible Assets |
Schedule of Amortization Expense for Intangible Assets
| For the Twelve Months Ending June 30, | |
Amount | |
| 2024 | |
$ | 510,308 | |
| 2025 | |
| 505,941 | |
| 2026 | |
| 431,441 | |
| 2027 | |
| 326,108 | |
| 2028 | |
| 319,316 | |
| Thereafter | |
| 2,071,378 | |
| Intangible assets | |
$ | 4,164,492 | |
|
| X |
- References
+ Details
| Name: |
us-gaap_GoodwillAndIntangibleAssetsDisclosureAbstract |
| Namespace Prefix: |
us-gaap_ |
| Data Type: |
xbrli:stringItemType |
| Balance Type: |
na |
| Period Type: |
duration |
|
| X |
- DefinitionTabular disclosure of assets, excluding financial assets and goodwill, lacking physical substance with a finite life, by either major class or business segment. Reference 1: http://fasb.org/us-gaap/role/ref/legacyRef
-Name Accounting Standards Codification
-Topic 350
-SubTopic 30
-Section 50
-Paragraph 1
-Subparagraph (a)
-Publisher FASB
-URI https://asc.fasb.org//1943274/2147482665/350-30-50-1
Reference 2: http://fasb.org/us-gaap/role/ref/legacyRef
-Name Accounting Standards Codification
-Topic 350
-SubTopic 30
-Section 50
-Paragraph 2
-Subparagraph (a)
-Publisher FASB
-URI https://asc.fasb.org//1943274/2147482665/350-30-50-2
| Name: |
us-gaap_ScheduleOfFiniteLivedIntangibleAssetsTableTextBlock |
| Namespace Prefix: |
us-gaap_ |
| Data Type: |
dtr-types:textBlockItemType |
| Balance Type: |
na |
| Period Type: |
duration |
|
| X |
- DefinitionTabular disclosure of the amount of amortization expense expected to be recorded in succeeding fiscal years for finite-lived intangible assets. Reference 1: http://fasb.org/us-gaap/role/ref/legacyRef
-Name Accounting Standards Codification
-Topic 350
-SubTopic 30
-Section 50
-Paragraph 2
-Subparagraph (a)
-Publisher FASB
-URI https://asc.fasb.org//1943274/2147482665/350-30-50-2
| Name: |
us-gaap_ScheduleofFiniteLivedIntangibleAssetsFutureAmortizationExpenseTableTextBlock |
| Namespace Prefix: |
us-gaap_ |
| Data Type: |
dtr-types:textBlockItemType |
| Balance Type: |
na |
| Period Type: |
duration |
|
v3.23.2
Fair Value Measurements (Tables)
|
6 Months Ended |
Jun. 30, 2023 |
|---|
| Fair Value Disclosures [Abstract] |
|
| Summary of Changes in Fair Value of Earnout Liabilities |
The
following table provides a summary of the changes in fair value of the earnout liabilities for the six months ended June 30, 2023 and 2022:
Summary
of Changes in Fair Value of Earnout Liabilities
| | |
June 30, 2023 | |
| Fair value at December 31, 2022 | |
$ | 700,000 | |
| Fair value, beginning balance | |
$ | 700,000 | |
| Payments | |
| (700,000 | ) |
| Change in fair value | |
| | |
| Fair value at June 30, 2023 | |
$ | - | |
| Fair value, ending balance | |
$ | - | |
| | |
Six months | |
| | |
ended | |
| | |
June 30, 2022 | |
| Fair value at December 31, 2021 | |
$ | 1,630,681 | |
| Fair value, beginning balance | |
$ | 1,630,681 | |
| Payment | |
| (1,018,333 | ) |
| Change in fair value | |
| 116,505 | |
| Fair value at June 30, 2022 | |
$ | 728,853 | |
| Fair value, ending balance | |
$ | 728,853 | |
|
| X |
- DefinitionSchedule of changes in fair value of plan liabillties [Table Text Block]
| Name: |
INLX_ScheduleOfChangesInFairValueOfPlanLiabilltiesTableTextBlock |
| Namespace Prefix: |
INLX_ |
| Data Type: |
dtr-types:textBlockItemType |
| Balance Type: |
na |
| Period Type: |
duration |
|
| X |
- References
+ Details
| Name: |
us-gaap_FairValueDisclosuresAbstract |
| Namespace Prefix: |
us-gaap_ |
| Data Type: |
xbrli:stringItemType |
| Balance Type: |
na |
| Period Type: |
duration |
|
v3.23.2
Property and Equipment (Tables)
|
6 Months Ended |
Jun. 30, 2023 |
|---|
| Property, Plant and Equipment [Abstract] |
|
| Schedule of Property and Equipment |
Property
and equipment are comprised of the following:
Schedule of Property and Equipment
| | |
June 30, 2023 | | |
December 31, 2022 | |
| Computer hardware and purchased software | |
$ | 1,661,438 | | |
$ | 1,595,652 | |
| Leasehold improvements | |
| 395,919 | | |
| 395,918 | |
| Furniture and fixtures | |
| 71,325 | | |
| 71,325 | |
| Property and equipment, gross | |
| 2,128,682 | | |
| 2,062,895 | |
| Less: accumulated depreciation | |
| (1,103,906 | ) | |
| (994,189 | ) |
| Property and equipment, net | |
$ | 1,024,776 | | |
$ | 1,068,706 | |
|
| X |
- References
+ Details
| Name: |
us-gaap_PropertyPlantAndEquipmentAbstract |
| Namespace Prefix: |
us-gaap_ |
| Data Type: |
xbrli:stringItemType |
| Balance Type: |
na |
| Period Type: |
duration |
|
| X |
- DefinitionTabular disclosure of physical assets used in the normal conduct of business and not intended for resale. Includes, but is not limited to, balances by class of assets, depreciation and depletion expense and method used, including composite depreciation, and accumulated deprecation. Reference 1: http://fasb.org/us-gaap/role/ref/legacyRef
-Name Accounting Standards Codification
-Section 50
-Paragraph 1
-SubTopic 10
-Topic 360
-Publisher FASB
-URI https://asc.fasb.org//1943274/2147482099/360-10-50-1
| Name: |
us-gaap_PropertyPlantAndEquipmentTextBlock |
| Namespace Prefix: |
us-gaap_ |
| Data Type: |
dtr-types:textBlockItemType |
| Balance Type: |
na |
| Period Type: |
duration |
|
v3.23.2
Notes Payable – Unrelated Parties (Tables)
|
6 Months Ended |
Jun. 30, 2023 |
|---|
| Debt Disclosure [Abstract] |
|
| Schedule of Notes Payable |
The
tables below summarize all notes payable at June 30, 2023 and December 31, 2022, respectively, with the exception of related party notes
disclosed in Note 9 “Notes Payable - Related Parties.”
Schedule
of Notes Payable
| | |
June 30, 2023 | | |
December 31, 2022 | |
| 2022 Unrelated Notes | |
$ | 2,364,500 | | |
$ | 2,364,500 | |
| 2020 Notes | |
| 717,500 | | |
| 980,450 | |
| Total notes payable | |
$ | 3,082,000 | | |
$ | 3,344,950 | |
| Less unamortized debt issuance costs | |
| (221,511 | ) | |
| (300,904 | ) |
| Less unamortized debt discount | |
| (4,267 | ) | |
| (22,045 | ) |
| Less current portion | |
| (709,083 | ) | |
| (936,966 | ) |
| Long-term portion of notes payable | |
$ | 2,147,139 | | |
$ | 2,085,035 | |
| Subordinated Notes Payable | |
Issue Date | |
Interest Rate | | |
Interest Due | |
Principal Due |
| 2022 Unrelated Notes | |
April 1, 2022 | |
| 12 | % | |
Quarterly | |
March 30, 2025 |
| 2020 Notes | |
March 2, 2020 | |
| 12 | % | |
Quarterly | |
August 31, 2023 |
|
| Schedule of Future Minimum Principal Payments of Notes Payable |
Future
minimum principal payments of the Notes Payable to Unrelated Parties are as follows:
Schedule
of Future Minimum Principal Payments of Notes Payable
| As of June 30, | |
Amount | |
| 2024 | |
$ | 717,500 | |
| 2025 | |
| 2,364,500 | |
| Total | |
$ | 3,082,000 | |
|
| X |
- References
+ Details
| Name: |
us-gaap_DebtDisclosureAbstract |
| Namespace Prefix: |
us-gaap_ |
| Data Type: |
xbrli:stringItemType |
| Balance Type: |
na |
| Period Type: |
duration |
|
| X |
- DefinitionTabular disclosure of information pertaining to short-term and long-debt instruments or arrangements, including but not limited to identification of terms, features, collateral requirements and other information necessary to a fair presentation.
| Name: |
us-gaap_ScheduleOfDebtTableTextBlock |
| Namespace Prefix: |
us-gaap_ |
| Data Type: |
dtr-types:textBlockItemType |
| Balance Type: |
na |
| Period Type: |
duration |
|
| X |
- DefinitionTabular disclosure of maturity and sinking fund requirement for long-term debt. Reference 1: http://fasb.org/us-gaap/role/ref/legacyRef
-Name Accounting Standards Codification
-Section 50
-Paragraph 1
-SubTopic 10
-Topic 470
-Publisher FASB
-URI https://asc.fasb.org//1943274/2147481544/470-10-50-1
| Name: |
us-gaap_ScheduleOfMaturitiesOfLongTermDebtTableTextBlock |
| Namespace Prefix: |
us-gaap_ |
| Data Type: |
dtr-types:textBlockItemType |
| Balance Type: |
na |
| Period Type: |
duration |
|
v3.23.2
Notes Payable - Related Parties (Tables)
|
6 Months Ended |
Jun. 30, 2023 |
|---|
| Related Party Transaction [Line Items] |
|
| Schedule of Notes Payable |
The
tables below summarize all notes payable at June 30, 2023 and December 31, 2022, respectively, with the exception of related party notes
disclosed in Note 9 “Notes Payable - Related Parties.”
Schedule
of Notes Payable
| | |
June 30, 2023 | | |
December 31, 2022 | |
| 2022 Unrelated Notes | |
$ | 2,364,500 | | |
$ | 2,364,500 | |
| 2020 Notes | |
| 717,500 | | |
| 980,450 | |
| Total notes payable | |
$ | 3,082,000 | | |
$ | 3,344,950 | |
| Less unamortized debt issuance costs | |
| (221,511 | ) | |
| (300,904 | ) |
| Less unamortized debt discount | |
| (4,267 | ) | |
| (22,045 | ) |
| Less current portion | |
| (709,083 | ) | |
| (936,966 | ) |
| Long-term portion of notes payable | |
$ | 2,147,139 | | |
$ | 2,085,035 | |
| Subordinated Notes Payable | |
Issue Date | |
Interest Rate | | |
Interest Due | |
Principal Due |
| 2022 Unrelated Notes | |
April 1, 2022 | |
| 12 | % | |
Quarterly | |
March 30, 2025 |
| 2020 Notes | |
March 2, 2020 | |
| 12 | % | |
Quarterly | |
August 31, 2023 |
|
| Schedule of Future Minimum Principal Payments of Notes Payable |
Future
minimum principal payments of the Notes Payable to Unrelated Parties are as follows:
Schedule
of Future Minimum Principal Payments of Notes Payable
| As of June 30, | |
Amount | |
| 2024 | |
$ | 717,500 | |
| 2025 | |
| 2,364,500 | |
| Total | |
$ | 3,082,000 | |
|
| Related Party [Member] |
|
| Related Party Transaction [Line Items] |
|
| Schedule of Notes Payable |
The
tables below summarize all notes payable to related parties at June 30, 2023 and December 31, 2022:
Schedule
of Notes Payable
| | |
June 30, 2023 | | |
December 31, 2022 | |
| Notes payable – “2022 Related Note” | |
$ | 600,000 | | |
$ | 600,000 | |
| Notes payable – “2022
Related Note” | |
$ | 600,000 | | |
$ | 600,000 | |
| Less unamortized debt issuance costs | |
| (55,157 | ) | |
| (70,916 | ) |
| Long-term portion of notes payable | |
$ | 544,843 | | |
$ | 529,084 | |
| Subordinated Notes Payable | |
Issue Date | |
Interest Rate | | |
Interest Due | |
Principal Due |
| 2022 Related Note | |
April 1, 2022 | |
| 12 | % | |
Quarterly | |
March 30, 2025 |
|
| Schedule of Future Minimum Principal Payments of Notes Payable |
Future
minimum principal payments of the 2022 Notes to related parties are as follows:
Schedule
of Future Minimum Principal Payments of Notes Payable
| As of June 30, | |
Amount | |
| 2025 | |
$ | 600,000 | |
| Total | |
$ | 600,000 | |
|
| X |
- DefinitionTabular disclosure of information pertaining to short-term and long-debt instruments or arrangements, including but not limited to identification of terms, features, collateral requirements and other information necessary to a fair presentation.
| Name: |
us-gaap_ScheduleOfDebtTableTextBlock |
| Namespace Prefix: |
us-gaap_ |
| Data Type: |
dtr-types:textBlockItemType |
| Balance Type: |
na |
| Period Type: |
duration |
|
| X |
- DefinitionTabular disclosure of maturity and sinking fund requirement for long-term debt. Reference 1: http://fasb.org/us-gaap/role/ref/legacyRef
-Name Accounting Standards Codification
-Section 50
-Paragraph 1
-SubTopic 10
-Topic 470
-Publisher FASB
-URI https://asc.fasb.org//1943274/2147481544/470-10-50-1
| Name: |
us-gaap_ScheduleOfMaturitiesOfLongTermDebtTableTextBlock |
| Namespace Prefix: |
us-gaap_ |
| Data Type: |
dtr-types:textBlockItemType |
| Balance Type: |
na |
| Period Type: |
duration |
|
v3.23.2
Commitments and Contingencies (Tables)
|
6 Months Ended |
Jun. 30, 2023 |
|---|
| Commitments and Contingencies Disclosure [Abstract] |
|
| Schedule of Operating Leases |
For
each of the below listed leases, management has determined it will utilize the base rental period and have not considered any renewal
periods.
Schedule
of Operating Leases
| Location | |
Square Feet | | |
Monthly Rent | | |
Lease Expiry |
| Columbus, OH | |
| 6,000 | | |
$ | 5,100 | | |
December 31, 2028 |
| Madison Heights, MI | |
| 36,000 | | |
$ | 43,185 | | |
August 31, 2026 |
| Sterling Heights, MI | |
| 37,000 | | |
$ | 21,072 | | |
April 30, 2028 |
| Traverse City, MI | |
| 5,200 | | |
$ | 4,500 | | |
January 31, 2024 |
| | |
| | | |
| | | |
|
| Temporary space | |
| | | |
| | | |
|
| Madison Heights, MI | |
| 3,200 | | |
$ | 1,605 | | |
month to month |
| | |
| | | |
| | | |
|
| Vehicles | |
| | | |
| | | |
|
| various | |
| n/a | | |
$ | 2,708 | | |
September 30, 2028 |
|
| Schedule of Future Rental Payments for Operating Leases |
The
following table sets forth the future minimum lease payments under our leases:
Schedule
of Future Rental Payments for Operating Leases
| For the twelve months ending June 30, | |
Finance Lease | | |
Operating Leases | |
| 2024 | |
$ | 41,259 | | |
$ | 930,559 | |
| 2025 | |
| 41,259 | | |
| 891,357 | |
| 2026 | |
| 41,259 | | |
| 901,152 | |
| 2027 | |
| 41,259 | | |
| 443,008 | |
| 2028 | |
| 39,243 | | |
| 311,010 | |
| Thereafter | |
| 8,299 | | |
| 35,100 | |
| Less Imputed Interest |
|
|
(38,395) |
|
|
|
(488,818) |
|
| Less Short-term lease payments |
|
|
|
|
|
|
(4,813) |
|
| | |
$ | 174,183 | | |
$ | 3,018,555 | |
|
| Summary of Components of Lease Expense |
The
following table summarizes the components of lease expense:
Summary
of Components of Lease Expense
| For the three months ending June 30, | |
2023 | | |
2022 | |
| Finance lease expense: | |
| | | |
| | |
| Amortization of ROU asset | |
$ | 8,252 | | |
$ | - | |
| Interest on lease liabilities | |
| 3,594 | | |
| - | |
| Operating lease expense | |
| 238,864 | | |
| 238,487 | |
| Short-term lease expense | |
| 4,814 | | |
| 4,814 | |
| For the six months ending June 30, | |
2023 | | |
2022 | |
| Finance lease expense: | |
| | | |
| | |
| Amortization of ROU asset | |
$ | 14,959 | | |
$ | - | |
| Interest on lease liabilities | |
| 6,426 | | |
| - | |
| Operating lease expense | |
| 476,312 | | |
| 476,975 | |
| Short-term lease expense | |
| 9,627 | | |
| 9,627 | |
|
| Schedule of Additional Information Pertaining to Leases |
The
following tables set forth additional information pertaining to our leases:
Schedule
of Additional Information Pertaining to Leases
| For the six months ending June 30, | |
2023 | | |
2022 | |
| Cash paid for amounts included in the measurement of lease liabilities: | |
| | | |
| | |
| Financing cash flows from finance leases (interest) | |
$ | 6,426 | | |
$ | - | |
| Financing cash flows from finance leases (principal) | |
| 12,312 | | |
| - | |
| Operating cash flows from operating leases | |
| 348,284 | | |
| 307,471 | |
| Weighted average remaining lease term – finance leases | |
| 5.2 years | | |
| - | |
| Weighted average remaining lease term – operating leases | |
| 4.0 years | | |
| 4.9 years | |
| Weighted average discount rate – finance leases | |
| 8.25 | % | |
| - | |
| Weighted average discount rate – operating leases | |
| 6.95 | % | |
| 7.01 | % |
|
| Schedule of Operating and Finance Leases |
Schedule
of Operating and Finance Leases
| | |
June 30, 2023 | | |
December 31, 2022 | |
| Operating leases: | |
| | | |
| | |
| Right-of-use assets, operating | |
$ | 2,895,784 | | |
$ | 3,200,191 | |
| Lease liabilities, operating – current | |
| 711,229 | | |
| 692,074 | |
| Lease liabilities, operating – net of current | |
| 2,307,326 | | |
| 2,624,608 | |
| Total operating lease liabilities | |
$ | 3,018,555 | | |
$ | 3,316,682 | |
| | |
| | | |
| | |
| Finance leases: | |
| | | |
| | |
| Right-of-use asset, finance | |
$ | 191,862 | | |
$ | 160,990 | |
| Accumulated amortization | |
| (21,668 | ) | |
| (6,708 | ) |
| Right-of-use asset, finance, net | |
$ | 170,194 | | |
$ | 154,282 | |
| | |
| | | |
| | |
| Lease liability, finance – current | |
$ | 28,303 | | |
$ | 22,493 | |
| Lease liability, finance – net of current | |
| 145,880 | | |
| 133,131 | |
| Total finance lease liability | |
$ | 174,183 | | |
$ | 155,624 | |
|
| X |
- DefinitionOperating leases and finance leases [Table text block].
| Name: |
INLX_OperatingLeasesAndFinanceLeasesTableTextBlock |
| Namespace Prefix: |
INLX_ |
| Data Type: |
dtr-types:textBlockItemType |
| Balance Type: |
na |
| Period Type: |
duration |
|
| X |
- DefinitionSchedule of Additional Information Pertaining to Leases [Table Text Block]
| Name: |
INLX_ScheduleOfAdditionalInformationPertainingToLeasesTableTextBlock |
| Namespace Prefix: |
INLX_ |
| Data Type: |
dtr-types:textBlockItemType |
| Balance Type: |
na |
| Period Type: |
duration |
|
| X |
- References
+ Details
| Name: |
us-gaap_CommitmentsAndContingenciesDisclosureAbstract |
| Namespace Prefix: |
us-gaap_ |
| Data Type: |
xbrli:stringItemType |
| Balance Type: |
na |
| Period Type: |
duration |
|
| X |
- DefinitionTabular disclosure of lessee's lease cost. Includes, but is not limited to, interest expense for finance lease, amortization of right-of-use asset for finance lease, operating lease cost, short-term lease cost, variable lease cost and sublease income. Reference 1: http://www.xbrl.org/2009/role/commonPracticeRef
-Topic 842
-SubTopic 20
-Name Accounting Standards Codification
-Section 50
-Paragraph 4
-Publisher FASB
-URI https://asc.fasb.org//1943274/2147478964/842-20-50-4
| Name: |
us-gaap_LeaseCostTableTextBlock |
| Namespace Prefix: |
us-gaap_ |
| Data Type: |
dtr-types:textBlockItemType |
| Balance Type: |
na |
| Period Type: |
duration |
|
| X |
- DefinitionTabular disclosure of undiscounted cash flows of lessee's operating lease liability. Includes, but is not limited to, reconciliation of undiscounted cash flows to operating lease liability recognized in statement of financial position. Reference 1: http://www.xbrl.org/2009/role/commonPracticeRef
-Topic 842
-SubTopic 20
-Name Accounting Standards Codification
-Section 50
-Paragraph 6
-Publisher FASB
-URI https://asc.fasb.org//1943274/2147478964/842-20-50-6
| Name: |
us-gaap_LesseeOperatingLeaseLiabilityMaturityTableTextBlock |
| Namespace Prefix: |
us-gaap_ |
| Data Type: |
dtr-types:textBlockItemType |
| Balance Type: |
na |
| Period Type: |
duration |
|
| X |
- DefinitionThe entire disclosure for operating leases of lessee. Includes, but is not limited to, description of operating lease and maturity analysis of operating lease liability. Reference 1: http://www.xbrl.org/2003/role/disclosureRef
-Topic 842
-SubTopic 20
-Name Accounting Standards Codification
-Publisher FASB
-URI https://asc.fasb.org//842-20/tableOfContent
| Name: |
us-gaap_LesseeOperatingLeasesTextBlock |
| Namespace Prefix: |
us-gaap_ |
| Data Type: |
dtr-types:textBlockItemType |
| Balance Type: |
na |
| Period Type: |
duration |
|
v3.23.2
Stockholders’ Equity (Tables)
|
6 Months Ended |
Jun. 30, 2023 |
|---|
| Equity [Abstract] |
|
| Schedule of Shares and Warrants Issued |
The
following table describes the shares and warrants issued as part of our 2022 and 2020 private placements:
Schedule
of Shares and Warrants Issued
| Issuance of Common Stock | |
Issue Date | |
Shares Issued | | |
Price per share | | |
Warrants Issued | | |
Warrant Exercise Price | | |
Warrant Fair Value | |
| Private Placement 2022 | |
April 1, 2022 | |
| 1,242,588 | | |
$ | 4.62 | | |
| 124,258 | | |
$ | 4.62 | | |
$ | 3.91 | |
| Private Placement 2020 | |
March 2, 2020 | |
| 955,000 | | |
$ | 4.00 | | |
| 95,500 | | |
$ | 4.00 | | |
$ | 3.90 | |
|
| Schedule of Warrants to Purchase Common Stock |
The
following sets forth the warrants to purchase our common stock that were outstanding as of June 30, 2023:
Schedule
of Warrants to Purchase Common Stock
| Warrants Outstanding | | |
Warrant Exercise Price | | |
Warranty Expiry |
| | 124,258 | | |
$ | 4.62 | | |
March 30, 2027 |
| | 95,500 | | |
$ | 4.00 | | |
March 30, 2027 |
| | 16,000 | | |
$ | 9.00 | | |
March 30, 2027 |
| | 17,200 | | |
$ | 12.50 | | |
March 30, 2027 |
| | 3,000 | | |
$ | 15.00 | | |
March 30, 2027 |
|
| Schedule of Estimated Values of Warrants Valuation Assumptions |
Schedule
of Estimated Values of Warrants Valuation Assumptions
| | |
Warrants Issued | |
| | |
April 1, 2022 | |
| Risk-free interest rate | |
| 2.55 | % |
| Weighted average expected term | |
| 5 years | |
| Expected volatility | |
| 116.32 | % |
| Expected dividend yield | |
| 0.00 | % |
|
| X |
- DefinitionSchedule of estimated values of warrants valuation assumptions [Table Text Block]
| Name: |
INLX_ScheduleOfEstimatedValuesOfWarrantsValuationAssumptionsTableTextBlock |
| Namespace Prefix: |
INLX_ |
| Data Type: |
dtr-types:textBlockItemType |
| Balance Type: |
na |
| Period Type: |
duration |
|
| X |
- References
+ Details
| Name: |
INLX_ScheduleOfWarrantsOutstandingToPurchaseCommonStockTableTextBlock |
| Namespace Prefix: |
INLX_ |
| Data Type: |
dtr-types:textBlockItemType |
| Balance Type: |
na |
| Period Type: |
duration |
|
| X |
- References
+ Details
| Name: |
us-gaap_EquityAbstract |
| Namespace Prefix: |
us-gaap_ |
| Data Type: |
xbrli:stringItemType |
| Balance Type: |
na |
| Period Type: |
duration |
|
| X |
- DefinitionTabular disclosure of warrants or rights issued. Warrants and rights outstanding are derivative securities that give the holder the right to purchase securities (usually equity) from the issuer at a specific price within a certain time frame. Warrants are often included in a new debt issue to entice investors by a higher return potential. The main difference between warrants and call options is that warrants are issued and guaranteed by the company, whereas options are exchange instruments and are not issued by the company. Also, the lifetime of a warrant is often measured in years, while the lifetime of a typical option is measured in months. Disclose the title of issue of securities called for by warrants and rights outstanding, the aggregate amount of securities called for by warrants and rights outstanding, the date from which the warrants or rights are exercisable, and the price at which the warrant or right is exercisable. Reference 1: http://fasb.org/us-gaap/role/ref/legacyRef
-Name Accounting Standards Codification
-Topic 718
-SubTopic 10
-Section 50
-Paragraph 1
-Subparagraph (a)
-Publisher FASB
-URI https://asc.fasb.org//1943274/2147480429/718-10-50-1
| Name: |
us-gaap_ScheduleOfStockholdersEquityNoteWarrantsOrRightsTextBlock |
| Namespace Prefix: |
us-gaap_ |
| Data Type: |
dtr-types:textBlockItemType |
| Balance Type: |
na |
| Period Type: |
duration |
|
v3.23.2
Stock-Based Compensation (Tables)
|
6 Months Ended |
Jun. 30, 2023 |
|---|
| Share-Based Payment Arrangement [Abstract] |
|
| Schedule of Estimated Values of Stock Option Grants Valuation Assumptions |
Schedule
of Estimated Values of Stock Option Grants Valuation Assumptions
| | |
Grant Date | |
| | |
April 1, 2022 | |
| Risk-free interest rate | |
| 2.82 | % |
| Weighted average expected term | |
| 6 years | |
| Expected volatility | |
| 116.60 | % |
| Expected dividend yield | |
| 0.00 | % |
|
| Schedule of Stock Option Activity |
A
summary of stock option activity during the six months ended June 30, 2023 and 2022 is as follows:
Schedule of Stock Option Activity
| | |
| | |
| | |
Weighted- | | |
| |
| | |
| | |
Weighted- | | |
Average | | |
| |
| | |
Shares | | |
Average | | |
Remaining | | |
Aggregate | |
| | |
Under | | |
Exercise | | |
Contractual | | |
Intrinsic | |
| | |
Option | | |
Price | | |
Life | | |
Value | |
| Outstanding at January 1, 2023 | |
| 365,447 | | |
$ | 5.89 | | |
| 8 years | | |
$ | 19,200 | |
| Granted | |
| 220,587 | | |
| 6.08 | | |
| | | |
| | |
| Forfeited | |
| (5,000 | ) | |
| 4.00 | | |
| | | |
| | |
| Outstanding at June 30, 2023 | |
| 360,447 | | |
$ | 5.92 | | |
| 8 years | | |
$ | 19,200 | |
| | |
| | | |
| | | |
| | | |
| | |
| Exercisable at June, 2023 | |
| 165,654 | | |
$ | 6.32 | | |
| 7 years | | |
$ | 19,200 | |
| | |
| | |
| | |
Weighted- | | |
| |
| | |
| | |
Weighted- | | |
Average | | |
| |
| | |
Shares | | |
Average | | |
Remaining | | |
Aggregate | |
| | |
Under | | |
Exercise | | |
Contractual | | |
Intrinsic | |
| | |
Option | | |
Price | | |
Life | | |
Value | |
| Outstanding at January 1, 2022 | |
| 144,860 | | |
$ | 5.61 | | |
| 8 years | | |
$ | 19,200 | |
| Granted | |
| 220,587 | | |
| 6.08 | | |
| | | |
| | |
| Outstanding at June 30, 2022 | |
| 365,447 | | |
$ | 5.89 | | |
| 9 years | | |
$ | 19,200 | |
| | |
| | | |
| | | |
| | | |
| | |
| Exercisable at June 30, 2022 | |
| 68,335 | | |
$ | 7.32 | | |
| 7 years | | |
$ | 19,200 | |
|
| X |
- DefinitionTabular disclosure for stock option plans. Includes, but is not limited to, outstanding awards at beginning and end of year, grants, exercises, forfeitures, and weighted-average grant date fair value. Reference 1: http://fasb.org/us-gaap/role/ref/legacyRef
-Name Accounting Standards Codification
-Topic 718
-SubTopic 10
-Section 50
-Paragraph 2
-Subparagraph (c)(1)
-Publisher FASB
-URI https://asc.fasb.org//1943274/2147480429/718-10-50-2
Reference 2: http://fasb.org/us-gaap/role/ref/legacyRef
-Name Accounting Standards Codification
-Section 50
-Paragraph 2
-Subparagraph (d)
-SubTopic 10
-Topic 718
-Publisher FASB
-URI https://asc.fasb.org//1943274/2147480429/718-10-50-2
Reference 3: http://fasb.org/us-gaap/role/ref/legacyRef
-Name Accounting Standards Codification
-Section 50
-Paragraph 2
-Subparagraph (e)
-SubTopic 10
-Topic 718
-Publisher FASB
-URI https://asc.fasb.org//1943274/2147480429/718-10-50-2
| Name: |
us-gaap_ScheduleOfShareBasedCompensationStockOptionsActivityTableTextBlock |
| Namespace Prefix: |
us-gaap_ |
| Data Type: |
dtr-types:textBlockItemType |
| Balance Type: |
na |
| Period Type: |
duration |
|
| X |
- DefinitionTabular disclosure of the significant assumptions used during the year to estimate the fair value of stock options, including, but not limited to: (a) expected term of share options and similar instruments, (b) expected volatility of the entity's shares, (c) expected dividends, (d) risk-free rate(s), and (e) discount for post-vesting restrictions. Reference 1: http://fasb.org/us-gaap/role/ref/legacyRef
-Topic 718
-SubTopic 10
-Subparagraph (f)(2)
-Name Accounting Standards Codification
-Paragraph 2
-Section 50
-Publisher FASB
-URI https://asc.fasb.org//1943274/2147480429/718-10-50-2
| Name: |
us-gaap_ScheduleOfShareBasedPaymentAwardStockOptionsValuationAssumptionsTableTextBlock |
| Namespace Prefix: |
us-gaap_ |
| Data Type: |
dtr-types:textBlockItemType |
| Balance Type: |
na |
| Period Type: |
duration |
|
v3.23.2
Schedule of Changes in Contract Assets (Details) - USD ($)
|
6 Months Ended |
Jun. 30, 2023 |
Jun. 30, 2022 |
| Offsetting Assets [Line Items] |
|
|
| Balance at Beginning of Period |
$ 80,378
|
|
| Balance at End of Period |
96,470
|
|
| Accounts Receivable [Member] |
|
|
| Offsetting Assets [Line Items] |
|
|
| Balance at Beginning of Period |
1,121,083
|
$ 1,176,059
|
| Accounts receivables, addition from acquisition |
|
68,380
|
| Accounts receivables, billings |
7,342,400
|
5,604,581
|
| Accounts receivables, payment recevied |
(7,136,497)
|
(5,977,525)
|
| Balance at End of Period |
1,326,986
|
871,495
|
| Accounts Receivable Unbilled [Member] |
|
|
| Offsetting Assets [Line Items] |
|
|
| Balance at Beginning of Period |
596,410
|
444,782
|
| Accounts receivables, billings |
(2,262,329)
|
(1,511,429)
|
| Balance at End of Period |
1,038,013
|
435,079
|
| Revenue Recognized in Advance of Billings |
2,703,932
|
1,501,726
|
| Contract Assests [Member] |
|
|
| Offsetting Assets [Line Items] |
|
|
| Balance at Beginning of Period |
80,378
|
78,556
|
| Balance at End of Period |
96,470
|
101,158
|
| Commissions Paid |
80,077
|
52,310
|
| Commissions Recognized |
$ (63,985)
|
$ (29,708)
|
| X |
- DefinitionContract with customer asset Commission paid.
| Name: |
INLX_ContractWithCustomerAssetCommissionPaid |
| Namespace Prefix: |
INLX_ |
| Data Type: |
xbrli:monetaryItemType |
| Balance Type: |
credit |
| Period Type: |
duration |
|
| X |
- DefinitionContract with customer asset Commission recognized.
| Name: |
INLX_ContractWithCustomerAssetCommissionRecognized |
| Namespace Prefix: |
INLX_ |
| Data Type: |
xbrli:monetaryItemType |
| Balance Type: |
credit |
| Period Type: |
duration |
|
| X |
- DefinitionContract with customer asset cumulative catch up adjustment to addition from aquisition.
| Name: |
INLX_ContractWithCustomerAssetCumulativeCatchUpAdjustmentToAdditionFromAquisition |
| Namespace Prefix: |
INLX_ |
| Data Type: |
xbrli:monetaryItemType |
| Balance Type: |
credit |
| Period Type: |
duration |
|
| X |
- DefinitionContract with customer asset payments recevied.
| Name: |
INLX_ContractWithCustomerAssetPaymentsRecevied |
| Namespace Prefix: |
INLX_ |
| Data Type: |
xbrli:monetaryItemType |
| Balance Type: |
credit |
| Period Type: |
duration |
|
| X |
- DefinitionContract with customer asset receivables billings.
| Name: |
INLX_ContractWithCustomerAssetReceivablesBillings |
| Namespace Prefix: |
INLX_ |
| Data Type: |
xbrli:monetaryItemType |
| Balance Type: |
credit |
| Period Type: |
duration |
|
| X |
- DefinitionAmount of increase (decrease) in revenue recognized for cumulative catch-up adjustment from contract modification which increases (decreases) right to consideration in exchange for good or service transferred to customer when right is conditioned on something other than passage of time. Reference 1: http://www.xbrl.org/2003/role/exampleRef
-Topic 606
-SubTopic 10
-Name Accounting Standards Codification
-Section 50
-Paragraph 10
-Subparagraph (b)
-Publisher FASB
-URI https://asc.fasb.org//1943274/2147479806/606-10-50-10
| Name: |
us-gaap_ContractWithCustomerAssetCumulativeCatchUpAdjustmentToRevenueModificationOfContract |
| Namespace Prefix: |
us-gaap_ |
| Data Type: |
xbrli:monetaryItemType |
| Balance Type: |
credit |
| Period Type: |
duration |
|
| X |
- DefinitionAmount, after allowance for credit loss, of right to consideration in exchange for good or service transferred to customer when right is conditioned on something other than passage of time, classified as current. Reference 1: http://www.xbrl.org/2003/role/disclosureRef
-Topic 606
-SubTopic 10
-Name Accounting Standards Codification
-Section 45
-Paragraph 3
-Publisher FASB
-URI https://asc.fasb.org//1943274/2147479837/606-10-45-3
Reference 2: http://www.xbrl.org/2003/role/disclosureRef
-Topic 606
-SubTopic 10
-Name Accounting Standards Codification
-Section 45
-Paragraph 1
-Publisher FASB
-URI https://asc.fasb.org//1943274/2147479837/606-10-45-1
Reference 3: http://www.xbrl.org/2003/role/disclosureRef
-Topic 606
-SubTopic 10
-Name Accounting Standards Codification
-Section 50
-Paragraph 8
-Subparagraph (a)
-Publisher FASB
-URI https://asc.fasb.org//1943274/2147479806/606-10-50-8
| Name: |
us-gaap_ContractWithCustomerAssetNetCurrent |
| Namespace Prefix: |
us-gaap_ |
| Data Type: |
xbrli:monetaryItemType |
| Balance Type: |
debit |
| Period Type: |
instant |
|
| X |
- DefinitionLine items represent financial concepts included in a table. These concepts are used to disclose reportable information associated with domain members defined in one or many axes to the table.
| Name: |
us-gaap_OffsettingAssetsLineItems |
| Namespace Prefix: |
us-gaap_ |
| Data Type: |
xbrli:stringItemType |
| Balance Type: |
na |
| Period Type: |
duration |
|
| X |
- Details
| Name: |
us-gaap_DerivativeInstrumentRiskAxis=us-gaap_AccountsReceivableMember |
| Namespace Prefix: |
|
| Data Type: |
na |
| Balance Type: |
|
| Period Type: |
|
|
| X |
- Details
| Name: |
us-gaap_DerivativeInstrumentRiskAxis=INLX_AccountsReceivableUnbilledMember |
| Namespace Prefix: |
|
| Data Type: |
na |
| Balance Type: |
|
| Period Type: |
|
|
| X |
- Details
| Name: |
us-gaap_DerivativeInstrumentRiskAxis=INLX_ContractAssestsMember |
| Namespace Prefix: |
|
| Data Type: |
na |
| Balance Type: |
|
| Period Type: |
|
|
v3.23.2
Schedule of Segment Information (Details) - USD ($)
|
3 Months Ended |
6 Months Ended |
|
Jun. 30, 2023 |
Jun. 30, 2022 |
Jun. 30, 2023 |
Jun. 30, 2022 |
Dec. 31, 2022 |
| Total revenues |
$ 4,258,430
|
$ 3,415,643
|
$ 8,445,263
|
$ 6,119,155
|
|
| Total gross profit |
2,590,433
|
2,189,018
|
5,236,272
|
3,820,855
|
|
| Total capital additions, net |
156,532
|
183,961
|
291,101
|
269,401
|
|
| Total goodwill |
5,789,821
|
|
5,789,821
|
|
$ 5,789,821
|
| Total assets |
18,587,086
|
|
18,587,086
|
|
19,943,142
|
| Document Management [Member] |
|
|
|
|
|
| Total revenues |
1,879,369
|
1,572,854
|
3,705,103
|
2,487,804
|
|
| Total gross profit |
1,536,385
|
1,326,345
|
3,053,746
|
2,012,823
|
|
| Total capital additions, net |
96,209
|
144,717
|
212,250
|
175,801
|
|
| Total goodwill |
3,989,645
|
|
3,989,645
|
|
3,989,645
|
| Total assets |
9,706,315
|
|
9,706,315
|
|
10,284,183
|
| Document Conversion [Member] |
|
|
|
|
|
| Total revenues |
2,379,061
|
1,842,789
|
4,740,160
|
3,631,351
|
|
| Total gross profit |
1,054,048
|
862,673
|
2,182,526
|
1,808,032
|
|
| Total capital additions, net |
60,323
|
$ 39,244
|
78,851
|
$ 93,600
|
|
| Total goodwill |
1,800,176
|
|
1,800,176
|
|
1,800,176
|
| Total assets |
$ 8,880,771
|
|
$ 8,880,771
|
|
$ 9,658,959
|
| X |
- DefinitionSum of the carrying amounts as of the balance sheet date of all assets that are recognized. Assets are probable future economic benefits obtained or controlled by an entity as a result of past transactions or events. Reference 1: http://www.xbrl.org/2003/role/disclosureRef
-Topic 810
-SubTopic 10
-Name Accounting Standards Codification
-Section 50
-Paragraph 3
-Subparagraph (bb)
-Publisher FASB
-URI https://asc.fasb.org//1943274/2147481203/810-10-50-3
Reference 2: http://www.xbrl.org/2003/role/disclosureRef
-Topic 810
-SubTopic 10
-Name Accounting Standards Codification
-Section 45
-Paragraph 25
-Subparagraph (a)
-Publisher FASB
-URI https://asc.fasb.org//1943274/2147481231/810-10-45-25
Reference 3: http://www.xbrl.org/2003/role/disclosureRef
-Topic 235
-SubTopic 10
-Name Accounting Standards Codification
-Section S99
-Paragraph 1
-Subparagraph (SX 210.4-08(g)(1)(ii))
-Publisher FASB
-URI https://asc.fasb.org//1943274/2147480678/235-10-S99-1
Reference 4: http://www.xbrl.org/2003/role/disclosureRef
-Topic 323
-SubTopic 10
-Name Accounting Standards Codification
-Section 50
-Paragraph 3
-Subparagraph (c)
-Publisher FASB
-URI https://asc.fasb.org//1943274/2147481687/323-10-50-3
Reference 5: http://www.xbrl.org/2003/role/disclosureRef
-Topic 825
-SubTopic 10
-Name Accounting Standards Codification
-Section 50
-Paragraph 28
-Subparagraph (f)
-Publisher FASB
-URI https://asc.fasb.org//1943274/2147482907/825-10-50-28
Reference 6: http://www.xbrl.org/2003/role/exampleRef
-Topic 852
-SubTopic 10
-Name Accounting Standards Codification
-Section 55
-Paragraph 10
-Publisher FASB
-URI https://asc.fasb.org//1943274/2147481372/852-10-55-10
Reference 7: http://www.xbrl.org/2003/role/exampleRef
-Topic 946
-SubTopic 830
-Name Accounting Standards Codification
-Section 55
-Paragraph 12
-Publisher FASB
-URI https://asc.fasb.org//1943274/2147480167/946-830-55-12
Reference 8: http://www.xbrl.org/2003/role/disclosureRef
-Topic 944
-SubTopic 210
-Name Accounting Standards Codification
-Section S99
-Paragraph 1
-Subparagraph (SX 210.7-03(a)(12))
-Publisher FASB
-URI https://asc.fasb.org//1943274/2147479440/944-210-S99-1
Reference 9: http://www.xbrl.org/2003/role/disclosureRef
-Topic 280
-SubTopic 10
-Name Accounting Standards Codification
-Section 50
-Paragraph 22
-Publisher FASB
-URI https://asc.fasb.org//1943274/2147482810/280-10-50-22
Reference 10: http://www.xbrl.org/2003/role/disclosureRef
-Topic 946
-SubTopic 210
-Name Accounting Standards Codification
-Section S99
-Paragraph 1
-Subparagraph (SX 210.6-04(8))
-Publisher FASB
-URI https://asc.fasb.org//1943274/2147479617/946-210-S99-1
Reference 11: http://www.xbrl.org/2003/role/disclosureRef
-Topic 210
-SubTopic 10
-Name Accounting Standards Codification
-Section S99
-Paragraph 1
-Subparagraph (SX 210.5-02(18))
-Publisher FASB
-URI https://asc.fasb.org//1943274/2147480566/210-10-S99-1
Reference 12: http://www.xbrl.org/2003/role/disclosureRef
-Topic 470
-SubTopic 10
-Name Accounting Standards Codification
-Section S99
-Paragraph 1A
-Subparagraph (SX 210.13-01(a)(4)(i))
-Publisher FASB
-URI https://asc.fasb.org//1943274/2147480097/470-10-S99-1A
Reference 13: http://www.xbrl.org/2009/role/commonPracticeRef
-Topic 470
-SubTopic 10
-Name Accounting Standards Codification
-Section S99
-Paragraph 1A
-Subparagraph (SX 210.13-01(a)(4)(ii))
-Publisher FASB
-URI https://asc.fasb.org//1943274/2147480097/470-10-S99-1A
Reference 14: http://www.xbrl.org/2009/role/commonPracticeRef
-Topic 470
-SubTopic 10
-Name Accounting Standards Codification
-Section S99
-Paragraph 1A
-Subparagraph (SX 210.13-01(a)(4)(iii))
-Publisher FASB
-URI https://asc.fasb.org//1943274/2147480097/470-10-S99-1A
Reference 15: http://www.xbrl.org/2003/role/disclosureRef
-Topic 470
-SubTopic 10
-Name Accounting Standards Codification
-Section S99
-Paragraph 1A
-Subparagraph (SX 210.13-01(a)(4)(iii)(A))
-Publisher FASB
-URI https://asc.fasb.org//1943274/2147480097/470-10-S99-1A
Reference 16: http://www.xbrl.org/2003/role/disclosureRef
-Topic 470
-SubTopic 10
-Name Accounting Standards Codification
-Section S99
-Paragraph 1A
-Subparagraph (SX 210.13-01(a)(4)(iv))
-Publisher FASB
-URI https://asc.fasb.org//1943274/2147480097/470-10-S99-1A
Reference 17: http://www.xbrl.org/2003/role/disclosureRef
-Topic 470
-SubTopic 10
-Name Accounting Standards Codification
-Section S99
-Paragraph 1A
-Subparagraph (SX 210.13-01(a)(5))
-Publisher FASB
-URI https://asc.fasb.org//1943274/2147480097/470-10-S99-1A
Reference 18: http://www.xbrl.org/2003/role/disclosureRef
-Topic 470
-SubTopic 10
-Name Accounting Standards Codification
-Section S99
-Paragraph 1B
-Subparagraph (SX 210.13-02(a)(4)(i))
-Publisher FASB
-URI https://asc.fasb.org//1943274/2147480097/470-10-S99-1B
Reference 19: http://www.xbrl.org/2003/role/disclosureRef
-Topic 470
-SubTopic 10
-Name Accounting Standards Codification
-Section S99
-Paragraph 1B
-Subparagraph (SX 210.13-02(a)(4)(iii)(A))
-Publisher FASB
-URI https://asc.fasb.org//1943274/2147480097/470-10-S99-1B
Reference 20: http://www.xbrl.org/2003/role/disclosureRef
-Topic 470
-SubTopic 10
-Name Accounting Standards Codification
-Section S99
-Paragraph 1B
-Subparagraph (SX 210.13-02(a)(4)(iii)(B))
-Publisher FASB
-URI https://asc.fasb.org//1943274/2147480097/470-10-S99-1B
Reference 21: http://www.xbrl.org/2003/role/disclosureRef
-Topic 470
-SubTopic 10
-Name Accounting Standards Codification
-Section S99
-Paragraph 1B
-Subparagraph (SX 210.13-02(a)(4)(iv))
-Publisher FASB
-URI https://asc.fasb.org//1943274/2147480097/470-10-S99-1B
Reference 22: http://www.xbrl.org/2003/role/disclosureRef
-Topic 470
-SubTopic 10
-Name Accounting Standards Codification
-Section S99
-Paragraph 1B
-Subparagraph (SX 210.13-02(a)(5))
-Publisher FASB
-URI https://asc.fasb.org//1943274/2147480097/470-10-S99-1B
Reference 23: http://www.xbrl.org/2009/role/commonPracticeRef
-Topic 852
-SubTopic 10
-Name Accounting Standards Codification
-Section 50
-Paragraph 7
-Subparagraph (a)
-Publisher FASB
-URI https://asc.fasb.org//1943274/2147481404/852-10-50-7
Reference 24: http://www.xbrl.org/2003/role/disclosureRef
-Topic 280
-SubTopic 10
-Name Accounting Standards Codification
-Section 50
-Paragraph 30
-Subparagraph (c)
-Publisher FASB
-URI https://asc.fasb.org//1943274/2147482810/280-10-50-30
Reference 25: http://www.xbrl.org/2003/role/disclosureRef
-Topic 280
-SubTopic 10
-Name Accounting Standards Codification
-Section 50
-Paragraph 32
-Subparagraph (d)
-Publisher FASB
-URI https://asc.fasb.org//1943274/2147482810/280-10-50-32
Reference 26: http://fasb.org/us-gaap/role/ref/legacyRef
-Topic 942
-SubTopic 210
-Name Accounting Standards Codification
-Section S99
-Paragraph 1
-Subparagraph (SX 210.9-03(11))
-Publisher FASB
-URI https://asc.fasb.org//1943274/2147479853/942-210-S99-1
| Name: |
us-gaap_Assets |
| Namespace Prefix: |
us-gaap_ |
| Data Type: |
xbrli:monetaryItemType |
| Balance Type: |
debit |
| Period Type: |
instant |
|
| X |
- DefinitionAmount after accumulated impairment loss of an asset representing future economic benefits arising from other assets acquired in a business combination that are not individually identified and separately recognized. Reference 1: http://www.xbrl.org/2003/role/exampleRef
-Topic 852
-SubTopic 10
-Name Accounting Standards Codification
-Section 55
-Paragraph 10
-Publisher FASB
-URI https://asc.fasb.org//1943274/2147481372/852-10-55-10
Reference 2: http://www.xbrl.org/2003/role/exampleRef
-Topic 350
-SubTopic 20
-Name Accounting Standards Codification
-Section 55
-Paragraph 24
-Publisher FASB
-URI https://asc.fasb.org//1943274/2147482548/350-20-55-24
Reference 3: http://www.xbrl.org/2003/role/disclosureRef
-Topic 210
-SubTopic 10
-Name Accounting Standards Codification
-Section S99
-Paragraph 1
-Subparagraph (SX 210.5-02(15))
-Publisher FASB
-URI https://asc.fasb.org//1943274/2147480566/210-10-S99-1
Reference 4: http://www.xbrl.org/2003/role/disclosureRef
-Topic 350
-SubTopic 20
-Name Accounting Standards Codification
-Section 45
-Paragraph 1
-Publisher FASB
-URI https://asc.fasb.org//1943274/2147482598/350-20-45-1
Reference 5: http://www.xbrl.org/2009/role/commonPracticeRef
-Topic 350
-SubTopic 20
-Name Accounting Standards Codification
-Section 50
-Paragraph 1
-Subparagraph (a)
-Publisher FASB
-URI https://asc.fasb.org//1943274/2147482573/350-20-50-1
Reference 6: http://www.xbrl.org/2009/role/commonPracticeRef
-Topic 350
-SubTopic 20
-Name Accounting Standards Codification
-Section 50
-Paragraph 1
-Subparagraph (h)
-Publisher FASB
-URI https://asc.fasb.org//1943274/2147482573/350-20-50-1
Reference 7: http://www.xbrl.org/2003/role/disclosureRef
-Topic 942
-SubTopic 210
-Name Accounting Standards Codification
-Section S99
-Paragraph 1
-Subparagraph (SX 210.9-03(10)(1))
-Publisher FASB
-URI https://asc.fasb.org//1943274/2147479853/942-210-S99-1
| Name: |
us-gaap_Goodwill |
| Namespace Prefix: |
us-gaap_ |
| Data Type: |
xbrli:monetaryItemType |
| Balance Type: |
debit |
| Period Type: |
instant |
|
| X |
- DefinitionAggregate revenue less cost of goods and services sold or operating expenses directly attributable to the revenue generation activity. Reference 1: http://www.xbrl.org/2003/role/disclosureRef
-Topic 235
-SubTopic 10
-Name Accounting Standards Codification
-Section S99
-Paragraph 1
-Subparagraph (SX 210.4-08(g)(1)(ii))
-Publisher FASB
-URI https://asc.fasb.org//1943274/2147480678/235-10-S99-1
Reference 2: http://www.xbrl.org/2003/role/disclosureRef
-Topic 323
-SubTopic 10
-Name Accounting Standards Codification
-Section 50
-Paragraph 3
-Subparagraph (c)
-Publisher FASB
-URI https://asc.fasb.org//1943274/2147481687/323-10-50-3
Reference 3: http://www.xbrl.org/2003/role/disclosureRef
-Topic 825
-SubTopic 10
-Name Accounting Standards Codification
-Section 50
-Paragraph 28
-Subparagraph (f)
-Publisher FASB
-URI https://asc.fasb.org//1943274/2147482907/825-10-50-28
Reference 4: http://www.xbrl.org/2003/role/disclosureRef
-Topic 280
-SubTopic 10
-Name Accounting Standards Codification
-Section 50
-Paragraph 22
-Publisher FASB
-URI https://asc.fasb.org//1943274/2147482810/280-10-50-22
Reference 5: http://www.xbrl.org/2003/role/disclosureRef
-Topic 470
-SubTopic 10
-Name Accounting Standards Codification
-Section S99
-Paragraph 1A
-Subparagraph (SX 210.13-01(a)(4)(i))
-Publisher FASB
-URI https://asc.fasb.org//1943274/2147480097/470-10-S99-1A
Reference 6: http://www.xbrl.org/2009/role/commonPracticeRef
-Topic 470
-SubTopic 10
-Name Accounting Standards Codification
-Section S99
-Paragraph 1A
-Subparagraph (SX 210.13-01(a)(4)(ii))
-Publisher FASB
-URI https://asc.fasb.org//1943274/2147480097/470-10-S99-1A
Reference 7: http://www.xbrl.org/2003/role/disclosureRef
-Topic 470
-SubTopic 10
-Name Accounting Standards Codification
-Section S99
-Paragraph 1A
-Subparagraph (SX 210.13-01(a)(4)(iii)(A))
-Publisher FASB
-URI https://asc.fasb.org//1943274/2147480097/470-10-S99-1A
Reference 8: http://www.xbrl.org/2003/role/disclosureRef
-Topic 470
-SubTopic 10
-Name Accounting Standards Codification
-Section S99
-Paragraph 1A
-Subparagraph (SX 210.13-01(a)(4)(iv))
-Publisher FASB
-URI https://asc.fasb.org//1943274/2147480097/470-10-S99-1A
Reference 9: http://www.xbrl.org/2003/role/disclosureRef
-Topic 470
-SubTopic 10
-Name Accounting Standards Codification
-Section S99
-Paragraph 1A
-Subparagraph (SX 210.13-01(a)(5))
-Publisher FASB
-URI https://asc.fasb.org//1943274/2147480097/470-10-S99-1A
Reference 10: http://www.xbrl.org/2003/role/disclosureRef
-Topic 470
-SubTopic 10
-Name Accounting Standards Codification
-Section S99
-Paragraph 1B
-Subparagraph (SX 210.13-02(a)(4)(i))
-Publisher FASB
-URI https://asc.fasb.org//1943274/2147480097/470-10-S99-1B
Reference 11: http://www.xbrl.org/2003/role/disclosureRef
-Topic 470
-SubTopic 10
-Name Accounting Standards Codification
-Section S99
-Paragraph 1B
-Subparagraph (SX 210.13-02(a)(4)(iii)(A))
-Publisher FASB
-URI https://asc.fasb.org//1943274/2147480097/470-10-S99-1B
Reference 12: http://www.xbrl.org/2003/role/disclosureRef
-Topic 470
-SubTopic 10
-Name Accounting Standards Codification
-Section S99
-Paragraph 1B
-Subparagraph (SX 210.13-02(a)(4)(iii)(B))
-Publisher FASB
-URI https://asc.fasb.org//1943274/2147480097/470-10-S99-1B
Reference 13: http://www.xbrl.org/2003/role/disclosureRef
-Topic 470
-SubTopic 10
-Name Accounting Standards Codification
-Section S99
-Paragraph 1B
-Subparagraph (SX 210.13-02(a)(4)(iv))
-Publisher FASB
-URI https://asc.fasb.org//1943274/2147480097/470-10-S99-1B
Reference 14: http://www.xbrl.org/2003/role/disclosureRef
-Topic 470
-SubTopic 10
-Name Accounting Standards Codification
-Section S99
-Paragraph 1B
-Subparagraph (SX 210.13-02(a)(5))
-Publisher FASB
-URI https://asc.fasb.org//1943274/2147480097/470-10-S99-1B
Reference 15: http://www.xbrl.org/2003/role/disclosureRef
-Topic 280
-SubTopic 10
-Name Accounting Standards Codification
-Section 50
-Paragraph 30
-Subparagraph (b)
-Publisher FASB
-URI https://asc.fasb.org//1943274/2147482810/280-10-50-30
Reference 16: http://www.xbrl.org/2003/role/disclosureRef
-Topic 280
-SubTopic 10
-Name Accounting Standards Codification
-Section 50
-Paragraph 32
-Subparagraph (f)
-Publisher FASB
-URI https://asc.fasb.org//1943274/2147482810/280-10-50-32
Reference 17: http://www.xbrl.org/2003/role/exampleRef
-Topic 280
-SubTopic 10
-Name Accounting Standards Codification
-Section 50
-Paragraph 31
-Publisher FASB
-URI https://asc.fasb.org//1943274/2147482810/280-10-50-31
Reference 18: http://www.xbrl.org/2003/role/disclosureRef
-Topic 280
-SubTopic 10
-Name Accounting Standards Codification
-Section 50
-Paragraph 32
-Subparagraph (c)
-Publisher FASB
-URI https://asc.fasb.org//1943274/2147482810/280-10-50-32
Reference 19: http://fasb.org/us-gaap/role/ref/legacyRef
-Topic 220
-SubTopic 10
-Name Accounting Standards Codification
-Section S99
-Paragraph 2
-Subparagraph (SX 210.5-03.1,2)
-Publisher FASB
-URI https://asc.fasb.org//1943274/2147483621/220-10-S99-2
| Name: |
us-gaap_GrossProfit |
| Namespace Prefix: |
us-gaap_ |
| Data Type: |
xbrli:monetaryItemType |
| Balance Type: |
credit |
| Period Type: |
duration |
|
| X |
- DefinitionAmount, excluding tax collected from customer, of revenue from satisfaction of performance obligation by transferring promised good or service to customer. Tax collected from customer is tax assessed by governmental authority that is both imposed on and concurrent with specific revenue-producing transaction, including, but not limited to, sales, use, value added and excise. Reference 1: http://www.xbrl.org/2003/role/disclosureRef
-Topic 924
-SubTopic 10
-Name Accounting Standards Codification
-Section S99
-Paragraph 1
-Subparagraph (SAB Topic 11.L)
-Publisher FASB
-URI https://asc.fasb.org//1943274/2147479941/924-10-S99-1
Reference 2: http://www.xbrl.org/2003/role/disclosureRef
-Topic 606
-SubTopic 10
-Name Accounting Standards Codification
-Section 50
-Paragraph 5
-Publisher FASB
-URI https://asc.fasb.org//1943274/2147479806/606-10-50-5
Reference 3: http://www.xbrl.org/2003/role/disclosureRef
-Topic 280
-SubTopic 10
-Name Accounting Standards Codification
-Section 50
-Paragraph 30
-Subparagraph (a)
-Publisher FASB
-URI https://asc.fasb.org//1943274/2147482810/280-10-50-30
Reference 4: http://www.xbrl.org/2003/role/disclosureRef
-Topic 280
-SubTopic 10
-Name Accounting Standards Codification
-Section 50
-Paragraph 42
-Publisher FASB
-URI https://asc.fasb.org//1943274/2147482810/280-10-50-42
Reference 5: http://www.xbrl.org/2003/role/disclosureRef
-Topic 280
-SubTopic 10
-Name Accounting Standards Codification
-Section 50
-Paragraph 22
-Subparagraph (b)
-Publisher FASB
-URI https://asc.fasb.org//1943274/2147482810/280-10-50-22
Reference 6: http://www.xbrl.org/2003/role/disclosureRef
-Topic 280
-SubTopic 10
-Name Accounting Standards Codification
-Section 50
-Paragraph 32
-Subparagraph (b)
-Publisher FASB
-URI https://asc.fasb.org//1943274/2147482810/280-10-50-32
Reference 7: http://www.xbrl.org/2003/role/disclosureRef
-Topic 280
-SubTopic 10
-Name Accounting Standards Codification
-Section 50
-Paragraph 40
-Publisher FASB
-URI https://asc.fasb.org//1943274/2147482810/280-10-50-40
Reference 8: http://www.xbrl.org/2003/role/disclosureRef
-Topic 280
-SubTopic 10
-Name Accounting Standards Codification
-Section 50
-Paragraph 22
-Subparagraph (a)
-Publisher FASB
-URI https://asc.fasb.org//1943274/2147482810/280-10-50-22
Reference 9: http://www.xbrl.org/2003/role/disclosureRef
-Topic 280
-SubTopic 10
-Name Accounting Standards Codification
-Section 50
-Paragraph 32
-Subparagraph (a)
-Publisher FASB
-URI https://asc.fasb.org//1943274/2147482810/280-10-50-32
Reference 10: http://www.xbrl.org/2003/role/disclosureRef
-Topic 280
-SubTopic 10
-Name Accounting Standards Codification
-Section 50
-Paragraph 41
-Subparagraph (a)
-Publisher FASB
-URI https://asc.fasb.org//1943274/2147482810/280-10-50-41
Reference 11: http://www.xbrl.org/2003/role/disclosureRef
-Topic 606
-SubTopic 10
-Name Accounting Standards Codification
-Section 50
-Paragraph 4
-Subparagraph (a)
-Publisher FASB
-URI https://asc.fasb.org//1943274/2147479806/606-10-50-4
| Name: |
us-gaap_RevenueFromContractWithCustomerExcludingAssessedTax |
| Namespace Prefix: |
us-gaap_ |
| Data Type: |
xbrli:monetaryItemType |
| Balance Type: |
credit |
| Period Type: |
duration |
|
| X |
- Details
| Name: |
us-gaap_StatementBusinessSegmentsAxis=INLX_DocumentManagementMember |
| Namespace Prefix: |
|
| Data Type: |
na |
| Balance Type: |
|
| Period Type: |
|
|
| X |
- Details
| Name: |
us-gaap_StatementBusinessSegmentsAxis=INLX_DocumentConversionMember |
| Namespace Prefix: |
|
| Data Type: |
na |
| Balance Type: |
|
| Period Type: |
|
|
v3.23.2
Summary of Significant Accounting Policies (Details Narrative) - USD ($)
|
3 Months Ended |
6 Months Ended |
12 Months Ended |
Jun. 30, 2023 |
Jun. 30, 2022 |
Jun. 30, 2023 |
Jun. 30, 2022 |
Dec. 31, 2022 |
| Property, Plant and Equipment [Line Items] |
|
|
|
|
|
| Allowance for doubtful accounts |
$ 114,219
|
|
$ 114,219
|
|
$ 88,331
|
| Revenue performance obligations percentage |
|
|
|
|
97.00%
|
| Revenue, remaining performance obligation, amount |
59,499
|
|
59,499
|
|
$ 74,448
|
| Deferred revenue, balance at beginning of period |
|
|
2,754,064
|
$ 1,194,649
|
1,194,649
|
| Deferred revenue, addition from acquisition |
|
|
|
860,456
|
|
| Deferred revenue, billings |
|
|
3,522,274
|
3,166,205
|
|
| Deferred revenue, recognized revenue |
|
|
(4,208,594)
|
(3,507,239)
|
|
| Deferred revenue, balance at end of period |
2,067,744
|
$ 1,714,071
|
2,067,744
|
1,714,071
|
2,754,064
|
| Other long-term assets |
525,337
|
|
525,337
|
|
$ 402,673
|
| Advertising expense |
6,123
|
9,052
|
$ 12,243
|
9,500
|
|
| Effective income tax rate reconciliation, change in deferred tax assets valuation allowance, percent |
|
|
100.00%
|
|
100.00%
|
| Accounting Standards Update 2016-13 [Member] |
|
|
|
|
|
| Property, Plant and Equipment [Line Items] |
|
|
|
|
|
| Allowance for doubtful accounts |
11,662
|
|
$ 11,662
|
|
|
| Software Development [Member] |
|
|
|
|
|
| Property, Plant and Equipment [Line Items] |
|
|
|
|
|
| Software development cost capiatlized |
|
43,771
|
|
43,771
|
|
| Capitalized cost |
96,209
|
98,037
|
208,417
|
127,434
|
|
| Research and development expense |
$ 140,003
|
$ 62,208
|
$ 271,746
|
$ 114,959
|
|
| Intellinetics Ohio and Graphic Sciences [Member] |
|
|
|
|
|
| Property, Plant and Equipment [Line Items] |
|
|
|
|
|
| Percentage of voting rights outstanding |
50.00%
|
|
50.00%
|
|
|
| X |
- DefinitionDeferred revenue addition from acquisition.
| Name: |
INLX_DeferredRevenueAdditionFromAcquisition |
| Namespace Prefix: |
INLX_ |
| Data Type: |
xbrli:monetaryItemType |
| Balance Type: |
credit |
| Period Type: |
duration |
|
| X |
- DefinitionDeferred revenue liability billings.
| Name: |
INLX_DeferredRevenueLiabilityBillings |
| Namespace Prefix: |
INLX_ |
| Data Type: |
xbrli:monetaryItemType |
| Balance Type: |
credit |
| Period Type: |
duration |
|
| X |
- DefinitionDeferred revenue revenue recognized.
| Name: |
INLX_DeferredRevenueRevenueRecognized |
| Namespace Prefix: |
INLX_ |
| Data Type: |
xbrli:monetaryItemType |
| Balance Type: |
credit |
| Period Type: |
duration |
|
| X |
- DefinitionAmount charged to advertising expense for the period, which are expenses incurred with the objective of increasing revenue for a specified brand, product or product line. Reference 1: http://www.xbrl.org/2003/role/disclosureRef
-Topic 720
-SubTopic 35
-Name Accounting Standards Codification
-Section 50
-Paragraph 1
-Subparagraph (b)
-Publisher FASB
-URI https://asc.fasb.org//1943274/2147483406/720-35-50-1
| Name: |
us-gaap_AdvertisingExpense |
| Namespace Prefix: |
us-gaap_ |
| Data Type: |
xbrli:monetaryItemType |
| Balance Type: |
debit |
| Period Type: |
duration |
|
| X |
- DefinitionAmount of allowance for credit loss on accounts receivable. Reference 1: http://www.xbrl.org/2009/role/commonPracticeRef
-Topic 944
-SubTopic 210
-Name Accounting Standards Codification
-Section S99
-Paragraph 1
-Subparagraph (SX 210.7-03(a)(5))
-Publisher FASB
-URI https://asc.fasb.org//1943274/2147479440/944-210-S99-1
Reference 2: http://www.xbrl.org/2003/role/disclosureRef
-Topic 210
-SubTopic 10
-Name Accounting Standards Codification
-Section S99
-Paragraph 1
-Subparagraph (SX 210.5-02(4))
-Publisher FASB
-URI https://asc.fasb.org//1943274/2147480566/210-10-S99-1
Reference 3: http://www.xbrl.org/2003/role/disclosureRef
-Topic 326
-SubTopic 20
-Name Accounting Standards Codification
-Section 45
-Paragraph 1
-Publisher FASB
-URI https://asc.fasb.org//1943274/2147479344/326-20-45-1
Reference 4: http://www.xbrl.org/2003/role/disclosureRef
-Topic 310
-SubTopic 10
-Name Accounting Standards Codification
-Section 50
-Paragraph 4
-Publisher FASB
-URI https://asc.fasb.org//1943274/2147481962/310-10-50-4
Reference 5: http://www.xbrl.org/2003/role/disclosureRef
-Topic 326
-SubTopic 20
-Name Accounting Standards Codification
-Section 50
-Paragraph 13
-Subparagraph (a)
-Publisher FASB
-URI https://asc.fasb.org//1943274/2147479319/326-20-50-13
Reference 6: http://www.xbrl.org/2003/role/disclosureRef
-Topic 326
-SubTopic 20
-Name Accounting Standards Codification
-Section 50
-Paragraph 13
-Subparagraph (f)
-Publisher FASB
-URI https://asc.fasb.org//1943274/2147479319/326-20-50-13
| Name: |
us-gaap_AllowanceForDoubtfulAccountsReceivable |
| Namespace Prefix: |
us-gaap_ |
| Data Type: |
xbrli:monetaryItemType |
| Balance Type: |
credit |
| Period Type: |
instant |
|
| X |
- DefinitionPercentage of voting equity interests acquired at the acquisition date in the business combination. Reference 1: http://fasb.org/us-gaap/role/ref/legacyRef
-Name Accounting Standards Codification
-Topic 805
-SubTopic 10
-Section 50
-Paragraph 2
-Subparagraph (c)
-Publisher FASB
-URI https://asc.fasb.org//1943274/2147479328/805-10-50-2
| Name: |
us-gaap_BusinessAcquisitionPercentageOfVotingInterestsAcquired |
| Namespace Prefix: |
us-gaap_ |
| Data Type: |
dtr-types:percentItemType |
| Balance Type: |
na |
| Period Type: |
instant |
|
| X |
- DefinitionAdditions made to capitalized computer software costs during the period. Reference 1: http://fasb.org/us-gaap/role/ref/legacyRef
-Name Accounting Standards Codification
-Topic 350
-SubTopic 30
-Section 50
-Paragraph 1
-Subparagraph (a)
-Publisher FASB
-URI https://asc.fasb.org//1943274/2147482665/350-30-50-1
| Name: |
us-gaap_CapitalizedComputerSoftwareAdditions |
| Namespace Prefix: |
us-gaap_ |
| Data Type: |
xbrli:monetaryItemType |
| Balance Type: |
debit |
| Period Type: |
duration |
|
| X |
- DefinitionAmount of deferred income and obligation to transfer product and service to customer for which consideration has been received or is receivable, classified as current. Reference 1: http://www.xbrl.org/2009/role/commonPracticeRef
-Topic 210
-SubTopic 10
-Name Accounting Standards Codification
-Section S99
-Paragraph 1
-Subparagraph (SX 210.5-02(20))
-Publisher FASB
-URI https://asc.fasb.org//1943274/2147480566/210-10-S99-1
| Name: |
us-gaap_DeferredRevenueCurrent |
| Namespace Prefix: |
us-gaap_ |
| Data Type: |
xbrli:monetaryItemType |
| Balance Type: |
credit |
| Period Type: |
instant |
|
| X |
- DefinitionAmount of long-term debt classified as other, payable after one year or the operating cycle, if longer. Reference 1: http://www.xbrl.org/2003/role/disclosureRef
-Topic 946
-SubTopic 210
-Name Accounting Standards Codification
-Section S99
-Paragraph 1
-Subparagraph (SX 210.6-04(13)(a)(4))
-Publisher FASB
-URI https://asc.fasb.org//1943274/2147479617/946-210-S99-1
Reference 2: http://fasb.org/us-gaap/role/ref/legacyRef
-Name Accounting Standards Codification
-Topic 210
-SubTopic 10
-Section S99
-Paragraph 1
-Subparagraph (SX 210.5-02.22)
-Publisher FASB
-URI https://asc.fasb.org//1943274/2147480566/210-10-S99-1
| Name: |
us-gaap_OtherLongTermDebtNoncurrent |
| Namespace Prefix: |
us-gaap_ |
| Data Type: |
xbrli:monetaryItemType |
| Balance Type: |
credit |
| Period Type: |
instant |
|
| X |
- DefinitionLine items represent financial concepts included in a table. These concepts are used to disclose reportable information associated with domain members defined in one or many axes to the table.
| Name: |
us-gaap_PropertyPlantAndEquipmentLineItems |
| Namespace Prefix: |
us-gaap_ |
| Data Type: |
xbrli:stringItemType |
| Balance Type: |
na |
| Period Type: |
duration |
|
| X |
- DefinitionThe aggregate costs incurred (1) in a planned search or critical investigation aimed at discovery of new knowledge with the hope that such knowledge will be useful in developing a new product or service, a new process or technique, or in bringing about a significant improvement to an existing product or process; or (2) to translate research findings or other knowledge into a plan or design for a new product or process or for a significant improvement to an existing product or process whether intended for sale or the entity's use, during the reporting period charged to research and development projects, including the costs of developing computer software up to the point in time of achieving technological feasibility, and costs allocated in accounting for a business combination to in-process projects deemed to have no alternative future use. Reference 1: http://www.xbrl.org/2003/role/disclosureRef
-Topic 730
-SubTopic 10
-Name Accounting Standards Codification
-Section 50
-Paragraph 1
-Publisher FASB
-URI https://asc.fasb.org//1943274/2147482916/730-10-50-1
Reference 2: http://www.xbrl.org/2009/role/commonPracticeRef
-Topic 912
-SubTopic 730
-Name Accounting Standards Codification
-Section 25
-Paragraph 1
-Publisher FASB
-URI https://asc.fasb.org//1943274/2147482517/912-730-25-1
Reference 3: http://fasb.org/us-gaap/role/ref/legacyRef
-Name Accounting Standards Codification
-Topic 985
-SubTopic 20
-Section 50
-Paragraph 1
-Publisher FASB
-URI https://asc.fasb.org//1943274/2147481283/985-20-50-1
| Name: |
us-gaap_ResearchAndDevelopmentExpense |
| Namespace Prefix: |
us-gaap_ |
| Data Type: |
xbrli:monetaryItemType |
| Balance Type: |
debit |
| Period Type: |
duration |
|
| X |
- DefinitionResearch and development expense during the period related to the costs of developing and achieving technological feasibility of a computer software product to be sold, leased, or otherwise marketed. Reference 1: http://www.xbrl.org/2009/role/commonPracticeRef
-Topic 730
-SubTopic 10
-Name Accounting Standards Codification
-Section 50
-Paragraph 1
-Publisher FASB
-URI https://asc.fasb.org//1943274/2147482916/730-10-50-1
Reference 2: http://fasb.org/us-gaap/role/ref/legacyRef
-Name Accounting Standards Codification
-Topic 985
-SubTopic 20
-Section 50
-Paragraph 1
-Subparagraph (b)
-Publisher FASB
-URI https://asc.fasb.org//1943274/2147481283/985-20-50-1
| Name: |
us-gaap_ResearchAndDevelopmentExpenseSoftwareExcludingAcquiredInProcessCost |
| Namespace Prefix: |
us-gaap_ |
| Data Type: |
xbrli:monetaryItemType |
| Balance Type: |
debit |
| Period Type: |
duration |
|
| X |
- DefinitionAmount of transaction price allocated to performance obligation that has not been recognized as revenue. Reference 1: http://www.xbrl.org/2003/role/disclosureRef
-Name Accounting Standards Codification
-Section 50
-Paragraph 13
-Subparagraph (a)
-SubTopic 10
-Topic 606
-Publisher FASB
-URI https://asc.fasb.org//1943274/2147479806/606-10-50-13
| Name: |
us-gaap_RevenueRemainingPerformanceObligation |
| Namespace Prefix: |
us-gaap_ |
| Data Type: |
xbrli:monetaryItemType |
| Balance Type: |
credit |
| Period Type: |
instant |
|
| X |
- DefinitionPercentage of remaining performance obligation to total remaining performance obligation not recognized as revenue. Reference 1: http://www.xbrl.org/2009/role/commonPracticeRef
-Name Accounting Standards Codification
-Section 50
-Paragraph 13
-Subparagraph (b)(1)
-SubTopic 10
-Topic 606
-Publisher FASB
-URI https://asc.fasb.org//1943274/2147479806/606-10-50-13
| Name: |
us-gaap_RevenueRemainingPerformanceObligationPercentage |
| Namespace Prefix: |
us-gaap_ |
| Data Type: |
dtr-types:percentItemType |
| Balance Type: |
na |
| Period Type: |
instant |
|
| X |
- Details
| Name: |
us-gaap_AdjustmentsForNewAccountingPronouncementsAxis=us-gaap_AccountingStandardsUpdate201613Member |
| Namespace Prefix: |
|
| Data Type: |
na |
| Balance Type: |
|
| Period Type: |
|
|
| X |
- Details
| Name: |
us-gaap_PropertyPlantAndEquipmentByTypeAxis=us-gaap_SoftwareDevelopmentMember |
| Namespace Prefix: |
|
| Data Type: |
na |
| Balance Type: |
|
| Period Type: |
|
|
| X |
- Details
| Name: |
us-gaap_BusinessAcquisitionAxis=INLX_IntellineticsOhioAndGraphicSciencesMember |
| Namespace Prefix: |
|
| Data Type: |
na |
| Balance Type: |
|
| Period Type: |
|
|
v3.23.2
Schedule of Fair Value of Assets Acquired and Liabilities Assumed (Details)
|
Apr. 01, 2022
USD ($)
|
| Business Combination and Asset Acquisition [Abstract] |
|
| Accounts receivable |
$ 68,380
|
| Prepaid expenses |
38,913
|
| Property and equipment |
30,018
|
| Intangible assets (see Note 5) |
3,888,000
|
| Assets |
4,025,311
|
| Accounts payable |
36,446
|
| Deferred revenue |
1,072,530
|
| Liabilities |
1,108,976
|
| Total identifiable net assets |
2,916,335
|
| Purchase price |
6,383,269
|
| Goodwill - Excess of purchase price over fair value of net assets acquired |
$ 3,466,934
|
| X |
- DefinitionBusiness combination recognized identifiable assets acquired and liabilities assumed purchase price.
| Name: |
INLX_BusinessCombinationRecognizedIdentifiableAssetsAcquiredAndLiabilitiesAssumedPurchasePrice |
| Namespace Prefix: |
INLX_ |
| Data Type: |
xbrli:monetaryItemType |
| Balance Type: |
debit |
| Period Type: |
instant |
|
| X |
- References
+ Details
| Name: |
us-gaap_BusinessCombinationAndAssetAcquisitionAbstract |
| Namespace Prefix: |
us-gaap_ |
| Data Type: |
xbrli:stringItemType |
| Balance Type: |
na |
| Period Type: |
duration |
|
| X |
- DefinitionAmount of assets acquired at the acquisition date. Reference 1: http://fasb.org/us-gaap/role/ref/legacyRef
-Name Accounting Standards Codification
-Topic 805
-SubTopic 20
-Section 50
-Paragraph 1
-Subparagraph (c)
-Publisher FASB
-URI https://asc.fasb.org//1943274/2147479907/805-20-50-1
| Name: |
us-gaap_BusinessCombinationRecognizedIdentifiableAssetsAcquiredAndLiabilitiesAssumedAssets |
| Namespace Prefix: |
us-gaap_ |
| Data Type: |
xbrli:monetaryItemType |
| Balance Type: |
debit |
| Period Type: |
instant |
|
| X |
- DefinitionAmount of asset related to consideration paid in advance for costs that provide economic benefits in future periods, and amount of other assets that are expected to be realized or consumed within one year or the normal operating cycle, if longer, acquired at the acquisition date. Reference 1: http://fasb.org/us-gaap/role/ref/legacyRef
-Name Accounting Standards Codification
-Topic 805
-SubTopic 20
-Section 50
-Paragraph 1
-Subparagraph (c)
-Publisher FASB
-URI https://asc.fasb.org//1943274/2147479907/805-20-50-1
| Name: |
us-gaap_BusinessCombinationRecognizedIdentifiableAssetsAcquiredAndLiabilitiesAssumedCurrentAssetsPrepaidExpenseAndOtherAssets |
| Namespace Prefix: |
us-gaap_ |
| Data Type: |
xbrli:monetaryItemType |
| Balance Type: |
debit |
| Period Type: |
instant |
|
| X |
- DefinitionAmount due from customers or clients for goods or services, including trade receivables, that have been delivered or sold in the normal course of business, and amounts due from others, including related parties expected to be converted to cash, sold or exchanged within one year or the normal operating cycle, if longer, acquired at the acquisition date. Reference 1: http://fasb.org/us-gaap/role/ref/legacyRef
-Name Accounting Standards Codification
-Topic 805
-SubTopic 20
-Section 50
-Paragraph 1
-Subparagraph (c)
-Publisher FASB
-URI https://asc.fasb.org//1943274/2147479907/805-20-50-1
| Name: |
us-gaap_BusinessCombinationRecognizedIdentifiableAssetsAcquiredAndLiabilitiesAssumedCurrentAssetsReceivables |
| Namespace Prefix: |
us-gaap_ |
| Data Type: |
xbrli:monetaryItemType |
| Balance Type: |
debit |
| Period Type: |
instant |
|
| X |
- DefinitionAmount of liabilities incurred for goods and services received that are used in an entity's business and related party payables, assumed at the acquisition date. Reference 1: http://fasb.org/us-gaap/role/ref/legacyRef
-Name Accounting Standards Codification
-Topic 805
-SubTopic 20
-Section 50
-Paragraph 1
-Subparagraph (c)
-Publisher FASB
-URI https://asc.fasb.org//1943274/2147479907/805-20-50-1
| Name: |
us-gaap_BusinessCombinationRecognizedIdentifiableAssetsAcquiredAndLiabilitiesAssumedCurrentLiabilitiesAccountsPayable |
| Namespace Prefix: |
us-gaap_ |
| Data Type: |
xbrli:monetaryItemType |
| Balance Type: |
credit |
| Period Type: |
instant |
|
| X |
- DefinitionAmount of deferred revenue expected to be recognized as such within one year or the normal operating cycle, if longer, assumed at the acquisition date. Reference 1: http://fasb.org/us-gaap/role/ref/legacyRef
-Name Accounting Standards Codification
-Topic 805
-SubTopic 20
-Section 50
-Paragraph 1
-Subparagraph (c)
-Publisher FASB
-URI https://asc.fasb.org//1943274/2147479907/805-20-50-1
| Name: |
us-gaap_BusinessCombinationRecognizedIdentifiableAssetsAcquiredAndLiabilitiesAssumedCurrentLiabilitiesDeferredRevenue |
| Namespace Prefix: |
us-gaap_ |
| Data Type: |
xbrli:monetaryItemType |
| Balance Type: |
credit |
| Period Type: |
instant |
|
| X |
- DefinitionAmount of intangible assets, excluding goodwill, acquired at the acquisition date. Reference 1: http://fasb.org/us-gaap/role/ref/legacyRef
-Name Accounting Standards Codification
-Topic 805
-SubTopic 20
-Section 50
-Paragraph 1
-Subparagraph (c)
-Publisher FASB
-URI https://asc.fasb.org//1943274/2147479907/805-20-50-1
| Name: |
us-gaap_BusinessCombinationRecognizedIdentifiableAssetsAcquiredAndLiabilitiesAssumedIntangibleAssetsOtherThanGoodwill |
| Namespace Prefix: |
us-gaap_ |
| Data Type: |
xbrli:monetaryItemType |
| Balance Type: |
debit |
| Period Type: |
instant |
|
| X |
- DefinitionAmount of liabilities assumed at the acquisition date. Reference 1: http://fasb.org/us-gaap/role/ref/legacyRef
-Name Accounting Standards Codification
-Topic 805
-SubTopic 20
-Section 50
-Paragraph 1
-Subparagraph (c)
-Publisher FASB
-URI https://asc.fasb.org//1943274/2147479907/805-20-50-1
| Name: |
us-gaap_BusinessCombinationRecognizedIdentifiableAssetsAcquiredAndLiabilitiesAssumedLiabilities |
| Namespace Prefix: |
us-gaap_ |
| Data Type: |
xbrli:monetaryItemType |
| Balance Type: |
credit |
| Period Type: |
instant |
|
| X |
- DefinitionAmount recognized as of the acquisition date for the identifiable assets acquired in excess of (less than) the aggregate liabilities assumed. Reference 1: http://fasb.org/us-gaap/role/ref/legacyRef
-Name Accounting Standards Codification
-Topic 805
-SubTopic 10
-Section 55
-Paragraph 37
-Publisher FASB
-URI https://asc.fasb.org//1943274/2147479303/805-10-55-37
Reference 2: http://fasb.org/us-gaap/role/ref/legacyRef
-Name Accounting Standards Codification
-Topic 805
-SubTopic 20
-Section 50
-Paragraph 1
-Subparagraph (c)
-Publisher FASB
-URI https://asc.fasb.org//1943274/2147479907/805-20-50-1
| Name: |
us-gaap_BusinessCombinationRecognizedIdentifiableAssetsAcquiredAndLiabilitiesAssumedNet |
| Namespace Prefix: |
us-gaap_ |
| Data Type: |
xbrli:monetaryItemType |
| Balance Type: |
debit |
| Period Type: |
instant |
|
| X |
- DefinitionThe amount of property, plant, and equipment recognized as of the acquisition date. Reference 1: http://fasb.org/us-gaap/role/ref/legacyRef
-Name Accounting Standards Codification
-Topic 805
-SubTopic 10
-Section 55
-Paragraph 37
-Publisher FASB
-URI https://asc.fasb.org//1943274/2147479303/805-10-55-37
Reference 2: http://fasb.org/us-gaap/role/ref/legacyRef
-Name Accounting Standards Codification
-Topic 805
-SubTopic 20
-Section 50
-Paragraph 1
-Subparagraph (c)
-Publisher FASB
-URI https://asc.fasb.org//1943274/2147479907/805-20-50-1
| Name: |
us-gaap_BusinessCombinationRecognizedIdentifiableAssetsAcquiredAndLiabilitiesAssumedPropertyPlantAndEquipment |
| Namespace Prefix: |
us-gaap_ |
| Data Type: |
xbrli:monetaryItemType |
| Balance Type: |
debit |
| Period Type: |
instant |
|
| X |
- DefinitionAmount recognized for assets, including goodwill, in excess of (less than) the aggregate liabilities assumed. Reference 1: http://fasb.org/us-gaap/role/ref/legacyRef
-Name Accounting Standards Codification
-Topic 805
-SubTopic 20
-Section 50
-Paragraph 1
-Subparagraph (c)
-Publisher FASB
-URI https://asc.fasb.org//1943274/2147479907/805-20-50-1
| Name: |
us-gaap_BusinessCombinationRecognizedIdentifiableAssetsAcquiredGoodwillAndLiabilitiesAssumedNet |
| Namespace Prefix: |
us-gaap_ |
| Data Type: |
xbrli:monetaryItemType |
| Balance Type: |
debit |
| Period Type: |
instant |
|
v3.23.2
Schedule of Pro Forma Information (Details) - USD ($)
|
3 Months Ended |
6 Months Ended |
Jun. 30, 2023 |
Jun. 30, 2022 |
Jun. 30, 2023 |
Jun. 30, 2022 |
| Business Acquisition [Line Items] |
|
|
|
|
| Total revenues |
$ 4,258,430
|
$ 3,415,643
|
$ 8,445,263
|
$ 6,897,007
|
| Net income (loss) |
$ 135,734
|
$ (374,167)
|
$ 248,297
|
$ (359,777)
|
| Basic net income (loss) per share |
$ 0.03
|
$ (0.09)
|
$ 0.06
|
$ (0.09)
|
| Diluted net income (loss) per share |
$ 0.03
|
$ (0.09)
|
$ 0.06
|
$ (0.09)
|
| Yellow Folder [Member] |
|
|
|
|
| Business Acquisition [Line Items] |
|
|
|
|
| Total revenues |
$ 864,331
|
$ 790,368
|
$ 1,738,893
|
$ 790,368
|
| Net income (loss) |
$ 85,408
|
$ 196,559
|
$ 271,111
|
$ 196,559
|
| X |
- DefinitionLine items represent financial concepts included in a table. These concepts are used to disclose reportable information associated with domain members defined in one or many axes to the table. Reference 1: http://www.xbrl.org/2003/role/disclosureRef
-Topic 805
-SubTopic 20
-Name Accounting Standards Codification
-Section 50
-Paragraph 5
-Subparagraph (a)
-Publisher FASB
-URI https://asc.fasb.org//1943274/2147479907/805-20-50-5
| Name: |
us-gaap_BusinessAcquisitionLineItems |
| Namespace Prefix: |
us-gaap_ |
| Data Type: |
xbrli:stringItemType |
| Balance Type: |
na |
| Period Type: |
duration |
|
| X |
- Details
| Name: |
us-gaap_BusinessAcquisitionAxis=INLX_YellowFolderMember |
| Namespace Prefix: |
|
| Data Type: |
na |
| Balance Type: |
|
| Period Type: |
|
|
v3.23.2
| X |
- DefinitionBusiness combination recognized identifiable assets acquired and liabilities assumed purchase price.
| Name: |
INLX_BusinessCombinationRecognizedIdentifiableAssetsAcquiredAndLiabilitiesAssumedPurchasePrice |
| Namespace Prefix: |
INLX_ |
| Data Type: |
xbrli:monetaryItemType |
| Balance Type: |
debit |
| Period Type: |
instant |
|
| X |
- References
+ Details
| Name: |
us-gaap_BusinessCombinationAndAssetAcquisitionAbstract |
| Namespace Prefix: |
us-gaap_ |
| Data Type: |
xbrli:stringItemType |
| Balance Type: |
na |
| Period Type: |
duration |
|
| X |
- DefinitionAmount recognized for assets, including goodwill, in excess of (less than) the aggregate liabilities assumed. Reference 1: http://fasb.org/us-gaap/role/ref/legacyRef
-Name Accounting Standards Codification
-Topic 805
-SubTopic 20
-Section 50
-Paragraph 1
-Subparagraph (c)
-Publisher FASB
-URI https://asc.fasb.org//1943274/2147479907/805-20-50-1
| Name: |
us-gaap_BusinessCombinationRecognizedIdentifiableAssetsAcquiredGoodwillAndLiabilitiesAssumedNet |
| Namespace Prefix: |
us-gaap_ |
| Data Type: |
xbrli:monetaryItemType |
| Balance Type: |
debit |
| Period Type: |
instant |
|
v3.23.2
Schedule of Intangible Assets (Details) - USD ($)
|
Jun. 30, 2023 |
Dec. 31, 2022 |
| Finite-Lived Intangible Assets [Line Items] |
|
|
| Intangible assets, cost |
$ 5,249,000
|
$ 5,249,000
|
| Intangible assets, accumulated amortization |
(1,084,508)
|
(829,354)
|
| Intangible assets, net |
$ 4,164,492
|
$ 4,419,646
|
| Trade Names [Member] |
|
|
| Finite-Lived Intangible Assets [Line Items] |
|
|
| Estimated useful life |
10 years
|
10 years
|
| Intangible assets, cost |
$ 297,000
|
$ 297,000
|
| Intangible assets, accumulated amortization |
(61,917)
|
(47,067)
|
| Intangible assets, net |
$ 235,083
|
$ 249,933
|
| Proprietary Technology [Member] |
|
|
| Finite-Lived Intangible Assets [Line Items] |
|
|
| Estimated useful life |
10 years
|
10 years
|
| Intangible assets, cost |
$ 861,000
|
$ 861,000
|
| Intangible assets, accumulated amortization |
(107,625)
|
(64,575)
|
| Intangible assets, net |
753,375
|
796,425
|
| Customer Relationships [Member] |
|
|
| Finite-Lived Intangible Assets [Line Items] |
|
|
| Intangible assets, cost |
4,091,000
|
4,091,000
|
| Intangible assets, accumulated amortization |
(914,966)
|
(717,712)
|
| Intangible assets, net |
$ 3,176,034
|
$ 3,373,288
|
| Customer Relationships [Member] | Minimum [Member] |
|
|
| Finite-Lived Intangible Assets [Line Items] |
|
|
| Estimated useful life |
5 years
|
5 years
|
| Customer Relationships [Member] | Maximum [Member] |
|
|
| Finite-Lived Intangible Assets [Line Items] |
|
|
| Estimated useful life |
15 years
|
15 years
|
| X |
- DefinitionUseful life of finite-lived intangible assets, in 'PnYnMnDTnHnMnS' format, for example, 'P1Y5M13D' represents the reported fact of one year, five months, and thirteen days.
| Name: |
us-gaap_FiniteLivedIntangibleAssetUsefulLife |
| Namespace Prefix: |
us-gaap_ |
| Data Type: |
xbrli:durationItemType |
| Balance Type: |
na |
| Period Type: |
instant |
|
| X |
- DefinitionAccumulated amount of amortization of assets, excluding financial assets and goodwill, lacking physical substance with a finite life. Reference 1: http://www.xbrl.org/2003/role/disclosureRef
-Topic 210
-SubTopic 10
-Name Accounting Standards Codification
-Section S99
-Paragraph 1
-Subparagraph (SX 210.5-02(16))
-Publisher FASB
-URI https://asc.fasb.org//1943274/2147480566/210-10-S99-1
Reference 2: http://www.xbrl.org/2003/role/disclosureRef
-Topic 350
-SubTopic 30
-Name Accounting Standards Codification
-Section 50
-Paragraph 2
-Subparagraph (a)(1)
-Publisher FASB
-URI https://asc.fasb.org//1943274/2147482665/350-30-50-2
| Name: |
us-gaap_FiniteLivedIntangibleAssetsAccumulatedAmortization |
| Namespace Prefix: |
us-gaap_ |
| Data Type: |
xbrli:monetaryItemType |
| Balance Type: |
credit |
| Period Type: |
instant |
|
| X |
- DefinitionAmount before amortization of assets, excluding financial assets and goodwill, lacking physical substance with a finite life. Reference 1: http://www.xbrl.org/2003/role/disclosureRef
-Topic 928
-SubTopic 340
-Name Accounting Standards Codification
-Section 50
-Paragraph 1
-Publisher FASB
-URI https://asc.fasb.org//1943274/2147483147/928-340-50-1
Reference 2: http://fasb.org/us-gaap/role/ref/legacyRef
-Topic 350
-SubTopic 30
-Name Accounting Standards Codification
-Section 50
-Paragraph 2
-Subparagraph (a)(1)
-Publisher FASB
-URI https://asc.fasb.org//1943274/2147482665/350-30-50-2
| Name: |
us-gaap_FiniteLivedIntangibleAssetsGross |
| Namespace Prefix: |
us-gaap_ |
| Data Type: |
xbrli:monetaryItemType |
| Balance Type: |
debit |
| Period Type: |
instant |
|
| X |
- DefinitionLine items represent financial concepts included in a table. These concepts are used to disclose reportable information associated with domain members defined in one or many axes to the table. Reference 1: http://www.xbrl.org/2003/role/disclosureRef
-Topic 926
-SubTopic 20
-Name Accounting Standards Codification
-Section 50
-Paragraph 5
-Publisher FASB
-URI https://asc.fasb.org//1943274/2147483154/926-20-50-5
| Name: |
us-gaap_FiniteLivedIntangibleAssetsLineItems |
| Namespace Prefix: |
us-gaap_ |
| Data Type: |
xbrli:stringItemType |
| Balance Type: |
na |
| Period Type: |
duration |
|
| X |
- DefinitionAmount after amortization of assets, excluding financial assets and goodwill, lacking physical substance with a finite life. Reference 1: http://www.xbrl.org/2003/role/disclosureRef
-Topic 926
-SubTopic 20
-Name Accounting Standards Codification
-Section 50
-Paragraph 5
-Publisher FASB
-URI https://asc.fasb.org//1943274/2147483154/926-20-50-5
Reference 2: http://fasb.org/us-gaap/role/ref/legacyRef
-Topic 350
-SubTopic 30
-Name Accounting Standards Codification
-Section 50
-Paragraph 2
-Subparagraph (a)(1)
-Publisher FASB
-URI https://asc.fasb.org//1943274/2147482665/350-30-50-2
| Name: |
us-gaap_FiniteLivedIntangibleAssetsNet |
| Namespace Prefix: |
us-gaap_ |
| Data Type: |
xbrli:monetaryItemType |
| Balance Type: |
debit |
| Period Type: |
instant |
|
| X |
- Details
| Name: |
us-gaap_FiniteLivedIntangibleAssetsByMajorClassAxis=us-gaap_TradeNamesMember |
| Namespace Prefix: |
|
| Data Type: |
na |
| Balance Type: |
|
| Period Type: |
|
|
| X |
- Details
| Name: |
us-gaap_FiniteLivedIntangibleAssetsByMajorClassAxis=INLX_ProprietaryTechnologyMember |
| Namespace Prefix: |
|
| Data Type: |
na |
| Balance Type: |
|
| Period Type: |
|
|
| X |
- Details
| Name: |
us-gaap_FiniteLivedIntangibleAssetsByMajorClassAxis=us-gaap_CustomerRelationshipsMember |
| Namespace Prefix: |
|
| Data Type: |
na |
| Balance Type: |
|
| Period Type: |
|
|
| X |
- Details
| Name: |
srt_RangeAxis=srt_MinimumMember |
| Namespace Prefix: |
|
| Data Type: |
na |
| Balance Type: |
|
| Period Type: |
|
|
| X |
- Details
| Name: |
srt_RangeAxis=srt_MaximumMember |
| Namespace Prefix: |
|
| Data Type: |
na |
| Balance Type: |
|
| Period Type: |
|
|
v3.23.2
Schedule of Amortization Expense for Intangible Assets (Details) - USD ($)
|
Jun. 30, 2023 |
Dec. 31, 2022 |
| Goodwill and Intangible Assets Disclosure [Abstract] |
|
|
| 2024 |
$ 510,308
|
|
| 2025 |
505,941
|
|
| 2026 |
431,441
|
|
| 2027 |
326,108
|
|
| 2028 |
319,316
|
|
| Thereafter |
2,071,378
|
|
| Intangible assets |
$ 4,164,492
|
$ 4,419,646
|
| X |
- DefinitionAmount of amortization for asset, excluding financial asset and goodwill, lacking physical substance with finite life expected to be recognized after fifth fiscal year following current fiscal year. Excludes interim and annual periods when interim periods are reported from current statement of financial position date (rolling approach).
| Name: |
us-gaap_FiniteLivedIntangibleAssetsAmortizationExpenseAfterYearFive |
| Namespace Prefix: |
us-gaap_ |
| Data Type: |
xbrli:monetaryItemType |
| Balance Type: |
debit |
| Period Type: |
instant |
|
| X |
- DefinitionAmount of amortization for assets, excluding financial assets and goodwill, lacking physical substance with finite life expected to be recognized in next fiscal year following current fiscal year. Excludes interim and annual periods when interim periods are reported from current statement of financial position date (rolling approach). Reference 1: http://fasb.org/us-gaap/role/ref/legacyRef
-Topic 350
-SubTopic 30
-Name Accounting Standards Codification
-Section 50
-Paragraph 2
-Subparagraph (a)(3)
-Publisher FASB
-URI https://asc.fasb.org//1943274/2147482665/350-30-50-2
| Name: |
us-gaap_FiniteLivedIntangibleAssetsAmortizationExpenseNextTwelveMonths |
| Namespace Prefix: |
us-gaap_ |
| Data Type: |
xbrli:monetaryItemType |
| Balance Type: |
debit |
| Period Type: |
instant |
|
| X |
- DefinitionAmount of amortization for assets, excluding financial assets and goodwill, lacking physical substance with finite life expected to be recognized in fifth fiscal year following current fiscal year. Excludes interim and annual periods when interim periods are reported from current statement of financial position date (rolling approach). Reference 1: http://fasb.org/us-gaap/role/ref/legacyRef
-Topic 350
-SubTopic 30
-Name Accounting Standards Codification
-Section 50
-Paragraph 2
-Subparagraph (a)(3)
-Publisher FASB
-URI https://asc.fasb.org//1943274/2147482665/350-30-50-2
| Name: |
us-gaap_FiniteLivedIntangibleAssetsAmortizationExpenseYearFive |
| Namespace Prefix: |
us-gaap_ |
| Data Type: |
xbrli:monetaryItemType |
| Balance Type: |
debit |
| Period Type: |
instant |
|
| X |
- DefinitionAmount of amortization for assets, excluding financial assets and goodwill, lacking physical substance with finite life expected to be recognized in fourth fiscal year following current fiscal year. Excludes interim and annual periods when interim periods are reported from current statement of financial position date (rolling approach). Reference 1: http://fasb.org/us-gaap/role/ref/legacyRef
-Topic 350
-SubTopic 30
-Name Accounting Standards Codification
-Section 50
-Paragraph 2
-Subparagraph (a)(3)
-Publisher FASB
-URI https://asc.fasb.org//1943274/2147482665/350-30-50-2
| Name: |
us-gaap_FiniteLivedIntangibleAssetsAmortizationExpenseYearFour |
| Namespace Prefix: |
us-gaap_ |
| Data Type: |
xbrli:monetaryItemType |
| Balance Type: |
debit |
| Period Type: |
instant |
|
| X |
- DefinitionAmount of amortization for assets, excluding financial assets and goodwill, lacking physical substance with finite life expected to be recognized in third fiscal year following current fiscal year. Excludes interim and annual periods when interim periods are reported from current statement of financial position date (rolling approach). Reference 1: http://fasb.org/us-gaap/role/ref/legacyRef
-Topic 350
-SubTopic 30
-Name Accounting Standards Codification
-Section 50
-Paragraph 2
-Subparagraph (a)(3)
-Publisher FASB
-URI https://asc.fasb.org//1943274/2147482665/350-30-50-2
| Name: |
us-gaap_FiniteLivedIntangibleAssetsAmortizationExpenseYearThree |
| Namespace Prefix: |
us-gaap_ |
| Data Type: |
xbrli:monetaryItemType |
| Balance Type: |
debit |
| Period Type: |
instant |
|
| X |
- DefinitionAmount of amortization for assets, excluding financial assets and goodwill, lacking physical substance with finite life expected to be recognized in second fiscal year following current fiscal year. Excludes interim and annual periods when interim periods are reported from current statement of financial position date (rolling approach). Reference 1: http://fasb.org/us-gaap/role/ref/legacyRef
-Topic 350
-SubTopic 30
-Name Accounting Standards Codification
-Section 50
-Paragraph 2
-Subparagraph (a)(3)
-Publisher FASB
-URI https://asc.fasb.org//1943274/2147482665/350-30-50-2
| Name: |
us-gaap_FiniteLivedIntangibleAssetsAmortizationExpenseYearTwo |
| Namespace Prefix: |
us-gaap_ |
| Data Type: |
xbrli:monetaryItemType |
| Balance Type: |
debit |
| Period Type: |
instant |
|
| X |
- DefinitionAmount after amortization of assets, excluding financial assets and goodwill, lacking physical substance with a finite life. Reference 1: http://www.xbrl.org/2003/role/disclosureRef
-Topic 926
-SubTopic 20
-Name Accounting Standards Codification
-Section 50
-Paragraph 5
-Publisher FASB
-URI https://asc.fasb.org//1943274/2147483154/926-20-50-5
Reference 2: http://fasb.org/us-gaap/role/ref/legacyRef
-Topic 350
-SubTopic 30
-Name Accounting Standards Codification
-Section 50
-Paragraph 2
-Subparagraph (a)(1)
-Publisher FASB
-URI https://asc.fasb.org//1943274/2147482665/350-30-50-2
| Name: |
us-gaap_FiniteLivedIntangibleAssetsNet |
| Namespace Prefix: |
us-gaap_ |
| Data Type: |
xbrli:monetaryItemType |
| Balance Type: |
debit |
| Period Type: |
instant |
|
| X |
- References
+ Details
| Name: |
us-gaap_GoodwillAndIntangibleAssetsDisclosureAbstract |
| Namespace Prefix: |
us-gaap_ |
| Data Type: |
xbrli:stringItemType |
| Balance Type: |
na |
| Period Type: |
duration |
|
v3.23.2
| X |
- DefinitionThe aggregate expense charged against earnings to allocate the cost of intangible assets (nonphysical assets not used in production) in a systematic and rational manner to the periods expected to benefit from such assets. As a noncash expense, this element is added back to net income when calculating cash provided by or used in operations using the indirect method. Reference 1: http://fasb.org/us-gaap/role/ref/legacyRef
-Name Accounting Standards Codification
-Section 45
-Paragraph 28
-Subparagraph (b)
-SubTopic 10
-Topic 230
-Publisher FASB
-URI https://asc.fasb.org//1943274/2147482740/230-10-45-28
Reference 2: http://fasb.org/us-gaap/role/ref/legacyRef
-Name Accounting Standards Codification
-Topic 350
-SubTopic 30
-Section 45
-Paragraph 2
-Publisher FASB
-URI https://asc.fasb.org//1943274/2147482686/350-30-45-2
Reference 3: http://fasb.org/us-gaap/role/ref/legacyRef
-Name Accounting Standards Codification
-Topic 350
-SubTopic 30
-Section 50
-Paragraph 2
-Subparagraph (a)(2)
-Publisher FASB
-URI https://asc.fasb.org//1943274/2147482665/350-30-50-2
| Name: |
us-gaap_AmortizationOfIntangibleAssets |
| Namespace Prefix: |
us-gaap_ |
| Data Type: |
xbrli:monetaryItemType |
| Balance Type: |
debit |
| Period Type: |
duration |
|
| X |
- References
+ Details
| Name: |
us-gaap_GoodwillAndIntangibleAssetsDisclosureAbstract |
| Namespace Prefix: |
us-gaap_ |
| Data Type: |
xbrli:stringItemType |
| Balance Type: |
na |
| Period Type: |
duration |
|
v3.23.2
Summary of Changes in Fair Value of Earnout Liabilities (Details) - USD ($)
|
3 Months Ended |
6 Months Ended |
Jun. 30, 2023 |
Jun. 30, 2022 |
Jun. 30, 2023 |
Jun. 30, 2022 |
| Fair Value Disclosures [Abstract] |
|
|
|
|
| Fair value, beginning balance |
|
|
$ 700,000
|
$ 1,630,681
|
| Payment |
|
|
(700,000)
|
(1,018,333)
|
| Change in fair value |
|
$ 52,301
|
|
116,505
|
| Fair value, ending balance |
|
$ 728,853
|
|
$ 728,853
|
| X |
- DefinitionAdjustment to fair value of contingent consideration earnout.
| Name: |
INLX_AdjustmentToFairValueOfContingentConsiderationEarnout |
| Namespace Prefix: |
INLX_ |
| Data Type: |
xbrli:monetaryItemType |
| Balance Type: |
debit |
| Period Type: |
duration |
|
| X |
- DefinitionPayment for contingent consideration earnout.
| Name: |
INLX_PaymentForContingentConsiderationEarnout |
| Namespace Prefix: |
INLX_ |
| Data Type: |
xbrli:monetaryItemType |
| Balance Type: |
debit |
| Period Type: |
duration |
|
| X |
- References
+ Details
| Name: |
us-gaap_FairValueDisclosuresAbstract |
| Namespace Prefix: |
us-gaap_ |
| Data Type: |
xbrli:stringItemType |
| Balance Type: |
na |
| Period Type: |
duration |
|
v3.23.2
| X |
- References
+ Details
| Name: |
us-gaap_FairValueDisclosuresAbstract |
| Namespace Prefix: |
us-gaap_ |
| Data Type: |
xbrli:stringItemType |
| Balance Type: |
na |
| Period Type: |
duration |
|
| X |
- DefinitionDescription of uncertainty of fair value measurement from use of unobservable input, including, but not limited to, inter-relationships among inputs used in fair value measurement. Reference 1: http://fasb.org/us-gaap/role/ref/legacyRef
-Name Accounting Standards Codification
-Section 50
-Paragraph 2
-Subparagraph (g)
-SubTopic 10
-Topic 820
-Publisher FASB
-URI https://asc.fasb.org//1943274/2147482106/820-10-50-2
| Name: |
us-gaap_FairValueMeasurementsSensitivityAnalysisDescription |
| Namespace Prefix: |
us-gaap_ |
| Data Type: |
xbrli:stringItemType |
| Balance Type: |
na |
| Period Type: |
duration |
|
v3.23.2
Schedule of Property and Equipment (Details) - USD ($)
|
Jun. 30, 2023 |
Dec. 31, 2022 |
| Property, Plant and Equipment [Abstract] |
|
|
| Computer hardware and purchased software |
$ 1,661,438
|
$ 1,595,652
|
| Leasehold improvements |
395,919
|
395,918
|
| Furniture and fixtures |
71,325
|
71,325
|
| Property and equipment, gross |
2,128,682
|
2,062,895
|
| Less: accumulated depreciation |
(1,103,906)
|
(994,189)
|
| Property and equipment, net |
$ 1,024,776
|
$ 1,068,706
|
| X |
- DefinitionAmount of accumulated depreciation, depletion and amortization for physical assets used in the normal conduct of business to produce goods and services. Reference 1: http://www.xbrl.org/2003/role/disclosureRef
-Topic 944
-SubTopic 210
-Name Accounting Standards Codification
-Section S99
-Paragraph 1
-Subparagraph (SX 210.7-03(a)(8)(b))
-Publisher FASB
-URI https://asc.fasb.org//1943274/2147479440/944-210-S99-1
Reference 2: http://www.xbrl.org/2003/role/disclosureRef
-Topic 210
-SubTopic 10
-Name Accounting Standards Codification
-Section S99
-Paragraph 1
-Subparagraph (SX 210.5-02(14))
-Publisher FASB
-URI https://asc.fasb.org//1943274/2147480566/210-10-S99-1
Reference 3: http://fasb.org/us-gaap/role/ref/legacyRef
-Name Accounting Standards Codification
-Topic 360
-SubTopic 10
-Section 50
-Paragraph 1
-Subparagraph (c)
-Publisher FASB
-URI https://asc.fasb.org//1943274/2147482099/360-10-50-1
| Name: |
us-gaap_AccumulatedDepreciationDepletionAndAmortizationPropertyPlantAndEquipment |
| Namespace Prefix: |
us-gaap_ |
| Data Type: |
xbrli:monetaryItemType |
| Balance Type: |
credit |
| Period Type: |
instant |
|
| X |
- DefinitionAmount before accumulated amortization of capitalized costs for computer software, including but not limited to, acquired and internally developed computer software. Reference 1: http://www.xbrl.org/2009/role/commonPracticeRef
-Topic 985
-SubTopic 20
-Name Accounting Standards Codification
-Section 50
-Paragraph 1
-Publisher FASB
-URI https://asc.fasb.org//1943274/2147481283/985-20-50-1
| Name: |
us-gaap_CapitalizedComputerSoftwareGross |
| Namespace Prefix: |
us-gaap_ |
| Data Type: |
xbrli:monetaryItemType |
| Balance Type: |
debit |
| Period Type: |
instant |
|
| X |
- DefinitionAmount before accumulated depreciation of equipment commonly used in offices and stores that have no permanent connection to the structure of a building or utilities. Examples include, but are not limited to, desks, chairs, tables, and bookcases. Reference 1: http://fasb.org/us-gaap/role/ref/legacyRef
-Topic 360
-SubTopic 10
-Name Accounting Standards Codification
-Section 50
-Paragraph 1
-Subparagraph (b)
-Publisher FASB
-URI https://asc.fasb.org//1943274/2147482099/360-10-50-1
| Name: |
us-gaap_FurnitureAndFixturesGross |
| Namespace Prefix: |
us-gaap_ |
| Data Type: |
xbrli:monetaryItemType |
| Balance Type: |
debit |
| Period Type: |
instant |
|
| X |
- DefinitionAmount before accumulated depreciation of additions or improvements to assets held under a lease arrangement. Reference 1: http://fasb.org/us-gaap/role/ref/legacyRef
-Topic 360
-SubTopic 10
-Name Accounting Standards Codification
-Section 50
-Paragraph 1
-Subparagraph (b)
-Publisher FASB
-URI https://asc.fasb.org//1943274/2147482099/360-10-50-1
| Name: |
us-gaap_LeaseholdImprovementsGross |
| Namespace Prefix: |
us-gaap_ |
| Data Type: |
xbrli:monetaryItemType |
| Balance Type: |
debit |
| Period Type: |
instant |
|
| X |
- References
+ Details
| Name: |
us-gaap_PropertyPlantAndEquipmentAbstract |
| Namespace Prefix: |
us-gaap_ |
| Data Type: |
xbrli:stringItemType |
| Balance Type: |
na |
| Period Type: |
duration |
|
| X |
- DefinitionAmount before accumulated depreciation, depletion and amortization of physical assets used in the normal conduct of business and not intended for resale. Examples include, but are not limited to, land, buildings, machinery and equipment, office equipment, and furniture and fixtures. Reference 1: http://www.xbrl.org/2003/role/disclosureRef
-Topic 944
-SubTopic 210
-Name Accounting Standards Codification
-Section S99
-Paragraph 1
-Subparagraph (SX 210.7-03(a)(8))
-Publisher FASB
-URI https://asc.fasb.org//1943274/2147479440/944-210-S99-1
Reference 2: http://www.xbrl.org/2003/role/disclosureRef
-Topic 210
-SubTopic 10
-Name Accounting Standards Codification
-Section S99
-Paragraph 1
-Subparagraph (SX 210.5-02(13))
-Publisher FASB
-URI https://asc.fasb.org//1943274/2147480566/210-10-S99-1
Reference 3: http://fasb.org/us-gaap/role/ref/legacyRef
-Topic 360
-SubTopic 10
-Name Accounting Standards Codification
-Section 50
-Paragraph 1
-Subparagraph (b)
-Publisher FASB
-URI https://asc.fasb.org//1943274/2147482099/360-10-50-1
| Name: |
us-gaap_PropertyPlantAndEquipmentGross |
| Namespace Prefix: |
us-gaap_ |
| Data Type: |
xbrli:monetaryItemType |
| Balance Type: |
debit |
| Period Type: |
instant |
|
| X |
- DefinitionAmount after accumulated depreciation, depletion and amortization of physical assets used in the normal conduct of business to produce goods and services and not intended for resale. Examples include, but are not limited to, land, buildings, machinery and equipment, office equipment, and furniture and fixtures. Reference 1: http://fasb.org/us-gaap/role/ref/legacyRef
-Name Accounting Standards Codification
-Section 50
-Paragraph 1
-SubTopic 10
-Topic 360
-Publisher FASB
-URI https://asc.fasb.org//1943274/2147482099/360-10-50-1
Reference 2: http://www.xbrl.org/2003/role/exampleRef
-Topic 852
-SubTopic 10
-Name Accounting Standards Codification
-Section 55
-Paragraph 10
-Publisher FASB
-URI https://asc.fasb.org//1943274/2147481372/852-10-55-10
Reference 3: http://www.xbrl.org/2003/role/disclosureRef
-Topic 944
-SubTopic 210
-Name Accounting Standards Codification
-Section S99
-Paragraph 1
-Subparagraph (SX 210.7-03(a)(8))
-Publisher FASB
-URI https://asc.fasb.org//1943274/2147479440/944-210-S99-1
Reference 4: http://www.xbrl.org/2003/role/disclosureRef
-Topic 942
-SubTopic 360
-Name Accounting Standards Codification
-Section 50
-Paragraph 1
-Publisher FASB
-URI https://asc.fasb.org//1943274/2147480842/942-360-50-1
| Name: |
us-gaap_PropertyPlantAndEquipmentNet |
| Namespace Prefix: |
us-gaap_ |
| Data Type: |
xbrli:monetaryItemType |
| Balance Type: |
debit |
| Period Type: |
instant |
|
v3.23.2
| X |
- DefinitionThe amount of expense recognized in the current period that reflects the allocation of the cost of tangible assets over the assets' useful lives. Includes production and non-production related depreciation. Reference 1: http://fasb.org/us-gaap/role/ref/legacyRef
-Name Accounting Standards Codification
-Section 45
-Paragraph 28
-Subparagraph (b)
-SubTopic 10
-Topic 230
-Publisher FASB
-URI https://asc.fasb.org//1943274/2147482740/230-10-45-28
Reference 2: http://fasb.org/us-gaap/role/ref/legacyRef
-Name Accounting Standards Codification
-Topic 360
-SubTopic 10
-Section 50
-Paragraph 1
-Subparagraph (a)
-Publisher FASB
-URI https://asc.fasb.org//1943274/2147482099/360-10-50-1
| Name: |
us-gaap_Depreciation |
| Namespace Prefix: |
us-gaap_ |
| Data Type: |
xbrli:monetaryItemType |
| Balance Type: |
debit |
| Period Type: |
duration |
|
| X |
- References
+ Details
| Name: |
us-gaap_PropertyPlantAndEquipmentAbstract |
| Namespace Prefix: |
us-gaap_ |
| Data Type: |
xbrli:stringItemType |
| Balance Type: |
na |
| Period Type: |
duration |
|
v3.23.2
Schedule of Notes Payable (Details) - USD ($)
|
6 Months Ended |
|
Jun. 30, 2023 |
Dec. 31, 2022 |
| Debt Instrument [Line Items] |
|
|
| Less current portion |
$ (709,083)
|
$ (936,966)
|
| 2022 Unrelated Notes [Member] |
|
|
| Debt Instrument [Line Items] |
|
|
| Issue Date |
Apr. 01, 2022
|
|
| Interest Date |
12.00%
|
|
| Interest Due |
Quarterly
|
|
| Principal Due |
Mar. 30, 2025
|
|
| 2020 Notes [Member] |
|
|
| Debt Instrument [Line Items] |
|
|
| Issue Date |
Mar. 02, 2020
|
|
| Interest Date |
12.00%
|
|
| Interest Due |
Quarterly
|
|
| Principal Due |
Aug. 31, 2023
|
|
| Nonrelated Party [Member] |
|
|
| Debt Instrument [Line Items] |
|
|
| Notes payable – “2022 Related Note” |
$ 3,082,000
|
3,344,950
|
| Less unamortized debt issuance costs |
(221,511)
|
(300,904)
|
| Less unamortized debt discount |
(4,267)
|
(22,045)
|
| Less current portion |
(709,083)
|
(936,966)
|
| Long-term portion of notes payable |
2,147,139
|
2,085,035
|
| Related Party [Member] |
|
|
| Debt Instrument [Line Items] |
|
|
| Less unamortized debt issuance costs |
(55,157)
|
(70,916)
|
| Long-term portion of notes payable |
544,843
|
529,084
|
| Related Party [Member] | 2022 Related Notes [Member] |
|
|
| Debt Instrument [Line Items] |
|
|
| Notes payable – “2022 Related Note” |
600,000
|
600,000
|
| 2022 Unrelated Notes [Member] | Nonrelated Party [Member] |
|
|
| Debt Instrument [Line Items] |
|
|
| Notes payable – “2022 Related Note” |
2,364,500
|
2,364,500
|
| 2020 Notes [Member] | Nonrelated Party [Member] |
|
|
| Debt Instrument [Line Items] |
|
|
| Notes payable – “2022 Related Note” |
$ 717,500
|
$ 980,450
|
| X |
- DefinitionContractual interest rate for funds borrowed, under the debt agreement. Reference 1: http://www.xbrl.org/2003/role/disclosureRef
-Topic 470
-SubTopic 20
-Name Accounting Standards Codification
-Section 50
-Paragraph 1B
-Subparagraph (b)
-Publisher FASB
-URI https://asc.fasb.org//1943274/2147481139/470-20-50-1B
Reference 2: http://fasb.org/us-gaap/role/ref/legacyRef
-Name Accounting Standards Codification
-Topic 210
-SubTopic 10
-Section S99
-Paragraph 1
-Subparagraph (SX 210.5-02.22(a)(1))
-Publisher FASB
-URI https://asc.fasb.org//1943274/2147480566/210-10-S99-1
| Name: |
us-gaap_DebtInstrumentInterestRateStatedPercentage |
| Namespace Prefix: |
us-gaap_ |
| Data Type: |
dtr-types:percentItemType |
| Balance Type: |
na |
| Period Type: |
instant |
|
| X |
- DefinitionDate the debt instrument was issued, in YYYY-MM-DD format. Reference 1: http://fasb.org/us-gaap/role/ref/legacyRef
-Name Accounting Standards Codification
-Section S99
-Paragraph 1
-Subparagraph (SX 210.5-02.22(a))
-SubTopic 10
-Topic 210
-Publisher FASB
-URI https://asc.fasb.org//1943274/2147480566/210-10-S99-1
Reference 2: http://www.xbrl.org/2009/role/commonPracticeRef
-Topic 470
-SubTopic 20
-Name Accounting Standards Codification
-Section 50
-Paragraph 1B
-Subparagraph (d)
-Publisher FASB
-URI https://asc.fasb.org//1943274/2147481139/470-20-50-1B
| Name: |
us-gaap_DebtInstrumentIssuanceDate1 |
| Namespace Prefix: |
us-gaap_ |
| Data Type: |
xbrli:dateItemType |
| Balance Type: |
na |
| Period Type: |
duration |
|
| X |
- DefinitionLine items represent financial concepts included in a table. These concepts are used to disclose reportable information associated with domain members defined in one or many axes to the table. Reference 1: http://www.xbrl.org/2003/role/disclosureRef
-Topic 835
-SubTopic 30
-Name Accounting Standards Codification
-Section 50
-Paragraph 1
-Publisher FASB
-URI https://asc.fasb.org//1943274/2147482900/835-30-50-1
Reference 2: http://www.xbrl.org/2009/role/commonPracticeRef
-Topic 235
-SubTopic 10
-Name Accounting Standards Codification
-Section S99
-Paragraph 1
-Subparagraph (SX 210.4-08(f))
-Publisher FASB
-URI https://asc.fasb.org//1943274/2147480678/235-10-S99-1
Reference 3: http://www.xbrl.org/2003/role/disclosureRef
-Topic 235
-SubTopic 10
-Name Accounting Standards Codification
-Section S99
-Paragraph 3
-Subparagraph (SX 210.12-04(a))
-Publisher FASB
-URI https://asc.fasb.org//1943274/2147480678/235-10-S99-3
Reference 4: http://www.xbrl.org/2003/role/disclosureRef
-Topic 470
-SubTopic 20
-Name Accounting Standards Codification
-Section 50
-Paragraph 1B
-Subparagraph (a)
-Publisher FASB
-URI https://asc.fasb.org//1943274/2147481139/470-20-50-1B
Reference 5: http://www.xbrl.org/2003/role/exampleRef
-Topic 470
-SubTopic 20
-Name Accounting Standards Codification
-Section 55
-Paragraph 69B
-Publisher FASB
-URI https://asc.fasb.org//1943274/2147481568/470-20-55-69B
Reference 6: http://www.xbrl.org/2003/role/exampleRef
-Topic 470
-SubTopic 20
-Name Accounting Standards Codification
-Section 55
-Paragraph 69C
-Publisher FASB
-URI https://asc.fasb.org//1943274/2147481568/470-20-55-69C
Reference 7: http://www.xbrl.org/2003/role/exampleRef
-Topic 470
-SubTopic 20
-Name Accounting Standards Codification
-Section 55
-Paragraph 69E
-Publisher FASB
-URI https://asc.fasb.org//1943274/2147481568/470-20-55-69E
Reference 8: http://www.xbrl.org/2003/role/exampleRef
-Topic 470
-SubTopic 20
-Name Accounting Standards Codification
-Section 55
-Paragraph 69F
-Publisher FASB
-URI https://asc.fasb.org//1943274/2147481568/470-20-55-69F
Reference 9: http://www.xbrl.org/2003/role/disclosureRef
-Topic 470
-SubTopic 20
-Name Accounting Standards Codification
-Section 50
-Paragraph 1B
-Subparagraph (b)
-Publisher FASB
-URI https://asc.fasb.org//1943274/2147481139/470-20-50-1B
Reference 10: http://www.xbrl.org/2003/role/disclosureRef
-Topic 470
-SubTopic 20
-Name Accounting Standards Codification
-Section 50
-Paragraph 1B
-Subparagraph (c)
-Publisher FASB
-URI https://asc.fasb.org//1943274/2147481139/470-20-50-1B
Reference 11: http://www.xbrl.org/2003/role/exampleRef
-Topic 470
-SubTopic 20
-Name Accounting Standards Codification
-Section 50
-Paragraph 1B
-Subparagraph (d)
-Publisher FASB
-URI https://asc.fasb.org//1943274/2147481139/470-20-50-1B
Reference 12: http://www.xbrl.org/2003/role/disclosureRef
-Topic 470
-SubTopic 20
-Name Accounting Standards Codification
-Section 50
-Paragraph 1B
-Subparagraph (e)
-Publisher FASB
-URI https://asc.fasb.org//1943274/2147481139/470-20-50-1B
Reference 13: http://www.xbrl.org/2003/role/disclosureRef
-Topic 470
-SubTopic 20
-Name Accounting Standards Codification
-Section 50
-Paragraph 1B
-Subparagraph (f)
-Publisher FASB
-URI https://asc.fasb.org//1943274/2147481139/470-20-50-1B
Reference 14: http://www.xbrl.org/2003/role/disclosureRef
-Topic 470
-SubTopic 20
-Name Accounting Standards Codification
-Section 50
-Paragraph 1B
-Subparagraph (h)
-Publisher FASB
-URI https://asc.fasb.org//1943274/2147481139/470-20-50-1B
Reference 15: http://www.xbrl.org/2003/role/disclosureRef
-Topic 470
-SubTopic 20
-Name Accounting Standards Codification
-Section 50
-Paragraph 1D
-Subparagraph (a)
-Publisher FASB
-URI https://asc.fasb.org//1943274/2147481139/470-20-50-1D
Reference 16: http://www.xbrl.org/2003/role/disclosureRef
-Topic 470
-SubTopic 20
-Name Accounting Standards Codification
-Section 50
-Paragraph 1D
-Subparagraph (b)
-Publisher FASB
-URI https://asc.fasb.org//1943274/2147481139/470-20-50-1D
Reference 17: http://www.xbrl.org/2003/role/disclosureRef
-Topic 470
-SubTopic 20
-Name Accounting Standards Codification
-Section 50
-Paragraph 1D
-Subparagraph (c)
-Publisher FASB
-URI https://asc.fasb.org//1943274/2147481139/470-20-50-1D
Reference 18: http://www.xbrl.org/2003/role/disclosureRef
-Topic 470
-SubTopic 20
-Name Accounting Standards Codification
-Section 50
-Paragraph 1E
-Subparagraph (a)
-Publisher FASB
-URI https://asc.fasb.org//1943274/2147481139/470-20-50-1E
Reference 19: http://www.xbrl.org/2003/role/disclosureRef
-Topic 470
-SubTopic 20
-Name Accounting Standards Codification
-Section 50
-Paragraph 1E
-Subparagraph (c)
-Publisher FASB
-URI https://asc.fasb.org//1943274/2147481139/470-20-50-1E
Reference 20: http://www.xbrl.org/2003/role/disclosureRef
-Topic 470
-SubTopic 20
-Name Accounting Standards Codification
-Section 50
-Paragraph 1E
-Subparagraph (d)
-Publisher FASB
-URI https://asc.fasb.org//1943274/2147481139/470-20-50-1E
Reference 21: http://www.xbrl.org/2003/role/disclosureRef
-Topic 470
-SubTopic 20
-Name Accounting Standards Codification
-Section 50
-Paragraph 1F
-Subparagraph (a)
-Publisher FASB
-URI https://asc.fasb.org//1943274/2147481139/470-20-50-1F
Reference 22: http://www.xbrl.org/2003/role/disclosureRef
-Topic 470
-SubTopic 20
-Name Accounting Standards Codification
-Section 50
-Paragraph 1F
-Subparagraph (b)
-Publisher FASB
-URI https://asc.fasb.org//1943274/2147481139/470-20-50-1F
Reference 23: http://www.xbrl.org/2003/role/disclosureRef
-Topic 470
-SubTopic 20
-Name Accounting Standards Codification
-Section 50
-Paragraph 1F
-Subparagraph (b)(1)
-Publisher FASB
-URI https://asc.fasb.org//1943274/2147481139/470-20-50-1F
Reference 24: http://www.xbrl.org/2003/role/disclosureRef
-Topic 470
-SubTopic 20
-Name Accounting Standards Codification
-Section 50
-Paragraph 1F
-Subparagraph (b)(2)
-Publisher FASB
-URI https://asc.fasb.org//1943274/2147481139/470-20-50-1F
Reference 25: http://www.xbrl.org/2003/role/disclosureRef
-Topic 470
-SubTopic 20
-Name Accounting Standards Codification
-Section 50
-Paragraph 1I
-Subparagraph (c)
-Publisher FASB
-URI https://asc.fasb.org//1943274/2147481139/470-20-50-1I
| Name: |
us-gaap_DebtInstrumentLineItems |
| Namespace Prefix: |
us-gaap_ |
| Data Type: |
xbrli:stringItemType |
| Balance Type: |
na |
| Period Type: |
duration |
|
| X |
- DefinitionDate when the debt instrument is scheduled to be fully repaid, in YYYY-MM-DD format. Reference 1: http://www.xbrl.org/2003/role/exampleRef
-Topic 470
-SubTopic 20
-Name Accounting Standards Codification
-Section 50
-Paragraph 1B
-Subparagraph (d)
-Publisher FASB
-URI https://asc.fasb.org//1943274/2147481139/470-20-50-1B
Reference 2: http://www.xbrl.org/2009/role/commonPracticeRef
-Topic 820
-SubTopic 10
-Name Accounting Standards Codification
-Section 50
-Paragraph 2
-Subparagraph (bbb)(2)
-Publisher FASB
-URI https://asc.fasb.org//1943274/2147482106/820-10-50-2
Reference 3: http://www.xbrl.org/2003/role/disclosureRef
-Name Accounting Standards Codification
-Section S99
-Paragraph 1
-Subparagraph (SX 210.5-02.22(a)(2))
-SubTopic 10
-Topic 210
-Publisher FASB
-URI https://asc.fasb.org//1943274/2147480566/210-10-S99-1
| Name: |
us-gaap_DebtInstrumentMaturityDate |
| Namespace Prefix: |
us-gaap_ |
| Data Type: |
xbrli:dateItemType |
| Balance Type: |
na |
| Period Type: |
duration |
|
| X |
- DefinitionDescription of the maturity date of the debt instrument including whether the debt matures serially and, if so, a brief description of the serial maturities. Reference 1: http://fasb.org/us-gaap/role/ref/legacyRef
-Name Accounting Standards Codification
-Topic 210
-SubTopic 10
-Section S99
-Paragraph 1
-Subparagraph (SX 210.5-02.22(a)(2))
-Publisher FASB
-URI https://asc.fasb.org//1943274/2147480566/210-10-S99-1
| Name: |
us-gaap_DebtInstrumentMaturityDateDescription |
| Namespace Prefix: |
us-gaap_ |
| Data Type: |
xbrli:stringItemType |
| Balance Type: |
na |
| Period Type: |
duration |
|
| X |
- DefinitionAmount, after accumulated amortization, of debt discount. Reference 1: http://fasb.org/us-gaap/role/ref/legacyRef
-Name Accounting Standards Codification
-Topic 835
-SubTopic 30
-Section 45
-Paragraph 1A
-Publisher FASB
-URI https://asc.fasb.org//1943274/2147482925/835-30-45-1A
Reference 2: http://fasb.org/us-gaap/role/ref/legacyRef
-Name Accounting Standards Codification
-Topic 835
-SubTopic 30
-Section 55
-Paragraph 8
-Publisher FASB
-URI https://asc.fasb.org//1943274/2147482949/835-30-55-8
Reference 3: http://www.xbrl.org/2009/role/commonPracticeRef
-Topic 470
-SubTopic 20
-Name Accounting Standards Codification
-Section 50
-Paragraph 1D
-Subparagraph (a)
-Publisher FASB
-URI https://asc.fasb.org//1943274/2147481139/470-20-50-1D
| Name: |
us-gaap_DebtInstrumentUnamortizedDiscount |
| Namespace Prefix: |
us-gaap_ |
| Data Type: |
xbrli:monetaryItemType |
| Balance Type: |
debit |
| Period Type: |
instant |
|
| X |
- DefinitionCarrying value as of the balance sheet date of notes payable (with maturities initially due after one year or beyond the operating cycle if longer), excluding current portion. Reference 1: http://fasb.org/us-gaap/role/ref/legacyRef
-Name Accounting Standards Codification
-Topic 210
-SubTopic 10
-Section S99
-Paragraph 1
-Subparagraph (SX 210.5-02.22)
-Publisher FASB
-URI https://asc.fasb.org//1943274/2147480566/210-10-S99-1
| Name: |
us-gaap_LongTermNotesPayable |
| Namespace Prefix: |
us-gaap_ |
| Data Type: |
xbrli:monetaryItemType |
| Balance Type: |
credit |
| Period Type: |
instant |
|
| X |
- DefinitionIncluding the current and noncurrent portions, aggregate carrying amount of all types of notes payable, as of the balance sheet date, with initial maturities beyond one year or beyond the normal operating cycle, if longer. Reference 1: http://fasb.org/us-gaap/role/ref/legacyRef
-Name Accounting Standards Codification
-Section S99
-Paragraph 1
-Subparagraph (SX 210.5-02(22))
-SubTopic 10
-Topic 210
-Publisher FASB
-URI https://asc.fasb.org//1943274/2147480566/210-10-S99-1
Reference 2: http://www.xbrl.org/2009/role/commonPracticeRef
-Topic 944
-SubTopic 210
-Name Accounting Standards Codification
-Section S99
-Paragraph 1
-Subparagraph (SX 210.7-03(a)(16)(a)(2))
-Publisher FASB
-URI https://asc.fasb.org//1943274/2147479440/944-210-S99-1
Reference 3: http://fasb.org/us-gaap/role/ref/legacyRef
-Topic 942
-SubTopic 210
-Name Accounting Standards Codification
-Section S99
-Paragraph 1
-Subparagraph (SX 210.9-03(16))
-Publisher FASB
-URI https://asc.fasb.org//1943274/2147479853/942-210-S99-1
| Name: |
us-gaap_NotesPayable |
| Namespace Prefix: |
us-gaap_ |
| Data Type: |
xbrli:monetaryItemType |
| Balance Type: |
credit |
| Period Type: |
instant |
|
| X |
- DefinitionSum of the carrying values as of the balance sheet date of the portions of long-term notes payable due within one year or the operating cycle if longer. Reference 1: http://fasb.org/us-gaap/role/ref/legacyRef
-Name Accounting Standards Codification
-Topic 210
-SubTopic 10
-Section S99
-Paragraph 1
-Subparagraph (SX 210.5-02.19,20)
-Publisher FASB
-URI https://asc.fasb.org//1943274/2147480566/210-10-S99-1
| Name: |
us-gaap_NotesPayableCurrent |
| Namespace Prefix: |
us-gaap_ |
| Data Type: |
xbrli:monetaryItemType |
| Balance Type: |
credit |
| Period Type: |
instant |
|
| X |
- DefinitionThe remaining balance of debt issuance expenses that were capitalized and are being amortized against income over the lives of the respective bond issues. This does not include the amounts capitalized as part of the cost of the utility plant or asset.
| Name: |
us-gaap_UnamortizedDebtIssuanceExpense |
| Namespace Prefix: |
us-gaap_ |
| Data Type: |
xbrli:monetaryItemType |
| Balance Type: |
debit |
| Period Type: |
instant |
|
| X |
- Details
| Name: |
us-gaap_DebtInstrumentAxis=INLX_TwoThousandTwentyNotesMember |
| Namespace Prefix: |
|
| Data Type: |
na |
| Balance Type: |
|
| Period Type: |
|
|
| X |
- Details
| Name: |
us-gaap_LongtermDebtTypeAxis=INLX_TwoThousandTwentyNotesMember |
| Namespace Prefix: |
|
| Data Type: |
na |
| Balance Type: |
|
| Period Type: |
|
|
v3.23.2
| X |
- DefinitionLine items represent financial concepts included in a table. These concepts are used to disclose reportable information associated with domain members defined in one or many axes to the table.
| Name: |
us-gaap_DefinedBenefitPlanDisclosureLineItems |
| Namespace Prefix: |
us-gaap_ |
| Data Type: |
xbrli:stringItemType |
| Balance Type: |
na |
| Period Type: |
duration |
|
| X |
- DefinitionAmount, after deduction of unamortized premium (discount) and debt issuance cost, of long-term debt. Excludes lease obligation. Reference 1: http://fasb.org/us-gaap/role/ref/legacyRef
-Name Accounting Standards Codification
-Section S99
-Paragraph 1
-Subparagraph (SX 210.5-02(22))
-SubTopic 10
-Topic 210
-Publisher FASB
-URI https://asc.fasb.org//1943274/2147480566/210-10-S99-1
Reference 2: http://www.xbrl.org/2003/role/exampleRef
-Topic 470
-SubTopic 20
-Name Accounting Standards Codification
-Section 55
-Paragraph 69B
-Publisher FASB
-URI https://asc.fasb.org//1943274/2147481568/470-20-55-69B
Reference 3: http://www.xbrl.org/2003/role/exampleRef
-Topic 470
-SubTopic 20
-Name Accounting Standards Codification
-Section 55
-Paragraph 69C
-Publisher FASB
-URI https://asc.fasb.org//1943274/2147481568/470-20-55-69C
Reference 4: http://www.xbrl.org/2003/role/disclosureRef
-Topic 470
-SubTopic 20
-Name Accounting Standards Codification
-Section 50
-Paragraph 1D
-Subparagraph (b)
-Publisher FASB
-URI https://asc.fasb.org//1943274/2147481139/470-20-50-1D
Reference 5: http://www.xbrl.org/2009/role/commonPracticeRef
-Topic 944
-SubTopic 210
-Name Accounting Standards Codification
-Section S99
-Paragraph 1
-Subparagraph (SX 210.7-03(a)(16)(a)(2))
-Publisher FASB
-URI https://asc.fasb.org//1943274/2147479440/944-210-S99-1
Reference 6: http://fasb.org/us-gaap/role/ref/legacyRef
-Topic 942
-SubTopic 210
-Name Accounting Standards Codification
-Section S99
-Paragraph 1
-Subparagraph (SX 210.9-03(16))
-Publisher FASB
-URI https://asc.fasb.org//1943274/2147479853/942-210-S99-1
Reference 7: http://www.xbrl.org/2003/role/disclosureRef
-Topic 470
-SubTopic 20
-Name Accounting Standards Codification
-Section 50
-Paragraph 4
-Subparagraph (b)(3)
-Publisher FASB
-URI https://asc.fasb.org//1943274/2147481139/470-20-50-4
| Name: |
us-gaap_LongTermDebt |
| Namespace Prefix: |
us-gaap_ |
| Data Type: |
xbrli:monetaryItemType |
| Balance Type: |
credit |
| Period Type: |
instant |
|
| X |
- DefinitionAmount of long-term debt payable, sinking fund requirement, and other securities issued that are redeemable by holder at fixed or determinable price and date, maturing in next fiscal year following current fiscal year. Excludes interim and annual periods when interim periods are reported from current statement of financial position date (rolling approach). Reference 1: http://www.xbrl.org/2003/role/disclosureRef
-Topic 235
-SubTopic 10
-Name Accounting Standards Codification
-Section S99
-Paragraph 3
-Subparagraph (SX 210.12-04(a))
-Publisher FASB
-URI https://asc.fasb.org//1943274/2147480678/235-10-S99-3
Reference 2: http://www.xbrl.org/2003/role/disclosureRef
-Topic 470
-SubTopic 20
-Name Accounting Standards Codification
-Section 50
-Paragraph 1E
-Subparagraph (d)
-Publisher FASB
-URI https://asc.fasb.org//1943274/2147481139/470-20-50-1E
Reference 3: http://fasb.org/us-gaap/role/ref/legacyRef
-Name Accounting Standards Codification
-Section 50
-Paragraph 1
-SubTopic 10
-Topic 470
-Publisher FASB
-URI https://asc.fasb.org//1943274/2147481544/470-10-50-1
| Name: |
us-gaap_LongTermDebtMaturitiesRepaymentsOfPrincipalInNextTwelveMonths |
| Namespace Prefix: |
us-gaap_ |
| Data Type: |
xbrli:monetaryItemType |
| Balance Type: |
credit |
| Period Type: |
instant |
|
| X |
- DefinitionAmount of long-term debt payable, sinking fund requirement, and other securities issued that are redeemable by holder at fixed or determinable price and date, maturing in second fiscal year following current fiscal year. Excludes interim and annual periods when interim periods are reported from current statement of financial position date (rolling approach). Reference 1: http://www.xbrl.org/2003/role/disclosureRef
-Topic 235
-SubTopic 10
-Name Accounting Standards Codification
-Section S99
-Paragraph 3
-Subparagraph (SX 210.12-04(a))
-Publisher FASB
-URI https://asc.fasb.org//1943274/2147480678/235-10-S99-3
Reference 2: http://www.xbrl.org/2003/role/disclosureRef
-Topic 470
-SubTopic 20
-Name Accounting Standards Codification
-Section 50
-Paragraph 1E
-Subparagraph (d)
-Publisher FASB
-URI https://asc.fasb.org//1943274/2147481139/470-20-50-1E
Reference 3: http://fasb.org/us-gaap/role/ref/legacyRef
-Name Accounting Standards Codification
-Section 50
-Paragraph 1
-SubTopic 10
-Topic 470
-Publisher FASB
-URI https://asc.fasb.org//1943274/2147481544/470-10-50-1
| Name: |
us-gaap_LongTermDebtMaturitiesRepaymentsOfPrincipalInYearTwo |
| Namespace Prefix: |
us-gaap_ |
| Data Type: |
xbrli:monetaryItemType |
| Balance Type: |
credit |
| Period Type: |
instant |
|
v3.23.2
Notes Payable – Unrelated Parties (Details Narrative) - USD ($)
|
|
3 Months Ended |
6 Months Ended |
|
Mar. 02, 2020 |
Jun. 30, 2023 |
Jun. 30, 2022 |
Jun. 30, 2023 |
Jun. 30, 2022 |
Dec. 31, 2022 |
| Short-Term Debt [Line Items] |
|
|
|
|
|
|
| Accrued interest |
|
$ 0
|
|
$ 0
|
|
$ 0
|
| Interest expense debt |
|
136,136
|
$ 287,741
|
214,589
|
$ 327,190
|
|
| Amortization of debt discount |
|
|
|
17,778
|
53,332
|
|
| Accredited Investors [Member] | 12% Subordinated Notes [Member] |
|
|
|
|
|
|
| Short-Term Debt [Line Items] |
|
|
|
|
|
|
| Interest expense debt |
|
$ 6,400
|
$ 17,778
|
$ 26,667
|
$ 53,333
|
|
| Amortization of debt discount |
$ 320,000
|
|
|
|
|
|
| New issues, shares |
80,000
|
|
|
|
|
|
| X |
- DefinitionAmount of noncash expense included in interest expense to amortize debt discount and premium associated with the related debt instruments. Excludes amortization of financing costs. Alternate captions include noncash interest expense. Reference 1: http://fasb.org/us-gaap/role/ref/legacyRef
-Name Accounting Standards Codification
-Section 45
-Paragraph 28
-Subparagraph (b)
-SubTopic 10
-Topic 230
-Publisher FASB
-URI https://asc.fasb.org//1943274/2147482740/230-10-45-28
Reference 2: http://www.xbrl.org/2003/role/disclosureRef
-Topic 470
-SubTopic 20
-Name Accounting Standards Codification
-Section 50
-Paragraph 1F
-Subparagraph (b)(2)
-Publisher FASB
-URI https://asc.fasb.org//1943274/2147481139/470-20-50-1F
Reference 3: http://fasb.org/us-gaap/role/ref/legacyRef
-Name Accounting Standards Codification
-Topic 835
-SubTopic 30
-Section 45
-Paragraph 1A
-Publisher FASB
-URI https://asc.fasb.org//1943274/2147482925/835-30-45-1A
Reference 4: http://fasb.org/us-gaap/role/ref/legacyRef
-Topic 220
-SubTopic 10
-Name Accounting Standards Codification
-Section S99
-Paragraph 2
-Subparagraph (SX 210.5-03.8)
-Publisher FASB
-URI https://asc.fasb.org//1943274/2147483621/220-10-S99-2
| Name: |
us-gaap_AmortizationOfDebtDiscountPremium |
| Namespace Prefix: |
us-gaap_ |
| Data Type: |
xbrli:monetaryItemType |
| Balance Type: |
debit |
| Period Type: |
duration |
|
| X |
- DefinitionAmount of the cost of borrowed funds accounted for as interest expense for debt. Reference 1: http://www.xbrl.org/2003/role/exampleRef
-Topic 470
-SubTopic 20
-Name Accounting Standards Codification
-Section 55
-Paragraph 69E
-Publisher FASB
-URI https://asc.fasb.org//1943274/2147481568/470-20-55-69E
Reference 2: http://www.xbrl.org/2003/role/exampleRef
-Topic 470
-SubTopic 20
-Name Accounting Standards Codification
-Section 55
-Paragraph 69F
-Publisher FASB
-URI https://asc.fasb.org//1943274/2147481568/470-20-55-69F
Reference 3: http://www.xbrl.org/2003/role/disclosureRef
-Topic 470
-SubTopic 20
-Name Accounting Standards Codification
-Section 50
-Paragraph 1F
-Subparagraph (b)
-Publisher FASB
-URI https://asc.fasb.org//1943274/2147481139/470-20-50-1F
Reference 4: http://fasb.org/us-gaap/role/ref/legacyRef
-Topic 220
-SubTopic 10
-Name Accounting Standards Codification
-Section S99
-Paragraph 2
-Subparagraph (SX 210.5-03.8)
-Publisher FASB
-URI https://asc.fasb.org//1943274/2147483621/220-10-S99-2
Reference 5: http://www.xbrl.org/2003/role/disclosureRef
-Topic 470
-SubTopic 20
-Name Accounting Standards Codification
-Section 50
-Paragraph 6
-Subparagraph (b)
-Publisher FASB
-URI https://asc.fasb.org//1943274/2147481139/470-20-50-6
| Name: |
us-gaap_InterestExpenseDebt |
| Namespace Prefix: |
us-gaap_ |
| Data Type: |
xbrli:monetaryItemType |
| Balance Type: |
debit |
| Period Type: |
duration |
|
| X |
- DefinitionAmount of interest payable on debt, including, but not limited to, trade payables. Reference 1: http://www.xbrl.org/2009/role/commonPracticeRef
-Topic 944
-SubTopic 210
-Name Accounting Standards Codification
-Section S99
-Paragraph 1
-Subparagraph (SX 210.7-03(a)(15)(a))
-Publisher FASB
-URI https://asc.fasb.org//1943274/2147479440/944-210-S99-1
Reference 2: http://fasb.org/us-gaap/role/ref/legacyRef
-Name Accounting Standards Codification
-Topic 942
-SubTopic 210
-Section S99
-Paragraph 1
-Subparagraph (SX 210.9-03.15(5))
-Publisher FASB
-URI https://asc.fasb.org//1943274/2147479853/942-210-S99-1
| Name: |
us-gaap_InterestPayableCurrentAndNoncurrent |
| Namespace Prefix: |
us-gaap_ |
| Data Type: |
xbrli:monetaryItemType |
| Balance Type: |
credit |
| Period Type: |
instant |
|
| X |
- DefinitionLine items represent financial concepts included in a table. These concepts are used to disclose reportable information associated with domain members defined in one or many axes to the table.
| Name: |
us-gaap_ShortTermDebtLineItems |
| Namespace Prefix: |
us-gaap_ |
| Data Type: |
xbrli:stringItemType |
| Balance Type: |
na |
| Period Type: |
duration |
|
| X |
- DefinitionNumber of new stock issued during the period. Reference 1: http://fasb.org/us-gaap/role/ref/legacyRef
-Name Accounting Standards Codification
-Section 50
-Paragraph 2
-SubTopic 10
-Topic 505
-Publisher FASB
-URI https://asc.fasb.org//1943274/2147481112/505-10-50-2
Reference 2: http://www.xbrl.org/2003/role/disclosureRef
-Topic 946
-SubTopic 505
-Name Accounting Standards Codification
-Section 50
-Paragraph 2
-Subparagraph (a)
-Publisher FASB
-URI https://asc.fasb.org//1943274/2147481004/946-505-50-2
Reference 3: http://www.xbrl.org/2003/role/disclosureRef
-Topic 946
-SubTopic 220
-Name Accounting Standards Codification
-Section S99
-Paragraph 3
-Subparagraph (SX 210.6-09(4)(b))
-Publisher FASB
-URI https://asc.fasb.org//1943274/2147483575/946-220-S99-3
Reference 4: http://www.xbrl.org/2003/role/disclosureRef
-Topic 946
-SubTopic 10
-Name Accounting Standards Codification
-Section S99
-Paragraph 3
-Subparagraph (SX 210.6-03(i)(1))
-Publisher FASB
-URI https://asc.fasb.org//1943274/2147479886/946-10-S99-3
Reference 5: http://fasb.org/us-gaap/role/ref/legacyRef
-Topic 210
-SubTopic 10
-Name Accounting Standards Codification
-Section S99
-Paragraph 1
-Subparagraph (SX 210.5-02(28))
-Publisher FASB
-URI https://asc.fasb.org//1943274/2147480566/210-10-S99-1
Reference 6: http://fasb.org/us-gaap/role/ref/legacyRef
-Topic 505
-SubTopic 10
-Name Accounting Standards Codification
-Section S99
-Paragraph 1
-Subparagraph (SX 210.3-04)
-Publisher FASB
-URI https://asc.fasb.org//1943274/2147480008/505-10-S99-1
Reference 7: http://fasb.org/us-gaap/role/ref/legacyRef
-Topic 210
-SubTopic 10
-Name Accounting Standards Codification
-Section S99
-Paragraph 1
-Subparagraph (SX 210.5-02(29))
-Publisher FASB
-URI https://asc.fasb.org//1943274/2147480566/210-10-S99-1
| Name: |
us-gaap_StockIssuedDuringPeriodSharesNewIssues |
| Namespace Prefix: |
us-gaap_ |
| Data Type: |
xbrli:sharesItemType |
| Balance Type: |
na |
| Period Type: |
duration |
|
| X |
- Details
| Name: |
srt_TitleOfIndividualAxis=INLX_AccreditedInvestorsMember |
| Namespace Prefix: |
|
| Data Type: |
na |
| Balance Type: |
|
| Period Type: |
|
|
| X |
- Details
| Name: |
us-gaap_DebtInstrumentAxis=INLX_TwelvePercentageSubordinatedNotesMember |
| Namespace Prefix: |
|
| Data Type: |
na |
| Balance Type: |
|
| Period Type: |
|
|
v3.23.2
Notes Payable - Related Parties (Details Narrative) - USD ($)
|
3 Months Ended |
6 Months Ended |
|
Jun. 30, 2023 |
Jun. 30, 2022 |
Jun. 30, 2023 |
Jun. 30, 2022 |
Dec. 31, 2022 |
| Related Party Transaction [Line Items] |
|
|
|
|
|
| Accrued interest |
$ 0
|
|
$ 0
|
|
$ 0
|
| Interest Expense, Debt |
136,136
|
$ 287,741
|
214,589
|
$ 327,190
|
|
| Interest Expense |
160,654
|
$ 240,468
|
332,090
|
353,069
|
|
| Related Party [Member] |
|
|
|
|
|
| Related Party Transaction [Line Items] |
|
|
|
|
|
| Accrued interest |
$ 0
|
|
0
|
|
$ 0
|
| Interest Expense, Debt |
|
|
$ 25,880
|
51,759
|
|
| Interest Expense |
|
|
|
$ 25,879
|
|
| X |
- DefinitionAmount of the cost of borrowed funds accounted for as interest expense. Reference 1: http://www.xbrl.org/2003/role/exampleRef
-Topic 946
-SubTopic 830
-Name Accounting Standards Codification
-Section 55
-Paragraph 10
-Publisher FASB
-URI https://asc.fasb.org//1943274/2147480167/946-830-55-10
Reference 2: http://www.xbrl.org/2009/role/commonPracticeRef
-Topic 946
-SubTopic 220
-Name Accounting Standards Codification
-Section 45
-Paragraph 3
-Subparagraph (i)
-Publisher FASB
-URI https://asc.fasb.org//1943274/2147483581/946-220-45-3
Reference 3: http://www.xbrl.org/2003/role/disclosureRef
-Topic 946
-SubTopic 220
-Name Accounting Standards Codification
-Section S99
-Paragraph 1
-Subparagraph (SX 210.6-07(3))
-Publisher FASB
-URI https://asc.fasb.org//1943274/2147483575/946-220-S99-1
Reference 4: http://www.xbrl.org/2003/role/disclosureRef
-Topic 280
-SubTopic 10
-Name Accounting Standards Codification
-Section 50
-Paragraph 22
-Subparagraph (d)
-Publisher FASB
-URI https://asc.fasb.org//1943274/2147482810/280-10-50-22
Reference 5: http://fasb.org/us-gaap/role/ref/legacyRef
-Name Accounting Standards Codification
-Topic 835
-SubTopic 30
-Section 45
-Paragraph 3
-Publisher FASB
-URI https://asc.fasb.org//1943274/2147482925/835-30-45-3
Reference 6: http://fasb.org/us-gaap/role/ref/legacyRef
-Topic 942
-SubTopic 220
-Name Accounting Standards Codification
-Section S99
-Paragraph 1
-Subparagraph (SX 210.9-04.9)
-Publisher FASB
-URI https://asc.fasb.org//1943274/2147483589/942-220-S99-1
Reference 7: http://www.xbrl.org/2003/role/disclosureRef
-Topic 220
-SubTopic 10
-Name Accounting Standards Codification
-Section S99
-Paragraph 2
-Subparagraph (210.5-03(11))
-Publisher FASB
-URI https://asc.fasb.org//1943274/2147483621/220-10-S99-2
Reference 8: http://www.xbrl.org/2003/role/disclosureRef
-Topic 835
-SubTopic 20
-Name Accounting Standards Codification
-Section 50
-Paragraph 1
-Subparagraph (a)
-Publisher FASB
-URI https://asc.fasb.org//1943274/2147483013/835-20-50-1
| Name: |
us-gaap_InterestExpense |
| Namespace Prefix: |
us-gaap_ |
| Data Type: |
xbrli:monetaryItemType |
| Balance Type: |
debit |
| Period Type: |
duration |
|
| X |
- DefinitionAmount of the cost of borrowed funds accounted for as interest expense for debt. Reference 1: http://www.xbrl.org/2003/role/exampleRef
-Topic 470
-SubTopic 20
-Name Accounting Standards Codification
-Section 55
-Paragraph 69E
-Publisher FASB
-URI https://asc.fasb.org//1943274/2147481568/470-20-55-69E
Reference 2: http://www.xbrl.org/2003/role/exampleRef
-Topic 470
-SubTopic 20
-Name Accounting Standards Codification
-Section 55
-Paragraph 69F
-Publisher FASB
-URI https://asc.fasb.org//1943274/2147481568/470-20-55-69F
Reference 3: http://www.xbrl.org/2003/role/disclosureRef
-Topic 470
-SubTopic 20
-Name Accounting Standards Codification
-Section 50
-Paragraph 1F
-Subparagraph (b)
-Publisher FASB
-URI https://asc.fasb.org//1943274/2147481139/470-20-50-1F
Reference 4: http://fasb.org/us-gaap/role/ref/legacyRef
-Topic 220
-SubTopic 10
-Name Accounting Standards Codification
-Section S99
-Paragraph 2
-Subparagraph (SX 210.5-03.8)
-Publisher FASB
-URI https://asc.fasb.org//1943274/2147483621/220-10-S99-2
Reference 5: http://www.xbrl.org/2003/role/disclosureRef
-Topic 470
-SubTopic 20
-Name Accounting Standards Codification
-Section 50
-Paragraph 6
-Subparagraph (b)
-Publisher FASB
-URI https://asc.fasb.org//1943274/2147481139/470-20-50-6
| Name: |
us-gaap_InterestExpenseDebt |
| Namespace Prefix: |
us-gaap_ |
| Data Type: |
xbrli:monetaryItemType |
| Balance Type: |
debit |
| Period Type: |
duration |
|
| X |
- DefinitionAmount of interest payable on debt, including, but not limited to, trade payables. Reference 1: http://www.xbrl.org/2009/role/commonPracticeRef
-Topic 944
-SubTopic 210
-Name Accounting Standards Codification
-Section S99
-Paragraph 1
-Subparagraph (SX 210.7-03(a)(15)(a))
-Publisher FASB
-URI https://asc.fasb.org//1943274/2147479440/944-210-S99-1
Reference 2: http://fasb.org/us-gaap/role/ref/legacyRef
-Name Accounting Standards Codification
-Topic 942
-SubTopic 210
-Section S99
-Paragraph 1
-Subparagraph (SX 210.9-03.15(5))
-Publisher FASB
-URI https://asc.fasb.org//1943274/2147479853/942-210-S99-1
| Name: |
us-gaap_InterestPayableCurrentAndNoncurrent |
| Namespace Prefix: |
us-gaap_ |
| Data Type: |
xbrli:monetaryItemType |
| Balance Type: |
credit |
| Period Type: |
instant |
|
v3.23.2
| X |
- DefinitionThe increase (decrease) during the reporting period in the obligation created by employee agreements whereby earned compensation will be paid in the future. Reference 1: http://fasb.org/us-gaap/role/ref/legacyRef
-Name Accounting Standards Codification
-Section 45
-Paragraph 28
-Subparagraph (a)
-SubTopic 10
-Topic 230
-Publisher FASB
-URI https://asc.fasb.org//1943274/2147482740/230-10-45-28
| Name: |
us-gaap_IncreaseDecreaseInDeferredCompensation |
| Namespace Prefix: |
us-gaap_ |
| Data Type: |
xbrli:monetaryItemType |
| Balance Type: |
debit |
| Period Type: |
duration |
|
v3.23.2
Schedule of Operating Leases (Details)
|
6 Months Ended |
|
Jun. 30, 2023
USD ($)
ft²
|
|---|
| Product Liability Contingency [Line Items] |
|
| Vehichle rent expense |
$ 2,708
|
| Lease Expiry |
September 30, 2028
|
| Columbus O H [Member] |
|
| Product Liability Contingency [Line Items] |
|
| Land | ft² |
6,000
|
| Vehichle rent expense |
$ 5,100
|
| Lease Expiry |
December 31, 2028
|
| Madison Heights M I [Member] |
|
| Product Liability Contingency [Line Items] |
|
| Land | ft² |
36,000
|
| Vehichle rent expense |
$ 43,185
|
| Lease Expiry |
August 31, 2026
|
| Sterling Heights M I [Member] |
|
| Product Liability Contingency [Line Items] |
|
| Land | ft² |
37,000
|
| Vehichle rent expense |
$ 21,072
|
| Lease Expiry |
April 30, 2028
|
| Traverse City M I [Member] |
|
| Product Liability Contingency [Line Items] |
|
| Land | ft² |
5,200
|
| Vehichle rent expense |
$ 4,500
|
| Lease Expiry |
January 31, 2024
|
| Madison Heights M I Temporary Space [Member] |
|
| Product Liability Contingency [Line Items] |
|
| Land | ft² |
3,200
|
| Vehichle rent expense |
$ 1,605
|
| Lease Expiry |
month to month
|
| X |
- DefinitionDescription of terms and conditions of option to terminate lessee's operating lease. Includes, but is not limited to, information about option recognized as part of right-of-use asset and lease liability. Reference 1: http://www.xbrl.org/2003/role/disclosureRef
-Topic 842
-SubTopic 20
-Name Accounting Standards Codification
-Section 50
-Paragraph 3
-Subparagraph (a)(3)
-Publisher FASB
-URI https://asc.fasb.org//1943274/2147478964/842-20-50-3
| Name: |
us-gaap_LesseeOperatingLeaseOptionToTerminate |
| Namespace Prefix: |
us-gaap_ |
| Data Type: |
xbrli:stringItemType |
| Balance Type: |
na |
| Period Type: |
duration |
|
| X |
- DefinitionCash payments to lessor's for use of assets under operating leases. Reference 1: http://fasb.org/us-gaap/role/ref/legacyRef
-Name Accounting Standards Codification
-Section 45
-Paragraph 25
-Subparagraph (g)
-SubTopic 10
-Topic 230
-Publisher FASB
-URI https://asc.fasb.org//1943274/2147482740/230-10-45-25
| Name: |
us-gaap_PaymentsForRent |
| Namespace Prefix: |
us-gaap_ |
| Data Type: |
xbrli:monetaryItemType |
| Balance Type: |
credit |
| Period Type: |
duration |
|
| X |
- DefinitionLine items represent financial concepts included in a table. These concepts are used to disclose reportable information associated with domain members defined in one or many axes to the table. Reference 1: http://www.xbrl.org/2003/role/disclosureRef
-Topic 450
-SubTopic 20
-Name Accounting Standards Codification
-Section S99
-Paragraph 1
-Subparagraph (SAB Topic 5.Y.Q2)
-Publisher FASB
-URI https://asc.fasb.org//1943274/2147480102/450-20-S99-1
Reference 2: http://www.xbrl.org/2009/role/commonPracticeRef
-Topic 450
-SubTopic 20
-Name Accounting Standards Codification
-Section 50
-Paragraph 1
-Publisher FASB
-URI https://asc.fasb.org//1943274/2147483076/450-20-50-1
Reference 3: http://www.xbrl.org/2009/role/commonPracticeRef
-Topic 450
-SubTopic 20
-Name Accounting Standards Codification
-Section 50
-Paragraph 4
-Subparagraph (b)
-Publisher FASB
-URI https://asc.fasb.org//1943274/2147483076/450-20-50-4
Reference 4: http://www.xbrl.org/2009/role/commonPracticeRef
-Topic 450
-SubTopic 20
-Name Accounting Standards Codification
-Section 50
-Paragraph 9
-Subparagraph (b)
-Publisher FASB
-URI https://asc.fasb.org//1943274/2147483076/450-20-50-9
| Name: |
us-gaap_ProductLiabilityContingencyLineItems |
| Namespace Prefix: |
us-gaap_ |
| Data Type: |
xbrli:stringItemType |
| Balance Type: |
na |
| Period Type: |
duration |
|
| X |
- Details
| Name: |
srt_StatementGeographicalAxis=INLX_ColumbusOHMember |
| Namespace Prefix: |
|
| Data Type: |
na |
| Balance Type: |
|
| Period Type: |
|
|
| X |
- Details
| Name: |
srt_StatementGeographicalAxis=INLX_MadisonHeightsMIMember |
| Namespace Prefix: |
|
| Data Type: |
na |
| Balance Type: |
|
| Period Type: |
|
|
| X |
- Details
| Name: |
srt_StatementGeographicalAxis=INLX_SterlingHeightsMIMember |
| Namespace Prefix: |
|
| Data Type: |
na |
| Balance Type: |
|
| Period Type: |
|
|
| X |
- Details
| Name: |
srt_StatementGeographicalAxis=INLX_TraverseCityMIMember |
| Namespace Prefix: |
|
| Data Type: |
na |
| Balance Type: |
|
| Period Type: |
|
|
| X |
- Details
| Name: |
srt_StatementGeographicalAxis=INLX_MadisonHeightsMITemporarySpaceMember |
| Namespace Prefix: |
|
| Data Type: |
na |
| Balance Type: |
|
| Period Type: |
|
|
v3.23.2
Schedule of Future Rental Payments for Operating Leases (Details) - USD ($)
|
Jun. 30, 2023 |
Dec. 31, 2022 |
| Commitments and Contingencies Disclosure [Abstract] |
|
|
| Finance lease, 2024 |
$ 41,259
|
|
| Operating Leases, 2024 |
930,559
|
|
| Finance lease, 2025 |
41,259
|
|
| Operating Leases, 2025 |
891,357
|
|
| Finance lease, 2026 |
41,259
|
|
| Operating Leases, 2026 |
901,152
|
|
| Finance lease, 2027 |
41,259
|
|
| Operating Leases, 2027 |
443,008
|
|
| Finance lease, 2028 |
39,243
|
|
| Operating Leases, 2028 |
311,010
|
|
| Thereafter |
8,299
|
|
| Thereafter |
35,100
|
|
| Less Imputed interest |
(38,395)
|
|
| Less Imputed interest |
(488,818)
|
|
| Less Short-term lease payments |
(4,813)
|
|
| Finance Lease |
174,183
|
$ 155,624
|
| Operating Leases |
$ 3,018,555
|
$ 3,316,682
|
| X |
- References
+ Details
| Name: |
us-gaap_CommitmentsAndContingenciesDisclosureAbstract |
| Namespace Prefix: |
us-gaap_ |
| Data Type: |
xbrli:stringItemType |
| Balance Type: |
na |
| Period Type: |
duration |
|
| X |
- DefinitionPresent value of lessee's discounted obligation for lease payments from finance lease. Reference 1: http://www.xbrl.org/2003/role/disclosureRef
-Topic 842
-SubTopic 20
-Name Accounting Standards Codification
-Section 50
-Paragraph 6
-Publisher FASB
-URI https://asc.fasb.org//1943274/2147478964/842-20-50-6
Reference 2: http://www.xbrl.org/2003/role/disclosureRef
-Topic 842
-SubTopic 20
-Name Accounting Standards Codification
-Section 45
-Paragraph 1
-Subparagraph (b)
-Publisher FASB
-URI https://asc.fasb.org//1943274/2147479041/842-20-45-1
| Name: |
us-gaap_FinanceLeaseLiability |
| Namespace Prefix: |
us-gaap_ |
| Data Type: |
xbrli:monetaryItemType |
| Balance Type: |
credit |
| Period Type: |
instant |
|
| X |
- DefinitionAmount of lessee's undiscounted obligation for lease payment for finance lease to be paid after fifth fiscal year following current fiscal year. Excludes interim and annual periods when interim periods are reported from current statement of financial position date (rolling approach). Reference 1: http://www.xbrl.org/2003/role/disclosureRef
-Topic 842
-SubTopic 20
-Name Accounting Standards Codification
-Section 50
-Paragraph 6
-Publisher FASB
-URI https://asc.fasb.org//1943274/2147478964/842-20-50-6
| Name: |
us-gaap_FinanceLeaseLiabilityPaymentsDueAfterYearFive |
| Namespace Prefix: |
us-gaap_ |
| Data Type: |
xbrli:monetaryItemType |
| Balance Type: |
credit |
| Period Type: |
instant |
|
| X |
- DefinitionAmount of lessee's undiscounted obligation for lease payment for finance lease to be paid in next fiscal year following current fiscal year. Excludes interim and annual periods when interim periods are reported from current statement of financial position date (rolling approach). Reference 1: http://www.xbrl.org/2003/role/disclosureRef
-Topic 842
-SubTopic 20
-Name Accounting Standards Codification
-Section 50
-Paragraph 6
-Publisher FASB
-URI https://asc.fasb.org//1943274/2147478964/842-20-50-6
| Name: |
us-gaap_FinanceLeaseLiabilityPaymentsDueNextTwelveMonths |
| Namespace Prefix: |
us-gaap_ |
| Data Type: |
xbrli:monetaryItemType |
| Balance Type: |
credit |
| Period Type: |
instant |
|
| X |
- DefinitionAmount of lessee's undiscounted obligation for lease payment for finance lease to be paid in fifth fiscal year following current fiscal year. Excludes interim and annual periods when interim periods are reported from current statement of financial position date (rolling approach). Reference 1: http://www.xbrl.org/2003/role/disclosureRef
-Topic 842
-SubTopic 20
-Name Accounting Standards Codification
-Section 50
-Paragraph 6
-Publisher FASB
-URI https://asc.fasb.org//1943274/2147478964/842-20-50-6
| Name: |
us-gaap_FinanceLeaseLiabilityPaymentsDueYearFive |
| Namespace Prefix: |
us-gaap_ |
| Data Type: |
xbrli:monetaryItemType |
| Balance Type: |
credit |
| Period Type: |
instant |
|
| X |
- DefinitionAmount of lessee's undiscounted obligation for lease payment for finance lease to be paid in fourth fiscal year following current fiscal year. Excludes interim and annual periods when interim periods are reported from current statement of financial position date (rolling approach). Reference 1: http://www.xbrl.org/2003/role/disclosureRef
-Topic 842
-SubTopic 20
-Name Accounting Standards Codification
-Section 50
-Paragraph 6
-Publisher FASB
-URI https://asc.fasb.org//1943274/2147478964/842-20-50-6
| Name: |
us-gaap_FinanceLeaseLiabilityPaymentsDueYearFour |
| Namespace Prefix: |
us-gaap_ |
| Data Type: |
xbrli:monetaryItemType |
| Balance Type: |
credit |
| Period Type: |
instant |
|
| X |
- DefinitionAmount of lessee's undiscounted obligation for lease payment for finance lease to be paid in third fiscal year following current fiscal year. Excludes interim and annual periods when interim periods are reported from current statement of financial position date (rolling approach). Reference 1: http://www.xbrl.org/2003/role/disclosureRef
-Topic 842
-SubTopic 20
-Name Accounting Standards Codification
-Section 50
-Paragraph 6
-Publisher FASB
-URI https://asc.fasb.org//1943274/2147478964/842-20-50-6
| Name: |
us-gaap_FinanceLeaseLiabilityPaymentsDueYearThree |
| Namespace Prefix: |
us-gaap_ |
| Data Type: |
xbrli:monetaryItemType |
| Balance Type: |
credit |
| Period Type: |
instant |
|
| X |
- DefinitionAmount of lessee's undiscounted obligation for lease payment for finance lease to be paid in second fiscal year following current fiscal year. Excludes interim and annual periods when interim periods are reported from current statement of financial position date (rolling approach). Reference 1: http://www.xbrl.org/2003/role/disclosureRef
-Topic 842
-SubTopic 20
-Name Accounting Standards Codification
-Section 50
-Paragraph 6
-Publisher FASB
-URI https://asc.fasb.org//1943274/2147478964/842-20-50-6
| Name: |
us-gaap_FinanceLeaseLiabilityPaymentsDueYearTwo |
| Namespace Prefix: |
us-gaap_ |
| Data Type: |
xbrli:monetaryItemType |
| Balance Type: |
credit |
| Period Type: |
instant |
|
| X |
- DefinitionAmount of lessee's undiscounted obligation for lease payments in excess of discounted obligation for lease payments for finance lease. Reference 1: http://www.xbrl.org/2003/role/disclosureRef
-Topic 842
-SubTopic 20
-Name Accounting Standards Codification
-Section 50
-Paragraph 6
-Publisher FASB
-URI https://asc.fasb.org//1943274/2147478964/842-20-50-6
| Name: |
us-gaap_FinanceLeaseLiabilityUndiscountedExcessAmount |
| Namespace Prefix: |
us-gaap_ |
| Data Type: |
xbrli:monetaryItemType |
| Balance Type: |
credit |
| Period Type: |
instant |
|
| X |
- DefinitionAmount of lessee's undiscounted obligation for lease payment for operating lease due after fifth fiscal year following current fiscal year. Excludes interim and annual periods when interim periods are reported from current statement of financial position date (rolling approach). Reference 1: http://www.xbrl.org/2003/role/disclosureRef
-Topic 842
-SubTopic 20
-Name Accounting Standards Codification
-Section 50
-Paragraph 6
-Publisher FASB
-URI https://asc.fasb.org//1943274/2147478964/842-20-50-6
| Name: |
us-gaap_LesseeOperatingLeaseLiabilityPaymentsDueAfterYearFive |
| Namespace Prefix: |
us-gaap_ |
| Data Type: |
xbrli:monetaryItemType |
| Balance Type: |
credit |
| Period Type: |
instant |
|
| X |
- DefinitionAmount of lessee's undiscounted obligation for lease payment for operating lease to be paid in next fiscal year following current fiscal year. Excludes interim and annual periods when interim periods are reported from current statement of financial position date (rolling approach). Reference 1: http://www.xbrl.org/2003/role/disclosureRef
-Topic 842
-SubTopic 20
-Name Accounting Standards Codification
-Section 50
-Paragraph 6
-Publisher FASB
-URI https://asc.fasb.org//1943274/2147478964/842-20-50-6
| Name: |
us-gaap_LesseeOperatingLeaseLiabilityPaymentsDueNextTwelveMonths |
| Namespace Prefix: |
us-gaap_ |
| Data Type: |
xbrli:monetaryItemType |
| Balance Type: |
credit |
| Period Type: |
instant |
|
| X |
- DefinitionAmount of lessee's undiscounted obligation for lease payment for operating lease to be paid in fifth fiscal year following current fiscal year. Excludes interim and annual periods when interim periods are reported from current statement of financial position date (rolling approach). Reference 1: http://www.xbrl.org/2003/role/disclosureRef
-Topic 842
-SubTopic 20
-Name Accounting Standards Codification
-Section 50
-Paragraph 6
-Publisher FASB
-URI https://asc.fasb.org//1943274/2147478964/842-20-50-6
| Name: |
us-gaap_LesseeOperatingLeaseLiabilityPaymentsDueYearFive |
| Namespace Prefix: |
us-gaap_ |
| Data Type: |
xbrli:monetaryItemType |
| Balance Type: |
credit |
| Period Type: |
instant |
|
| X |
- DefinitionAmount of lessee's undiscounted obligation for lease payment for operating lease to be paid in fourth fiscal year following current fiscal year. Excludes interim and annual periods when interim periods are reported from current statement of financial position date (rolling approach). Reference 1: http://www.xbrl.org/2003/role/disclosureRef
-Topic 842
-SubTopic 20
-Name Accounting Standards Codification
-Section 50
-Paragraph 6
-Publisher FASB
-URI https://asc.fasb.org//1943274/2147478964/842-20-50-6
| Name: |
us-gaap_LesseeOperatingLeaseLiabilityPaymentsDueYearFour |
| Namespace Prefix: |
us-gaap_ |
| Data Type: |
xbrli:monetaryItemType |
| Balance Type: |
credit |
| Period Type: |
instant |
|
| X |
- DefinitionAmount of lessee's undiscounted obligation for lease payment for operating lease to be paid in third fiscal year following current fiscal year. Excludes interim and annual periods when interim periods are reported from current statement of financial position date (rolling approach). Reference 1: http://www.xbrl.org/2003/role/disclosureRef
-Topic 842
-SubTopic 20
-Name Accounting Standards Codification
-Section 50
-Paragraph 6
-Publisher FASB
-URI https://asc.fasb.org//1943274/2147478964/842-20-50-6
| Name: |
us-gaap_LesseeOperatingLeaseLiabilityPaymentsDueYearThree |
| Namespace Prefix: |
us-gaap_ |
| Data Type: |
xbrli:monetaryItemType |
| Balance Type: |
credit |
| Period Type: |
instant |
|
| X |
- DefinitionAmount of lessee's undiscounted obligation for lease payment for operating lease to be paid in second fiscal year following current fiscal year. Excludes interim and annual periods when interim periods are reported from current statement of financial position date (rolling approach). Reference 1: http://www.xbrl.org/2003/role/disclosureRef
-Topic 842
-SubTopic 20
-Name Accounting Standards Codification
-Section 50
-Paragraph 6
-Publisher FASB
-URI https://asc.fasb.org//1943274/2147478964/842-20-50-6
| Name: |
us-gaap_LesseeOperatingLeaseLiabilityPaymentsDueYearTwo |
| Namespace Prefix: |
us-gaap_ |
| Data Type: |
xbrli:monetaryItemType |
| Balance Type: |
credit |
| Period Type: |
instant |
|
| X |
- DefinitionAmount of lessee's undiscounted obligation for lease payments in excess of discounted obligation for lease payments for operating lease. Reference 1: http://www.xbrl.org/2003/role/disclosureRef
-Topic 842
-SubTopic 20
-Name Accounting Standards Codification
-Section 50
-Paragraph 6
-Publisher FASB
-URI https://asc.fasb.org//1943274/2147478964/842-20-50-6
| Name: |
us-gaap_LesseeOperatingLeaseLiabilityUndiscountedExcessAmount |
| Namespace Prefix: |
us-gaap_ |
| Data Type: |
xbrli:monetaryItemType |
| Balance Type: |
credit |
| Period Type: |
instant |
|
| X |
- DefinitionPresent value of lessee's discounted obligation for lease payments from operating lease. Reference 1: http://www.xbrl.org/2003/role/disclosureRef
-Topic 842
-SubTopic 20
-Name Accounting Standards Codification
-Section 45
-Paragraph 1
-Subparagraph (b)
-Publisher FASB
-URI https://asc.fasb.org//1943274/2147479041/842-20-45-1
| Name: |
us-gaap_OperatingLeaseLiability |
| Namespace Prefix: |
us-gaap_ |
| Data Type: |
xbrli:monetaryItemType |
| Balance Type: |
credit |
| Period Type: |
instant |
|
| X |
- DefinitionAmount of short-term lease commitment. Reference 1: http://www.xbrl.org/2003/role/disclosureRef
-Topic 842
-SubTopic 20
-Name Accounting Standards Codification
-Section 50
-Paragraph 8
-Publisher FASB
-URI https://asc.fasb.org//1943274/2147478964/842-20-50-8
| Name: |
us-gaap_ShortTermLeaseCommitmentAmount |
| Namespace Prefix: |
us-gaap_ |
| Data Type: |
xbrli:monetaryItemType |
| Balance Type: |
debit |
| Period Type: |
instant |
|
v3.23.2
Summary of Components of Lease Expense (Details) - USD ($)
|
3 Months Ended |
6 Months Ended |
Jun. 30, 2023 |
Jun. 30, 2022 |
Jun. 30, 2023 |
Jun. 30, 2022 |
| Finance lease expense: |
|
|
|
|
| Amortization of ROU asset |
$ 8,252
|
|
$ 14,959
|
|
| Interest on lease liabilities |
3,594
|
|
6,426
|
|
| Operating lease expense |
238,864
|
238,487
|
476,312
|
476,975
|
| Short-term lease expense |
$ 4,814
|
$ 4,814
|
$ 9,627
|
$ 9,627
|
| X |
- DefinitionAmount of interest expense on finance lease liability. Reference 1: http://www.xbrl.org/2003/role/exampleRef
-Topic 842
-SubTopic 20
-Name Accounting Standards Codification
-Section 55
-Paragraph 53
-Publisher FASB
-URI https://asc.fasb.org//1943274/2147479589/842-20-55-53
Reference 2: http://www.xbrl.org/2003/role/disclosureRef
-Topic 842
-SubTopic 20
-Name Accounting Standards Codification
-Section 45
-Paragraph 4
-Subparagraph (a)
-Publisher FASB
-URI https://asc.fasb.org//1943274/2147479041/842-20-45-4
Reference 3: http://www.xbrl.org/2003/role/disclosureRef
-Topic 842
-SubTopic 20
-Name Accounting Standards Codification
-Section 50
-Paragraph 4
-Subparagraph (a)
-Publisher FASB
-URI https://asc.fasb.org//1943274/2147478964/842-20-50-4
| Name: |
us-gaap_FinanceLeaseInterestExpense |
| Namespace Prefix: |
us-gaap_ |
| Data Type: |
xbrli:monetaryItemType |
| Balance Type: |
debit |
| Period Type: |
duration |
|
| X |
- DefinitionAmount of amortization expense attributable to right-of-use asset from finance lease. Reference 1: http://www.xbrl.org/2003/role/exampleRef
-Topic 842
-SubTopic 20
-Name Accounting Standards Codification
-Section 55
-Paragraph 53
-Publisher FASB
-URI https://asc.fasb.org//1943274/2147479589/842-20-55-53
Reference 2: http://www.xbrl.org/2003/role/disclosureRef
-Topic 842
-SubTopic 20
-Name Accounting Standards Codification
-Section 45
-Paragraph 4
-Subparagraph (a)
-Publisher FASB
-URI https://asc.fasb.org//1943274/2147479041/842-20-45-4
Reference 3: http://www.xbrl.org/2003/role/disclosureRef
-Topic 842
-SubTopic 20
-Name Accounting Standards Codification
-Section 50
-Paragraph 4
-Subparagraph (a)
-Publisher FASB
-URI https://asc.fasb.org//1943274/2147478964/842-20-50-4
| Name: |
us-gaap_FinanceLeaseRightOfUseAssetAmortization |
| Namespace Prefix: |
us-gaap_ |
| Data Type: |
xbrli:monetaryItemType |
| Balance Type: |
debit |
| Period Type: |
duration |
|
| X |
- References
+ Details
| Name: |
us-gaap_LeaseCostAbstract |
| Namespace Prefix: |
us-gaap_ |
| Data Type: |
xbrli:stringItemType |
| Balance Type: |
na |
| Period Type: |
duration |
|
| X |
- DefinitionAmount of single lease cost, calculated by allocation of remaining cost of lease over remaining lease term. Includes, but is not limited to, single lease cost, after impairment of right-of-use asset, calculated by amortization of remaining right-of-use asset and accretion of lease liability. Reference 1: http://www.xbrl.org/2003/role/exampleRef
-Topic 842
-SubTopic 20
-Name Accounting Standards Codification
-Section 55
-Paragraph 53
-Publisher FASB
-URI https://asc.fasb.org//1943274/2147479589/842-20-55-53
Reference 2: http://www.xbrl.org/2003/role/disclosureRef
-Topic 842
-SubTopic 20
-Name Accounting Standards Codification
-Section 50
-Paragraph 4
-Subparagraph (b)
-Publisher FASB
-URI https://asc.fasb.org//1943274/2147478964/842-20-50-4
| Name: |
us-gaap_OperatingLeaseCost |
| Namespace Prefix: |
us-gaap_ |
| Data Type: |
xbrli:monetaryItemType |
| Balance Type: |
debit |
| Period Type: |
duration |
|
| X |
- DefinitionAmount of short-term lease cost, excluding expense for lease with term of one month or less. Reference 1: http://www.xbrl.org/2003/role/exampleRef
-Topic 842
-SubTopic 20
-Name Accounting Standards Codification
-Section 55
-Paragraph 53
-Publisher FASB
-URI https://asc.fasb.org//1943274/2147479589/842-20-55-53
Reference 2: http://www.xbrl.org/2003/role/disclosureRef
-Topic 842
-SubTopic 20
-Name Accounting Standards Codification
-Section 50
-Paragraph 4
-Subparagraph (c)
-Publisher FASB
-URI https://asc.fasb.org//1943274/2147478964/842-20-50-4
| Name: |
us-gaap_ShortTermLeaseCost |
| Namespace Prefix: |
us-gaap_ |
| Data Type: |
xbrli:monetaryItemType |
| Balance Type: |
debit |
| Period Type: |
duration |
|
v3.23.2
| X |
- References
+ Details
| Name: |
us-gaap_CommitmentsAndContingenciesDisclosureAbstract |
| Namespace Prefix: |
us-gaap_ |
| Data Type: |
xbrli:stringItemType |
| Balance Type: |
na |
| Period Type: |
duration |
|
| X |
- DefinitionAmount of interest paid on finance lease liability. Reference 1: http://www.xbrl.org/2003/role/disclosureRef
-Topic 842
-SubTopic 20
-Name Accounting Standards Codification
-Section 50
-Paragraph 4
-Subparagraph (g)(1)
-Publisher FASB
-URI https://asc.fasb.org//1943274/2147478964/842-20-50-4
Reference 2: http://www.xbrl.org/2003/role/disclosureRef
-Topic 842
-SubTopic 20
-Name Accounting Standards Codification
-Section 45
-Paragraph 5
-Subparagraph (b)
-Publisher FASB
-URI https://asc.fasb.org//1943274/2147479041/842-20-45-5
| Name: |
us-gaap_FinanceLeaseInterestPaymentOnLiability |
| Namespace Prefix: |
us-gaap_ |
| Data Type: |
xbrli:monetaryItemType |
| Balance Type: |
credit |
| Period Type: |
duration |
|
| X |
- DefinitionAmount of cash outflow for principal payment on finance lease. Reference 1: http://www.xbrl.org/2003/role/disclosureRef
-Topic 842
-SubTopic 20
-Name Accounting Standards Codification
-Section 50
-Paragraph 4
-Subparagraph (g)(1)
-Publisher FASB
-URI https://asc.fasb.org//1943274/2147478964/842-20-50-4
Reference 2: http://www.xbrl.org/2003/role/disclosureRef
-Topic 842
-SubTopic 20
-Name Accounting Standards Codification
-Section 45
-Paragraph 5
-Subparagraph (a)
-Publisher FASB
-URI https://asc.fasb.org//1943274/2147479041/842-20-45-5
| Name: |
us-gaap_FinanceLeasePrincipalPayments |
| Namespace Prefix: |
us-gaap_ |
| Data Type: |
xbrli:monetaryItemType |
| Balance Type: |
credit |
| Period Type: |
duration |
|
| X |
- DefinitionWeighted average discount rate for finance lease calculated at point in time. Reference 1: http://www.xbrl.org/2003/role/exampleRef
-Topic 842
-SubTopic 20
-Name Accounting Standards Codification
-Section 55
-Paragraph 53
-Publisher FASB
-URI https://asc.fasb.org//1943274/2147479589/842-20-55-53
Reference 2: http://www.xbrl.org/2003/role/disclosureRef
-Topic 842
-SubTopic 20
-Name Accounting Standards Codification
-Section 50
-Paragraph 4
-Subparagraph (g)(4)
-Publisher FASB
-URI https://asc.fasb.org//1943274/2147478964/842-20-50-4
| Name: |
us-gaap_FinanceLeaseWeightedAverageDiscountRatePercent |
| Namespace Prefix: |
us-gaap_ |
| Data Type: |
dtr-types:percentItemType |
| Balance Type: |
na |
| Period Type: |
instant |
|
| X |
- DefinitionWeighted average remaining lease term for finance lease, in 'PnYnMnDTnHnMnS' format, for example, 'P1Y5M13D' represents reported fact of one year, five months, and thirteen days. Reference 1: http://www.xbrl.org/2003/role/exampleRef
-Topic 842
-SubTopic 20
-Name Accounting Standards Codification
-Section 55
-Paragraph 53
-Publisher FASB
-URI https://asc.fasb.org//1943274/2147479589/842-20-55-53
Reference 2: http://www.xbrl.org/2003/role/disclosureRef
-Topic 842
-SubTopic 20
-Name Accounting Standards Codification
-Section 50
-Paragraph 4
-Subparagraph (g)(3)
-Publisher FASB
-URI https://asc.fasb.org//1943274/2147478964/842-20-50-4
| Name: |
us-gaap_FinanceLeaseWeightedAverageRemainingLeaseTerm1 |
| Namespace Prefix: |
us-gaap_ |
| Data Type: |
xbrli:durationItemType |
| Balance Type: |
na |
| Period Type: |
instant |
|
| X |
- DefinitionAmount of cash outflow from operating lease, excluding payments to bring another asset to condition and location necessary for its intended use. Reference 1: http://www.xbrl.org/2003/role/disclosureRef
-Topic 842
-SubTopic 20
-Name Accounting Standards Codification
-Section 45
-Paragraph 5
-Subparagraph (c)
-Publisher FASB
-URI https://asc.fasb.org//1943274/2147479041/842-20-45-5
Reference 2: http://www.xbrl.org/2003/role/disclosureRef
-Topic 842
-SubTopic 20
-Name Accounting Standards Codification
-Section 50
-Paragraph 4
-Subparagraph (g)(1)
-Publisher FASB
-URI https://asc.fasb.org//1943274/2147478964/842-20-50-4
| Name: |
us-gaap_OperatingLeasePayments |
| Namespace Prefix: |
us-gaap_ |
| Data Type: |
xbrli:monetaryItemType |
| Balance Type: |
credit |
| Period Type: |
duration |
|
| X |
- DefinitionWeighted average discount rate for operating lease calculated at point in time. Reference 1: http://www.xbrl.org/2003/role/exampleRef
-Topic 842
-SubTopic 20
-Name Accounting Standards Codification
-Section 55
-Paragraph 53
-Publisher FASB
-URI https://asc.fasb.org//1943274/2147479589/842-20-55-53
Reference 2: http://www.xbrl.org/2003/role/disclosureRef
-Topic 842
-SubTopic 20
-Name Accounting Standards Codification
-Section 50
-Paragraph 4
-Subparagraph (g)(4)
-Publisher FASB
-URI https://asc.fasb.org//1943274/2147478964/842-20-50-4
| Name: |
us-gaap_OperatingLeaseWeightedAverageDiscountRatePercent |
| Namespace Prefix: |
us-gaap_ |
| Data Type: |
dtr-types:percentItemType |
| Balance Type: |
na |
| Period Type: |
instant |
|
| X |
- DefinitionWeighted average remaining lease term for operating lease, in 'PnYnMnDTnHnMnS' format, for example, 'P1Y5M13D' represents reported fact of one year, five months, and thirteen days. Reference 1: http://www.xbrl.org/2003/role/exampleRef
-Topic 842
-SubTopic 20
-Name Accounting Standards Codification
-Section 55
-Paragraph 53
-Publisher FASB
-URI https://asc.fasb.org//1943274/2147479589/842-20-55-53
Reference 2: http://www.xbrl.org/2003/role/disclosureRef
-Topic 842
-SubTopic 20
-Name Accounting Standards Codification
-Section 50
-Paragraph 4
-Subparagraph (g)(3)
-Publisher FASB
-URI https://asc.fasb.org//1943274/2147478964/842-20-50-4
| Name: |
us-gaap_OperatingLeaseWeightedAverageRemainingLeaseTerm1 |
| Namespace Prefix: |
us-gaap_ |
| Data Type: |
xbrli:durationItemType |
| Balance Type: |
na |
| Period Type: |
instant |
|
v3.23.2
Schedule of Operating and Finance Leases (Details) - USD ($)
|
Jun. 30, 2023 |
Dec. 31, 2022 |
| Commitments and Contingencies Disclosure [Abstract] |
|
|
| Right-of-use assets, operating |
$ 2,895,784
|
$ 3,200,191
|
| Lease liabilities, operating – current |
711,229
|
692,074
|
| Lease liabilities, operating – net of current |
2,307,326
|
2,624,608
|
| Total operating lease liabilities |
3,018,555
|
3,316,682
|
| Right-of-use asset, finance |
191,862
|
160,990
|
| Accumulated amortization |
(21,668)
|
(6,708)
|
| Right-of-use asset, finance, net |
170,194
|
154,282
|
| Lease liability, finance – current |
28,303
|
22,493
|
| Lease liability, finance – net of current |
145,880
|
133,131
|
| Total finance lease liability |
$ 174,183
|
$ 155,624
|
| X |
- References
+ Details
| Name: |
us-gaap_CommitmentsAndContingenciesDisclosureAbstract |
| Namespace Prefix: |
us-gaap_ |
| Data Type: |
xbrli:stringItemType |
| Balance Type: |
na |
| Period Type: |
duration |
|
| X |
- DefinitionPresent value of lessee's discounted obligation for lease payments from finance lease. Reference 1: http://www.xbrl.org/2003/role/disclosureRef
-Topic 842
-SubTopic 20
-Name Accounting Standards Codification
-Section 50
-Paragraph 6
-Publisher FASB
-URI https://asc.fasb.org//1943274/2147478964/842-20-50-6
Reference 2: http://www.xbrl.org/2003/role/disclosureRef
-Topic 842
-SubTopic 20
-Name Accounting Standards Codification
-Section 45
-Paragraph 1
-Subparagraph (b)
-Publisher FASB
-URI https://asc.fasb.org//1943274/2147479041/842-20-45-1
| Name: |
us-gaap_FinanceLeaseLiability |
| Namespace Prefix: |
us-gaap_ |
| Data Type: |
xbrli:monetaryItemType |
| Balance Type: |
credit |
| Period Type: |
instant |
|
| X |
- DefinitionPresent value of lessee's discounted obligation for lease payments from finance lease, classified as current. Reference 1: http://www.xbrl.org/2003/role/disclosureRef
-Topic 842
-SubTopic 20
-Name Accounting Standards Codification
-Section 45
-Paragraph 1
-Subparagraph (b)
-Publisher FASB
-URI https://asc.fasb.org//1943274/2147479041/842-20-45-1
| Name: |
us-gaap_FinanceLeaseLiabilityCurrent |
| Namespace Prefix: |
us-gaap_ |
| Data Type: |
xbrli:monetaryItemType |
| Balance Type: |
credit |
| Period Type: |
instant |
|
| X |
- DefinitionPresent value of lessee's discounted obligation for lease payments from finance lease, classified as noncurrent. Reference 1: http://www.xbrl.org/2003/role/disclosureRef
-Topic 842
-SubTopic 20
-Name Accounting Standards Codification
-Section 45
-Paragraph 1
-Subparagraph (b)
-Publisher FASB
-URI https://asc.fasb.org//1943274/2147479041/842-20-45-1
| Name: |
us-gaap_FinanceLeaseLiabilityNoncurrent |
| Namespace Prefix: |
us-gaap_ |
| Data Type: |
xbrli:monetaryItemType |
| Balance Type: |
credit |
| Period Type: |
instant |
|
| X |
- DefinitionAmount, after accumulated amortization, of right-of-use asset from finance lease. Reference 1: http://www.xbrl.org/2003/role/disclosureRef
-Topic 842
-SubTopic 20
-Name Accounting Standards Codification
-Section 45
-Paragraph 1
-Subparagraph (a)
-Publisher FASB
-URI https://asc.fasb.org//1943274/2147479041/842-20-45-1
| Name: |
us-gaap_FinanceLeaseRightOfUseAsset |
| Namespace Prefix: |
us-gaap_ |
| Data Type: |
xbrli:monetaryItemType |
| Balance Type: |
debit |
| Period Type: |
instant |
|
| X |
- DefinitionAmount of accumulated amortization of right-of-use asset from finance lease. Reference 1: http://www.xbrl.org/2009/role/commonPracticeRef
-Name Accounting Standards Codification
-Section 45
-Paragraph 4
-Subparagraph (a)
-SubTopic 20
-Topic 842
-Publisher FASB
-URI https://asc.fasb.org//1943274/2147479041/842-20-45-4
Reference 2: http://www.xbrl.org/2009/role/commonPracticeRef
-Name Accounting Standards Codification
-Section 50
-Paragraph 4
-Subparagraph (a)
-SubTopic 20
-Topic 842
-Publisher FASB
-URI https://asc.fasb.org//1943274/2147478964/842-20-50-4
| Name: |
us-gaap_FinanceLeaseRightOfUseAssetAccumulatedAmortization |
| Namespace Prefix: |
us-gaap_ |
| Data Type: |
xbrli:monetaryItemType |
| Balance Type: |
credit |
| Period Type: |
instant |
|
| X |
- DefinitionAmount, before accumulated amortization, of right-of-use asset from finance lease. Reference 1: http://www.xbrl.org/2009/role/commonPracticeRef
-Name Accounting Standards Codification
-Section 45
-Paragraph 1
-Subparagraph (a)
-SubTopic 20
-Topic 842
-Publisher FASB
-URI https://asc.fasb.org//1943274/2147479041/842-20-45-1
| Name: |
us-gaap_FinanceLeaseRightOfUseAssetBeforeAccumulatedAmortization |
| Namespace Prefix: |
us-gaap_ |
| Data Type: |
xbrli:monetaryItemType |
| Balance Type: |
debit |
| Period Type: |
instant |
|
| X |
- DefinitionPresent value of lessee's discounted obligation for lease payments from operating lease. Reference 1: http://www.xbrl.org/2003/role/disclosureRef
-Topic 842
-SubTopic 20
-Name Accounting Standards Codification
-Section 45
-Paragraph 1
-Subparagraph (b)
-Publisher FASB
-URI https://asc.fasb.org//1943274/2147479041/842-20-45-1
| Name: |
us-gaap_OperatingLeaseLiability |
| Namespace Prefix: |
us-gaap_ |
| Data Type: |
xbrli:monetaryItemType |
| Balance Type: |
credit |
| Period Type: |
instant |
|
| X |
- DefinitionPresent value of lessee's discounted obligation for lease payments from operating lease, classified as current. Reference 1: http://www.xbrl.org/2003/role/disclosureRef
-Topic 842
-SubTopic 20
-Name Accounting Standards Codification
-Section 45
-Paragraph 1
-Subparagraph (b)
-Publisher FASB
-URI https://asc.fasb.org//1943274/2147479041/842-20-45-1
| Name: |
us-gaap_OperatingLeaseLiabilityCurrent |
| Namespace Prefix: |
us-gaap_ |
| Data Type: |
xbrli:monetaryItemType |
| Balance Type: |
credit |
| Period Type: |
instant |
|
| X |
- DefinitionPresent value of lessee's discounted obligation for lease payments from operating lease, classified as noncurrent. Reference 1: http://www.xbrl.org/2003/role/disclosureRef
-Topic 842
-SubTopic 20
-Name Accounting Standards Codification
-Section 45
-Paragraph 1
-Subparagraph (b)
-Publisher FASB
-URI https://asc.fasb.org//1943274/2147479041/842-20-45-1
| Name: |
us-gaap_OperatingLeaseLiabilityNoncurrent |
| Namespace Prefix: |
us-gaap_ |
| Data Type: |
xbrli:monetaryItemType |
| Balance Type: |
credit |
| Period Type: |
instant |
|
| X |
- DefinitionAmount of lessee's right to use underlying asset under operating lease. Reference 1: http://www.xbrl.org/2003/role/disclosureRef
-Topic 842
-SubTopic 20
-Name Accounting Standards Codification
-Section 45
-Paragraph 1
-Subparagraph (a)
-Publisher FASB
-URI https://asc.fasb.org//1943274/2147479041/842-20-45-1
| Name: |
us-gaap_OperatingLeaseRightOfUseAsset |
| Namespace Prefix: |
us-gaap_ |
| Data Type: |
xbrli:monetaryItemType |
| Balance Type: |
debit |
| Period Type: |
instant |
|
v3.23.2
Schedule of Shares and Warrants Issued (Details)
|
6 Months Ended |
|
Jun. 30, 2023
$ / shares
shares
|
|---|
| Private Placement 2022 [Member] |
|
| Subsidiary, Sale of Stock [Line Items] |
|
| Issue Date |
Apr. 01, 2022
|
| Shares issued | shares |
1,242,588
|
| Share price |
$ 4.62
|
| Warrants issued | shares |
124,258
|
| Warrants exercise price |
$ 4.62
|
| Warrants Fair value |
$ 3.91
|
| Private Placement 2020 [Member] |
|
| Subsidiary, Sale of Stock [Line Items] |
|
| Issue Date |
Mar. 02, 2020
|
| Shares issued | shares |
955,000
|
| Share price |
$ 4.00
|
| Warrants issued | shares |
95,500
|
| Warrants exercise price |
$ 4.00
|
| Warrants Fair value |
$ 3.90
|
| X |
- References
+ Details
| Name: |
INLX_ClassOfWarrantOrRightFairPriceOfWarrantsOrRights1 |
| Namespace Prefix: |
INLX_ |
| Data Type: |
dtr-types:perShareItemType |
| Balance Type: |
na |
| Period Type: |
instant |
|
| X |
- DefinitionDate the warrants or rights are exercisable, in YYYY-MM-DD format. Reference 1: http://www.xbrl.org/2003/role/disclosureRef
-Topic 505
-SubTopic 10
-Name Accounting Standards Codification
-Section 50
-Paragraph 3
-Publisher FASB
-URI https://asc.fasb.org//1943274/2147481112/505-10-50-3
| Name: |
us-gaap_ClassOfWarrantOrRighstDateFromWhichWarrantsOrRightsExercisable |
| Namespace Prefix: |
us-gaap_ |
| Data Type: |
xbrli:dateItemType |
| Balance Type: |
na |
| Period Type: |
duration |
|
| X |
- DefinitionExercise price per share or per unit of warrants or rights outstanding. Reference 1: http://www.xbrl.org/2003/role/disclosureRef
-Topic 505
-SubTopic 10
-Name Accounting Standards Codification
-Section 50
-Paragraph 3
-Publisher FASB
-URI https://asc.fasb.org//1943274/2147481112/505-10-50-3
| Name: |
us-gaap_ClassOfWarrantOrRightExercisePriceOfWarrantsOrRights1 |
| Namespace Prefix: |
us-gaap_ |
| Data Type: |
dtr-types:perShareItemType |
| Balance Type: |
na |
| Period Type: |
instant |
|
| X |
- DefinitionNumber of securities into which the class of warrant or right may be converted. For example, but not limited to, 500,000 warrants may be converted into 1,000,000 shares. Reference 1: http://www.xbrl.org/2003/role/disclosureRef
-Topic 505
-SubTopic 10
-Name Accounting Standards Codification
-Section 50
-Paragraph 3
-Publisher FASB
-URI https://asc.fasb.org//1943274/2147481112/505-10-50-3
| Name: |
us-gaap_ClassOfWarrantOrRightNumberOfSecuritiesCalledByWarrantsOrRights |
| Namespace Prefix: |
us-gaap_ |
| Data Type: |
xbrli:sharesItemType |
| Balance Type: |
na |
| Period Type: |
instant |
|
| X |
- DefinitionNumber of shares of stock issued as of the balance sheet date, including shares that had been issued and were previously outstanding but which are now held in the treasury. Reference 1: http://fasb.org/us-gaap/role/ref/legacyRef
-Name Accounting Standards Codification
-Section 50
-Paragraph 2
-SubTopic 10
-Topic 505
-Publisher FASB
-URI https://asc.fasb.org//1943274/2147481112/505-10-50-2
| Name: |
us-gaap_SharesIssued |
| Namespace Prefix: |
us-gaap_ |
| Data Type: |
xbrli:sharesItemType |
| Balance Type: |
na |
| Period Type: |
instant |
|
| X |
- DefinitionPer share or per unit amount of equity securities issued.
| Name: |
us-gaap_SharesIssuedPricePerShare |
| Namespace Prefix: |
us-gaap_ |
| Data Type: |
dtr-types:perShareItemType |
| Balance Type: |
na |
| Period Type: |
instant |
|
| X |
- DefinitionLine items represent financial concepts included in a table. These concepts are used to disclose reportable information associated with domain members defined in one or many axes to the table.
| Name: |
us-gaap_SubsidiarySaleOfStockLineItems |
| Namespace Prefix: |
us-gaap_ |
| Data Type: |
xbrli:stringItemType |
| Balance Type: |
na |
| Period Type: |
duration |
|
| X |
- Details
| Name: |
us-gaap_SubsidiarySaleOfStockAxis=INLX_PrivatePlacement2022Member |
| Namespace Prefix: |
|
| Data Type: |
na |
| Balance Type: |
|
| Period Type: |
|
|
| X |
- Details
| Name: |
us-gaap_SubsidiarySaleOfStockAxis=INLX_PrivatePlacement2020Member |
| Namespace Prefix: |
|
| Data Type: |
na |
| Balance Type: |
|
| Period Type: |
|
|
v3.23.2
Schedule of Warrants to Purchase Common Stock (Details)
|
6 Months Ended |
|
Jun. 30, 2023
$ / shares
shares
|
|---|
| Warrant Exercise Price One [Member] |
|
| Accumulated Other Comprehensive Income (Loss) [Line Items] |
|
| Warrants outstanding | shares |
124,258
|
| Warrants Exercise Price | $ / shares |
$ 4.62
|
| Warrants Expiry |
Mar. 30, 2027
|
| Warrant Exercise Price Two [Member] |
|
| Accumulated Other Comprehensive Income (Loss) [Line Items] |
|
| Warrants outstanding | shares |
95,500
|
| Warrants Exercise Price | $ / shares |
$ 4.00
|
| Warrants Expiry |
Mar. 30, 2027
|
| Warrant Exercise Price Three [Member] |
|
| Accumulated Other Comprehensive Income (Loss) [Line Items] |
|
| Warrants outstanding | shares |
16,000
|
| Warrants Exercise Price | $ / shares |
$ 9.00
|
| Warrants Expiry |
Mar. 30, 2027
|
| Warrant Exercise Price Four [Member] |
|
| Accumulated Other Comprehensive Income (Loss) [Line Items] |
|
| Warrants outstanding | shares |
17,200
|
| Warrants Exercise Price | $ / shares |
$ 12.50
|
| Warrants Expiry |
Mar. 30, 2027
|
| Warrant Exercise Price Five [Member] |
|
| Accumulated Other Comprehensive Income (Loss) [Line Items] |
|
| Warrants outstanding | shares |
3,000
|
| Warrants Exercise Price | $ / shares |
$ 15.00
|
| Warrants Expiry |
Mar. 30, 2027
|
| X |
- DefinitionLine items represent financial concepts included in a table. These concepts are used to disclose reportable information associated with domain members defined in one or many axes to the table. Reference 1: http://www.xbrl.org/2003/role/disclosureRef
-Topic 220
-SubTopic 10
-Name Accounting Standards Codification
-Section 50
-Paragraph 4
-Publisher FASB
-URI https://asc.fasb.org//1943274/2147482765/220-10-50-4
Reference 2: http://www.xbrl.org/2003/role/disclosureRef
-Topic 220
-SubTopic 10
-Name Accounting Standards Codification
-Section 50
-Paragraph 5
-Publisher FASB
-URI https://asc.fasb.org//1943274/2147482765/220-10-50-5
Reference 3: http://www.xbrl.org/2003/role/disclosureRef
-Topic 830
-SubTopic 30
-Name Accounting Standards Codification
-Section 50
-Paragraph 1
-Publisher FASB
-URI https://asc.fasb.org//1943274/2147481674/830-30-50-1
Reference 4: http://www.xbrl.org/2003/role/disclosureRef
-Topic 830
-SubTopic 30
-Name Accounting Standards Codification
-Section 45
-Paragraph 17
-Publisher FASB
-URI https://asc.fasb.org//1943274/2147481694/830-30-45-17
Reference 5: http://www.xbrl.org/2003/role/disclosureRef
-Topic 830
-SubTopic 30
-Name Accounting Standards Codification
-Section 45
-Paragraph 20
-Subparagraph (a)
-Publisher FASB
-URI https://asc.fasb.org//1943274/2147481694/830-30-45-20
Reference 6: http://www.xbrl.org/2003/role/disclosureRef
-Topic 830
-SubTopic 30
-Name Accounting Standards Codification
-Section 45
-Paragraph 20
-Subparagraph (b)
-Publisher FASB
-URI https://asc.fasb.org//1943274/2147481694/830-30-45-20
Reference 7: http://www.xbrl.org/2003/role/disclosureRef
-Topic 830
-SubTopic 30
-Name Accounting Standards Codification
-Section 45
-Paragraph 20
-Subparagraph (c)
-Publisher FASB
-URI https://asc.fasb.org//1943274/2147481694/830-30-45-20
Reference 8: http://www.xbrl.org/2003/role/disclosureRef
-Topic 830
-SubTopic 30
-Name Accounting Standards Codification
-Section 45
-Paragraph 20
-Subparagraph (d)
-Publisher FASB
-URI https://asc.fasb.org//1943274/2147481694/830-30-45-20
| Name: |
us-gaap_AccumulatedOtherComprehensiveIncomeLossLineItems |
| Namespace Prefix: |
us-gaap_ |
| Data Type: |
xbrli:stringItemType |
| Balance Type: |
na |
| Period Type: |
duration |
|
| X |
- DefinitionDate the warrants or rights are exercisable, in YYYY-MM-DD format. Reference 1: http://www.xbrl.org/2003/role/disclosureRef
-Topic 505
-SubTopic 10
-Name Accounting Standards Codification
-Section 50
-Paragraph 3
-Publisher FASB
-URI https://asc.fasb.org//1943274/2147481112/505-10-50-3
| Name: |
us-gaap_ClassOfWarrantOrRighstDateFromWhichWarrantsOrRightsExercisable |
| Namespace Prefix: |
us-gaap_ |
| Data Type: |
xbrli:dateItemType |
| Balance Type: |
na |
| Period Type: |
duration |
|
| X |
- DefinitionExercise price per share or per unit of warrants or rights outstanding. Reference 1: http://www.xbrl.org/2003/role/disclosureRef
-Topic 505
-SubTopic 10
-Name Accounting Standards Codification
-Section 50
-Paragraph 3
-Publisher FASB
-URI https://asc.fasb.org//1943274/2147481112/505-10-50-3
| Name: |
us-gaap_ClassOfWarrantOrRightExercisePriceOfWarrantsOrRights1 |
| Namespace Prefix: |
us-gaap_ |
| Data Type: |
dtr-types:perShareItemType |
| Balance Type: |
na |
| Period Type: |
instant |
|
| X |
- DefinitionNumber of securities into which the class of warrant or right may be converted. For example, but not limited to, 500,000 warrants may be converted into 1,000,000 shares. Reference 1: http://www.xbrl.org/2003/role/disclosureRef
-Topic 505
-SubTopic 10
-Name Accounting Standards Codification
-Section 50
-Paragraph 3
-Publisher FASB
-URI https://asc.fasb.org//1943274/2147481112/505-10-50-3
| Name: |
us-gaap_ClassOfWarrantOrRightNumberOfSecuritiesCalledByWarrantsOrRights |
| Namespace Prefix: |
us-gaap_ |
| Data Type: |
xbrli:sharesItemType |
| Balance Type: |
na |
| Period Type: |
instant |
|
| X |
- Details
| Name: |
us-gaap_StatementEquityComponentsAxis=INLX_WarrantExercisePriceOneMember |
| Namespace Prefix: |
|
| Data Type: |
na |
| Balance Type: |
|
| Period Type: |
|
|
| X |
- Details
| Name: |
us-gaap_StatementEquityComponentsAxis=INLX_WarrantExercisePriceTwoMember |
| Namespace Prefix: |
|
| Data Type: |
na |
| Balance Type: |
|
| Period Type: |
|
|
| X |
- Details
| Name: |
us-gaap_StatementEquityComponentsAxis=INLX_WarrantExercisePriceThreeMember |
| Namespace Prefix: |
|
| Data Type: |
na |
| Balance Type: |
|
| Period Type: |
|
|
| X |
- Details
| Name: |
us-gaap_StatementEquityComponentsAxis=INLX_WarrantExercisePriceFourMember |
| Namespace Prefix: |
|
| Data Type: |
na |
| Balance Type: |
|
| Period Type: |
|
|
| X |
- Details
| Name: |
us-gaap_StatementEquityComponentsAxis=INLX_WarrantExercisePriceFiveMember |
| Namespace Prefix: |
|
| Data Type: |
na |
| Balance Type: |
|
| Period Type: |
|
|
v3.23.2
Schedule of Estimated Values of Warrants Valuation Assumptions (Details) - Placement Agent [Member]
|
Apr. 01, 2022 |
| Measurement Input, Risk Free Interest Rate [Member] |
|
| Deferred Compensation Arrangement with Individual, Excluding Share-Based Payments and Postretirement Benefits [Line Items] |
|
| Warrants, measurement input percentage |
2.55
|
| Measurement Input, Expected Term [Member] |
|
| Deferred Compensation Arrangement with Individual, Excluding Share-Based Payments and Postretirement Benefits [Line Items] |
|
| Warrants, term |
5 years
|
| Measurement Input, Price Volatility [Member] |
|
| Deferred Compensation Arrangement with Individual, Excluding Share-Based Payments and Postretirement Benefits [Line Items] |
|
| Warrants, measurement input percentage |
116.32
|
| Measurement Input, Expected Dividend Rate [Member] |
|
| Deferred Compensation Arrangement with Individual, Excluding Share-Based Payments and Postretirement Benefits [Line Items] |
|
| Warrants, measurement input percentage |
0.00
|
| X |
- DefinitionLine items represent financial concepts included in a table. These concepts are used to disclose reportable information associated with domain members defined in one or many axes to the table.
| Name: |
us-gaap_DeferredCompensationArrangementWithIndividualExcludingShareBasedPaymentsAndPostretirementBenefitsLineItems |
| Namespace Prefix: |
us-gaap_ |
| Data Type: |
xbrli:stringItemType |
| Balance Type: |
na |
| Period Type: |
duration |
|
| X |
- DefinitionPeriod between issuance and expiration of outstanding warrant and right embodying unconditional obligation requiring redemption by transferring asset at specified or determinable date or upon event certain to occur, in 'PnYnMnDTnHnMnS' format, for example, 'P1Y5M13D' represents reported fact of one year, five months, and thirteen days. Reference 1: http://www.xbrl.org/2009/role/commonPracticeRef
-Topic 820
-SubTopic 10
-Name Accounting Standards Codification
-Section 50
-Paragraph 2
-Subparagraph (bbb)(2)
-Publisher FASB
-URI https://asc.fasb.org//1943274/2147482106/820-10-50-2
| Name: |
us-gaap_WarrantsAndRightsOutstandingTerm |
| Namespace Prefix: |
us-gaap_ |
| Data Type: |
xbrli:durationItemType |
| Balance Type: |
na |
| Period Type: |
instant |
|
| X |
- Details
| Name: |
srt_TitleOfIndividualAxis=INLX_PlacementAgentMember |
| Namespace Prefix: |
|
| Data Type: |
na |
| Balance Type: |
|
| Period Type: |
|
|
v3.23.2
Stockholders’ Equity (Details Narrative) - USD ($)
|
3 Months Ended |
6 Months Ended |
|
Jun. 30, 2023 |
Jun. 30, 2022 |
Jun. 30, 2023 |
Jun. 30, 2022 |
Dec. 31, 2022 |
| Accumulated Other Comprehensive Income (Loss) [Line Items] |
|
|
|
|
|
| Common stock, shares outstanding |
4,073,757
|
|
4,073,757
|
|
4,073,757
|
| Amortization of Debt Issuance Costs |
|
|
$ 95,152
|
$ 90,801
|
|
| Private Placement [Member] |
|
|
|
|
|
| Accumulated Other Comprehensive Income (Loss) [Line Items] |
|
|
|
|
|
| Amortization of Debt Issuance Costs |
$ 6,224
|
$ 25,935
|
$ 17,290
|
$ 51,869
|
|
| 2015 Equity Incentive Plan [Member] |
|
|
|
|
|
| Accumulated Other Comprehensive Income (Loss) [Line Items] |
|
|
|
|
|
| Common stock capital shares reserved for future issuance |
497,330
|
|
497,330
|
|
|
| Exercise of Outstanding Warrants [Member] |
|
|
|
|
|
| Accumulated Other Comprehensive Income (Loss) [Line Items] |
|
|
|
|
|
| Common stock capital shares reserved for future issuance |
255,958
|
|
255,958
|
|
|
| X |
- DefinitionLine items represent financial concepts included in a table. These concepts are used to disclose reportable information associated with domain members defined in one or many axes to the table. Reference 1: http://www.xbrl.org/2003/role/disclosureRef
-Topic 220
-SubTopic 10
-Name Accounting Standards Codification
-Section 50
-Paragraph 4
-Publisher FASB
-URI https://asc.fasb.org//1943274/2147482765/220-10-50-4
Reference 2: http://www.xbrl.org/2003/role/disclosureRef
-Topic 220
-SubTopic 10
-Name Accounting Standards Codification
-Section 50
-Paragraph 5
-Publisher FASB
-URI https://asc.fasb.org//1943274/2147482765/220-10-50-5
Reference 3: http://www.xbrl.org/2003/role/disclosureRef
-Topic 830
-SubTopic 30
-Name Accounting Standards Codification
-Section 50
-Paragraph 1
-Publisher FASB
-URI https://asc.fasb.org//1943274/2147481674/830-30-50-1
Reference 4: http://www.xbrl.org/2003/role/disclosureRef
-Topic 830
-SubTopic 30
-Name Accounting Standards Codification
-Section 45
-Paragraph 17
-Publisher FASB
-URI https://asc.fasb.org//1943274/2147481694/830-30-45-17
Reference 5: http://www.xbrl.org/2003/role/disclosureRef
-Topic 830
-SubTopic 30
-Name Accounting Standards Codification
-Section 45
-Paragraph 20
-Subparagraph (a)
-Publisher FASB
-URI https://asc.fasb.org//1943274/2147481694/830-30-45-20
Reference 6: http://www.xbrl.org/2003/role/disclosureRef
-Topic 830
-SubTopic 30
-Name Accounting Standards Codification
-Section 45
-Paragraph 20
-Subparagraph (b)
-Publisher FASB
-URI https://asc.fasb.org//1943274/2147481694/830-30-45-20
Reference 7: http://www.xbrl.org/2003/role/disclosureRef
-Topic 830
-SubTopic 30
-Name Accounting Standards Codification
-Section 45
-Paragraph 20
-Subparagraph (c)
-Publisher FASB
-URI https://asc.fasb.org//1943274/2147481694/830-30-45-20
Reference 8: http://www.xbrl.org/2003/role/disclosureRef
-Topic 830
-SubTopic 30
-Name Accounting Standards Codification
-Section 45
-Paragraph 20
-Subparagraph (d)
-Publisher FASB
-URI https://asc.fasb.org//1943274/2147481694/830-30-45-20
| Name: |
us-gaap_AccumulatedOtherComprehensiveIncomeLossLineItems |
| Namespace Prefix: |
us-gaap_ |
| Data Type: |
xbrli:stringItemType |
| Balance Type: |
na |
| Period Type: |
duration |
|
| X |
- DefinitionAmount of amortization expense attributable to debt issuance costs. Reference 1: http://www.xbrl.org/2003/role/disclosureRef
-Topic 470
-SubTopic 20
-Name Accounting Standards Codification
-Section 50
-Paragraph 1F
-Subparagraph (b)(2)
-Publisher FASB
-URI https://asc.fasb.org//1943274/2147481139/470-20-50-1F
Reference 2: http://www.xbrl.org/2009/role/commonPracticeRef
-Topic 230
-SubTopic 10
-Name Accounting Standards Codification
-Section 45
-Paragraph 28
-Subparagraph (b)
-Publisher FASB
-URI https://asc.fasb.org//1943274/2147482740/230-10-45-28
Reference 3: http://www.xbrl.org/2003/role/disclosureRef
-Topic 835
-SubTopic 30
-Name Accounting Standards Codification
-Section 45
-Paragraph 3
-Publisher FASB
-URI https://asc.fasb.org//1943274/2147482925/835-30-45-3
Reference 4: http://fasb.org/us-gaap/role/ref/legacyRef
-Topic 220
-SubTopic 10
-Name Accounting Standards Codification
-Section S99
-Paragraph 2
-Subparagraph (SX 210.5-03(8))
-Publisher FASB
-URI https://asc.fasb.org//1943274/2147483621/220-10-S99-2
| Name: |
us-gaap_AmortizationOfFinancingCosts |
| Namespace Prefix: |
us-gaap_ |
| Data Type: |
xbrli:monetaryItemType |
| Balance Type: |
debit |
| Period Type: |
duration |
|
| X |
- DefinitionAggregate number of common shares reserved for future issuance. Reference 1: http://fasb.org/us-gaap/role/ref/legacyRef
-Name Accounting Standards Codification
-Topic 210
-SubTopic 10
-Section S99
-Paragraph 1
-Subparagraph (SX 210.5-02.29)
-Publisher FASB
-URI https://asc.fasb.org//1943274/2147480566/210-10-S99-1
| Name: |
us-gaap_CommonStockCapitalSharesReservedForFutureIssuance |
| Namespace Prefix: |
us-gaap_ |
| Data Type: |
xbrli:sharesItemType |
| Balance Type: |
na |
| Period Type: |
instant |
|
| X |
- DefinitionNumber of shares of common stock outstanding. Common stock represent the ownership interest in a corporation. Reference 1: http://fasb.org/us-gaap/role/ref/legacyRef
-Name Accounting Standards Codification
-Section 50
-Paragraph 2
-SubTopic 10
-Topic 505
-Publisher FASB
-URI https://asc.fasb.org//1943274/2147481112/505-10-50-2
Reference 2: http://www.xbrl.org/2003/role/disclosureRef
-Topic 946
-SubTopic 210
-Name Accounting Standards Codification
-Section S99
-Paragraph 2
-Subparagraph (SX 210.6-05(4))
-Publisher FASB
-URI https://asc.fasb.org//1943274/2147479617/946-210-S99-2
Reference 3: http://www.xbrl.org/2009/role/commonPracticeRef
-Topic 946
-SubTopic 220
-Name Accounting Standards Codification
-Section S99
-Paragraph 3
-Subparagraph (SX 210.6-09(4)(b))
-Publisher FASB
-URI https://asc.fasb.org//1943274/2147483575/946-220-S99-3
Reference 4: http://www.xbrl.org/2003/role/disclosureRef
-Topic 946
-SubTopic 210
-Name Accounting Standards Codification
-Section S99
-Paragraph 1
-Subparagraph (SX 210.6-04(16)(a))
-Publisher FASB
-URI https://asc.fasb.org//1943274/2147479617/946-210-S99-1
Reference 5: http://www.xbrl.org/2009/role/commonPracticeRef
-Topic 946
-SubTopic 220
-Name Accounting Standards Codification
-Section S99
-Paragraph 3
-Subparagraph (SX 210.6-09(7))
-Publisher FASB
-URI https://asc.fasb.org//1943274/2147483575/946-220-S99-3
Reference 6: http://fasb.org/us-gaap/role/ref/legacyRef
-Topic 210
-SubTopic 10
-Name Accounting Standards Codification
-Section S99
-Paragraph 1
-Subparagraph (SX 210.5-02(29))
-Publisher FASB
-URI https://asc.fasb.org//1943274/2147480566/210-10-S99-1
| Name: |
us-gaap_CommonStockSharesOutstanding |
| Namespace Prefix: |
us-gaap_ |
| Data Type: |
xbrli:sharesItemType |
| Balance Type: |
na |
| Period Type: |
instant |
|
| X |
- Details
| Name: |
us-gaap_SubsidiarySaleOfStockAxis=us-gaap_PrivatePlacementMember |
| Namespace Prefix: |
|
| Data Type: |
na |
| Balance Type: |
|
| Period Type: |
|
|
| X |
- Details
| Name: |
us-gaap_PlanNameAxis=INLX_TwoThousandFifteenEquityIncentivePlanMember |
| Namespace Prefix: |
|
| Data Type: |
na |
| Balance Type: |
|
| Period Type: |
|
|
| X |
- Details
| Name: |
us-gaap_StatementEquityComponentsAxis=INLX_ExerciseOfOutstandingWarrantsMember |
| Namespace Prefix: |
|
| Data Type: |
na |
| Balance Type: |
|
| Period Type: |
|
|
v3.23.2
| X |
- DefinitionThe estimated dividend rate (a percentage of the share price) to be paid (expected dividends) to holders of the underlying shares over the option's term. Reference 1: http://www.xbrl.org/2003/role/disclosureRef
-Topic 718
-SubTopic 10
-Name Accounting Standards Codification
-Section 50
-Paragraph 2
-Subparagraph (f)(2)(iii)
-Publisher FASB
-URI https://asc.fasb.org//1943274/2147480429/718-10-50-2
| Name: |
us-gaap_ShareBasedCompensationArrangementByShareBasedPaymentAwardFairValueAssumptionsExpectedDividendRate |
| Namespace Prefix: |
us-gaap_ |
| Data Type: |
dtr-types:percentItemType |
| Balance Type: |
na |
| Period Type: |
duration |
|
| X |
- DefinitionThe estimated measure of the percentage by which a share price is expected to fluctuate during a period. Volatility also may be defined as a probability-weighted measure of the dispersion of returns about the mean. The volatility of a share price is the standard deviation of the continuously compounded rates of return on the share over a specified period. That is the same as the standard deviation of the differences in the natural logarithms of the stock prices plus dividends, if any, over the period. Reference 1: http://www.xbrl.org/2003/role/disclosureRef
-Topic 718
-SubTopic 10
-Name Accounting Standards Codification
-Section 50
-Paragraph 2
-Subparagraph (f)(2)(ii)
-Publisher FASB
-URI https://asc.fasb.org//1943274/2147480429/718-10-50-2
| Name: |
us-gaap_ShareBasedCompensationArrangementByShareBasedPaymentAwardFairValueAssumptionsExpectedVolatilityRate |
| Namespace Prefix: |
us-gaap_ |
| Data Type: |
dtr-types:percentItemType |
| Balance Type: |
na |
| Period Type: |
duration |
|
| X |
- DefinitionThe risk-free interest rate assumption that is used in valuing an option on its own shares. Reference 1: http://www.xbrl.org/2003/role/disclosureRef
-Topic 718
-SubTopic 10
-Name Accounting Standards Codification
-Section 50
-Paragraph 2
-Subparagraph (f)(2)(iv)
-Publisher FASB
-URI https://asc.fasb.org//1943274/2147480429/718-10-50-2
| Name: |
us-gaap_ShareBasedCompensationArrangementByShareBasedPaymentAwardFairValueAssumptionsRiskFreeInterestRate |
| Namespace Prefix: |
us-gaap_ |
| Data Type: |
dtr-types:percentItemType |
| Balance Type: |
na |
| Period Type: |
duration |
|
| X |
- DefinitionLine items represent financial concepts included in a table. These concepts are used to disclose reportable information associated with domain members defined in one or many axes to the table. Reference 1: http://www.xbrl.org/2003/role/disclosureRef
-Topic 718
-SubTopic 10
-Name Accounting Standards Codification
-Section 35
-Paragraph 1D
-Publisher FASB
-URI https://asc.fasb.org//1943274/2147480483/718-10-35-1D
Reference 2: http://www.xbrl.org/2003/role/disclosureRef
-Topic 718
-SubTopic 10
-Name Accounting Standards Codification
-Section 35
-Paragraph 3
-Publisher FASB
-URI https://asc.fasb.org//1943274/2147480483/718-10-35-3
Reference 3: http://www.xbrl.org/2003/role/disclosureRef
-Topic 718
-SubTopic 10
-Name Accounting Standards Codification
-Section 50
-Paragraph 2
-Subparagraph (a)(1)
-Publisher FASB
-URI https://asc.fasb.org//1943274/2147480429/718-10-50-2
Reference 4: http://www.xbrl.org/2003/role/disclosureRef
-Topic 718
-SubTopic 10
-Name Accounting Standards Codification
-Section 50
-Paragraph 2
-Subparagraph (a)(2)
-Publisher FASB
-URI https://asc.fasb.org//1943274/2147480429/718-10-50-2
Reference 5: http://www.xbrl.org/2003/role/disclosureRef
-Topic 718
-SubTopic 10
-Name Accounting Standards Codification
-Section 50
-Paragraph 2
-Subparagraph (a)(3)
-Publisher FASB
-URI https://asc.fasb.org//1943274/2147480429/718-10-50-2
Reference 6: http://www.xbrl.org/2003/role/disclosureRef
-Topic 718
-SubTopic 10
-Name Accounting Standards Codification
-Section 50
-Paragraph 2
-Subparagraph (c)(1)(i)
-Publisher FASB
-URI https://asc.fasb.org//1943274/2147480429/718-10-50-2
Reference 7: http://www.xbrl.org/2003/role/disclosureRef
-Topic 718
-SubTopic 10
-Name Accounting Standards Codification
-Section 50
-Paragraph 2
-Subparagraph (c)(1)(ii)
-Publisher FASB
-URI https://asc.fasb.org//1943274/2147480429/718-10-50-2
Reference 8: http://www.xbrl.org/2003/role/disclosureRef
-Topic 718
-SubTopic 10
-Name Accounting Standards Codification
-Section 50
-Paragraph 2
-Subparagraph (c)(1)(iii)
-Publisher FASB
-URI https://asc.fasb.org//1943274/2147480429/718-10-50-2
Reference 9: http://www.xbrl.org/2003/role/disclosureRef
-Topic 718
-SubTopic 10
-Name Accounting Standards Codification
-Section 50
-Paragraph 2
-Subparagraph (c)(1)(iv)
-Publisher FASB
-URI https://asc.fasb.org//1943274/2147480429/718-10-50-2
Reference 10: http://www.xbrl.org/2003/role/disclosureRef
-Topic 718
-SubTopic 10
-Name Accounting Standards Codification
-Section 50
-Paragraph 2
-Subparagraph (c)(1)(iv)(01)
-Publisher FASB
-URI https://asc.fasb.org//1943274/2147480429/718-10-50-2
Reference 11: http://www.xbrl.org/2003/role/disclosureRef
-Topic 718
-SubTopic 10
-Name Accounting Standards Codification
-Section 50
-Paragraph 2
-Subparagraph (c)(1)(iv)(02)
-Publisher FASB
-URI https://asc.fasb.org//1943274/2147480429/718-10-50-2
Reference 12: http://www.xbrl.org/2003/role/disclosureRef
-Topic 718
-SubTopic 10
-Name Accounting Standards Codification
-Section 50
-Paragraph 2
-Subparagraph (c)(1)(iv)(03)
-Publisher FASB
-URI https://asc.fasb.org//1943274/2147480429/718-10-50-2
Reference 13: http://www.xbrl.org/2003/role/disclosureRef
-Topic 718
-SubTopic 10
-Name Accounting Standards Codification
-Section 50
-Paragraph 2
-Subparagraph (c)(1)(iv)(04)
-Publisher FASB
-URI https://asc.fasb.org//1943274/2147480429/718-10-50-2
Reference 14: http://www.xbrl.org/2003/role/disclosureRef
-Topic 718
-SubTopic 10
-Name Accounting Standards Codification
-Section 50
-Paragraph 2
-Subparagraph (c)(2)(i)
-Publisher FASB
-URI https://asc.fasb.org//1943274/2147480429/718-10-50-2
Reference 15: http://www.xbrl.org/2003/role/disclosureRef
-Topic 718
-SubTopic 10
-Name Accounting Standards Codification
-Section 50
-Paragraph 2
-Subparagraph (c)(2)(ii)
-Publisher FASB
-URI https://asc.fasb.org//1943274/2147480429/718-10-50-2
Reference 16: http://www.xbrl.org/2003/role/disclosureRef
-Topic 718
-SubTopic 10
-Name Accounting Standards Codification
-Section 50
-Paragraph 2
-Subparagraph (c)(2)(iii)
-Publisher FASB
-URI https://asc.fasb.org//1943274/2147480429/718-10-50-2
Reference 17: http://www.xbrl.org/2003/role/disclosureRef
-Topic 718
-SubTopic 10
-Name Accounting Standards Codification
-Section 50
-Paragraph 2
-Subparagraph (c)(2)(iii)(01)
-Publisher FASB
-URI https://asc.fasb.org//1943274/2147480429/718-10-50-2
Reference 18: http://www.xbrl.org/2003/role/disclosureRef
-Topic 718
-SubTopic 10
-Name Accounting Standards Codification
-Section 50
-Paragraph 2
-Subparagraph (c)(2)(iii)(02)
-Publisher FASB
-URI https://asc.fasb.org//1943274/2147480429/718-10-50-2
Reference 19: http://www.xbrl.org/2003/role/disclosureRef
-Topic 718
-SubTopic 10
-Name Accounting Standards Codification
-Section 50
-Paragraph 2
-Subparagraph (c)(2)(iii)(03)
-Publisher FASB
-URI https://asc.fasb.org//1943274/2147480429/718-10-50-2
Reference 20: http://www.xbrl.org/2003/role/disclosureRef
-Topic 718
-SubTopic 10
-Name Accounting Standards Codification
-Section 50
-Paragraph 2
-Subparagraph (d)(1)
-Publisher FASB
-URI https://asc.fasb.org//1943274/2147480429/718-10-50-2
Reference 21: http://www.xbrl.org/2003/role/disclosureRef
-Topic 718
-SubTopic 10
-Name Accounting Standards Codification
-Section 50
-Paragraph 2
-Subparagraph (d)(2)
-Publisher FASB
-URI https://asc.fasb.org//1943274/2147480429/718-10-50-2
Reference 22: http://www.xbrl.org/2003/role/disclosureRef
-Topic 718
-SubTopic 10
-Name Accounting Standards Codification
-Section 50
-Paragraph 2
-Subparagraph (e)(1)
-Publisher FASB
-URI https://asc.fasb.org//1943274/2147480429/718-10-50-2
Reference 23: http://www.xbrl.org/2003/role/disclosureRef
-Topic 718
-SubTopic 10
-Name Accounting Standards Codification
-Section 50
-Paragraph 2
-Subparagraph (e)(2)
-Publisher FASB
-URI https://asc.fasb.org//1943274/2147480429/718-10-50-2
Reference 24: http://www.xbrl.org/2003/role/disclosureRef
-Topic 718
-SubTopic 10
-Name Accounting Standards Codification
-Section 50
-Paragraph 2
-Subparagraph (f)(2)(i)
-Publisher FASB
-URI https://asc.fasb.org//1943274/2147480429/718-10-50-2
Reference 25: http://www.xbrl.org/2003/role/disclosureRef
-Topic 718
-SubTopic 10
-Name Accounting Standards Codification
-Section 50
-Paragraph 2
-Subparagraph (f)(2)(ii)
-Publisher FASB
-URI https://asc.fasb.org//1943274/2147480429/718-10-50-2
Reference 26: http://www.xbrl.org/2003/role/disclosureRef
-Topic 718
-SubTopic 10
-Name Accounting Standards Codification
-Section 50
-Paragraph 2
-Subparagraph (f)(2)(iii)
-Publisher FASB
-URI https://asc.fasb.org//1943274/2147480429/718-10-50-2
Reference 27: http://www.xbrl.org/2003/role/disclosureRef
-Topic 718
-SubTopic 10
-Name Accounting Standards Codification
-Section 50
-Paragraph 2
-Subparagraph (f)(2)(iv)
-Publisher FASB
-URI https://asc.fasb.org//1943274/2147480429/718-10-50-2
Reference 28: http://www.xbrl.org/2003/role/disclosureRef
-Topic 718
-SubTopic 10
-Name Accounting Standards Codification
-Section 50
-Paragraph 2
-Subparagraph (f)(2)(v)
-Publisher FASB
-URI https://asc.fasb.org//1943274/2147480429/718-10-50-2
| Name: |
us-gaap_ShareBasedCompensationArrangementByShareBasedPaymentAwardLineItems |
| Namespace Prefix: |
us-gaap_ |
| Data Type: |
xbrli:stringItemType |
| Balance Type: |
na |
| Period Type: |
duration |
|
| X |
- DefinitionExpected term of award under share-based payment arrangement, in 'PnYnMnDTnHnMnS' format, for example, 'P1Y5M13D' represents reported fact of one year, five months, and thirteen days. Reference 1: http://www.xbrl.org/2003/role/disclosureRef
-Topic 718
-SubTopic 10
-Name Accounting Standards Codification
-Section 50
-Paragraph 2
-Subparagraph (f)(2)(i)
-Publisher FASB
-URI https://asc.fasb.org//1943274/2147480429/718-10-50-2
| Name: |
us-gaap_SharebasedCompensationArrangementBySharebasedPaymentAwardFairValueAssumptionsExpectedTerm1 |
| Namespace Prefix: |
us-gaap_ |
| Data Type: |
xbrli:durationItemType |
| Balance Type: |
na |
| Period Type: |
duration |
|
| X |
- Details
| Name: |
us-gaap_AwardDateAxis=INLX_GrantDateAprilFourteenTwoThousandTwentyTwoMember |
| Namespace Prefix: |
|
| Data Type: |
na |
| Balance Type: |
|
| Period Type: |
|
|
v3.23.2
Schedule of Stock Option Activity (Details) - Equity Option [Member] - USD ($)
|
6 Months Ended |
12 Months Ended |
Jun. 30, 2023 |
Jun. 30, 2022 |
Dec. 31, 2022 |
| Share-Based Compensation Arrangement by Share-Based Payment Award [Line Items] |
|
|
|
| Shares Under Option, Outstanding beginning balance |
365,447
|
144,860
|
144,860
|
| Weighted- Average Exercise Price, Outstanding beginning balance |
$ 5.89
|
$ 5.61
|
$ 5.61
|
| Weighted Average Remaining Contractual Life Outstanding, beginning |
8 years
|
8 years
|
8 years
|
| Aggregate Intrinsic Value, Outstanding, beginning balance |
$ 19,200
|
$ 19,200
|
$ 19,200
|
| Shares Under Option, Granted |
|
220,587
|
|
| Weighted- Average Exercise Price, Granted |
|
$ 6.08
|
|
| Shares Under Option, Forfeited and expired |
(5,000)
|
|
|
| Weighted- Average Exercise Price, Forfeited and expired |
$ 4.00
|
|
|
| Shares Under Option, Outstanding ending balance |
360,447
|
365,447
|
365,447
|
| Weighted- Average Exercise Price, Outstanding ending balance |
$ 5.92
|
$ 5.89
|
$ 5.89
|
| Aggregate Intrinsic Value, Outstanding ending balance |
$ 19,200
|
$ 19,200
|
$ 19,200
|
| Shares Under Option, Exercisable ending balance |
165,654
|
68,335
|
|
| Weighted- Average Exercise Price, Exercisable ending balance |
$ 6.32
|
$ 7.32
|
|
| Weighted Average Remaining Contractual Life Outstanding, beginning |
7 years
|
7 years
|
|
| Aggregate Intrinsic Value, Exercisable ending balance |
$ 19,200
|
$ 19,200
|
|
| Weighted Average Remaining Contractual Life Outstanding, beginning |
|
9 years
|
|
| X |
- DefinitionWeighted Average Remaining Contractual Life Outstanding, Ending.
| Name: |
INLX_SharebasedCompensationArrangementBySharebasedPaymentAwardOptionsOutstandingWeightedAverageRemainingContractualTerm |
| Namespace Prefix: |
INLX_ |
| Data Type: |
xbrli:durationItemType |
| Balance Type: |
na |
| Period Type: |
duration |
|
| X |
- DefinitionLine items represent financial concepts included in a table. These concepts are used to disclose reportable information associated with domain members defined in one or many axes to the table. Reference 1: http://www.xbrl.org/2003/role/disclosureRef
-Topic 718
-SubTopic 10
-Name Accounting Standards Codification
-Section 35
-Paragraph 1D
-Publisher FASB
-URI https://asc.fasb.org//1943274/2147480483/718-10-35-1D
Reference 2: http://www.xbrl.org/2003/role/disclosureRef
-Topic 718
-SubTopic 10
-Name Accounting Standards Codification
-Section 35
-Paragraph 3
-Publisher FASB
-URI https://asc.fasb.org//1943274/2147480483/718-10-35-3
Reference 3: http://www.xbrl.org/2003/role/disclosureRef
-Topic 718
-SubTopic 10
-Name Accounting Standards Codification
-Section 50
-Paragraph 2
-Subparagraph (a)(1)
-Publisher FASB
-URI https://asc.fasb.org//1943274/2147480429/718-10-50-2
Reference 4: http://www.xbrl.org/2003/role/disclosureRef
-Topic 718
-SubTopic 10
-Name Accounting Standards Codification
-Section 50
-Paragraph 2
-Subparagraph (a)(2)
-Publisher FASB
-URI https://asc.fasb.org//1943274/2147480429/718-10-50-2
Reference 5: http://www.xbrl.org/2003/role/disclosureRef
-Topic 718
-SubTopic 10
-Name Accounting Standards Codification
-Section 50
-Paragraph 2
-Subparagraph (a)(3)
-Publisher FASB
-URI https://asc.fasb.org//1943274/2147480429/718-10-50-2
Reference 6: http://www.xbrl.org/2003/role/disclosureRef
-Topic 718
-SubTopic 10
-Name Accounting Standards Codification
-Section 50
-Paragraph 2
-Subparagraph (c)(1)(i)
-Publisher FASB
-URI https://asc.fasb.org//1943274/2147480429/718-10-50-2
Reference 7: http://www.xbrl.org/2003/role/disclosureRef
-Topic 718
-SubTopic 10
-Name Accounting Standards Codification
-Section 50
-Paragraph 2
-Subparagraph (c)(1)(ii)
-Publisher FASB
-URI https://asc.fasb.org//1943274/2147480429/718-10-50-2
Reference 8: http://www.xbrl.org/2003/role/disclosureRef
-Topic 718
-SubTopic 10
-Name Accounting Standards Codification
-Section 50
-Paragraph 2
-Subparagraph (c)(1)(iii)
-Publisher FASB
-URI https://asc.fasb.org//1943274/2147480429/718-10-50-2
Reference 9: http://www.xbrl.org/2003/role/disclosureRef
-Topic 718
-SubTopic 10
-Name Accounting Standards Codification
-Section 50
-Paragraph 2
-Subparagraph (c)(1)(iv)
-Publisher FASB
-URI https://asc.fasb.org//1943274/2147480429/718-10-50-2
Reference 10: http://www.xbrl.org/2003/role/disclosureRef
-Topic 718
-SubTopic 10
-Name Accounting Standards Codification
-Section 50
-Paragraph 2
-Subparagraph (c)(1)(iv)(01)
-Publisher FASB
-URI https://asc.fasb.org//1943274/2147480429/718-10-50-2
Reference 11: http://www.xbrl.org/2003/role/disclosureRef
-Topic 718
-SubTopic 10
-Name Accounting Standards Codification
-Section 50
-Paragraph 2
-Subparagraph (c)(1)(iv)(02)
-Publisher FASB
-URI https://asc.fasb.org//1943274/2147480429/718-10-50-2
Reference 12: http://www.xbrl.org/2003/role/disclosureRef
-Topic 718
-SubTopic 10
-Name Accounting Standards Codification
-Section 50
-Paragraph 2
-Subparagraph (c)(1)(iv)(03)
-Publisher FASB
-URI https://asc.fasb.org//1943274/2147480429/718-10-50-2
Reference 13: http://www.xbrl.org/2003/role/disclosureRef
-Topic 718
-SubTopic 10
-Name Accounting Standards Codification
-Section 50
-Paragraph 2
-Subparagraph (c)(1)(iv)(04)
-Publisher FASB
-URI https://asc.fasb.org//1943274/2147480429/718-10-50-2
Reference 14: http://www.xbrl.org/2003/role/disclosureRef
-Topic 718
-SubTopic 10
-Name Accounting Standards Codification
-Section 50
-Paragraph 2
-Subparagraph (c)(2)(i)
-Publisher FASB
-URI https://asc.fasb.org//1943274/2147480429/718-10-50-2
Reference 15: http://www.xbrl.org/2003/role/disclosureRef
-Topic 718
-SubTopic 10
-Name Accounting Standards Codification
-Section 50
-Paragraph 2
-Subparagraph (c)(2)(ii)
-Publisher FASB
-URI https://asc.fasb.org//1943274/2147480429/718-10-50-2
Reference 16: http://www.xbrl.org/2003/role/disclosureRef
-Topic 718
-SubTopic 10
-Name Accounting Standards Codification
-Section 50
-Paragraph 2
-Subparagraph (c)(2)(iii)
-Publisher FASB
-URI https://asc.fasb.org//1943274/2147480429/718-10-50-2
Reference 17: http://www.xbrl.org/2003/role/disclosureRef
-Topic 718
-SubTopic 10
-Name Accounting Standards Codification
-Section 50
-Paragraph 2
-Subparagraph (c)(2)(iii)(01)
-Publisher FASB
-URI https://asc.fasb.org//1943274/2147480429/718-10-50-2
Reference 18: http://www.xbrl.org/2003/role/disclosureRef
-Topic 718
-SubTopic 10
-Name Accounting Standards Codification
-Section 50
-Paragraph 2
-Subparagraph (c)(2)(iii)(02)
-Publisher FASB
-URI https://asc.fasb.org//1943274/2147480429/718-10-50-2
Reference 19: http://www.xbrl.org/2003/role/disclosureRef
-Topic 718
-SubTopic 10
-Name Accounting Standards Codification
-Section 50
-Paragraph 2
-Subparagraph (c)(2)(iii)(03)
-Publisher FASB
-URI https://asc.fasb.org//1943274/2147480429/718-10-50-2
Reference 20: http://www.xbrl.org/2003/role/disclosureRef
-Topic 718
-SubTopic 10
-Name Accounting Standards Codification
-Section 50
-Paragraph 2
-Subparagraph (d)(1)
-Publisher FASB
-URI https://asc.fasb.org//1943274/2147480429/718-10-50-2
Reference 21: http://www.xbrl.org/2003/role/disclosureRef
-Topic 718
-SubTopic 10
-Name Accounting Standards Codification
-Section 50
-Paragraph 2
-Subparagraph (d)(2)
-Publisher FASB
-URI https://asc.fasb.org//1943274/2147480429/718-10-50-2
Reference 22: http://www.xbrl.org/2003/role/disclosureRef
-Topic 718
-SubTopic 10
-Name Accounting Standards Codification
-Section 50
-Paragraph 2
-Subparagraph (e)(1)
-Publisher FASB
-URI https://asc.fasb.org//1943274/2147480429/718-10-50-2
Reference 23: http://www.xbrl.org/2003/role/disclosureRef
-Topic 718
-SubTopic 10
-Name Accounting Standards Codification
-Section 50
-Paragraph 2
-Subparagraph (e)(2)
-Publisher FASB
-URI https://asc.fasb.org//1943274/2147480429/718-10-50-2
Reference 24: http://www.xbrl.org/2003/role/disclosureRef
-Topic 718
-SubTopic 10
-Name Accounting Standards Codification
-Section 50
-Paragraph 2
-Subparagraph (f)(2)(i)
-Publisher FASB
-URI https://asc.fasb.org//1943274/2147480429/718-10-50-2
Reference 25: http://www.xbrl.org/2003/role/disclosureRef
-Topic 718
-SubTopic 10
-Name Accounting Standards Codification
-Section 50
-Paragraph 2
-Subparagraph (f)(2)(ii)
-Publisher FASB
-URI https://asc.fasb.org//1943274/2147480429/718-10-50-2
Reference 26: http://www.xbrl.org/2003/role/disclosureRef
-Topic 718
-SubTopic 10
-Name Accounting Standards Codification
-Section 50
-Paragraph 2
-Subparagraph (f)(2)(iii)
-Publisher FASB
-URI https://asc.fasb.org//1943274/2147480429/718-10-50-2
Reference 27: http://www.xbrl.org/2003/role/disclosureRef
-Topic 718
-SubTopic 10
-Name Accounting Standards Codification
-Section 50
-Paragraph 2
-Subparagraph (f)(2)(iv)
-Publisher FASB
-URI https://asc.fasb.org//1943274/2147480429/718-10-50-2
Reference 28: http://www.xbrl.org/2003/role/disclosureRef
-Topic 718
-SubTopic 10
-Name Accounting Standards Codification
-Section 50
-Paragraph 2
-Subparagraph (f)(2)(v)
-Publisher FASB
-URI https://asc.fasb.org//1943274/2147480429/718-10-50-2
| Name: |
us-gaap_ShareBasedCompensationArrangementByShareBasedPaymentAwardLineItems |
| Namespace Prefix: |
us-gaap_ |
| Data Type: |
xbrli:stringItemType |
| Balance Type: |
na |
| Period Type: |
duration |
|
| X |
- DefinitionThe number of shares into which fully or partially vested stock options outstanding as of the balance sheet date can be currently converted under the option plan. Reference 1: http://www.xbrl.org/2003/role/disclosureRef
-Topic 718
-SubTopic 10
-Name Accounting Standards Codification
-Section 50
-Paragraph 2
-Subparagraph (c)(1)(iii)
-Publisher FASB
-URI https://asc.fasb.org//1943274/2147480429/718-10-50-2
| Name: |
us-gaap_ShareBasedCompensationArrangementByShareBasedPaymentAwardOptionsExercisableNumber |
| Namespace Prefix: |
us-gaap_ |
| Data Type: |
xbrli:sharesItemType |
| Balance Type: |
na |
| Period Type: |
instant |
|
| X |
- DefinitionThe weighted-average price as of the balance sheet date at which grantees can acquire the shares reserved for issuance on vested portions of options outstanding and currently exercisable under the stock option plan. Reference 1: http://www.xbrl.org/2003/role/disclosureRef
-Topic 718
-SubTopic 10
-Name Accounting Standards Codification
-Section 50
-Paragraph 2
-Subparagraph (c)(1)(iii)
-Publisher FASB
-URI https://asc.fasb.org//1943274/2147480429/718-10-50-2
| Name: |
us-gaap_ShareBasedCompensationArrangementByShareBasedPaymentAwardOptionsExercisableWeightedAverageExercisePrice |
| Namespace Prefix: |
us-gaap_ |
| Data Type: |
dtr-types:perShareItemType |
| Balance Type: |
na |
| Period Type: |
instant |
|
| X |
- DefinitionFor presentations that combine terminations, the number of shares under options that were cancelled during the reporting period as a result of occurrence of a terminating event specified in contractual agreements pertaining to the stock option plan or that expired. Reference 1: http://www.xbrl.org/2009/role/commonPracticeRef
-Topic 718
-SubTopic 10
-Name Accounting Standards Codification
-Section 50
-Paragraph 2
-Subparagraph (c)(1)(iv)
-Publisher FASB
-URI https://asc.fasb.org//1943274/2147480429/718-10-50-2
| Name: |
us-gaap_ShareBasedCompensationArrangementByShareBasedPaymentAwardOptionsForfeituresAndExpirationsInPeriod |
| Namespace Prefix: |
us-gaap_ |
| Data Type: |
xbrli:sharesItemType |
| Balance Type: |
na |
| Period Type: |
duration |
|
| X |
- DefinitionWeighted average price of options that were either forfeited or expired. Reference 1: http://www.xbrl.org/2009/role/commonPracticeRef
-Topic 718
-SubTopic 10
-Name Accounting Standards Codification
-Section 50
-Paragraph 2
-Subparagraph (c)(1)(iv)
-Publisher FASB
-URI https://asc.fasb.org//1943274/2147480429/718-10-50-2
| Name: |
us-gaap_ShareBasedCompensationArrangementByShareBasedPaymentAwardOptionsForfeituresAndExpirationsInPeriodWeightedAverageExercisePrice |
| Namespace Prefix: |
us-gaap_ |
| Data Type: |
dtr-types:perShareItemType |
| Balance Type: |
na |
| Period Type: |
duration |
|
| X |
- DefinitionGross number of share options (or share units) granted during the period. Reference 1: http://www.xbrl.org/2003/role/disclosureRef
-Topic 718
-SubTopic 10
-Name Accounting Standards Codification
-Section 50
-Paragraph 2
-Subparagraph (c)(1)(iv)(01)
-Publisher FASB
-URI https://asc.fasb.org//1943274/2147480429/718-10-50-2
| Name: |
us-gaap_ShareBasedCompensationArrangementByShareBasedPaymentAwardOptionsGrantsInPeriodGross |
| Namespace Prefix: |
us-gaap_ |
| Data Type: |
xbrli:sharesItemType |
| Balance Type: |
na |
| Period Type: |
duration |
|
| X |
- DefinitionAmount by which the current fair value of the underlying stock exceeds the exercise price of options outstanding. Reference 1: http://fasb.org/us-gaap/role/ref/legacyRef
-Name Accounting Standards Codification
-Topic 718
-SubTopic 10
-Section 50
-Paragraph 2
-Publisher FASB
-URI https://asc.fasb.org//1943274/2147480429/718-10-50-2
| Name: |
us-gaap_ShareBasedCompensationArrangementByShareBasedPaymentAwardOptionsOutstandingIntrinsicValue |
| Namespace Prefix: |
us-gaap_ |
| Data Type: |
xbrli:monetaryItemType |
| Balance Type: |
debit |
| Period Type: |
instant |
|
| X |
- DefinitionNumber of options outstanding, including both vested and non-vested options. Reference 1: http://www.xbrl.org/2003/role/disclosureRef
-Topic 718
-SubTopic 10
-Name Accounting Standards Codification
-Section 50
-Paragraph 2
-Subparagraph (c)(1)(i)
-Publisher FASB
-URI https://asc.fasb.org//1943274/2147480429/718-10-50-2
Reference 2: http://www.xbrl.org/2003/role/disclosureRef
-Topic 718
-SubTopic 10
-Name Accounting Standards Codification
-Section 50
-Paragraph 2
-Subparagraph (c)(1)(ii)
-Publisher FASB
-URI https://asc.fasb.org//1943274/2147480429/718-10-50-2
| Name: |
us-gaap_ShareBasedCompensationArrangementByShareBasedPaymentAwardOptionsOutstandingNumber |
| Namespace Prefix: |
us-gaap_ |
| Data Type: |
xbrli:sharesItemType |
| Balance Type: |
na |
| Period Type: |
instant |
|
| X |
- DefinitionWeighted average price at which grantees can acquire the shares reserved for issuance under the stock option plan. Reference 1: http://www.xbrl.org/2003/role/disclosureRef
-Topic 718
-SubTopic 10
-Name Accounting Standards Codification
-Section 50
-Paragraph 2
-Subparagraph (c)(1)(i)
-Publisher FASB
-URI https://asc.fasb.org//1943274/2147480429/718-10-50-2
Reference 2: http://www.xbrl.org/2003/role/disclosureRef
-Topic 718
-SubTopic 10
-Name Accounting Standards Codification
-Section 50
-Paragraph 2
-Subparagraph (c)(1)(ii)
-Publisher FASB
-URI https://asc.fasb.org//1943274/2147480429/718-10-50-2
| Name: |
us-gaap_ShareBasedCompensationArrangementByShareBasedPaymentAwardOptionsOutstandingWeightedAverageExercisePrice |
| Namespace Prefix: |
us-gaap_ |
| Data Type: |
dtr-types:perShareItemType |
| Balance Type: |
na |
| Period Type: |
instant |
|
| X |
- DefinitionWeighted average per share amount at which grantees can acquire shares of common stock by exercise of options. Reference 1: http://www.xbrl.org/2003/role/disclosureRef
-Topic 718
-SubTopic 10
-Name Accounting Standards Codification
-Section 50
-Paragraph 2
-Subparagraph (c)(1)(iv)(01)
-Publisher FASB
-URI https://asc.fasb.org//1943274/2147480429/718-10-50-2
| Name: |
us-gaap_ShareBasedCompensationArrangementsByShareBasedPaymentAwardOptionsGrantsInPeriodWeightedAverageExercisePrice |
| Namespace Prefix: |
us-gaap_ |
| Data Type: |
dtr-types:perShareItemType |
| Balance Type: |
na |
| Period Type: |
duration |
|
| X |
- DefinitionAmount of difference between fair value of the underlying shares reserved for issuance and exercise price of vested portions of options outstanding and currently exercisable. Reference 1: http://fasb.org/us-gaap/role/ref/legacyRef
-Name Accounting Standards Codification
-Topic 718
-SubTopic 10
-Section 50
-Paragraph 2
-Publisher FASB
-URI https://asc.fasb.org//1943274/2147480429/718-10-50-2
| Name: |
us-gaap_SharebasedCompensationArrangementBySharebasedPaymentAwardOptionsExercisableIntrinsicValue1 |
| Namespace Prefix: |
us-gaap_ |
| Data Type: |
xbrli:monetaryItemType |
| Balance Type: |
debit |
| Period Type: |
instant |
|
| X |
- DefinitionWeighted average remaining contractual term for vested portions of options outstanding and currently exercisable or convertible, in 'PnYnMnDTnHnMnS' format, for example, 'P1Y5M13D' represents the reported fact of one year, five months, and thirteen days. Reference 1: http://fasb.org/us-gaap/role/ref/legacyRef
-Name Accounting Standards Codification
-Topic 718
-SubTopic 10
-Section 50
-Paragraph 2
-Publisher FASB
-URI https://asc.fasb.org//1943274/2147480429/718-10-50-2
| Name: |
us-gaap_SharebasedCompensationArrangementBySharebasedPaymentAwardOptionsExercisableWeightedAverageRemainingContractualTerm1 |
| Namespace Prefix: |
us-gaap_ |
| Data Type: |
xbrli:durationItemType |
| Balance Type: |
na |
| Period Type: |
duration |
|
| X |
- DefinitionWeighted average remaining contractual term for option awards outstanding, in 'PnYnMnDTnHnMnS' format, for example, 'P1Y5M13D' represents the reported fact of one year, five months, and thirteen days. Reference 1: http://fasb.org/us-gaap/role/ref/legacyRef
-Topic 718
-SubTopic 10
-Subparagraph (e)(1)
-Name Accounting Standards Codification
-Paragraph 2
-Section 50
-Publisher FASB
-URI https://asc.fasb.org//1943274/2147480429/718-10-50-2
| Name: |
us-gaap_SharebasedCompensationArrangementBySharebasedPaymentAwardOptionsOutstandingWeightedAverageRemainingContractualTerm2 |
| Namespace Prefix: |
us-gaap_ |
| Data Type: |
xbrli:durationItemType |
| Balance Type: |
na |
| Period Type: |
duration |
|
| X |
- Details
| Name: |
us-gaap_AwardTypeAxis=us-gaap_StockOptionMember |
| Namespace Prefix: |
|
| Data Type: |
na |
| Balance Type: |
|
| Period Type: |
|
|
v3.23.2
Stock-Based Compensation (Details Narrative) - USD ($)
|
|
|
3 Months Ended |
6 Months Ended |
|
Apr. 14, 2022 |
Jan. 06, 2022 |
Jun. 30, 2023 |
Jun. 30, 2022 |
Jun. 30, 2023 |
Jun. 30, 2022 |
Dec. 31, 2022 |
| Share-Based Compensation Arrangement by Share-Based Payment Award [Line Items] |
|
|
|
|
|
|
|
| Allocated share based compensation expense |
|
|
$ 115,456
|
$ 22,960
|
$ 233,618
|
$ 102,992
|
|
| Fair value of stock options |
|
|
|
|
390,221
|
$ 10,238
|
|
| Weighted-average grant date fair value of options granted |
|
|
|
|
|
$ 5.22
|
|
| Unrecognized compensation costs |
|
|
$ 778,893
|
|
$ 778,893
|
|
$ 1,019,140
|
| Weighted-average period |
|
|
|
|
2 years
|
|
|
| Employee [Member] |
|
|
|
|
|
|
|
| Share-Based Compensation Arrangement by Share-Based Payment Award [Line Items] |
|
|
|
|
|
|
|
| Stock option granted |
220,587
|
|
|
|
|
|
|
| Stock option exercise price |
$ 6.08
|
|
|
|
|
|
|
| Fair value of stock options |
$ 1,152,470
|
|
|
|
|
|
|
| Restricted Stock [Member] |
|
|
|
|
|
|
|
| Share-Based Compensation Arrangement by Share-Based Payment Award [Line Items] |
|
|
|
|
|
|
|
| Stock issued during period, shares, restricted stock award |
|
8,097
|
|
|
|
|
|
| Allocated share based compensation expense |
|
|
|
|
|
$ 57,500
|
|
| X |
- DefinitionAmount of expense for award under share-based payment arrangement. Excludes amount capitalized. Reference 1: http://www.xbrl.org/2003/role/disclosureRef
-Topic 718
-SubTopic 10
-Name Accounting Standards Codification
-Section S99
-Paragraph 1
-Subparagraph (SAB Topic 14.F)
-Publisher FASB
-URI https://asc.fasb.org//1943274/2147479830/718-10-S99-1
Reference 2: http://www.xbrl.org/2003/role/disclosureRef
-Topic 718
-SubTopic 10
-Name Accounting Standards Codification
-Section 50
-Paragraph 2
-Subparagraph (h)(1)(i)
-Publisher FASB
-URI https://asc.fasb.org//1943274/2147480429/718-10-50-2
| Name: |
us-gaap_AllocatedShareBasedCompensationExpense |
| Namespace Prefix: |
us-gaap_ |
| Data Type: |
xbrli:monetaryItemType |
| Balance Type: |
debit |
| Period Type: |
duration |
|
| X |
- DefinitionWeighted-average period over which cost not yet recognized is expected to be recognized for award under share-based payment arrangement, in 'PnYnMnDTnHnMnS' format, for example, 'P1Y5M13D' represents reported fact of one year, five months, and thirteen days. Reference 1: http://www.xbrl.org/2003/role/disclosureRef
-Topic 718
-SubTopic 10
-Name Accounting Standards Codification
-Section 50
-Paragraph 2
-Subparagraph (i)
-Publisher FASB
-URI https://asc.fasb.org//1943274/2147480429/718-10-50-2
| Name: |
us-gaap_EmployeeServiceShareBasedCompensationNonvestedAwardsTotalCompensationCostNotYetRecognizedPeriodForRecognition1 |
| Namespace Prefix: |
us-gaap_ |
| Data Type: |
xbrli:durationItemType |
| Balance Type: |
na |
| Period Type: |
duration |
|
| X |
- DefinitionAmount of cost to be recognized for option under share-based payment arrangement. Reference 1: http://www.xbrl.org/2009/role/commonPracticeRef
-Topic 718
-SubTopic 10
-Name Accounting Standards Codification
-Section 50
-Paragraph 2
-Subparagraph (i)
-Publisher FASB
-URI https://asc.fasb.org//1943274/2147480429/718-10-50-2
| Name: |
us-gaap_EmployeeServiceShareBasedCompensationNonvestedAwardsTotalCompensationCostNotYetRecognizedStockOptions |
| Namespace Prefix: |
us-gaap_ |
| Data Type: |
xbrli:monetaryItemType |
| Balance Type: |
debit |
| Period Type: |
instant |
|
| X |
- DefinitionLine items represent financial concepts included in a table. These concepts are used to disclose reportable information associated with domain members defined in one or many axes to the table. Reference 1: http://www.xbrl.org/2003/role/disclosureRef
-Topic 718
-SubTopic 10
-Name Accounting Standards Codification
-Section 35
-Paragraph 1D
-Publisher FASB
-URI https://asc.fasb.org//1943274/2147480483/718-10-35-1D
Reference 2: http://www.xbrl.org/2003/role/disclosureRef
-Topic 718
-SubTopic 10
-Name Accounting Standards Codification
-Section 35
-Paragraph 3
-Publisher FASB
-URI https://asc.fasb.org//1943274/2147480483/718-10-35-3
Reference 3: http://www.xbrl.org/2003/role/disclosureRef
-Topic 718
-SubTopic 10
-Name Accounting Standards Codification
-Section 50
-Paragraph 2
-Subparagraph (a)(1)
-Publisher FASB
-URI https://asc.fasb.org//1943274/2147480429/718-10-50-2
Reference 4: http://www.xbrl.org/2003/role/disclosureRef
-Topic 718
-SubTopic 10
-Name Accounting Standards Codification
-Section 50
-Paragraph 2
-Subparagraph (a)(2)
-Publisher FASB
-URI https://asc.fasb.org//1943274/2147480429/718-10-50-2
Reference 5: http://www.xbrl.org/2003/role/disclosureRef
-Topic 718
-SubTopic 10
-Name Accounting Standards Codification
-Section 50
-Paragraph 2
-Subparagraph (a)(3)
-Publisher FASB
-URI https://asc.fasb.org//1943274/2147480429/718-10-50-2
Reference 6: http://www.xbrl.org/2003/role/disclosureRef
-Topic 718
-SubTopic 10
-Name Accounting Standards Codification
-Section 50
-Paragraph 2
-Subparagraph (c)(1)(i)
-Publisher FASB
-URI https://asc.fasb.org//1943274/2147480429/718-10-50-2
Reference 7: http://www.xbrl.org/2003/role/disclosureRef
-Topic 718
-SubTopic 10
-Name Accounting Standards Codification
-Section 50
-Paragraph 2
-Subparagraph (c)(1)(ii)
-Publisher FASB
-URI https://asc.fasb.org//1943274/2147480429/718-10-50-2
Reference 8: http://www.xbrl.org/2003/role/disclosureRef
-Topic 718
-SubTopic 10
-Name Accounting Standards Codification
-Section 50
-Paragraph 2
-Subparagraph (c)(1)(iii)
-Publisher FASB
-URI https://asc.fasb.org//1943274/2147480429/718-10-50-2
Reference 9: http://www.xbrl.org/2003/role/disclosureRef
-Topic 718
-SubTopic 10
-Name Accounting Standards Codification
-Section 50
-Paragraph 2
-Subparagraph (c)(1)(iv)
-Publisher FASB
-URI https://asc.fasb.org//1943274/2147480429/718-10-50-2
Reference 10: http://www.xbrl.org/2003/role/disclosureRef
-Topic 718
-SubTopic 10
-Name Accounting Standards Codification
-Section 50
-Paragraph 2
-Subparagraph (c)(1)(iv)(01)
-Publisher FASB
-URI https://asc.fasb.org//1943274/2147480429/718-10-50-2
Reference 11: http://www.xbrl.org/2003/role/disclosureRef
-Topic 718
-SubTopic 10
-Name Accounting Standards Codification
-Section 50
-Paragraph 2
-Subparagraph (c)(1)(iv)(02)
-Publisher FASB
-URI https://asc.fasb.org//1943274/2147480429/718-10-50-2
Reference 12: http://www.xbrl.org/2003/role/disclosureRef
-Topic 718
-SubTopic 10
-Name Accounting Standards Codification
-Section 50
-Paragraph 2
-Subparagraph (c)(1)(iv)(03)
-Publisher FASB
-URI https://asc.fasb.org//1943274/2147480429/718-10-50-2
Reference 13: http://www.xbrl.org/2003/role/disclosureRef
-Topic 718
-SubTopic 10
-Name Accounting Standards Codification
-Section 50
-Paragraph 2
-Subparagraph (c)(1)(iv)(04)
-Publisher FASB
-URI https://asc.fasb.org//1943274/2147480429/718-10-50-2
Reference 14: http://www.xbrl.org/2003/role/disclosureRef
-Topic 718
-SubTopic 10
-Name Accounting Standards Codification
-Section 50
-Paragraph 2
-Subparagraph (c)(2)(i)
-Publisher FASB
-URI https://asc.fasb.org//1943274/2147480429/718-10-50-2
Reference 15: http://www.xbrl.org/2003/role/disclosureRef
-Topic 718
-SubTopic 10
-Name Accounting Standards Codification
-Section 50
-Paragraph 2
-Subparagraph (c)(2)(ii)
-Publisher FASB
-URI https://asc.fasb.org//1943274/2147480429/718-10-50-2
Reference 16: http://www.xbrl.org/2003/role/disclosureRef
-Topic 718
-SubTopic 10
-Name Accounting Standards Codification
-Section 50
-Paragraph 2
-Subparagraph (c)(2)(iii)
-Publisher FASB
-URI https://asc.fasb.org//1943274/2147480429/718-10-50-2
Reference 17: http://www.xbrl.org/2003/role/disclosureRef
-Topic 718
-SubTopic 10
-Name Accounting Standards Codification
-Section 50
-Paragraph 2
-Subparagraph (c)(2)(iii)(01)
-Publisher FASB
-URI https://asc.fasb.org//1943274/2147480429/718-10-50-2
Reference 18: http://www.xbrl.org/2003/role/disclosureRef
-Topic 718
-SubTopic 10
-Name Accounting Standards Codification
-Section 50
-Paragraph 2
-Subparagraph (c)(2)(iii)(02)
-Publisher FASB
-URI https://asc.fasb.org//1943274/2147480429/718-10-50-2
Reference 19: http://www.xbrl.org/2003/role/disclosureRef
-Topic 718
-SubTopic 10
-Name Accounting Standards Codification
-Section 50
-Paragraph 2
-Subparagraph (c)(2)(iii)(03)
-Publisher FASB
-URI https://asc.fasb.org//1943274/2147480429/718-10-50-2
Reference 20: http://www.xbrl.org/2003/role/disclosureRef
-Topic 718
-SubTopic 10
-Name Accounting Standards Codification
-Section 50
-Paragraph 2
-Subparagraph (d)(1)
-Publisher FASB
-URI https://asc.fasb.org//1943274/2147480429/718-10-50-2
Reference 21: http://www.xbrl.org/2003/role/disclosureRef
-Topic 718
-SubTopic 10
-Name Accounting Standards Codification
-Section 50
-Paragraph 2
-Subparagraph (d)(2)
-Publisher FASB
-URI https://asc.fasb.org//1943274/2147480429/718-10-50-2
Reference 22: http://www.xbrl.org/2003/role/disclosureRef
-Topic 718
-SubTopic 10
-Name Accounting Standards Codification
-Section 50
-Paragraph 2
-Subparagraph (e)(1)
-Publisher FASB
-URI https://asc.fasb.org//1943274/2147480429/718-10-50-2
Reference 23: http://www.xbrl.org/2003/role/disclosureRef
-Topic 718
-SubTopic 10
-Name Accounting Standards Codification
-Section 50
-Paragraph 2
-Subparagraph (e)(2)
-Publisher FASB
-URI https://asc.fasb.org//1943274/2147480429/718-10-50-2
Reference 24: http://www.xbrl.org/2003/role/disclosureRef
-Topic 718
-SubTopic 10
-Name Accounting Standards Codification
-Section 50
-Paragraph 2
-Subparagraph (f)(2)(i)
-Publisher FASB
-URI https://asc.fasb.org//1943274/2147480429/718-10-50-2
Reference 25: http://www.xbrl.org/2003/role/disclosureRef
-Topic 718
-SubTopic 10
-Name Accounting Standards Codification
-Section 50
-Paragraph 2
-Subparagraph (f)(2)(ii)
-Publisher FASB
-URI https://asc.fasb.org//1943274/2147480429/718-10-50-2
Reference 26: http://www.xbrl.org/2003/role/disclosureRef
-Topic 718
-SubTopic 10
-Name Accounting Standards Codification
-Section 50
-Paragraph 2
-Subparagraph (f)(2)(iii)
-Publisher FASB
-URI https://asc.fasb.org//1943274/2147480429/718-10-50-2
Reference 27: http://www.xbrl.org/2003/role/disclosureRef
-Topic 718
-SubTopic 10
-Name Accounting Standards Codification
-Section 50
-Paragraph 2
-Subparagraph (f)(2)(iv)
-Publisher FASB
-URI https://asc.fasb.org//1943274/2147480429/718-10-50-2
Reference 28: http://www.xbrl.org/2003/role/disclosureRef
-Topic 718
-SubTopic 10
-Name Accounting Standards Codification
-Section 50
-Paragraph 2
-Subparagraph (f)(2)(v)
-Publisher FASB
-URI https://asc.fasb.org//1943274/2147480429/718-10-50-2
| Name: |
us-gaap_ShareBasedCompensationArrangementByShareBasedPaymentAwardLineItems |
| Namespace Prefix: |
us-gaap_ |
| Data Type: |
xbrli:stringItemType |
| Balance Type: |
na |
| Period Type: |
duration |
|
| X |
- DefinitionThe weighted average grant-date fair value of options granted during the reporting period as calculated by applying the disclosed option pricing methodology. Reference 1: http://www.xbrl.org/2003/role/disclosureRef
-Topic 718
-SubTopic 10
-Name Accounting Standards Codification
-Section 50
-Paragraph 2
-Subparagraph (d)(1)
-Publisher FASB
-URI https://asc.fasb.org//1943274/2147480429/718-10-50-2
| Name: |
us-gaap_ShareBasedCompensationArrangementByShareBasedPaymentAwardOptionsGrantsInPeriodWeightedAverageGrantDateFairValue |
| Namespace Prefix: |
us-gaap_ |
| Data Type: |
dtr-types:perShareItemType |
| Balance Type: |
na |
| Period Type: |
duration |
|
| X |
- DefinitionPer share weighted-average price paid for shares purchased on open market for issuance under share-based payment arrangement. Reference 1: http://fasb.org/us-gaap/role/ref/legacyRef
-Name Accounting Standards Codification
-Topic 718
-SubTopic 10
-Section 50
-Paragraph 2
-Publisher FASB
-URI https://asc.fasb.org//1943274/2147480429/718-10-50-2
| Name: |
us-gaap_ShareBasedCompensationArrangementByShareBasedPaymentAwardPerShareWeightedAveragePriceOfSharesPurchased |
| Namespace Prefix: |
us-gaap_ |
| Data Type: |
dtr-types:perShareItemType |
| Balance Type: |
na |
| Period Type: |
instant |
|
| X |
- DefinitionNumber of shares purchased for issuance under share-based payment arrangement. Reference 1: http://www.xbrl.org/2009/role/commonPracticeRef
-Topic 718
-SubTopic 10
-Name Accounting Standards Codification
-Section 50
-Paragraph 2
-Subparagraph (l)
-Publisher FASB
-URI https://asc.fasb.org//1943274/2147480429/718-10-50-2
| Name: |
us-gaap_ShareBasedCompensationArrangementByShareBasedPaymentAwardSharesPurchasedForAward |
| Namespace Prefix: |
us-gaap_ |
| Data Type: |
xbrli:sharesItemType |
| Balance Type: |
na |
| Period Type: |
duration |
|
| X |
- DefinitionFair value of options vested. Excludes equity instruments other than options, for example, but not limited to, share units, stock appreciation rights, restricted stock. Reference 1: http://www.xbrl.org/2003/role/disclosureRef
-Topic 718
-SubTopic 10
-Name Accounting Standards Codification
-Section 50
-Paragraph 2
-Subparagraph (d)(2)
-Publisher FASB
-URI https://asc.fasb.org//1943274/2147480429/718-10-50-2
| Name: |
us-gaap_SharebasedCompensationArrangementBySharebasedPaymentAwardOptionsVestedInPeriodFairValue1 |
| Namespace Prefix: |
us-gaap_ |
| Data Type: |
xbrli:monetaryItemType |
| Balance Type: |
credit |
| Period Type: |
duration |
|
| X |
- DefinitionTotal number of shares issued during the period, including shares forfeited, as a result of Restricted Stock Awards. Reference 1: http://fasb.org/us-gaap/role/ref/legacyRef
-Name Accounting Standards Codification
-Section 50
-Paragraph 2
-SubTopic 10
-Topic 505
-Publisher FASB
-URI https://asc.fasb.org//1943274/2147481112/505-10-50-2
Reference 2: http://fasb.org/us-gaap/role/ref/legacyRef
-Topic 505
-SubTopic 10
-Name Accounting Standards Codification
-Section S99
-Paragraph 1
-Subparagraph (SX 210.3-04)
-Publisher FASB
-URI https://asc.fasb.org//1943274/2147480008/505-10-S99-1
| Name: |
us-gaap_StockIssuedDuringPeriodSharesRestrictedStockAwardGross |
| Namespace Prefix: |
us-gaap_ |
| Data Type: |
xbrli:sharesItemType |
| Balance Type: |
na |
| Period Type: |
duration |
|
| X |
- Details
| Name: |
srt_TitleOfIndividualAxis=INLX_EmployeeMember |
| Namespace Prefix: |
|
| Data Type: |
na |
| Balance Type: |
|
| Period Type: |
|
|
| X |
- Details
| Name: |
us-gaap_AwardTypeAxis=us-gaap_RestrictedStockMember |
| Namespace Prefix: |
|
| Data Type: |
na |
| Balance Type: |
|
| Period Type: |
|
|
v3.23.2
Concentrations (Details Narrative) - Customer Concentration Risk [Member]
|
3 Months Ended |
6 Months Ended |
12 Months Ended |
Jun. 30, 2023 |
Jun. 30, 2022 |
Jun. 30, 2023 |
Jun. 30, 2022 |
Dec. 31, 2022 |
| State of Michigan [Member] | Revenue Benchmark [Member] |
|
|
|
|
|
| Concentration Risk [Line Items] |
|
|
|
|
|
| Concentration risk, percentage |
36.00%
|
35.00%
|
35.00%
|
37.00%
|
|
| Rocket Mortgage [Member] | Revenue Benchmark [Member] |
|
|
|
|
|
| Concentration Risk [Line Items] |
|
|
|
|
|
| Concentration risk, percentage |
5.00%
|
6.00%
|
5.00%
|
8.00%
|
|
| Government Contracts [Member] | Revenue Benchmark [Member] |
|
|
|
|
|
| Concentration Risk [Line Items] |
|
|
|
|
|
| Concentration risk, percentage |
79.00%
|
77.00%
|
76.00%
|
72.00%
|
|
| Customer One [Member] | Accounts Receivable [Member] |
|
|
|
|
|
| Concentration Risk [Line Items] |
|
|
|
|
|
| Concentration risk, percentage |
|
|
37.00%
|
|
44.00%
|
| Customer Two [Member] | Accounts Receivable [Member] |
|
|
|
|
|
| Concentration Risk [Line Items] |
|
|
|
|
|
| Concentration risk, percentage |
|
|
10.00%
|
|
7.00%
|
| X |
- DefinitionLine items represent financial concepts included in a table. These concepts are used to disclose reportable information associated with domain members defined in one or many axes to the table. Reference 1: http://www.xbrl.org/2003/role/disclosureRef
-Topic 954
-SubTopic 310
-Name Accounting Standards Codification
-Section 50
-Paragraph 2
-Publisher FASB
-URI https://asc.fasb.org//1943274/2147481027/954-310-50-2
| Name: |
us-gaap_ConcentrationRiskLineItems |
| Namespace Prefix: |
us-gaap_ |
| Data Type: |
xbrli:stringItemType |
| Balance Type: |
na |
| Period Type: |
duration |
|
| X |
- DefinitionFor an entity that discloses a concentration risk in relation to quantitative amount, which serves as the "benchmark" (or denominator) in the equation, this concept represents the concentration percentage derived from the division. Reference 1: http://www.xbrl.org/2003/role/disclosureRef
-Topic 280
-SubTopic 10
-Name Accounting Standards Codification
-Section 50
-Paragraph 42
-Publisher FASB
-URI https://asc.fasb.org//1943274/2147482810/280-10-50-42
Reference 2: http://fasb.org/us-gaap/role/ref/legacyRef
-Name Accounting Standards Codification
-Topic 825
-SubTopic 10
-Section 50
-Paragraph 21
-Subparagraph (a)
-Publisher FASB
-URI https://asc.fasb.org//1943274/2147482907/825-10-50-21
Reference 3: http://fasb.org/us-gaap/role/ref/legacyRef
-Name Accounting Standards Codification
-Topic 825
-SubTopic 10
-Section 50
-Paragraph 20
-Publisher FASB
-URI https://asc.fasb.org//1943274/2147482907/825-10-50-20
Reference 4: http://fasb.org/us-gaap/role/ref/legacyRef
-Name Accounting Standards Codification
-Topic 275
-SubTopic 10
-Section 50
-Paragraph 18
-Publisher FASB
-URI https://asc.fasb.org//1943274/2147482861/275-10-50-18
Reference 5: http://fasb.org/us-gaap/role/ref/legacyRef
-Name Accounting Standards Codification
-Topic 275
-SubTopic 10
-Section 50
-Paragraph 20
-Publisher FASB
-URI https://asc.fasb.org//1943274/2147482861/275-10-50-20
| Name: |
us-gaap_ConcentrationRiskPercentage1 |
| Namespace Prefix: |
us-gaap_ |
| Data Type: |
dtr-types:percentItemType |
| Balance Type: |
na |
| Period Type: |
duration |
|
| X |
- Details
| Name: |
srt_MajorCustomersAxis=INLX_StateOfMichiganMember |
| Namespace Prefix: |
|
| Data Type: |
na |
| Balance Type: |
|
| Period Type: |
|
|
| X |
- Details
| Name: |
us-gaap_ConcentrationRiskByBenchmarkAxis=us-gaap_SalesRevenueNetMember |
| Namespace Prefix: |
|
| Data Type: |
na |
| Balance Type: |
|
| Period Type: |
|
|
| X |
- Details
| Name: |
us-gaap_ConcentrationRiskByTypeAxis=us-gaap_CustomerConcentrationRiskMember |
| Namespace Prefix: |
|
| Data Type: |
na |
| Balance Type: |
|
| Period Type: |
|
|
| X |
- Details
| Name: |
srt_MajorCustomersAxis=INLX_RocketMortgageMember |
| Namespace Prefix: |
|
| Data Type: |
na |
| Balance Type: |
|
| Period Type: |
|
|
| X |
- Details
| Name: |
srt_MajorCustomersAxis=INLX_GovernmentContractsMember |
| Namespace Prefix: |
|
| Data Type: |
na |
| Balance Type: |
|
| Period Type: |
|
|
| X |
- Details
| Name: |
srt_MajorCustomersAxis=INLX_CustomerOneMember |
| Namespace Prefix: |
|
| Data Type: |
na |
| Balance Type: |
|
| Period Type: |
|
|
| X |
- Details
| Name: |
us-gaap_ConcentrationRiskByBenchmarkAxis=us-gaap_AccountsReceivableMember |
| Namespace Prefix: |
|
| Data Type: |
na |
| Balance Type: |
|
| Period Type: |
|
|
| X |
- Details
| Name: |
srt_MajorCustomersAxis=INLX_CustomerTwoMember |
| Namespace Prefix: |
|
| Data Type: |
na |
| Balance Type: |
|
| Period Type: |
|
|
Intellinetics (AMEX:INLX)
Historical Stock Chart
From Mar 2024 to Apr 2024

Intellinetics (AMEX:INLX)
Historical Stock Chart
From Apr 2023 to Apr 2024
