UNITED STATES
SECURITIES AND EXCHANGE COMMISSION
Washington, D.C. 20549
FORM 6-K
REPORT OF
FOREIGN PRIVATE ISSUER
PURSUANT TO RULE 13a-16 or
15d-16
UNDER THE SECURITIES EXCHANGE ACT OF 1934
For the month of July 2023
Commission File Number: 001-14946
Cemex, S.A.B. de C.V.
(Translation of Registrant’s name into English)
Avenida
Ricardo Margáin Zozaya #325, Colonia Valle del Campestre,
San Pedro Garza García, Nuevo León 66265,
México
(Address of principal executive offices)
Indicate by check mark whether the registrant files or will file annual reports under cover Form 20-F or Form 40-F.
Form
20-F ☒ Form 40-F ☐
Indicate by check mark if the registrant is submitting the Form 6-K in paper as permitted by Regulation S-T Rule 101(b)(1):
Indicate by check mark if the registrant is submitting the Form
6-K in paper as permitted by Regulation S-T Rule 101(b)(7):
Contents
|
|
|
| 1. |
|
Press release dated July 27, 2023, announcing second quarter 2023 results for Cemex, S.A.B. de C.V. (NYSE: CX) (“Cemex”). |
|
|
| 2. |
|
Second quarter 2023 results for Cemex. |
|
|
| 3. |
|
Presentation regarding second quarter 2023 results for Cemex. |
SIGNATURE
Pursuant to the requirements of the Securities Exchange Act of 1934, Cemex, S.A.B. de C.V. has duly caused this report to be signed on its
behalf by the undersigned, thereunto duly authorized.
|
|
|
|
|
|
|
|
|
|
|
|
|
Cemex, S.A.B. de C.V. |
|
|
|
|
|
|
(Registrant) |
|
|
|
|
| Date: July 27, 2023 |
|
|
|
By: |
|
/s/ Rafael Garza Lozano |
|
|
|
|
|
|
Name: Rafael Garza Lozano |
|
|
|
|
|
|
Title: Chief Comptroller |
3
EXHIBIT INDEX
|
|
|
EXHIBIT
NO. |
|
DESCRIPTION |
|
|
| 1. |
|
Press release dated July 27, 2023, announcing second quarter 2023 results for Cemex, S.A.B. de C.V. (NYSE: CX) (“Cemex”). |
|
|
| 2. |
|
Second quarter 2023 results for Cemex. |
|
|
| 3. |
|
Presentation regarding second quarter 2023 results for Cemex. |
4
Exhibit 1

Cemex reports record quarterly EBITDA with
significant margin recovery
Monterrey,
Mexico. July 27, 2023 – Cemex reported second quarter of 2023 results today with a 10% growth in Sales and 29% growth in EBITDA, and EBITDA Margin expanding by 3.3pp to 21.1%. With these results, Cemex is close to its
goal of recovering 2021 margins, set in 2022 in response to unprecedented inflation.
The improvement in EBITDA across all regions reflects not only the
success of Cemex’s pricing strategy and decelerating input cost inflation but also the incremental contribution from its growth investments portfolio and expanding Urbanization Solutions business.
Cemex’s growth strategy, introduced in 2020, focuses on bolt-on and margin enhancement investments across its
four core businesses, mainly in developed markets. Cemex’s Urbanization Solutions business, Cemex’s newest core business and a primary beneficiary of these investments, has been growing at a 20% compound annual growth rate since its launch
in 2019. Urbanization Solutions now represents 9% of Cemex’s consolidated EBITDA. During the second quarter, the incremental EBITDA from growth investments and Urbanization Solutions business was close to US$50 million dollars versus the
same period of the previous year.
“The success of our pricing strategy, bolt-on investments, and
Urbanization Solutions business, as well as decelerating cost inflation, are driving what is shaping up to be a very strong year for our company,” said Fernando A. González, CEO of Cemex. “One of our main priorities has been to
recover 2021 margins, and we are getting very close. Our growth investment strategy and our Urbanization Solutions business are ramping up nicely and contributing to profitability in a meaningful way. Beyond our financial results, we continue
progressing on the ambitious carbon reduction and circularity commitments of our Future in Action program, remaining on the path to becoming a net-zero
CO2 company by 2050.”
Cemex’s Consolidated 2023 Second Quarter Financial and
Operational Highlights
| |
• |
|
Net Sales increased 10% to US$4,566 million. |
| |
• |
|
Operating EBITDA increased 29% to US$961 million. |
| |
• |
|
EBITDA margin of 21.1%, taking the company closer to its strategic priority of recovering margins to 2021 levels.
|
| |
• |
|
Free Cash Flow after Maintenance Capital Expenditures was US$278 million, US$124 million higher YoY.
|
| |
• |
|
Year-over-year reduction of 4.4% in CO2 levels in first
half of 2023 vs the same period last year. |
| |
• |
|
Leverage ratio at 2.45x, the lowest level since Cemex started measuring the metric in 2009 in connection with the
signing of its syndicated bank facility. |
| |
• |
|
Incremental EBITDA contribution of US$46 million from growth investments and Urbanization Solutions.
|
| |
• |
|
Increase of 26% in EBITDA from Urbanization Solutions business. |
1
Geographical Markets 2023 Second Quarter Highlights
| |
• |
|
Net Sales in Mexico increased 14% in the second quarter, to US$1,298 million, while Operating EBITDA
increased 9% to US$399 million. EBITDA margin declined 1.3pp to 30.8%. |
| |
• |
|
Cemex’s operation in the United States reported a record quarter, with EBITDA growing 87%, reaching
US$303 million. Net Sales increased 10% to US$1,420 million while EBITDA Margin increased 8.8pp to 21.3%. |
| |
• |
|
In the Europe, Middle East, Africa, and Asia region, Net Sales increased 6% in the Second Quarter, to
US$1,354 million. Operating EBITDA was US$212 million, 11% higher, while EBITDA Margin increased 0.8pp to 15.7%. |
| |
• |
|
Cemex’s operations in South, Central America, and the Caribbean region, reported Net Sales of
US$447 million in the Second Quarter, an increase of 10%, while Operating EBITDA grew 15% to US$112 million. EBITDA Margin increased 1.4pp, to 25.1%. |
Note: All percentage variations related to Net Sales and EBITDA are on a
like-to-like basis for the ongoing operations and for foreign exchange fluctuations compared to the same period of last year.
About Cemex
Cemex, S.A.B. de C.V. (“Cemex”)
(NYSE: CX) is a global construction materials company that is building a better future through sustainable products and solutions. Cemex is committed to achieving carbon neutrality through relentless innovation and industry-leading research and
development. Cemex is at the forefront of the circular economy in the construction value chain and is pioneering ways to increase the use of waste and residues as alternative raw materials and fuels in its operations with the use of new
technologies. Cemex offers cement, ready-mix concrete, aggregates, and urbanization solutions in growing markets around the world, powered by a multinational workforce focused on providing a superior customer
experience, enabled by digital technologies. For more information, please visit: www.cemex.com
Contact information
Analyst and Investor Relations - Monterrey
Fabián Orta
+52 (81) 8888-4327
ir@cemex.com
Analyst and Investor Relations - New York
Scott Pollak
+1 (212) 317-6011
ir@cemex.com
Media Relations
Jorge Pérez
+52 (81) 8259-6666
jorgeluis.perez@cemex.com
###
2
This press release contains, and the reports we will file or furnish in the future may contain,
forward-looking statements within the meaning of the U.S. federal securities laws. Cemex intends these forward-looking statements to be covered by the safe harbor provisions for forward-looking statements in the U.S. federal securities laws. These
forward-looking statements reflect Cemex’s current expectations and projections about future events based on Cemex’s knowledge of present facts and circumstances, and assumptions about future events, as well as Cemex’s current plans
based on such facts and circumstances, unless otherwise indicated. These statements necessarily involve risks, uncertainties, and assumptions that could cause actual results to differ materially from Cemex’s expectations, including, among
others, risks, uncertainties, and assumptions discussed in Cemex’s most recent annual report and detailed from time to time in Cemex’s other filings with the Securities and Exchange Commission and the Mexican Stock Exchange (Bolsa Mexicana
de Valores), which factors are incorporated herein by reference, which if materialized could ultimately lead to Cemex’s expectations, expected results, and/or projections expressed in this press release not being reached and/or producing the
expected benefits and/or results. Forward-looking statements should not be considered guarantees of future performance, nor the results or developments are indicative of results or developments in subsequent periods. Actual results of Cemex’s
operations and the development of market conditions in which Cemex operates, or other circumstances or assumptions suggested by such statements may differ materially from those described in, or suggested by, the forward-looking statements contained
herein. These factors may be revised or supplemented and the information contained in this press release and the report referenced herein is subject to change without notice, but Cemex is not under, and expressly disclaims, any obligation to update
or correct this press release or revise any forward-looking statement contained herein, whether as a result of new information, future events or otherwise, or to reflect the occurrence of anticipated or unanticipated events or circumstances. Any or
all of Cemex’s forward-looking statements may turn out to be inaccurate. Accordingly, undue reliance on forward-looking statements should not be placed, as such forward-looking statements speak only as of the dates on which they are made. The
content of this press release is for informational purposes only, and you should not construe any such information or other material as legal, tax, investment, financial, or other advice. Readers must consult their own legal adviser, investment
adviser, financial adviser, or tax adviser for legal, investment, financial, or tax advice, as appropriate.
3
Exhibit 2
Second Quarter Results 2023

UDEM - Roberto Garza Sada Center, Santa Catarina, Mexico
|
|
|
| Stock Listing Information |
|
Investor Relations |
|
|
| NYSE (ADS) |
|
In the United States: |
|
|
| Ticker: CX |
|
+ 1 877 7CX NYSE |
|
|
| Mexican Stock Exchange (CPO) |
|
In Mexico: |
|
|
| Ticker: CEMEX.CPO |
|
+ 52 (81) 8888 4292 |
|
|
| Ratio of CEMEXCPO to CX = 10:1 |
|
E-Mail: ir@cemex.com |

|
|
|
| Operating and financial highlights |
|

|
|
|
|
|
|
|
|
|
|
|
|
|
|
|
|
|
|
|
|
|
|
|
|
|
|
|
|
|
|
|
|
|
|
| |
|
|
|
|
January - June |
|
|
|
|
|
Second Quarter |
|
| |
|
|
|
|
|
|
|
|
|
|
l-t-l |
|
|
|
|
|
|
|
|
|
|
|
l-t-l |
|
| |
|
2023 |
|
|
2022 |
|
|
% var |
|
|
% var |
|
|
2023 |
|
|
2022 |
|
|
% var |
|
|
% var |
|
| Consolidated domestic gray cement volume |
|
|
25,743 |
|
|
|
27,993 |
|
|
|
(8 |
%) |
|
|
|
|
|
|
13,426 |
|
|
|
14,271 |
|
|
|
(6 |
%) |
|
|
|
|
| Consolidated ready-mix volume |
|
|
24,077 |
|
|
|
25,214 |
|
|
|
(5 |
%) |
|
|
|
|
|
|
12,371 |
|
|
|
13,049 |
|
|
|
(5 |
%) |
|
|
|
|
| Consolidated aggregates volume |
|
|
68,933 |
|
|
|
69,357 |
|
|
|
(1 |
%) |
|
|
|
|
|
|
36,681 |
|
|
|
35,489 |
|
|
|
3 |
% |
|
|
|
|
| Net sales |
|
|
8,602 |
|
|
|
7,753 |
|
|
|
11 |
% |
|
|
10 |
% |
|
|
4,566 |
|
|
|
4,028 |
|
|
|
13 |
% |
|
|
10 |
% |
| Gross profit |
|
|
2,869 |
|
|
|
2,409 |
|
|
|
19 |
% |
|
|
23 |
% |
|
|
1,579 |
|
|
|
1,260 |
|
|
|
25 |
% |
|
|
31 |
% |
| as % of net sales |
|
|
33.3 |
% |
|
|
31.1 |
% |
|
|
2.2pp |
|
|
|
|
|
|
|
34.6 |
% |
|
|
31.3 |
% |
|
|
3.3pp |
|
|
|
|
|
| Operating earnings before other income and expenses, net |
|
|
1,086 |
|
|
|
836 |
|
|
|
30 |
% |
|
|
25 |
% |
|
|
651 |
|
|
|
430 |
|
|
|
51 |
% |
|
|
44 |
% |
| as % of net sales |
|
|
12.6 |
% |
|
|
10.8 |
% |
|
|
1.8pp |
|
|
|
|
|
|
|
14.3 |
% |
|
|
10.7 |
% |
|
|
3.6pp |
|
|
|
|
|
| SG&A expenses as % of net sales |
|
|
6.6 |
% |
|
|
5.8 |
% |
|
|
0.8pp |
|
|
|
|
|
|
|
6.4 |
% |
|
|
5.7 |
% |
|
|
0.7pp |
|
|
|
|
|
| Controlling interest net income (loss) |
|
|
497 |
|
|
|
463 |
|
|
|
7 |
% |
|
|
|
|
|
|
272 |
|
|
|
265 |
|
|
|
2 |
% |
|
|
|
|
| Operating EBITDA |
|
|
1,694 |
|
|
|
1,401 |
|
|
|
21 |
% |
|
|
18 |
% |
|
|
961 |
|
|
|
716 |
|
|
|
34 |
% |
|
|
29 |
% |
| as % of net sales |
|
|
19.7 |
% |
|
|
18.1 |
% |
|
|
1.6pp |
|
|
|
|
|
|
|
21.1 |
% |
|
|
17.8 |
% |
|
|
3.3pp |
|
|
|
|
|
| Free cash flow after maintenance capital expenditures |
|
|
223 |
|
|
|
(20 |
) |
|
|
N/A |
|
|
|
|
|
|
|
278 |
|
|
|
154 |
|
|
|
80 |
% |
|
|
|
|
| Free cash flow |
|
|
54 |
|
|
|
(194 |
) |
|
|
N/A |
|
|
|
|
|
|
|
195 |
|
|
|
56 |
|
|
|
246 |
% |
|
|
|
|
| Total debt |
|
|
7,665 |
|
|
|
8,729 |
|
|
|
(12 |
%) |
|
|
|
|
|
|
7,665 |
|
|
|
8,729 |
|
|
|
(12 |
%) |
|
|
|
|
| Earnings (loss) of continuing operations per ADS |
|
|
0.34 |
|
|
|
0.30 |
|
|
|
12 |
% |
|
|
|
|
|
|
0.18 |
|
|
|
0.18 |
|
|
|
5 |
% |
|
|
|
|
| Fully diluted earnings (loss) of continuing operations per ADS (1) |
|
|
0.34 |
|
|
|
0.30 |
|
|
|
12 |
% |
|
|
|
|
|
|
0.18 |
|
|
|
0.18 |
|
|
|
5 |
% |
|
|
|
|
| Average ADSs outstanding |
|
|
1,474 |
|
|
|
1,481 |
|
|
|
(1 |
%) |
|
|
|
|
|
|
1,472 |
|
|
|
1,474 |
|
|
|
(0 |
%) |
|
|
|
|
| Employees |
|
|
44,875 |
|
|
|
42,694 |
|
|
|
5 |
% |
|
|
|
|
|
|
44,875 |
|
|
|
42,694 |
|
|
|
5 |
% |
|
|
|
|
This information does not include discontinued operations. Please see page 14 of this report for additional information.
Cement and aggregates volumes in thousands of metric tons. Ready-mix volumes in thousands of cubic meters.
In millions of U.S. dollars, except volumes, percentages, employees, and per-ADS amounts. Average ADSs outstanding are
presented in millions.
Please refer to page 13 for end-of quarter
CPO-equivalent units outstanding.
Consolidated net sales in the second quarter of 2023 reached US$4.6 billion, an increase of +10% on
a like-to-like basis, compared to the second quarter of 2022. Higher prices in local currency terms in all our regions were the main drivers of our top line growth.
Cost of sales, as a percentage of Net Sales, decreased by 3.3pp to 65.4% during the second quarter of 2023, from 68.7% in the same period last year,
mainly driven by pricing, easing cost headwinds, and operational efficiencies.
Operating expenses, as a percentage of Net Sales, decreased by
0.3pp to 20.3% during the second quarter of 2023 compared with the same period last year, mainly due to lower distribution expenses.
Operating EBITDA in the second quarter of 2023 reached US$961 million, increasing +29% on a like-to-like basis. EBITDA was higher in all four regions, with the US, Europe, and SCAC increasing double-digit, and Mexico growing high single-digit.
Operating EBITDA margin increased by 3.3pp from 17.8% in the second quarter of 2022 to 21.1% this quarter.
Controlling interest net income (loss) resulted in an income of US$272 million in the second quarter of 2023 versus an income of
US$265 million in the same quarter of 2022. The higher income primarily reflects a higher operating income and a positive variation in foreign exchange results, partially offset by higher financial expenses and higher income tax.
|
|
|
| 2023 Second Quarter Results |
|
Page 2 |
|
|
|
| Operating results |
|
|
Mexico
|
|
|
|
|
|
|
|
|
|
|
|
|
|
|
|
|
|
|
|
|
|
|
|
|
|
|
|
|
|
|
|
|
| |
|
January - June |
|
|
Second Quarter |
|
| |
|
2023 |
|
|
2022 |
|
|
% var |
|
|
l-t-l
% var |
|
|
2023 |
|
|
2022 |
|
|
% var |
|
|
l-t-l
% var |
|
| Net sales |
|
|
2,395 |
|
|
|
1,878 |
|
|
|
27 |
% |
|
|
13 |
% |
|
|
1,298 |
|
|
|
998 |
|
|
|
30 |
% |
|
|
14 |
% |
| Operating EBITDA |
|
|
744 |
|
|
|
606 |
|
|
|
23 |
% |
|
|
9 |
% |
|
|
399 |
|
|
|
320 |
|
|
|
25 |
% |
|
|
9 |
% |
| Operating EBITDA margin |
|
|
31.1 |
% |
|
|
32.3 |
% |
|
|
(1.2pp |
) |
|
|
|
|
|
|
30.8 |
% |
|
|
32.1 |
% |
|
|
(1.3pp |
) |
|
|
|
|
In millions of U.S. dollars, except percentages.
|
|
|
|
|
|
|
|
|
|
|
|
|
|
|
|
|
|
|
|
|
|
|
|
|
| |
|
Domestic gray cement |
|
|
Ready-mix |
|
|
Aggregates |
|
| Year-over-year percentage variation |
|
January - June |
|
|
Second Quarter |
|
|
January - June |
|
|
Second Quarter |
|
|
January - June |
|
|
Second Quarter |
|
| Volume |
|
|
(1 |
%) |
|
|
1 |
% |
|
|
8 |
% |
|
|
6 |
% |
|
|
9 |
% |
|
|
11 |
% |
| Price (USD) |
|
|
28 |
% |
|
|
28 |
% |
|
|
41 |
% |
|
|
45 |
% |
|
|
34 |
% |
|
|
36 |
% |
| Price (local currency) |
|
|
14 |
% |
|
|
12 |
% |
|
|
26 |
% |
|
|
27 |
% |
|
|
20 |
% |
|
|
19 |
% |
Our Mexican operations delivered strong results, with double-digit growth in Sales and high single-digit increase in
EBITDA. As our pricing strategy continued to make meaningful inroads in offsetting the last two years’ inflation, EBITDA rose for the third consecutive quarter. EBITDA margin decreased year-over-year primarily due to an unfavorable product mix
and higher distribution, electricity, and labor costs.
Our cement volumes rose 1% year-over-year, the first sign of demand recovery in two years, and
growing 12% sequentially, supported by continued strong bulk cement performance from formal construction, and from market share recovery in bagged cement. Ready-mix and aggregates volumes also benefited from
formal construction strength, with growth of mid-single digit and double-digit, respectively.
The alternative
fuel substitution rate reached a record in Mexico of 44% with four plants at levels above 50%.
United States
|
|
|
|
|
|
|
|
|
|
|
|
|
|
|
|
|
|
|
|
|
|
|
|
|
|
|
|
|
|
|
|
|
| |
|
January - June |
|
|
Second Quarter |
|
| |
|
2023 |
|
|
2022 |
|
|
% var |
|
|
l-t-l
% var |
|
|
2023 |
|
|
2022 |
|
|
% var |
|
|
l-t-l
% var |
|
| Net sales |
|
|
2,675 |
|
|
|
2,492 |
|
|
|
7 |
% |
|
|
7 |
% |
|
|
1,420 |
|
|
|
1,296 |
|
|
|
10 |
% |
|
|
10 |
% |
| Operating EBITDA |
|
|
533 |
|
|
|
363 |
|
|
|
47 |
% |
|
|
47 |
% |
|
|
303 |
|
|
|
162 |
|
|
|
87 |
% |
|
|
87 |
% |
| Operating EBITDA margin |
|
|
19.9 |
% |
|
|
14.5 |
% |
|
|
5.4pp |
|
|
|
|
|
|
|
21.3 |
% |
|
|
12.5 |
% |
|
|
8.8pp |
|
|
|
|
|
In millions of U.S. dollars, except percentages.
|
|
|
|
|
|
|
|
|
|
|
|
|
|
|
|
|
|
|
|
|
|
|
|
|
| |
|
Domestic gray cement |
|
|
Ready-mix |
|
|
Aggregates |
|
| Year-over-year percentage variation |
|
January - June |
|
|
Second Quarter |
|
|
January - June |
|
|
Second Quarter |
|
|
January - June |
|
|
Second Quarter |
|
| Volume |
|
|
(13 |
%) |
|
|
(8 |
%) |
|
|
(11 |
%) |
|
|
(10 |
%) |
|
|
(5 |
%) |
|
|
5 |
% |
| Price (USD) |
|
|
18 |
% |
|
|
15 |
% |
|
|
23 |
% |
|
|
21 |
% |
|
|
20 |
% |
|
|
11 |
% |
| Price (local currency) |
|
|
18 |
% |
|
|
15 |
% |
|
|
23 |
% |
|
|
21 |
% |
|
|
20 |
% |
|
|
11 |
% |
The United States had a record quarter benefiting from our pricing strategy, growth investments, and decelerating
costs. The 87% growth in EBITDA and 8.8pp margin expansion reflects these dynamics, as well as prior year’s comparative base, which was significantly affected by multiple cement plants’ unplanned outages and supply chain disruptions.
Cement and ready-mix volumes continued to be impacted by weather and a weak residential sector. Aggregates volumes
increased mid-single digit, due to the opening of a new sand mine in Florida as well as the acquisition of the assets of Atlantic Minerals Limited in Canada. Cement and
ready-mix prices rose double-digit year-over-year and increased low single digit sequentially. Price increases were announced for third quarter, covering approximately 90% of our cement volumes.
|
|
|
| 2023 Second Quarter Results |
|
Page 3 |
|
|
|
| Operating results |
|
|
Europe, Middle East, Africa and Asia
|
|
|
|
|
|
|
|
|
|
|
|
|
|
|
|
|
|
|
|
|
|
|
|
|
|
|
|
|
|
|
|
|
| |
|
January - June |
|
|
Second Quarter |
|
| |
|
2023 |
|
|
2022 |
|
|
% var |
|
|
l-t-l
% var |
|
|
2023 |
|
|
2022 |
|
|
% var |
|
|
l-t-l
% var |
|
| Net sales |
|
|
2,588 |
|
|
|
2,490 |
|
|
|
4 |
% |
|
|
9 |
% |
|
|
1,354 |
|
|
|
1,294 |
|
|
|
5 |
% |
|
|
6 |
% |
| Operating EBITDA |
|
|
360 |
|
|
|
338 |
|
|
|
6 |
% |
|
|
13 |
% |
|
|
212 |
|
|
|
193 |
|
|
|
10 |
% |
|
|
11 |
% |
| Operating EBITDA margin |
|
|
13.9 |
% |
|
|
13.6 |
% |
|
|
0.3pp |
|
|
|
|
|
|
|
15.7 |
% |
|
|
14.9 |
% |
|
|
0.8pp |
|
|
|
|
|
In millions of U.S. dollars, except percentages.
|
|
|
|
|
|
|
|
|
|
|
|
|
|
|
|
|
|
|
|
|
|
|
|
|
| |
|
Domestic gray cement |
|
|
Ready-mix |
|
|
Aggregates |
|
| Year-over-year percentage variation |
|
January - June |
|
|
Second Quarter |
|
|
January - June |
|
|
Second Quarter |
|
|
January - June |
|
|
Second Quarter |
|
| Volume |
|
|
(11 |
%) |
|
|
(11 |
%) |
|
|
(5 |
%) |
|
|
(7 |
%) |
|
|
(1 |
%) |
|
|
(2 |
%) |
| Price (USD) |
|
|
17 |
% |
|
|
18 |
% |
|
|
11 |
% |
|
|
12 |
% |
|
|
6 |
% |
|
|
10 |
% |
| Price (local currency) (*) |
|
|
25 |
% |
|
|
21 |
% |
|
|
15 |
% |
|
|
13 |
% |
|
|
9 |
% |
|
|
9 |
% |
EMEA delivered solid results despite a challenging demand environment, with EBITDA growing year-on-year for the seventh consecutive quarter. Top line and EBITDA growth was mainly driven by our disciplined pricing and carbon strategy, as well as important
contributions from growth investments. EBITDA margin expanded by almost one percentage point, to the highest level in seven quarters.
EBITDA in Europe
rose 32% while margin increased by 3.2pp, showing strong cement pricing momentum, with 28% growth year-over-year. Sequential cement prices rose 3% on the back of April increases in Germany and the United Kingdom. The region continued to post new
company records in Climate Action and is well on its way to match the EU’s 55% 2030 carbon emissions reduction target.
In the Philippines,
cement volumes declined 17% during the second quarter mainly as a result of continued weakness in construction activity, driven by high inflation and interest rates, lower infrastructure activity, and a tough comparative base. Domestic cement prices
decreased 2% during the second quarter in local currency terms and 4% sequentially. On a like-to-like basis, Sales in the country decreased 18% during the quarter, while
EBITDA and EBITDA margin declined by 56% and 12.5pp respectively, due to lower volumes and inflationary pressures, particularly energy. The expected date of completion of the new line of our Solid Cement Plant is first quarter 2024.
| (*) |
Calculated on a volume-weighted-average basis at constant foreign-exchange rates. |
|
|
|
| 2023 Second Quarter Results |
|
Page 4 |
|
|
|
| Operating results |
|
|
South, Central America and the Caribbean
|
|
|
|
|
|
|
|
|
|
|
|
|
|
|
|
|
|
|
|
|
|
|
|
|
|
|
|
|
|
|
|
|
| |
|
|
|
|
January - June |
|
|
|
|
|
|
|
|
Second Quarter |
|
|
|
|
| |
|
2023 |
|
|
2022 |
|
|
% var |
|
|
l-t-l
% var |
|
|
2023 |
|
|
2022 |
|
|
% var |
|
|
l-t-l
% var |
|
| Net sales |
|
|
858 |
|
|
|
838 |
|
|
|
2 |
% |
|
|
7 |
% |
|
|
447 |
|
|
|
418 |
|
|
|
7 |
% |
|
|
10 |
% |
| Operating EBITDA |
|
|
196 |
|
|
|
208 |
|
|
|
(6 |
%) |
|
|
(4 |
%) |
|
|
112 |
|
|
|
99 |
|
|
|
13 |
% |
|
|
15 |
% |
| Operating EBITDA margin |
|
|
22.9 |
% |
|
|
24.9 |
% |
|
|
(2.0pp |
) |
|
|
|
|
|
|
25.1 |
% |
|
|
23.7 |
% |
|
|
1.4pp |
|
|
|
|
|
In millions of U.S. dollars, except percentages.
|
|
|
|
|
|
|
|
|
|
|
|
|
|
|
|
|
|
|
|
|
|
|
|
|
| |
|
Domestic gray cement |
|
|
Ready-mix |
|
|
Aggregates |
|
| Year-over-year percentage
variation |
|
January - June |
|
|
Second Quarter |
|
|
January - June |
|
|
Second Quarter |
|
|
January - June |
|
|
Second Quarter |
|
| Volume |
|
|
(6 |
%) |
|
|
(3 |
%) |
|
|
1 |
% |
|
|
3 |
% |
|
|
8 |
% |
|
|
14 |
% |
| Price (USD) |
|
|
7 |
% |
|
|
7 |
% |
|
|
10 |
% |
|
|
13 |
% |
|
|
9 |
% |
|
|
10 |
% |
| Price (local currency) (*) |
|
|
11 |
% |
|
|
10 |
% |
|
|
21 |
% |
|
|
21 |
% |
|
|
20 |
% |
|
|
18 |
% |
Net sales and EBITDA in the South, Central America and Caribbean region grew double-digit driven by a strong pricing
contribution and decelerating energy costs. Cement volumes continued to be pressured by weak bagged cement demand, although bulk cement, ready-mix, and aggregates, showed positive performance supported mainly
by the infrastructure sector. EBITDA margin for the second quarter marks an inflection point, with an expansion of 1.4pp year-over-year as a result of our pricing strategy and decelerating input cost inflation.
In Colombia, cement volumes declined low single digit, mainly driven by a weak residential sector, which was partially offset by strong
infrastructure-related activity.
In the Dominican Republic, while weak informal cement demand weighs on bagged cement volumes, we continue to see
robust activity in formal construction, primarily in tourism and infrastructure-related projects.
In Panama, cement and ready-mix volumes increased mainly driven by the infrastructure projects related to the metro, the fourth bridge over the canal, and highway expansions.
| (*) |
Calculated on a volume-weighted-average basis at constant foreign-exchange rates. |
|
|
|
| 2023 Second Quarter Results |
|
Page 5 |
|
|
|
| Operating results |
|
|
Operating EBITDA and free cash flow
|
|
|
|
|
|
|
|
|
|
|
|
|
|
|
|
|
|
|
|
|
|
|
|
|
| |
|
January—June |
|
|
Second Quarter |
|
| |
|
2023 |
|
|
2022 |
|
|
% var |
|
|
2023 |
|
|
2022 |
|
|
% var |
|
| Operating earnings before other income and expenses, net |
|
|
1,086 |
|
|
|
836 |
|
|
|
30 |
% |
|
|
651 |
|
|
|
430 |
|
|
|
51 |
% |
| + Depreciation and operating amortization |
|
|
608 |
|
|
|
565 |
|
|
|
|
|
|
|
310 |
|
|
|
286 |
|
|
|
|
|
|
|
|
|
|
|
|
|
|
|
|
|
|
|
|
|
|
|
|
|
|
|
|
|
|
| Operating EBITDA |
|
|
1,694 |
|
|
|
1,401 |
|
|
|
21 |
% |
|
|
961 |
|
|
|
716 |
|
|
|
34 |
% |
| - Net financial expense |
|
|
289 |
|
|
|
258 |
|
|
|
|
|
|
|
145 |
|
|
|
131 |
|
|
|
|
|
| - Maintenance capital expenditures |
|
|
389 |
|
|
|
386 |
|
|
|
|
|
|
|
233 |
|
|
|
205 |
|
|
|
|
|
| - Change in working capital |
|
|
546 |
|
|
|
660 |
|
|
|
|
|
|
|
92 |
|
|
|
172 |
|
|
|
|
|
| - Taxes paid |
|
|
291 |
|
|
|
113 |
|
|
|
|
|
|
|
207 |
|
|
|
64 |
|
|
|
|
|
| - Other cash items (net) |
|
|
(43 |
) |
|
|
(4 |
) |
|
|
|
|
|
|
8 |
|
|
|
(21 |
) |
|
|
|
|
| - Free cash flow discontinued operations |
|
|
— |
|
|
|
8 |
|
|
|
|
|
|
|
— |
|
|
|
11 |
|
|
|
|
|
|
|
|
|
|
|
|
|
|
|
|
|
|
|
|
|
|
|
|
|
|
|
|
|
|
| Free cash flow after maintenance capital expenditures |
|
|
223 |
|
|
|
(20 |
) |
|
|
N/A |
|
|
|
278 |
|
|
|
154 |
|
|
|
80 |
% |
|
|
|
|
|
|
|
|
|
|
|
|
|
|
|
|
|
|
|
|
|
|
|
|
|
| - Strategic capital expenditures |
|
|
169 |
|
|
|
174 |
|
|
|
|
|
|
|
83 |
|
|
|
98 |
|
|
|
|
|
|
|
|
|
|
|
|
|
|
|
|
|
|
|
|
|
|
|
|
|
|
|
|
|
|
| Free cash flow |
|
|
54 |
|
|
|
(194 |
) |
|
|
N/A |
|
|
|
195 |
|
|
|
56 |
|
|
|
246 |
% |
|
|
|
|
|
|
|
|
|
|
|
|
|
|
|
|
|
|
|
|
|
|
|
|
|
|
| In millions of U.S. dollars, except percentages. |
FCF after maintenance capex for the second quarter of 2023 was higher than the prior year mainly due to EBITDA growth, as well
as lower working capital. During the quarter, uses of cash below the Free cash flow line include the acquisition of the assets of Atlantic Minerals Limited in Canada, the investment in a new Construction, Demolition, and Excavation Waste (CDEW)
recycling center in Israel, and the coupons of our subordinated notes with no fixed maturity.
Information on debt
|
|
|
|
|
|
|
|
|
|
|
|
|
|
|
|
|
| |
|
|
|
|
|
|
|
|
|
|
First
Quarter |
|
| |
|
Second Quarter |
|
| |
|
2023 |
|
|
2022 |
|
|
% var |
|
|
2023 |
|
| Total debt (1) |
|
|
7,665 |
|
|
|
8,729 |
|
|
|
(12 |
%) |
|
|
7,862 |
|
| Short-term |
|
|
4 |
% |
|
|
5 |
% |
|
|
|
|
|
|
4 |
% |
| Long-term |
|
|
96 |
% |
|
|
95 |
% |
|
|
|
|
|
|
96 |
% |
| Cash and cash equivalents |
|
|
471 |
|
|
|
490 |
|
|
|
(4 |
%) |
|
|
758 |
|
|
|
|
|
|
|
|
|
|
|
|
|
|
|
|
|
|
| Net debt |
|
|
7,194 |
|
|
|
8,239 |
|
|
|
(13 |
%) |
|
|
7,104 |
|
|
|
|
|
|
|
|
|
|
|
|
|
|
|
|
|
|
| Consolidated net debt (2) |
|
|
7,281 |
|
|
|
8,123 |
|
|
|
|
|
|
|
7,157 |
|
| Consolidated leverage ratio (2) |
|
|
2.45 |
|
|
|
2.88 |
|
|
|
|
|
|
|
2.62 |
|
| Consolidated coverage ratio (2) |
|
|
6.90 |
|
|
|
6.74 |
|
|
|
|
|
|
|
6.38 |
|
|
|
|
|
|
|
|
|
|
|
|
|
|
|
|
|
|
|
|
|
|
|
|
|
|
|
| |
|
Second Quarter |
|
| |
|
2023 |
|
|
2022 |
|
| Currency denomination |
|
|
|
|
|
|
|
|
| U.S. dollar |
|
|
74 |
% |
|
|
77 |
% |
| Euro |
|
|
15 |
% |
|
|
15 |
% |
| Mexican peso |
|
|
5 |
% |
|
|
3 |
% |
| Other |
|
|
6 |
% |
|
|
5 |
% |
| Interest rate(3) |
|
|
|
|
|
|
|
|
| Fixed |
|
|
64 |
% |
|
|
81 |
% |
| Variable |
|
|
36 |
% |
|
|
19 |
% |
In millions of U.S. dollars, except
percentages and ratios.
| (1) |
Includes leases, in accordance with International Financial Reporting Standards (IFRS). |
| (2) |
Calculated in accordance with our contractual obligations under our main bank debt agreements.
|
| (3) |
Includes the effect of our interest rate derivatives, as applicable. |
|
|
|
| 2023 Second Quarter Results |
|
Page 6 |
|
|
|
| Operating results |
|
|
Consolidated Statement of Operations & Statement of Financial Position
Cemex, S.A.B. de C.V. and Subsidiaries
(Thousands of
U.S. dollars, except per ADS amounts)
|
|
|
|
|
|
|
|
|
|
|
|
|
|
|
|
|
|
|
|
|
|
|
|
|
|
|
|
|
|
|
|
|
| |
|
January - June |
|
|
Second Quarter |
|
| STATEMENT OF OPERATIONS |
|
2023 |
|
|
2022 |
|
|
%
var |
|
|
like-to-like
% var |
|
|
2023 |
|
|
2022 |
|
|
% var |
|
|
like-to-like
% var |
|
| Net sales |
|
|
8,601,876 |
|
|
|
7,752,736 |
|
|
|
11 |
% |
|
|
10 |
% |
|
|
4,566,076 |
|
|
|
4,028,117 |
|
|
|
13 |
% |
|
|
10 |
% |
| Cost of sales |
|
|
(5,733,289 |
) |
|
|
(5,344,084 |
) |
|
|
(7 |
%) |
|
|
|
|
|
|
(2,987,160 |
) |
|
|
(2,768,589 |
) |
|
|
(8 |
%) |
|
|
|
|
| Gross profit |
|
|
2,868,588 |
|
|
|
2,408,653 |
|
|
|
19 |
% |
|
|
23 |
% |
|
|
1,578,916 |
|
|
|
1,259,528 |
|
|
|
25 |
% |
|
|
31 |
% |
| Operating expenses |
|
|
(1,782,328 |
) |
|
|
(1,572,437 |
) |
|
|
(13 |
%) |
|
|
|
|
|
|
(927,612 |
) |
|
|
(829,319 |
) |
|
|
(12 |
%) |
|
|
|
|
|
|
|
|
|
|
|
|
|
|
|
|
|
|
|
|
|
|
|
|
|
|
|
|
|
|
|
|
|
|
|
|
|
| Operating earnings before other income and expenses, net |
|
|
1,086,259 |
|
|
|
836,216 |
|
|
|
30 |
% |
|
|
25 |
% |
|
|
651,304 |
|
|
|
430,209 |
|
|
|
51 |
% |
|
|
44 |
% |
| Other expenses, net |
|
|
(29,162 |
) |
|
|
6,456 |
|
|
|
N/A |
|
|
|
|
|
|
|
(37,402 |
) |
|
|
27,611 |
|
|
|
N/A |
|
|
|
|
|
|
|
|
|
|
|
|
|
|
|
|
|
|
|
|
|
|
|
|
|
|
|
|
|
|
|
|
|
|
|
|
|
|
| Operating earnings |
|
|
1,057,097 |
|
|
|
842,672 |
|
|
|
25 |
% |
|
|
|
|
|
|
613,902 |
|
|
|
457,819 |
|
|
|
34 |
% |
|
|
|
|
| Financial expense |
|
|
(268,491 |
) |
|
|
(243,639 |
) |
|
|
(10 |
%) |
|
|
|
|
|
|
(136,432 |
) |
|
|
(125,232 |
) |
|
|
(9 |
%) |
|
|
|
|
| Other financial income (expense), net |
|
|
24,359 |
|
|
|
(41,063 |
) |
|
|
N/A |
|
|
|
|
|
|
|
(7,092 |
) |
|
|
(16,855 |
) |
|
|
58 |
% |
|
|
|
|
| Financial income |
|
|
16,281 |
|
|
|
6,987 |
|
|
|
133 |
% |
|
|
|
|
|
|
9,429 |
|
|
|
3,291 |
|
|
|
186 |
% |
|
|
|
|
| Results from financial instruments, net |
|
|
(53,560 |
) |
|
|
21,469 |
|
|
|
N/A |
|
|
|
|
|
|
|
(43,855 |
) |
|
|
23,543 |
|
|
|
N/A |
|
|
|
|
|
| Foreign exchange results |
|
|
107,269 |
|
|
|
(40,049 |
) |
|
|
N/A |
|
|
|
|
|
|
|
49,207 |
|
|
|
(29,572 |
) |
|
|
N/A |
|
|
|
|
|
| Effects of net present value on assets and liabilities and others, net |
|
|
(45,631 |
) |
|
|
(29,471 |
) |
|
|
(55 |
%) |
|
|
|
|
|
|
(21,873 |
) |
|
|
(14,119 |
) |
|
|
(55 |
%) |
|
|
|
|
| Equity in gain (loss) of associates |
|
|
30,983 |
|
|
|
22,787 |
|
|
|
36 |
% |
|
|
|
|
|
|
23,050 |
|
|
|
17,386 |
|
|
|
33 |
% |
|
|
|
|
|
|
|
|
|
|
|
|
|
|
|
|
|
|
|
|
|
|
|
|
|
|
|
|
|
|
|
|
|
|
|
|
|
| Income (loss) before income tax |
|
|
843,948 |
|
|
|
580,757 |
|
|
|
45 |
% |
|
|
|
|
|
|
493,427 |
|
|
|
333,119 |
|
|
|
48 |
% |
|
|
|
|
| Income tax |
|
|
(337,610 |
) |
|
|
(120,552 |
) |
|
|
(180 |
%) |
|
|
|
|
|
|
(206,916 |
) |
|
|
(68,560 |
) |
|
|
(202 |
%) |
|
|
|
|
|
|
|
|
|
|
|
|
|
|
|
|
|
|
|
|
|
|
|
|
|
|
|
|
|
|
|
|
|
|
|
|
|
| Profit (loss) of continuing operations |
|
|
506,338 |
|
|
|
460,205 |
|
|
|
10 |
% |
|
|
|
|
|
|
286,511 |
|
|
|
264,558 |
|
|
|
8 |
% |
|
|
|
|
| Discontinued operations |
|
|
— |
|
|
|
18,544 |
|
|
|
(100 |
%) |
|
|
|
|
|
|
— |
|
|
|
6,386 |
|
|
|
(100 |
%) |
|
|
|
|
|
|
|
|
|
|
|
|
|
|
|
|
|
|
|
|
|
|
|
|
|
|
|
|
|
|
|
|
|
|
|
|
|
| Consolidated net income (loss) |
|
|
506,338 |
|
|
|
478,749 |
|
|
|
6 |
% |
|
|
|
|
|
|
286,511 |
|
|
|
270,944 |
|
|
|
6 |
% |
|
|
|
|
| Non-controlling interest net income (loss) |
|
|
9,047 |
|
|
|
15,342 |
|
|
|
(41 |
%) |
|
|
|
|
|
|
14,666 |
|
|
|
5,622 |
|
|
|
161 |
% |
|
|
|
|
|
|
|
|
|
|
|
|
|
|
|
|
|
|
|
|
|
|
|
|
|
|
|
|
|
|
|
|
|
|
|
|
|
| Controlling interest net income (loss) |
|
|
497,291 |
|
|
|
463,406 |
|
|
|
7 |
% |
|
|
|
|
|
|
271,845 |
|
|
|
265,322 |
|
|
|
2 |
% |
|
|
|
|
|
|
|
|
|
|
|
|
|
|
|
|
|
|
|
|
|
|
|
|
|
|
|
|
|
|
|
|
|
|
|
|
|
| Operating EBITDA |
|
|
1,694,109 |
|
|
|
1,401,084 |
|
|
|
21 |
% |
|
|
18 |
% |
|
|
961,441 |
|
|
|
715,796 |
|
|
|
34 |
% |
|
|
29 |
% |
| Earnings (loss) of continued operations per ADS |
|
|
0.34 |
|
|
|
0.30 |
|
|
|
12 |
% |
|
|
|
|
|
|
0.18 |
|
|
|
0.18 |
|
|
|
5 |
% |
|
|
|
|
| Earnings (loss) of discontinued operations per ADS |
|
|
0.00 |
|
|
|
0.01 |
|
|
|
(100 |
%) |
|
|
|
|
|
|
0.00 |
|
|
|
0.00 |
|
|
|
(100 |
%) |
|
|
|
|
|
|
|
|
|
|
|
|
|
|
|
|
|
|
|
|
|
|
|
|
|
|
|
|
|
|
|
|
|
|
|
|
|
|
|
|
|
|
|
|
|
|
|
|
|
|
| |
|
As of June 30 |
|
| STATEMENT OF FINANCIAL POSITION |
|
2023 |
|
|
2022 |
|
|
% var |
|
| Total assets |
|
|
27,961,648 |
|
|
|
26,986,758 |
|
|
|
4 |
% |
| Cash and cash equivalents |
|
|
470,793 |
|
|
|
489,698 |
|
|
|
(4 |
%) |
| Trade receivables less allowance for doubtful accounts |
|
|
2,096,332 |
|
|
|
1,866,859 |
|
|
|
12 |
% |
| Other accounts receivable |
|
|
630,660 |
|
|
|
607,496 |
|
|
|
4 |
% |
| Inventories, net |
|
|
1,823,398 |
|
|
|
1,500,476 |
|
|
|
22 |
% |
| Assets held for sale |
|
|
49,605 |
|
|
|
142,348 |
|
|
|
(65 |
%) |
| Other current assets |
|
|
187,470 |
|
|
|
214,079 |
|
|
|
(12 |
%) |
| Current assets |
|
|
5,258,258 |
|
|
|
4,820,957 |
|
|
|
9 |
% |
| Property, machinery and equipment, net |
|
|
11,994,582 |
|
|
|
11,144,125 |
|
|
|
8 |
% |
| Other assets |
|
|
10,708,809 |
|
|
|
11,021,675 |
|
|
|
(3 |
%) |
|
|
|
|
|
|
|
|
|
|
|
|
|
| Total liabilities |
|
|
15,497,709 |
|
|
|
16,409,456 |
|
|
|
(6 |
%) |
| Current liabilities |
|
|
5,921,412 |
|
|
|
5,512,243 |
|
|
|
7 |
% |
| Long-term liabilities |
|
|
6,392,264 |
|
|
|
7,423,745 |
|
|
|
(14 |
%) |
| Other liabilities |
|
|
3,184,033 |
|
|
|
3,473,467 |
|
|
|
(8 |
%) |
|
|
|
|
|
|
|
|
|
|
|
|
|
| Total stockholder’s equity |
|
|
12,463,939 |
|
|
|
10,577,302 |
|
|
|
18 |
% |
| Common stock and additional paid-in capital |
|
|
7,686,469 |
|
|
|
7,810,104 |
|
|
|
(2 |
%) |
| Other equity reserves |
|
|
(2,133,178 |
) |
|
|
(2,475,169 |
) |
|
|
14 |
% |
| Subordinated notes |
|
|
1,847,419 |
|
|
|
935,887 |
|
|
|
97 |
% |
| Retained earnings |
|
|
4,743,070 |
|
|
|
3,850,826 |
|
|
|
23 |
% |
| Non-controlling interest |
|
|
320,159 |
|
|
|
455,654 |
|
|
|
(30 |
%) |
|
|
|
|
|
|
|
|
|
|
|
|
|
|
|
|
| 2023 Second Quarter Results |
|
Page 7 |
|
|
|
| Operating results |
|
|
Operating Summary per Country
In thousands of U.S. dollars
|
|
|
|
|
|
|
|
|
|
|
|
|
|
|
|
|
|
|
|
|
|
|
|
|
|
|
|
|
|
|
|
|
| |
|
January - June |
|
|
Second Quarter |
|
| NET SALES |
|
2023 |
|
|
2022 |
|
|
%
var |
|
|
like-to-like
% var |
|
|
2023 |
|
|
2022 |
|
|
%
var |
|
|
like-to-like
% var |
|
| Mexico |
|
|
2,394,547 |
|
|
|
1,878,311 |
|
|
|
27 |
% |
|
|
13 |
% |
|
|
1,297,503 |
|
|
|
997,611 |
|
|
|
30 |
% |
|
|
14 |
% |
| U.S.A. |
|
|
2,675,287 |
|
|
|
2,492,479 |
|
|
|
7 |
% |
|
|
7 |
% |
|
|
1,420,328 |
|
|
|
1,296,349 |
|
|
|
10 |
% |
|
|
10 |
% |
| Europe, Middle East, Asia and Africa |
|
|
2,587,758 |
|
|
|
2,489,936 |
|
|
|
4 |
% |
|
|
9 |
% |
|
|
1,353,517 |
|
|
|
1,293,633 |
|
|
|
5 |
% |
|
|
6 |
% |
| Europe |
|
|
1,871,006 |
|
|
|
1,720,752 |
|
|
|
9 |
% |
|
|
9 |
% |
|
|
1,010,937 |
|
|
|
918,566 |
|
|
|
10 |
% |
|
|
7 |
% |
| Philippines |
|
|
164,766 |
|
|
|
204,119 |
|
|
|
(19 |
%) |
|
|
(15 |
%) |
|
|
79,905 |
|
|
|
102,082 |
|
|
|
(22 |
%) |
|
|
(18 |
%) |
| Middle East and Africa |
|
|
551,986 |
|
|
|
565,065 |
|
|
|
(2 |
%) |
|
|
16 |
% |
|
|
262,674 |
|
|
|
272,985 |
|
|
|
(4 |
%) |
|
|
12 |
% |
| South, Central America and the Caribbean |
|
|
858,178 |
|
|
|
838,056 |
|
|
|
2 |
% |
|
|
7 |
% |
|
|
447,066 |
|
|
|
417,873 |
|
|
|
7 |
% |
|
|
10 |
% |
| Others and intercompany eliminations |
|
|
86,106 |
|
|
|
53,954 |
|
|
|
60 |
% |
|
|
58 |
% |
|
|
47,662 |
|
|
|
22,650 |
|
|
|
110 |
% |
|
|
111 |
% |
|
|
|
|
|
|
|
|
|
|
|
|
|
|
|
|
|
|
|
|
|
|
|
|
|
|
|
|
|
|
|
|
|
| TOTAL |
|
|
8,601,876 |
|
|
|
7,752,736 |
|
|
|
11 |
% |
|
|
10 |
% |
|
|
4,566,076 |
|
|
|
4,028,117 |
|
|
|
13 |
% |
|
|
10 |
% |
|
|
|
|
|
|
|
|
|
|
|
|
|
|
|
|
|
|
|
|
|
|
|
|
|
|
|
|
|
|
|
|
|
| GROSS PROFIT |
|
|
|
|
|
|
|
|
|
|
|
|
|
|
|
|
|
|
|
|
|
|
|
|
|
|
|
|
|
|
|
|
| Mexico |
|
|
1,145,847 |
|
|
|
894,592 |
|
|
|
28 |
% |
|
|
14 |
% |
|
|
619,616 |
|
|
|
478,638 |
|
|
|
29 |
% |
|
|
14 |
% |
| U.S.A. |
|
|
774,212 |
|
|
|
594,341 |
|
|
|
30 |
% |
|
|
30 |
% |
|
|
426,827 |
|
|
|
297,028 |
|
|
|
44 |
% |
|
|
44 |
% |
| Europe, Middle East, Asia and Africa |
|
|
620,971 |
|
|
|
608,622 |
|
|
|
2 |
% |
|
|
7 |
% |
|
|
349,153 |
|
|
|
338,195 |
|
|
|
3 |
% |
|
|
4 |
% |
| Europe |
|
|
477,445 |
|
|
|
419,109 |
|
|
|
14 |
% |
|
|
14 |
% |
|
|
283,288 |
|
|
|
246,398 |
|
|
|
15 |
% |
|
|
12 |
% |
| Philippines |
|
|
39,284 |
|
|
|
78,090 |
|
|
|
(50 |
%) |
|
|
(47 |
%) |
|
|
20,968 |
|
|
|
39,286 |
|
|
|
(47 |
%) |
|
|
(44 |
%) |
| Middle East and Africa |
|
|
104,243 |
|
|
|
111,422 |
|
|
|
(6 |
%) |
|
|
18 |
% |
|
|
44,897 |
|
|
|
52,510 |
|
|
|
(14 |
%) |
|
|
3 |
% |
| South, Central America and the Caribbean |
|
|
286,194 |
|
|
|
292,892 |
|
|
|
(2 |
%) |
|
|
1 |
% |
|
|
159,410 |
|
|
|
140,410 |
|
|
|
14 |
% |
|
|
16 |
% |
| Others and intercompany eliminations |
|
|
41,363 |
|
|
|
18,206 |
|
|
|
127 |
% |
|
|
1060 |
% |
|
|
23,911 |
|
|
|
5,258 |
|
|
|
355 |
% |
|
|
3035 |
% |
|
|
|
|
|
|
|
|
|
|
|
|
|
|
|
|
|
|
|
|
|
|
|
|
|
|
|
|
|
|
|
|
|
| TOTAL |
|
|
2,868,588 |
|
|
|
2,408,653 |
|
|
|
19 |
% |
|
|
23 |
% |
|
|
1,578,916 |
|
|
|
1,259,528 |
|
|
|
25 |
% |
|
|
31 |
% |
|
|
|
|
|
|
|
|
|
|
|
|
|
|
|
|
|
|
|
|
|
|
|
|
|
|
|
|
|
|
|
|
|
| OPERATING EARNINGS BEFORE OTHER EXPENSES, NET |
|
|
|
|
|
|
|
|
|
|
|
|
|
| Mexico |
|
|
637,328 |
|
|
|
523,474 |
|
|
|
22 |
% |
|
|
8 |
% |
|
|
343,875 |
|
|
|
277,017 |
|
|
|
24 |
% |
|
|
8 |
% |
| U.S.A. |
|
|
292,792 |
|
|
|
124,086 |
|
|
|
136 |
% |
|
|
136 |
% |
|
|
181,027 |
|
|
|
42,367 |
|
|
|
327 |
% |
|
|
327 |
% |
| Europe, Middle East, Asia and Africa |
|
|
195,726 |
|
|
|
176,596 |
|
|
|
11 |
% |
|
|
19 |
% |
|
|
128,180 |
|
|
|
113,858 |
|
|
|
13 |
% |
|
|
13 |
% |
| Europe |
|
|
143,327 |
|
|
|
89,157 |
|
|
|
61 |
% |
|
|
59 |
% |
|
|
105,483 |
|
|
|
72,531 |
|
|
|
45 |
% |
|
|
41 |
% |
| Philippines |
|
|
5,528 |
|
|
|
38,141 |
|
|
|
(86 |
%) |
|
|
(87 |
%) |
|
|
4,552 |
|
|
|
19,004 |
|
|
|
(76 |
%) |
|
|
(76 |
%) |
| Middle East and Africa |
|
|
46,871 |
|
|
|
49,298 |
|
|
|
(5 |
%) |
|
|
27 |
% |
|
|
18,144 |
|
|
|
22,323 |
|
|
|
(19 |
%) |
|
|
1 |
% |
| South, Central America and the Caribbean |
|
|
155,131 |
|
|
|
167,117 |
|
|
|
(7 |
%) |
|
|
(6 |
%) |
|
|
92,150 |
|
|
|
78,539 |
|
|
|
17 |
% |
|
|
19 |
% |
| Others and intercompany eliminations |
|
|
(194,718 |
) |
|
|
(155,056 |
) |
|
|
(26 |
%) |
|
|
(14 |
%) |
|
|
(93,928 |
) |
|
|
(81,572 |
) |
|
|
(15 |
%) |
|
|
(1 |
%) |
|
|
|
|
|
|
|
|
|
|
|
|
|
|
|
|
|
|
|
|
|
|
|
|
|
|
|
|
|
|
|
|
|
| TOTAL |
|
|
1,086,259 |
|
|
|
836,216 |
|
|
|
30 |
% |
|
|
25 |
% |
|
|
651,304 |
|
|
|
430,209 |
|
|
|
51 |
% |
|
|
44 |
% |
|
|
|
|
|
|
|
|
|
|
|
|
|
|
|
|
|
|
|
|
|
|
|
|
|
|
|
|
|
|
|
|
|
|
|
|
| 2023 Second Quarter Results |
|
Page 8 |
|
|
|
| Operating results |
|
|
Operating Summary per Country
EBITDA in thousands of U.S. dollars. EBITDA margin as a percentage of Net sales.
|
|
|
|
|
|
|
|
|
|
|
|
|
|
|
|
|
|
|
|
|
|
|
|
|
|
|
|
|
|
|
|
|
| |
|
January - June |
|
|
Second Quarter |
|
|
|
|
| |
|
|
|
|
|
|
|
|
|
|
like-to-like |
|
|
|
|
|
|
|
|
|
|
|
like-to-like |
|
| OPERATING EBITDA |
|
2023 |
|
|
2022 |
|
|
% var |
|
|
% var |
|
|
2023 |
|
|
2022 |
|
|
% var |
|
|
% var |
|
| Mexico |
|
|
743,612 |
|
|
|
606,259 |
|
|
|
23 |
% |
|
|
9 |
% |
|
|
399,210 |
|
|
|
320,321 |
|
|
|
25 |
% |
|
|
9 |
% |
| U.S.A. |
|
|
532,871 |
|
|
|
362,504 |
|
|
|
47 |
% |
|
|
47 |
% |
|
|
303,037 |
|
|
|
162,078 |
|
|
|
87 |
% |
|
|
87 |
% |
| Europe, Middle East, Asia and Africa |
|
|
359,679 |
|
|
|
338,089 |
|
|
|
6 |
% |
|
|
13 |
% |
|
|
212,080 |
|
|
|
192,711 |
|
|
|
10 |
% |
|
|
11 |
% |
| Europe |
|
|
266,892 |
|
|
|
194,338 |
|
|
|
37 |
% |
|
|
37 |
% |
|
|
170,041 |
|
|
|
124,868 |
|
|
|
36 |
% |
|
|
32 |
% |
| Philippines |
|
|
22,176 |
|
|
|
57,355 |
|
|
|
(61 |
%) |
|
|
(60 |
%) |
|
|
12,280 |
|
|
|
28,445 |
|
|
|
(57 |
%) |
|
|
(56 |
%) |
| Middle East and Africa |
|
|
70,611 |
|
|
|
86,396 |
|
|
|
(18 |
%) |
|
|
6 |
% |
|
|
29,760 |
|
|
|
39,397 |
|
|
|
(24 |
%) |
|
|
(7 |
%) |
| South, Central America and the Caribbean |
|
|
196,106 |
|
|
|
208,278 |
|
|
|
(6 |
%) |
|
|
(4 |
%) |
|
|
112,127 |
|
|
|
99,024 |
|
|
|
13 |
% |
|
|
15 |
% |
| Others and intercompany eliminations |
|
|
(138,159 |
) |
|
|
(114,047 |
) |
|
|
(21 |
%) |
|
|
(6 |
%) |
|
|
(65,014 |
) |
|
|
(58,338 |
) |
|
|
(11 |
%) |
|
|
8 |
% |
|
|
|
|
|
|
|
|
|
|
|
|
|
|
|
|
|
|
|
|
|
|
|
|
|
|
|
|
|
|
|
|
|
| TOTAL |
|
|
1,694,109 |
|
|
|
1,401,084 |
|
|
|
21 |
% |
|
|
18 |
% |
|
|
961,441 |
|
|
|
715,796 |
|
|
|
34 |
% |
|
|
29 |
% |
|
|
|
|
|
|
|
|
|
|
|
|
|
|
|
|
|
|
|
|
|
|
|
|
|
|
|
|
|
|
|
|
|
| OPERATING EBITDA MARGIN |
|
|
|
|
|
|
|
|
|
|
|
|
|
|
|
|
|
|
|
|
|
|
| Mexico |
|
|
31.1 |
% |
|
|
32.3 |
% |
|
|
|
|
|
|
|
|
|
|
30.8 |
% |
|
|
32.1 |
% |
|
|
|
|
|
|
|
|
| U.S.A. |
|
|
19.9 |
% |
|
|
14.5 |
% |
|
|
|
|
|
|
|
|
|
|
21.3 |
% |
|
|
12.5 |
% |
|
|
|
|
|
|
|
|
| Europe, Middle East, Asia and Africa |
|
|
13.9 |
% |
|
|
13.6 |
% |
|
|
|
|
|
|
|
|
|
|
15.7 |
% |
|
|
14.9 |
% |
|
|
|
|
|
|
|
|
| Europe |
|
|
14.3 |
% |
|
|
11.3 |
% |
|
|
|
|
|
|
|
|
|
|
16.8 |
% |
|
|
13.6 |
% |
|
|
|
|
|
|
|
|
| Philippines |
|
|
13.5 |
% |
|
|
28.1 |
% |
|
|
|
|
|
|
|
|
|
|
15.4 |
% |
|
|
27.9 |
% |
|
|
|
|
|
|
|
|
| Middle East and Africa |
|
|
12.8 |
% |
|
|
15.3 |
% |
|
|
|
|
|
|
|
|
|
|
11.3 |
% |
|
|
14.4 |
% |
|
|
|
|
|
|
|
|
| South, Central America and the Caribbean |
|
|
22.9 |
% |
|
|
24.9 |
% |
|
|
|
|
|
|
|
|
|
|
25.1 |
% |
|
|
23.7 |
% |
|
|
|
|
|
|
|
|
|
|
|
|
|
|
|
|
|
|
|
|
|
|
|
|
|
|
|
|
|
|
|
|
|
|
|
|
|
|
|
|
|
| TOTAL |
|
|
19.7 |
% |
|
|
18.1 |
% |
|
|
|
|
|
|
|
|
|
|
21.1 |
% |
|
|
17.8 |
% |
|
|
|
|
|
|
|
|
|
|
|
|
|
|
|
|
|
|
|
|
|
|
|
|
|
|
|
|
|
|
|
|
|
|
|
|
|
|
|
|
|
|
|
|
| 2023 Second Quarter Results |
|
Page 9 |
|
|
|
| Operating results |
|
|
Volume Summary
Cement and aggregates: Thousands of metric tons.
Ready-mix: Thousands of cubic meters.
|
|
|
|
|
|
|
|
|
|
|
|
|
|
|
|
|
|
|
|
|
|
|
|
|
| |
|
January - June |
|
|
|
|
|
Second Quarter |
|
|
|
|
| |
|
2023 |
|
|
2022 |
|
|
% var |
|
|
2023 |
|
|
2022 |
|
|
% var |
|
| Consolidated cement volume (1) |
|
|
30,025 |
|
|
|
32,107 |
|
|
|
(6 |
%) |
|
|
15,622 |
|
|
|
16,331 |
|
|
|
(4 |
%) |
| Consolidated ready-mix volume |
|
|
24,077 |
|
|
|
25,214 |
|
|
|
(5 |
%) |
|
|
12,371 |
|
|
|
13,049 |
|
|
|
(5 |
%) |
| Consolidated aggregates volume (2) |
|
|
68,933 |
|
|
|
69,357 |
|
|
|
(1 |
%) |
|
|
36,681 |
|
|
|
35,489 |
|
|
|
3 |
% |
|
|
|
|
|
|
|
|
|
|
|
|
|
| Per-country volume summary |
|
| |
|
January - June |
|
|
Second Quarter |
|
|
Second Quarter 2023 |
|
| DOMESTIC GRAY CEMENT VOLUME |
|
2023 vs. 2022 |
|
|
2023 vs. 2022 |
|
|
vs. First Quarter 2023 |
|
| Mexico |
|
|
(1 |
%) |
|
|
1 |
% |
|
|
12 |
% |
| U.S.A. |
|
|
(13 |
%) |
|
|
(8 |
%) |
|
|
12 |
% |
| Europe, Middle East, Asia and Africa |
|
|
(11 |
%) |
|
|
(11 |
%) |
|
|
9 |
% |
| Europe |
|
|
(11 |
%) |
|
|
(12 |
%) |
|
|
22 |
% |
| Philippines |
|
|
(17 |
%) |
|
|
(17 |
%) |
|
|
(1 |
%) |
| Middle East and Africa |
|
|
(3 |
%) |
|
|
(0 |
%) |
|
|
(11 |
%) |
| South, Central America and the Caribbean |
|
|
(6 |
%) |
|
|
(3 |
%) |
|
|
0 |
% |
| READY-MIX VOLUME |
|
|
|
|
| Mexico |
|
|
8 |
% |
|
|
6 |
% |
|
|
7 |
% |
| U.S.A. |
|
|
(11 |
%) |
|
|
(10 |
%) |
|
|
9 |
% |
| Europe, Middle East, Asia and Africa |
|
|
(5 |
%) |
|
|
(7 |
%) |
|
|
3 |
% |
| Europe |
|
|
(9 |
%) |
|
|
(10 |
%) |
|
|
10 |
% |
| Philippines |
|
|
N/A |
|
|
|
N/A |
|
|
|
N/A |
|
| Middle East and Africa |
|
|
2 |
% |
|
|
(1 |
%) |
|
|
(7 |
%) |
| South, Central America and the Caribbean |
|
|
1 |
% |
|
|
3 |
% |
|
|
5 |
% |
| AGGREGATES VOLUME |
|
|
|
|
| Mexico |
|
|
9 |
% |
|
|
11 |
% |
|
|
10 |
% |
| U.S.A. |
|
|
(5 |
%) |
|
|
5 |
% |
|
|
22 |
% |
| Europe, Middle East, Asia and Africa |
|
|
(1 |
%) |
|
|
(2 |
%) |
|
|
9 |
% |
| Europe |
|
|
(1 |
%) |
|
|
(2 |
%) |
|
|
14 |
% |
| Philippines |
|
|
N/A |
|
|
|
N/A |
|
|
|
N/A |
|
| Middle East and Africa |
|
|
(0 |
%) |
|
|
(0 |
%) |
|
|
(6 |
%) |
| South, Central America and the Caribbean |
|
|
8 |
% |
|
|
14 |
% |
|
|
8 |
% |
| (1) |
Consolidated cement volume includes domestic and export volume of gray cement, white cement, special cement,
mortar, and clinker. |
| (2) |
Consolidated aggregates volumes include aggregates from our marine business in the United Kingdom.
|
|
|
|
| 2023 Second Quarter Results |
|
Page 10 |
|
|
|
| Operating results |
|
|
Price Summary
Variation in U.S. dollars
|
|
|
|
|
|
|
|
|
|
|
|
|
| |
|
January - June |
|
|
Second Quarter |
|
|
Second Quarter 2023 vs. |
|
| DOMESTIC GRAY CEMENT PRICE |
|
2023 vs. 2022 |
|
|
2023 vs. 2022 |
|
|
First Quarter 2023 |
|
| Mexico |
|
|
28 |
% |
|
|
28 |
% |
|
|
6 |
% |
| U.S.A. |
|
|
18 |
% |
|
|
15 |
% |
|
|
1 |
% |
| Europe, Middle East, Asia and Africa (*) |
|
|
17 |
% |
|
|
18 |
% |
|
|
8 |
% |
| Europe (*) |
|
|
30 |
% |
|
|
32 |
% |
|
|
5 |
% |
| Philippines |
|
|
(3 |
%) |
|
|
(6 |
%) |
|
|
(5 |
%) |
| Middle East and Africa (*) |
|
|
(16 |
%) |
|
|
(16 |
%) |
|
|
0 |
% |
| South, Central America and the Caribbean (*) |
|
|
7 |
% |
|
|
7 |
% |
|
|
5 |
% |
| READY-MIX PRICE |
|
|
|
|
|
|
|
|
|
|
|
|
| Mexico |
|
|
41 |
% |
|
|
45 |
% |
|
|
12 |
% |
| U.S.A. |
|
|
23 |
% |
|
|
21 |
% |
|
|
2 |
% |
| Europe, Middle East, Asia and Africa (*) |
|
|
11 |
% |
|
|
12 |
% |
|
|
2 |
% |
| Europe (*) |
|
|
18 |
% |
|
|
19 |
% |
|
|
2 |
% |
| Philippines |
|
|
N/A |
|
|
|
N/A |
|
|
|
N/A |
|
| Middle East and Africa (*) |
|
|
(0 |
%) |
|
|
(1 |
%) |
|
|
(1 |
%) |
| South, Central America and the Caribbean (*) |
|
|
10 |
% |
|
|
13 |
% |
|
|
7 |
% |
| AGGREGATES PRICE |
|
|
|
|
|
|
|
|
|
|
|
|
| Mexico |
|
|
34 |
% |
|
|
36 |
% |
|
|
15 |
% |
| U.S.A. |
|
|
20 |
% |
|
|
11 |
% |
|
|
(6 |
%) |
| Europe, Middle East, Asia and Africa (*) |
|
|
6 |
% |
|
|
10 |
% |
|
|
2 |
% |
| Europe (*) |
|
|
8 |
% |
|
|
12 |
% |
|
|
2 |
% |
| Philippines |
|
|
N/A |
|
|
|
N/A |
|
|
|
N/A |
|
| Middle East and Africa (*) |
|
|
(2 |
%) |
|
|
(2 |
%) |
|
|
(3 |
%) |
| South, Central America and the Caribbean (*) |
|
|
9 |
% |
|
|
10 |
% |
|
|
8 |
% |
| (*) |
Price variation in U.S. dollars calculated on a volume-weighted-average basis; price variation in local
currency calculated on a volume-weighted-average basis at constant foreign-exchange rates. |
|
|
|
| 2023 Second Quarter Results |
|
Page 11 |
|
|
|
| Operating results |
|
|
Variation in Local Currency
|
|
|
|
|
|
|
|
|
|
|
|
|
| |
|
January - June |
|
|
Second Quarter |
|
|
Second Quarter 2023 vs. |
|
| DOMESTIC GRAY CEMENT PRICE |
|
2023 vs. 2022 |
|
|
2023 vs. 2022 |
|
|
First Quarter 2023 |
|
| Mexico |
|
|
14 |
% |
|
|
12 |
% |
|
|
1 |
% |
| U.S.A. |
|
|
18 |
% |
|
|
15 |
% |
|
|
1 |
% |
| Europe, Middle East, Asia and Africa (*) |
|
|
25 |
% |
|
|
21 |
% |
|
|
6 |
% |
| Europe (*) |
|
|
31 |
% |
|
|
28 |
% |
|
|
3 |
% |
| Philippines |
|
|
2 |
% |
|
|
(2 |
%) |
|
|
(4 |
%) |
| Middle East and Africa (*) |
|
|
33 |
% |
|
|
27 |
% |
|
|
1 |
% |
| South, Central America and the Caribbean (*) |
|
|
11 |
% |
|
|
10 |
% |
|
|
3 |
% |
| READY-MIX PRICE |
|
|
|
|
|
|
|
|
|
|
|
|
| Mexico |
|
|
26 |
% |
|
|
27 |
% |
|
|
8 |
% |
| U.S.A. |
|
|
23 |
% |
|
|
21 |
% |
|
|
2 |
% |
| Europe, Middle East, Asia and Africa (*) |
|
|
15 |
% |
|
|
13 |
% |
|
|
2 |
% |
| Europe (*) |
|
|
18 |
% |
|
|
16 |
% |
|
|
0 |
% |
| Philippines |
|
|
N/A |
|
|
|
N/A |
|
|
|
N/A |
|
| Middle East and Africa (*) |
|
|
11 |
% |
|
|
8 |
% |
|
|
1 |
% |
| South, Central America and the Caribbean (*) |
|
|
21 |
% |
|
|
21 |
% |
|
|
3 |
% |
| AGGREGATES PRICE |
|
|
|
|
|
|
|
|
|
|
|
|
| Mexico |
|
|
20 |
% |
|
|
19 |
% |
|
|
10 |
% |
| U.S.A. |
|
|
20 |
% |
|
|
11 |
% |
|
|
(6 |
%) |
| Europe, Middle East, Asia and Africa (*) |
|
|
9 |
% |
|
|
9 |
% |
|
|
1 |
% |
| Europe (*) |
|
|
10 |
% |
|
|
10 |
% |
|
|
1 |
% |
| Philippines |
|
|
N/A |
|
|
|
N/A |
|
|
|
N/A |
|
| Middle East and Africa (*) |
|
|
8 |
% |
|
|
7 |
% |
|
|
(0 |
%) |
| South, Central America and the Caribbean (*) |
|
|
20 |
% |
|
|
18 |
% |
|
|
4 |
% |
| (*) |
Price variation in U.S. dollars calculated on a volume-weighted-average basis; price variation in local
currency calculated on a volume-weighted-average basis at constant foreign-exchange rates. |
|
|
|
| 2023 Second Quarter Results |
|
Page 12 |
|
|
|
| Other information |
|
|
Operating expenses
The following table shows the breakdown of operating expenses for the period presented.
|
|
|
|
|
|
|
|
|
|
|
|
|
|
|
|
|
| |
|
January - June |
|
|
Second Quarter |
|
| In thousands of US
dollars |
|
2023 |
|
|
2022 |
|
|
2023 |
|
|
2022 |
|
| Administrative expenses |
|
|
565,779 |
|
|
|
445,826 |
|
|
|
290,053 |
|
|
|
230,805 |
|
| Selling expenses |
|
|
167,206 |
|
|
|
150,202 |
|
|
|
87,594 |
|
|
|
77,725 |
|
| Distribution and logistic expenses |
|
|
944,231 |
|
|
|
883,464 |
|
|
|
497,536 |
|
|
|
472,007 |
|
|
|
|
|
|
|
|
|
|
|
|
|
|
|
|
|
|
| Operating expenses before depreciation |
|
|
1,677,217 |
|
|
|
1,479,492 |
|
|
|
875,182 |
|
|
|
780,537 |
|
|
|
|
|
|
|
|
|
|
|
|
|
|
|
|
|
|
| Depreciation in operating expenses |
|
|
105,112 |
|
|
|
92,945 |
|
|
|
52,430 |
|
|
|
48,782 |
|
|
|
|
|
|
|
|
|
|
|
|
|
|
|
|
|
|
| Operating expenses |
|
|
1,782,328 |
|
|
|
1,572,437 |
|
|
|
927,612 |
|
|
|
829,319 |
|
|
|
|
|
|
|
|
|
|
|
|
|
|
|
|
|
|
|
|
|
|
|
|
|
|
|
|
|
|
|
|
|
|
|
| As % of Net Sales |
|
| Administrative expenses |
|
|
6.6 |
% |
|
|
5.8 |
% |
|
|
6.4 |
% |
|
|
5.7 |
% |
| SG&A expenses |
|
|
8.5 |
% |
|
|
7.7 |
% |
|
|
8.3 |
% |
|
|
7.7 |
% |
Equity-related information
One Cemex ADS represents ten Cemex CPOs. One Cemex CPO represents two Series A shares and one Series B share. The following amounts are expressed in CPO-equivalent terms.
|
|
|
|
|
|
Beginning-of-quarter outstanding CPO-equivalents |
|
|
14,487,786,971 |
|
|
|
|
|
|
| End-of-quarter
outstanding CPO-equivalents |
|
|
14,487,786,971 |
|
For purposes of this report, outstanding CPO-equivalents equal the total number of
Series A and B shares outstanding as if they were all held in CPO form less CPOs held in subsidiaries, which as of June 30, 2023, were 20,541,277.
Derivative instruments
The following table shows the notional amount for each type of derivative instrument and the aggregate fair market value for all of Cemex’s derivative
instruments as of the last day of each quarter presented.
|
|
|
|
|
|
|
|
|
|
|
|
|
|
|
|
|
|
|
|
|
|
|
|
|
| |
|
Second Quarter |
|
|
First Quarter |
|
| |
|
2023 |
|
|
2022 |
|
|
2023 |
|
| In millions of
US dollars |
|
Notional
amount |
|
|
Fair
value |
|
|
Notional
amount |
|
|
Fair
value |
|
|
Notional
amount |
|
|
Fair
value |
|
| Exchange rate derivatives (1) |
|
|
1,488 |
|
|
|
(135 |
) |
|
|
1,822 |
|
|
|
(8 |
) |
|
|
1,495 |
|
|
|
(94 |
) |
| Interest rate swaps (2) |
|
|
1,056 |
|
|
|
49 |
|
|
|
1,310 |
|
|
|
58 |
|
|
|
1,040 |
|
|
|
41 |
|
| Fuel derivatives |
|
|
152 |
|
|
|
(1 |
) |
|
|
111 |
|
|
|
63 |
|
|
|
161 |
|
|
|
(1 |
) |
|
|
|
|
|
|
|
|
|
|
|
|
|
|
|
|
|
|
|
|
|
|
|
|
|
|
|
|
2,696 |
|
|
|
(87 |
) |
|
|
3,243 |
|
|
|
113 |
|
|
|
2,696 |
|
|
|
54 |
|
|
|
|
|
|
|
|
|
|
|
|
|
|
|
|
|
|
|
|
|
|
|
|
|
|
| 1) |
The exchange rate derivatives are used to manage currency exposures arising from regular operations, net
investment hedge and forecasted transactions. As of June 30, 2023, the derivatives related to net investment hedge represent a notional amount of US$1,188 million. |
| 2) |
Interest-rate swap derivatives related to bank loans. |
Under IFRS, companies are required to recognize the fair value of all derivative financial instruments on the balance sheet as financial assets or
liabilities, with changes in such fair market values recorded in the income statement, except when transactions are entered into for cash-flow-hedging purposes, in such cases, changes in the fair market value of the related derivative instruments
are recognized temporarily in equity and then reclassified into earnings as the inverse effects of the underlying hedged items flow through the income statement. Moreover, in transactions related to net investment hedges, changes in fair market
value are recorded directly in equity as part of the currency translation effect and are reclassified to the income statement only in the case of a disposal of the net investment. As of June 30, 2023, in connection with its derivatives
portfolio’s fair market value recognition, Cemex recognized a negative change in mark to market as compared to 1Q23 which increased its net financial liabilities to US$87 million.
|
|
|
| 2023 Second Quarter Results |
|
Page 13 |
|
|
|
| Operating information |
|
|
Discontinued operations
On October 25, 2022, Cemex successfully concluded a partnership with Advent International (“Advent”). As part of the partnership, Advent
acquired a 65% stake in Neoris for US$119 million from Cemex. While surrendering control to Advent, Cemex retained a 34.8% stake and remained a key strategic partner and customer of Neoris. Cemex’s retained 34.8% stake in Neoris is
accounted for under the equity method. Neoris’ results for the six-month period ended June 30, 2022, are reported in Cemex’s income statements, net of income tax, in the single line item
“Discontinued operations.”
On August 31, 2022, Cemex concluded with affiliates of Cementos Progreso Holdings, S.L. the sale of its
operations in Costa Rica and El Salvador, for a total consideration related to the aggregate majority ownership of US$325 million. The assets divested consisted of one cement plant, one grinding station, seven
ready-mix plants, one aggregates quarry, as well as one distribution center in Costa Rica and one distribution center in El Salvador. As of June 30, 2022, the assets and liabilities associated with these
operations are presented in the Statement of Financial Position within the line items of “Assets held for sale” and “Liabilities directly related to assets held for sale,” respectively. Cemex’s operations of these assets for
the six-month period ended June 30, 2022, are reported in Cemex’s income statements, net of income tax, in the single line item “Discontinued operations.”
The following table presents condensed combined information of the income statements for the six-month period ended
June 30, 2022, for Cemex’s discontinued operations related to Neoris, Costa Rica and El Salvador:
|
|
|
|
|
|
|
|
|
|
|
|
|
|
|
|
|
| STATEMENT OF OPERATIONS |
|
Jan-June |
|
|
Second Quarter |
|
| (Millions of U.S. dollars) |
|
2023 |
|
|
2022 |
|
|
2023 |
|
|
2022 |
|
| Sales |
|
|
— |
|
|
|
165 |
|
|
|
— |
|
|
|
84 |
|
| Cost of sales, operating expenses, and other expenses, net |
|
|
— |
|
|
|
(154 |
) |
|
|
— |
|
|
|
(83 |
) |
| Interest expense, net, and others |
|
|
— |
|
|
|
19 |
|
|
|
— |
|
|
|
11 |
|
|
|
|
|
|
|
|
|
|
|
|
|
|
|
|
|
|
| Income (loss) before income tax |
|
|
— |
|
|
|
30 |
|
|
|
— |
|
|
|
12 |
|
|
|
|
|
|
|
|
|
|
|
|
|
|
|
|
|
|
| Income tax |
|
|
— |
|
|
|
(9 |
) |
|
|
— |
|
|
|
(4 |
) |
|
|
|
|
|
|
|
|
|
|
|
|
|
|
|
|
|
| Income (loss) from discontinued operations |
|
|
— |
|
|
|
21 |
|
|
|
— |
|
|
|
8 |
|
|
|
|
|
|
|
|
|
|
|
|
|
|
|
|
|
|
| Net gain (loss) on sale |
|
|
— |
|
|
|
(2 |
) |
|
|
— |
|
|
|
(2 |
) |
|
|
|
|
|
|
|
|
|
|
|
|
|
|
|
|
|
| Net result from discontinued operations |
|
|
— |
|
|
|
19 |
|
|
|
— |
|
|
|
6 |
|
|
|
|
|
|
|
|
|
|
|
|
|
|
|
|
|
|
Relevant accounting effects included in the reported financial statements
During the fourth quarter of 2022, Cemex recognized non-cash impairment charges in the statement of operations for an
aggregate amount of US$442 million within the line-item other expenses, net, of which US$365 million refer to impairment of goodwill and US$77 million refer to impairment of property, machinery and equipment. The impairment losses of
goodwill refer to Cemex operating segments in the United States for US$273 million and Spain for US$92 million, which reduced the line item of goodwill in the statement of financial position. Moreover, the impairment losses of property,
machinery and equipment relate mainly also to Cemex’s businesses in the United States and Spain.
The impairment losses of goodwill are mainly
related to the significant increase in the discount rates as compared to 2021 and the resulting significant decrease in the Cemex’s projected cash flows in these operating segments considering the global high inflationary environment, which
increased the risk-free rates, and the material increase in the funding cost observed in the industry during the period. These negative effects more than offset the expected improvements in the estimated Operating EBITDA generation in both of
Cemex’s businesses in the United States and Spain. These non-cash impairment losses did not impact Cemex’s liquidity, Operating EBITDA, and cash taxes payable. Nevertheless, it decreased Cemex’s
total assets and equity and generated net losses in the fourth quarter.
|
|
|
| 2023 Second Quarter Results |
|
Page 14 |
|
|
|
| Definitions of terms and disclosures |
|
|
Methodology for translation, consolidation, and presentation of results
Under IFRS, Cemex translates the financial statements of foreign subsidiaries using exchange rates at the reporting date for the balance sheet and the exchange
rates at the end of each month for the income statement.
Breakdown of regions and subregions
The South, Central America and the Caribbean region includes Cemex’s operations in Bahamas, Colombia, the Dominican Republic, Guatemala, Guyana, Haiti,
Jamaica, Trinidad & Tobago, Barbados, Nicaragua, Panama, Peru, and Puerto Rico, as well as trading operations in the Caribbean region.
The EMEA
region includes Europe, Middle East, Asia, and Africa.
Asia subregion includes our Philippines operations.
Europe subregion includes operations in Spain, Croatia, the Czech Republic, France, Germany, Poland, and the United Kingdom.
Middle East and Africa subregion include the United Arab Emirates, Egypt, and Israel.
Definition of terms
Free cash flow equals operating
EBITDA minus net interest expense, maintenance, and strategic capital expenditures, change in working capital, taxes paid, and other cash items (net other expenses less proceeds from the disposal of obsolete and/or substantially depleted operating
fixed assets that are no longer in operation).
l-t-l (like to like) on a like-to-like basis adjusting for currency fluctuations and for investments/divestments when applicable.
Maintenance capital expenditures equal investments incurred for the purpose of ensuring the company’s operational continuity. These include capital
expenditures on projects required to replace obsolete assets or maintain current operational levels, and mandatory capital expenditures, which are projects required to comply with governmental regulations or company policies.
Net debt equals total debt (debt plus financial leases) minus cash and cash equivalents.
Operating EBITDA equals operating earnings before other income and expenses, net, plus depreciation and operating amortization.
pp equals percentage points
Prices all references to pricing
initiatives, price increases or decreases, refer to our prices for our products and services
SG&A expenses equal selling and administrative expenses
Strategic capital expenditures equal investments incurred with the purpose of increasing the company’s profitability. These include capital
expenditures on projects designed to increase profitability by expanding capacity, and margin improvement capital expenditures, which are projects designed to increase profitability by reducing costs.
Working capital equals operating accounts receivable (including other current assets received as payment in kind) plus historical inventories minus operating
payables.
% var percentage variation
Earnings per ADS
Please refer to page 2 for the number of average ADSs outstanding used for the calculation of earnings per ADS.
According to the IAS 33 Earnings per share, the weighted-average number of common shares outstanding is determined considering the number of days during the
accounting period in which the shares have been outstanding, including shares derived from corporate events that have modified the stockholder’s equity structure during the period, such as increases in the number of shares by a public offering
and the distribution of shares from stock dividends or recapitalizations of retained earnings and the potential diluted shares (Stock options, Restricted Stock Options and Mandatory Convertible Shares). The shares issued because of share dividends,
recapitalizations and potential diluted shares are considered as issued at the beginning of the period.
|
|
|
|
|
|
|
|
|
|
|
|
|
|
|
|
|
|
|
|
|
|
|
|
|
| Exchange rates |
|
January - June |
|
|
Second Quarter |
|
|
Second Quarter |
|
| |
|
|
|
|
|
|
|
|
|
|
|
|
|
|
|
|
|
|
| |
|
2023 |
|
|
2022 |
|
|
2023 |
|
|
2022 |
|
|
2023 |
|
|
2022 |
|
| |
Average |
|
|
Average |
|
|
Average |
|
|
Average |
|
|
End of period |
|
|
End of period |
|
| Mexican peso |
|
|
18.00 |
|
|
|
20.19 |
|
|
|
17.60 |
|
|
|
20.05 |
|
|
|
17.12 |
|
|
|
20.10 |
|
| Euro |
|
|
0.9236 |
|
|
|
0.9203 |
|
|
|
0.9184 |
|
|
|
0.9447 |
|
|
|
0.9168 |
|
|
|
0.9540 |
|
| British pound |
|
|
0.8072 |
|
|
|
0.7778 |
|
|
|
0.7979 |
|
|
|
0.8047 |
|
|
|
0.7877 |
|
|
|
0.8216 |
|
Amounts provided in units of
local currency per U.S. dollar.
|
|
|
| 2023 Second Quarter Results |
|
Page 15 |
|
|
|
| Disclaimer |
|
|
Except as the context otherwise may require, references in this report to “Cemex,” “we,”
“us” or “our” refer to Cemex, S.A.B. de C.V. and its consolidated entities. The information included in this report contains, and other reports we will file or furnish in the future may contain, forward-looking statements within
the meaning of the U.S. federal securities laws. We intend these forward-looking statements to be covered by the safe harbor provisions for forward-looking statements within the meaning of the U.S. federal securities laws. These forward-looking
statements and information are necessarily subject to risks, uncertainties, and assumptions, including but not limited to statements related to Cemex’s plans, objectives, expectations (financial or otherwise), and typically can be identified by
the use of words such as “may,” “assume,” “might,” “should,” “could,” “continue,” “would,” “can,” “consider,” “anticipate,” “estimate,”
“expect,” “envision,” “plan,” “believe,” “foresee,” “predict,” “potential,” “target,” “strategy,” “intend,” “aimed”, or other similar
terms. Although Cemex believes that its expectations are reasonable, it can give no assurance that these expectations will prove to be correct, and actual results may vary materially from historical results or results anticipated by forward-looking
statements due to various factors. These forward-looking statements reflect, as of the date on which such forward-looking statements are made, or unless otherwise indicated, our current expectations and projections about future events based on our
knowledge of present facts and circumstances and assumptions about future events. These statements necessarily involve risks, uncertainties and assumptions that could cause actual results to differ materially from historical results or those
anticipated in this report. Among others, such risks, uncertainties, and assumptions that could cause results to differ, or that otherwise could have an impact on us, include those discussed in Cemex’s most recent annual report and those
detailed from time to time in Cemex’s other filings with the Securities and Exchange Commission and the Mexican Stock Exchange (Bolsa Mexicana de Valores), which factors are incorporated herein by reference, including, but not limited to:
impact of pandemics, epidemics or outbreaks of infectious diseases and the response of governments and other third parties, which could adversely affect, among other matters, the ability of our operating facilities to operate at full or any
capacity, supply chains, international operations, availability of liquidity, investor confidence and consumer spending, as well as the availability of, and demand for, our products and services; the cyclical activity of the construction sector; our
exposure to other sectors that impact our and our clients’ businesses, such as, but not limited to, the energy sector; availability of raw materials and related fluctuating prices of raw materials, as well as of goods and services in general,
in particular increases in prices as a result of inflation; volatility in pension plan asset values and liabilities, which may require cash contributions to the pension plans; the impact of environmental cleanup costs and other remedial actions, and
other liabilities relating to existing and/or divested businesses; our ability to secure and permit aggregates reserves in strategically located areas; the timing and amount of federal, state and local funding for infrastructure; changes in the
level of spending for private residential and private nonresidential construction; changes in our effective tax rate; competition in the markets in which we offer our products and services; general political, social, health, economic and business
conditions in the markets in which we operate or that affect our operations and any significant economic, health, political or social developments in those markets, as well as any inherent risks to international operations; the regulatory
environment, including environmental, energy, tax, labor, antitrust, and acquisition-related rules and regulations; our ability to satisfy our obligations under our material debt agreements, the indentures that govern our outstanding notes, and
other debt instruments and financial obligations, including our subordinated notes with no fixed maturity and other financial obligations; the availability of short-term credit lines or working capital facilities, which can assist us in connection
with market cycles; the impact of our below investment grade debt rating on our cost of capital and on the cost of the products and services we purchase; loss of reputation of our brands; our ability to consummate asset sales, fully integrate newly
acquired businesses, achieve cost-savings from our cost-reduction initiatives, implement our pricing initiatives for our products and generally meet our business strategy goals; the increasing reliance on information technology infrastructure for
our sales, invoicing, procurement, financial statements and other processes that can adversely affect our sales and operations in the event that the infrastructure does not work as intended, experiences technical difficulties or is subjected to
cyber-attacks; changes in the economy that affect the demand for consumer goods, consequently affecting demand for our products and services; climate change, in particular reflected in weather conditions, including but not limited to, excessive rain
and snow, and disasters such as earthquakes and floods, that could affect our facilities or the markets in which we offer our products and services or from where we source our raw materials; trade barriers, including tariffs or import taxes and
changes in existing trade policies or changes to, or withdrawals from, free trade agreements, including the United States-Mexico-Canada Agreement; availability and cost of trucks, railcars, barges and ships, as well as their licensed operators and
drivers, for transport of our materials; labor shortages and constraints; terrorist and organized criminal activities as well as geopolitical events, such as war and armed conflicts, including the current war between Russia and Ukraine; declarations
of insolvency or bankruptcy, or becoming subject to similar proceedings; and, natural disasters and other unforeseen events (including global health hazards such as COVID-19). Should one or more of these risks
or uncertainties materialize, or should underlying assumptions prove incorrect, actual results may vary materially from historical results, performance or achievements and/or results, performance or achievements expressly or implicitly anticipated
by the forward-looking statements, or otherwise could have an impact on us or our consolidated entities. Forward-looking statements should not be considered guarantees of future performance, nor the results or developments are indicative of results
or developments in subsequent periods. Actual results of Cemex’s operations and the development of market conditions in which Cemex operates, or other circumstances or assumptions suggested by such statements may differ materially from those
described in, or suggested by, the forward-looking statements contained herein. Any or all of Cemex’s forward-looking statements may turn out to be inaccurate and the factors identified above are not exhaustive. Accordingly, undue reliance on
forward-looking statements should not be placed, as such forward-looking statements speak only as of the dates on which they are made. These factors may be revised or supplemented and the information contained in this report is subject to change
without notice, but Cemex is not under, and expressly disclaims, any obligation to update or correct the information contained in this report or revise any forward-looking statement that it may make from time to time, whether as a result of new
information, future events or otherwise, or to reflect the occurrence of anticipated or unanticipated events or circumstances. Readers should review future reports filed by us with the U.S. Securities and Exchange Commission and the Mexican Stock
Exchange (Bolsa Mexicana de Valores). This report also includes statistical data regarding, but not limited to, the production, distribution, marketing and sale of cement, ready mix concrete, clinker, aggregates, and Urbanization Solutions. Unless
the context indicates otherwise, all references to pricing initiatives, price increases or decreases, refer to Cemex’s prices for Cemex’s products. We generated some of this data internally, and some was obtained from independent industry
publications and reports that we believe to be reliable sources that were available as of the date of this report. We have not independently verified this data nor sought the consent of any organizations to refer to their reports in this report.
UNLESS OTHERWISE NOTED, ALL FIGURES ARE PRESENTED IN DOLLARS,
BASED ON INTERNATIONAL FINANCIAL REPORTING STANDARDS, AS APPLICABLE
Copyright Cemex, S.A.B. de C.V. and its subsidiaries
|
|
|
| 2023 Second Quarter Results |
|
Page 16 |

Exhibit 3 Second Quarter 2023 Results UDEM - Roberto Garza Sada Center,
Santa Catarina, Mexico

Except as the context otherwise may require, references in this
presentation to “Cemex,” “we,” “us” or “our” refer to Cemex, S.A.B. de C.V. and its consolidated entities. The information included in this presentation contains, and the reports we will file or
furnish in the future may contain, forward-looking statements within the meaning of the U.S. federal securities laws. We intend these forward-looking statements to be covered by the safe harbor provisions for forward-looking statements within the
meaning of the U.S. federal securities laws. These forward-looking statements and information are necessarily subject to risks, uncertainties, and assumptions, including but not limited to statements related to Cemex’s plans, objectives,
expectations (financial or otherwise), and typically can be identified by the use of words such as “may,” “assume,” “might,” “should,” “could,” “continue,” “would,”
“can,” “consider,” “anticipate,” “estimate,” “expect,” “envision,” “plan,” “believe,” “foresee,” “predict,”
“potential,” “target,” “strategy,” “intend,” “aimed” or other similar terms. Although Cemex believes that its expectations are reasonable, it can give no assurance that these expectations
will prove to be correct, and actual results may vary materially from historical results or results anticipated by forward-looking statements due to various factors. These forward-looking statements reflect, as of the date on which such
forward-looking statements are made, or unless otherwise indicated, our current expectations and projections about future events based on our knowledge of present facts and circumstances and assumptions about future events. These statements
necessarily involve risks, uncertainties and assumptions that could cause actual results to differ materially from historical results or those anticipated in this presentation. Among others, such risks, uncertainties, and assumptions that could
cause results to differ, or that otherwise could have an impact on us, include those discussed in Cemex’s most recent annual report and those detailed from time to time in Cemex’s other filings with the Securities and Exchange Commission
and the Mexican Stock Exchange (Bolsa Mexicana de Valores), which factors are incorporated herein by reference, including, but not limited to: impact of pandemics, epidemics or outbreaks of infectious diseases and the response of governments and
other third parties, which could adversely affect, among other matters, the ability of our operating facilities to operate at full or any capacity, supply chains, international operations, availability of liquidity, investor confidence and consumer
spending, as well as the availability of, and demand for, our products and services; the cyclical activity of the construction sector; our exposure to other sectors that impact our and our clients’ businesses, such as, but not limited to, the
energy sector; availability of raw materials and related fluctuating prices of raw materials, as well as of goods and services in general, in particular increases in prices as a result of inflation; volatility in pension plan asset values and
liabilities, which may require cash contributions to the pension plans; the impact of environmental cleanup costs and other remedial actions, and other liabilities relating to existing and/or divested businesses; our ability to secure and permit
aggregates reserves in strategically located areas; the timing and amount of federal, state and local funding for infrastructure; changes in the level of spending for private residential and private nonresidential construction; changes in our
effective tax rate; competition in the markets in which we offer our products and services; general political, social, health, economic and business conditions in the markets in which we operate or that affect our operations and any significant
economic, health, political or social developments in those markets, as well as any inherent risks to international operations; the regulatory environment, including environmental, energy, tax, labor, antitrust, and acquisition-related rules and
regulations; our ability to satisfy our obligations under our material debt agreements, the indentures that govern our outstanding notes, and other debt instruments and financial obligations, including our subordinated notes with no fixed maturity
and other financial obligations; the availability of short-term credit lines or working capital facilities, which can assist us in connection with market cycles; the impact of our below investment grade debt rating on our cost of capital and on the
cost of the products and services we purchase; loss of reputation of our brands; our ability to consummate asset sales, fully integrate newly acquired businesses, achieve cost-savings from our cost-reduction initiatives, implement our pricing
initiatives for our products and generally meet our business strategy goals; the increasing reliance on information technology infrastructure for our sales, invoicing, procurement, financial statements and other processes that can adversely affect
our sales and operations in the event that the infrastructure does not work as intended, experiences technical difficulties or is subjected to cyber-attacks; changes in the economy that affect demand for consumer goods, consequently affecting the
demand for our products and services; climate change, in particular reflected in weather conditions, including but not limited to, excessive rain and snow, and disasters such as earthquakes and floods, that could affect our facilities or the markets
in which we offer our products and services or from where we source our raw materials; trade barriers, including tariffs or import taxes and changes in existing trade policies or changes to, or withdrawals from, free trade agreements, including the
United States-Mexico-Canada Agreement; availability and cost of trucks, railcars, barges, and ships, as well as their licensed operators and drivers, for transport of our materials; labor shortages and constraints; terrorist and organized criminal
activities as well as geopolitical events, such as war and armed conflicts, including the current war between Russia and Ukraine; declarations of insolvency or bankruptcy, or becoming subject to similar proceedings; and, natural disasters and other
unforeseen events (including global health hazards such as COVID-19). Should one or more of these risks or uncertainties materialize, or should underlying assumptions prove incorrect, actual results may vary materially from historical results,
performance, or achievements and/or results, performance or achievements expressly or implicitly anticipated by the forward-looking statements, or otherwise could have an impact on us or our consolidated entities. Forward-looking statements should
not be considered guarantees of future performance, nor the results or developments are indicative of results or developments in subsequent periods. Actual results of Cemex’s operations and the development of market conditions in which Cemex
operates, or other circumstances or assumptions suggested by such statements may differ materially from those described in, or suggested by, the forward-looking statements contained herein. Any or all of Cemex’s forward-looking statements may
turn out to be inaccurate and the factors identified above are not exhaustive. Accordingly, undue reliance on forward-looking statements should not be placed, as such forward-looking statements speak only as of the dates on which they are made.
These factors may be revised or supplemented and the information contained in this presentation is subject to change without notice, but Cemex is not under, and expressly disclaims, any obligation to update or correct the information contained in
this presentation or revise any forward-looking statement that it may make from time to time, whether as a result of new information, future events or otherwise, or to reflect the occurrence of anticipated or unanticipated events or circumstances.
Readers should review future reports filed by us with the U.S. Securities and Exchange Commission and the Mexican Stock Exchange (Bolsa Mexicana de Valores). This presentation also includes statistical data regarding, but not limited to, the
production, distribution, marketing and sale of cement, ready mix concrete, clinker, aggregates, and Urbanization Solutions. Unless the context indicates otherwise, all references to pricing initiatives, price increases or decreases, refer to
Cemex’s prices for Cemex’s products. We generated some of this data internally, and some was obtained from independent industry publications and reports that we believe to be reliable sources that were available as of the date of this
presentation. We have not independently verified this data nor sought the consent of any organizations to refer to their reports in this presentation. UNLESS OTHERWISE NOTED, ALL FIGURES ARE PRESENTED IN DOLLARS, BASED ON INTERNATIONAL FINANCIAL
REPORTING STANDARDS, AS APPLICABLE Copyright Cemex, S.A.B. de C.V. and its subsidiaries
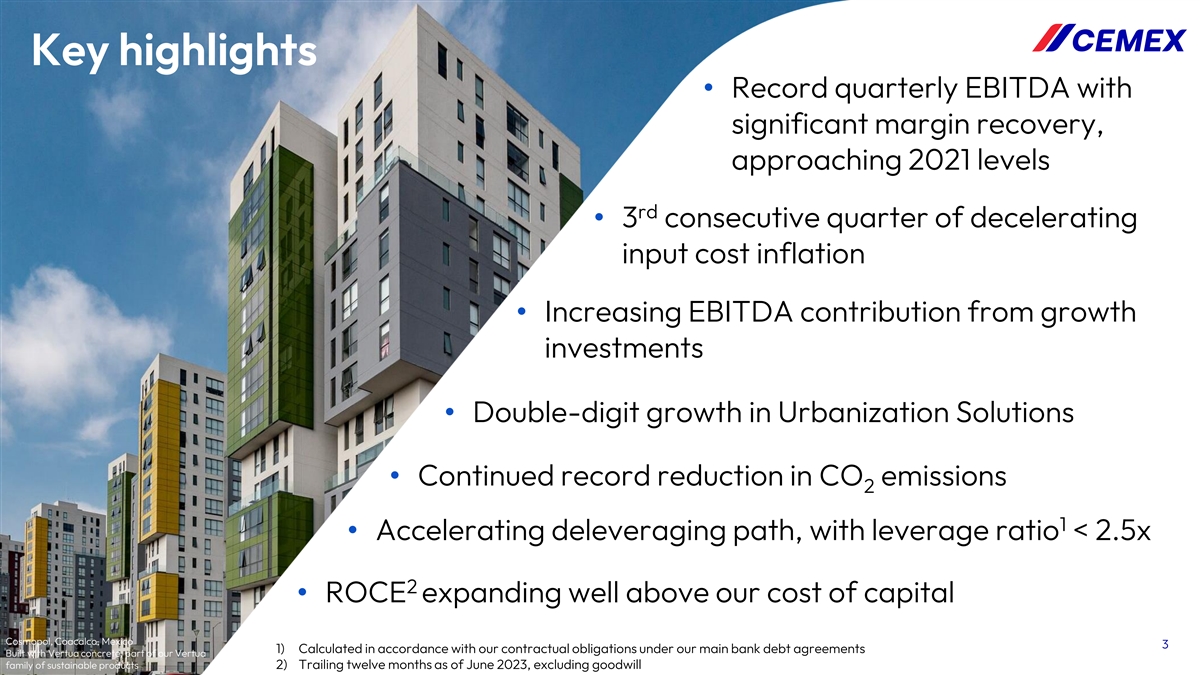
Key highlights • Record quarterly EBITDA with significant margin
recovery, approaching 2021 levels rd • 3 consecutive quarter of decelerating input cost inflation • Increasing EBITDA contribution from growth investments • Double-digit growth in Urbanization Solutions • Continued record
reduction in CO emissions 2 1 • Accelerating deleveraging path, with leverage ratio < 2.5x 2 • ROCE expanding well above our cost of capital Cosmopol, Coacalco, Mexico 3 1) Calculated in accordance with our contractual obligations
under our main bank debt agreements Built with Vertua concrete, part of our Vertua family of sustainable products 2) Trailing twelve months as of June 2023, excluding goodwill
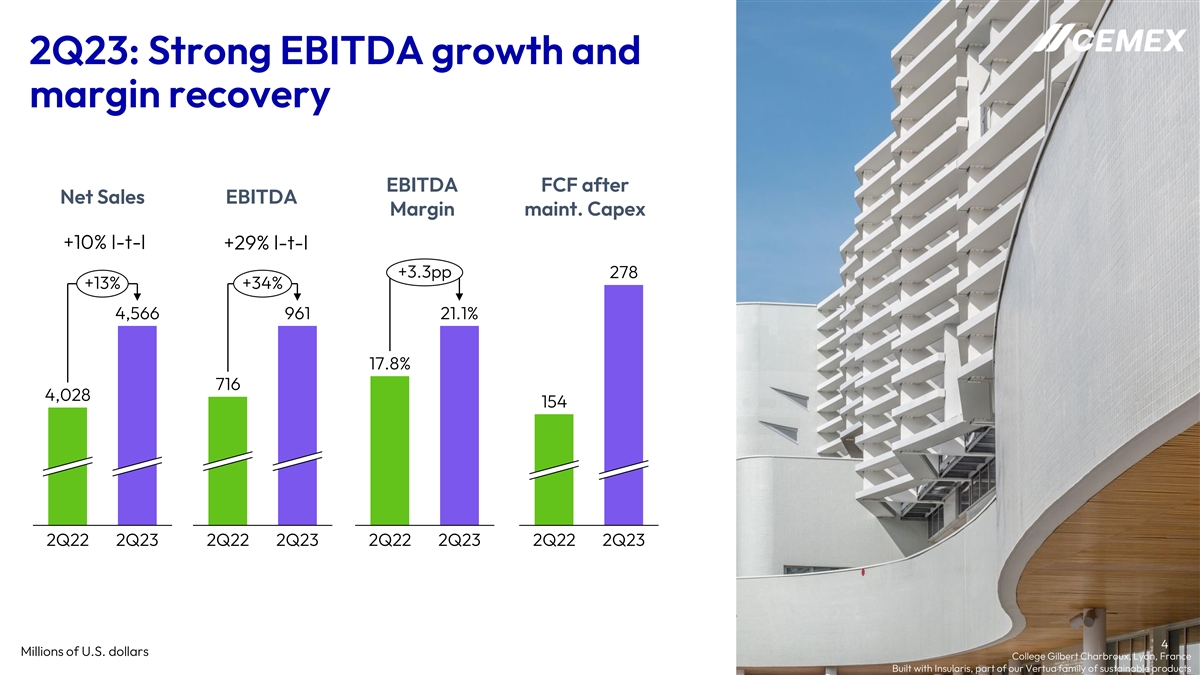
2Q23: Strong EBITDA growth and margin recovery EBITDA FCF after Net Sales
EBITDA Margin maint. Capex +10% l-t-l +29% l-t-l +3.3pp 278 +13% +34% 4,566 961 21.1% 17.8% 716 4,028 154 2Q22 2Q23 2Q22 2Q23 2Q22 2Q23 2Q22 2Q23 4 Millions of U.S. dollars College Gilbert Charbroux, Lyon, France Built with Insularis, part of our
Vertua family of sustainable products

Paring down 1Q23 volume decline… CONSOLIDATED VOLUMES 2Q23 YoY volume
variation (l-t-l) 5% 3% USA -2% -2% EMEA -8% -10% EUROPE -7% 11% -11% -5% -10% -6% -12% 6% MEX 1% 1 14% Cement Ready-mix 3% SCAC Aggregates -3% 5 1) Domestic gray cement

…while pricing catches up to cumulative cost inflation CONSOLIDATED
PRICES 2Q23 YoY and QoQ price variation (l-t-l) 18% 21% 15% 21% 28% 13% 15% 11% 9% 11% 16% EMEA 10% USA EUROPE 27% 6% 2% 1% QoQ: 1% 2% -6% 19% 3% 0% 1% 3% 3% 0% 12% MEX 1% 8% 10% Sequential (1Q23 to 2Q23) 21% 1 Cement 18% Ready-mix 10% SCAC
Aggregates 3% 3% 4% 1) Domestic gray cement 6 Note: For CEMEX, SCAC, Europe and EMEA, prices (l-t-l) are calculated on a volume-weighted average basis at constant foreign-exchange rates
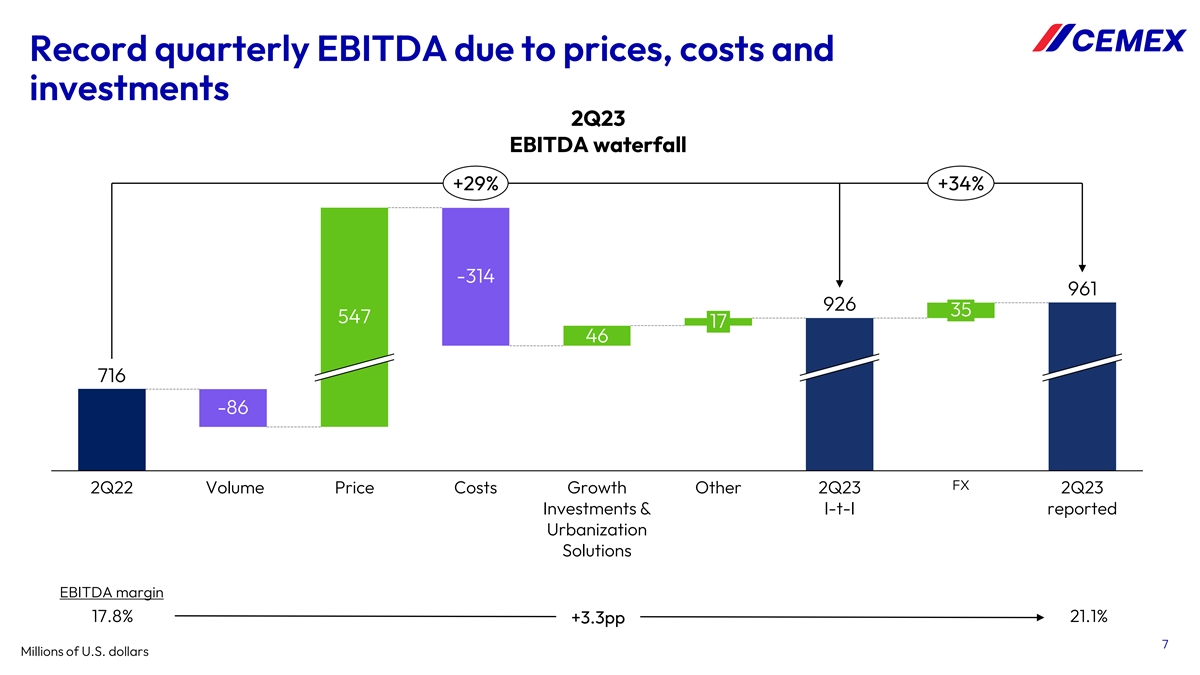
Record quarterly EBITDA due to prices, costs and investments 2Q23 EBITDA
waterfall +29% +34% -314 961 926 35 547 17 46 716 -86 FX 2Q22 Volume Price Costs Growth Other 2Q23 2Q23 Investments & l-t-l reported Urbanization Solutions EBITDA margin 17.8% 21.1% +3.3pp 7 Millions of U.S. dollars

Margins approaching 2021 goal, boosted by decelerating cost inflation
Consolidated EBITDA Margin 21.2% 21.1% 20.1% 19.7% FY 2021 19.6% 18.4% 18.2% 17.8% 18.1% 18.0% 17.2% FY 2022 16.3% 16.4% 4Q20 1Q21 2Q21 3Q21 4Q21 1Q22 2Q22 3Q22 4Q22 1Q23 2Q23 COGS as % of Sales 68.8% 67.6% 66.4% 67.7% 69.8% 69.2% 68.7% 69.5% 68.8%
68.0% 65.4% 8
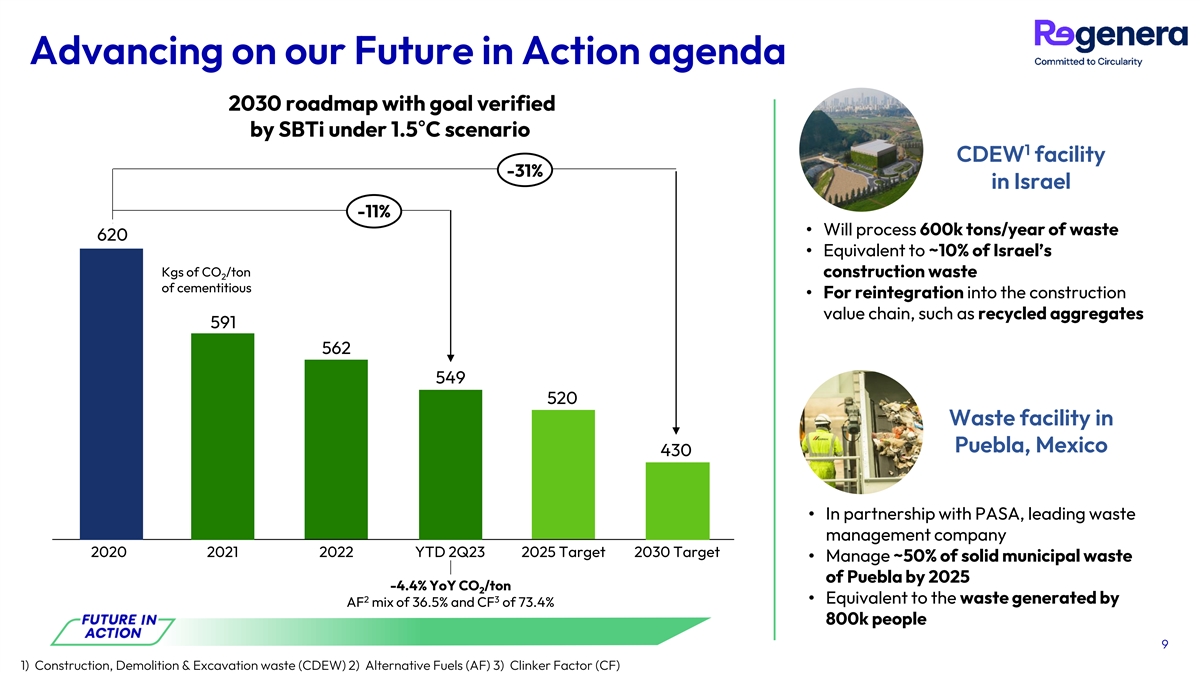
Advancing on our Future in Action agenda 2030 roadmap with goal verified by
SBTi under 1.5°C scenario 1 CDEW facility -31% in Israel -11% • Will process 600k tons/year of waste 620 • Equivalent to ~10% of Israel’s Kgs of CO /ton construction waste 2 of cementitious • For reintegration into the
construction value chain, such as recycled aggregates 591 562 549 520 Waste facility in Puebla, Mexico 430 • In partnership with PASA, leading waste 0 0 0 0 0 management company 2020 2021 2022 YTD 2Q23 2025 Target 2030 Target • Manage
~50% of solid municipal waste of Puebla by 2025 -4.4% YoY CO /ton 2 2 3 • Equivalent to the waste generated by AF mix of 36.5% and CF of 73.4% 800k people 9 1) Construction, Demolition & Excavation waste (CDEW) 2) Alternative Fuels (AF) 3)
Clinker Factor (CF)

Regional Highlights 411 Tower, Monterrey, Mexico

Mexico: First cement volume increase after 2 years YTD 2Q23 2Q23 Net Sales
1,298 2,395 % var (l-t-l) 14% 13% Operating EBITDA 399 744 % var (l-t-l) 9% 9% Operating EBITDA margin 30.8% 31.1% pp var (1.3pp) (1.2pp) • Low single digit growth in cement volumes driven by formal construction, with market share recovery in
bagged cement • Mid single to double-digit volume growth for ready-mix and aggregates, respectively, propelled by the industrial, infrastructure, and tourism sectors • Pricing strategy continues to make inroads in recovering last two
years of significant cost inflation • EBITDA margin impacted by product mix, higher electricity, labor and freight costs • Record alternative fuels substitution rate of 44% with four plants above 50% level Foro Boca, Veracruz, Mexico
Built with Duramax, part of our Vertua family of sustainable products 11 Millions of U.S. dollars

US: Hitting record operational results YTD 2Q23 2Q23 Net Sales 1,420 2,675
% var (l-t-l) 10% 7% Operating EBITDA 303 533 % var (l-t-l) 87% 47% Operating EBITDA margin 21.3% 19.9% pp var 8.8pp 5.4pp • Record quarterly top line and EBITDA growth driven by pricing strategy and decelerating input cost inflation th
• 4 consecutive quarter with sequential EBITDA margin improvement • Increased manufacturing and infrastructure construction supported by the Bipartisan Infrastructure Bill, the Inflation Reduction Act and the CHIPS Act •
Residential continues to stabilize as tight inventory in existing home market supports demand for new homes The Residences at 400 Central Project, Miami, United States 12 Millions of U.S. dollars

th EMEA: 7 consecutive quarter with EBITDA growth YTD 2Q23 2Q23 Net Sales
1,354 2,588 % var (l-t-l) 6% 9% Operating EBITDA 212 360 % var (l-t-l) 11% 13% Operating EBITDA margin 15.7% 13.9% pp var 0.8pp 0.3pp • Mid single digit top line growth despite challenging demand backdrop, mainly driven by disciplined pricing
• EBITDA growth supported by pricing and contribution from growth investments • EBITDA margin expansion after four consecutive quarters of YoY declines th • 12 consecutive quarterly YoY EBITDA growth in Europe • European
operations well positioned to match the EU 55% CO 2 reduction goal by 2030 • Volumes in the Philippines impacted by continued macro Pelješac Bridge, Pelješac, Croatia challenges, as well as a tough comparison base Built with Vertua
Concrete, part of our Vertua family of sustainable products 13 Millions of U.S. dollars

SCAC: Double digit growth in Sales and EBITDA YTD 2Q23 2Q23 Net Sales 447
858 % var (l-t-l) 10% 7% Operating EBITDA 112 196 % var (l-t-l) 15% (4%) Operating EBITDA margin 25.1% 22.9% pp var 1.4pp (2.0pp) • Double-digit growth in sales and EBITDA reflecting strong pricing and decelerating energy costs • Formal
sector demand driven primarily by infrastructure, offsetting bagged cement weakness • Second quarter marks a positive inflection point in margins as energy costs ease • In Colombia and the Dominican Republic, weak residential activity
partially offset by strong infrastructure and tourism activity • In Panama, pickup in infrastructure sector related to expansion Salvio Apartments, Bogotá, Colombia of metro, bridge over the Canal, and highway expansions 14 Millions of
U.S. dollars

Financial Developments Crédit Agricole Building, Nimes, France Built
with Vertua Concrete, part of our Vertua family of sustainable products

Improving FCF due to strong EBITDA growth and lower working capital,
partially offset by higher taxes January - June Second Quarter Average working capital days 2023 2022 % var 2023 2022 % var 2Q23 2Q22 Operating EBITDA 1,694 1,401 21% 961 716 34% 0 - Net Financial Expense 289 258 145 131 - Maintenance Capex 389 386
233 205 - Change in Working Capital 546 660 92 172 - Taxes Paid 291 113 207 64 -5 - Other Cash Items (net) (43) (4) 8 (21) Controlling Interest Net Income - Free Cash Flow - 8 - 11 US$ M Discontinued Operations Free Cash Flow after 223 (20) N/A 278
154 80% 272 Maintenance Capex 265 - Strategic Capex 169 174 83 98 Free Cash Flow 54 (194) N/A 195 56 246% 2Q23 2Q22 16 Millions of U.S. dollars

Continued leverage reduction, with eyes on investment grade 1 Consolidated
Leverage Ratio evolution • Operating performance driven by pricing strategy, growth strategy and Urbanization 4.17x 4.13x Solutions • Last 12 months EBITDA of ~$3.0 B, highest since 2009 2.84x 2.73x 2.62x • Second half of the year
is generally the 2.45x strongest in FCF generation • Leverage ratio expected to trend lower in 2H23 2019 2020 2021 2022 1Q23 2Q23 17 1) Calculated in accordance with our contractual obligations under our main bank debt agreements

2023 Outlook Gilbert Chabroux School, Lyon France Built with Insularis,
part of our Vertua family of sustainable products

2023 guidance 1 Operating EBITDA ~$3.25 billion Energy cost/ton of cement
produced ~10% increase ~$1.25 billion total Capital expenditures ~$850 million Maintenance, ~$400 million Strategic Investment in working capital ~$250 million Cash taxes ~$400 million 2 Cost of debt Increase of ~$100 million 1) Like-to-like for
ongoing operations and assuming June 30, 2023 FX levels for the remaining of the year 19 2) Including subordinated notes with no fixed maturity and the effect of our EUR-USD cross-currency swap

Appendix Happy Residence for Seniors, Montpellier, France Built with
Insularis, part of our Vertua family of sustainable products

Debt maturity profile as of June 30, 2023 Total debt as of June 30, 2023:
$7,665 million Main bank debt agreements Other bank debt Average life of debt: Fixed Income 5.0 years Leases 2,047 1,641 1,380 798 745 636 192 152 74 2023 2024 2025 2026 2027 2028 2029 2030≥ 2031 21 Millions of U.S. dollars
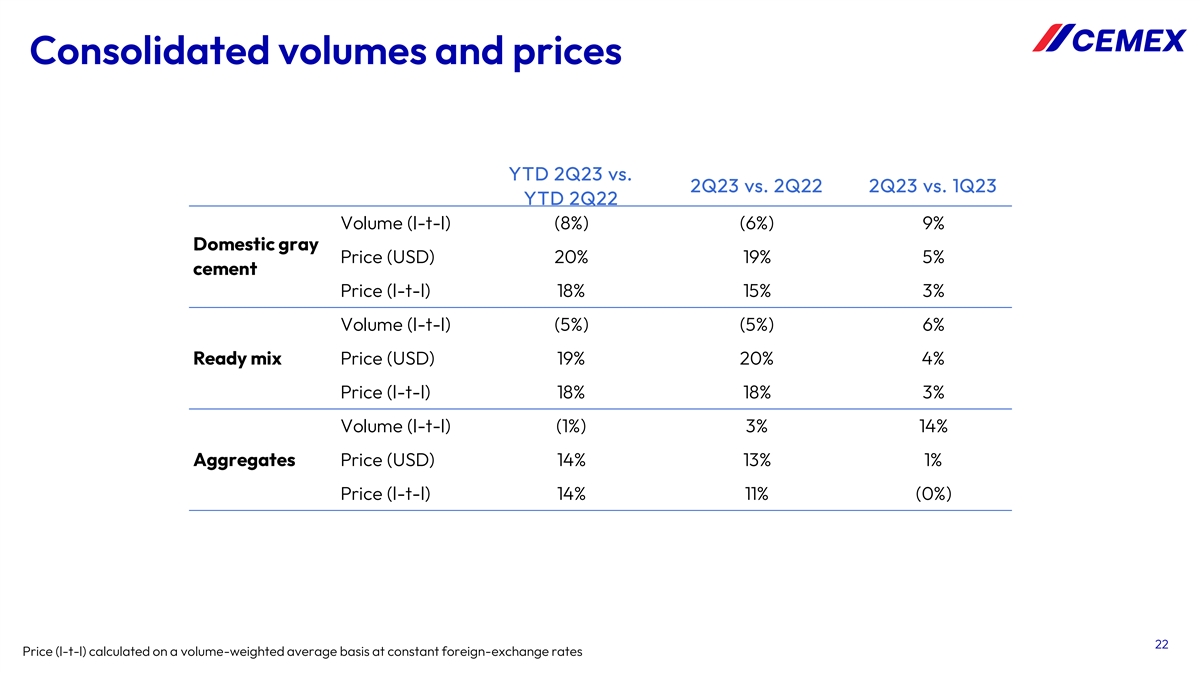
Consolidated volumes and prices YTD 2Q23 vs. 2Q23 vs. 2Q22 2Q23 vs. 1Q23
YTD 2Q22 Volume (l-t-l) (8%) (6%) 9% Domestic gray Price (USD) 20% 19% 5% cement Price (l-t-l) 18% 15% 3% Volume (l-t-l) (5%) (5%) 6% Ready mix Price (USD) 19% 20% 4% Price (l-t-l) 18% 18% 3% Volume (l-t-l) (1%) 3% 14% Aggregates Price (USD) 14% 13%
1% Price (l-t-l) 14% 11% (0%) 22 Price (l-t-l) calculated on a volume-weighted average basis at constant foreign-exchange rates

Additional information on debt MXN 5% Other 6% Second Quarter First
Quarter Euro 2023 2022 % var 2023 15% Currency 1 7,665 8,729 (12%) 7,862 Total debt denomination Short-term 4% 5% 4% U.S. dollar Long-term 96% 95% 96% 74% Cash and cash equivalents 471 490 (4%) 758 Net debt 7,194 8,239 (13%) 7,104 2 7,281 8,123
(10%) 7,157 Consolidated net debt 2 2.45 2.88 2.62 Consolidated leverage ratio Variable 2 6.90 6.74 6.38 Consolidated coverage ratio 3 36% Interest rate Fixed 64% Millions of U.S. dollars 1) Includes leases, in accordance with International
Financial Reporting Standard (IFRS) 2) Calculated in accordance with our contractual obligations under our main bank debt agreements 23 3) Includes the effect of our interest rate derivatives, as applicable

Additional information on debt Total debt by instrument Second Quarter
First Quarter 2023 % of total 2023 % of total Fixed Income 3,151 41% 4,080 52% Main Bank Debt Agreements 3,026 39% 2,307 29% 41% 39% Leases 1,201 16% 1,186 15% Other 288 4% 289 4% Total Debt 7,665 7,862 16% 4% 24 Millions of U.S. dollars

2Q23 volume and price summary: selected countries and regions Domestic
gray cement Ready mix Aggregates 2Q23 vs. 2Q22 2Q23 vs. 2Q22 2Q23 vs. 2Q22 Volume Price (USD) Price (LC) Volume Price (USD) Price (LC) Volume Price (USD) Price (LC) Mexico 1% 28% 12% 6% 45% 27% 11% 36% 19% U.S. (8%) 15% 15% (10%) 21% 21% 5% 11% 11%
Europe (12%) 32% 28% (10%) 19% 16% (2%) 12% 10% Israel N/A N/A N/A (0%) (1%) 8% (0%) (2%) 7% Philippines (17%) (6%) (2%) N/A N/A N/A N/A N/A N/A Colombia (1%) 5% 15% (2%) 13% 25% 2% 13% 24% Panama 8% 4% 4% 52% 5% 5% 39% (0%) (0%) Dominican Republic
(9%) 9% 9% (2%) 23% 23% N/A N/A N/A 25 Price (LC) for Europe calculated on a volume-weighted-average basis at constant foreign-exchange rates
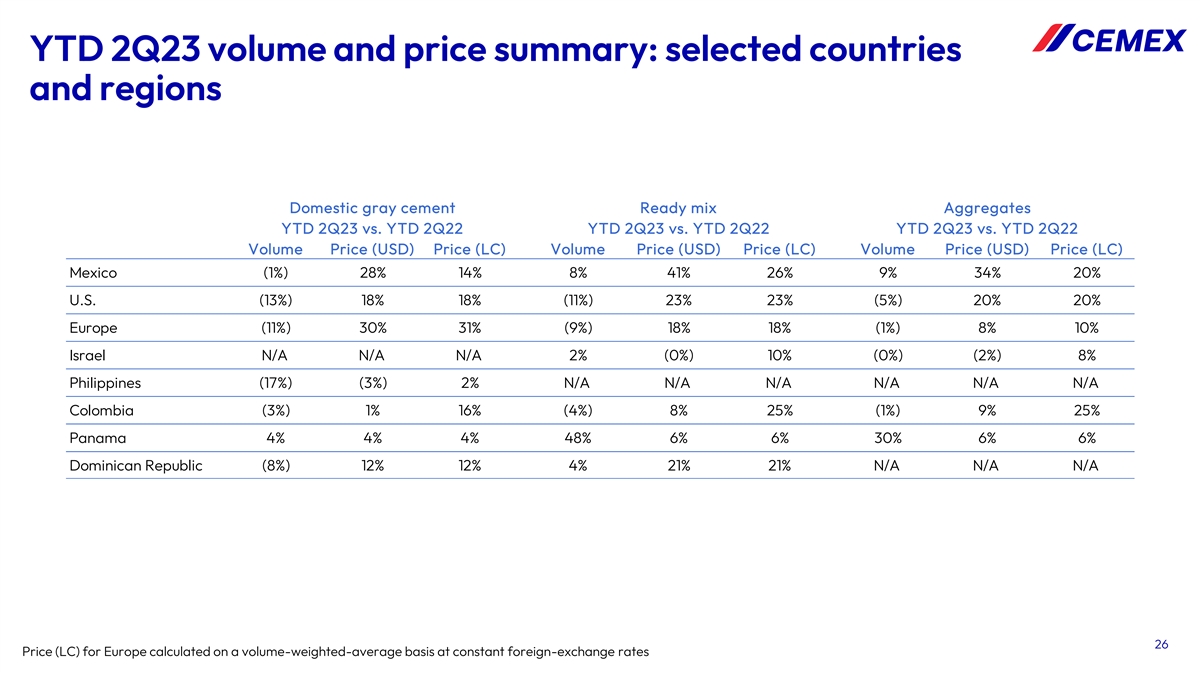
YTD 2Q23 volume and price summary: selected countries and regions Domestic
gray cement Ready mix Aggregates YTD 2Q23 vs. YTD 2Q22 YTD 2Q23 vs. YTD 2Q22 YTD 2Q23 vs. YTD 2Q22 Volume Price (USD) Price (LC) Volume Price (USD) Price (LC) Volume Price (USD) Price (LC) Mexico (1%) 28% 14% 8% 41% 26% 9% 34% 20% U.S. (13%) 18% 18%
(11%) 23% 23% (5%) 20% 20% Europe (11%) 30% 31% (9%) 18% 18% (1%) 8% 10% Israel N/A N/A N/A 2% (0%) 10% (0%) (2%) 8% Philippines (17%) (3%) 2% N/A N/A N/A N/A N/A N/A Colombia (3%) 1% 16% (4%) 8% 25% (1%) 9% 25% Panama 4% 4% 4% 48% 6% 6% 30% 6% 6%
Dominican Republic (8%) 12% 12% 4% 21% 21% N/A N/A N/A 26 Price (LC) for Europe calculated on a volume-weighted-average basis at constant foreign-exchange rates

1 2023 expected volume outlook : selected countries/regions Cement
Ready-mix Aggregates Mid single digit decline Low to mid single digit decline Flat CEMEX Low single digit increase High single digit increase High single digit increase Mexico High-single digit decline High-single digit decline Low single digit
decline USA Mid to high single digit decline Mid-single digit decline Flat to low single digit decline Europe Low single digit decline Mid-single digit increase NA Colombia Flat to low single digit increase≥20% increase NA Panama Dominican
Republic Low single digit decline Low double-digit increase NA Israel NA Low single digit increase Flat Philippines Mid to high single digit decline NA NA 27 1) Reflects CEMEX’s current expectations. Volumes on a like-to-like basis

Relevant ESG indicators YTD YTD Customers and suppliers 2Q23 2Q22 2022
Carbon strategy 2022 2Q23 2Q22 Kg of CO per ton of Net Promoter Score (NPS) 68 66 66 2 549 574 562 cementitious % of sales using CX Go 65% 57% 59% 36.5% 33.2% 35.0% Alternative fuels (%) 73.4% 74.5% 73.7% Clinker factor YTD YTD YTD YTD Low-carbon
products 2022 Health and safety 2022 2Q23 2Q22 2Q23 2Q22 Blended cement as % of total 2 1 3 Employee fatalities 82% 81% 75% cement produced Employee L-T-I frequency 0.5 0.5 0.5 rate Vertua concrete as % of total 45% 31% 33% Operations with zero
fatalities 98% 98% 96% and injuries (%) Vertua cement as % of total 55% 40% 41% 28

Definitions SCAC South, Central America and the Caribbean EMEA Europe,
Middle East, Africa and Asia When providing cement volume variations, refers to domestic gray cement operations (starting in 2Q10, the base for reported Cement cement volumes changed from total domestic cement including clinker to domestic gray
cement) LC Local currency l-t-l (like to like) On a like-to-like basis adjusting for currency fluctuations and for investments/divestments when applicable Investments incurred for the purpose of ensuring the company’s operational continuity.
These include capital expenditures on Maintenance capital projects required to replace obsolete assets or maintain current operational levels, and mandatory capital expenditures, which expenditures are projects required to comply with governmental
regulations or company policies Operating EBITDA Operating earnings before other expenses, net plus depreciation and operating amortization IFRS International Financial Reporting Standards, as issued by the International Accounting Standards Board
Pp Percentage points Prices All references to pricing initiatives, price increases or decreases, refer to our prices for our products Investments incurred with the purpose of increasing the company’s profitability. These include capital
expenditures on projects Strategic capital expenditures designed to increase profitability by expanding capacity, and margin improvement capital expenditures, which are projects designed to increase profitability by reducing costs U.S. dollars
USD/U.S. dollars Percentage variation % var 29

Contact Information Investors Relations Stock Information In the United
States: NYSE (ADS): +1 877 7CX NYSE CX In Mexico: Mexican Stock Exchange +52 81 8888 4292 (CPO): CEMEX.CPO ir@cemex.com Ratio of CPO to ADS: 10 to 1
Cemex SaB De Cv (NYSE:CX)
Historical Stock Chart
From Mar 2024 to Apr 2024

Cemex SaB De Cv (NYSE:CX)
Historical Stock Chart
From Apr 2023 to Apr 2024
