0001464790
false
0001464790
2023-07-25
2023-07-25
0001464790
RILY:CommonStockParValue0.0001PerShareMember
2023-07-25
2023-07-25
0001464790
RILY:DepositarySharesEachRepresenting11000Member
2023-07-25
2023-07-25
0001464790
RILY:DepositaryShareseachrepresentinga11000thinterestina7375SeriesBCumulativePerpetualPreferredShareparvalue00001pershareMember
2023-07-25
2023-07-25
0001464790
RILY:Sec6.50SeniorNotesDue2026Member
2023-07-25
2023-07-25
0001464790
RILY:Sec6.375SeniorNotesDue2025Member
2023-07-25
2023-07-25
0001464790
RILY:Sec6.75SeniorNotesDue2024Member
2023-07-25
2023-07-25
0001464790
RILY:Sec6.00SeniorNotesDue2028Member
2023-07-25
2023-07-25
0001464790
RILY:Sec5.50SeniorNotesDue2026Member
2023-07-25
2023-07-25
0001464790
RILY:Sec5.25SeniorNotesDue2028Member
2023-07-25
2023-07-25
0001464790
RILY:Sec5.00SeniorNotesDue2026Member
2023-07-25
2023-07-25
iso4217:USD
xbrli:shares
iso4217:USD
xbrli:shares
UNITED STATES
SECURITIES AND EXCHANGE COMMISSION
Washington, D.C. 20549
FORM 8-K
CURRENT REPORT
Pursuant to Section 13 OR 15(d) of The Securities
Exchange Act of 1934
Date of Report (Date of earliest event reported):
July 25, 2023
B. RILEY FINANCIAL, INC.
(Exact name of registrant as specified in its charter)
| Delaware |
|
001-37503 |
|
27-0223495 |
(State or other jurisdiction
of incorporation) |
|
(Commission File Number) |
|
(IRS Employer
Identification No.) |
11100 Santa Monica Boulevard, Suite 800
Los Angeles, California 90025
310-966-1444
(Address, Including Zip Code, and Telephone Number,
Including Area Code, of Registrant’s Principal Executive Offices)
Securities registered pursuant to Section
12(b) of the Act:
| Title of each class |
|
Trading Symbol(s) |
|
Name of each exchange on which registered |
| Common Stock, par value $0.0001 per share |
|
RILY |
|
Nasdaq Global Market |
| Depositary
Shares (each representing a 1/1000th interest in a 6.875% Series A Cumulative Perpetual Preferred Share, par value $0.0001 per share) |
|
RILYP |
|
Nasdaq Global Market |
| Depositary
Shares (each representing a 1/1000th interest in a 7.375% Series B Cumulative Perpetual Preferred Share, par value $0.0001 per share) |
|
RILYL |
|
Nasdaq Global Market |
| 6.50% Senior Notes due 2026 |
|
RILYN |
|
Nasdaq Global Market |
| 6.375% Senior Notes due 2025 |
|
RILYM |
|
Nasdaq Global Market |
| 6.75% Senior Notes due 2024 |
|
RILYO |
|
Nasdaq Global Market |
| 6.00% Senior Notes due 2028 |
|
RILYT |
|
Nasdaq Global Market |
| 5.50% Senior Notes due 2026 |
|
RILYK |
|
Nasdaq Global Market |
| 5.25% Senior Notes due 2028 |
|
RILYZ |
|
Nasdaq Global Market |
| 5.00% Senior Notes due 2026 |
|
RILYG |
|
Nasdaq Global Market |
Not Applicable
(Former name or former address, if changed since
last report)
Check the appropriate box below if the Form 8-K
filing is intended to simultaneously satisfy the filing obligation of the registrant under any of the following provisions:
| ☐ | Written
communications pursuant to Rule 425 under the Securities Act (17 CFR 230.425) |
| ☐ | Soliciting
material pursuant to Rule 14a-12 under the Exchange Act (17 CFR 240.14a-12) |
| ☐ | Pre-commencement
communications pursuant to Rule 14d-2(b) under the Exchange Act (17 CFR 240.14d-2(b)) |
| ☐ | Pre-commencement
communications pursuant to Rule 13e-4(c) under the Exchange Act (17 CFR 240.13e-4(c)) |
Indicate by check mark whether the registrant
is an emerging growth company as defined in Rule 405 of the Securities Act of 1933 (§230.405 of this chapter) or Rule 12b-2
of the Securities Exchange Act of 1934 (§240.12b-2 of this chapter).
Emerging growth company ☐
If an emerging growth company, indicate by check
mark if the registrant has elected not to use the extended transition period for complying with any new or revised financial accounting
standards provided pursuant to Section 13(a) of the Exchange Act. ☐
Item 2.02 Results of Operations and Financial Condition.
On July 25, 2023, B. Riley
Financial, Inc. (the “Company”) announced preliminary, unaudited estimates of results for the three months and six
months ended June 30, 2023 based on currently available information (“Preliminary Estimates”). These Preliminary Estimates
are being announced in connection with an offering of the Company’s common stock (the “Offering”). In connection
with the Offering, the Company filed a preliminary prospectus supplement (the “Preliminary Prospectus Supplement”)
with the Securities and Exchange Commission (“SEC”) and issued a press release announcing the launch of the Offering.
The Preliminary Prospectus Supplement contains the Preliminary Estimates. A copy of the press release is attached hereto as Exhibit 99.1.
The Preliminary Estimates are not a comprehensive
statement of our financial results for the three months and six months ended June 30, 2023. We caution that our final results for the
three months and six months ended June 30, 2023 that we will file with the SEC could vary significantly from these Preliminary Estimates
as a result of the completion of our customary quarter-end closing, review and audit procedures and other developments arising between
now and the time that our financial results for the three months and six months ended June 30, 2023 are finalized.
Revenue for the three months and six months ended June 30, 2023 is estimated to be within the range of $405 million and $407 million and $837.1 million and $839.1 million, respectively.
For the three months ended June 30, 2023, we estimate that the net income attributable to the Company will be within the range of $44.6 million and $46.6 million compared to a net loss of $140.2 million for the three months ended June 30, 2022. Diluted income per common share is expected to be within the range of $1.48 to $1.55 per diluted share. This compares to a net loss of $5.07 per diluted share for the three months ended June 30, 2022. For the six months ended June 30, 2023, we estimate that the net income attributable to the Company shall be within the range of $61.8 million and $63.8 million compared to a net loss of $150.2 million for the six months ended June 30, 2022. Diluted income per common share is expected to be within the range of $1.98 to $2.05 per diluted share. This compares to a net loss of $5.52 per diluted share for the six months ended June 30, 2022.
For the three months ended June 30, 2023, we estimate
that our adjusted EBITDA will be within the range of $138 million and $140 million compared to a total adjusted EBITDA loss of $135.8
million for the three months ended June 30, 2022. For the six months ended June 30, 2023, we estimate that our adjusted EBITDA will be
within the range of $232.8 million and $234.8 million compared to a total adjusted EBITDA loss of $95.1 million for the six months ended
June 30, 2022. Operating adjusted EBITDA for the three months ended June 30, 2023 is estimated to be within the range of $78.5 million
and $80.5 million compared to $74.2 million for the three months ended June 30, 2022. Operating adjusted EBITDA for the six months ended
June 30, 2023 is estimated to be within the range of $158.6 million and $160.6 million compared to $158.4 million for the six months ended
June 30, 2022. As of June 30, 2023, the Company estimates their cash and investments balance to be approximately $1.9 billion and their
total debt outstanding to be $2.3 billion. As of June 30, 2023, the Company estimates their total debt, net of cash and investments, to
be approximately $406 million. The Company expects its operating adjusted EBITDA for the three month period ending September 30, 2023
will be at least $105 million.
Certain of the information set forth herein, including
operating revenues, adjusted EBITDA, operating adjusted EBITDA and total debt, net of cash and investments may be considered non-GAAP
financial measures. We believe this information is useful to investors because it provides a basis for measuring our available capital
resources, the operating performance of our business and our revenues and our cash flow, (i) excluding in the case of operating revenues,
trading income (losses) and fair value adjustments on loans, (ii) excluding in the case of adjusted EBITDA, net interest expense, provisions
for or benefit from income taxes, depreciation, amortization, restructuring charge, gain on extinguishment of loans, impairment of trade
names, stock-based compensation and transaction related and other expenses, (iii) excluding in the case of operating adjusted EBITDA,
the aforementioned adjustments for adjusted EBITDA as well as trading income (losses) and fair value adjustments on loans, realized and
unrealized gains (losses) on investments and fair value adjustments and other investment related expenses and (iv) including in the case
of total cash and investments, cash and cash equivalents, restricted cash, due from clearing brokers net of due to clearing brokers, securities
and other investments owned, at fair value net of (a) securities sold not yet purchased and (b) noncontrolling interest related to investments,
advances against customer contracts, loans receivable, at fair value net of loan participations sold, and other investments reported in
prepaid and other assets, that would normally be included in the most directly comparable measures calculated and presented in accordance
with Generally Accepted Accounting Principles (“GAAP”). In addition, our management uses these non-GAAP financial measures
along with the most directly comparable GAAP financial measures in evaluating the Company's operating performance, management compensation,
capital resources, and cash flow. Non-GAAP financial measures should not be considered in isolation from, or as a substitute for, financial
information presented in compliance with GAAP, and non-financial measures as reported by the Company may not be comparable to similarly
titled amounts reported by other companies. The following is a reconciliation of Net Income estimates to Adjusted EBITDA and Operating
Adjusted EBITDA to the corresponding GAAP measure (in thousands), as well as a reconciliation of diluted income per common share.
The Company has not provided guidance for a comparable
GAAP measure or a quantitative reconciliation of its forecast for Operating Adjusted EBITDA in the third quarter of 2023 to the most directly
comparable GAAP measure because it is unable to determine with reasonable certainty the ultimate outcome of certain significant items
necessary to calculate such measure without unreasonable effort. These items include, but are not limited to, final calculation of investment
gains (losses), defined as trading income (losses) and fair value adjustments on loans. Notwithstanding this limitation, as noted above,
the Company estimates Operating Adjusted EBITDA of at least $105 million in the third quarter of 2023. These items are uncertain, depend
on various factors, and could have a material impact on the GAAP reported results for the period
Reconciliation of Net Income Preliminary Estimate
to Adjusted EBITDA Preliminary Estimate
(Unaudited)
(Dollars in thousands)
| |
|
Preliminary Estimate |
|
|
Prior Period |
|
| |
|
Three Months
Ended
June 30,
2023 |
|
|
Three Months
Ended
June 30,
2022 |
|
| |
|
Low |
|
|
High |
|
|
Actual |
|
| Net income (loss) attributable to B. Riley Financial, Inc. |
|
$ |
44,600 |
|
|
$ |
46,600 |
|
|
$ |
(140,159 |
) |
| Adjustments: |
|
|
|
|
|
|
|
|
|
|
|
|
| Provision for (benefit from) income taxes |
|
|
21,500 |
|
|
|
21,500 |
|
|
|
(52,513 |
) |
| Interest expense |
|
|
47,300 |
|
|
|
47,300 |
|
|
|
31,764 |
|
| Interest income |
|
|
(700 |
) |
|
|
(700 |
) |
|
|
(500 |
) |
| Share based payments |
|
|
10,500 |
|
|
|
10,500 |
|
|
|
14,202 |
|
| Depreciation and amortization |
|
|
12,500 |
|
|
|
12,500 |
|
|
|
7,961 |
|
| Restructuring charge |
|
|
600 |
|
|
|
600 |
|
|
|
— |
|
| Impairment of tradenames |
|
|
1,700 |
|
|
|
1,700 |
|
|
|
— |
|
| Transactions related costs and other |
|
|
— |
|
|
|
— |
|
|
|
3,468 |
|
| |
|
|
|
|
|
|
|
|
|
|
|
|
| Total EBITDA adjustments |
|
|
93,400 |
|
|
|
93,400 |
|
|
|
4,382 |
|
| |
|
|
|
|
|
|
|
|
|
|
|
|
| Adjusted EBITDA |
|
$ |
138,000 |
|
|
$ |
140,000 |
|
|
$ |
(135,777 |
) |
| |
|
|
|
|
|
|
|
|
|
|
|
|
| Operating EBITDA Adjustments: |
|
|
|
|
|
|
|
|
|
|
|
|
| Trading (income) losses and fair value adjustments on loans |
|
|
(42,000 |
) |
|
|
(42,000 |
) |
|
|
117,763 |
|
| Realized and unrealized (gains) losses on investments and fair value adjustments |
|
|
(19,000 |
) |
|
|
(19,000 |
) |
|
|
106,164 |
|
| Other investment related expenses |
|
|
1,500 |
|
|
|
1,500 |
|
|
|
(13,930 |
) |
| |
|
|
|
|
|
|
|
|
|
|
|
|
| Total Operating EBITDA Adjustments |
|
|
(59,500 |
) |
|
|
(59,500 |
) |
|
|
209,997 |
|
| |
|
|
|
|
|
|
|
|
|
|
|
|
| Operating Adjusted EBITDA |
|
$ |
78,500 |
|
|
$ |
80,500 |
|
|
$ |
74,220 |
|
Diluted Income per Common Share — Preliminary
Estimate
(Unaudited)
(Dollars in thousands, except share data)
| | |
Preliminary Estimate | | |
Prior Period | |
| | |
Three Months
Ended
June 30,
2023 | | |
Three Months
Ended
June 30,
2022 | |
| | |
Low | | |
High | | |
Actual | |
| Net income (loss) attributable to B. Riley Financial, Inc. | |
$ | 44,600 | | |
$ | 46,600 | | |
$ | (140,159 | ) |
| Preferred stock dividends | |
| 2,000 | | |
| 2,000 | | |
| 2,002 | |
| Net income (loss) available to common shareholders | |
$ | 42,600 | | |
$ | 44,600 | | |
$ | (142,161 | ) |
| | |
| | | |
| | | |
| | |
| Diluted income (loss) per common share | |
$ | 1.48 | | |
$ | 1.55 | | |
$ | (5.07 | ) |
| Weighted average diluted common shares outstanding | |
| 28,700,000 | | |
| 28,700,000 | | |
| 28,051,570 | |
Reconciliation of Net Income Preliminary Estimate
to Adjusted EBITDA Preliminary Estimate
(Unaudited)
(Dollars in thousands)
| |
|
Preliminary Estimate |
|
|
Prior Period |
|
| |
|
Six Months
Ended
June 30,
2023 |
|
|
Six Months
Ended
June 30,
2022 |
|
| |
|
Low |
|
|
High |
|
|
Actual |
|
| Net income (loss) attributable to B. Riley Financial, Inc. |
|
$ |
61,755 |
|
|
$ |
63,755 |
|
|
$ |
(150,221 |
) |
| Adjustments: |
|
|
|
|
|
|
|
|
|
|
|
|
| Provision for (benefit from) income taxes |
|
|
29,419 |
|
|
|
29,419 |
|
|
|
(56,208 |
) |
| Interest expense |
|
|
94,861 |
|
|
|
94,861 |
|
|
|
62,200 |
|
| Interest income |
|
|
(3,274 |
) |
|
|
(3,274 |
) |
|
|
(567 |
) |
| Share based payments |
|
|
24,246 |
|
|
|
24,246 |
|
|
|
31,215 |
|
| Depreciation and amortization |
|
|
25,577 |
|
|
|
25,577 |
|
|
|
15,809 |
|
| Restructuring charge |
|
|
693 |
|
|
|
693 |
|
|
|
— |
|
| Gain on extinguishment of loans |
|
|
— |
|
|
|
— |
|
|
|
(1,102 |
) |
| Impairment of tradenames |
|
|
1,700 |
|
|
|
1,700 |
|
|
|
— |
|
| Transactions related costs and other |
|
|
(2,146 |
) |
|
|
(2,146 |
) |
|
|
3,759 |
|
| |
|
|
|
|
|
|
|
|
|
|
|
|
| Total EBITDA adjustments |
|
|
171,076 |
|
|
|
171,076 |
|
|
|
55,106 |
|
| |
|
|
|
|
|
|
|
|
|
|
|
|
| Adjusted EBITDA |
|
$ |
232,831 |
|
|
$ |
234,831 |
|
|
$ |
(95,115 |
) |
| |
|
|
|
|
|
|
|
|
|
|
|
|
| Operating EBITDA Adjustments: |
|
|
|
|
|
|
|
|
|
|
|
|
| Trading (income) losses and fair value adjustments on loans |
|
|
(93,568 |
) |
|
|
(93,568 |
) |
|
|
137,041 |
|
| Realized and unrealized (gains) losses on investments and fair value adjustments |
|
|
9,442 |
|
|
|
9,442 |
|
|
|
155,276 |
|
| Other investment related expenses |
|
|
9,921 |
|
|
|
9,921 |
|
|
|
(38,795 |
) |
| |
|
|
|
|
|
|
|
|
|
|
|
|
| Total Operating EBITDA Adjustments |
|
|
(74,205 |
) |
|
|
(74,205 |
) |
|
|
253,522 |
|
| |
|
|
|
|
|
|
|
|
|
|
|
|
| Operating Adjusted EBITDA |
|
$ |
158,626 |
|
|
$ |
160,626 |
|
|
$ |
158,407 |
|
Diluted Income per Common
Share — Preliminary Estimate
(Unaudited)
(Dollars in thousands, except share data)
| | |
Preliminary Estimate | | |
Prior Period | |
| | |
Six Months
Ended
June 30,
2023 | | |
Six Months
Ended
June 30,
2022 | |
| | |
Low | | |
High | | |
Actual | |
| Net income (loss) attributable to B. Riley Financial, Inc. | |
$ | 61,755 | | |
$ | 63,755 | | |
$ | (150,221 | ) |
| Preferred stock dividends | |
| 4,012 | | |
| 4,012 | | |
| 4,004 | |
| Net income (loss) available to common shareholders | |
$ | 57,743 | | |
$ | 59,743 | | |
$ | (154,225 | ) |
| | |
| | | |
| | | |
| | |
| Diluted income (loss) per common share | |
$ | 1.98 | | |
$ | 2.05 | | |
$ | (5.52 | ) |
| Weighted average diluted common shares outstanding | |
| 29,100,000 | | |
| 29,100,000 | | |
| 27,953,845 | |
On July 25, 2023, the Company declared a regular
quarterly cash dividend of $1.00 per share of common stock payable on or about August 21, 2023 to common stockholders of record as of
August 11, 2023.
The information disclosed under this Item 2.02, including Exhibit 99.1
hereto, is being furnished and shall not be deemed “filed” for purposes of Section 18 of the Securities Exchange Act of 1934,
as amended (the “Exchange Act”) and shall not be deemed incorporated by reference into any filing made under the Securities
Act of 1933, as amended (the “Securities Act”), except as expressly set forth by specific reference in such filing.
Item 7.01 Regulation FD Disclosure.
On July 25, 2023, the Company issued a press release
announcing the commencement of its Offering. A copy of the press release is attached hereto as Exhibit 99.2.
In addition, the Company made available an updated
version of the Company’s corporate presentation on the Company’s website. A copy of the updated corporate presentation is
furnished as Exhibit 99.3 to this Current Report on Form 8-K (“Corporate Presentation”). The information contained
in the Corporate Presentation is summary information that should be considered in the context of the Company’s filings with the
SEC and other public announcements the Company may make by press release or otherwise from time to time.
The information set forth under this Item 7.01,
including Exhibit 99.2 and Exhibit 99.3 hereto, is not deemed “filed” for purposes of Section 18 of the Exchange Act, or incorporated
by reference in any filing under the Securities Act, except as may be expressly set forth by specific reference in such a filing.
Forward-Looking Statements
This Current Report on Form 8-K (and the exhibits
attached hereto) may contain “forward-looking” statements as defined by the Private Securities Litigation Reform Act of 1995
or by the SEC in its rules, regulations and releases. These statements include, but are not limited to, the Company’s anticipated
results of operations for the second quarter of 2023, the Company’s plans, objectives, expectations and intentions regarding the
performance of its business, the terms and conditions and timing of the common stock offering, the intended use of proceeds of the common
stock offering and other non-historical statements. These statements can be identified by the use of words such as “believes,”
“anticipates,” “expects,” “intends,” “plans,” “continues,” “estimates,”
“predicts,” “projects,” “forecasts,” and similar expressions. All forward looking statements are based
on management’s current expectations and beliefs only as of the date of this report and are subject to risks, uncertainties and
assumptions that could cause actual results to differ materially from those discussed in, or implied by, the forward-looking statements,
including the risks identified and discussed from time to time in the Company’s reports filed with the SEC, including the Company’s
most recent Annual Report on Form 10-K for the year ended December 31, 2022 and Quarterly Report on Form 10-Q for the quarter ended March
31, 2023. Readers are strongly encouraged to review carefully the full cautionary statements described in these reports. Except as required
by law, the Company undertakes no obligation to revise or update publicly any forward-looking statements to reflect events or circumstances
after the date of this report, or to reflect the occurrence of unanticipated events or circumstances.
Item 9.01 Financial Statements and Exhibits
(d) Exhibits
SIGNATURES
Pursuant to the requirements of the Securities
Exchange Act of 1934, the registrant has duly caused this report to be signed on its behalf by the undersigned hereunto duly authorized.
| July 25, 2023 |
B. RILEY FINANCIAL, INC. |
| |
|
| |
By: |
/s/ Phillip J. Ahn |
| |
|
Name: |
Phillip J. Ahn |
| |
|
Title: |
Chief Financial Officer and
Chief Operating Officer |
Exhibit 99.1

B. Riley Financial Announces Preliminary Second
Quarter 2023 Results
and Guidance for Third Quarter 2023; Declares $1.00 Dividend
LOS ANGELES, July 25, 2023 – B. Riley
Financial, Inc. (NASDAQ: RILY) (“B. Riley” or the “Company”), a diversified financial services platform, today
announced certain preliminary unaudited financial results for the three-month and six-month period ending June 30, 2023. The Company has
also provided guidance for operating adjusted EBITDA in the third quarter of 2023.
Preliminary Estimates for the Three Months
Ended June 30, 2023
| ● | Total
revenues estimated within the range of $405 million to $407 million |
| | |
| ● | Net
income attributable to the Company between $44.6 million to $46.6 million |
| | |
| ● | Diluted
earnings per common share in the range of $1.48 to $1.55 per diluted share |
| | |
| ● | Adjusted
EBITDA(1) expected in the range of $138 million to $140 million |
| | |
| ● | Operating
adjusted EBITDA(2) within the range of $78.5 million and $80.5 million |
Preliminary
Estimates for the Six Months Ended June 30, 2023
| ● | Total
revenues estimated within the range of $837.1 million and $839.1 million |
| | |
| ● | Net
income attributable to the Company between $61.8 million and $63.8 million |
| | |
| ● | Diluted
earnings per common share in the range of $1.98 to $2.05 per diluted share |
| | |
| ● | Adjusted
EBITDA(1) expected in the range of $232.8 million and $234.8 million |
| | |
| ● | Operating
adjusted EBITDA(2) within the range of $158.6 million and $160.6 million |
Q3 2023 Operating Adjusted EBITDA Guidance
| ● | Operating
adjusted EBITDA(2) of at least $105 million |
“B. Riley Financial is experiencing strong
momentum, and we believe our preliminary second quarter results and outlook demonstrate the ongoing successful execution of our platform
strategy,” said Bryant Riley, Chairman and Co-Chief Executive Officer of B. Riley Financial. “We are seeing positive
trends across our businesses. Capital markets and retail liquidation activity is steadily increasing as a function of market tailwinds
in our historically episodic segments. Demand for our consulting and appraisal services is at record levels, and our communications and
consumer segments continue to perform as a stable source of earnings and cash flow.”
“Investment banking during the month
of July has already exceeded our results for all of the second quarter. To the extent that this recent momentum continues, Operating
Adjusted EBITDA will meaningfully exceed our $105 million estimate,” said Riley. “We expect to have over $500 million of
immediate liquidity with current cash on hand, anticipated proceeds from our concurrently announced equity offering, and a new
upsized credit facility which we expect to finalize shortly. We plan to use this capital to go on offense in pursuit of
opportunities presented by this increased activity in our investment banking business, as well as other opportunities that we see
across our B. Riley platform.”
| | |
| www.brileyfin.com | NASDAQ: RILY | 1 |

Total cash and investments (3) is estimated
to be approximately $1.9 billion as of June 30, 2023. Total debt, net of cash and investments, is expected to be approximately $406 million
as of June 30, 2023.
Declaration of Common Dividend
The Company has declared a Second Quarter 2023
cash dividend of $1.00 per share which will be payable on or about August 21 to common stockholders of record as of August 11.
The preliminary results and guidance presented
herein reflect reasonable estimates based upon the information available to B. Riley Financial at this time. Actual results may differ
from these estimates. Further, these estimates should not be viewed as a substitute for complete financial statements prepared in accordance
with GAAP and they are not necessarily indicative of the results to be achieved in any future period. Preliminary results are subject
to completion of the Company’s customary quarter-end closing and review procedures and are not a comprehensive statement of its
financial results for the three months ended June 30, 2023.
B. Riley Financial plans to release its full second
quarter 2023 financial results in a press release on Wednesday, August 9, 2023 after market close, to be followed by a conference call
on the same day at 4:30 pm ET (1:30 pm PT). Conference call details will be announced prior to the call.
About B. Riley Financial
B. Riley Financial is a diversified financial
services platform that delivers tailored solutions to meet the strategic, operational, and capital needs of its clients and partners.
B. Riley leverages cross-platform expertise to provide clients with full service, collaborative solutions at every stage of the business
life cycle. Through its affiliated subsidiaries, B. Riley provides end-to-end financial services across investment banking, institutional
brokerage, private wealth and investment management, financial consulting, corporate restructuring, operations management, risk and compliance,
due diligence, forensic accounting, litigation support, appraisal and valuation, auction, and liquidation services. B. Riley opportunistically
invests to benefit its shareholders, and certain affiliates originate and underwrite senior secured loans for asset-rich companies. B.
Riley refers to B. Riley Financial, Inc. and/or one or more of its subsidiaries or affiliates. For more information, please visit www.brileyfin.com.
Forward-Looking Statements
Statements in this press release that are not
descriptions of historical facts are forward-looking statements that are based on management’s current expectations and assumptions and
are subject to risks and uncertainties. If such risks or uncertainties materialize or such assumptions prove incorrect, our business,
operating results, financial condition, and stock price could be materially negatively affected. You should not place undue reliance on
such forward-looking statements, which are based on the information currently available to us and speak only as of the date of this press
release. Such forward-looking statements include, but are not limited to, statements regarding our excitement and the expected growth
of our business segments. Factors that could cause such actual results to differ materially from those contemplated or implied by such
forward-looking statements include, without limitation, the risks described from time to time in B. Riley Financial, Inc.’s periodic filings
with the SEC, including, without limitation, the risks described in B. Riley Financial, Inc.’s 2022 Annual Report on Form 10-K under
the captions “Risk Factors” and “Management’s Discussion and Analysis of Financial Condition and Results of Operations”
(as applicable) and our Quarterly Report on Form 10-Q for the quarter ended March 31, 2023. These factors should be considered carefully,
and readers are cautioned not to place undue reliance on such forward-looking statements. All information is current as of the date this
press release is issued, and B. Riley Financial undertakes no duty to update this information.
| | |
| www.brileyfin.com | NASDAQ: RILY | 2 |
Note Regarding Use of Non-GAAP Financial Measures
Certain of the information set forth herein, including
operating revenues, adjusted EBITDA, operating adjusted EBITDA and total debt, net of cash and investments may be considered non-GAAP
financial measures. B. Riley Financial believes this information is useful to investors because it provides a basis for measuring the
Company’s available capital resources, the operating performance of its business and revenues and cash flow, (i) excluding in the
case of operating revenues, trading income (losses) and fair value adjustments on loans, (ii) excluding in the case of adjusted EBITDA,
net interest expense, provisions for or benefit from income taxes, depreciation, amortization, restructuring charge, gain on extinguishment
of loans, impairment of trade names, stock-based compensation and transaction related and other expenses, (iii) excluding in the case
of operating adjusted EBITDA, the aforementioned adjustments for adjusted EBITDA as well as trading income (losses) and fair value adjustments
on loans, realized and unrealized gains (losses) on investments and fair value adjustments and other investment related expenses and (iv)
including in the case of total cash and investments, cash and cash equivalents, restricted cash, due from clearing brokers net of due
to clearing brokers, securities and other investments owned, at fair value net of (a) securities sold not yet purchased and (b) noncontrolling
interest related to investments, advances against customer contracts, loans receivable, at fair value net of loan participations sold,
and other investments reported in prepaid and other assets, that would normally be included in the most directly comparable measures calculated
and presented in accordance with Generally Accepted Accounting Principles (“GAAP”). In addition, our management uses these
non-GAAP financial measures along with the most directly comparable GAAP financial measures in evaluating the Company’s operating performance,
management compensation, capital resources, and cash flow. Non-GAAP financial measures should not be considered in isolation from, or
as a substitute for, financial information presented in compliance with GAAP, and non-financial measures as reported by the Company may
not be comparable to similarly titled amounts reported by other companies.
The Company has not provided guidance for a comparable
GAAP measure or a quantitative reconciliation of its forecast for Operating Adjusted EBITDA in the third quarter of 2023 to the most directly
comparable GAAP measure because it is unable to determine with reasonable certainty the ultimate outcome of certain significant items
necessary to calculate such measure without unreasonable effort. These items include, but are not limited to, final calculation of investment
gains (losses), defined as trading income (losses) and fair value adjustments on loans. Notwithstanding this limitation, as noted above,
the Company estimates Operating Adjusted EBITDA(2) of at least $105 million in the third quarter of 2023. These items are uncertain,
depend on various factors, and could have a material impact on the GAAP reported results for the period.
Footnotes (See “Note Regarding Use
of Non-GAAP Financial Measures” for further discussion of these non-GAAP terms. For a reconciliation to the comparable GAAP financial
measures, please see the Appendix hereto.)
(1) Adjusted EBITDA includes earnings before interest,
taxes, depreciation, amortization, restructuring charge, share-based payments, gain on extinguishment of loans, impairment of tradenames,
and transaction related and other costs.
(2) Operating Adjusted EBITDA is defined as Adjusted
EBITDA excluding (i) Trading income (loss) and fair value adjustments on loans, (ii) Realized and unrealized gains (losses) on investments
and fair value adjustments, and (iii) Other investment related expenses.
(3) Total cash and investments is defined as the
sum of cash and cash equivalents, restricted cash, due from clearing brokers net of due to clearing brokers, securities and other investments
owned, at fair value net of (i) securities sold not yet purchased and (ii) noncontrolling interest related to investments, advances against
customer contracts, loans receivable, at fair value net of loan participations sold, and other investments reported in prepaid and other
assets.
| | |
| www.brileyfin.com | NASDAQ: RILY | 3 |
The following is a reconciliation of Net Income
estimates to Adjusted EBITDA and Operating Adjusted EBITDA to the corresponding GAAP measure (in thousands), as well as a reconciliation
of diluted income per common share:
B. RILEY FINANCIAL, INC.
Reconciliation of Net Income Preliminary Estimate
to Adjusted EBITDA Preliminary Estimate
(Unaudited)
(Dollars in thousands)
| | |
Preliminary Estimate | | |
Prior Period | |
| | |
Three Months
Ended
June 30,
2023 | | |
Three Months
Ended
June 30,
2022 | |
| | |
Low | | |
High | | |
Actual | |
| Net income (loss) attributable to B. Riley Financial, Inc. | |
$ | 44,600 | | |
$ | 46,600 | | |
$ | (140,159 | ) |
| Adjustments: | |
| | | |
| | | |
| | |
| Provision for (benefit from) income taxes | |
| 21,500 | | |
| 21,500 | | |
| (52,513 | ) |
| Interest expense | |
| 47,300 | | |
| 47,300 | | |
| 31,764 | |
| Interest income | |
| (700 | ) | |
| (700 | ) | |
| (500 | ) |
| Share based payments | |
| 10,500 | | |
| 10,500 | | |
| 14,202 | |
| Depreciation and amortization | |
| 12,500 | | |
| 12,500 | | |
| 7,961 | |
| Restructuring charge | |
| 600 | | |
| 600 | | |
| — | |
| Impairment of tradenames | |
| 1,700 | | |
| 1,700 | | |
| — | |
| Transactions related costs and other | |
| — | | |
| — | | |
| 3,468 | |
| | |
| | | |
| | | |
| | |
| Total EBITDA adjustments | |
| 93,400 | | |
| 93,400 | | |
| 4,382 | |
| | |
| | | |
| | | |
| | |
| Adjusted EBITDA | |
$ | 138,000 | | |
$ | 140,000 | | |
$ | (135,777 | ) |
| | |
| | | |
| | | |
| | |
| Operating EBITDA Adjustments: | |
| | | |
| | | |
| | |
| Trading (income) losses and fair value adjustments on loans | |
| (42,000 | ) | |
| (42,000 | ) | |
| 117,763 | |
| Realized and unrealized (gains) losses on investments and fair value adjustments | |
| (19,000 | ) | |
| (19,000 | ) | |
| 106,164 | |
| Other investment related expenses | |
| 1,500 | | |
| 1,500 | | |
| (13,930 | ) |
| | |
| | | |
| | | |
| | |
| Total Operating EBITDA Adjustments | |
| (59,500 | ) | |
| (59,500 | ) | |
| 209,997 | |
| | |
| | | |
| | | |
| | |
| Operating Adjusted EBITDA | |
$ | 78,500 | | |
$ | 80,500 | | |
$ | 74,220 | |
| | |
| www.brileyfin.com | NASDAQ: RILY | 4 |
B. RILEY FINANCIAL, INC.
Diluted Income per Common Share — Preliminary
Estimate
(Unaudited)
(Dollars in thousands, except share data)
| | |
Preliminary Estimate | | |
Prior Period | |
| | |
Three Months
Ended
June 30,
2023 | | |
Three Months
Ended
June 30,
2022 | |
| | |
Low | | |
High | | |
Actual | |
| Net income (loss) attributable to B. Riley Financial, Inc. | |
$ | 44,600 | | |
$ | 46,600 | | |
$ | (140,159 | ) |
| Preferred stock dividends | |
| 2,000 | | |
| 2,000 | | |
| 2,002 | |
| Net income (loss) available to common shareholders | |
$ | 42,600 | | |
$ | 44,600 | | |
$ | (142,161 | ) |
| | |
| | | |
| | | |
| | |
| Diluted income (loss) per common share | |
$ | 1.48 | | |
$ | 1.55 | | |
$ | (5.07 | ) |
| Weighted average diluted common shares outstanding | |
| 28,700,000 | | |
| 28,700,000 | | |
| 28,051,570 | |
B. RILEY FINANCIAL, INC.
Reconciliation of Net Income Preliminary Estimate
to Adjusted EBITDA Preliminary Estimate
(Unaudited)
(Dollars in thousands)
| | |
Preliminary Estimate | | |
Prior Period | |
| | |
Six Months
Ended
June 30,
2023 | | |
Six Months
Ended
June 30,
2022 | |
| | |
Low | | |
High | | |
Actual | |
| Net income (loss) attributable to B. Riley Financial, Inc. | |
$ | 61,755 | | |
$ | 63,755 | | |
$ | (150,221 | ) |
| Adjustments: | |
| | | |
| | | |
| | |
| Provision for (benefit from) income taxes | |
| 29,419 | | |
| 29,419 | | |
| (56,208 | ) |
| Interest expense | |
| 94,861 | | |
| 94,861 | | |
| 62,200 | |
| Interest income | |
| (3,274 | ) | |
| (3,274 | ) | |
| (567 | ) |
| Share based payments | |
| 24,246 | | |
| 24,246 | | |
| 31,215 | |
| Depreciation and amortization | |
| 25,577 | | |
| 25,577 | | |
| 15,809 | |
| Restructuring charge | |
| 693 | | |
| 693 | | |
| — | |
| Gain on extinguishment of loans | |
| — | | |
| — | | |
| (1,102 | ) |
| Impairment of tradenames | |
| 1,700 | | |
| 1,700 | | |
| — | |
| Transactions related costs and other | |
| (2,146 | ) | |
| (2,146 | ) | |
| 3,759 | |
| | |
| | | |
| | | |
| | |
| Total EBITDA adjustments | |
| 171,076 | | |
| 171,076 | | |
| 55,106 | |
| | |
| | | |
| | | |
| | |
| Adjusted EBITDA | |
$ | 232,831 | | |
$ | 234,831 | | |
$ | (95,115 | ) |
| | |
| | | |
| | | |
| | |
| Operating EBITDA Adjustments: | |
| | | |
| | | |
| | |
| Trading (income) losses and fair value adjustments on loans | |
| (93,568 | ) | |
| (93,568 | ) | |
| 137,041 | |
| Realized and unrealized (gains) losses on investments and fair value adjustments | |
| 9,442 | | |
| 9,442 | | |
| 155,276 | |
| Other investment related expenses | |
| 9,921 | | |
| 9,921 | | |
| (38,795 | ) |
| | |
| | | |
| | | |
| | |
| Total Operating EBITDA Adjustments | |
| (74,205 | ) | |
| (74,205 | ) | |
| 253,522 | |
| | |
| | | |
| | | |
| | |
| Operating Adjusted EBITDA | |
$ | 158,626 | | |
$ | 160,626 | | |
$ | 158,407 | |
| | |
| www.brileyfin.com | NASDAQ: RILY | 5 |
B. RILEY FINANCIAL, INC.
Diluted Income per Common Share — Preliminary
Estimate
(Unaudited)
(Dollars in thousands, except share data)
| |
|
Preliminary Estimate |
|
|
Prior Period |
|
| |
|
Six Months
Ended
June 30,
2023 |
|
|
Six Months
Ended
June 30,
2022 |
|
| |
|
Low |
|
|
High |
|
|
Actual |
|
| Net income (loss) attributable to B. Riley Financial, Inc. |
|
$ |
61,755 |
|
|
$ |
63,755 |
|
|
$ |
(150,221 |
) |
| Preferred stock dividends |
|
|
4,012 |
|
|
|
4,012 |
|
|
|
4,004 |
|
| Net income (loss) available to common shareholders |
|
$ |
57,743 |
|
|
$ |
59,743 |
|
|
$ |
(154,225 |
) |
| |
|
|
|
|
|
|
|
|
|
|
|
|
| Diluted income (loss) per common share |
|
$ |
1.98 |
|
|
$ |
2.05 |
|
|
$ |
(5.52 |
) |
| Weighted average diluted common shares outstanding |
|
|
29,100,000 |
|
|
|
29,100,000 |
|
|
|
27,953,845 |
|
# # #
| Contacts |
|
| |
|
| Investors |
Media |
| Mike Frank |
Jo Anne McCusker |
| ir@brileyfin.com |
jmccusker@brileyfin.com |
| (212) 409-2424 |
(646) 885-5425 |
Source: B. Riley Financial, Inc.
| | |
| www.brileyfin.com | NASDAQ: RILY | 6 |
Exhibit 99.2
B. Riley Financial Announces Proposed Public
Offering of Common Stock
LOS ANGELES, July 25, 2023 – B. Riley
Financial, Inc. (NASDAQ: RILY) (“B. Riley” or the “Company”), a diversified financial services platform, today
announced it has commenced an underwritten public offering of $100 million of its common stock (the “Offering”), subject to
market and certain other conditions.
The Company expects to grant the underwriter a
30-day option to purchase up to an additional 15% of the shares of common stock sold in the Offering. Co-Chief Executive Officers Bryant
R. Riley and Tom Kelleher have indicated an interest to purchase, in the aggregate, up to $4.5 million of shares of common stock in this
Offering at the public offering price. Certain of the Company’s officers, directors, and employees have also indicated an interest
in participating in this Offering.
B. Riley Securities is acting as sole book-running
manager for the offering.
The Company expects to use the net proceeds of
this offering for general corporate purposes, including funding future acquisitions and investments, repaying and/or refinancing indebtedness,
making loans and/or providing guaranty or backstop commitments to clients in the ordinary course of business, making capital expenditures
and funding working capital. Pending such use, the Company may invest the net proceeds in short-term interest-bearing accounts, securities
or similar investments.
Any offers, solicitations or offers to buy, or
any sales of securities will be made in accordance with the registration requirements of the Securities Act of 1933, as amended. A registration
statement was previously filed by the Company with the SEC and became effective upon filing on January 28, 2021, and a preliminary prospectus
supplement was filed on July 25, 2023. The offering will only be made by means of a prospectus.
Copies of the preliminary prospectus supplement
and the accompanying base prospectus may be obtained on the SEC’s website at www.sec.gov, or by contacting B. Riley Securities by telephone
at (703) 312-9580, or by emailing prospectuses@brileyfin.com.
This press release shall not constitute an offer
to sell or the solicitation of an offer to buy, nor shall there be any sale of these securities in any state or jurisdiction in which
such offer, sale or solicitation would be unlawful prior to registration or qualification under the securities laws of any such state
or jurisdiction.
About B. Riley Financial
B. Riley Financial is a diversified financial
services platform that delivers tailored solutions to meet the strategic, operational, and capital needs of its clients and partners.
B. Riley leverages cross-platform expertise to provide clients with full service, collaborative solutions at every stage of the business
life cycle. Through its affiliated subsidiaries, B. Riley provides end-to-end financial services across investment banking, institutional
brokerage, private wealth and investment management, financial consulting, corporate restructuring, operations management, risk and compliance,
due diligence, forensic accounting, litigation support, appraisal and valuation, auction, and liquidation services. B. Riley opportunistically
invests to benefit its shareholders, and certain affiliates originate and underwrite senior secured loans for asset-rich companies. B.
Riley refers to B. Riley Financial, Inc. and/or one or more of its subsidiaries or affiliates.
| | |
| www.brileyfin.com | NASDAQ: RILY | |

Forward-Looking Statements
Statements in this press release that are not
descriptions of historical facts are forward-looking statements that are based on management’s current expectations and assumptions and
are subject to risks and uncertainties. If such risks or uncertainties materialize or such assumptions prove incorrect, our business,
operating results, financial condition, and stock price could be materially negatively affected. You should not place undue reliance on
such forward-looking statements, which are based on the information currently available to us and speak only as of the date of this press
release. Such forward-looking statements include, but are not limited to, statements regarding timing and size of the proposed public
offering and the intended use of net proceeds. Factors that could cause such actual results to differ materially from those contemplated
or implied by such forward-looking statements include, without limitation, the risks described from time to time in B. Riley Financial,
Inc.’s periodic filings with the SEC, including, without limitation, the risks described in B. Riley Financial, Inc.’s 2022
Annual Report on Form 10-K under the captions “Risk Factors” and “Management’s Discussion and Analysis of Financial
Condition and Results of Operations” (as applicable)and our Quarterly Report on Form 10-Q for the quarter ended March 31, 2023.
These factors should be considered carefully, and readers are cautioned not to place undue reliance on such forward-looking statements.
All information is current as of the date this press release is issued, and B. Riley Financial undertakes no duty to update this information.
# # #
Contacts
| Investors |
Media |
| Mike Frank |
Jo Anne McCusker
|
| ir@brileyfin.com |
jmccusker@brileyfin.com
|
| (212) 409-2424 |
(646) 885-5425
|
| |
|
| Source: B. Riley Financial, Inc. |
|
| | |
| www.brileyfin.com | NASDAQ: RILY | |
Exhibit
99.3

1 Investor Overview July 2023
2 Forward - looking Statements Statements made in this presentation that are not descriptions of historical facts are forward - looking statements that are based on management’s current expectations and assumptions and are subject to risks and uncertainties . If such risks or uncertainties materialize or such assumptions prove incorrect, our business, operating results, financial condition, and stock price could be materially negatively affected . You should not place undue reliance on such forward - looking statements, which are based on the information currently available to us and speak only as of the date of this press release . Such forward - looking statements include, but are not limited to, statements regarding our excitement and the expected growth of our business segments . Factors that could cause such actual results to differ materially from those contemplated or implied by such forward - looking statements include, without limitation, the risks described from time to time in B . Riley Financial, Inc . ’s periodic filings with the SEC, including, without limitation, the risks described in B . Riley Financial, Inc . ’s Annual Report on Form 10 - K for the year ended December 31 , 2022 and under the captions “Risk Factors” and “Management's Discussion and Analysis of Financial Condition and Results of Operations” (as applicable) and our Quarterly Report on Form 10 - Q for the quarter ended March 31 , 2023 . These factors should be considered carefully, and readers are cautioned not to place undue reliance on such forward - looking statements . These factors should be considered carefully, and readers are cautioned not to place undue reliance on such forward - looking statements . All information is current as of the date this presentation is published, and B . Riley Financial undertakes no duty to update this information . This presentation does not constitute an offer to sell or the solicitation of an offer to buy any securities . Any offers, solicitations or offers to buy, or any sales of securities will be made in accordance with the registration requirements of the Securities Act of 1933 , as amended . Use of Non - GAAP Financial Measures Certain of the information set forth herein, including operating revenues, adjusted EBITDA, operating adjusted EBITDA, and investment adjusted EBITDA may be considered non - GAAP financial measures . B . Riley Financial believes this information is useful to investors because it provides a basis for measuring the Company's available capital resources, the operating performance of its business and its revenues and cash flow, ( i ) excluding in the case of operating revenues, trading income (loss) and fair value adjustments on loans, (ii) excluding in the case of adjusted EBITDA, net interest expense, provisions for or benefit from income taxes, depreciation, amortization, fair value adjustment, restructuring charge, gain on extinguishment of loans, impairment of trade names, stock - based compensation and transaction and other expenses, (iii) excluding in the case of operating adjusted EBITDA, aforementioned adjustments for adjusted EBITDA, as well as trading income (loss) and fair value adjustments on loans, realized and unrealized gains (losses) on investments, and other investment related expenses, and (iv) in the case of investment adjusted EBITDA this includes trading income (loss) and fair value adjustments on loans and realized and unrealized gains (losses) on investments, net of other investment related expenses, that would normally be included in the most directly comparable measures calculated and presented in accordance with Generally Accepted Accounting Principles ("GAAP") . In addition, the Company's management uses these non - GAAP financial measures along with the most directly comparable GAAP financial measures in evaluating the Company's operating performance, capital resources and cash flow . Non - GAAP financial measures should not be considered in isolation from, or as a substitute for, financial information presented in compliance with GAAP, and non - financial measures as reported by the Company may not be comparable to similarly titled amounts reported by other companies .

3 01 B. RILEY FINANCIAL AT A GLANCE 3
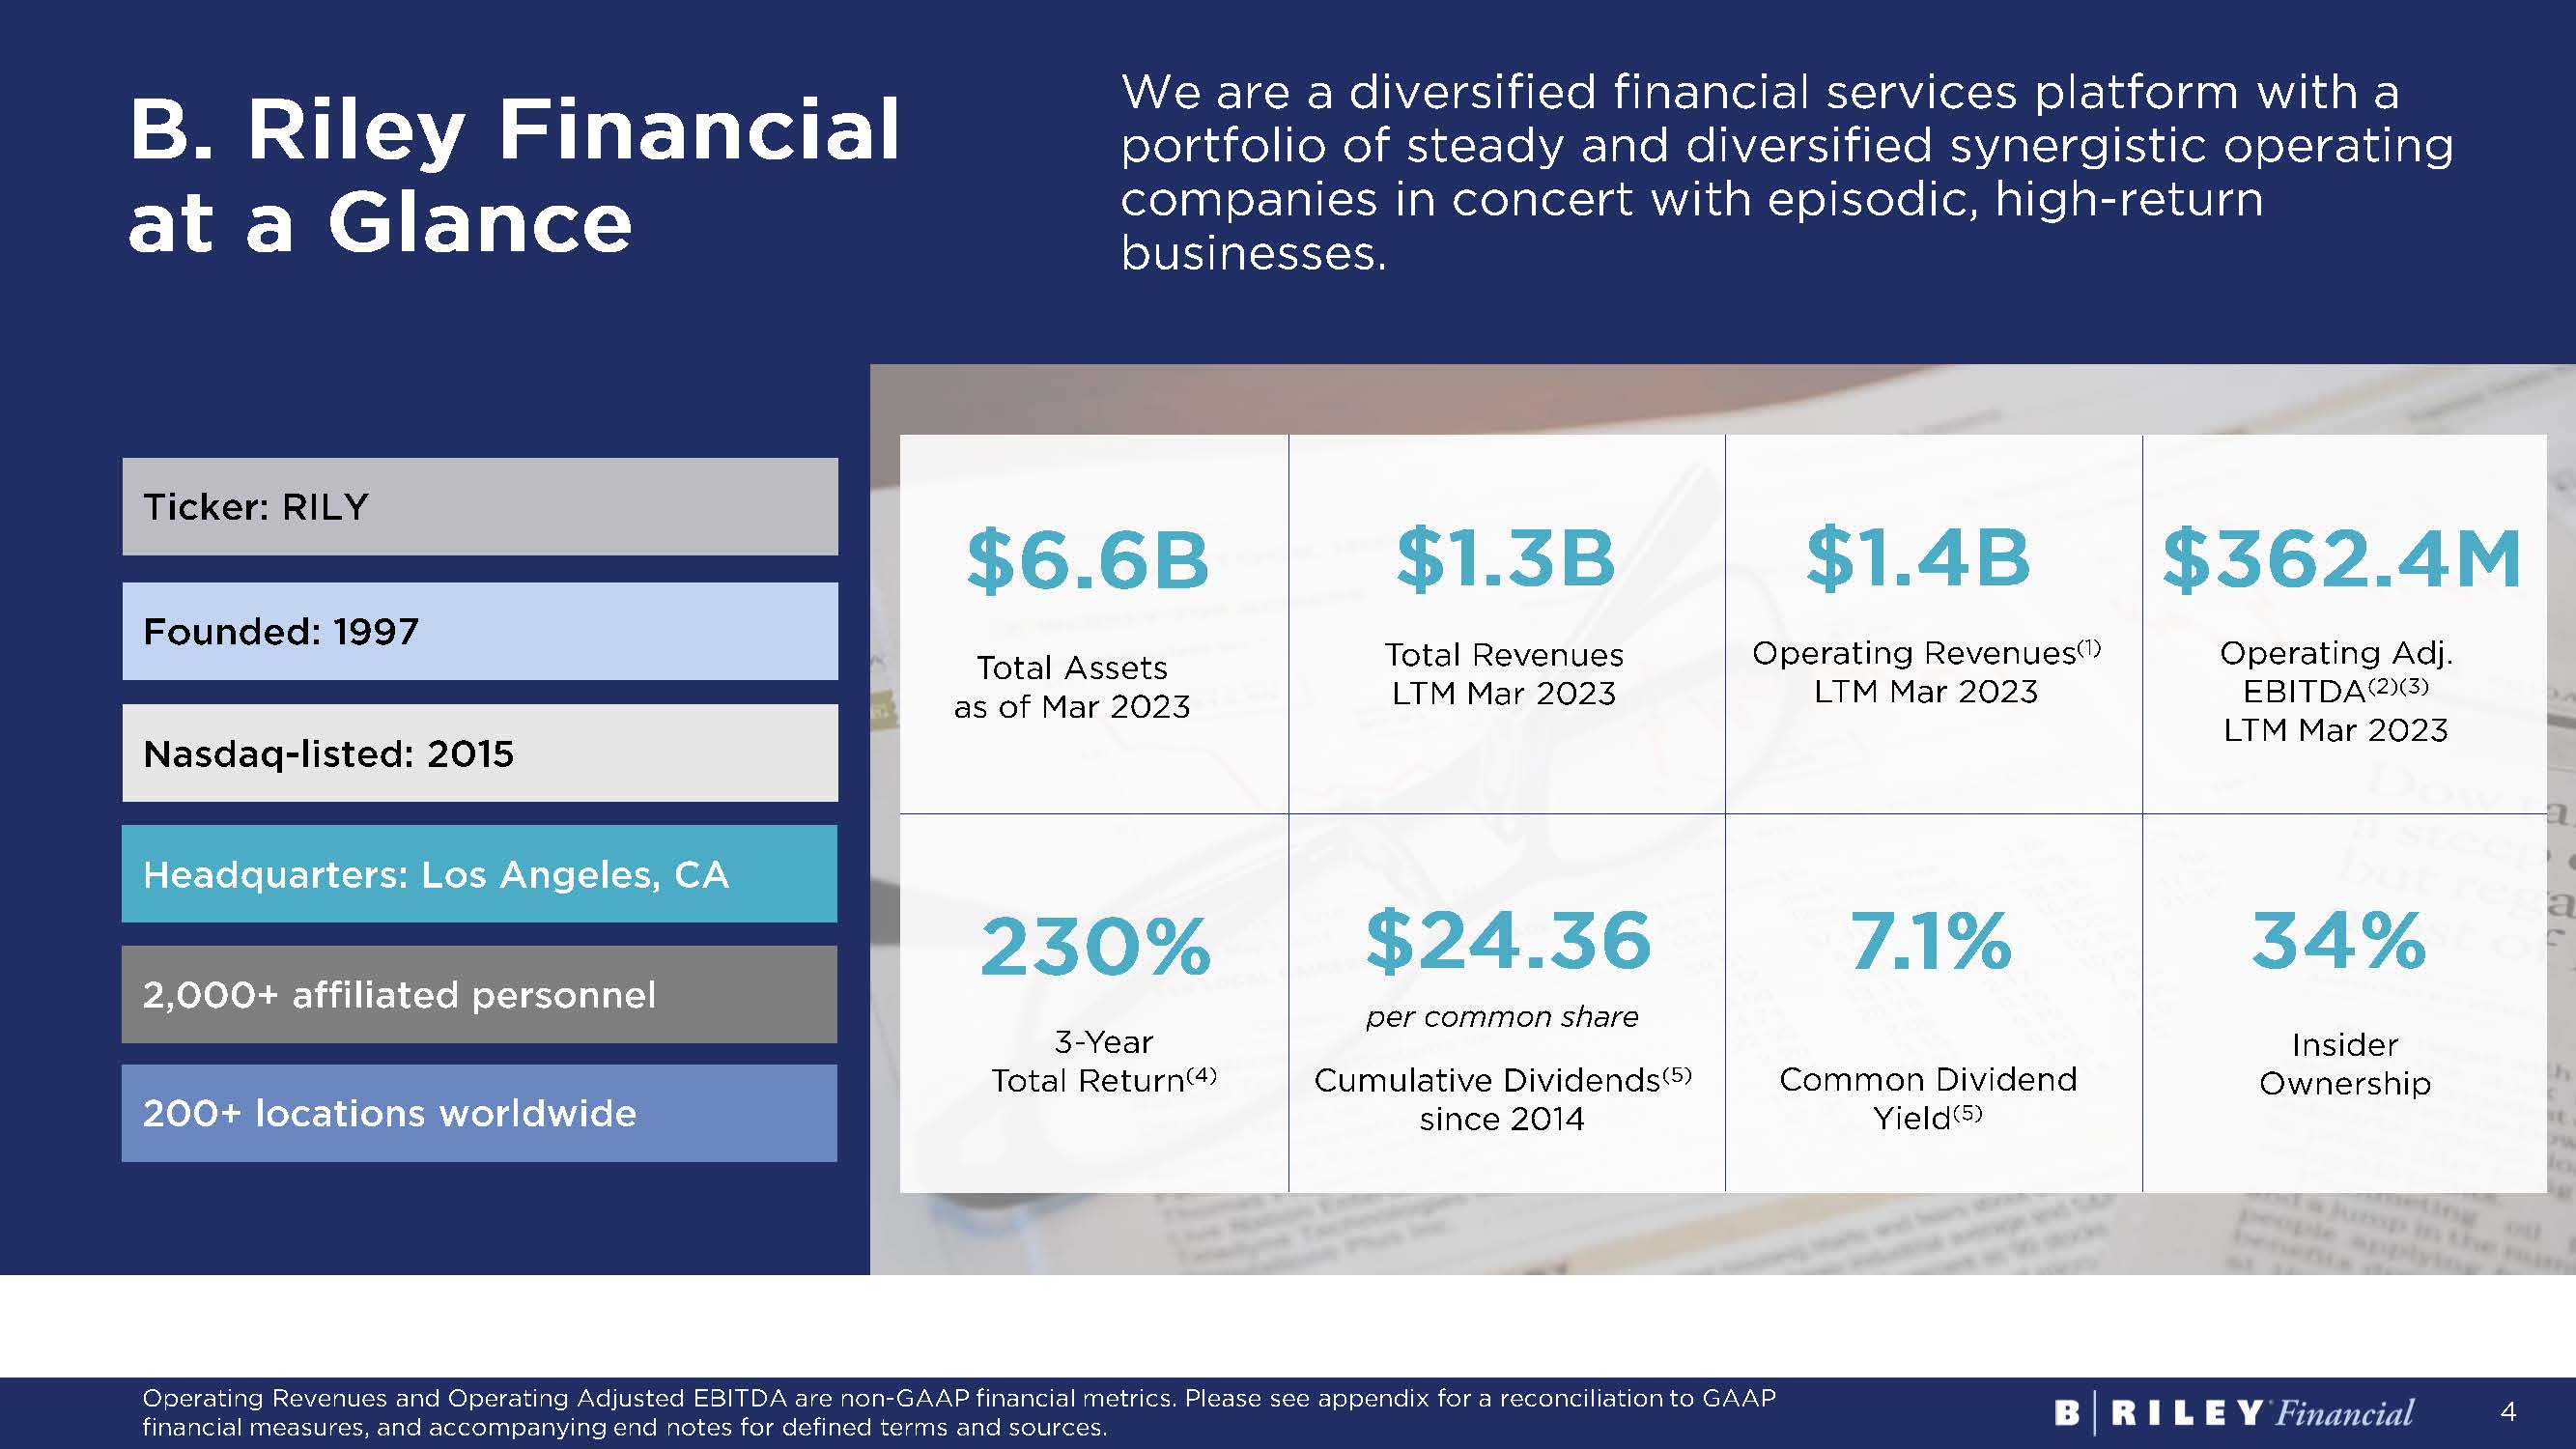
4 B. Riley Financial at a Glance Ticker: RILY Founded: 1997 Nasdaq - listed: 2015 Headquarters: Los Angeles, CA 2,000+ affiliated personnel 200+ locations worldwide We are a diversified financial services platform with a portfolio of steady and diversified synergistic operating companies in concert with episodic, high - return businesses. Total Assets as of Mar 2023 $6.6B 3 - Year Total Return (4) 230% Total Revenues LTM Mar 2023 $1.3B Operating Revenues (1) LTM Mar 2023 $1.4B Operating Adj. EBITDA (2)(3) LTM Mar 2023 $362.4M per common share Cumulative Dividends (5) since 2014 $24.36 Insider Ownership 34% Common Dividend Yield (5) 7.1% Operating Revenues and Operating Adjusted EBITDA are non - GAAP financial metrics. Please see appendix for a reconciliation to GAA P financial measures, and accompanying end notes for defined terms and sources.
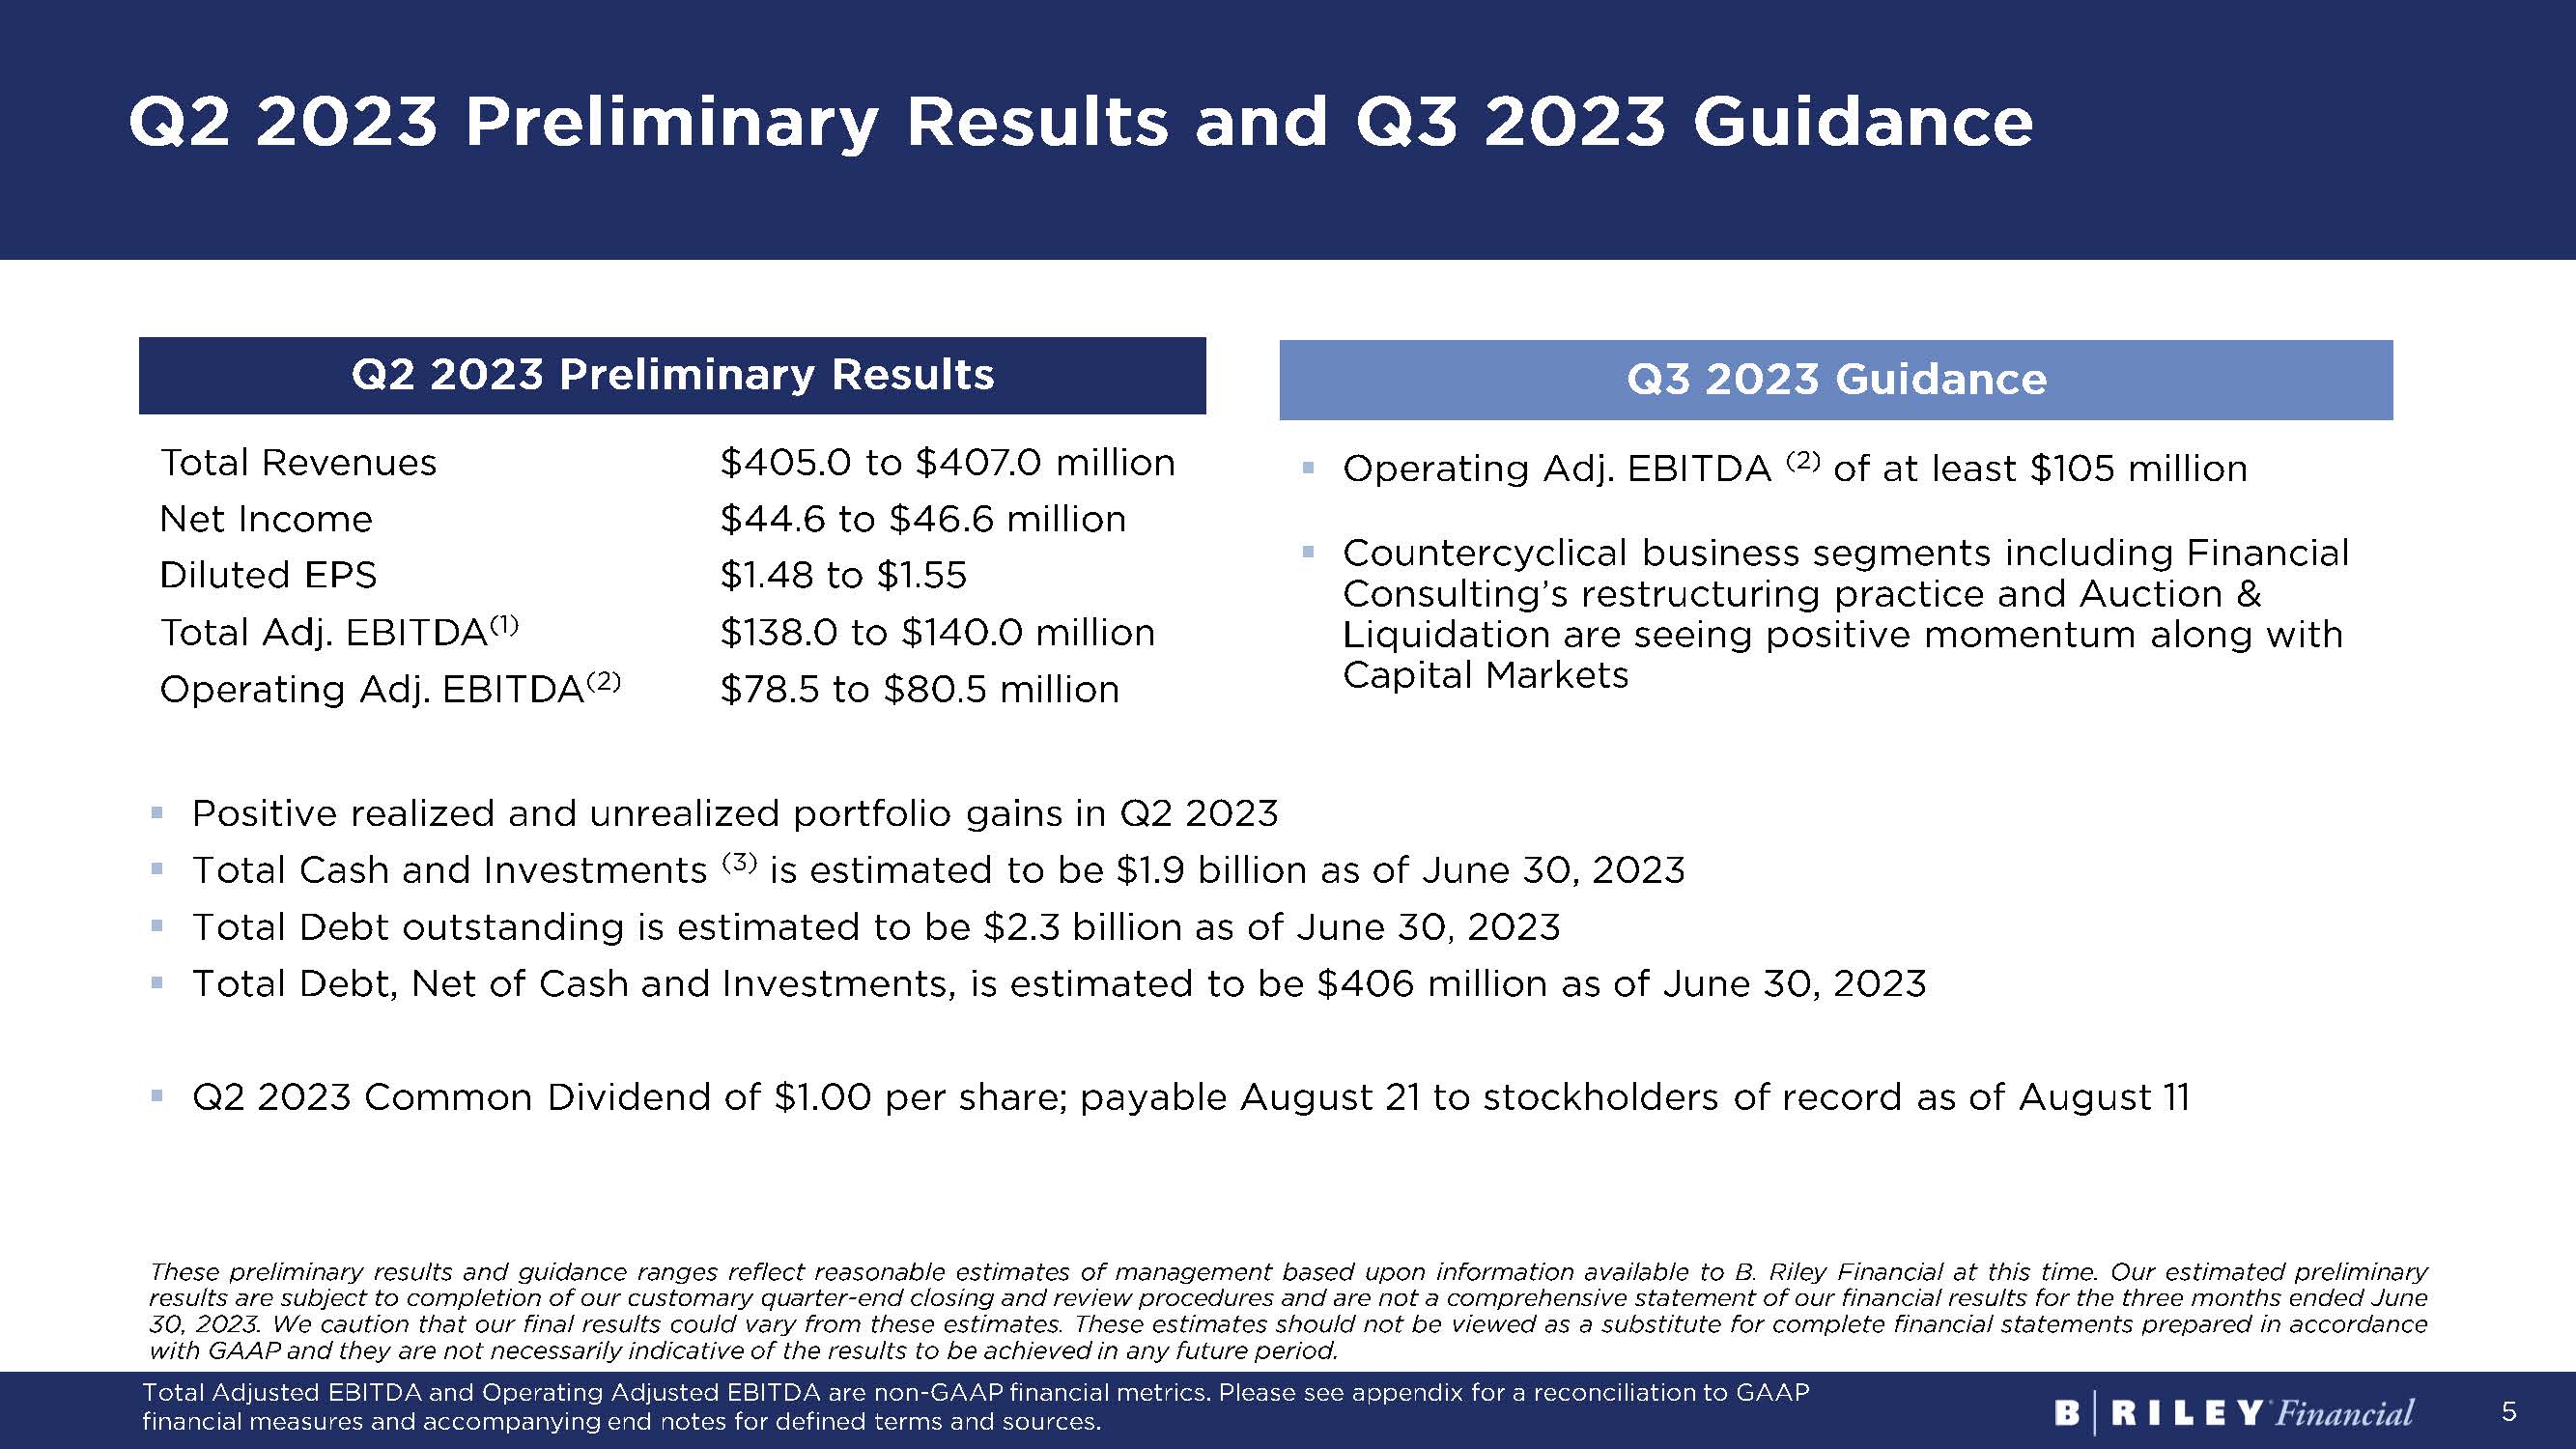
5 Q2 2023 Preliminary Results Total Revenues $405.0 to $407.0 million Net Income $44.6 to $46.6 million Diluted EPS $1.48 to $1.55 Total Adj. EBITDA (1) $138.0 to $140.0 million Operating Adj. EBITDA (2) $78.5 to $80.5 million Q3 2023 Guidance ▪ Positive realized and unrealized portfolio gains in Q 2 2023 ▪ Total Cash and Investments ( 3 ) is estimated to be $ 1 . 9 billion as of June 30 , 2023 ▪ Total Debt outstanding is estimated to be $ 2 . 3 billion as of June 30 , 2023 ▪ Total Debt, Net of Cash and Investments, is estimated to be $ 406 million as of June 30 , 2023 ▪ Q 2 2023 Common Dividend of $ 1 . 00 per share ; payable August 21 to stockholders of record as of August 11 These preliminary results and guidance ranges reflect reasonable estimates of management based upon information available to B . Riley Financial at this time . Our estimated preliminary results are subject to completion of our customary quarter - end closing and review procedures and are not a comprehensive statement of our financial results for the three months ended June 30 , 2023 . We caution that our final results could vary from these estimates . These estimates should not be viewed as a substitute for complete financial statements prepared in accordance with GAAP and they are not necessarily indicative of the results to be achieved in any future period . ▪ Operating Adj. EBITDA (2) of at least $105 million ▪ Countercyclical business segments including Financial Consulting’s restructuring practice and Auction & Liquidation are seeing positive momentum along with Capital Markets Q2 2023 Preliminary Results and Q3 2023 Guidance Total Adjusted EBITDA and Operating Adjusted EBITDA are non - GAAP financial metrics. Please see appendix for a reconciliation to GAAP financial measures and accompanying end notes for defined terms and sources.

6 02 PLATFORM STRATEGY & PERFORMANCE
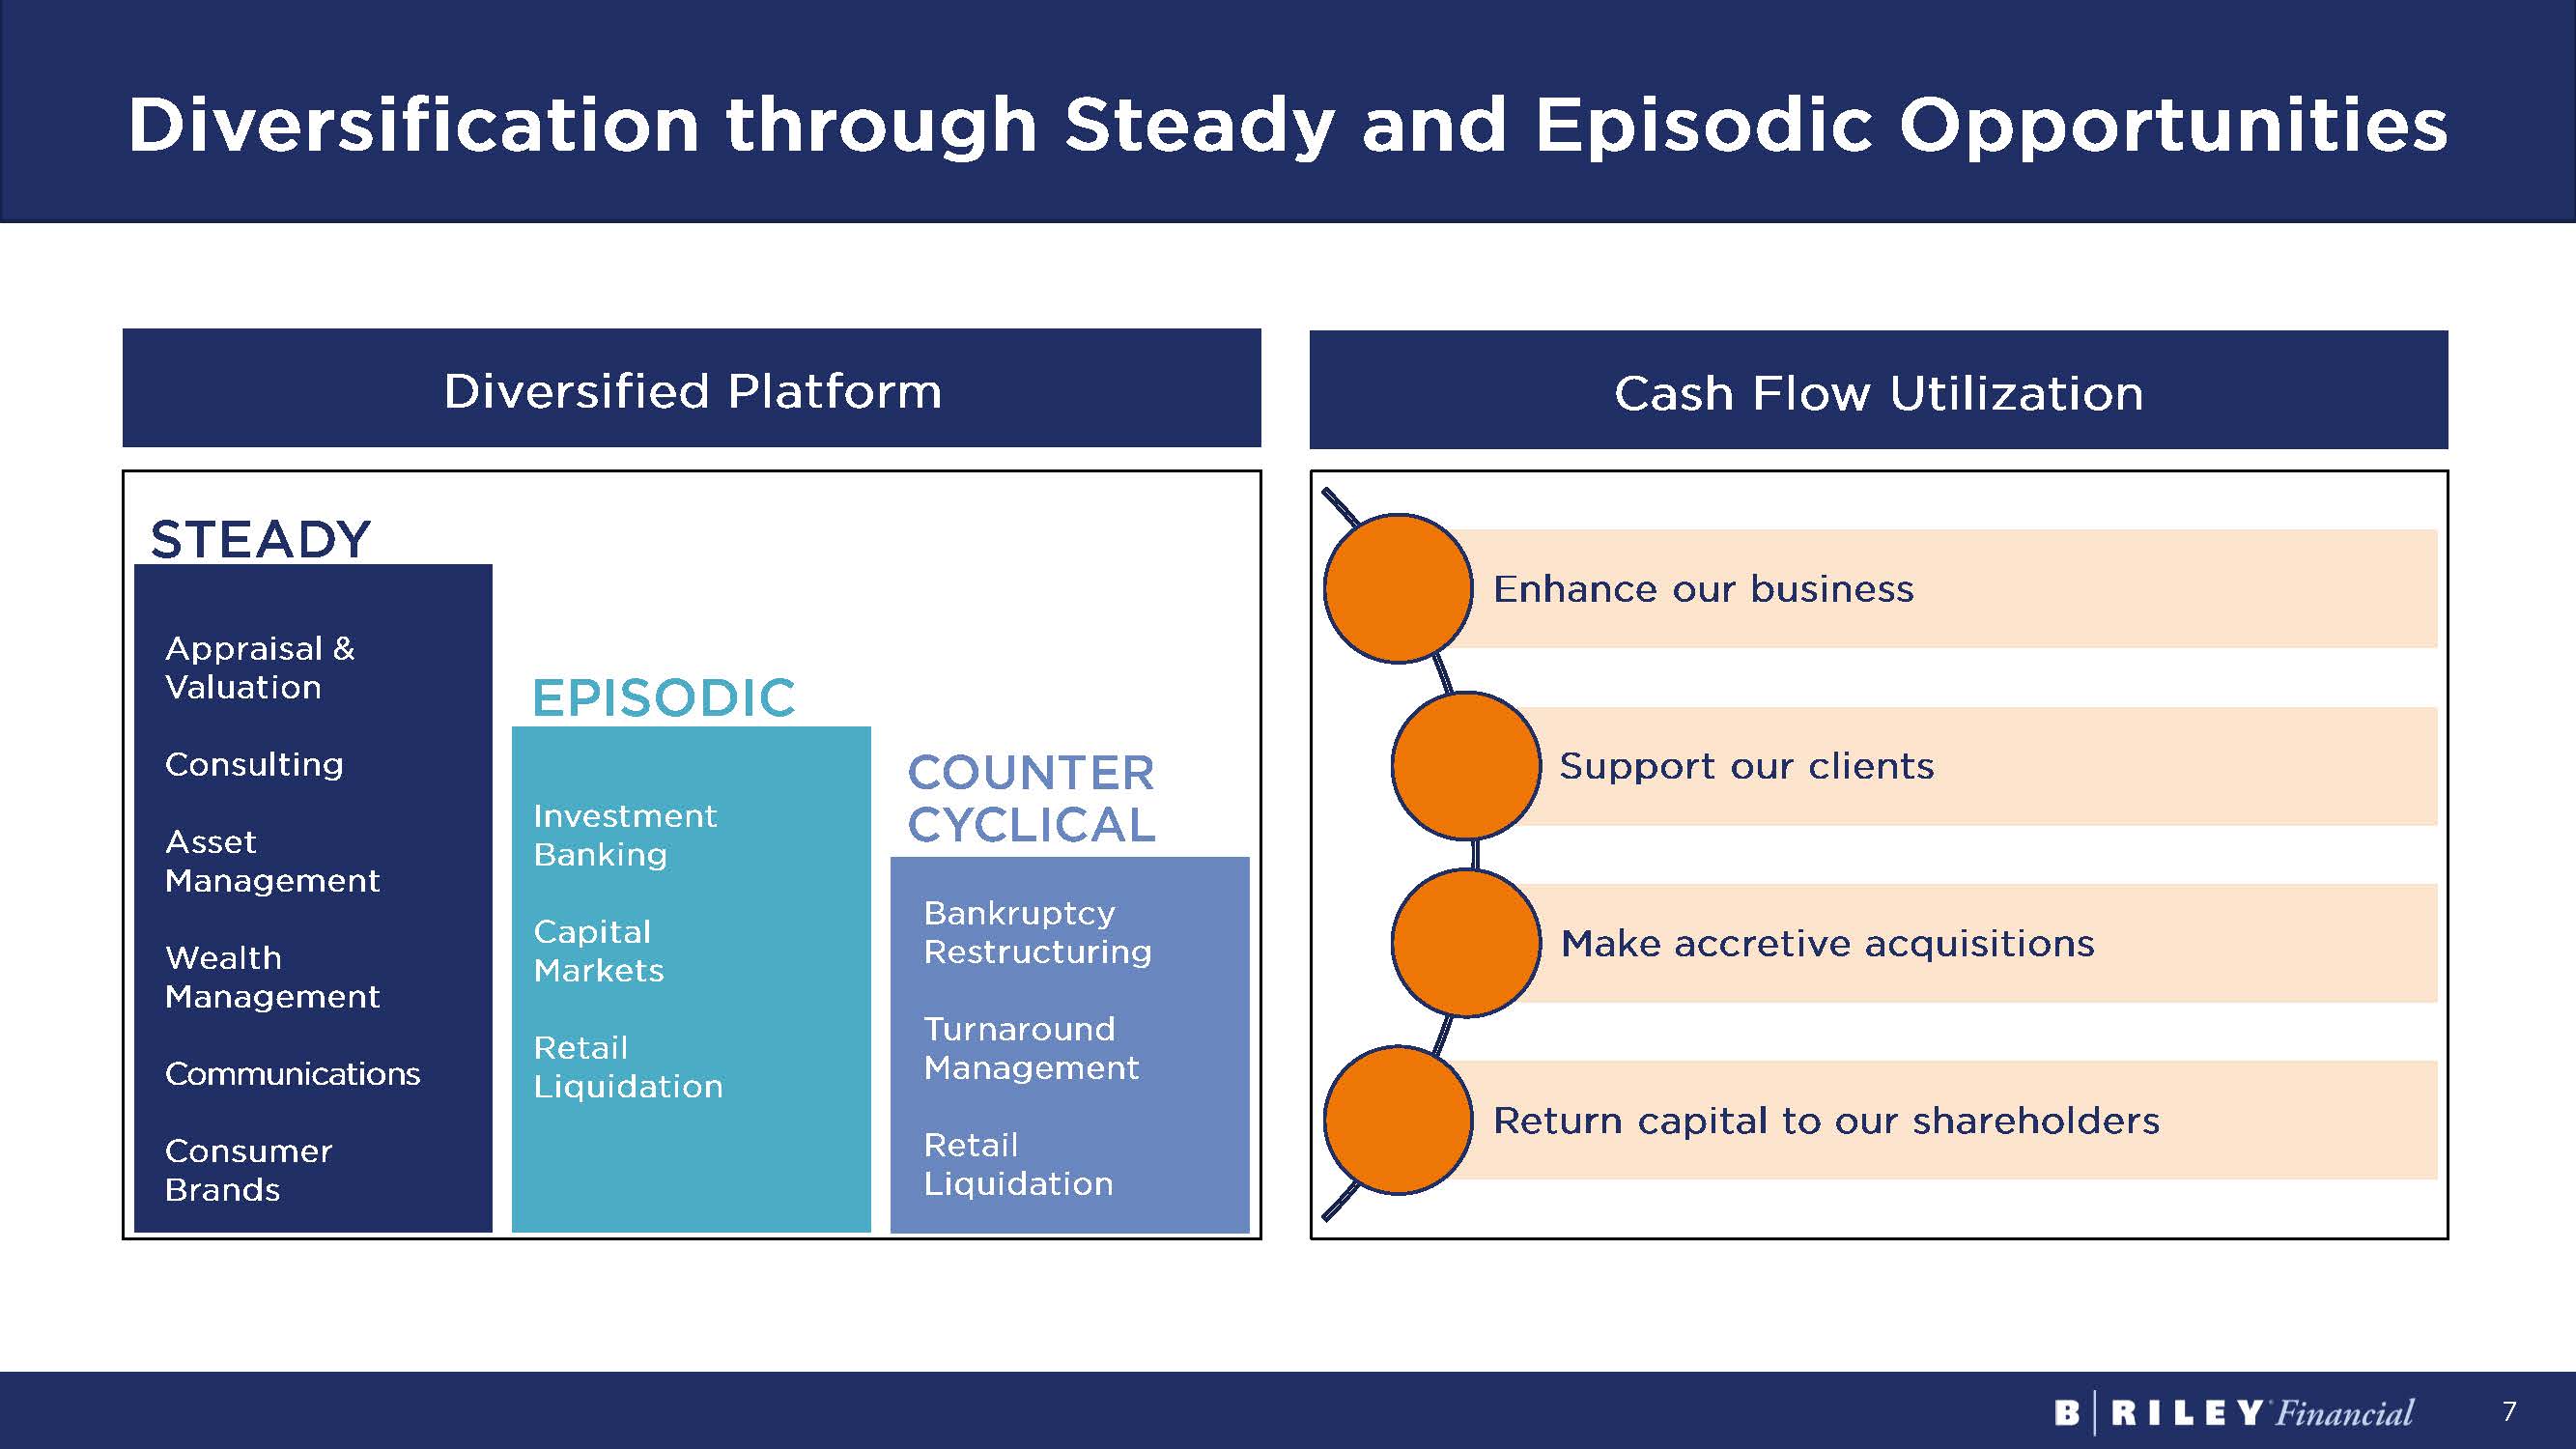
7 Diversification through Steady and Episodic Opportunities Enhance our business Support our clients Make accretive acquisitions Return capital to our shareholders Diversified Platform Cash Flow Utilization STEADY EPISODIC COUNTER CYCLICAL Appraisal & Valuation Consulting Asset Management Wealth Management Communications Consumer Brands Investment Banking Capital Markets Retail Liquidation Bankruptcy Restructuring Turnaround Management Retail Liquidation

8 Historical Timeline and Acquisitions Banking, Capital Markets Asset, Wealth Management Advisory, Consulting Consumer, Communications 1997 2014 2016 2017 2018 2019 2020 2021 2022 2023 Merged with publicly traded Great American Group RILY lists on Nasdaq Acquired National Holdings Acquired 272 Capital Acquired Marconi Wireless Acquired FBR & Co Acquired Wunderlich Securities Established Brands Portfolio Formed boutique stock - picking research firm serving small caps Acquired United Online Acquired GlassRatner Acquired magicJack Acquired FocalPoint Acquired Lingo Acquired BullsEye Telecom Acquired Targus Acquired corporate division of Farber Group Acquired ABTV Acquired C&W Acquired Alderney Advisors Acquired Anchor Resource Mgmt Established Financial Sponsors Group B. Riley Real Estate B. Riley Venture Capital
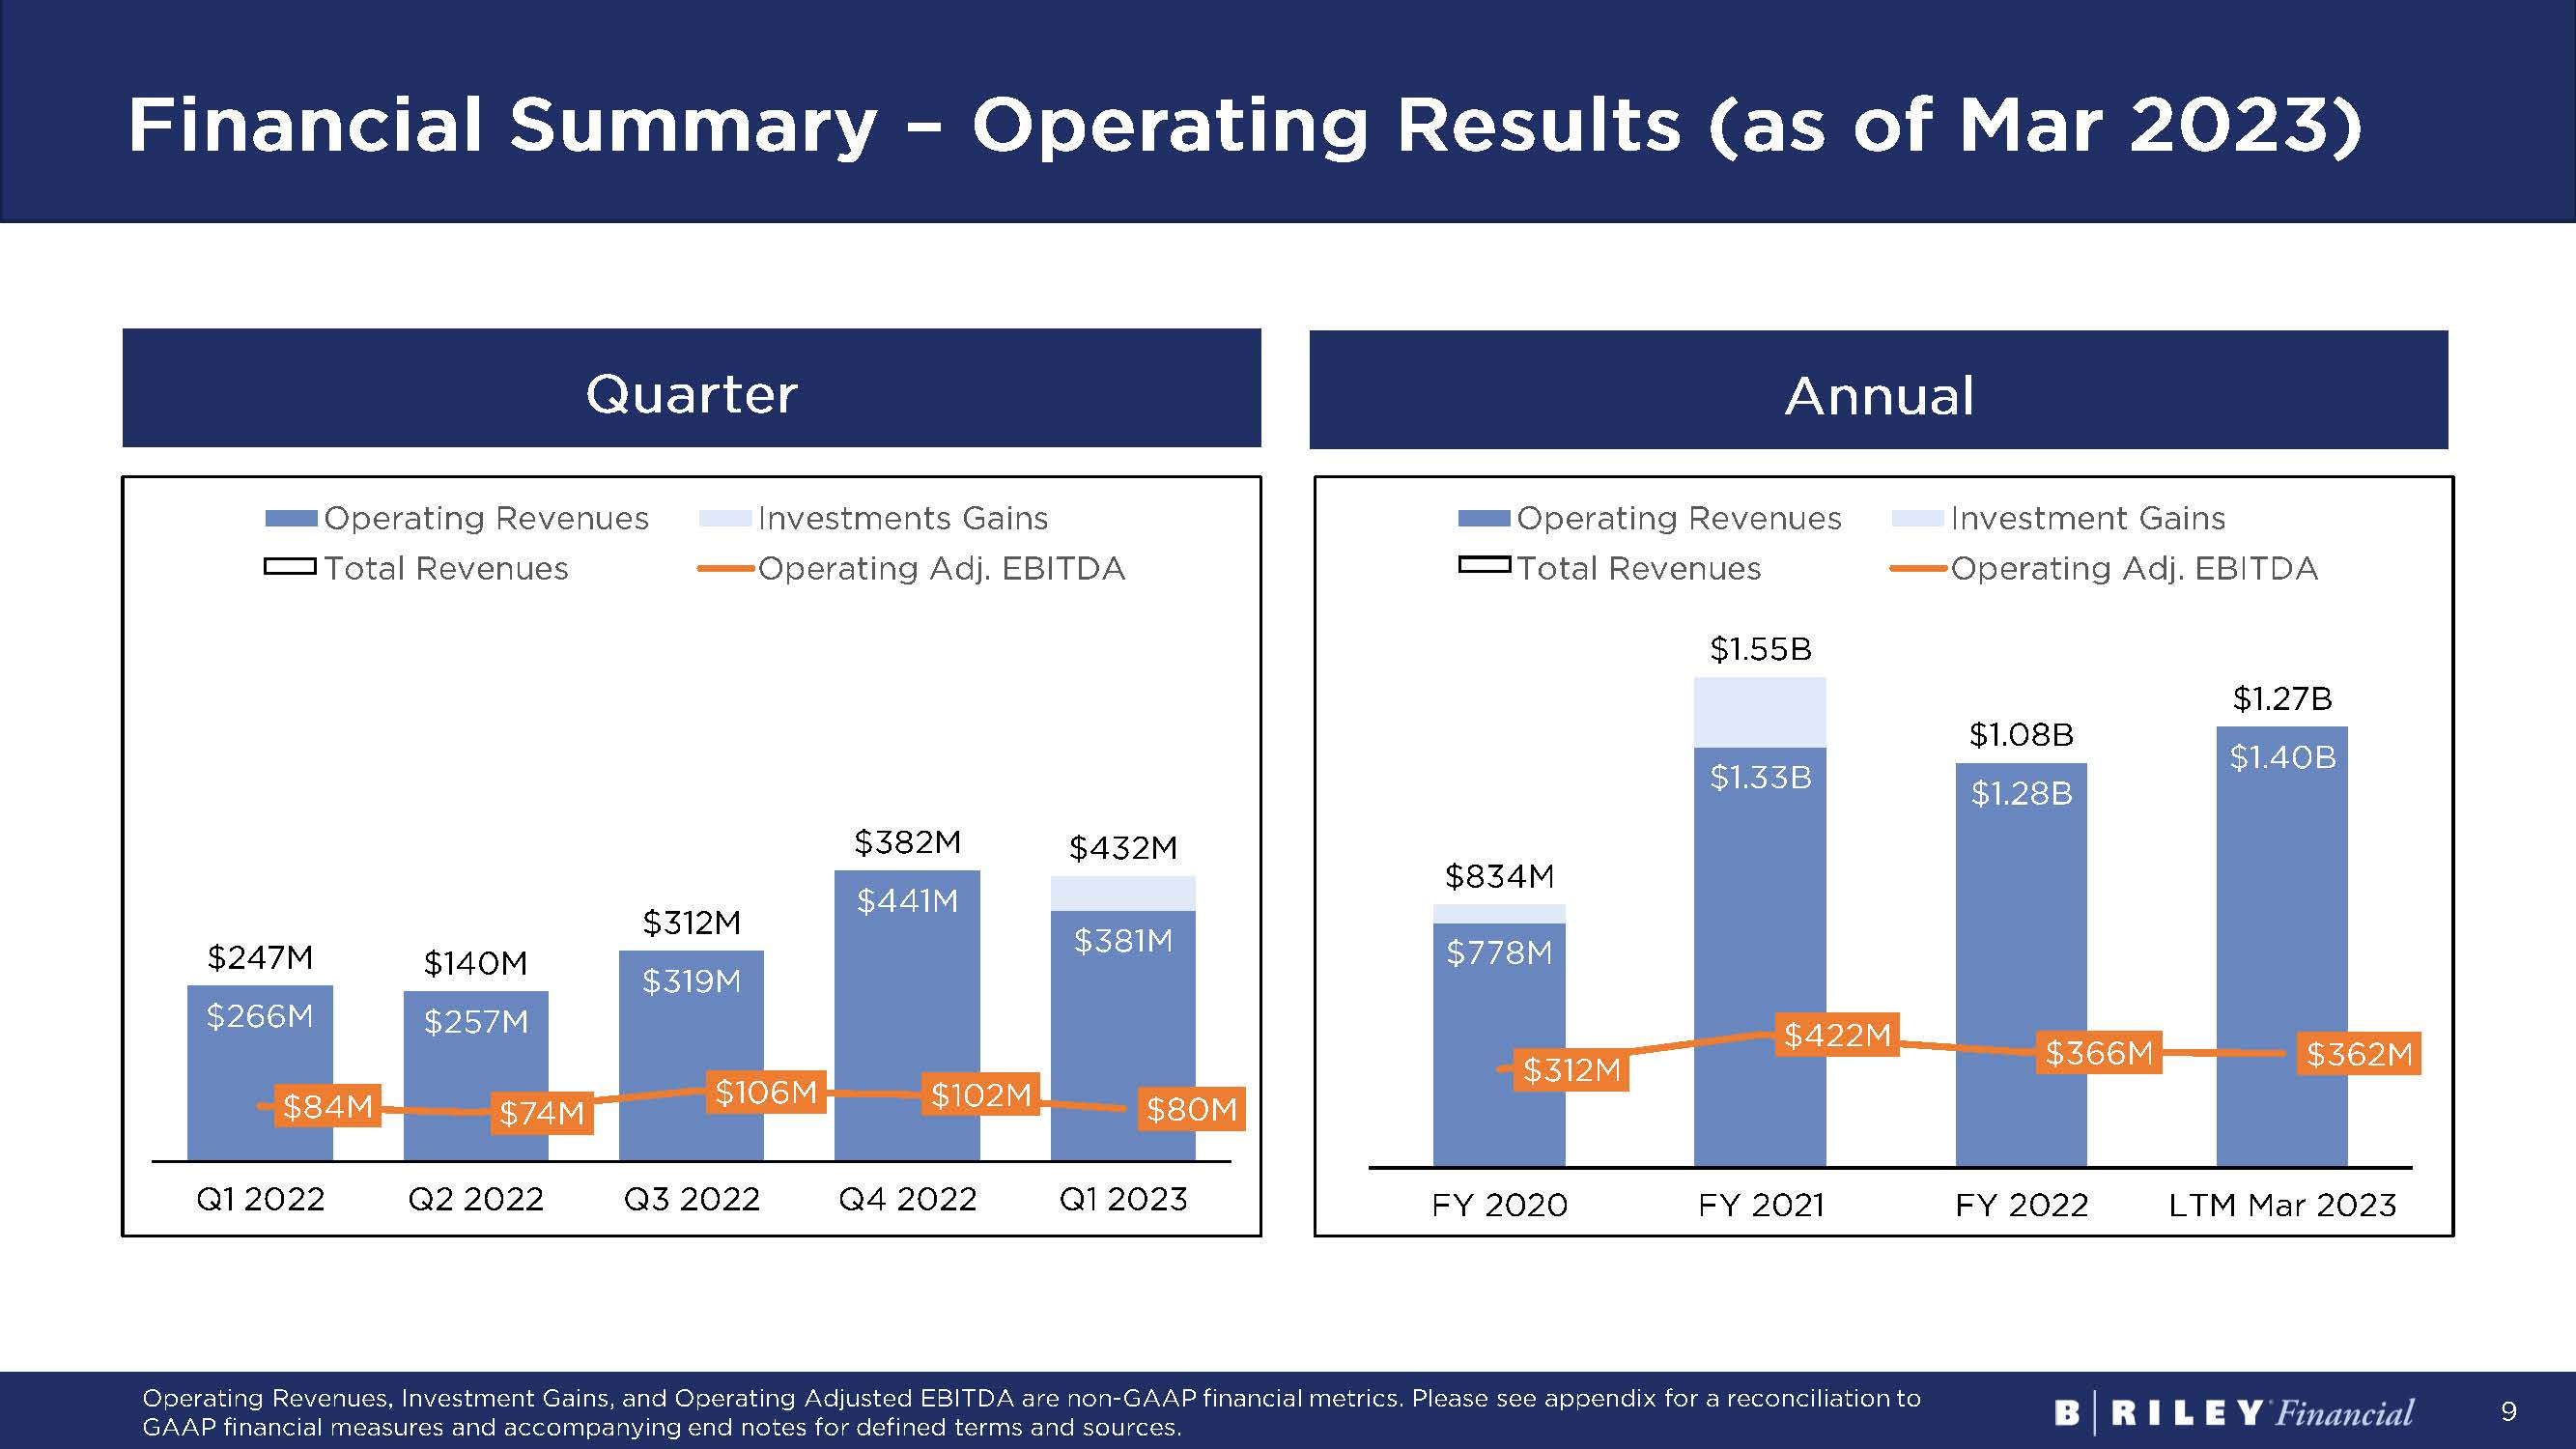
9 Financial Summary – Operating Results (as of Mar 2023) $266M $257M $319M $441M $381M $247M $140M $312M $382M $432M $84M $74M $106M $102M $80M Q1 2022 Q2 2022 Q3 2022 Q4 2022 Q1 2023 Operating Revenues Investments Gains Total Revenues Operating Adj. EBITDA $778M $1.33B $1.28B $1.40B $834M $1.55B $1.08B $1.27B $312M $422M $366M $362M FY 2020 FY 2021 FY 2022 LTM Mar 2023 Operating Revenues Investment Gains Total Revenues Operating Adj. EBITDA Quarter Annual Operating Revenues, Investment Gains, and Operating Adjusted EBITDA are non - GAAP financial metrics. Please see appendix for a re conciliation to GAAP financial measures and accompanying end notes for defined terms and sources.
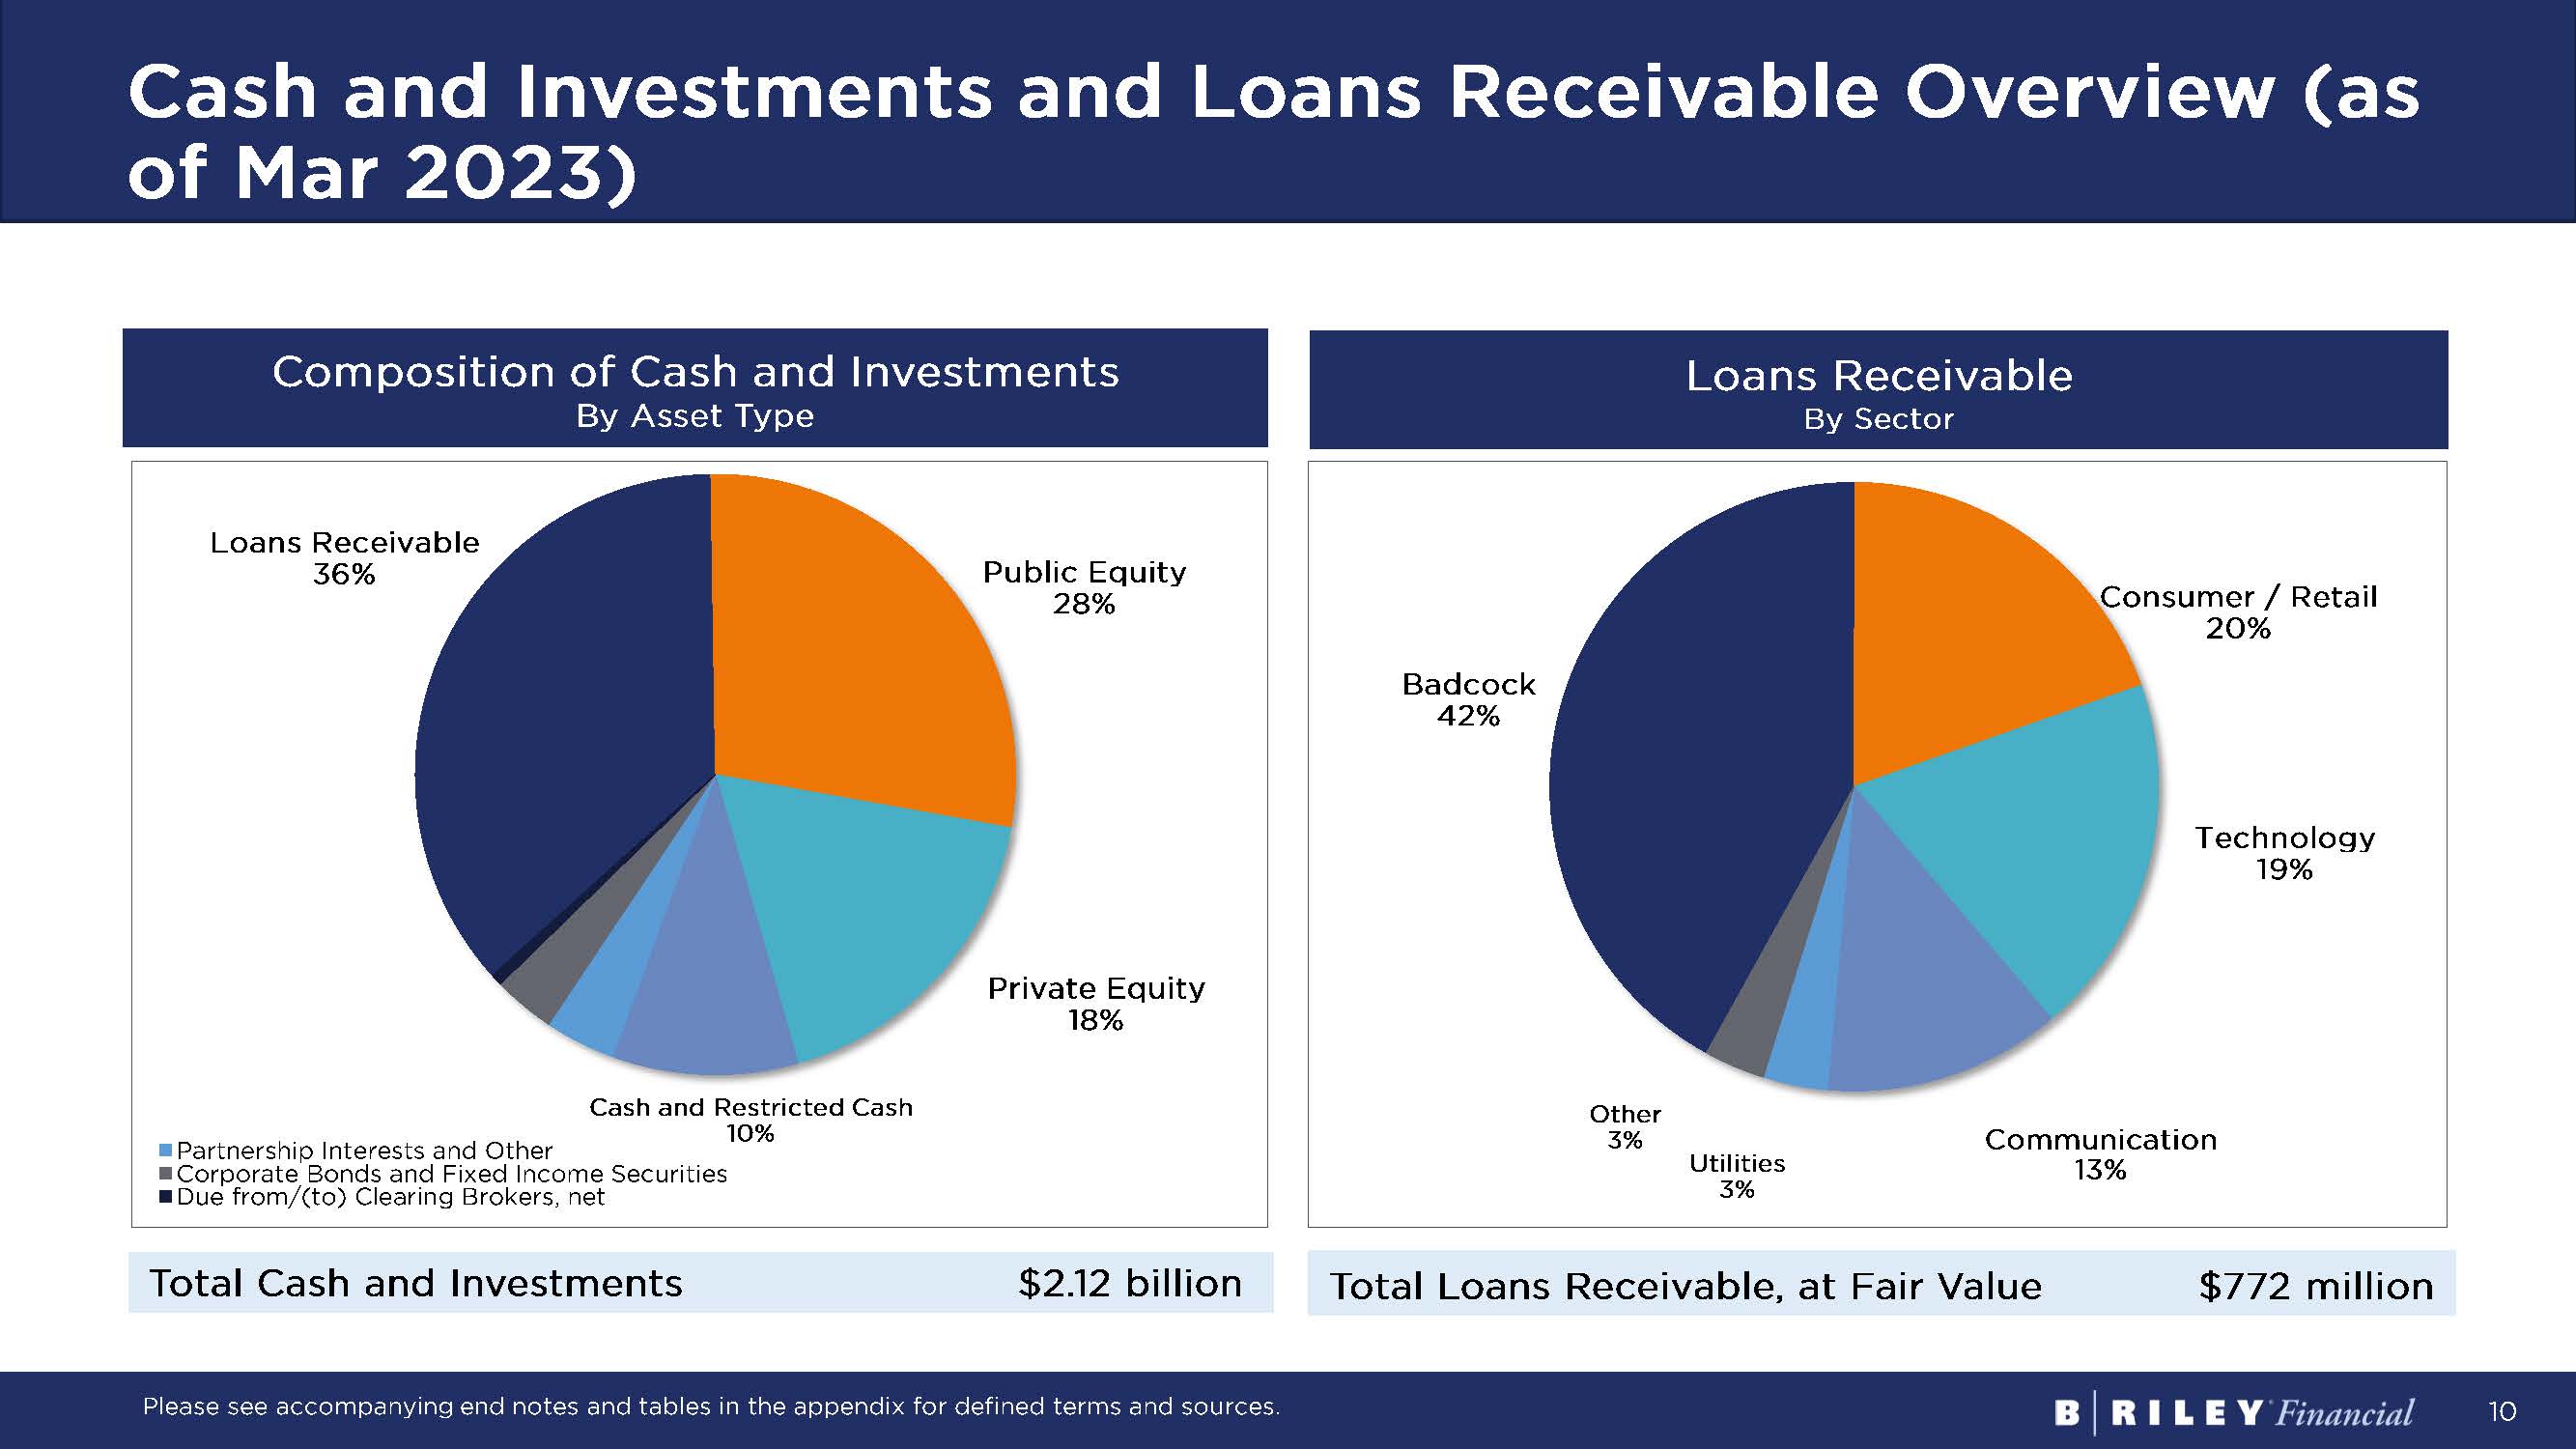
10 Cash and Investments and Loans Receivable Overview (as of Mar 2023) Composition of Cash and Investments By Asset Type Loans Receivable By Sector Loans Receivable 36% Public Equity 28% Private Equity 18% Cash and Restricted Cash 10% Partnership Interests and Other Corporate Bonds and Fixed Income Securities Please see accompanying end notes and tables in the appendix for defined terms and sources. Badcock 42% Consumer / Retail 20% Technology 19% Communication 13% Utilities 3% Other 3% Total Cash and Investments $2.12 billion Total Loans Receivable, at Fair Value $772 million
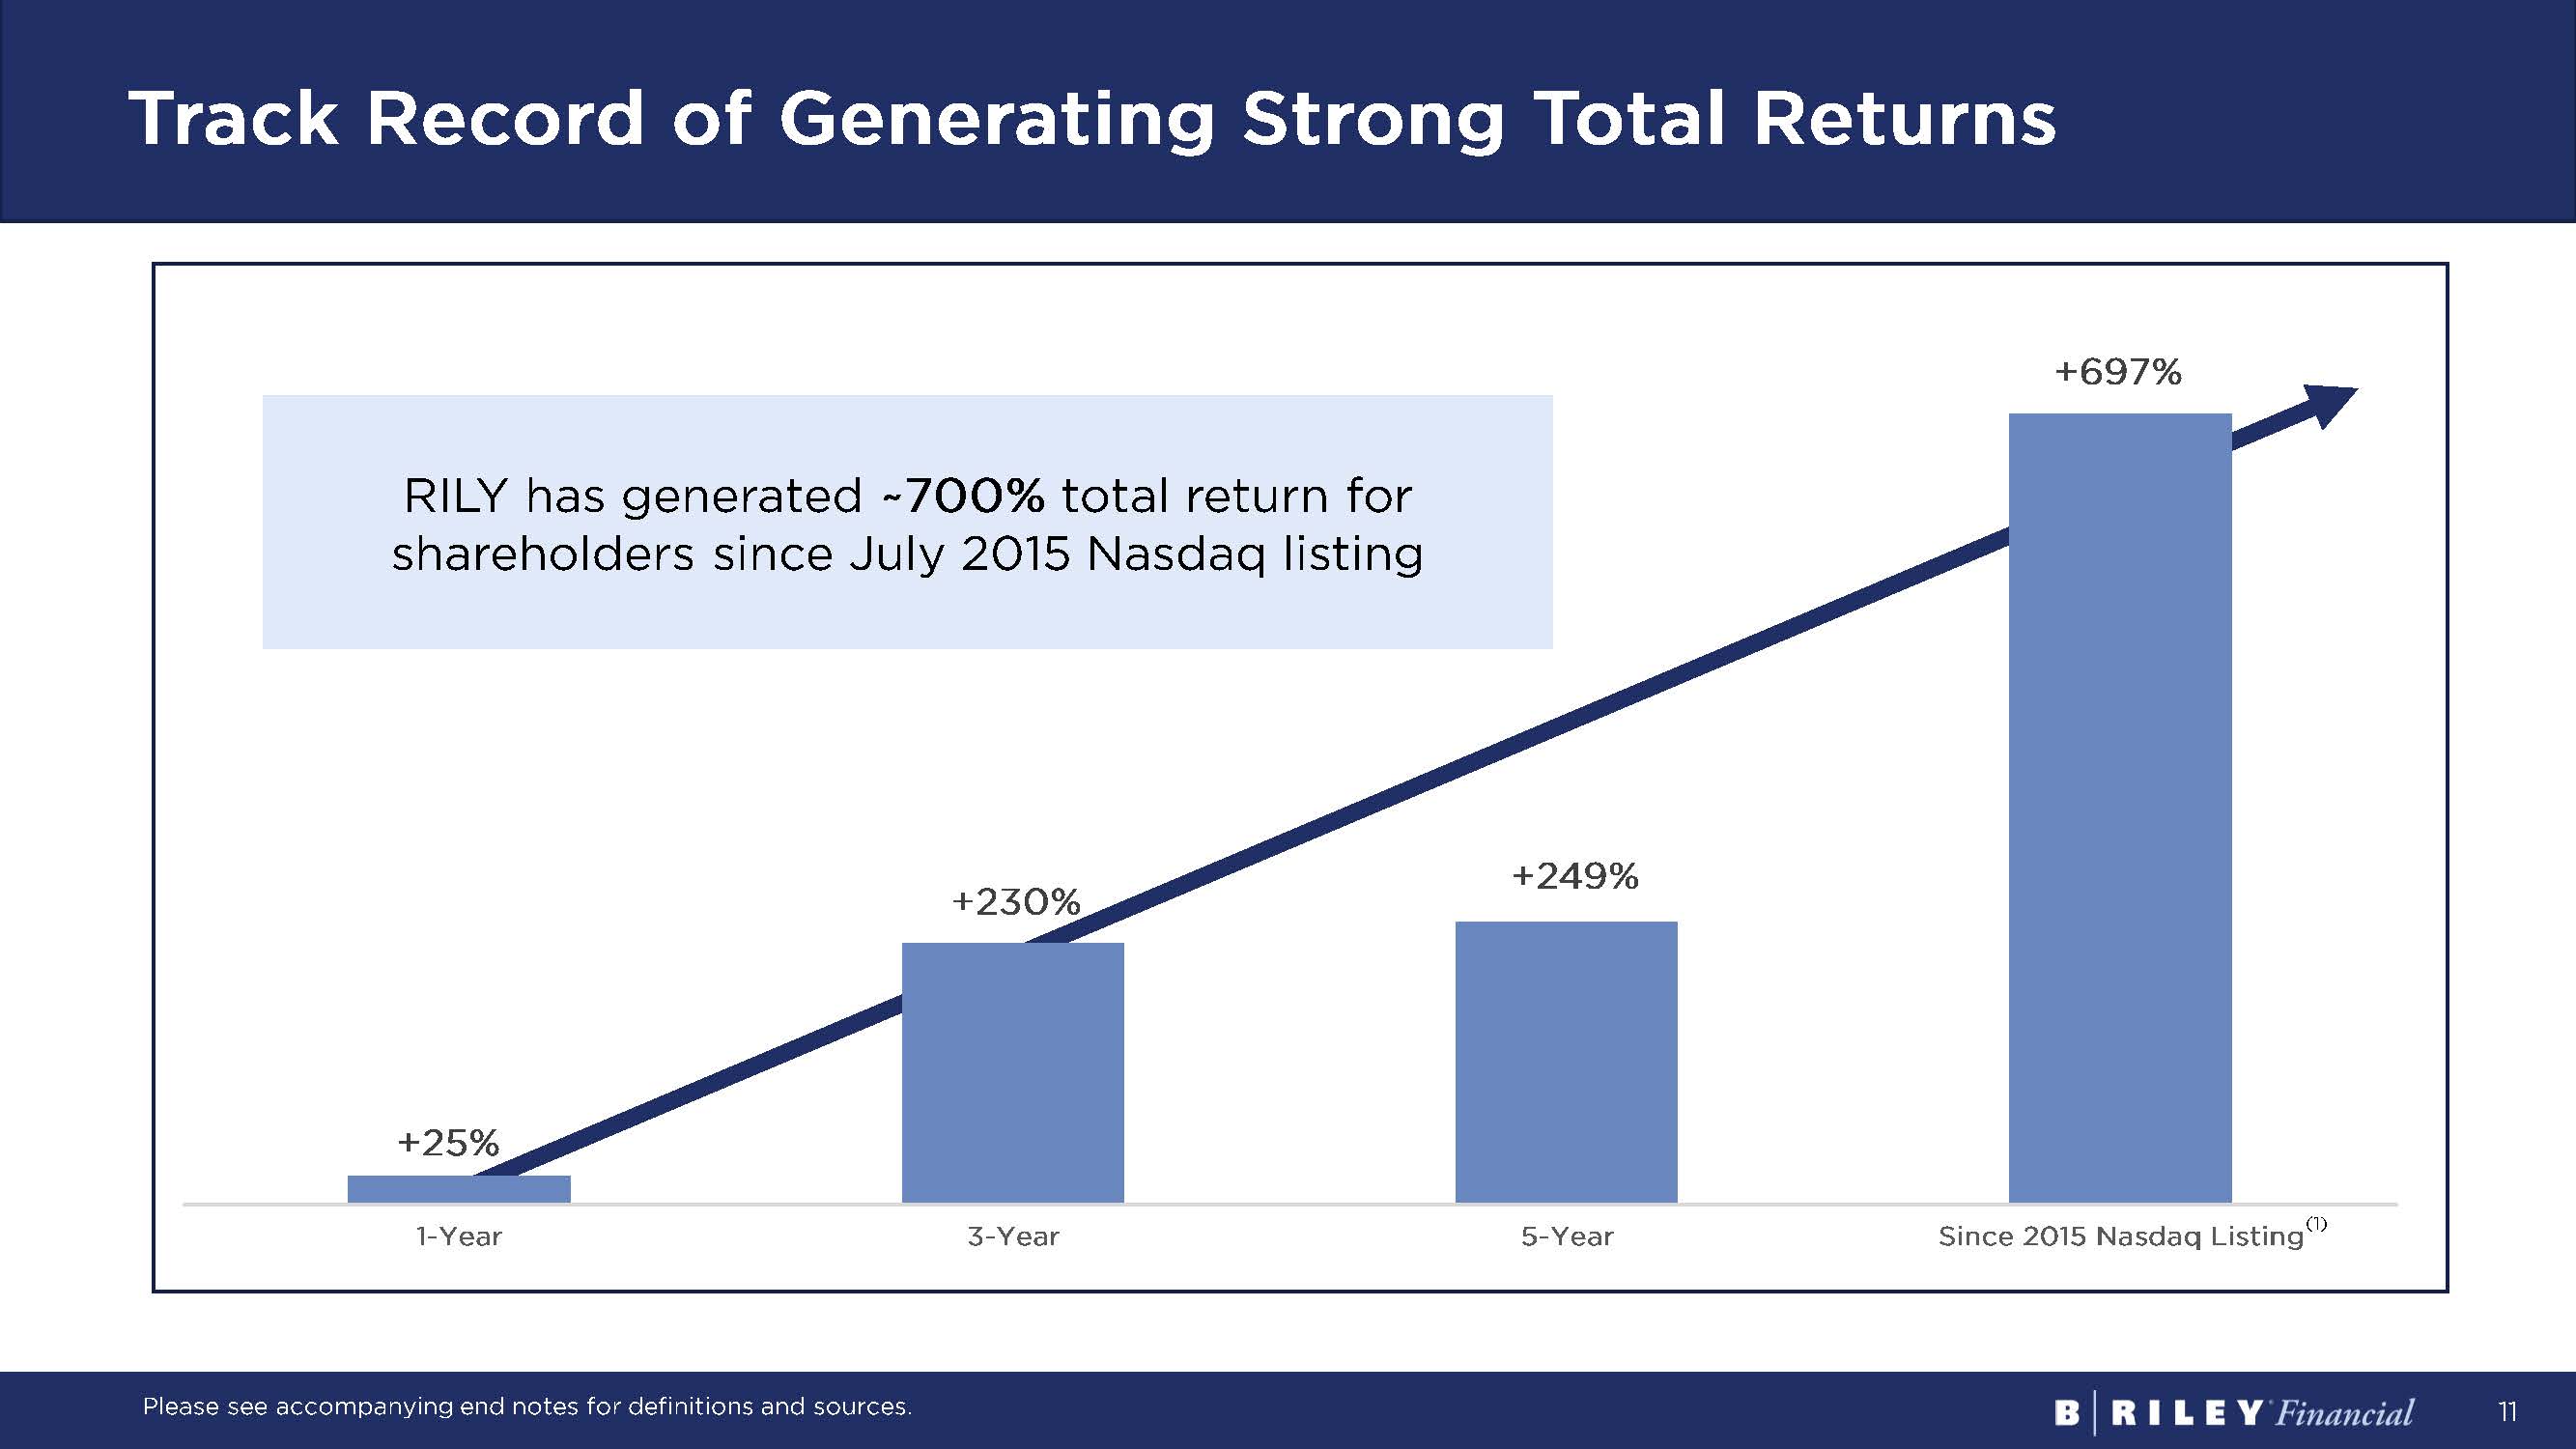
11 Track Record of Generating Strong Total Returns Please see accompanying end notes for definitions and sources. + 25% + 230% + 249% + 697% 1-Year 3-Year 5-Year Since 2015 Nasdaq Listing (1) RILY has generated ~700% total return for shareholders since July 2015 Nasdaq listing

12 03 OVERVIEW OF OPERATING UNITS

13 Click to edit Master title style Click to edit Master text styles Second level Third level Fourth level Fifth level Over 1,000 Institutional Client Relationships Over 1,500 Appraisals Completed/year Over 2,500 Retail Store Closures since 2020 Over 400 Companies Covered by Equity Research Over 400 Financial Advisors and Registered Reps 500 Average Advisory Matters/year Figures noted are approximations based upon the latest available data.
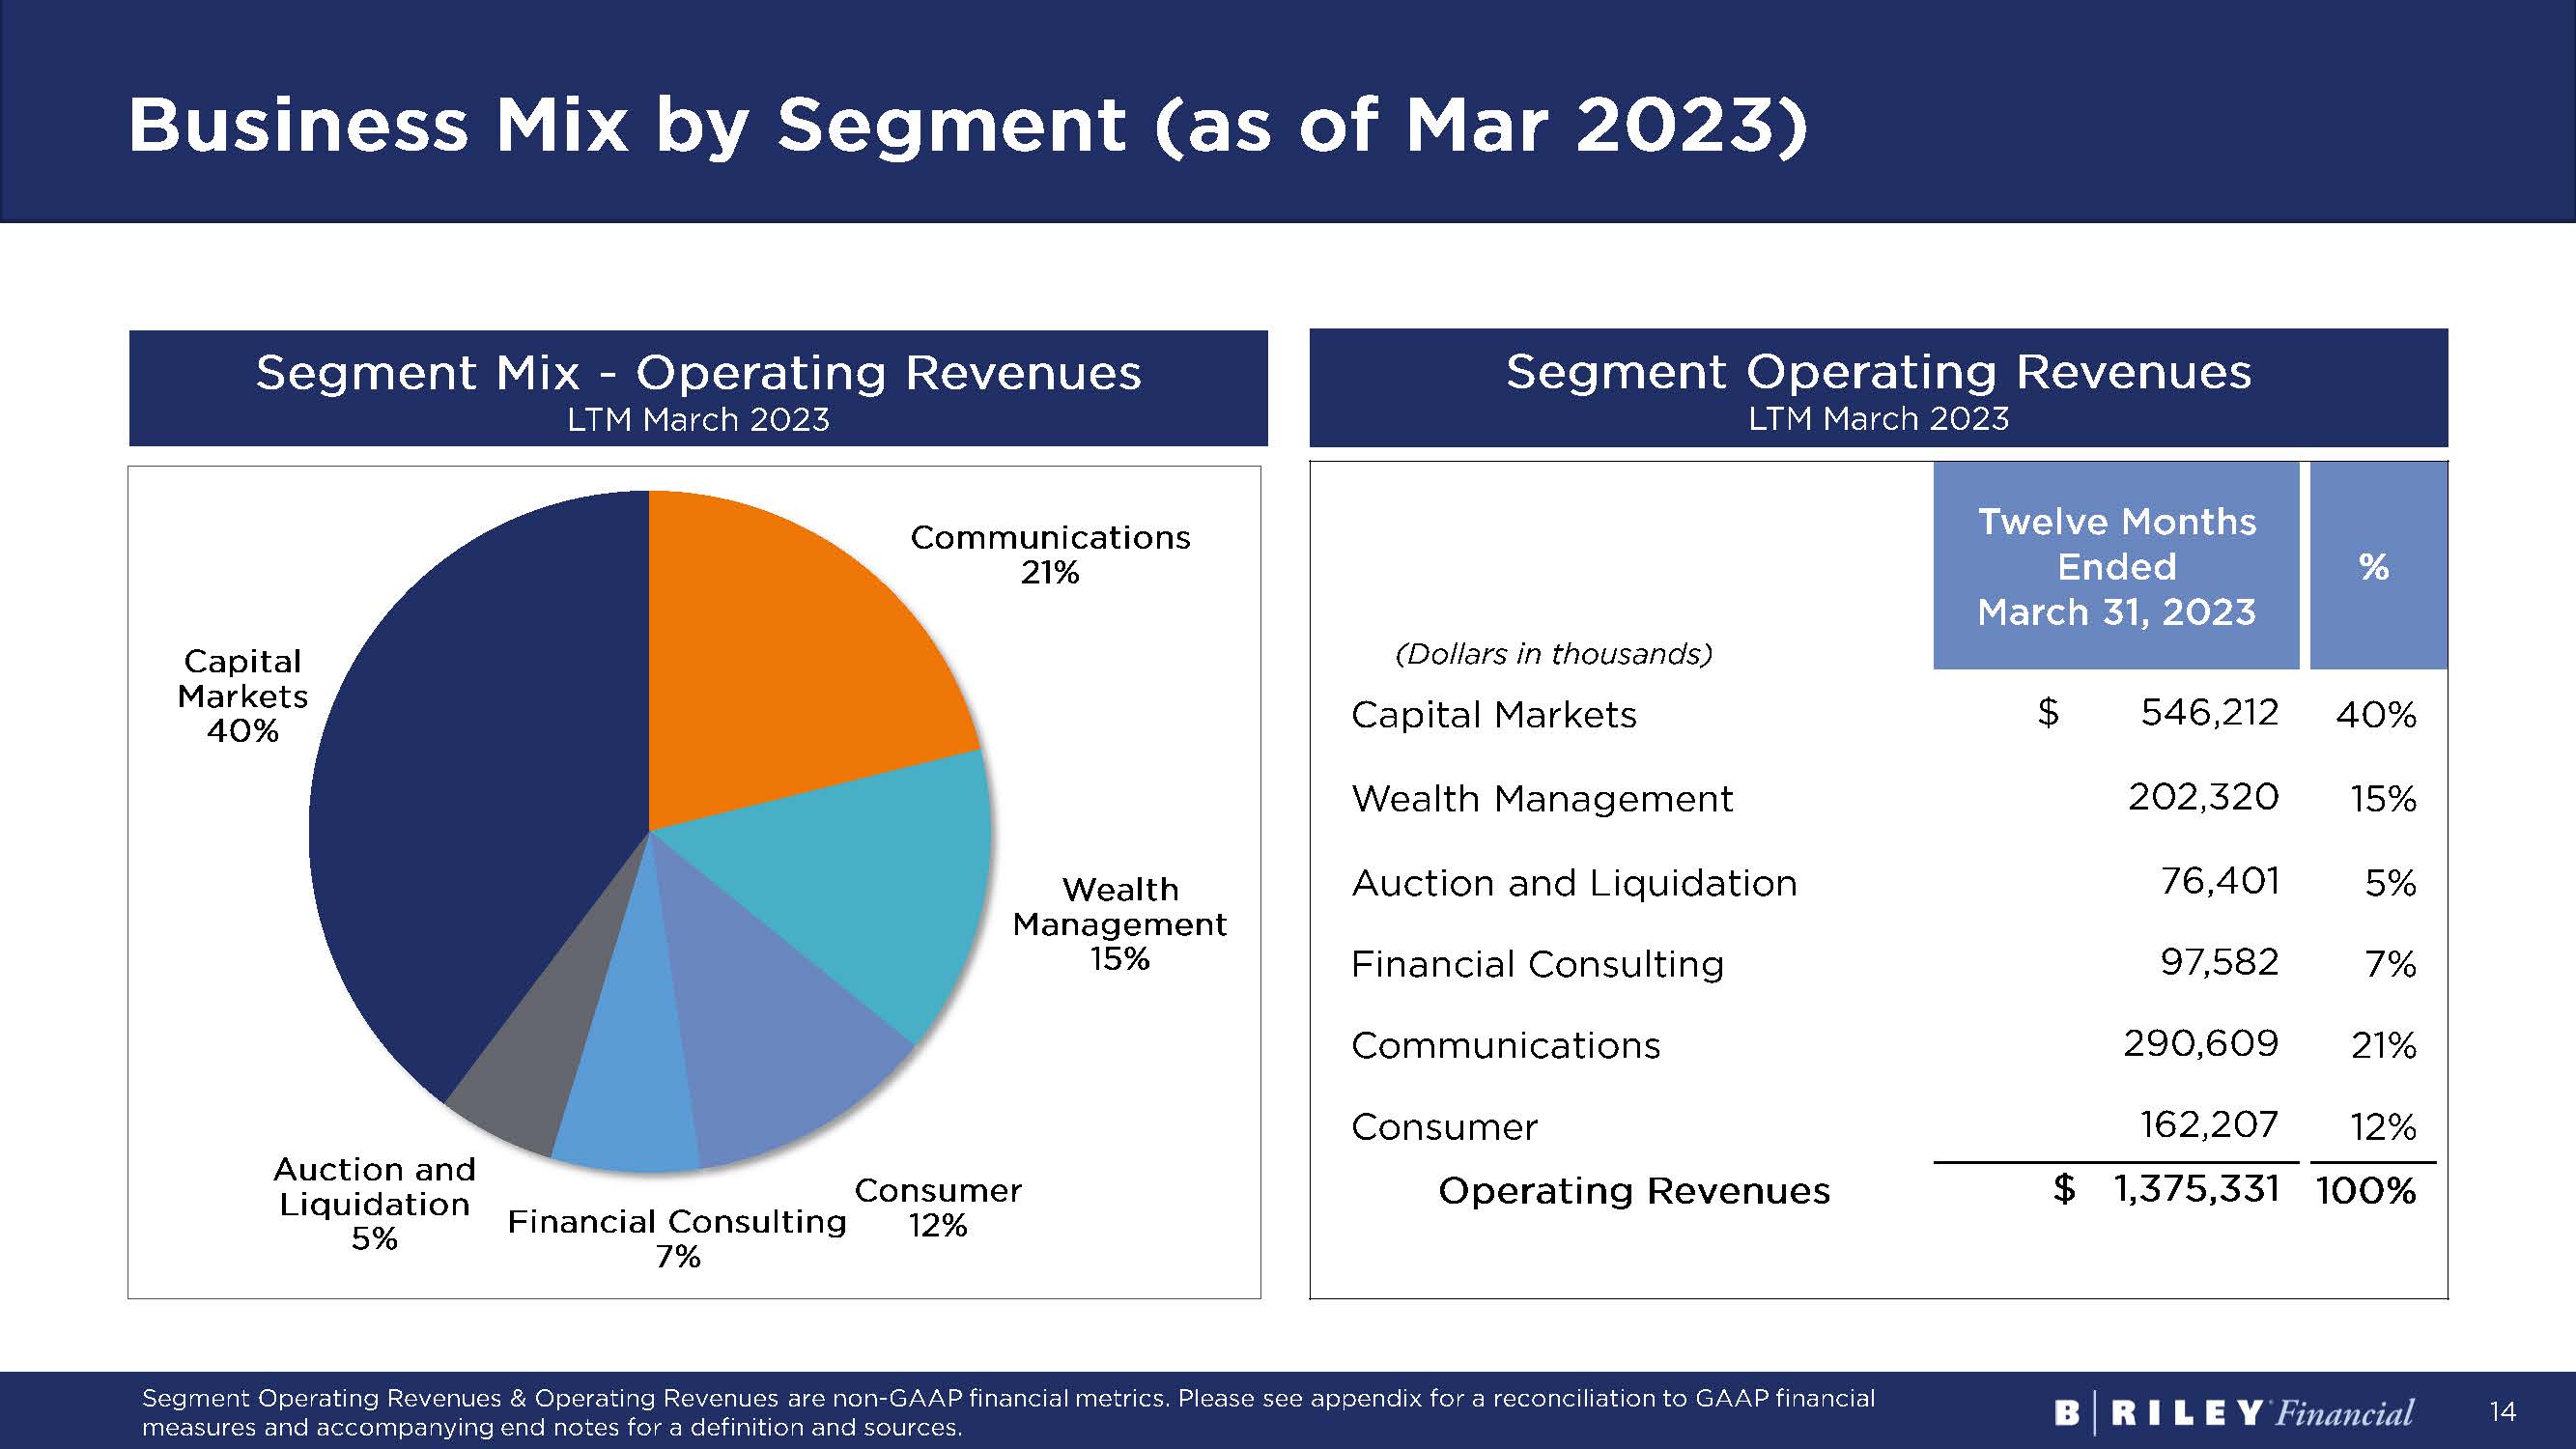
14 Business Mix by Segment (as of Mar 2023) Capital Markets 40% Communications 21% Wealth Management 15% Consumer 12% Financial Consulting 7% Auction and Liquidation 5% Segment Operating Revenues LTM March 2023 Segment Mix - Operating Revenues LTM March 2023 (Dollars in thousands) Twelve Months Ended March 31, 2023 % Capital Markets $ 546,212 40% Wealth Management 202,320 15% Auction and Liquidation 76,401 5% Financial Consulting 97,582 7% Communications 290,609 21% Consumer 162,207 12% Operating Revenues $ 1,375,331 100% Segment Operating Revenues & Operating Revenues are non - GAAP financial metrics. Please see appendix for a reconciliation to GAAP financial measures and accompanying end notes for a definition and sources.

15 Equity Capital Markets | Debt Capital Markets By the Numbers Trailing 3 Years #2 Sales agent in at - the - market offerings (3) Led 35+ Unsecured notes and preferred equity offerings, raising ~ $3.2B Led 70+ IPOs and follow - ons, raising ~ $6.8B (1) #1 Small - cap bookrunner outside “bulge brackets” (2) Leading Middle - Market Capital Markets Platform Please see accompanying end notes for sources.

16 Capital Markets Equity Capital Markets Debt Capital Markets Mergers & Acquisitions We help clients seize opportunities and solve complex capital structure challenges Sell - Side Representation Buy - Side Representation Restructuring Financial & Debt Advisory Distressed M&A Investment Banking

17 Provides comprehensive financial planning, investment advisory, portfolio management, and tax preparation services to individuals, corporations and non - profits. Wealth Management Enhanced Distribution through Dedicated Wealth Management Channel Financial Advisors and Registered Reps Client Assets under Management 400+ $24B Figures noted are approximations based upon the latest available data.

18 Financial Consulting “Best Of 2023” Ranking National Law Journal #1 End - to - End Litigation Consulting Firm #1 Forensic Accounting #1 IP Litigation Consulting #1 Litigation Dispute Advisory “Best of 2022” Ranking The Daily Report (Law.com) #1 Litigation Valuation #2 Forensic Accounting Firm #2 Overall Expert Witness 2023 Most Innovative ABF Journal Most Innovative Companies in Specialty Finance: Transformative Category 2023 Turnaround Awards The M&A Advisor Sec. 363 Sale of the Year ($50M - $100M) 2022 Turnaround Awards The M&A Advisor Distressed M&A Deal of the Year ($25M - $50M) Representative Awards and Accolades Financial Consulting: Specialty Advisory Restructuring & Turnaround Management ▪ Financial & Operational Restructuring ▪ Financial Advisory, Fiduciary Services ▪ Receivership , Liquidating Agent ▪ Turnaround & Interim Management Forensic & Litigation Support ▪ Complex Litigation, Contract Disputes ▪ Data Analytics ▪ Expert Witness Testimony ▪ Fraud & Forensic Investigations ▪ Lost Profits & Financial Damages Provides Specialty Financial Advisory Services to Solve Complex Business Problems
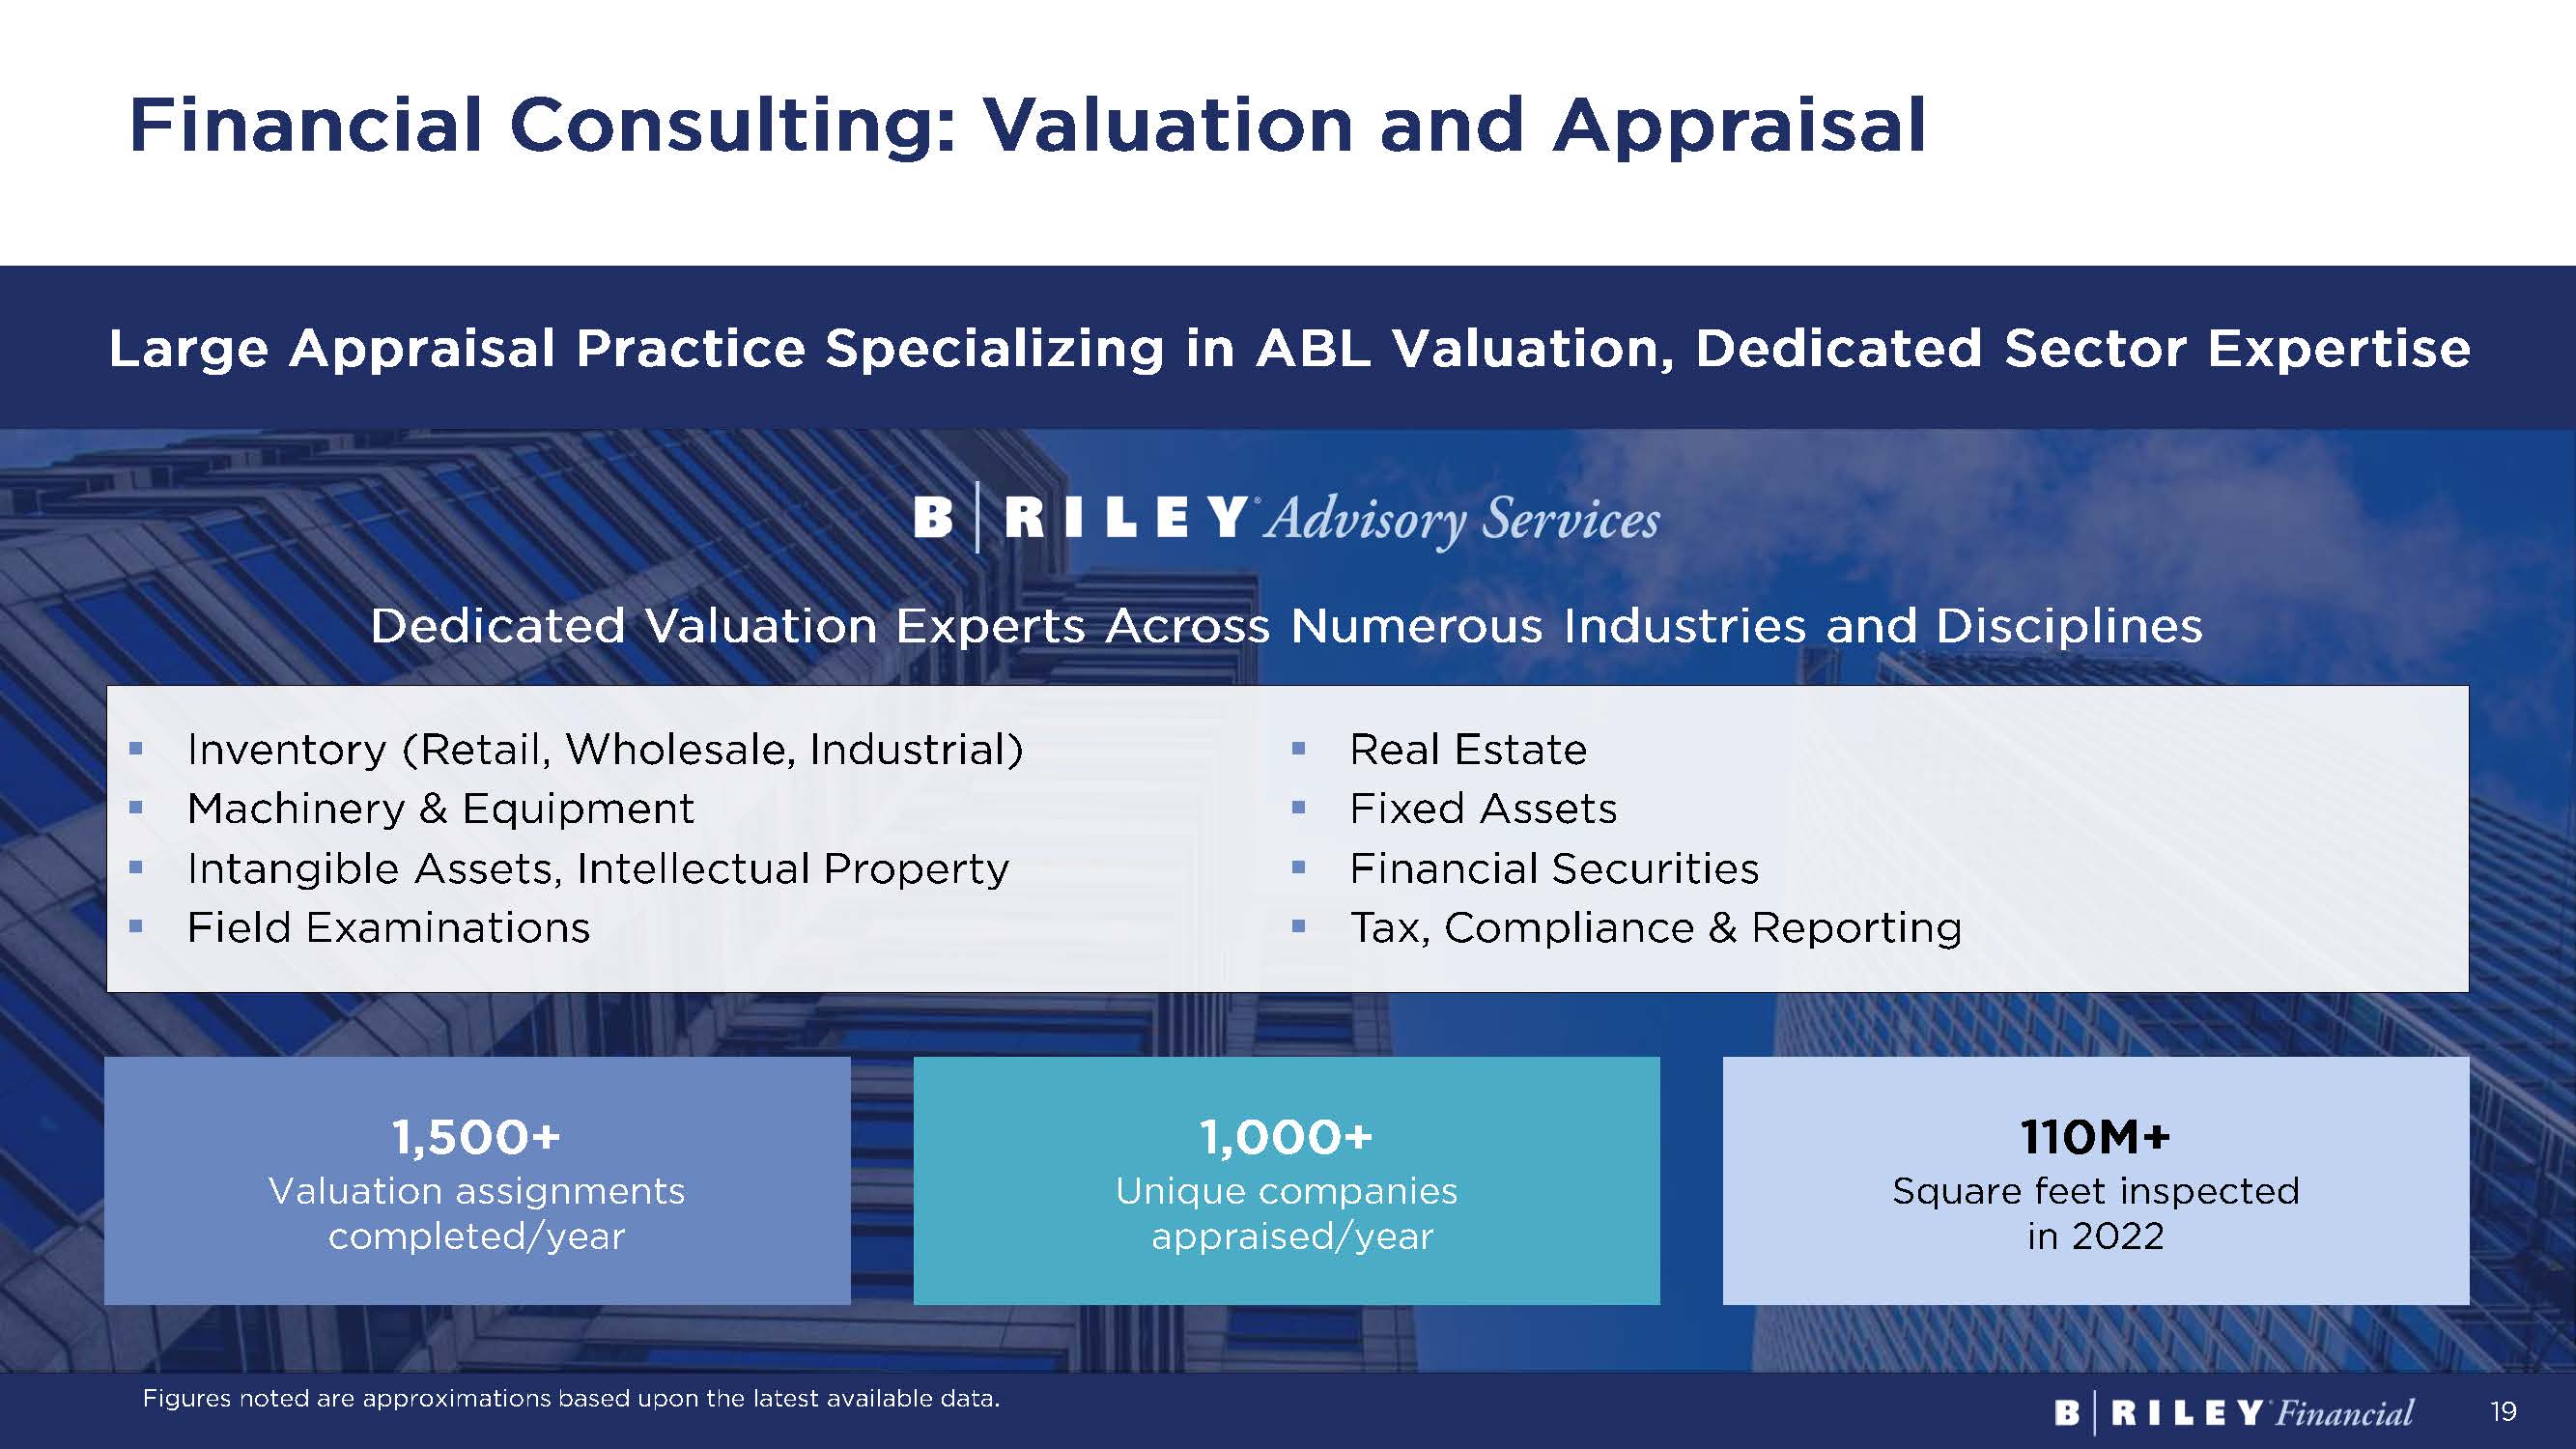
19 Retail Liquidation Financial Consulting: Valuation and Appraisal 1,000+ Unique companies a ppraised/year 1,500+ Valuation assignments completed/year 110M+ Square feet inspected in 2022 ▪ Inventory (Retail, Wholesale, Industrial) ▪ Machinery & Equipment ▪ Intangible Assets, Intellectual Property ▪ Field Examinations ▪ Real Estate ▪ Fixed Assets ▪ Financial Securities ▪ Tax, Compliance & Reporting Dedicated Valuation Experts Across Numerous Industries and Disciplines Large Appraisal Practice Specializing in ABL Valuation, Dedicated Sector Expertise Figures noted are approximations based upon the latest available data.

20 Retail Liquidation Representative Client Engagements Over $ 4B Total value of assets liquidated since 2020 Over 2,500 S tore closures conducted since 2020 Over $ 45B R etail inventory liquidated since inception Retail Liquidation Figures noted are approximations based upon the latest available data.
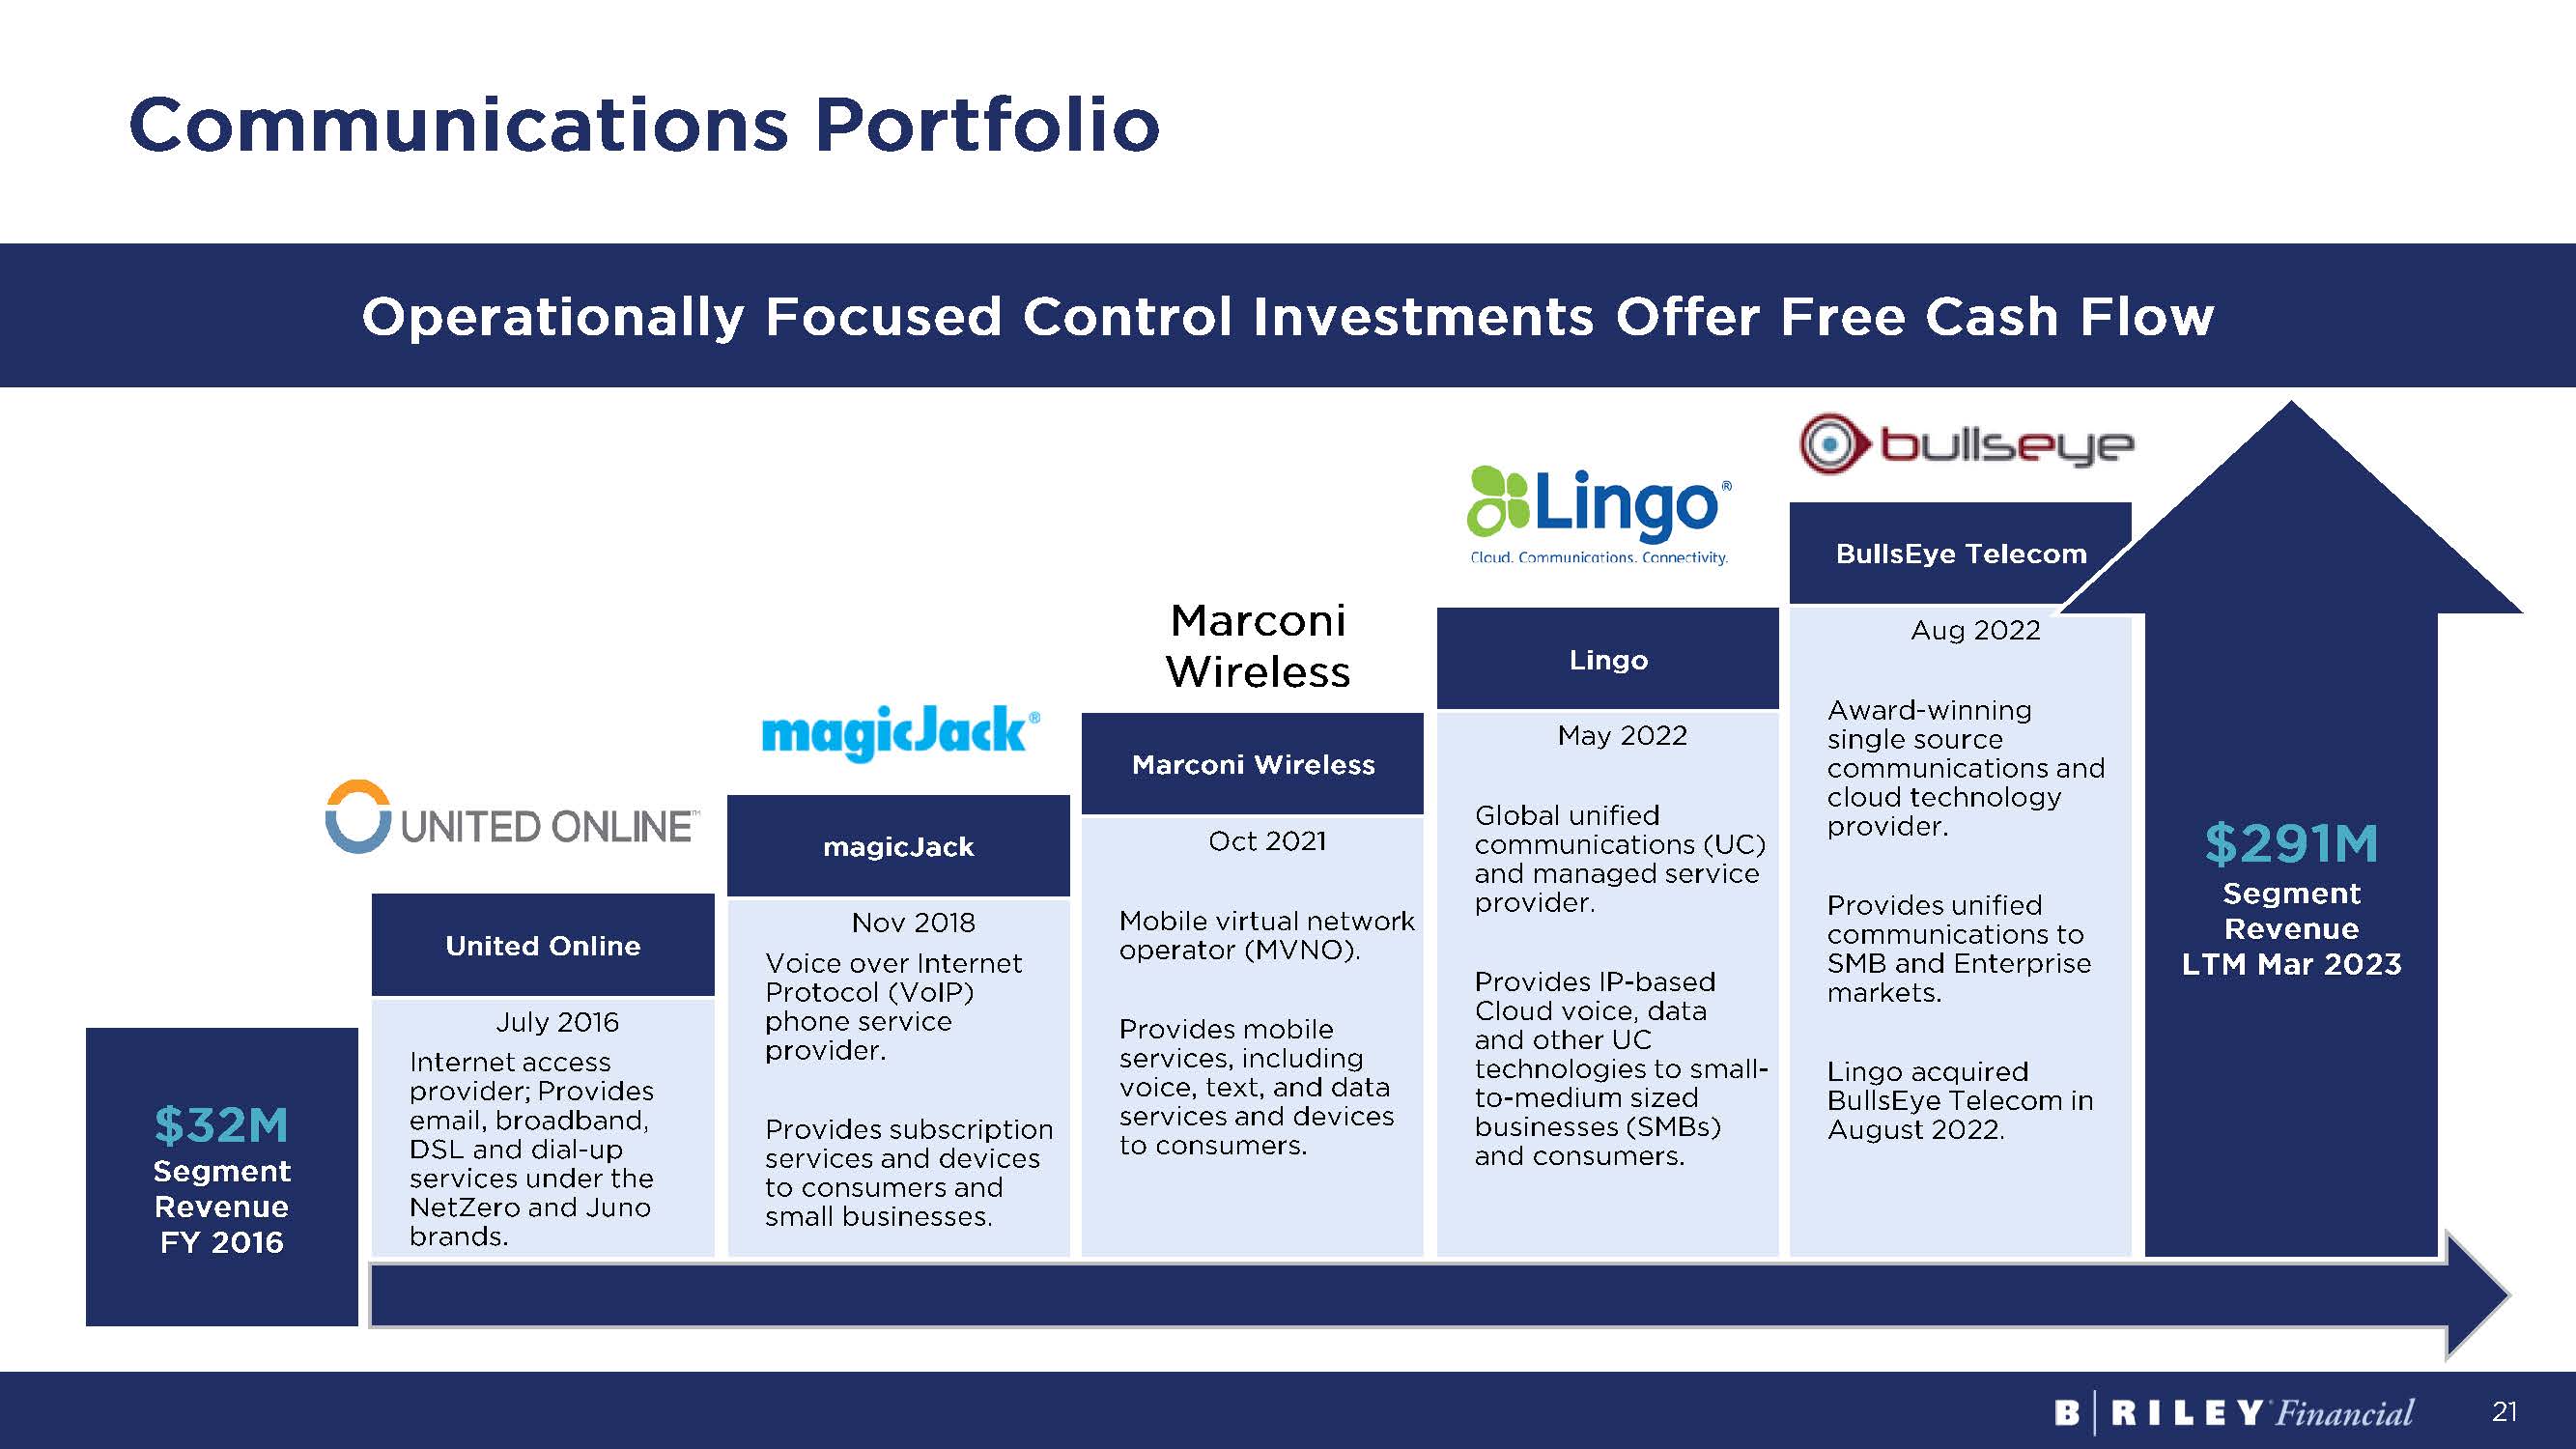
21 Communications Portfolio Marconi Wireless magicJack United Online July 2016 Internet access provider; Provides email, broadband, DSL and dial - up services under the NetZero and Juno brands. Nov 2018 Voice over Internet Protocol (VoIP) phone service provider. Provides subscription services and devices to consumers and small businesses. Oct 2021 Mobile virtual network operator (MVNO ). Provides mobile services, including voice, text, and data services and devices to consumers. Aug 2022 A ward - winning single source communications and cloud technology provider. Provides unified communications to SMB and Enterprise markets. Lingo acquired BullsEye Telecom in August 2022. $32M Segment Revenue FY 2016 Lingo May 2022 Global unified communications (UC) and managed service provider. Provides IP - based Cloud voice, data and other UC technologies to small - to - medium sized businesses (SMBs) and consumers. BullsEye Telecom $291M Segment Revenue LTM Mar 2023 Operationally Focused Control Investments Offer Free Cash Flow Marconi Wireless

22 Consumer Brand Investments Diverse Portfolio of Consumer Brands ▪ Acquired Targus in October 2022 ▪ Leading brand share in key product categories in the U.S. and abroad ▪ Serves Fortune 1000 companies with global footprint in 100 countries *Targus is a registered trademark of Targus International LLC in the U.S. and in certain other countries. Please see accompan yin g end notes for sources. ▪ Established Brands Portfolio in Q4 2019 ▪ Offers diversified revenue and cash flow through licensing of Six Brands ▪ Leverages retail expertise and brand management partnerships ▪ Additional consumer brands acquired between 2018 and 2023 ▪ Generate additional income from these brand investments ▪ Recognized outside of Consumer Segment in Other Income 100% ownership 80% ownership 43% ownership 41% ownership 40% ownership 10% ownership
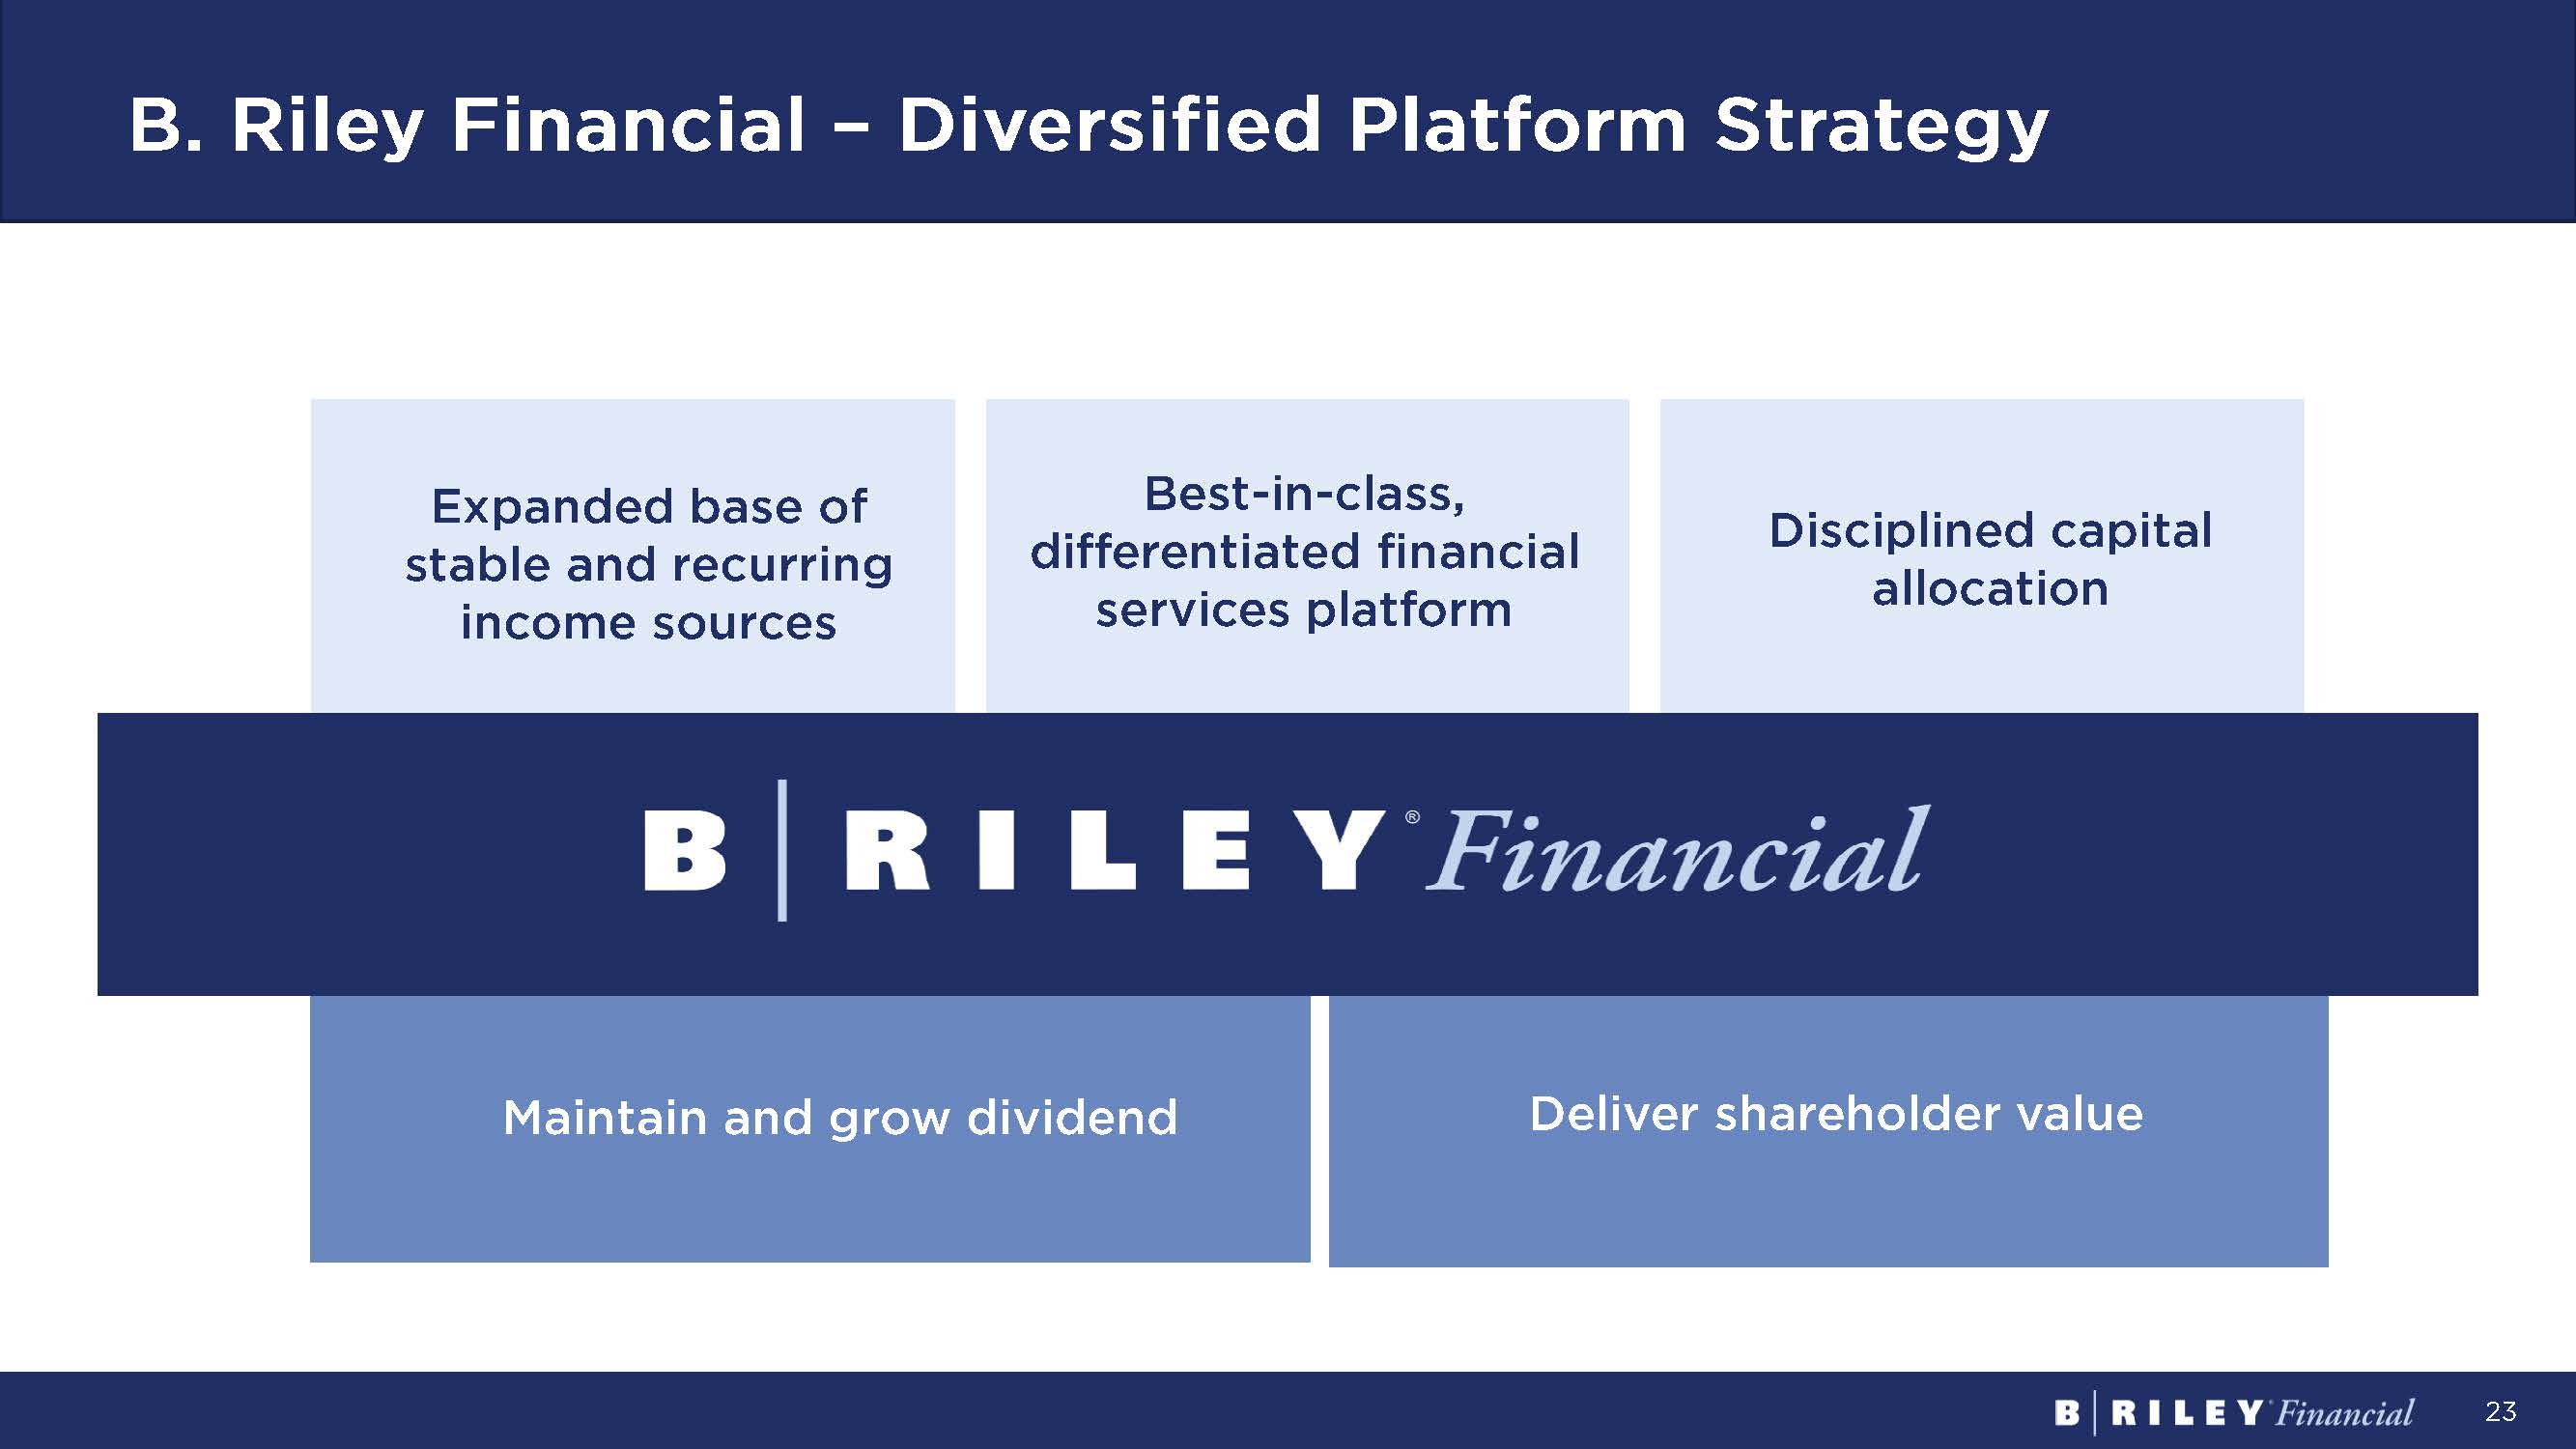
23 B. Riley Financial – Diversified Platform Strategy Expanded base of stable and recurring income sources Best - in - class, differentiated financial services platform Disciplined capital allocation Maintain and grow dividend Deliver shareholder value

24 04 APPENDIX
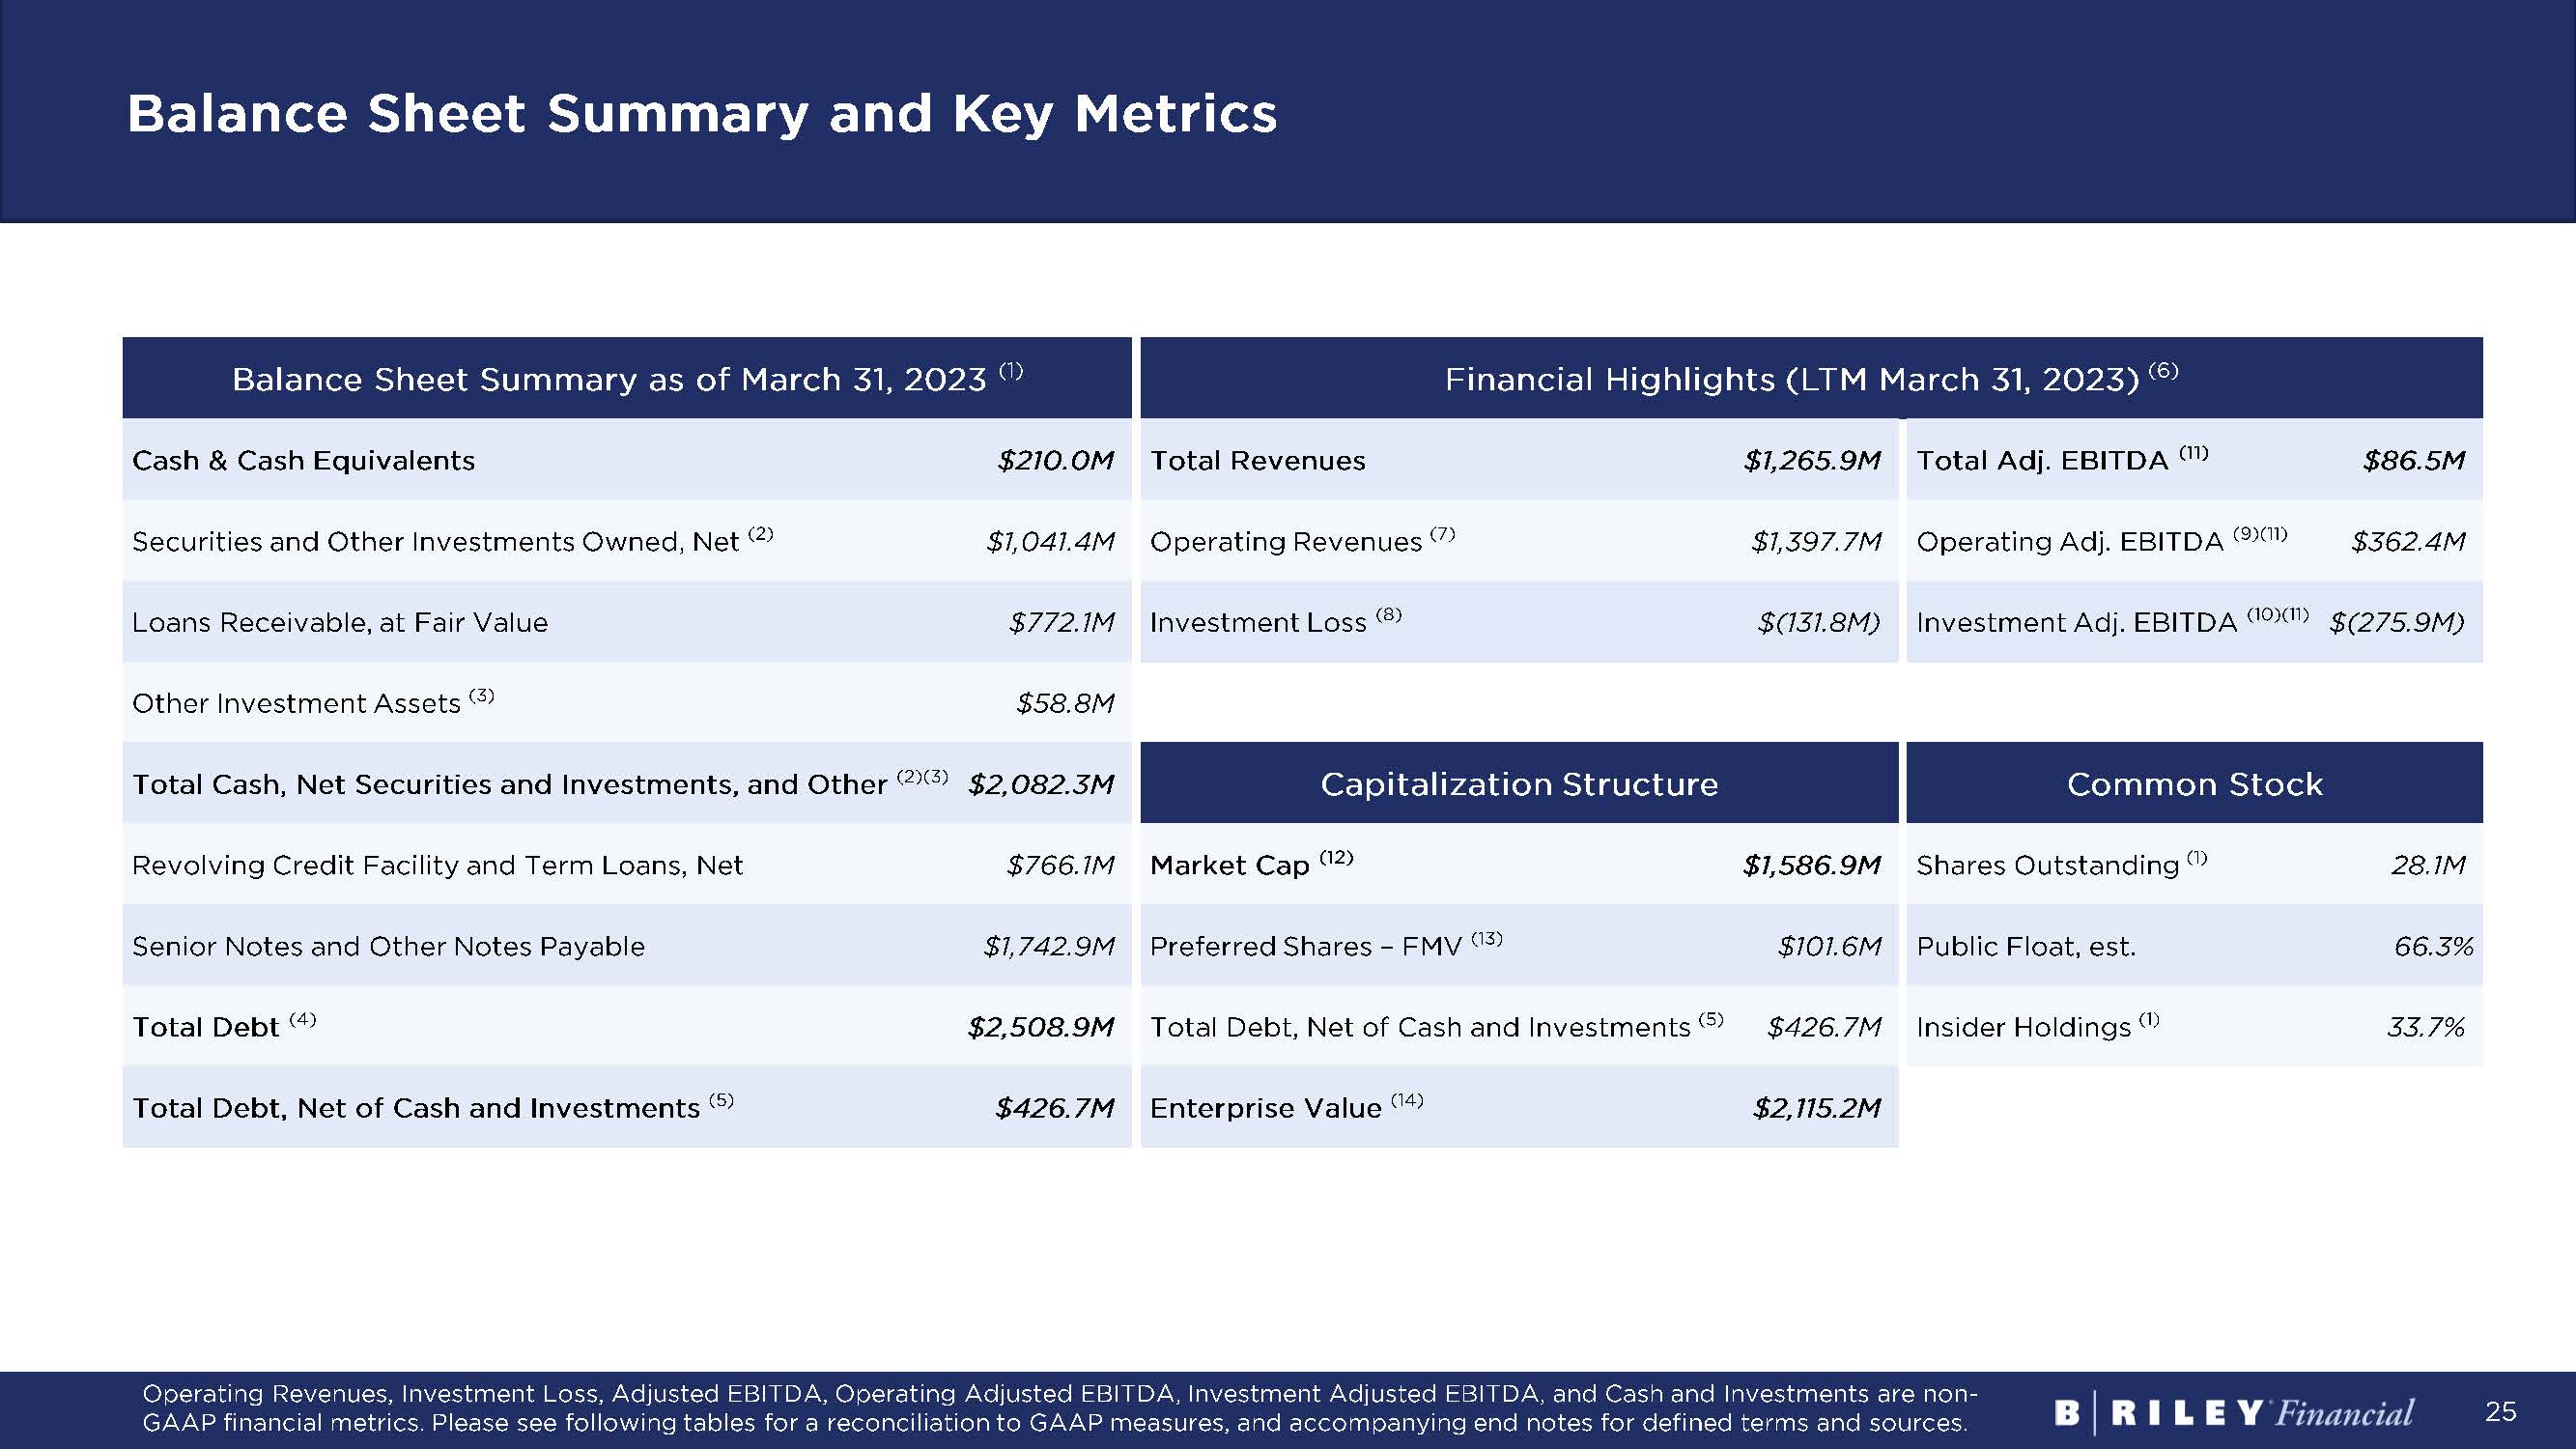
25 Balance Sheet Summary and Key Metrics Operating Revenues, Investment Loss, Adjusted EBITDA, Operating Adjusted EBITDA, Investment Adjusted EBITDA, and Cash and Inv est ments are non - GAAP financial metrics. Please see following tables for a reconciliation to GAAP measures, and accompanying end notes for defined terms and sources. Balance Sheet Summary as of March 31, 2023 (1) Financial Highlights (LTM March 31, 2023) (6) Cash & Cash Equivalents $210.0M Total Revenues $1,265.9M Total Adj. EBITDA (11) $86.5M Securities and Other Investments Owned, Net (2) $1,041.4M Operating Revenues (7) $1,397.7M Operating Adj. EBITDA (9)(11) $362.4M Loans Receivable, at Fair Value $772.1M Investment Loss (8) $(131.8M) Investment Adj. EBITDA (10)(11) $(275.9M) Other Investment Assets (3) $58.8M Total Cash, Net Securities and Investments, and Other (2)(3) $2,082.3M Capitalization Structure Common Stock Revolving Credit Facility and Term Loans, Net $766.1M Market Cap (12) $1,586.9M Shares Outstanding (1) 28.1M Senior Notes and Other Notes Payable $1,742.9M Preferred Shares – FMV (13) $101.6M Public Float, est. 66.3% Total Debt (4) $2,508.9M Total Debt, Net of Cash and Investments (5) $426.7M Insider Holdings (1) 33.7% Total Debt, Net of Cash and Investments (5) $426.7M Enterprise Value (14) $2,115.2M
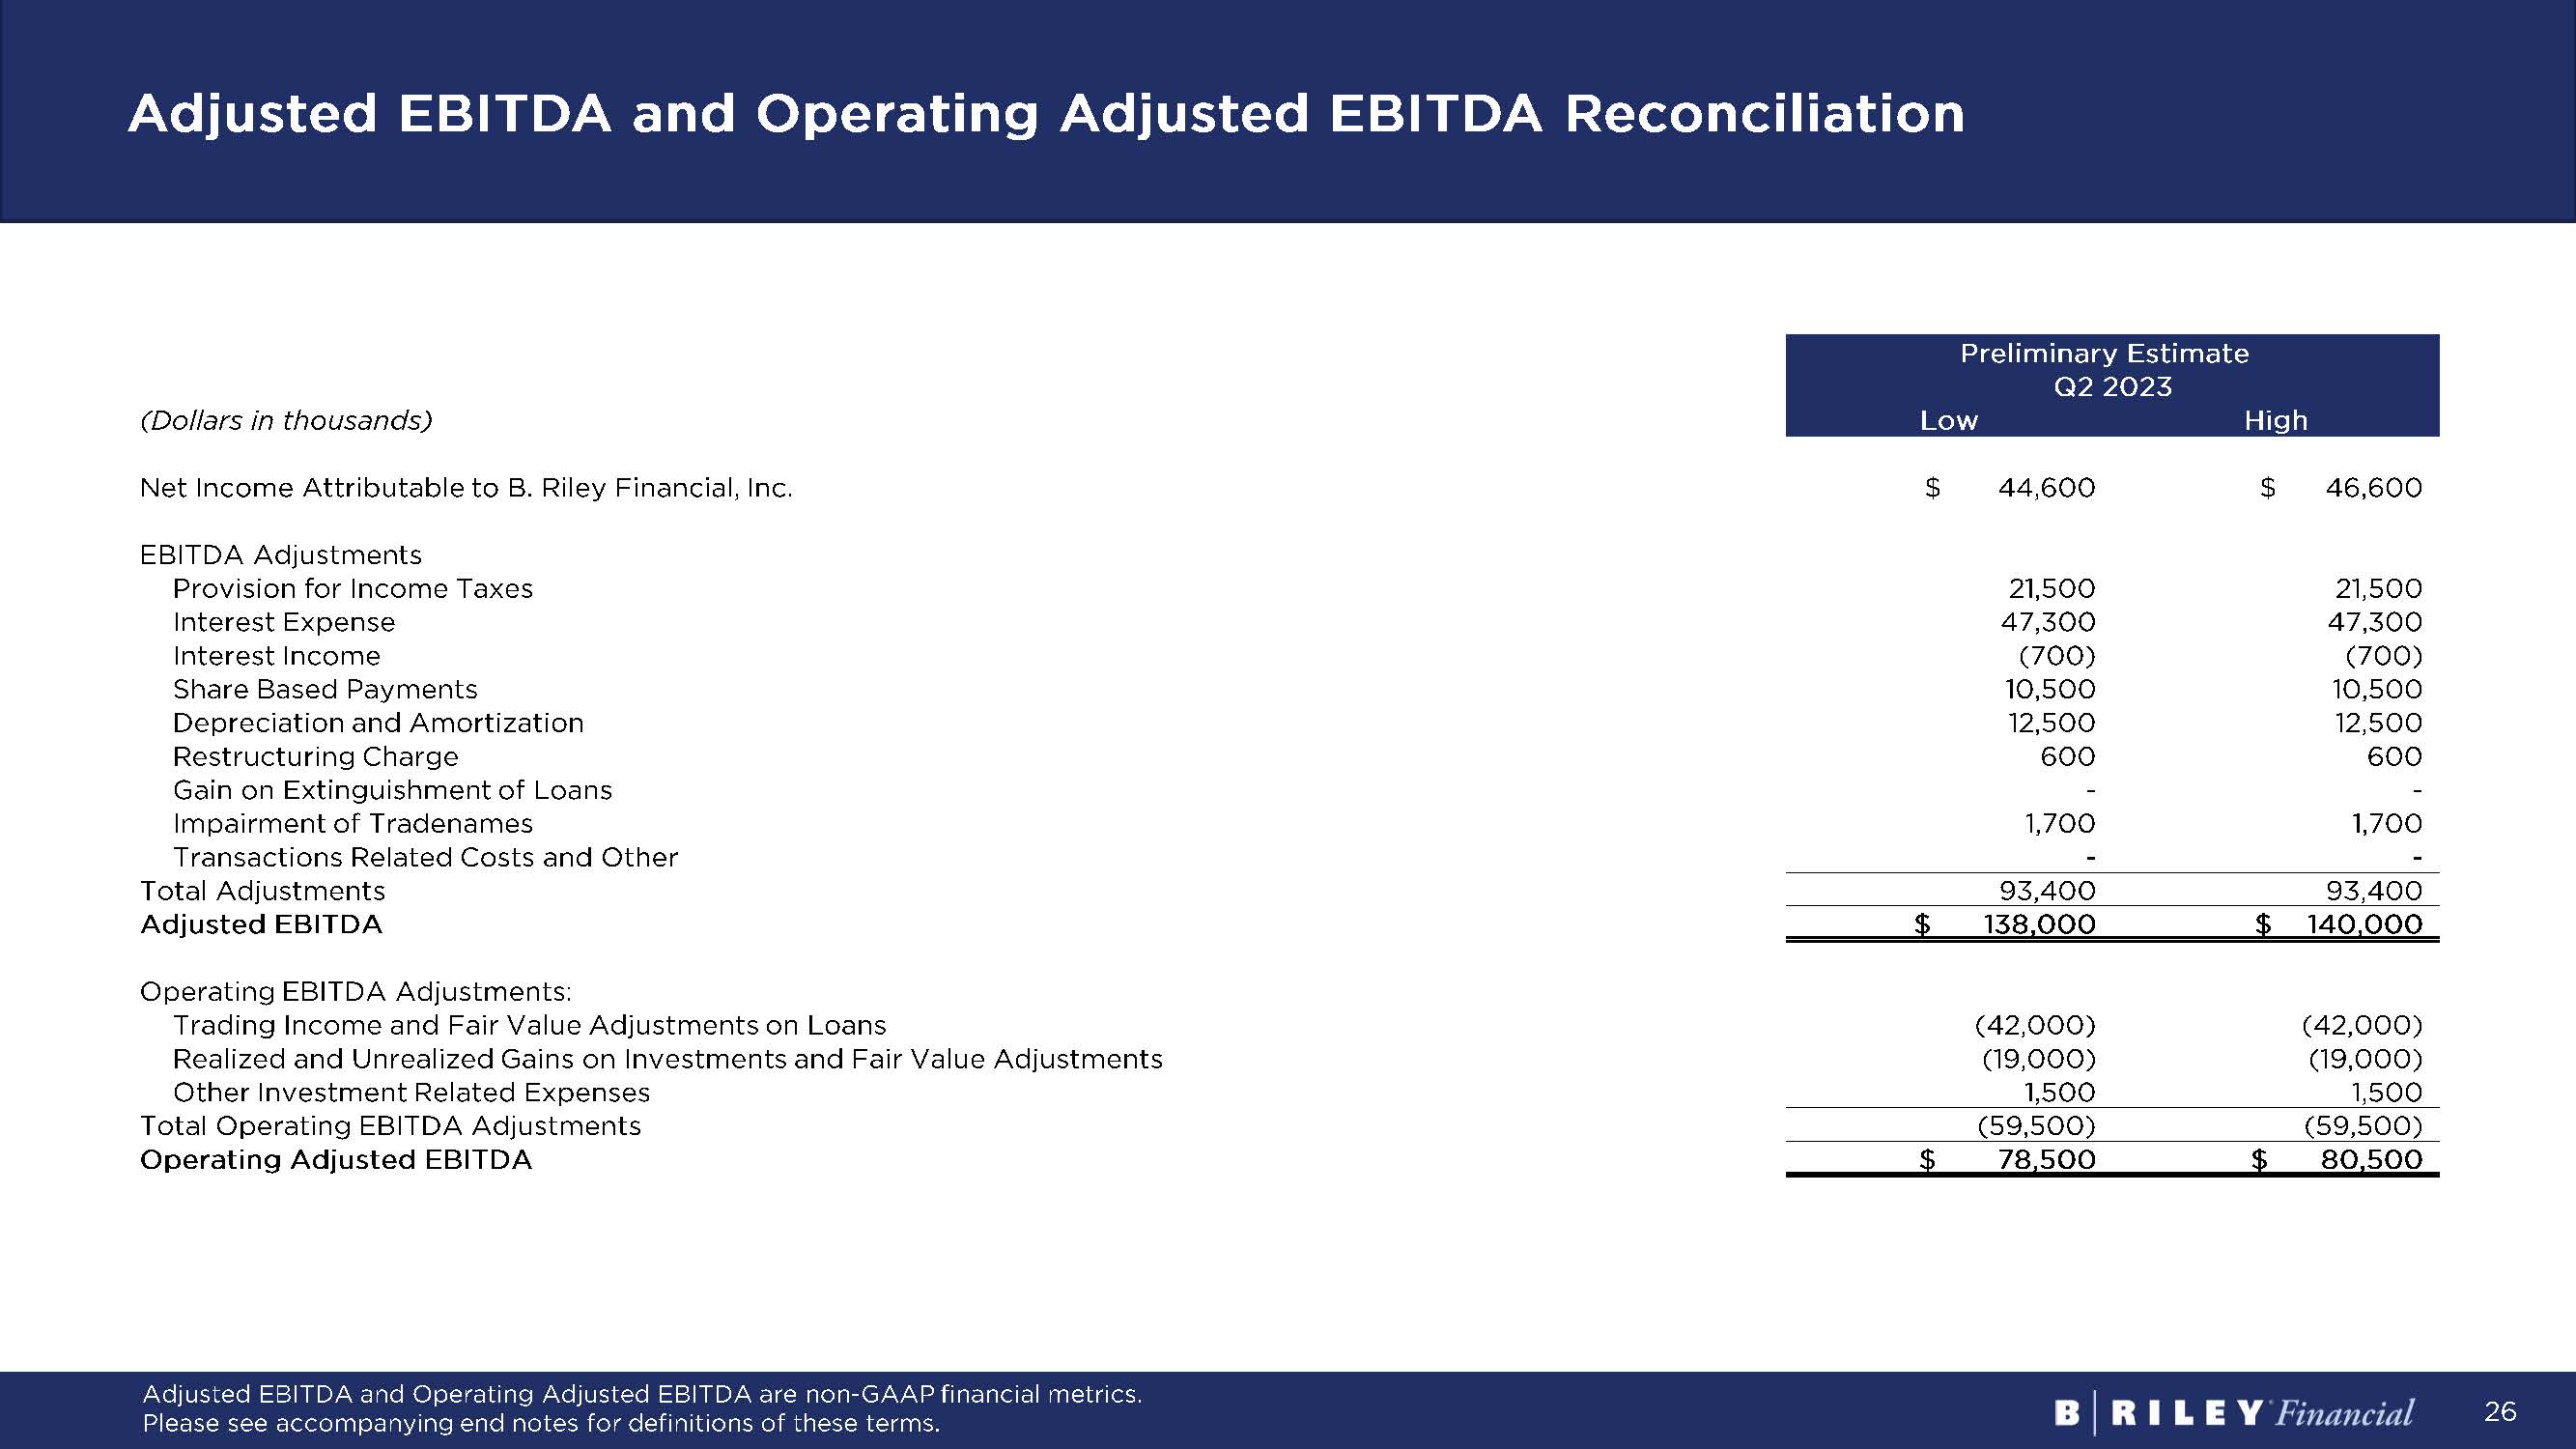
26 Adjusted EBITDA and Operating Adjusted EBITDA Reconciliation Preliminary Estimate Q2 2023 (Dollars in thousands) Low High Net Income Attributable to B. Riley Financial, Inc. $ 44,600 $ 46,600 EBITDA Adjustments Provision for Income Taxes 21,500 21,500 Interest Expense 47,300 47,300 Interest Income (700) (700) Share Based Payments 10,500 10,500 Depreciation and Amortization 12,500 12,500 Restructuring Charge 600 600 Gain on Extinguishment of Loans - - Impairment of Tradenames 1,700 1,700 Transactions Related Costs and Other - - Total Adjustments 93,400 93,400 Adjusted EBITDA $ 138,000 $ 140,000 Operating EBITDA Adjustments: Trading Income and Fair Value Adjustments on Loans (42,000) (42,000) Realized and Unrealized Gains on Investments and Fair Value Adjustments (19,000) (19,000) Other Investment Related Expenses 1,500 1,500 Total Operating EBITDA Adjustments (59,500) (59,500) Operating Adjusted EBITDA $ 78,500 $ 80,500 Adjusted EBITDA and Operating Adjusted EBITDA are non - GAAP financial metrics. Please see accompanying end notes for definitions of these terms.
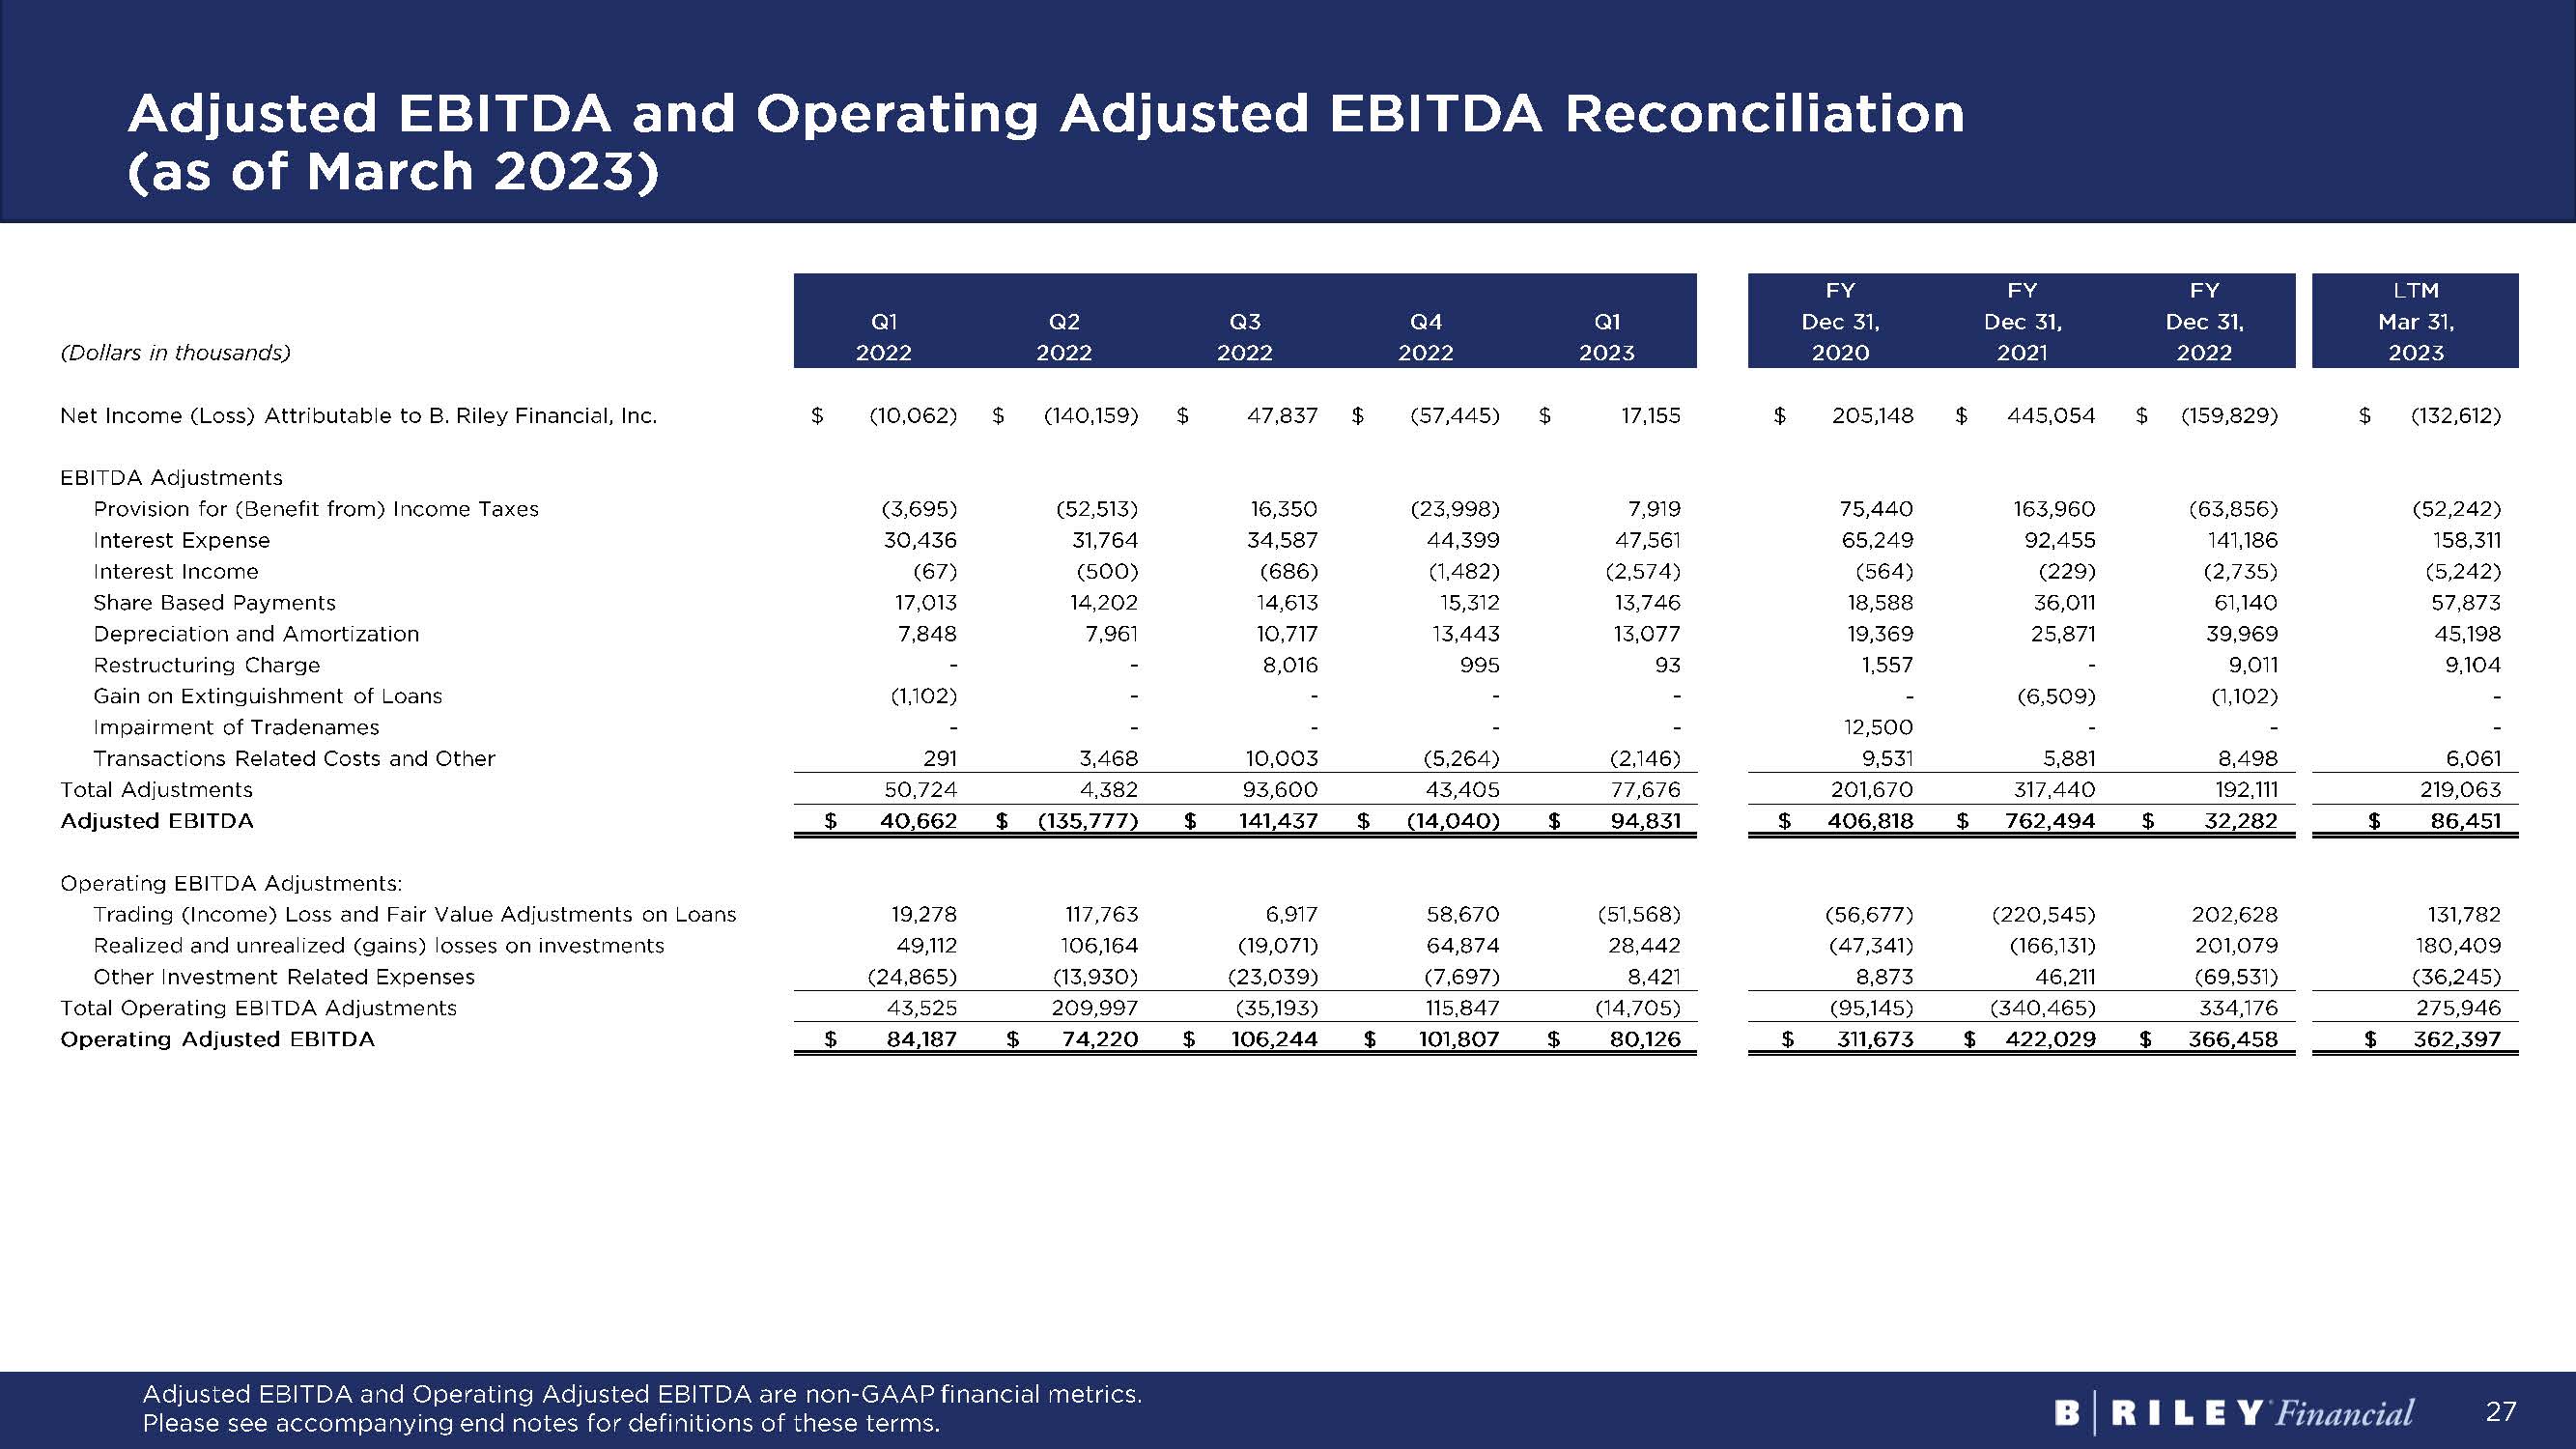
27 Adjusted EBITDA and Operating Adjusted EBITDA Reconciliation (as of March 2023) Adjusted EBITDA and Operating Adjusted EBITDA are non - GAAP financial metrics. Please see accompanying end notes for definitions of these terms. Q1 Q2 Q3 Q4 Q1 (Dollars in thousands) 2022 2022 2022 2022 2023 Net Income (Loss) Attributable to B. Riley Financial, Inc. $ (10,062) $ (140,159) $ 47,837 $ (57,445) $ 17,155 EBITDA Adjustments Provision for (Benefit from) Income Taxes (3,695) (52,513) 16,350 (23,998) 7,919 Interest Expense 30,436 31,764 34,587 44,399 47,561 Interest Income (67) (500) (686) (1,482) (2,574) Share Based Payments 17,013 14,202 14,613 15,312 13,746 Depreciation and Amortization 7,848 7,961 10,717 13,443 13,077 Restructuring Charge - - 8,016 995 93 Gain on Extinguishment of Loans (1,102) - - - - Impairment of Tradenames - - - - - Transactions Related Costs and Other 291 3,468 10,003 (5,264) (2,146) Total Adjustments 50,724 4,382 93,600 43,405 77,676 Adjusted EBITDA $ 40,662 $ (135,777) $ 141,437 $ (14,040) $ 94,831 Operating EBITDA Adjustments: Trading (Income) Loss and Fair Value Adjustments on Loans 19,278 117,763 6,917 58,670 (51,568) Realized and unrealized (gains) losses on investments 49,112 106,164 (19,071) 64,874 28,442 Other Investment Related Expenses (24,865) (13,930) (23,039) (7,697) 8,421 Total Operating EBITDA Adjustments 43,525 209,997 (35,193) 115,847 (14,705) Operating Adjusted EBITDA $ 84,187 $ 74,220 $ 106,244 $ 101,807 $ 80,126 FY FY FY LTM Dec 31, Dec 31, Dec 31, Mar 31, 2020 2021 2022 2023 $ 205,148 $ 445,054 $ (159,829) $ (132,612) 75,440 163,960 (63,856) (52,242) 65,249 92,455 141,186 158,311 (564) (229) (2,735) (5,242) 18,588 36,011 61,140 57,873 19,369 25,871 39,969 45,198 1,557 - 9,011 9,104 - (6,509) (1,102) - 12,500 - - - 9,531 5,881 8,498 6,061 201,670 317,440 192,111 219,063 $ 406,818 $ 762,494 $ 32,282 $ 86,451 (56,677) (220,545) 202,628 131,782 (47,341) (166,131) 201,079 180,409 8,873 46,211 (69,531) (36,245) (95,145) (340,465) 334,176 275,946 $ 311,673 $ 422,029 $ 366,458 $ 362,397
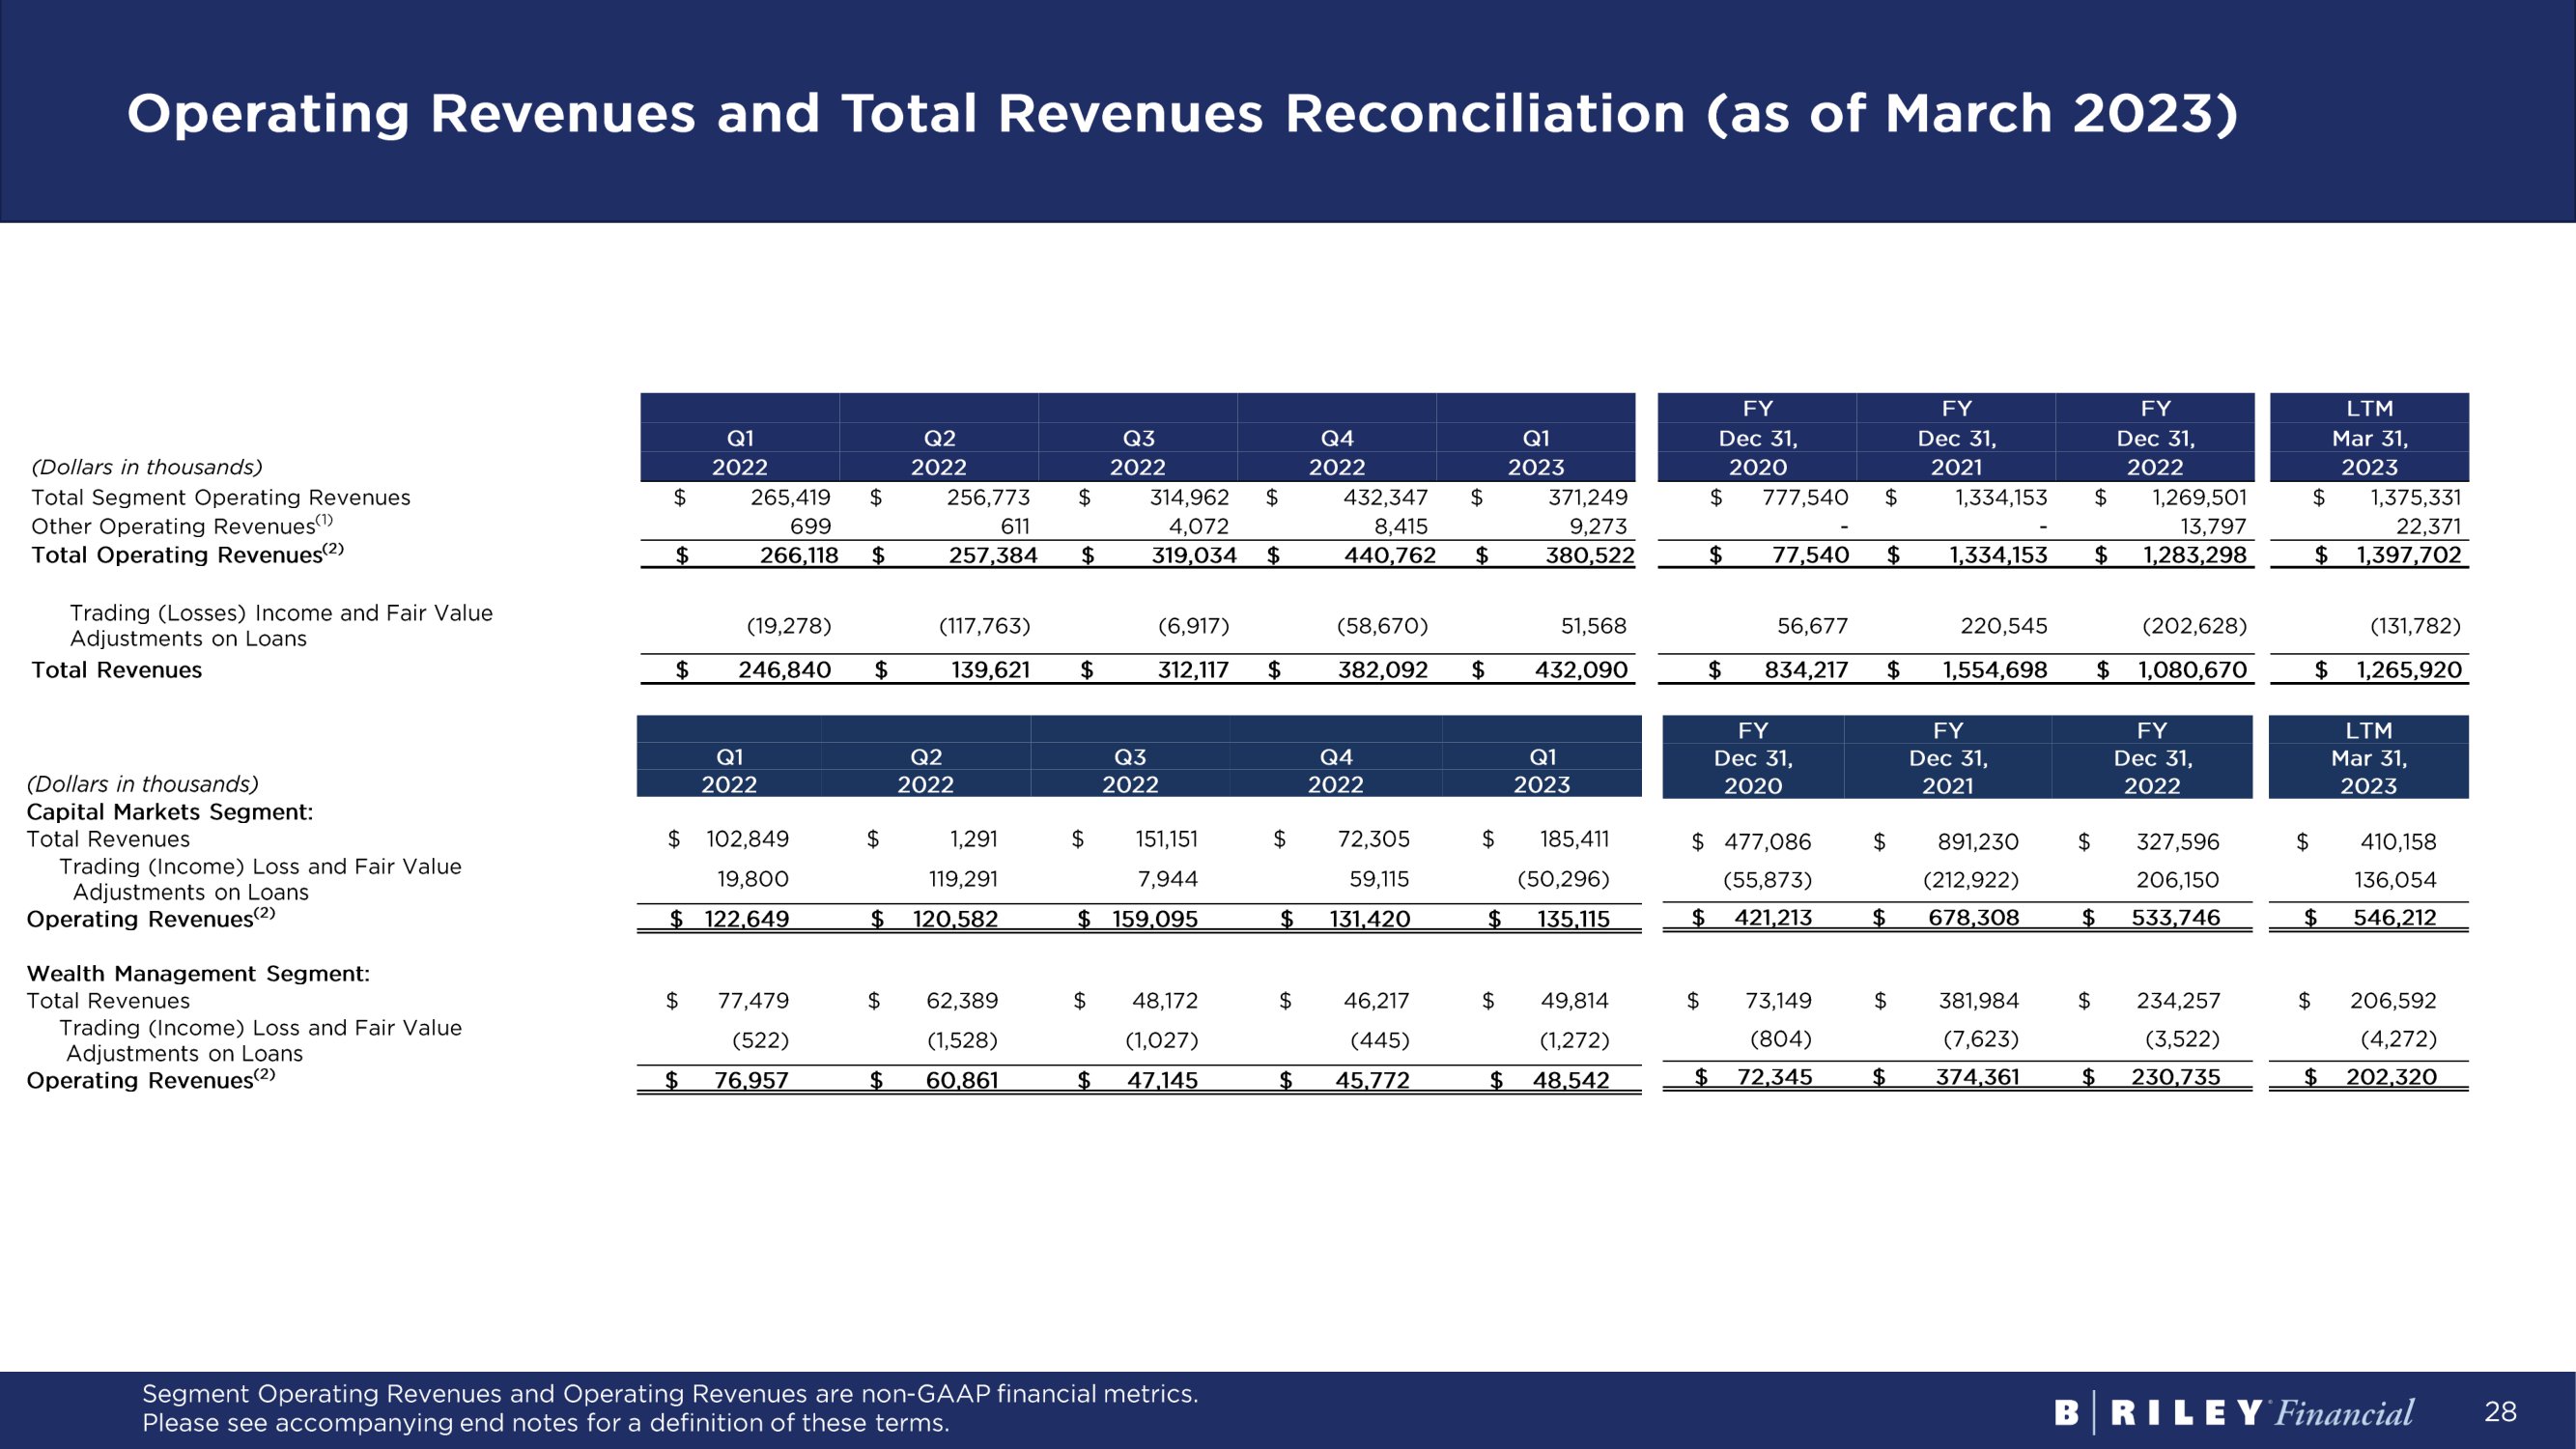
28 Operating Revenue and Revenue Reconciliation (as of March 2023) Segment Operating Revenues and Operating Revenues are non - GAAP financial metrics. Please see accompanying end notes for a definition of these terms. FY FY FY LTM Q1 Q2 Q3 Q4 Q1 Dec 31, Dec 31, Dec 31, Mar 31, (Dollars in thousands) 2022 2022 2022 2022 2023 2020 2021 2022 2023 Total Segment Operating Revenues $ 265,419 $ 256,773 $ 314,962 $ 432,347 $ 371,249 $ 777,540 $ 1,334,153 $ 1,269,501 $ 1,375,331 Other Operating Revenues (1) 699 611 4,072 8,415 9,273 - - 13,797 22,371 Total Operating Revenues (2) $ 266,118 $ 257,384 $ 319,034 $ 440,762 $ 380,522 $ 77,540 $ 1,334,153 $ 1,283,298 $ 1,397,702 Trading (Losses) Income and Fair Value Adjustments on Loans (19,278) (117,763) (6,917) (58,670) 51,568 56,677 220,545 (202,628) (131,782) Total Revenues $ 246,840 $ 139,621 $ 312,117 $ 382,092 $ 432,090 $ 834,217 $ 1,554,698 $ 1,080,670 $ 1,265,920 Q1 Q2 Q3 Q4 Q1 (Dollars in thousands) 2022 2022 2022 2022 2023 Capital Markets Segment: Total Revenues $ 102,849 $ 1,291 $ 151,151 $ 72,305 $ 185,411 Trading (Income) Loss and Fair Value Adjustments on Loans 19,800 119,291 7,944 59,115 (50,296) Operating Revenues (2) $ 122,649 $ 120,582 $ 159,095 $ 131,420 $ 135,115 Wealth Management Segment: Total Revenues $ 77,479 $ 62,389 $ 48,172 $ 46,217 $ 49,814 Trading (Income) Loss and Fair Value Adjustments on Loans (522) (1,528) (1,027) (445) (1,272) Operating Revenues (2) $ 76,957 $ 60,861 $ 47,145 $ 45,772 $ 48,542 FY FY FY LTM Dec 31, Dec 31, Dec 31, Mar 31, 2020 2021 2022 2023 $ 477,086 $ 891,230 $ 327,596 $ 410,158 (55,873) (212,922) 206,150 136,054 $ 421,213 $ 678,308 $ 533,746 $ 546,212 $ 73,149 $ 381,984 $ 234,257 $ 206,592 (804) (7,623) (3,522) (4,272) $ 72,345 $ 374,361 $ 230,735 $ 202,320

29 End notes These notes refer to financial metrics, defined terms and sources, as presented on: Slide 4: B. Riley Financial, Inc. at a Glance Figures for total headcount and locations are approximations based on the latest data available as of December 31, 2022. Operating Revenues and Operating Adjusted EBITDA are non - GAAP financial metrics. For further discussion of these non - GAAP terms, please see “Note Regarding Use of Non - GAAP Financial Measures” and financial tables in the appendix for a reconciliation to GAAP financial measures. (1) Operating Revenues is defined as the sum of revenues from (i) Service and Fees, (ii) Interest Income - Loans and Securities Lending and (iii) Sales of Goods. (2) Adjusted EBITDA includes earnings before interest, taxes, depreciation, amortization, restructuring charge, share - based pay ments, gain on extinguishment of loans, impairment of tradenames, and transaction related and other costs. (3) Operating Adjusted EBITDA is defined as Adjusted EBITDA excluding (i) Trading Income (Loss) and Fair Value Adjustments on L oans, (ii) Realized and Unrealized Gains (Losses) on Investments and Fair Value Adjustments, and (iii) other investment related expenses. (4) Total Return representative of stock price change plus cash dividends between 7/21/20 and 7/21/23. (5) Dividend metrics include Q2 2023 quarterly dividend of $1.00 payable August 2023. Common dividend yield based on $1.00 qu ar terly dividend and $56.40 share price as of 7/21/23 close. Slide 5: Q2 2023 Preliminary Results and Q3 2023 Guidance Operating Adjusted EBITDA is a non - GAAP financial metrics. For further discussion of these non - GAAP terms, please see “Note Rega rding Use of Non - GAAP Financial Measures” and financial tables in the appendix for a reconciliation to GAAP financial measures. (1) Adjusted EBITDA includes earnings before interest, taxes, depreciation, amortization, restructuring charge, share - based pay ments, gain on extinguishment of loans, impairment of tradenames, and transaction related and other costs. (2) Operating Adjusted EBITDA is defined as Adjusted EBITDA excluding (i) Trading Income (Loss) and Fair Value Adjustments on L oans, (ii) Realized and Unrealized Gains (Losses) on Investments and Fair Value Adjustments, and (iii) other investment related expenses. (3) Includes cash and cash equivalents, restricted cash, the net amount of due from clearing brokers and due to clearing brokers, ad vances against customer contracts, the net amount of loans receivable and loan participations sold, the net amount of securities and other investments owned and securities sold not yet purchased, and the net amount of other investmen ts and deposits reported in prepaid and other assets and noncontrolling interest related to investments reported in securities and other Investments owned. Slide 9: Financial Summary – Operating Results (as of Mar 2023) Operating Revenue, Investment Gains, Adjusted EBITDA, and Operating Adjusted EBITDA are non - GAAP financial metrics. For further discussion of these non - GAAP terms, please see “Note Regarding Use of Non - GAAP Financial Measures” and financial tables in the appendix for a reconciliation to GAAP financial measures. Operating Revenues is defined as the sum of revenues from (i) Service and Fees, (ii) Interest Income - Loans and Securities Len ding and (iii) Sales of Goods. Investment Gains is defined as Trading Income and Fair Value Adjustments on Loans. Adjusted EBITDA includes earnings before interest, taxes, depreciation, amortization, restructuring charge, share - based payment s, gain on extinguishment of loans, impairment of tradenames, and transaction related and other costs. Operating Adjusted EBITDA is defined as Adjusted EBITDA excluding (i) Trading Income (Loss) and Fair Value Adjustments on Loa ns , (ii) Realized and Unrealized Gains (Losses) on Investments and Fair Value Adjustments, and (iii) other investment related expenses. Slide 10: Cash and Investments and Loans Receivable Overview (as of Mar 2023) Public Equity, Private Equity, and Partnership Interests and Other include investments reported in prepaid and other assets. P ublic Equity also includes $59 million equity positions held by B. Riley in managed account with gains and losses for client benefit, as of March 31, 2023.

30 End notes These notes refer to financial metrics, defined terms and sources, as presented on: Slide 11: Track Record of Generating Strong Total Returns Total Return equal to (7/21/23 Closing Share Price – Beginning Period Share Price + Dividends) / Beginning Period Share Price. (1) RILY began trading on the Nasdaq on July 16, 2015 at $10.00. Slide 14: Business Mix by Segment (as of Mar 2023) Segment Operating Revenues is a non - GAAP financial metric. For further discussion of this non - GAAP term, please see “Note Regar ding Use of Non - GAAP Financial Measures” and financial table in the appendix for a reconciliation to GAAP financial measures. Segment Operating Revenues and is defined as the sum of revenues from (i) Services and Fees, (ii) Interest Income - Loans and S ecurities Lending and (iii) Sales of Goods. Slide 15: Leading Middle - Market Capital Markets Platform B. Riley Securities by the Numbers Trailing 3 Years (7/1/2020 – 6/30/2023). (1) Cumulative led transaction deal value (public IPO, FO and convert offerings). (2) Source: Dealogic. Pricing Date 7/1/2020 – 6/30/2023, Deal Type = IPO, FO, Rank Eligible. SEC registered. Exchange Nationali ty = USA. Market Cap. $100m - $1.5bn. Deal Price >= $1.00. Excludes SPAC IPOs and Healthcare transactions. (3) 300+ ATMs over time span. Slides 17 : Wealth Management Figures noted for Financial Advisors and Registered Representatives, and Client Assets as of March 31, 2023. Slide 19: Financial Consulting: Valuation and Appraisal Figures noted for Valuation Assignments, Unique Companies Appraised, and Square Feet Inspected as of December 31, 2022. Slide 20: Retail Liquidation Figures noted for Store Closures and Value of Assets and Inventory Liquidated as of March 2023. Slide 22: Consumer Brand Investments Targus ranked #1 B2B and Retail Laptop Cases in the U.S. Source: The NPD Group/Retail Tracking Service (U.S. and Canada): com bin ed Q3 2022 sales for Sleeves/Slipcases; Reseller Tracking (U.S.): combined sales for Laptop Cases and Other. Notebook Accessories; based on unit sales, 12ME September 2022 combined. Brand holdings for Six Brands as of December 31, 2022. Percentage represents approximate ownership stake in these brands. Brand holdings for Hurley, Justice, and bebe as of December 31, 2022. Percentages represent approximate ownership stakes in these brands. Our investments in Hurley, Just ic e and bebe are recognized outside of Operating Income from Reportable Segments and is reported in “Other Income (Expense).”

31 End notes These notes refer to financial metrics, defined terms and sources, as presented on: Slide 25: Balance Sheet Summary, Key Metrics (1) Balance Sheet Summary as of March 31, 2023. (2) Includes approximately $1,049.2M in securities and other investments owned net of $7.8M in securities sold not yet purcha se d. (3) Includes approximately $2.4M in restricted cash, $0.2M in advances against customer contracts, $19.1M due from clearing b ro kers, net of $6.0M due to clearing brokers, and $72.9M in other investments reported in prepaid and other assets, net of $29.8M in noncontrolling interest related to investments reported in securities and other investments owned. (4) Excludes operating lease liabilities. (5) Defined as total debt minus cash, net securities and investments, and other. (6) Based on results for last twelve months ended March 31, 2023. (7) Operating Revenues is defined as the sum of revenues from (i) Services and Fees, (ii) Interest Income - Loans and Securitie s Lending and (iii) Sales of Goods. (8) Investment Gains (Loss) is defined as Trading Income (Loss) and Fair Value Adjustments on Loans. (9) Operating Adjusted EBITDA is defined as Adjusted EBITDA excluding (i) Trading Income (Loss) and Fair Value Adjustments on L oans, (ii) Realized and Unrealized Gains (Losses) on Investments and Fair Value Adjustments, and (iii) Other Investment Related Expenses. (10) Investment Adjusted EBITDA is defined as Trading Income (Loss) and Fair Value Adjustments on Loans and Realized and Unre al ized Gains (Losses) on Investments , net of Other Investment Related Expenses. (11) Adjusted EBITDA includes earnings before interest, taxes, depreciation, amortization, restructuring charge, share - based pa yments, gain on extinguishment of loans, impairment of tradenames, and transaction related and other costs. (12) RILY common stock price as of July 21, 2023 for total shares outstanding of 28.1 million as of March 31, 2023. (13) Fair market value of RILYP and RILYL preferred shares as of July 21, 2023 for total shares outstanding as of March 31, 2 02 3. (14) Enterprise value is defined as market capitalization, less cash and cash equivalents, restricted cash, the net amount of d ue from clearing brokers and due to clearing brokers, advances against customer contracts, the net amount of loans receivable and loan participations sold, the net amount of securities and other investments owned and securities sold not yet pu rchased, and the net amount of other investments and deposits reported in prepaid and other assets and noncontrolling interest related to investments reported in securities and other Investments owned, plus notes payable, term l oan s, net, revolving credit facility, senior notes payable, and fair value of RILYP and RILYL as of July 21, 2023 using outstanding preferred shares as of March 31, 2023. Slide 26 : Adjusted EBITDA and Operating Adjusted EBITDA Reconciliation Adjusted EBITDA and Operating Adjusted EBITDA are non - GAAP financial metrics. For further discussion of these non - GAAP terms, p lease see "Note Regarding Use of Non - GAAP Financial Measures." Adjusted EBITDA includes earnings before interest, taxes, depreciation, amortization, restructuring charge, share - based payment s, gain on extinguishment of loans, impairment of tradenames, and transaction related and other costs. Operating Adjusted EBITDA is defined as Adjusted EBITDA excluding (i) Trading Income (Loss) and Fair Value Adjustments on Loa ns , (ii) Realized and Unrealized Gains (Losses) on Investments and Fair Value Adjustments, and (iii) Other Investment Related Expenses. Slide 27: Adjusted EBITDA and Operating Adjusted EBITDA Reconciliation (as of March 2023) Adjusted EBITDA and Operating Adjusted EBITDA are non - GAAP financial metrics. For further discussion of these non - GAAP terms, p lease see "Note Regarding Use of Non - GAAP Financial Measures." Adjusted EBITDA includes earnings before interest, taxes, depreciation, amortization, restructuring charge, share - based payment s, gain on extinguishment of loans, impairment of tradenames, and transaction related and other costs. Operating Adjusted EBITDA is defined as Adjusted EBITDA excluding (i) Trading Income (Loss) and Fair Value Adjustments on Loa ns , (ii) Realized and Unrealized Gains (Losses) on Investments and Fair Value Adjustments, and (iii) Other Investment Related Expenses. Slide 28 : Operating Revenue and Revenue Reconciliation (as of March 2023) Segment Operating Revenue and Operating Revenue are non - GAAP financial metrics. For further discussion of these non - GAAP terms, please see "Note Regarding Use of Non - GAAP Financial Measures.” (1) Includes services and fees revenue not reported segment revenues. (2) Operating Revenues is defined as the sum of revenues from (i) Service and Fees, (ii) Interest Income - Loans and Securities Lending and (iii) Sales of Goods.

32 For more information, please visit www.brileyfin.com
v3.23.2
Cover
|
Jul. 25, 2023 |
| Document Type |
8-K
|
| Amendment Flag |
false
|
| Document Period End Date |
Jul. 25, 2023
|
| Entity File Number |
001-37503
|
| Entity Registrant Name |
B. RILEY FINANCIAL, INC.
|
| Entity Central Index Key |
0001464790
|
| Entity Tax Identification Number |
27-0223495
|
| Entity Incorporation, State or Country Code |
DE
|
| Entity Address, Address Line One |
11100 Santa Monica Boulevard
|
| Entity Address, Address Line Two |
Suite 800
|
| Entity Address, City or Town |
Los Angeles
|
| Entity Address, State or Province |
CA
|
| Entity Address, Postal Zip Code |
90025
|
| City Area Code |
310
|
| Local Phone Number |
966-1444
|
| Written Communications |
false
|
| Soliciting Material |
false
|
| Pre-commencement Tender Offer |
false
|
| Pre-commencement Issuer Tender Offer |
false
|
| Entity Emerging Growth Company |
false
|
| Common Stock, par value $0.0001 per share |
|
| Title of 12(b) Security |
Common Stock, par value $0.0001 per share
|
| Trading Symbol |
RILY
|
| Security Exchange Name |
NASDAQ
|
| Depositary Shares (each representing a 1/1000 |
|
| Title of 12(b) Security |
Depositary
Shares (each representing a 1/1000th interest in a 6.875% Series A Cumulative Perpetual Preferred Share, par value $0.0001 per share)
|
| Trading Symbol |
RILYP
|
| Security Exchange Name |
NASDAQ
|
| Depositary Shareseachrepresentinga 11000thinterestina 7375 Series B Cumulative Perpetual Preferred Shareparvalue 00001pershare [Member] |
|
| Title of 12(b) Security |
Depositary
Shares (each representing a 1/1000th interest in a 7.375% Series B Cumulative Perpetual Preferred Share, par value $0.0001 per share)
|
| Trading Symbol |
RILYL
|
| 6.50% Senior Notes due 2026 |
|
| Title of 12(b) Security |
6.50% Senior Notes due 2026
|
| Trading Symbol |
RILYN
|
| Security Exchange Name |
NASDAQ
|
| 6.375% Senior Notes due 2025 |
|
| Title of 12(b) Security |
6.375% Senior Notes due 2025
|
| Trading Symbol |
RILYM
|
| Security Exchange Name |
NASDAQ
|
| 6.75% Senior Notes due 2024 |
|
| Title of 12(b) Security |
6.75% Senior Notes due 2024
|
| Trading Symbol |
RILYO
|
| Security Exchange Name |
NASDAQ
|
| 6.00% Senior Notes due 2028 |
|
| Title of 12(b) Security |
6.00% Senior Notes due 2028
|
| Trading Symbol |
RILYT
|
| Security Exchange Name |
NASDAQ
|
| 5.50% Senior Notes due 2026 |
|
| Title of 12(b) Security |
5.50% Senior Notes due 2026
|
| Trading Symbol |
RILYK
|
| Security Exchange Name |
NASDAQ
|
| 5.25% Senior Notes due 2028 |
|
| Title of 12(b) Security |
5.25% Senior Notes due 2028
|
| Trading Symbol |
RILYZ
|
| Security Exchange Name |
NASDAQ
|
| 5.00% Senior Notes due 2026 |
|
| Title of 12(b) Security |
5.00% Senior Notes due 2026
|
| Trading Symbol |
RILYG
|
| Security Exchange Name |
NASDAQ
|
| X |
- DefinitionBoolean flag that is true when the XBRL content amends previously-filed or accepted submission.
| Name: |
dei_AmendmentFlag |
| Namespace Prefix: |
dei_ |
| Data Type: |
xbrli:booleanItemType |
| Balance Type: |
na |
| Period Type: |
duration |
|
| X |
- DefinitionFor the EDGAR submission types of Form 8-K: the date of the report, the date of the earliest event reported; for the EDGAR submission types of Form N-1A: the filing date; for all other submission types: the end of the reporting or transition period. The format of the date is YYYY-MM-DD.
| Name: |
dei_DocumentPeriodEndDate |
| Namespace Prefix: |
dei_ |
| Data Type: |
xbrli:dateItemType |
| Balance Type: |
na |
| Period Type: |
duration |
|
| X |
- DefinitionThe type of document being provided (such as 10-K, 10-Q, 485BPOS, etc). The document type is limited to the same value as the supporting SEC submission type, or the word 'Other'.
| Name: |
dei_DocumentType |
| Namespace Prefix: |
dei_ |
| Data Type: |
dei:submissionTypeItemType |
| Balance Type: |
na |
| Period Type: |
duration |
|
| X |
- DefinitionAddress Line 1 such as Attn, Building Name, Street Name
| Name: |
dei_EntityAddressAddressLine1 |
| Namespace Prefix: |
dei_ |
| Data Type: |
xbrli:normalizedStringItemType |
| Balance Type: |
na |
| Period Type: |
duration |
|
| X |
- DefinitionAddress Line 2 such as Street or Suite number
| Name: |
dei_EntityAddressAddressLine2 |
| Namespace Prefix: |
dei_ |
| Data Type: |
xbrli:normalizedStringItemType |
| Balance Type: |
na |
| Period Type: |
duration |
|
| X |
- Definition
+ References
+ Details
| Name: |
dei_EntityAddressCityOrTown |
| Namespace Prefix: |
dei_ |
| Data Type: |
xbrli:normalizedStringItemType |
| Balance Type: |
na |
| Period Type: |
duration |
|
| X |
- DefinitionCode for the postal or zip code
| Name: |
dei_EntityAddressPostalZipCode |
| Namespace Prefix: |
dei_ |
| Data Type: |
xbrli:normalizedStringItemType |
| Balance Type: |
na |
| Period Type: |
duration |
|
| X |
- DefinitionName of the state or province.
| Name: |
dei_EntityAddressStateOrProvince |
| Namespace Prefix: |
dei_ |
| Data Type: |
dei:stateOrProvinceItemType |
| Balance Type: |
na |
| Period Type: |
duration |
|
| X |
- DefinitionA unique 10-digit SEC-issued value to identify entities that have filed disclosures with the SEC. It is commonly abbreviated as CIK. Reference 1: http://www.xbrl.org/2003/role/presentationRef
-Publisher SEC
-Name Exchange Act
-Number 240
-Section 12
-Subsection b-2
| Name: |
dei_EntityCentralIndexKey |
| Namespace Prefix: |
dei_ |
| Data Type: |
dei:centralIndexKeyItemType |
| Balance Type: |
na |
| Period Type: |
duration |
|
| X |
- DefinitionIndicate if registrant meets the emerging growth company criteria. Reference 1: http://www.xbrl.org/2003/role/presentationRef
-Publisher SEC
-Name Exchange Act
-Number 240
-Section 12
-Subsection b-2
| Name: |
dei_EntityEmergingGrowthCompany |
| Namespace Prefix: |
dei_ |
| Data Type: |
xbrli:booleanItemType |
| Balance Type: |
na |
| Period Type: |
duration |
|
| X |
- DefinitionCommission file number. The field allows up to 17 characters. The prefix may contain 1-3 digits, the sequence number may contain 1-8 digits, the optional suffix may contain 1-4 characters, and the fields are separated with a hyphen.
| Name: |
dei_EntityFileNumber |
| Namespace Prefix: |
dei_ |
| Data Type: |
dei:fileNumberItemType |
| Balance Type: |
na |
| Period Type: |
duration |
|
| X |
- DefinitionTwo-character EDGAR code representing the state or country of incorporation.
| Name: |
dei_EntityIncorporationStateCountryCode |
| Namespace Prefix: |
dei_ |
| Data Type: |
dei:edgarStateCountryItemType |
| Balance Type: |
na |
| Period Type: |
duration |
|
| X |
- DefinitionThe exact name of the entity filing the report as specified in its charter, which is required by forms filed with the SEC. Reference 1: http://www.xbrl.org/2003/role/presentationRef
-Publisher SEC
-Name Exchange Act
-Number 240
-Section 12
-Subsection b-2
| Name: |
dei_EntityRegistrantName |
| Namespace Prefix: |
dei_ |
| Data Type: |
xbrli:normalizedStringItemType |
| Balance Type: |
na |
| Period Type: |
duration |
|
| X |
- DefinitionThe Tax Identification Number (TIN), also known as an Employer Identification Number (EIN), is a unique 9-digit value assigned by the IRS. Reference 1: http://www.xbrl.org/2003/role/presentationRef
-Publisher SEC
-Name Exchange Act
-Number 240
-Section 12
-Subsection b-2
| Name: |
dei_EntityTaxIdentificationNumber |
| Namespace Prefix: |
dei_ |
| Data Type: |
dei:employerIdItemType |
| Balance Type: |
na |
| Period Type: |
duration |
|
| X |
- DefinitionLocal phone number for entity.
| Name: |
dei_LocalPhoneNumber |
| Namespace Prefix: |
dei_ |
| Data Type: |
xbrli:normalizedStringItemType |
| Balance Type: |
na |
| Period Type: |
duration |
|
| X |
- DefinitionBoolean flag that is true when the Form 8-K filing is intended to satisfy the filing obligation of the registrant as pre-commencement communications pursuant to Rule 13e-4(c) under the Exchange Act. Reference 1: http://www.xbrl.org/2003/role/presentationRef
-Publisher SEC
-Name Exchange Act
-Number 240
-Section 13e
-Subsection 4c
| Name: |
dei_PreCommencementIssuerTenderOffer |
| Namespace Prefix: |
dei_ |
| Data Type: |
xbrli:booleanItemType |
| Balance Type: |
na |
| Period Type: |
duration |
|
| X |
- DefinitionBoolean flag that is true when the Form 8-K filing is intended to satisfy the filing obligation of the registrant as pre-commencement communications pursuant to Rule 14d-2(b) under the Exchange Act. Reference 1: http://www.xbrl.org/2003/role/presentationRef
-Publisher SEC
-Name Exchange Act
-Number 240
-Section 14d
-Subsection 2b
| Name: |
dei_PreCommencementTenderOffer |
| Namespace Prefix: |
dei_ |
| Data Type: |
xbrli:booleanItemType |
| Balance Type: |
na |
| Period Type: |
duration |
|
| X |
- DefinitionTitle of a 12(b) registered security. Reference 1: http://www.xbrl.org/2003/role/presentationRef
-Publisher SEC
-Name Exchange Act
-Number 240
-Section 12
-Subsection b
| Name: |
dei_Security12bTitle |
| Namespace Prefix: |
dei_ |
| Data Type: |
dei:securityTitleItemType |
| Balance Type: |
na |
| Period Type: |
duration |
|
| X |
- DefinitionName of the Exchange on which a security is registered. Reference 1: http://www.xbrl.org/2003/role/presentationRef
-Publisher SEC
-Name Exchange Act
-Number 240
-Section 12
-Subsection d1-1
| Name: |
dei_SecurityExchangeName |
| Namespace Prefix: |
dei_ |
| Data Type: |
dei:edgarExchangeCodeItemType |
| Balance Type: |
na |
| Period Type: |
duration |
|
| X |
- DefinitionBoolean flag that is true when the Form 8-K filing is intended to satisfy the filing obligation of the registrant as soliciting material pursuant to Rule 14a-12 under the Exchange Act. Reference 1: http://www.xbrl.org/2003/role/presentationRef
-Publisher SEC
-Name Exchange Act
-Section 14a
-Number 240
-Subsection 12
| Name: |
dei_SolicitingMaterial |
| Namespace Prefix: |
dei_ |
| Data Type: |
xbrli:booleanItemType |
| Balance Type: |
na |
| Period Type: |
duration |
|
| X |
- DefinitionTrading symbol of an instrument as listed on an exchange.
| Name: |
dei_TradingSymbol |
| Namespace Prefix: |
dei_ |
| Data Type: |
dei:tradingSymbolItemType |
| Balance Type: |
na |
| Period Type: |
duration |
|
| X |
- DefinitionBoolean flag that is true when the Form 8-K filing is intended to satisfy the filing obligation of the registrant as written communications pursuant to Rule 425 under the Securities Act. Reference 1: http://www.xbrl.org/2003/role/presentationRef
-Publisher SEC
-Name Securities Act
-Number 230
-Section 425
| Name: |
dei_WrittenCommunications |
| Namespace Prefix: |
dei_ |
| Data Type: |
xbrli:booleanItemType |
| Balance Type: |
na |
| Period Type: |
duration |
|
| X |
- Details
| Name: |
us-gaap_StatementClassOfStockAxis=RILY_CommonStockParValue0.0001PerShareMember |
| Namespace Prefix: |
|
| Data Type: |
na |
| Balance Type: |
|
| Period Type: |
|
|
| X |
- Details
| Name: |
us-gaap_StatementClassOfStockAxis=RILY_DepositarySharesEachRepresenting11000Member |
| Namespace Prefix: |
|
| Data Type: |
na |
| Balance Type: |
|
| Period Type: |
|
|
| X |
- Details
| Name: |
us-gaap_StatementClassOfStockAxis=RILY_DepositaryShareseachrepresentinga11000thinterestina7375SeriesBCumulativePerpetualPreferredShareparvalue00001pershareMember |
| Namespace Prefix: |
|
| Data Type: |
na |
| Balance Type: |
|
| Period Type: |
|
|
| X |
- Details
| Name: |
us-gaap_StatementClassOfStockAxis=RILY_Sec6.50SeniorNotesDue2026Member |
| Namespace Prefix: |
|
| Data Type: |
na |
| Balance Type: |
|
| Period Type: |
|
|
| X |
- Details
| Name: |
us-gaap_StatementClassOfStockAxis=RILY_Sec6.375SeniorNotesDue2025Member |
| Namespace Prefix: |
|
| Data Type: |
na |
| Balance Type: |
|
| Period Type: |
|
|
| X |
- Details
| Name: |
us-gaap_StatementClassOfStockAxis=RILY_Sec6.75SeniorNotesDue2024Member |
| Namespace Prefix: |
|
| Data Type: |
na |
| Balance Type: |
|
| Period Type: |
|
|
| X |
- Details
| Name: |
us-gaap_StatementClassOfStockAxis=RILY_Sec6.00SeniorNotesDue2028Member |
| Namespace Prefix: |
|
| Data Type: |
na |
| Balance Type: |
|
| Period Type: |
|
|
| X |
- Details
| Name: |
us-gaap_StatementClassOfStockAxis=RILY_Sec5.50SeniorNotesDue2026Member |
| Namespace Prefix: |
|
| Data Type: |
na |
| Balance Type: |
|
| Period Type: |
|
|
| X |
- Details
| Name: |
us-gaap_StatementClassOfStockAxis=RILY_Sec5.25SeniorNotesDue2028Member |
| Namespace Prefix: |
|
| Data Type: |
na |
| Balance Type: |
|
| Period Type: |
|
|
| X |
- Details
| Name: |
us-gaap_StatementClassOfStockAxis=RILY_Sec5.00SeniorNotesDue2026Member |
| Namespace Prefix: |
|
| Data Type: |
na |
| Balance Type: |
|
| Period Type: |
|
|
Amplify Video Game Tech ... (AMEX:GAMR)
Historical Stock Chart
From Mar 2024 to Apr 2024

Amplify Video Game Tech ... (AMEX:GAMR)
Historical Stock Chart
From Apr 2023 to Apr 2024
