Key Support Levels: $1,750, $1, 700, $1,650
Gold (XAUUSD) Long-term Trend: Bearish
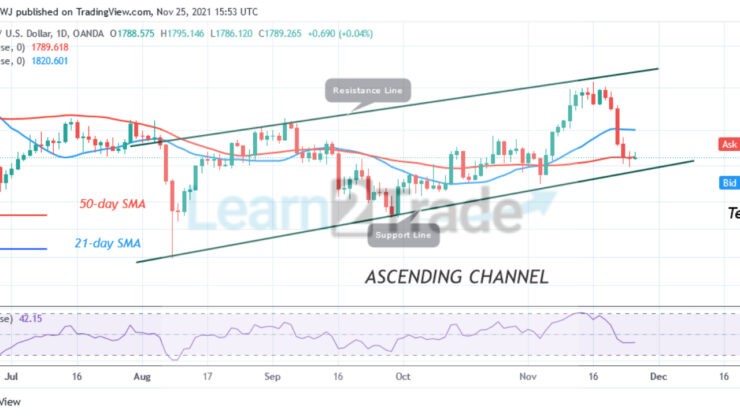
Gold (XAUUSD) is in a downward move. On November 16, XAUUSD rallied to $1,877 high. Buyers could not sustain the bullish momentum as the market reached the overbought region. Gold was rejected from the recent high as the market declined sharply to the low of level 1782. Presently, the Gold price is above the 50-day line SMA but below the 21-day SMA. If the 50-day line support holds, Gold will be range-bound between the moving averages.

Daily Chart Indicators Reading:
Gold is at level 42 of the Relative Strength Index for period 14. XAUUSD is now in the downtrend zone and below the centerline 50. Gold price is between the moving averages which will result in a range-bound move above the current support. The 21-day SMA and the 50-day SMA are sloping horizontally indicating the sideways trend.
Gold (XAUUSD) Medium-term bias: Bearish
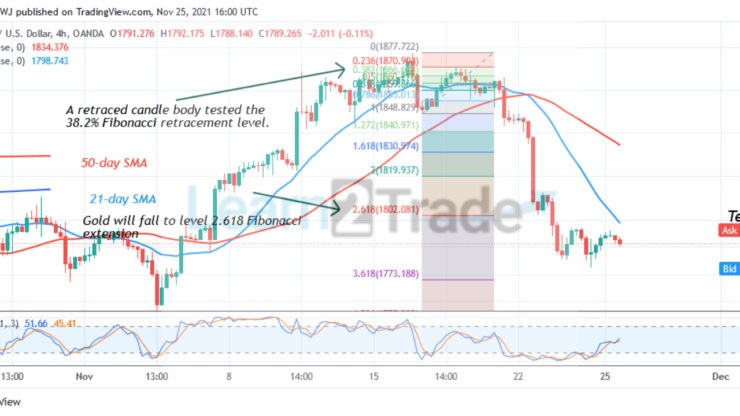
On the 4 hour chart, the Gold price is in a downward move. The downtrend has reached bearish exhaustion. Meanwhile, on November 16 uptrend; a retraced candle body tested the 38.2 % Fibonacci retracement level. The retracement indicates that Gold will fall to level 2.618 Fibonacci extension or $1,802.08. From the price action, the market declined to level 1778 and resumed consolidation.

4-hour Chart Indicators Reading
Gold is above the 40% range of the daily stochastic. The market is in bullish momentum. The 21-day SMA and the 50-day SMA are sloping upward indicating the uptrend.
General Outlook for Gold (XAUUSD)
Gold’s (XAUUSD) is in a downward move. For the past week, the Gold price has been consolidating above level 1778. The downtrend has reached bearish exhaustion as price holds above the previous low.
Source: https://learn2.trade


