Ripple has broken the resistance trendline on the daily chart. Lower highs have developed after the supply level of $0.410 was reached to show the market’s bearish position. The price declined until the demand level at $0.320 was broken. Immediately after, a rejection candle developed, which caused the market to increase. The high of $0.370 has been swept away. The invalidation of the bearish channel reveals the market is ready for a bullish run to higher resistance levels at $0.400.
Ripple Key Levels
Demand Levels: $0.3450, $0.3350, $0.3200
Supply Levels: $0.4100, $0.4000, $0.3700
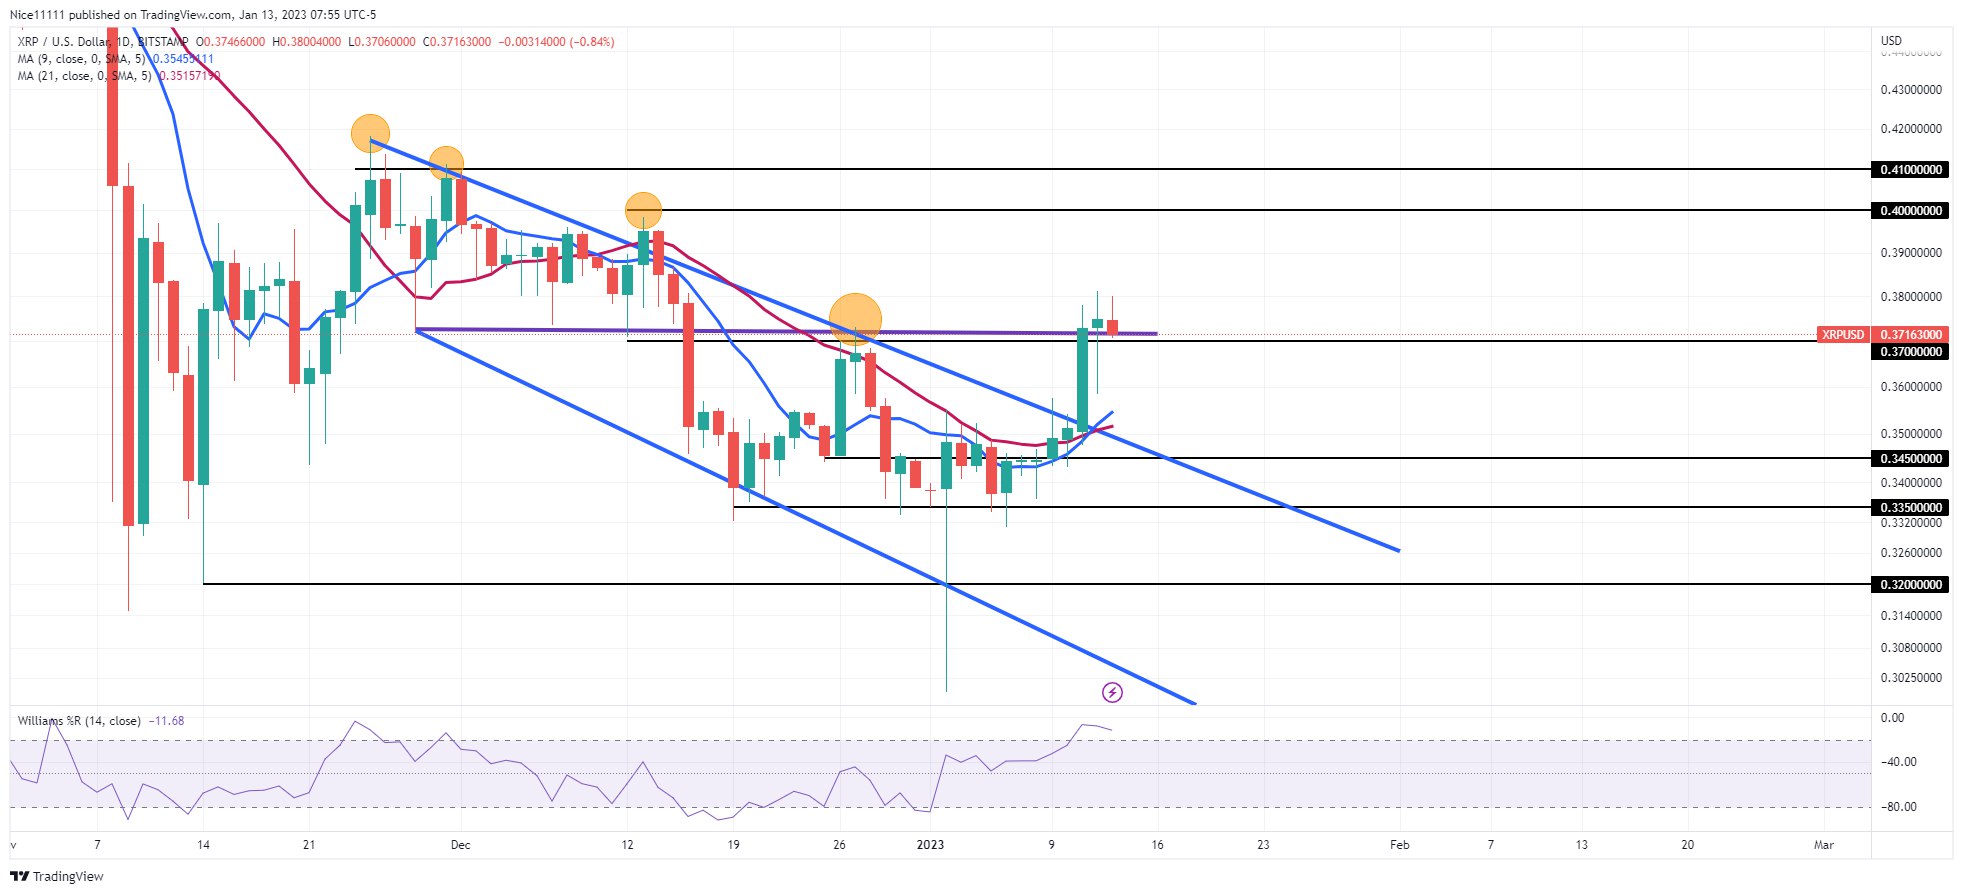
What Are the Indicators Saying?
The Moving Averages (periods nine and twenty) have repositioned themselves to rest under the daily candles. The cross of the Moving Averages confirmed the ascent in the market. The Williams Percent Range signals an overbought market. The market is expected to retrace and retest the bearish trendline to aim for $0.400.
Learn from market wizards: Books to take your trading to the next level