TIDMRAT
RNS Number : 1447Q
Rathbone Brothers PLC
17 October 2019
Rathbone Brothers Plc
Third quarter interim management statement and strategic
update
Rathbone Brothers Plc ("Rathbones") announces a trading update
for the three months ended 30 September 2019.
Paul Stockton, Chief Executive of Rathbone Brothers Plc,
said:
"Our funds under management and administration increased
marginally in the quarter to GBP49.4 billion. In difficult markets
we continue to focus on providing a quality service to our clients,
navigating through ongoing market uncertainty but also selectively
investing to pursue organic growth opportunities and develop our
business."
Financial highlights:
- Total funds under management and administration increased 4.4%
to GBP49.4 billion at 30 September 2019 (30 September 2018: GBP47.3
billion). The FTSE 100 Index on the third quarter charging date
decreased 1.4% from the equivalent date last year, whilst the MSCI
WMA Private Investor Balanced Index increased by 2.0%.
   -      GBP42.4 billion in the Investment Management business (30 September 2018: GBP41.3 billion)
   -      GBP7.0 billion in the Unit Trusts business (30 September 2018: GBP6.0 billion)
- Total net inflows were GBP0.1 billion in the third quarter
(2018: GBP7.0 billion, largely reflecting the acquisition of Speirs
& Jeffrey).
- Gross organic inflows in Investment Management in the quarter
remained resilient at GBP0.8 billion (2018: GBP0.8 billion) in a
difficult market for savings. Total net outflows in Investment
Management during the quarter were GBP0.2 billion (2018: net
inflows of GBP6.9 billion largely reflecting the acquisition of
Speirs & Jeffrey). This reflected ongoing weak investor
sentiment and investment manager departures. Both factors, together
with anticipated outflows from short term discretionary mandates,
are expected to continue to weigh on net growth in FUMA into
2020.
- Net inflows in Unit Trusts for the quarter remained strong at
GBP0.3 billion against a difficult environment for asset managers
(2018: GBP0.1 billion).
- Underlying operating income totalled GBP86.3 million for the
three months ended 30 September 2019, an increase of 7.5% from the
GBP80.3 million recorded in the third quarter of 2018.
- Income in Investment Management totalled GBP76.7 million in
the quarter, up 8.3% on the GBP70.8 million reported for the
comparable period in 2018. The average FTSE 100 Index was 7427 on
quarterly billing dates in 2019, broadly flat against the 7449
recorded in 2018.
- Income in Unit Trusts totalled GBP9.6 million for the three
months ended 30 September 2019, broadly flat on the GBP9.5 million
reported for the third quarter in 2018 and an increase of 8.9%
excluding managers' box dealing profits.
Strategic update
The executive management team will outline their vision for the
business at the strategic update this morning; a copy of the
presentation is available online at
https://www.rathbones.com/investor-relations and a recording of the
event will be uploaded to the website after the event.
Rathbones has built a leading market position based on a
powerful brand, high quality people, a strong operating platform
and a stable client base who value our relationship led services.
We intend to leverage the core strengths of our business by
investing over the next 2-3 years to enhance organic growth. During
this time, we believe it is appropriate to operate the business
closer to a mid-twenties underlying operating margin to enable us
to create long term growth opportunities, improve client services
and deliver productivity gains.
Net operating income
                                                           3 months ended 30 September   9 months ended 30 September
                                                            2019      2018      Change     2019     2018      Change
                                                            GBPm      GBPm           %     GBPm     GBPm           %
 Investment Management
 - Fees                                                     56.0      51.9         7.9    166.6    150.3        10.8
 - Commissions                                              11.3       9.8        15.3     39.0     30.8        26.6
 - Net interest income                                       4.4       4.0        10.0     12.1     10.9        11.0

   *    Fees from advisory services(1) and other income      5.0       5.1       (2.0)     14.4     14.1         2.1
                                                         -------  --------  ----------  -------  -------  ----------
                                                            76.7      70.8         8.3    232.1    206.1        12.6
 Unit Trusts                                                 9.6       9.5         1.1     27.0     27.4       (1.5)
                                                         -------  --------  ----------  -------  -------  ----------
 Underlying net operating
  income                                                    86.3      80.3         7.5    259.1    233.5        11.0
                                                         -------  --------  ----------  -------  -------  ----------
 Average FTSE 100 Index
  on principal charging
  dates(2)                                                  7408      7510       (1.4)     7427     7449       (0.3)
 Average MSCI WMA Balanced
  Index on principal
  charging dates(2)                                         1645      1612         2.0     1629     1582         3.0
(1) Including income from trust, tax, pension advisory services
and Vision Independent Financial Planning.
(2) The principal charging dates for Investment Management
clients are 5 April, 30 June, 30 September and 31 December. Unit
Trust income accrues on daily levels of funds under management.
Funds under management
                                        3 months ended         9 months ended
                                          30 September          30 September
                                        2019       2018        2019       2018
                                        GBPm       GBPm        GBPm       GBPm
(i) Investment Management
 Opening FUM (1 July/1 January)          42,482    34,140       38,456    33,780
 Inflows                                    789     7,508        2,690     9,262
-----------------------------------  ----------  --------  -----------  --------
  Organic new business                      757       800        2,483     2,493
  Acquired new business                      32     6,708          207     6,769
-----------------------------------  ----------  --------  -----------  --------
 Outflows                                 (953)     (582)      (2,714)   (1,922)
 Market adjustment                          104       208        3,990       154
                                     ----------  --------  -----------  --------
 Closing FUM (30 September)              42,422    41,274       42,422    41,274
                                     ----------  --------  -----------  --------

 Underlying annualised rate of
  net organic growth                     (1.8%)      2.6%       (0.8%)      2.3%
 Annualised rate of net inflows(3)       (1.5%)      2.8%       (0.1%)      2.6%

(ii) Unit Trusts
 Opening FUM (1 July/1 January)           6,702     5,776        5,643     5,367
 Inflows                                    661       459        1,655     1,432
 Outflows                                 (342)     (338)      (1,007)   (1,012)
 Market adjustment                            6       109          736       219
                                     ----------  --------  -----------  --------
 Closing FUM (30 September)               7,027     6,006        7,027     6,006
                                     ----------  --------  -----------  --------

 Total FUM (30 September) (4)            49,449    47,280       49,449    47,280
                                     ----------  --------  -----------  --------

 Net fund inflows
 Investment Management                    (164)     6,926         (24)     7,340
 Unit Trusts                                319       121          648       420
                                     ----------  --------  -----------  --------
 Total                                      155     7,047          624     7,760
                                     ----------  --------  -----------  --------
(3) Annualised rate of net inflows in 2018 excludes the GBP6.7
billion acquired in relation to Speirs & Jeffrey.
(4) Includes GBP2.5 billion (30 September 2018: GBP2.3 billion)
of execution only funds, Greenbank funds of GBP1.5 billion (30
September 2018: GBP1.2 billion) and funds managed with a charitable
mandate of GBP6.0 billion (30 September 2018: GBP5.7 billion).
(iii) Investment Management; Service level breakdown
                                   30 September   31 December   30 September      Change       Change
                                           2019          2018           2018    9 months    12 months
                                           GBPm          GBPm           GBPm           %            %
--------------------------------  -------------  ------------  -------------  ----------  -----------
 Direct                                  30,311        26,642         28,207        13.8          7.5
 Financial Adviser linked(5)              8,567         7,515          8,095        14.0          5.8
--------------------------------  -------------  ------------  -------------  ----------  -----------
 Total Discretionary                     38,878        34,157         36,302        13.8          7.1
 Non-Discretionary Investment
  Management                              2,721         3,332          3,889      (18.3)       (30.0)
 Execution Only                           2,466         2,158          2,304        14.3          7.0
--------------------------------  -------------  ------------  -------------  ----------  -----------
 Gross Investment Management
  FUMA                                   44,065        39,647         42,495        11.1          3.7
--------------------------------  -------------  ------------  -------------  ----------  -----------
 Discretionary wrapped funds(6)         (1,643)       (1,191)        (1,221)        38.0         34.6
--------------------------------  -------------  ------------  -------------  ----------  -----------

 Total Investment Management
  FUMA                                   42,422        38,456         41,274        10.3          2.8
--------------------------------  -------------  ------------  -------------  ----------  -----------
(5) Of the GBP7.8 billion of financial adviser linked business
that we reported in the 2018 report and accounts, GBP7.5 billion is
included in Discretionary and GBP0.3 billion in Execution Only.
(6) Discretionary wrapped funds represent funds operated by Unit
Trusts, managed by both Investment Management teams and Unit Trusts
fund managers.
The FTSE 100 Index closed at 7,168 on 16 October 2019, a
decrease of 3.2% since 30 September 2019. Investment Management fee
income in the fourth quarter is dependent upon the value of funds
under management at 31 December 2019.
17 October 2019
For further information contact:
Rathbone Brothers Plc
Tel: 020 7399 0000
Email: shelly.patel@rathbones.com
Paul Stockton, Chief Executive
Jennifer Mathias, Group Finance Director
Shelly Patel, Head of Investor Relations
Camarco (Communications adviser to Rathbones)
Tel: 020 3757 4984
Email: ed.gascoigne-pees@camarco.co.uk
Ed Gascoigne-Pees
Hazel Stevenson
Rathbone Brothers Plc
Rathbones provides individual investment and wealth management
services for private clients, charities, trustees and professional
partners. We have been trusted for generations to manage and
preserve our clients' wealth. Our tradition of investing and acting
responsibly has been with us from the beginning and continues to
lead us forward. Our ambition is to be recognised as the UK's most
responsible wealth manager.
Rathbones has over 1,400 staff in 15 UK locations and Jersey;
its headquarters is 8 Finsbury Circus, London.
rathbones.com
This information is provided by RNS, the news service of the
London Stock Exchange. RNS is approved by the Financial Conduct
Authority to act as a Primary Information Provider in the United
Kingdom. Terms and conditions relating to the use and distribution
of this information may apply. For further information, please
contact rns@lseg.com or visit www.rns.com.
END
TSTGGGPCUUPBGQQ
(END) Dow Jones Newswires
October 17, 2019 02:00 ET (06:00 GMT)
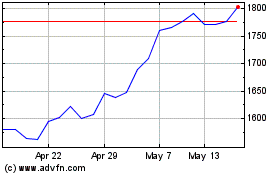
Rathbones (LSE:RAT)
Historical Stock Chart
From Jun 2024 to Jul 2024

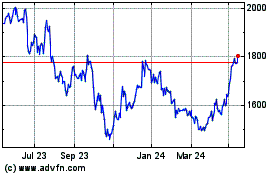
Rathbones (LSE:RAT)
Historical Stock Chart
From Jul 2023 to Jul 2024
