TIDMRAT
RNS Number : 1987R
Rathbone Brothers PLC
01 November 2011
Rathbone Brothers Plc
Rathbones attracts GBP300m of net new funds in the third
quarter
This statement is an Interim Management Statement in accordance
with the UK Listing Authority's Disclosure and Transparency
Rules.
Chief Executive, Andy Pomfret, commented:
"Rathbones' tailored and flexible approach to investment
management continues to be attractive to clients in spite of the
considerable market uncertainties. The total net inflow of funds
under management in Rathbone Investment Management was GBP284
million (7.4% on an annualised basis) in the three months ended 30
September 2011.
"We expect markets to remain nervous for the remainder of 2011
as inflation expectations and European sovereign debt uncertainties
continue to dominate the headlines. Despite this our brand and
commitment to client service continue to position us well to grow
as a leading provider of high-quality personalised discretionary
investment services."
Highlights:
-- Total funds under management were GBP15.1 billion at 30
September 2011, down 3.2% from GBP15.6 billion at 31 December 2010,
compared to a decrease of 13.1% in the FTSE 100 Index and a
decrease of 8.2% in the FTSE APCIMS Balanced Index in the first
nine months of 2011.
-- Underlying annualised rate of net organic growth of funds
under management in Rathbone Investment Management was 4.6% for the
quarter ended 30 September 2011 (2010: 5.7%) and 6.2% for the nine
months ended 30 September 2011 (2010: 4.6%). The total rate of
annualised rate of net inflows of 7.4% (2010: 10.4%) for the three
months ended 30 September 2011 includes acquired inflows of GBP109
million.
-- Net operating income of GBP102.5 million in Rathbone
Investment Management for the nine months ended 30 September 2011
was 15.7% higher than 2010 as net growth in new funds combined with
higher average market levels. The average value of the FTSE 100
Index on our three principal charging dates(1) in 2011 was 5694
compared to 5403 on the same dates in 2010, a rise of 5.4%. The
average FTSE APCIMS Balanced Index, measured on the same dates,
rose 4.5%. Income from new charges applied to client accounts from
the second quarter of 2011 is in line with expectations.
-- Net interest and other income of GBP9.7 million in the first
nine months of 2011 includes a one off gain of GBP1.1 million from
the sale of long stock positions, arising from acquisitions in the
1990s and previously held in nominee, which are no longer required.
Excluding this gain, net interest and other income of GBP8.6m
(2010: GBP7.7 million) increased 11.7%.
-- Rathbone Unit Trust Management experienced a fourth
consecutive quarter of net inflows attracting GBP62 million in the
nine months ended 30 September 2011. Lower markets in the third
quarter reduced funds under management from GBP1.1 billion at 30
June 2011 to GBP1.0 billion at 30 September 2011.
-- The project to relocate our London head office to 1 Curzon
Street is proceeding according to plan. The move is expected to
take place by the end of February 2012.
Net operating income
                             3 months ended 30 September(1)      9 months ended 30 September(1)
=======================  ==================================  ==================================
                              2011       2010        Change        2011      2010        Change
=======================  =========  =========  ============  ==========  ========  ============
                              GBPm       GBPm             %        GBPm      GBPm             %
=======================  =========  =========  ============  ==========  ========  ============
Investment management
=======================  =========  =========  ============  ==========  ========  ============
- Fees                        19.2       17.3          11.0        59.1      48.1          22.9
=======================  =========  =========  ============  ==========  ========  ============
- Commissions                  8.0        8.6         (7.0)        28.0      27.3           2.6
=======================  =========  =========  ============  ==========  ========  ============
- Net interest & other
 income(2)                     4.0        2.5          60.0         9.7       7.7          26.0
=======================  =========  =========  ============  ==========  ========  ============
- Fees from advisory
 services(3)                   1.8        1.9         (5.3)         5.7       5.5           3.6
=======================  ---------  ---------  ------------  ----------  --------  ------------
                              33.0       30.3           8.9       102.5      88.6          15.7
=======================  =========  =========  ============  ==========  ========  ============
Unit trusts                    2.1        1.8          16.7         6.2       5.5          12.7
=======================  =========  =========  ============  ==========  ========  ============
Net operating income          35.1       32.1           9.3       108.7      94.1          15.5
=======================  ---------  ---------  ------------  ----------  --------  ------------

Average FTSE 100 Index
 on principal charging
 dates(1)                     5128       5549         (7.6)        5694      5403           5.4
=======================  =========  =========  ============  ==========  ========  ============
(1) The principal charging dates for investment management
clients are 5 April, 30 June, 30 September and 31 December. Unit
trust income accrues on daily levels of funds under management.
(2) Net interest and other income includes a one off gain of
GBP1.1 million from the sale of long stock positions, purchased
following acquisitions in the 1990's and previously held in
nominee, which are no longer required.
(3) Including income from trust, tax and pension advisory services.
Funds under management
                                      3 months ended     9 months ended
                                       30 September       30 September
                                      2011      2010     2011      2010
                                      GBPm      GBPm     GBPm      GBPm
(i) Investment management
 Opening FUM (1 July / 1 January)     15,270   12,413    14,586   12,158
 Inflows                                 473      500     1,542    1,553
----------------------------------  --------  -------  --------  -------
  Organic new business                   364      354     1,322    1,050
  Acquired new business                  109      146       220      503
----------------------------------  --------  -------  --------  -------
 Outflows                              (189)    (177)     (643)    (630)
 Market adjustment                   (1,510)      851   (1,441)      506
                                    --------  -------  --------  -------
 Closing FUM (30 September)           14,044   13,587    14,044   13,587
                                    --------  -------  --------  -------

 Underlying annualised rate of
  net organic growth                    4.6%     5.7%      6.2%     4.6%
 Annualised rate of net inflows         7.4%    10.4%      8.2%    10.1%


(ii) Unit trusts
 Opening FUM (1 July / 1 January)      1,089      877     1,043      935
 Inflows                                  63       33       174       95
 Outflows                               (40)     (41)     (112)    (144)
 Market adjustment                      (99)       82      (92)       65
                                    --------  -------  --------  -------
 Closing FUM (30 September)            1,013      951     1,013      951
                                    --------  -------  --------  -------

 Total FUM (30 September)             15,057   14,538    15,057   14,538
                                    --------  -------  --------  -------

 Net fund inflows/(outflows)
 Investment management                   284      323       899      923
 Unit trusts                              23      (8)        62     (49)
                                    --------  -------  --------  -------
 Total net fund flows                    307      315       961      874
                                    --------  -------  --------  -------
The FTSE 100 Index closed at 5544 on 31 October 2011, a rise of
8.1% since 30 September 2011, which has increased the value of
funds under management. Investment management fee income in the
fourth quarter is dependent upon the value of funds under
management at 31 December 2011.
1 November 2011
For further information contact:
 Rathbone Brothers Plc              Quill PR
  Tel: 020 7399 0000                 Tel: 020 7466 5054
  email: marketing@rathbones.com

  Mark Nicholls, Chairman            Hugo Mortimer-Harvey
  Andy Pomfret, Chief Executive
  Paul Stockton, Finance Director
Rathbone Brothers Plc
Rathbone Brothers Plc is a leading independent provider of
high-quality, personalised investment and wealth management
services for private investors, charities and trustees. This
includes discretionary investment management, tax and financial
planning and unit trusts.
Rathbones has some 750 staff in 11 UK locations and Jersey, and
has its headquarters in New Bond Street, London.
www.rathbones.com
This information is provided by RNS
The company news service from the London Stock Exchange
END
IMSQFLFXFBFEFBE
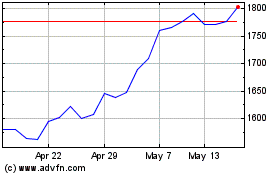
Rathbones (LSE:RAT)
Historical Stock Chart
From Jun 2024 to Jul 2024

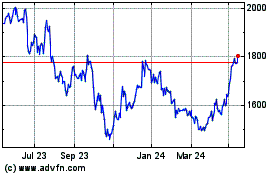
Rathbones (LSE:RAT)
Historical Stock Chart
From Jul 2023 to Jul 2024
