International Public Partnership Ld Full Year -2-
March 26 2015 - 3:01AM
UK Regulatory
  (2) Cash dividend payments to investors are paid from net operating
  cash flow (after taking into account financing costs).
  (3) The forecast date for payment of the full year dividend is June
  2015.
  (4) See pages 24 and 25 for information relating to the Company's
  use of sensitivity analysis.
  (5) Source: Bloomberg. Share price plus dividends assumed to be reinvested.
  (6) Represent investments in equity and/or subordinated debt in underlying
  projects ('Risk Capital').
  (7) Represent investments in Risk Capital and senior debt in underlying
  projects.
Investments have included schools, courts houses, health
facilities, police stations, and other public sector buildings,
rail operations, rolling stock leasing entities and offshore
electricity transmission asset owning entities. The Company's
investments are located in the UK, Europe, Australia and
Canada.
Whilst the Company is able to invest in regulated infrastructure
and other forms of economic infrastructure projects, to date it has
primarily invested in entities holding physical infrastructure and
associated services procured under Public Private Partnerships
('PPP')/Private Finance Initiative ('PFI') and similar processes.
The Case Study on page 28 provides more detail on these
structures.
Features of International Public Partnerships Limited and its
investment portfolio are:
Portfolio
> Geographically diversified with a portfolio across seven countries in a variety of sectors
> A focus on yielding operational investments but with some
'in construction' with prospects for future capital
appreciation
> A significant degree of inflation linkage to investment
returns - a 1% per annum increase in the anticipated rate of
inflation across the portfolio would imply a 0.85% per annum
increase in return across the portfolio
> The Investment Adviser has historical success in
originating and developing investment opportunities in new sectors
with low risks relative to returns
> A high degree of management and control of underlying
investments to support sustained performance
> Access to a pool of pre-emptive and other preferred rights
to increase investment in assets that have proven performance
within the existing portfolio
> Operational performance and income from underlying
investments is predominantly founded on asset availability, not
demand, usage or other non-controllable variables
> A significant portion (14.3%) of the portfolio is
investment in secured senior debt (where no other debt ranks in
preference to the Company's investment in the asset)
Shareholder Returns
   >   Strong track record of delivering consistent dividend growth and capital appreciation
   >   Share liquidity through listing and trading on the London Stock Exchange
> 8-9% per annum target internal rate of return set at the
time of initial public offering in 2006
Governance
   >   Experienced independent leadership and strong corporate governance
   >   Long-term alignment of interest with the Investment Adviser and asset manager
Market Information
   >   FTSE listed since November 2006 with an initial market capitalisation of GBP300 million
   >   Member of the FTSE 250 and FTSE All Share indices
   >   GBP1,132 million market capitalisation as at 31 December 2014 (2013: GBP972.9 million)
   >   836.2 shares in issue as at 31 December 2014 (2013: 760.6 million)
   >   The Company's shares are eligible for ISA/PEPs and SIPPs transfers
> The Company's shares are excluded from the Financial
Conduct Authority restrictions which apply to non-mainstream
investment products and can therefore be recommended by independent
financial advisers to their clients (see page 47 for detail)
Investment Adviser Fees
   >   Competitive fee structure
   >   1.2% per annum of gross asset value ('GAV') of investments bearing construction risk
   >   For fully operational assets:
-- 1.2% per annum of the GAV (excluding uncommitted cash from
capital raisings) up to GBP750 million
-- 1.0% per annum where GAV (excluding uncommitted cash from
capital raisings) is between GBP750 million and GBP1.5 billion
-- 0.9% per annum where GAV (excluding uncommitted cash from
capital raisings) value exceeds GBP1.5 billion
   >   1.5% asset origination fee of the value of new investments to cover acquisition due diligence
   >   Investment Adviser bears the risk of abortive transaction origination cost.
   >   No incentive or performance fees
   >   Further details can be found in the Strategic Report on pages 15 and 16

 Sector Breakdown                          Geographical Split
======================================    ===================================

 112 investments in infrastructure         Invested in selected jurisdictions
  projects(1) across a variety of           which meet the Company's risk
  sectors                                   and return requirements
 Investment Type                           Mode of Acquisition / Asset Status
======================================    ===================================

 Invested across the capital structure
  taking into account appropriate          Early stage investor to maximise
  risks to returns                          capital growth opportunities
 Project Ownership                         Concession Length
======================================    ===================================

 Preference to hold majority stakes        Weighted average portfolio life
                                            of 22 years
(1) Information provided in charts above is based on 31 December
2014 portfolio investment fair value. Unless otherwise stated the
Company and its subsidiaries hold investments in equity,
subordinated debt and senior loans made to entities owning or
operating infrastructure concession, assets or related businesses
most of which are investment subsidiaries.
(2) Primary stage investor - asset developed or originated by
the Investment Adviser or predecessor team.
(3) Later stage investor - asset acquired from another investor in the secondary market.
A complete listing of the Group's investments can be found in
note 23 of the financial statements and further information about
each of these investments is available on the Company's
website.
Significant movements in the Group's portfolio for the year
ended 31 December 2014 can be found on page 19 of the Strategic
Report.
                                                                                         % Investment
                                                           Status                                Fair   % Investment
                                                            at            % Holding             Value     Fair Value
                                                            31 Dec         at 31               31 Dec         31 Dec
  Name of Project    Location             Sector            2014           Dec 2014              2014           2013
 =================  ===================  ===============  =============  =============  =============  =============
  Lincs Offshore     Lincolnshire,        Energy           Operational    100% Risk            16.29%            N/A
   Transmission(1)    England              Transmission                    Capital(2)
 =================  ===================  ===============  =============  =============  =============  =============
  Diabolo Rail       Brussels,                                            100% Risk
   Link(3)            Belgium             Transport        Operational     Capital(2)          13.80%         15.55%
 =================  ===================  ===============  =============  =============  =============  =============
                                                                          100% Risk
                                                                           Capital(2)
                                                                           and 100%
  Ormonde Offshore   Cumbria,             Energy                           senior
   Transmission       England              Transmission    Operational     debt                12.52%         14.90%
 =================  ===================  ===============  =============  =============  =============  =============
  Royal Children's   Victoria,                                            100% Risk
   Hospital           Australia           Health           Operational     Capital(2)           4.47%          5.18%
 =================  ===================  ===============  =============  =============  =============  =============
                     Various,                                             49% Risk
  BeNEX Rail          Germany             Transport        Operational     Capital(2)           3.52%          4.18%
 =================  ===================  ===============  =============  =============  =============  =============
                                                                          100% Risk
                                                                           Capital(2)
  Hereford &                                                               and 100%
   Worcester         Worcestershire,                                       senior
   Courts             England             Courts           Operational     debt                 3.20%          4.09%
 =================  ===================  ===============  =============  =============  =============  =============
  Northampton        Northamptonshire,                                    100% Risk
   Schools            England             Education        Operational     Capital(2)           3.18%          3.91%
 =================  ===================  ===============  =============  =============  =============  =============
                     Alberta,                                             100% Risk
  Alberta Schools     Canada              Education        Operational     Capital(2)           2.65%          3.45%
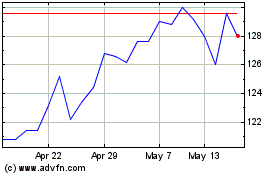
International Public Par... (LSE:INPP)
Historical Stock Chart
From Jun 2024 to Jul 2024

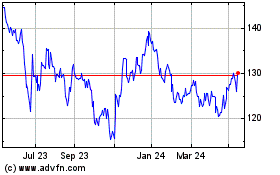
International Public Par... (LSE:INPP)
Historical Stock Chart
From Jul 2023 to Jul 2024
