Contingent equity consideration                               600,000              - 
 Retained earnings - deficit                              (26,332,437)   (25,207,673) 
                                                         -------------  ------------- 
 
 Equity attributable to equity holders 
  of the parent                                              5,541,235    (1,725,340) 
 Non-controlling interest                                            -        898,010 
                                                         -------------  ------------- 
 
 Total equity/(deficit)                                      5,541,235      (827,330) 
                                                         -------------  ------------- 
 
 Non-current liabilities 
 Borrowings                                        12        2,498,212      2,425,025 
 Share of net liabilities of jointly 
  controlled entities                               9                -        509,599 
 
 Total non-current liabilities                               2,498,212      2,934,624 
                                                         -------------  ------------- 
 
 Current liabilities 
 Amounts due to customers under construction 
  contracts                                                          -      1,110,090 
 Trade and other payables                                    2,411,471      2,595,766 
 Borrowings                                        12        1,351,519      9,661,645 
 Finance lease liabilities                                           -            373 
                                                         -------------  ------------- 
                                                             3,762,990     13,367,874 
 Liabilities associated with assets 
  held for resale                                                    -      2,630,581 
 
 Total current liabilities                                   3,762,990     15,998,455 
                                                         -------------  ------------- 
 
 Total equity and liabilities                               11,802,437     18,105,749 
                                                         =============  ============= 
 

Kedco plc

Condensed Consolidated Statement of Changes in Equity

for the six months ended 31 December 2011 and the six months ended 31 December 2012


                                                                                                Attributable 
                                                                                                   to equity 
                                                                   Contingent    Share-based         holders 
                           Share        Share       Retained           equity        payment          of the    Non-controlling 
                         capital      premium       earnings    consideration        reserve          parent           interest         Total 
                             EUR          EUR            EUR              EUR            EUR             EUR                EUR           EUR 
 
  Balance at 1 
   July 2011           3,543,999   19,038,300   (22,316,689)                -        492,580         758,190            799,228     1,557,418 
 
  (Loss)/Profit 
   for the 
   financial 
   period                      -            -      (431,972)                -              -       (431,972)             65,276     (366,696) 
 
  Unrealised 
   foreign 
   exchange loss               -            -      (194,261)                -              -       (194,261)                  -     (194,261) 
 
  Balance at 31 
   December 2011       3,543,999   19,038,300   (22,942,922)                -        492,580         131,957            864,504       996,461 
                    ============  ===========  =============  ===============  =============  ==============  =================  ============ 
 
  Balance at 1 
   July 2012           4,106,808   19,375,525   (25,207,673)                -              -     (1,725,340)            898,010     (827,330) 
 
  Issue of 
   ordinary shares 
   in Kedco 
   plc                   951,296        4,959              -                -              -         956,255                  -       956,255 
 
  Conversion of 
   debt into 
   equity              5,724,229       44,046              -                -              -       5,768,275                  -     5,768,275 
 
  Issue of 
   ordinary shares 
   and contingent 
   equity 
   consideration 
   on acquisition 
   of subsidiary       1,393,867        6,133              -          600,000              -       2,000,000                  -     2,000,000 
 
  Share issue 
   costs                       -    (333,191)              -                -              -       (333,191)                  -     (333,191) 
 
  (Loss)/Profit 
   for the 
   financial 
   period                      -            -      (919,591)                -              -       (919,591)             32,865     (886,726) 
 
  Elimination of 
   profit from 
   jointly 
   controlled 
   entity                      -            -      (256,358)                -              -       (256,358)                  -     (256,358) 
 
  Disposal of 
   non-controlling 
   interest 
   in subsidiary               -            -              -                -              -               -          (930,875)     (930,875) 
  Unrealised 
   foreign 
   exchange gain               -            -         51,185                -              -          51,185                  -        51,185 
 
  Balance at 31 
   December 2012      12,176,200   19,097,472   (26,332,437)          600,000              -       5,541,235                  -     5,541,235 
                    ============  ===========  =============  ===============  =============  ==============  =================  ============ 


Kedco plc

Condensed Consolidated Statement of Cash Flows

for the six months ended 31 December 2012


                                                     Notes    6 months      6 months 
                                                                 ended         ended 
                                                                31 Dec        31 Dec 
                                                                  2012          2011 
 Cash flows from operating activities                              EUR           EUR 
 Loss before taxation                                        (886,726)     (366,696) 
 Adjustments for: 
 Depreciation of property, plant and equipment                 256,890       295,069 
 Amortisation of intangible assets                                   -           505 
 Profit on disposal of property, plant 
  and equipment                                               (83,537)      (13,710) 
 Loss on disposal of subsidiary                                  8,866             - 
 Unrealised foreign exchange gain                              146,260        70,788 
 Share of losses of jointly controlled 
  entities after tax                                            20,208       190,437 
 Decrease in provision for impairment 
  of trade receivables                                               -      (10,922) 
 Increase in impairment of inventories                       (177,571)     (169,442) 
 Decrease in deferred income                                   (4,293)       (5,151) 
 Interest expense                                              183,820       566,924 
 Interest income                                                     -         (241) 
                                                            ----------  ------------ 
 
 Operating cash flows before working capital 
  changes                                                    (536,083)       557,561 
 Decrease/(increase) in: 
    Amounts due from customers under construction 
     contracts                                                 843,212     8,027,508 
    Trade and other receivables                              (801,606)       726,346 
    Inventories                                                656,403       304,021 
  (Decrease)/increase in: 
    Amounts due to customers under construction 
     contracts                                               (110,090)       528,106 
    Trade and other payables                                 (426,694)   (4,248,933) 
 
                                                             (374,858)     5,894,609 
 Income taxes paid                                                   -             - 
                                                            ----------  ------------ 
 
 Net cash (used in)/from operating activities                (374,858)     5,894,609 
                                                            ----------  ------------ 
 
 Cash flows from investing activities 
 Payments for property, plant and equipment                  (146,701)     (729,511) 
 Proceeds from sale of property, plant 
  and equipment                                                109,584       382,708 
 Payments to acquire financial assets                                -   (6,361,966) 
 Net cash inflow on acquisition of subsidiaries       14       156,781             - 
 Net cash inflow on disposal of subsidiary            13       226,094             - 
 Interest received                                                   -           241 
                                                            ----------  ------------ 
 
 Net cash from/(used in) investing activities                  345,758   (6,708,528) 
                                                            ----------  ------------ 
 
 Cash flows from financing activities 
 Proceeds from borrowings                                      292,308     2,192,761 
 Repayments of borrowings                                    (182,925)   (1,653,260) 
 Proceeds from issue of equity                                 902,993             - 
 Payments for share issue costs                              (178,916)             - 
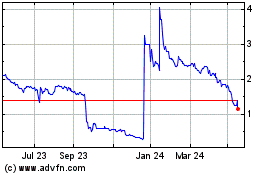
Eqtec (LSE:EQT)
Historical Stock Chart
From Aug 2024 to Sep 2024 Click Here for more Eqtec Charts.
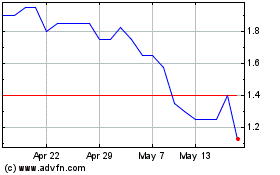
Eqtec (LSE:EQT)
Historical Stock Chart
From Sep 2023 to Sep 2024 Click Here for more Eqtec Charts.