AMERICAN BUSINESS BANK (Bank) (OTCBB: AMBZ) today reported net
income of $2,695,000 for the first quarter of 2014. Earnings per
share (basic) in the first quarter of 2014 were $0.54 versus $0.81
in the first quarter of 2013. During the first quarter of 2013, the
Bank was able to harvest gains from its securities portfolio to add
to capital. After adjusting results for securities gains on an
after-tax basis, “core” earnings per share increased 24% to $0.54
in the first quarter of 2014 versus $0.44 in the first quarter of
2013.
“In 2013 we took advantage of having a number of securities
where the market price made it advantageous for us to sell them at
a profit and increase our capital accounts. This year, we are back
to basics, generating the bulk of our income through the spread
business. With that in mind, we think that we have gotten off to a
great start in 2014,” said Wes Schaefer, Vice Chairman and CFO.
“Core earnings are what count. Opportunities will arise to take
one-time gains in our bond portfolio from time to time and we may
choose to take advantage of those situations. However, the strength
of our Bank is based upon earnings derived from providing our
clients with superior service every day. This is a very traditional
model and one that won’t change at American Business Bank,” said
Robert Schack, Chairman.
Total assets increased 6% or $79 million to $1.387 billion at
March 31, 2014 as compared to $1.308 billion at March 31, 2013. The
loan portfolio (net) increased 14% or $72 million to $588 million
at March 31, 2014 as compared to $516 million at March 31, 2013.
Deposits increased 11.6% or $130 million to $1.243 billion at March
31, 2014 as compared to $1.113 billion at March of 2013. Borrowings
from the Federal Home Loan Bank were reduced from $70 million at
the end of the first quarter in 2013 to $34 million at the end of
the first quarter in 2014.
During the first quarter of 2014, Net Interest Income increased
$509,000 or 5% to $10,068,000 from $9,559,000 during the first
quarter in 2013.
Non-Interest income during the first quarter of 2014 decreased
$2,188,000 to $522,000 from $2,710,000 during the first quarter of
2013. This change was centered in investment gains as mentioned
above.
Non-Interest expense during the first quarter of 2014 increased
$408,000 or 6.7% to $6,473,000 from $6,065,000 during the first
quarter in 2013.
Asset quality at the end of the first quarter of 2014 remains
excellent, with $279,000 of non-performing loans, or 0.05% of total
loans; and, no OREO. At the end of March 2014, the allowance for
loan losses stood at $11,661,000 or 1.94% of loans.
AMERICAN BUSINESS BANK, headquartered in downtown Los Angeles,
offers a wide range of financial services to the business
marketplace. Clients include wholesalers, manufacturers, service
businesses, professionals and non-profits. The Bank has opened four
Loan Production Offices in strategic areas including our Orange
County Office in Irvine, our South Bay Office in Torrance, our San
Fernando Valley Office in the Warner Center and our Inland Empire
Office in Ontario.
American Business Bank Figures in $000, except per share
amounts
CONSOLIDATED BALANCE SHEET
(unaudited)
As of:
March March Change
2014 2013 %
Assets:
Cash & Equivalents $ 62,170 $ 44,290 40.4 % Fed Funds Sold
3,000 1,000 200.0 % Interest Bearing Balances 28 28 0.0 %
Investment
Securities:
US Agencies 379,423 376,582 0.8 % Mortgage Backed Securities
149,878 170,832 -12.3 % State & Municipals 162,264 157,425 3.1
% Other 2,988 2,995 -0.2
% Total Investment Securities 694,553 707,834 -1.9 %
Gross
Loans:
Commercial Real Estate 362,397 292,808 23.8 % Commercial &
Industrial 191,905 191,709 0.1 % Other Real Estate 39,783 36,864
7.9 %
Other
5,642 5,220 8.1 % Total
Gross Loans 599,727 526,601 13.9 % Allowance for Loan & Lease
Losses (11,661 ) (10,211 ) 14.2 % Net
Loans 588,066 516,390 13.9 % Premises & Equipment 955 640 49.2
% Other Assets 38,274 37,929
0.9 %
Total Assets
$ 1,387,046 $
1,308,111 6.0 %
Liabilities:
Demand Deposits $ 577,242 $ 515,501 12.0 % Money Market 595,105
517,871 14.9 % Time Deposits and Savings 71,034
80,345 -11.6 % Total Deposits 1,243,381
1,113,717 11.6 % FHLB Advances / Other Borrowings 34,500 70,500
-51.1 % Other Liabilities 5,740
19,330 -70.3 %
Total Liabilities $
1,283,621 $ 1,203,547 6.7
%
Shareholders'
Equity:
Common Stock & Retained Earnings $ 110,364 $ 94,696 16.5 %
Accumulated Other Comprehensive Income / (Loss)
(6,939 ) 9,868 -170.3 %
Total Shareholders'
Equity $ 103,425 $
104,564 -1.1 %
Total Liabilities &
Shareholders' Equity $ 1,387,046
$ 1,308,111 6.0 %
Capital
Adequacy:
Tangible Common Equity / Tangible Assets 7.46 % 7.99 % -- Tier 1
Leverage Ratio 7.96 % 7.54 % -- Tier 1 Capital Ratio / Risk
Weighted Assets 15.95 % 15.96 % -- Total Risk-Based Ratio 17.20 %
17.22 % --
Per Share
Information:
Common Shares Outstanding 4,945,774 4,876,664 -- Book Value Per
Share $ 20.91 $ 21.44 -2.5 % Tangible Book Value Per Share $ 20.91
$ 21.44 -2.5 %
American Business Bank Figures in
$000, except per share amounts
CONSOLIDATED
INCOME STATEMENT (unaudited) For the 3-month
period ended: March March Change
2014 2013 %
Interest
Income:
Loans & Leases $ 6,551 $ 5,870 11.6 % Investment Securities
3,921 4,215 -7.0 % Total
Interest Income 10,472 10,085 3.8 %
Interest
Expense:
Money Market, NOW Accounts & Savings 321 368 -12.8 % Time
Deposits 71 104 -31.7 % Repurchase Agreements / Other Borrowings
12 54 -77.8 % Total
Interest Expense 404 526 -23.2 % Net Interest Income
10,068 9,559 5.3 % Provision for Loan Losses (300 )
(300 ) 0.0 % Net Interest Income After Provision for
Loan Losses 9,768 9,259 5.5 %
Non-Interest
Income:
Deposit Fees 325 270 20.4 % Realized Securities Gains 7 2,689 -99.7
% Other 190 (249 ) -176.3 %
Total Non-Interest Income 522 2,710 -80.7 %
Non-Interest
Expense:
Compensation & Benefits 3,909 3,691 5.9 % Occupancy &
Equipment 516 510 1.2 % Other 2,048
1,864 9.9 % Total Non-Interest Expense 6,473 6,065
6.7 % Pre-Tax Income 3,817 5,904 -35.3 % Provision
for Income Tax (1,122 ) (1,970 ) -43.0
%
Net Income $ 2,695 $
3,934 -31.5 % Less: After-Tax Realized Securities
Gains $ 5 $ 1,792
Core Net Income $ 2,690
$ 2,142 25.6 %
Per Share
Information:
Average Shares Outstanding (for the quarter) 4,945,774 4,876,664 --
Earnings Per Share - Basic $ 0.54 $ 0.81 -32.5 %
Earnings Per Share "CORE" - Basic
$ 0.54 $ 0.44 23.8 %
American Business Bank Figures
in $000, except per share amounts
March March Change 2014
2013 %
Performance
Ratios
Return on Average Assets (ROAA) 0.79 % 1.23 % -- Return on Average
Equity (ROAE) 10.76 % 15.06 % --
Return on Average Assets "CORE" (ROAA)
0.79 % 0.67 % --
Return on Average Equity "CORE" (ROAE)
10.74 % 8.20 % --
Asset Quality
Overview
Non-Performing Loans $ - $ 322 NA Loans 90+Days Past Due
279 933 -70.1 % Total
Non-Performing Loans $ 279 $ 1,255 -77.8 % Restructured
Loans (TDR's) $ 2,563 $ 6,472 -60.4 % Other Real Estate
Owned 0 0 -- ALLL / Gross Loans 1.94 % 1.94 % -- ALLL /
Non-Performing Loans * 4179.57 % 813.63 % -- Non-Performing Loans /
Total Loans * 0.05 % 0.24 % -- Non-Performing Assets / Total Assets
* 0.02 % 0.10 % -- Net Charge-Offs $ (209 ) $ 626 -- Net
Charge-Offs / Average Gross Loans -0.04 % 0.12 % --
* Excludes Restructured Loans
AMERICAN BUSINESS BANKWes E. SchaeferVice Chairman and Chief
Financial Officer213-430-4000
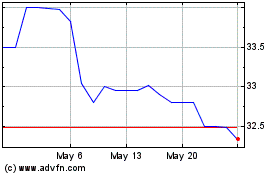
American Business Bank (QX) (USOTC:AMBZ)
Historical Stock Chart
From Dec 2024 to Jan 2025

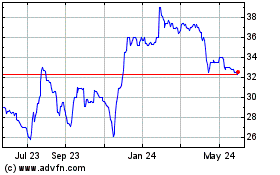
American Business Bank (QX) (USOTC:AMBZ)
Historical Stock Chart
From Jan 2024 to Jan 2025
