United States
Securities and Exchange Commission
Washington, D.C. 20549
FORM 6-K
Report of Foreign Private Issuer
Pursuant to Rule 13a-16 or 15d-16
of the
Securities Exchange Act of 1934
For the month of
June 2024
Vale S.A.
Praia de Botafogo nº 186, 18º andar,
Botafogo
22250-145 Rio de Janeiro, RJ, Brazil
(Address of principal executive office)
(Indicate by check mark whether the registrant files
or will file annual reports under cover of Form 20-F or Form 40-F.)
(Check One)
Form 20-F x Form 40-F ¨

Vale informs on estimates update
Rio de Janeiro, June 20th, 2024
– Vale S.A. (“Vale”) informs that it has updated its estimates for its Energy Transition Metal’s division and
that these must be considered as such:
Energy Transition Metal’s Asset Review (“AR”)
– Estimated total expenditure in the next 3 years¹ ²:
| U$ million |
2024-2026 |
| Capacity run rate & reliability |
US$ 650 |
| Sudbury and Salobo |
US$ 150 |
| Exploration & Project development |
US$ 350 |
¹ Includes costs, expenses, and capital
expenditures. About 50% refers to CAPEX and 50% to one-off costs & expenses. Value in real terms. ² Current CAPEX guidance for
Vale remains unchanged as per Vale guidance provided on Dec 5, 2023 (Vale Day 2023).
Estimated production volumes:
| Year |
2026
(baseline) 3 |
2026
(after Asset Review early wins) 4 |
| Copper (kt) |
375-410 |
+5% |
| Nickel (kt) |
190-210 |
+10% |
3As per Vale guidance provided on
Dec 5, 2023 (Vale Day 2023).
4 Copper and Nickel production can
reach 394-431 kt (+5% in relation to the 2026 baseline) and 209-231kt (+10% in relation to the 2026 baseline) , respectively, considering
the following early wins (3 years): (i) implementation of the Asset Review initiatives, with total expenditure of US$ 800 million (capacity
run rate & reliability and Sudbury and Salobo); and (ii) 30% productivity uplift in Sudbury.
All-in components (real terms):
| Year |
2026
(baseline) 6 |
2026
(after Asset Review early wins) 7 |
| Copper All-in costs5 (US$/t) |
3,500-4,000 |
-10% |
| Nickel All-in costs5 (US$/t) |
11,500-13,500 |
-10% |
5 Excluding sustaining investments.
For Nickel, not considering the effects of PTVI's divestment.
6 As per Vale guidance provided on
Dec 5, 2023 (Vale Day 2023).
7 Copper and Nickel All-in Costs
could reach US$3,150-3,600/t (-10% in relation to the 2026 baseline) and US$10,350-12,150/t (-10% in relation to the 2026 baseline), respectively,
considering the following early wins (3 years): (i) implementation of the initiatives of the Asset Review, with total expenditure of US$
800 million (capacity run rate & reliability and Sudbury and Salobo); (ii) 30% productivity uplift and cost dilution in Sudbury; and
(iii) 10% cost reduction in Salobo operations.
Estimated production capacity:
| Year |
Asset capacity
pre-asset review
(2026) |
Asset
potential
(2028+) |
Long term
potential
(2030+) |
| Copper (kt)8 |
~400 |
~500 |
~900 |
| Nickel (kt)9 |
~210 |
~250 |
>300 |
8 Considering the Asset Review initiatives,
Copper operations can reach production capacity of: (i) 400 ktpy by 2026, considering Salobo (~220 ktpy), Sossego (~80 ktpy), and Canadian
operations (~100 ktpy); (ii) ~500 ktpy by 2028, considering an ~100 ktpy addition, in relation to 2026, coming from Salobo (+60 ktpy),
Sossego (+15 kpty), and Canadian operations (+25 kpty); (iii) ~900 ktpy after 2030, considering the asset potential by 2028 and the additions
from Hu’u (300-350 ktpy), Alemão (~60 ktpy), and North Hub (70-100 ktpy).
9 Considering the Asset Review initiatives,
the Nickel operations can reach production capacity of: (i) ~210 ktpy by 2026, considering Sudbury (~60 ktpy), Thompson (~10 ktpy), Voisey’s
Bay (~45 ktpy), Onça Puma (~40 ktpy), and PTVI (~55 ktpy); (ii) ~250 ktpy by 2028, considering a ~40 ktpy addition, in relation
to 2026, coming from Sudbury (+25 ktpy) and Voisey’s Bay (+15 ktpy); (iii) >300 ktpy after 2030, considering the asset potential
by 2028 and the additions from Indonesia JV’s (~20 ktpy) and Ultramafics in Thompson (~40 ktpy).
Energy Transition Metal’s Asset Review (“AR”)
– Estimated incremental EBITDA, total expenditure, and additional value creation:
| |
Early wins (up to 2026) |
Deliver asset potential (2028+) |
| EBITDA10 |
~US$ 400 million |
~US$ 1.3 billion |
| Total expenditure 11 |
~US$ 800 million |
~US$ 3.3 billion |
| Value creation12 |
~US$ 2 billion |
~US$ 6 billion |
10 Refers to incremental EBITDA for the business considering
the implementation of asset review initiatives. Nickel price of $18,000/t; copper price of $8,500/t; copper TC/RC discount of US$ 500/t
of payable copper. For every US$ 1,000/t variation in nickel price, Δ EBITDA varies by ~US$ 40 million; for every US$ 1,000/t variation
in copper price, Δ EBITDA varies by ~US$ 100 million.
11 Includes CAPEX and one-off costs.
12 Considering an average industry
multiple reference of 7.The additional value creation is achieved by multiplying the EBITDA figures per 7 (industry multiple) and discounting
the total expenditure.
All other guidances remain unchanged. Vale
clarifies that the information provided in this document represent only an expectation, hypothetical data that by no means constitute
a promise of performance by Vale and/or its management. The estimates presented involve market factors that are beyond Vale’s control
and, therefore, can be subject to new changes. Additionally, Vale informs that will file again in due course the item 11 of its Reference
Form, in the period required by the Resolution CVM nº 80/2022.
Gustavo Duarte Pimenta
Executive Vice President, Finance and Investor
Relations
For further information, please contact:
Vale.RI@vale.com
Thiago Lofiego: thiago.lofiego@vale.com
Luciana Oliveti: luciana.oliveti@vale.com
Mariana Rocha: mariana.rocha@vale.com
Pedro Terra: Pedro.terra@vale.com
This press release may include statements that
present Vale’s expectations about future events or results. All statements, when based upon expectations about the future, involve
various risks and uncertainties. Vale cannot guarantee that such statements will prove correct. These risks and uncertainties include
factors related to the following: (a) the countries where we operate, especially Brazil and Canada; (b) the global economy; (c) the capital
markets; (d) the mining and metals prices and their dependence on global industrial production, which is cyclical by nature; and (e) global
competition in the markets in which Vale operates. To obtain further information on factors that may lead to results different from those
forecast by Vale, please consult the reports Vale files with the U.S. Securities and Exchange Commission (SEC), the Brazilian Comissão
de Valores Mobiliários (CVM) and in particular the factors discussed under “Forward-Looking Statements” and “Risk
Factors” in Vale’s annual report on Form 20-F.
Signatures
Pursuant to the requirements of the Securities
Exchange Act of 1934, the registrant has duly caused this report to be signed on its behalf by the undersigned, thereunto duly authorized.
| |
Vale S.A.
(Registrant) |
| |
|
| |
By: |
/s/ Thiago Lofiego |
| Date: June 20, 2024 |
|
Director of Investor Relations |
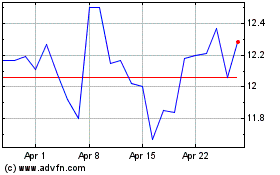
Vale (NYSE:VALE)
Historical Stock Chart
From May 2024 to Jun 2024

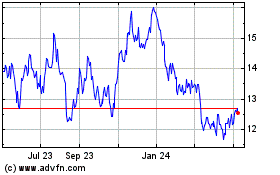
Vale (NYSE:VALE)
Historical Stock Chart
From Jun 2023 to Jun 2024
