Oil States Announces Third Quarter 2003 Earnings HOUSTON, Oct. 27
/PRNewswire-FirstCall/ -- Oil States International, Inc. today
reported net income of $11.3 million, or $0.23 per diluted share,
for the quarter ended September 30, 2003 compared to net income of
$10.2 million, or $0.21 per diluted share, in the third quarter of
2002. The Company generated $177.2 million of revenues and $23.9
million of EBITDA (defined as net income plus interest, taxes,
depreciation and amortization) compared to $154.6 million and $20.1
million, respectively, in the third quarter of 2002(1). This
year-over-year improvement of 14.6% in revenues and 18.8% in EBITDA
was the result of an improvement in North American drilling
activity, continued strong deepwater development and incremental
results of the Company's acquisitions completed in the third
quarter 2002. The Company's effective tax rate for the third
quarter of 2003 was 26.6% compared to an effective tax rate of
22.6% in the third quarter of 2002. Capital expenditures during the
third quarter of 2003 totaled $11.4 million. For the first nine
months of 2003, the Company reported net income of $34.9 million,
or $0.71 per diluted share, on revenues of $526.3 million and
EBITDA of $73.1 million. For the corresponding period in 2002, the
Company reported net income of $28.2 million, or $0.58 per diluted
share, on revenues of $456.0 million and $56.0 million of EBITDA.
This performance represents year-over-year revenue and EBITDA
increases of 15.4% and 30.7%, respectively. BUSINESS SEGMENT
RESULTS Well Site Services Benefiting from increases in North
American drilling and workover activity, Well Site Services'
revenues and EBITDA were $56.6 million and $12.5 million,
respectively, in the third quarter of 2003 compared to $44.3
million and $8.9 million in the third quarter of 2002. With a year-
over-year increase of 33.7% in the North American drilling rig
count and a year-over-year increase of 20.1% in the North American
workover rig count, the Company had improved utilization and
efficiency of its Well Site Services' assets, generating increases
of 27.8% and 40.6% in revenues and EBITDA, respectively. These
improved activity levels were partially offset by continued
weakness in the US offshore drilling and workover markets, limiting
the Company's ability to achieve full utilization or to
significantly increase prices in several of its Well Site Services
business lines. Offshore Products For the third quarter of 2003,
Offshore Products generated $59.3 million of revenues and $10.9
million of EBITDA, compared to $55.5 million of revenues and $10.9
million of EBITDA in the third quarter of 2002. Gross margins
decreased slightly to 27.3% in the third quarter of 2003 from 28.0%
in the third quarter of 2002, as a result of product mix and lower
realized margins on rig equipment products. Offshore Products'
backlog was $72.9 million at September 30, 2003 compared to $80.2
million at June 30, 2003 and $104.0 million at September 30, 2002.
Tubular Services Tubular Services generated $61.3 million of
revenues and $1.9 million of EBITDA in the third quarter of 2003
compared to $54.8 million of revenues and $1.7 million of EBITDA in
the third quarter of 2002. The average US rig count increased 27.6%
to 1,088 rigs in the third quarter of 2003 compared to 853 average
rigs working in the third quarter of 2002. Tubular Services shipped
69.8 thousand tons of OCTG in the third quarter of 2003 compared to
59.2 thousand tons in the third quarter of 2002. The third quarter
of 2002 results included $4.5 million of higher margin
international sales which did not occur in the third quarter of
2003. The Company's revenues per ton in the third quarter of 2003
declined 4.8% from those of the third quarter 2002. Gross margin
for the third quarter of 2003 declined to 5.9% compared to 6.4% in
the third quarter of 2002. OCTG inventory at September 30, 2003 was
$72.7 million compared to $72.6 million at June 30, 2003 and $56.0
million at September 30, 2002. As of September 30, 2003,
approximately 60% of Oil States' OCTG inventory was committed to
customer orders. "We performed very well in the third quarter of
2003 as North American drilling and workover activity continued to
strengthen," stated Douglas E. Swanson, Oil States' President and
Chief Executive Officer. "We continued to experience good
utilization of our assets and shipments of our products. However,
the low level of offshore drilling in the US continued to hamper
our Well Site Services and Tubular Services segments. Looking
forward to the remainder of 2003, we expect to see continued strong
land drilling activity in the US and Canada. However, we do not
foresee a meaningful recovery in deeper land and offshore drilling
activity in the US by year end." Oil States International, Inc. is
a diversified solutions provider for the oil and gas industry. With
locations around the world, Oil States is a leading manufacturer of
products for deepwater production facilities and subsea pipelines,
and a leading supplier of a broad range of services to the oil and
gas industry, including production-related rental tools, work force
accommodations and logistics, oil country tubular goods
distribution, hydraulic workover services and land drilling
services. Oil States is organized in three business segments --
Offshore Products, Tubular Services and Well Site Services, and is
publicly traded on the New York Stock Exchange under the symbol
OIS. Please visit Oil States International's website at
http://www.oilstatesintl.com/ . The foregoing contains
forward-looking statements within the meaning of the Securities Act
of 1933 and Section 21E of the Securities Exchange Act of 1934.
Forward-looking statements are those that do not state historical
facts and are, therefore, inherently subject to risks and
uncertainties. The forward-looking statements included herein are
based on current expectations and entail various risks and
uncertainties that could cause actual results to differ materially
from those forward-looking statements. Such risks and uncertainties
include, among other things, risks associated with the general
nature of the oilfield service industry and other factors discussed
within the "Business" section of the Form 10-K for the year ended
December 31, 2002 filed by Oil States with the SEC on March 13,
2003. (1) The term EBITDA consists of net income plus interest,
taxes, depreciation and amortization. EBITDA is not a measure of
financial performance under generally accepted accounting
principles. You should not consider it in isolation from or as a
substitute for net income or cash flow measures prepared in
accordance with generally accepted accounting principles or as a
measure of profitability or liquidity. Additionally, EBITDA may not
be comparable to other similarly titled measures of other
companies. The Company has included EBITDA as a supplemental
disclosure because its management believes that EBITDA provides
useful information regarding our ability to service debt and to
fund capital expenditures and provides investors a helpful measure
for comparing its operating performance with the performance of
other companies that have different financing and capital
structures or tax rates. The Company uses EBITDA to compare and to
monitor the performance of its business segments to other
comparable public companies and as a benchmark for the award of
incentive compensation under its annual incentive compensation
plan. Oil States International, Inc. Statements of Operations (in
thousands, except per share amounts) (unaudited) Three Months Ended
Nine Months Ended September 30, September 30, 2003 2002 2003 2002
Revenue $177,170 $154,595 $526,310 $456,033 Costs and expenses:
Cost of sales 139,355 121,756 411,653 363,599 Selling, general and
administrative 14,306 12,697 42,037 36,888 Depreciation and
amortization 6,978 5,942 20,347 16,871 Other expense / (income)
(162) 46 3 (69) Operating income 16,693 14,154 52,270 38,744
Interest income 157 143 319 354 Interest expense (1,654) (1,158)
(5,020) (3,172) Other income 248 30 509 354 Income before income
taxes 15,444 13,169 48,078 36,280 Income tax expense (4,110)
(2,981) (13,221) (8,065) Net income applicable to common stock
$11,334 $10,188 $34,857 $28,215 Net income per common share Basic
$0.23 $0.21 $0.72 $0.58 Diluted $0.23 $0.21 $0.71 $0.58 Average
shares outstanding Basic 48,554 48,297 48,515 48,260 Diluted 49,212
48,934 49,155 48,827 Segment Data: Revenues Well Site Services
$56,560 $44,268 $188,284 $161,747 Offshore Products 59,303 55,500
174,050 134,727 Tubular Services 61,307 54,827 163,976 159,559
Total Revenues $177,170 $154,595 $526,310 $456,033 EBITDA (A) Well
Site Services $12,474 $8,872 $43,907 $32,840 Offshore Products
10,934 10,901 28,880 24,060 Tubular Services 1,948 1,669 4,619
3,035 Corporate / Other (1,437) (1,316) (4,280) (3,966) Total
EBITDA $23,919 $20,126 $73,126 $55,969 Operating Income / (Loss)
Well Site Services $7,315 $4,591 $29,426 $20,468 Offshore Products
9,063 9,376 23,200 19,504 Tubular Services 1,761 1,515 3,951 2,578
Corporate / Other (1,446) (1,328) (4,307) (3,806) Total Operating
Income $16,693 $14,154 $52,270 $38,744 Oil States International,
Inc. Consolidated Balance Sheets (in thousands) (unaudited) Sep.
30, Jun. 30, Dec. 31, 2003 2003 2002 Assets Current assets Cash
$15,001 $14,039 $11,118 Accounts receivable 135,462 120,445 116,875
Inventory 132,584 132,434 118,338 Prepaid and other current assets
6,958 7,714 9,475 Total current assets 290,005 274,632 255,806
Property, plant and equipment, net 179,704 175,358 167,146 Goodwill
217,525 216,134 213,051 Other long term assets 8,838 9,005 8,213
Total assets $696,072 $675,129 $644,216 Liabilities and
stockholders' equity Current liabilities Accounts payable and
accrued liabilities $92,263 $82,385 $84,049 Income taxes payable
5,700 4,554 1,229 Current portion of long term debt 841 868 913
Deferred Revenue 7,885 7,434 8,949 Other current liabilities 841
860 1,402 Total current liabilities 107,530 96,101 96,542 Long term
debt 126,369 129,416 133,292 Deferred income taxes 19,859 19,961
18,303 Postretirement healthcare and other benefits 2,739 3,386
5,280 Other liabilities 4,393 3,967 3,220 Total liabilities 260,890
252,831 256,637 Stockholders' equity Common stock 486 486 485
Additional paid-in capital 328,605 328,351 327,801 Retained
earnings 99,243 87,909 64,386 Accumulated other comprehensive
income/(loss) 7,189 5,838 (4,921) Treasury stock (341) (286) (172)
Total stockholders' equity 435,182 422,298 387,579 Total
liabilities and stockholders' equity $696,072 $675,129 $644,216 Oil
States International, Inc. Additional Quarterly Segment and
Operating Data (unaudited) Three Months Ended September 30, 2003
2002 Additional Well Site Services Financial Data ($ in thousands)
Revenues Accommodations $29,001 $20,749 Hydraulic Workover Services
7,679 7,146 Rental Tools 10,504 8,333 Land Drilling 9,376 8,040
Total Revenues $56,560 $44,268 EBITDA (A) Accommodations $5,872
$3,864 Hydraulic Workover Services 1,145 1,179 Rental Tools 3,011
1,719 Land Drilling 2,446 2,110 Total EBITDA $12,474 $8,872
Operating Income Accommodations $3,798 $2,094 Hydraulic Workover
Services 240 402 Rental Tools 1,528 537 Land Drilling 1,749 1,558
Total Operating Income $7,315 $4,591 Well Site Services
Supplemental Operating Data Accommodations Operating Statistics
Average Mandays Served 4,279 3,304 Average Camps Rented Canadian
Side-by-Side Camps 11 8 US Offshore Steel Buildings (10 foot wide)
77 87 Hydraulic Workover Services Operating Statistics Average
Units Available 29 27 Utilization 29.8% 29.9% Average Day Rate ($
in thousands per day) $9.6 $9.6 Average Daily Cash Margin ($ in
thousands per day) $2.3 $2.9 Land Drilling Operating Statistics
Average Rigs Available 15 13 Utilization 91.6% 95.0% Implied Day
Rate ($ in thousands per day) $7.4 $7.1 Implied Daily Cash Margin
($ in thousands per day) $2.1 $2.0 Offshore Products Backlog ($ in
millions) $72.9 $104.0 Tubular Services Operating Data Shipments
(Tons in thousands) 69.8 59.2 Quarter end Inventory ($ in
thousands) $72,740 $56,012 (A) EBITDA consists of net income plus
interest, taxes, depreciation, and amortization. See footnote (4)
on page 23 of the Company's Annual Report on Form 10K for the year
December 31, 2002 for an explanation of this non-GAAP financial
measure. DATASOURCE: Oil States International, Inc. CONTACT: Cindy
B. Taylor of Oil States International, Inc., +1-713-652-0582 Web
site: http:www.oilstatesintl.com
Copyright
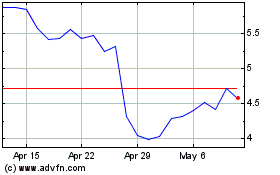
Oil States (NYSE:OIS)
Historical Stock Chart
From Jun 2024 to Jul 2024

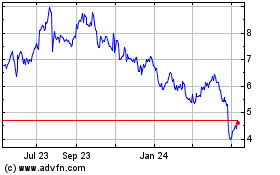
Oil States (NYSE:OIS)
Historical Stock Chart
From Jul 2023 to Jul 2024
