Owens-Illinois Beats Zacks Estimates - Analyst Blog
April 28 2011 - 12:51PM
Zacks
Owens-Illinois
Inc. (OI) delivered adjusted EPS of
47 cents in its first quarter ended March 31, 2011, beating the
Zacks Consensus Estimate of 45 cents.
However, the result dropped
a penny from 48 cents in the year-ago quarter.
Adjusted EPS excluded a
3-cent restructuring charge. Including the said charge, the company
reported EPS of 44 cents, compared with 48 cents in the year-ago
quarter.
Total revenue rose 11% year
over year to $1,719 million and outperformed the Zacks Consensus
Estimate of $1,662 million. While the combined effect of price and
product mix was essentially flat compared to the prior year, global
shipments increased 7%. Acquisitions completed in 2010 represented
more than 5% of this volume growth. The remaining increase was
driven by organic growth. Revenues increased across all operating
regions, led by South America in particular, which posted a
year-over-year growth of 54%.
Costs & Margin
Performance
Manufacturing and delivery
costs increased 11% year over year to $1,386 million. Gross profit
increased 11% to $333 million and gross margin expanded 10 basis
points to 19.4% in the quarter. Selling and administrative expenses
went up 18% year over year to $142 million and, as a percentage of
sales, improved 50 basis points to 8.3%.
Segment operating profit
increased to $199 million from $193 million in the year-ago quarter
driven by higher capacity utilization and footprint realignment
efforts conducted in the prior year.
Financial
Position
Owens-Illinois had cash and
cash equivalents of $430 million as of March 31, 2011, down from
$640 million as of December 31, 2010. The company used operating
cash flows of $85 million in the quarter compared with $16 million
of cash generated from operating activities in the year-ago
quarter.
Net debt was $3.933
billion, an increase of $295 million from fiscal 2010. The increase
in net debt was primarily due to the use of free cash flow of $158
million to support seasonally higher working capital levels as well
as $110 million on account of foreign currency translation.
Available liquidity on March 31, 2011 was $728 million under the
company’s global revolving credit facility.
Asbestos-related cash
payments during the quarter were $33 million compared with $34
million in the year-ago quarter. New lawsuits and claims filed
during the first three months of 2011 were consistent with the same
period last year. The number of pending asbestos-related lawsuits
and claims approximated 5,900 as of March 31, 2011, flat with
year-end 2010 levels.
Outlook
Management did not provide
specific guidance for the upcoming quarter or the fiscal year.
However it expects higher shipment and production levels compared
to the prior year due to the recent acquisitions and improving
demand for glass packaging.
Even though the company
anticipates elevated cost inflation given high energy prices in
Europe, it believes an improving demand profile should create a
more receptive environment to pass along incremental costs in 2011.
The company expects investments in marketing and innovation to
benefit future earnings. Free cash flow is expected to improve to
approximately $300 million in 2011.
Our
Take
The company’s substantial
debt remains a matter of concern. Furthermore, the company has
asbestos liabilities and may record additional charges, in the
future, for estimated asbestos-related costs. In addition, raw
material cost inflation and increased interest expense on
additional borrowings to fund recent and future acquisitions may
affect its earnings. It is currently a Zacks #4 Rank (short-term
'Sell' recommendation).
Perrysburg, Ohio-based
Owens-Illinois is the world's largest glass container manufacturer
for food and beverage products, including beer, wine, spirits and
non-alcoholic drinks. The company commands market leadership in
each of its four operating regions - Asia Pacific, Europe, Latin
America and North America. Owens-Illinois competes with
Silgan
Holdings Inc. (SLGN) and privately-held Anchor
Glass Container Corporation and Compagnie de
Saint-Gobain.
OWENS-ILLINOIS (OI): Free Stock Analysis Report
SILGAN HOLDINGS (SLGN): Free Stock Analysis Report
Zacks Investment Research
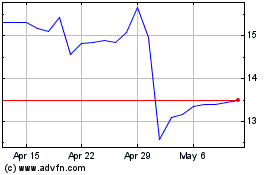
OI Glass (NYSE:OI)
Historical Stock Chart
From Jun 2024 to Jul 2024

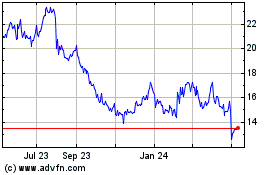
OI Glass (NYSE:OI)
Historical Stock Chart
From Jul 2023 to Jul 2024
