Form 6-K - Report of foreign issuer [Rules 13a-16 and 15d-16]
July 23 2024 - 8:18AM
Edgar (US Regulatory)
UNITED STATES
SECURITIES AND EXCHANGE COMMISSION
Washington, D.C. 20549
Form 6-K
REPORT OF
FOREIGN PRIVATE ISSUER
PURSUANT TO RULE 13a-16 OR
15d-16 UNDER
THE SECURITIES EXCHANGE ACT OF 1934
For the month of July 2024
Commission File Number: 000-53445
KB Financial Group Inc.
(Translation of registrant’s name into English)
26, Gukjegeumyung-ro 8-gil, Yeongdeungpo-gu, Seoul 07331, Korea
(Address of principal executive office)
Indicate by check mark whether
the registrant files or will file annual reports under cover of Form 20-F or Form 40-F.
Form 20-F ☒
Form 40-F ☐
Preliminary Operating Results for the First Half of 2024
On July 23, 2024, KB Financial Group Inc. (“KB Financial Group”) held an earnings conference and released its preliminary operating results for
the first half of fiscal year 2024. The following tables reflect the key figures released during the conference. The presentation materials for the conference, which contain further details, are available at KB Financial Group’s website
(http://www.kbfg.com).
The preliminary figures presented herein are based on International Financial Reporting Standards as adopted by the Republic of
Korea (“K-IFRS”) and are currently being reviewed by KB Financial Group’s independent auditors and are therefore subject to change.
| 1. |
Preliminary Operating Results of KB Financial Group (Consolidated) |
|
|
|
|
|
|
|
|
|
|
|
|
|
|
|
|
|
|
|
|
|
|
|
| (Won in millions, %) |
|
2Q 2024 |
|
|
1Q 2024 |
|
|
% Change
Increase
(Decrease) (Q to
Q) |
|
|
2Q 2023 |
|
|
% Change
Increase
(Decrease) (Y to
Y) |
|
| Operating revenue |
|
Specified Quarter |
|
|
19,918,040 |
|
|
|
23,352,449 |
|
|
|
(14.71 |
) |
|
|
15,901,595 |
|
|
|
25.26 |
|
| |
Cumulative |
|
|
43,270,489 |
|
|
|
23,352,449 |
|
|
|
— |
|
|
|
40,734,330 |
|
|
|
6.23 |
|
| Net operating
profit |
|
Specified Quarter |
|
|
2,302,268 |
|
|
|
2,355,448 |
|
|
|
(2.26 |
) |
|
|
2,052,822 |
|
|
|
12.15 |
|
| |
Cumulative |
|
|
4,657,716 |
|
|
|
2,355,448 |
|
|
|
— |
|
|
|
4,192,849 |
|
|
|
11.09 |
|
| Profit before income
tax |
|
Specified Quarter |
|
|
2,369,252 |
|
|
|
1,407,484 |
|
|
|
68.33 |
|
|
|
1,960,469 |
|
|
|
20.85 |
|
| |
Cumulative |
|
|
3,776,736 |
|
|
|
1,407,484 |
|
|
|
— |
|
|
|
4,004,335 |
|
|
|
(5.68 |
) |
| Profit for the
period |
|
Specified Quarter |
|
|
1,710,680 |
|
|
|
1,063,214 |
|
|
|
60.90 |
|
|
|
1,504,631 |
|
|
|
13.69 |
|
| |
Cumulative |
|
|
2,773,894 |
|
|
|
1,063,214 |
|
|
|
— |
|
|
|
3,014,922 |
|
|
|
(7.99 |
) |
| Profit attributable to
shareholders of the parent company |
|
Specified Quarter |
|
|
1,732,225 |
|
|
|
1,049,133 |
|
|
|
65.11 |
|
|
|
1,498,916 |
|
|
|
15.57 |
|
| |
Cumulative |
|
|
2,781,358 |
|
|
|
1,049,133 |
|
|
|
— |
|
|
|
3,007,624 |
|
|
|
(7.52 |
) |
|
|
|
| Notes: 1) |
|
“Operating revenue” represents the sum of interest income, fee and commission income, insurance income, reinsurance income, gain on financial assets/liabilities at fair value through profit or loss, other insurance finance
income and other operating income. |
| 2) |
|
KB Financial Group’s preliminary operating results for the first half of 2024 and the operating results for the first quarter of 2024 reflect the application of the variable fee approach for measuring insurance liabilities,
which was adopted in the fourth quarter of 2023 in accordance with the IFRS17 actuarial assumption guidelines of the Financial Supervisory Service. For comparison purposes, the figures for the first half of 2023 above have been restated
retrospectively to reflect such application. |
| 2. |
Preliminary Operating Results of Kookmin Bank (Consolidated) |
|
|
|
|
|
|
|
|
|
|
|
|
|
|
|
|
|
|
|
|
|
|
|
| (Won in millions, %) |
|
2Q 2024 |
|
|
1Q 2024 |
|
|
% Change
Increase
(Decrease)
(Q to Q) |
|
|
2Q 2023 |
|
|
% Change
Increase
(Decrease)
(Y to Y) |
|
| Operating
revenue |
|
Specified Quarter |
|
|
11,822,663 |
|
|
|
14,403,010 |
|
|
|
(17.92 |
) |
|
|
8,817,685 |
|
|
|
34.08 |
|
| |
Cumulative |
|
|
26,225,673 |
|
|
|
14,403,010 |
|
|
|
— |
|
|
|
23,736,807 |
|
|
|
10.49 |
|
| Net operating
profit |
|
Specified Quarter |
|
|
1,421,558 |
|
|
|
1,440,393 |
|
|
|
(1.31 |
) |
|
|
1,222,012 |
|
|
|
16.33 |
|
| |
Cumulative |
|
|
2,861,951 |
|
|
|
1,440,393 |
|
|
|
— |
|
|
|
2,490,152 |
|
|
|
14.93 |
|
| Profit before income
tax |
|
Specified Quarter |
|
|
1,510,892 |
|
|
|
496,625 |
|
|
|
204.23 |
|
|
|
1,188,087 |
|
|
|
27.17 |
|
| |
Cumulative |
|
|
2,007,517 |
|
|
|
496,625 |
|
|
|
— |
|
|
|
2,423,251 |
|
|
|
(17.16 |
) |
| Profit for the
period |
|
Specified Quarter |
|
|
1,089,094 |
|
|
|
377,253 |
|
|
|
188.69 |
|
|
|
919,941 |
|
|
|
18.39 |
|
| |
Cumulative |
|
|
1,466,347 |
|
|
|
377,253 |
|
|
|
— |
|
|
|
1,841,865 |
|
|
|
(20.39 |
) |
| Profit attributable to
shareholders of the parent company |
|
Specified Quarter |
|
|
1,116,338 |
|
|
|
389,535 |
|
|
|
186.58 |
|
|
|
926,992 |
|
|
|
20.43 |
|
| |
Cumulative |
|
|
1,505,873 |
|
|
|
389,535 |
|
|
|
— |
|
|
|
1,858,508 |
|
|
|
(18.97 |
) |
| Note: |
“Operating revenue” represents the sum of interest income, fee and commission income, gain on
financial assets/liabilities at fair value through profit or loss and other operating income. |
| 3. |
Preliminary Operating Results of KB Securities Co., Ltd. (“KB Securities”) (Consolidated)
|
|
|
|
|
|
|
|
|
|
|
|
|
|
|
|
|
|
|
|
|
|
|
|
| (Won in millions, %) |
|
2Q 2024 |
|
|
1Q 2024 |
|
|
% Change
Increase
(Decrease) (Q to
Q) |
|
|
2Q 2023 |
|
|
% Change
Increase
(Decrease)
(Y to Y) |
|
| Operating
revenue |
|
Specified Quarter |
|
|
2,273,350 |
|
|
|
3,460,114 |
|
|
|
(34.30 |
) |
|
|
1,805,906 |
|
|
|
25.88 |
|
| |
Cumulative |
|
|
5,733,464 |
|
|
|
3,460,114 |
|
|
|
— |
|
|
|
6,130,156 |
|
|
|
(6.47 |
) |
| Net operating
profit |
|
Specified Quarter |
|
|
243,362 |
|
|
|
253,337 |
|
|
|
(3.94 |
) |
|
|
194,063 |
|
|
|
25.40 |
|
| |
Cumulative |
|
|
496,699 |
|
|
|
253,337 |
|
|
|
— |
|
|
|
458,262 |
|
|
|
8.39 |
|
| Profit before income
tax |
|
Specified Quarter |
|
|
233,655 |
|
|
|
243,044 |
|
|
|
(3.86 |
) |
|
|
142,728 |
|
|
|
63.71 |
|
| |
Cumulative |
|
|
476,699 |
|
|
|
243,044 |
|
|
|
— |
|
|
|
331,540 |
|
|
|
43.78 |
|
| Profit for the
period |
|
Specified Quarter |
|
|
180,614 |
|
|
|
198,853 |
|
|
|
(9.17 |
) |
|
|
110,304 |
|
|
|
63.74 |
|
| |
Cumulative |
|
|
379,467 |
|
|
|
198,853 |
|
|
|
— |
|
|
|
252,254 |
|
|
|
50.43 |
|
| Profit attributable to
shareholders of the parent company |
|
Specified Quarter |
|
|
179,528 |
|
|
|
199,335 |
|
|
|
(9.94 |
) |
|
|
110,345 |
|
|
|
62.70 |
|
| |
Cumulative |
|
|
378,863 |
|
|
|
199,335 |
|
|
|
— |
|
|
|
252,239 |
|
|
|
50.20 |
|
|
|
|
| Notes: 1) |
|
Based on KB Securities’ consolidated financial statements, as a result of which the figures differ from KB Securities’ earnings results to be released at KB Financial Group’s earnings conference for the first half of
2024, which are based on KB Financial Group’s consolidated financial statements. |
| 2) |
|
“Operating revenue” represents operating income based on KB Securities’ financial statements. |
SIGNATURES
Pursuant to the requirements of the Securities Exchange Act of 1934, the registrant has duly caused this report to be signed on its behalf by
the undersigned, thereunto duly authorized.
|
|
|
|
|
|
|
|
|
|
|
KB Financial Group Inc. |
|
|
|
|
(Registrant) |
|
|
|
| Date: July 23, 2024 |
|
|
|
By: /s/ Jae Kwan Kim |
|
|
|
|
(Signature) |
|
|
|
|
|
|
|
Name: Jae Kwan Kim |
|
|
|
|
Title: Senior Executive Vice President and Chief Finance Officer |
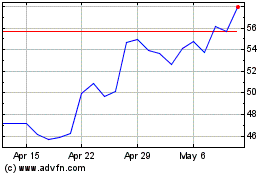
KB Financial (NYSE:KB)
Historical Stock Chart
From Dec 2024 to Jan 2025

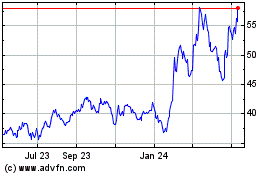
KB Financial (NYSE:KB)
Historical Stock Chart
From Jan 2024 to Jan 2025
