Enzo Biochem Reports First Quarter Fiscal Year 2025 Results and Provides a Company Update
December 16 2024 - 4:17PM

Enzo Biochem, Inc. (NYSE: ENZ) (“Enzo” or the “Company”) today
announced financial results for the fiscal first quarter ended
October 31, 2024.
First Quarter Highlights
- Enzo ended the first quarter with aggregate cash and cash
equivalents of $47.7 million. The net cash used in operating
activities during the first quarter decreased by $4.4 million
compared to the prior year.
- The Company's first-quarter revenue of $6.2 million declined
year-over-year by 20% due to declining market demand related to
general continued headwinds in the life sciences tools space.
Recent Events
- The declared special cash dividend of $0.10 per share on
its common stock was paid on December 2, 2024 to the holders of
record as of the close of business on November 15, 2024.
- Jon Couchman became a director of the Company and member of the
Company’s Audit Committee, Nominating & Governance Committee
and Compensation Committee effective November 22, 2024. Mr.
Couchman is the Managing Member of Couchman Management LLC, an
investment management company through which he manages private
investments. Mr. Couchman has significant public company director
experience and has served in various executive leadership
roles.
About Enzo Biochem
Enzo Biochem, Inc. has operated as a life sciences company for
over 45 years. The primary business of Enzo today is conducted
through its Life Sciences division, Enzo Life Sciences, which
focuses on labeling and detection technologies from DNA to whole
cell analysis, including a comprehensive portfolio of thousands of
high-quality products, including antibodies, genomic probes,
assays, biochemicals, and proteins. The Company’s proprietary
products and technologies play central roles in translational
research and drug development areas, including cell biology,
genomics, assays, immunohistochemistry, and small molecule
chemistry. The Company monetizes its technology primarily via sales
through our global distribution network and licensing. For more
information, please visit enzo.com or follow Enzo Biochem
on X and LinkedIn.
Forward-Looking Statements
Except for historical information, the matters discussed in this
release may be considered "forward-looking" statements within the
meaning of Section 27A of the Securities Act of 1933, as amended,
and Section 21E of the Securities Exchange Act of 1934, as amended.
Such statements include declarations regarding the intent, belief
or current expectations of the Company and its management,
including those related to cash flow, gross margins, revenues and
expenses, which are dependent on a number of factors outside of the
control of the Company, including, inter alia, the markets for the
Company’s products, cost of goods sold, other expenses, government
regulations, litigation, and general business conditions. See Risk
Factors in the Company’s Form 10-K for the fiscal year ended July
31, 2024. Investors are cautioned that any such forward-looking
statements are not guarantees of future performance and involve a
number of risks and uncertainties that could materially affect
actual results. The Company disclaims any obligations to update any
forward-looking statement as a result of developments occurring
after the date of this release.
Enzo Biochem ContactsFor Enzo
Biochem:Patricia Eckert, Chief Financial OfficerEnzo
Biochem631-755-5500peckert@enzo.com
Use of Non-GAAP Financial Measures by Enzo
The non-GAAP financial measures contained in this press release
(including, without limitation, Adjusted net loss, EBITDA, and
Adjusted EBITDA) are not GAAP measures of the Company’s financial
performance or liquidity and should not be considered as
alternatives to net income (loss) as a measure of financial
performance or cash flows from operations as measures of liquidity,
or any other performance measure derived in accordance with GAAP. A
reconciliation of such non-GAAP measures is included in the
presentation of the Company’s financial results for the quarter
ended October 31, 2024 contained herein and is also available in
the investor relations section of the Company’s website
(https://www.enzo.com).
The Company believes the presentation of these non-GAAP measures
provides useful additional information to investors because they
provide information consistent with that on which management
evaluates the financial performance of the Company. The Company
manages its business based on its operating cash flows. It refers
to EBITDA as its primary indicator of performance and refers to
Adjusted EBITDA to further exclude items of a non-recurring nature.
It is reasonable to expect that one or more excluded items will
occur in future periods, though the amounts recognized can vary
significantly from period to period. You are encouraged to evaluate
each adjustment used to determine a non-GAAP financial measure and
the reasons management considers it appropriate for supplemental
analysis. Our presentation of these measures should not be
construed as an inference that our future results will be
unaffected by unusual or non-recurring items.
We refer you to the tables attached to this press release, which
includes reconciliation tables of GAAP net loss to Adjusted net
loss and GAAP net loss to EBITDA and Adjusted EBITDA.
|
|
|
ENZO BIOCHEM, INC. |
|
(in thousands, except per share data) |
|
|
|
|
|
|
|
|
|
Three months ended |
|
Selected operations data: |
|
October 31, |
| |
|
(unaudited) |
|
|
|
|
|
|
|
|
|
|
2024 |
|
|
|
2023 |
|
|
|
|
|
|
|
|
Revenues |
|
$ |
6,213 |
|
|
$ |
7,806 |
|
|
|
|
|
|
|
|
Gross profit |
|
|
2,280 |
|
|
|
3,455 |
|
|
|
|
|
|
|
|
Gross profit % |
|
|
37 |
% |
|
|
44 |
% |
|
|
|
|
|
|
|
Operating loss |
|
|
(3,622 |
) |
|
|
(5,476 |
) |
|
|
|
|
|
|
|
Net loss from continuing operations |
|
|
(3,071 |
) |
|
|
(5,675 |
) |
|
Net loss from discontinued operations |
|
|
(305 |
) |
|
|
(941 |
) |
|
Net loss |
|
$ |
(3,376 |
) |
|
$ |
(6,616 |
) |
|
|
|
|
|
|
|
Net loss per common share – basic and diluted – Continuing
Operations |
|
|
($0.07 |
) |
|
|
($0.11 |
) |
|
Net loss per common share – basic and
diluted – Discontinued Operations |
|
|
$0.00 |
|
|
|
($0.02 |
) |
|
Total net loss per basic and diluted common share |
|
|
($0.07 |
) |
|
|
($0.13 |
) |
|
|
|
|
|
|
|
Weighted average common shares outstanding – basic and
diluted |
|
|
52,244 |
|
|
|
50,184 |
|
|
|
|
|
|
|
|
|
|
|
|
|
|
Selected balance sheet data: |
|
10/31/2024(unaudited) |
|
7/31/2024(unaudited) |
|
|
|
|
|
|
|
Cash and cash equivalents |
|
$ |
47,735 |
|
|
$ |
52,371 |
|
|
|
|
|
|
|
|
Working capital |
|
|
36,264 |
|
|
|
45,237 |
|
|
|
|
|
|
|
|
Stockholders' equity |
|
|
47,658 |
|
|
|
56,112 |
|
|
|
|
|
|
|
|
Total assets |
|
|
75,291 |
|
|
|
85,764 |
|
|
The following table presents a reconciliation of reported net loss
and basic and diluted net loss per share to Adjusted net loss and
Adjusted basic and diluted net loss per share for the three months
ended October 31, 2024. |
| |
|
|
|
ENZO BIOCHEM, INC. |
|
Non-GAAP Reconciliation Table |
|
(Unaudited, in thousands, except per share data) |
|
|
|
|
|
|
|
Three months ended |
|
|
|
October 31, |
|
|
|
|
2024 |
|
|
|
|
|
|
Reported GAAP loss |
|
$ |
(3,376 |
) |
|
Adjusted for: |
|
|
|
Discrete legal matters |
|
|
288 |
|
|
One time inventory provision |
|
|
252 |
|
|
Net loss from discontinued operations |
|
|
305 |
|
|
Adjusted net loss |
|
$ |
(2,531 |
) |
|
|
|
|
|
|
|
|
|
Weighted Shares Outstanding: |
|
|
|
Basic and diluted |
|
|
52,244 |
|
|
|
|
|
|
Basic and diluted earnings per share: |
|
|
|
Basic and diluted net loss per share GAAP |
|
|
($0.07 |
) |
|
|
|
|
|
Basic and diluted net loss per share non-GAAP |
|
|
($0.05 |
) |
|
The following table presents a reconciliation of reported GAAP net
loss for the three months ended October 31, 2024 to EBITDA and
Adjusted EBITDA: |
| |
|
|
|
ENZO BIOCHEM, INC. |
|
EBITDA & Adjusted EBITDA Reconciliation Table |
|
(Unaudited, in thousands) |
|
|
|
|
|
|
|
Three months ended |
|
|
|
October 31, |
|
|
|
|
2024 |
|
|
|
|
|
|
GAAP net loss |
|
$ |
(3,376 |
) |
|
Plus (minus): |
|
|
|
Depreciation and amortization |
|
|
319 |
|
|
Interest (income) expense, net |
|
|
(620 |
) |
|
EBITDA |
|
|
(3,677 |
) |
|
|
|
|
|
Adjusted for: |
|
|
|
Discrete legal matters |
|
|
288 |
|
|
One time inventory provision |
|
|
252 |
|
|
Net loss from discontinued operations |
|
|
305 |
|
|
Foreign exchange loss |
|
|
192 |
|
|
Adjusted EBITDA |
|
$ |
(2,640 |
) |
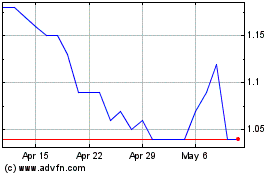
Enzo Biochem (NYSE:ENZ)
Historical Stock Chart
From Dec 2024 to Jan 2025

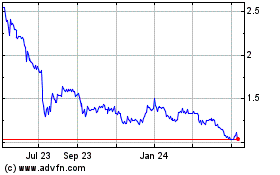
Enzo Biochem (NYSE:ENZ)
Historical Stock Chart
From Jan 2024 to Jan 2025
