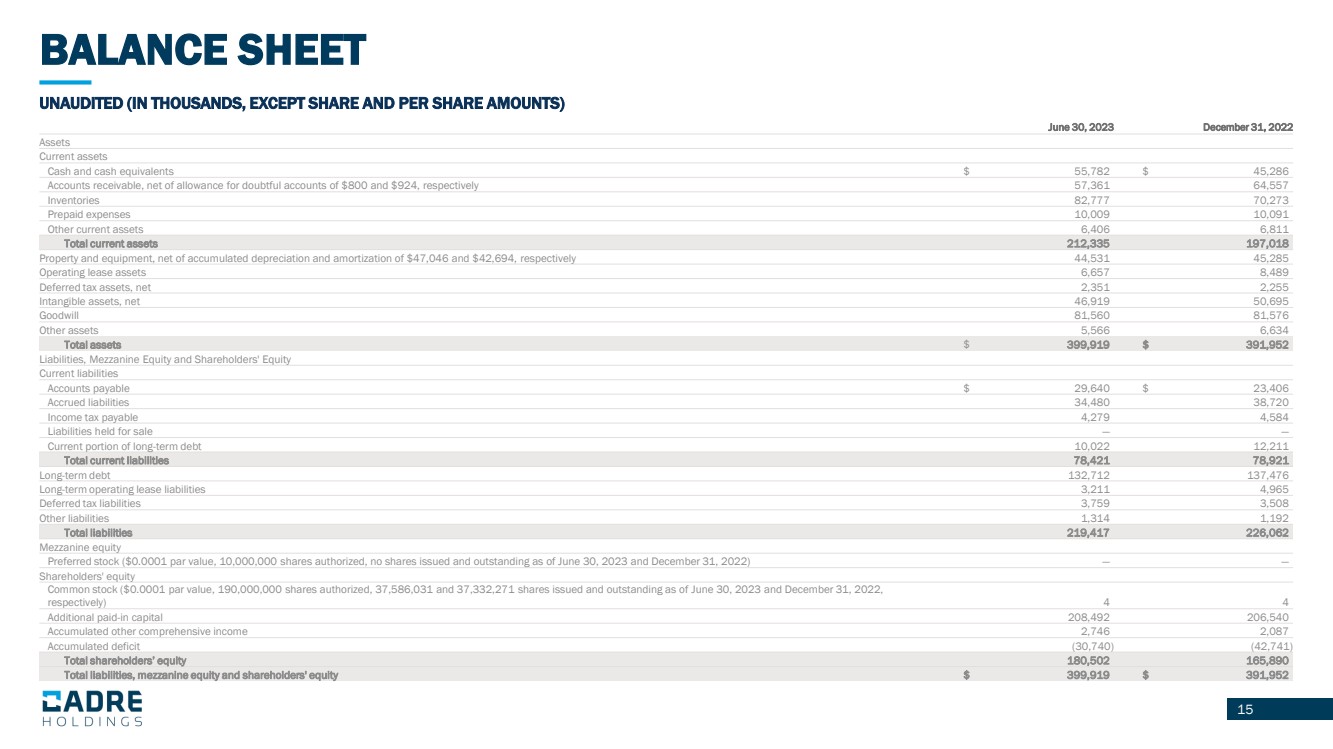
0001860543false00018605432023-08-082023-08-08

United States

Securities and Exchange Commission

Washington, D.C. 20549

Form 8-K

Current Report

Pursuant to Section 13 or 15(d) of the Securities Exchange Act of 1934

Date of Report (Date of earliest event reported): August 8, 2023

CADRE HOLDINGS, INC.

(Exact name of registrant as specified in its charter)

Delaware

001-40698

38-3873146

(State or other jurisdiction

(Commission File Number)

(IRS Employer

of incorporation)


Identification Number)

13386 International Pkwy

32218

Jacksonville, Florida

(Zip Code)

(Address of principal executive offices)


Registrant’s telephone number, including area code: (904) 741-5400

N/A

(Former name or former address, if changed since last report.)

Check the appropriate box below if the Form 8-K filing is intended to simultaneously satisfy the filing obligation of the registrant under any of the following provisions:

Written communications pursuant to Rule 425 under the Securities Act (17 CFR 230.425)

Soliciting material pursuant to Rule 14a-12 under the Exchange Act (17 CFR 240.14a-12)

Pre-commencement communications pursuant to Rule 14d-2(b) under the Exchange Act (17 CFR 240.14d-2(b))

Pre-commencement communications pursuant to Rule 13e-4(c) under the Exchange Act (17 CFR 240.13e-4(c))

Securities registered pursuant to Section 12(b) of the Act:

Title of each class

Trading Symbol

Name of each exchange on which registered

Common Stock, par value $0.0001

CDRE

New York Stock Exchange

Indicate by check mark whether the registrant is an emerging growth company as defined in Rule 405 of the Securities Act of 1933 (§230.405 of this chapter) or Rule 12b-2 of the Securities Exchange Act of 1934 (§240.12b-2 of this chapter).

Emerging growth company

If an emerging growth company, indicate by check mark if the registrant has elected not to use the extended transition period for complying with any new or revised financial accounting standards provided pursuant to Section 13(a) of the Exchange Act.  

Item 2.02 Results of Operations and Financial Condition

On August 8, 2023, Cadre Holdings, Inc. (the “Company”) issued a press release announcing its financial results for the quarter ended June 30, 2023. A copy of this press release is attached hereto as Exhibit 99.1 and is incorporated herein by reference. Attached hereto as Exhibit 99.2 and incorporated herein by reference is a presentation regarding the Company’s financial results for the quarter ended June 30, 2023.

The press release and presentation contain the non-GAAP measures earnings before interest, taxes, other income or expense, depreciation and amortization (“EBITDA”), adjusted EBITDA and adjusted EBITDA margin. The Company believes that the presentation of these non-GAAP measures provides useful information for the understanding of its ongoing operations and enables investors to focus on period-over-period operating performance, and thereby enhances the user's overall understanding of the Company's current financial performance relative to past performance and provides, along with the nearest GAAP measures, a baseline for modeling future earnings expectations. The non-GAAP measures are reconciled to comparable GAAP financial measures within the press release and the presentation. The Company cautions that non-GAAP measures should be considered in addition to, but not as a substitute for, the Company’s reported GAAP results. Additionally, the Company notes that there can be no assurance that the above referenced non-GAAP financial measures are comparable to similarly titled financial measures used by other publicly traded companies.

The information in Items 2.02 and 7.01 of this Current Report on Form 8-K (including Exhibits 99.1 and 99.2 attached hereto) shall not be deemed “filed” for purposes of Section 18 of the Securities Act of 1934, as amended, nor shall it be deemed incorporated by reference in any filing under the Securities Act of 1933, as amended, except as shall be expressly set forth by specific reference in such filing.

Item 7.01. Regulation FD Disclosure

The information set forth under Item 2.02 “Results of Operations and Financial Condition” is incorporated into this Item 7.01 by reference.

Item 9.01. Financial Statements and Exhibits

(d) Exhibits.

Exhibit

Description


99.1


Press Release, dated August 8, 2023 (furnished only).

99.2


Slide Presentation for Conference Call held on August 8, 2023 (furnished only).

104


Cover Page Interactive Data File (embedded within the Inline XBRL document).

SIGNATURES

Pursuant to the requirements of the Securities Exchange Act of 1934, as amended, the Company has duly caused this report to be signed on its behalf by the undersigned hereunto duly authorized.

Dated: August 8, 2023


CADRE HOLDINGS, INC.


By:

/s/ Blaine Browers


Name:Blaine Browers


Title:Chief Financial Officer

Exhibit 99.1

Cadre Holdings Reports Second Quarter 2023 Financial Results

Achieved Revenue, Net Income, Gross Margin and Adjusted EBITDA Growth

Achieves Record Quarterly Adjusted EBITDA of $22.8 Million and Adjusted EBITDA Margin of 18.8%

Expects Full-Year 2023 Net Sales of $427 to $484 Million and Raises 2023 Full-Year Adjusted EBITDA Range to $80 to $84 Million

JACKSONVILLE, Fla., August 8, 2023 – Cadre Holdings, Inc. (NYSE: CDRE) ("Cadre" or "the Company"), a global leader in the manufacturing and distribution of safety and survivability equipment for first responders, announced today its consolidated operating results for the three and six months ended June 30, 2023.

Net sales of $121.1 million for the second quarter; net sales of $232.8 million for the six months ended June 30, 2023
Gross profit margin of 41.9% for the second quarter; gross profit margin of 41.8% for the six months ended June 30, 2023
Net income of $11.0 million, or $0.29 per diluted share, for the second quarter; net income of $18.0 million, or $0.48 per diluted share, for the six months ended June 30, 2023
Adjusted EBITDA of $22.8 million for the second quarter; Adjusted EBITDA of $41.4 million for the six months ended June 30, 2023
Adjusted EBITDA margin of 18.8% for the second quarter; Adjusted EBITDA margin of 17.8% for the six months ended June 30, 2023
Declared quarterly cash dividend of $0.08 per share in July 2023

“Our significant momentum continued in the second quarter, as we generated improvements in quarterly net sales, adjusted EBITDA, and net income both sequentially and year-over-year,” said Warren Kanders, CEO and Chairman. “Based on outstanding strategic execution and strong and recurring demand for our best-in-class mission-critical safety and survivability equipment, we are pleased to increase our full year 2023 adjusted EBITDA outlook. We continued to make progress expanding margins in the second quarter, driven by further implementation of our resilient and proven operating model. Our Q2 adjusted EBITDA margin of 18.8% was our highest since going public, with gross margins increasing 530 basis points compared to last year.”

Mr. Kanders added, “The consistency and strength of our financial results are a testament to Cadre’s innovative product offering, premium brands, and superior execution, underpinned by leading positions in law enforcement, first responder and military markets. We remain on track to deliver record full year net sales in 2023 and are ideally positioned to capitalize on organic and inorganic opportunities ahead to further enhance our market leadership over the long-term. As we continue to actively evaluate a robust pipeline of potential M&A transactions, we are steadfast in our patient and disciplined approach and focus on high margin companies with leading market positions and strong recurring revenues and cash flows.”

Second Quarter and Six-Month 2023 Operating Results

For the quarter ended June 30, 2023, Cadre generated net sales of $121.1 million, as compared to $118.2 million for the quarter ended June 30, 2022. The increase was primarily the result of the Cyalume acquisition, armor and holster volume, and agency demand for hard goods, partially offset by timing for our EOD products.

For the six months ended June 30, 2023, Cadre generated net sales of $232.8 million, as compared to $222.6 million for the six months ended June 30, 2022, mainly driven by recent acquisitions, armor and holster volume, and agency demand for hard goods, partially offset by timing for our EOD products.

For the quarter ended June 30, 2023, Cadre generated gross profit of $50.7 million, as compared to $43.2 million for the quarter ended June 30, 2022. For the six months ended June 30, 2023, Cadre generated gross profit of $97.4 million, as compared to $83.4 million for the prior year period.


Gross profit margin was 41.9% for the quarter ended June 30, 2023, as compared to 36.6% for the quarter ended June 30, 2022, mainly driven by favorable pricing, favorable product mix, prior year amortization of inventory step up related to acquisitions and productivity net of inflation. Gross profit margin was 41.8% for the six months ended June 30, 2023, as compared to 37.5% for the prior year period.

Net income was $11.0 million for the quarter ended June 30, 2023, as compared to $4.4 million for the three months ended June 30, 2022. The increase resulted primarily from the change in year-over-year revenue and the increase in gross profit margin.

Net income was $18.0 million for the six months ended June 30, 2023, as compared to a net loss of $5.7 million for the prior year period, primarily due to the change in year-over-year revenue, the increase in gross profit margin, and a decrease in stock-based compensation expense.

Cadre generated $22.8 million of Adjusted EBITDA for the quarter ended June 30, 2023, as compared to $18.4 million for the quarter ended June 30, 2022. Adjusted EBITDA margin was 18.8% for the quarter ended June 30, 2023, as compared to 15.6% for the prior year period.

Cadre generated $41.4 million of Adjusted EBITDA for the six months ended June 30, 2023, as compared to $32.6 million for the prior period. Adjusted EBITDA margin was 17.8% for the six months ended June 30, 2023, as compared to 14.6% for the prior year period.

Product segment gross margin was 43.7% and 43.6% for the second quarter and first half of 2023, respectively, compared to 39.0% and 39.5% for the prior year periods.

Distribution segment gross margin was 23.1% and 23.6% for the second quarter and first half of 2023, respectively, compared to 18.2% and 21.4% for the prior year periods.

Liquidity, Cash Flows and Capital Allocation

Cash and cash equivalents increased by $10.5 million from $45.3 million as of December 31, 2022 to $55.8 million as of June 30, 2023.
Total debt decreased by $7.0 million from $149.7 million as of December 31, 2022, to $142.7 million as of June 30, 2023.
Net Debt (total debt net of cash and cash equivalents) decreased by $17.4 million from $104.4 million as of December 31, 2022, to $87.0 million as of June 30, 2023.
Capital expenditures totaled $1.5 million for the second quarter and $2.5 million for the six months ended June 30, 2023, compared with $1.4 million for the second quarter and $2.5 million for the six months ended June 30, 2022.

Dividend

On July 25, 2023, the Company announced that its Board of Directors declared a quarterly cash dividend of $0.08 per share, or $0.32 per share on an annualized basis. Cadre's dividend payment will be made on August 18, 2023, to shareholders of record as of the close of business on the record date of August 4, 2023. The declaration of any future dividend is subject to the discretion of the Company's Board of Directors.

2023 Outlook Update

As a result of the Company's second-quarter performance and management's outlook for the remainder of the year, Cadre increased its full-year Adjusted EBITDA guidance. For the full year 2023, Cadre expects to generate net sales in the range of $472 million to $484 million and Adjusted EBITDA in the range of $80 million to $84 million. We expect capital expenditures to be in the range of $8.0 million to $9.0 million.

Conference Call

Cadre management will host a conference call on Tuesday, August 8, 2023, at 5:00 PM EST to discuss the latest corporate developments and financial results. The dial-in number for callers in the US is (888)-510-2553 and the dial-in


number for international callers is (646)-960-0473. The access code for all callers is 1410384. A live webcast will also be available on the Company’s website at https://www.cadre-holdings.com/.

A replay of the call will be available through August 22, 2023. To access the replay, please dial (800)-770-2030 in the U.S. or +1-647-362-9199 if outside the U.S., and then enter the access code 1410384.

About Cadre

Headquartered in Jacksonville, Florida, Cadre is a global leader in the manufacturing and distribution of safety and survivability products for first responders. Cadre's equipment provides critical protection to allow users to safely and securely perform their duties and protect those around them in hazardous or life-threatening situations. The Company's core products include body armor, explosive ordnance disposal equipment, and duty gear. Our highly engineered products are utilized in over 100 countries by federal, state and local law enforcement, fire and rescue professionals, explosive ordnance disposal teams, and emergency medical technicians. Our key brands include Safariland® and Med-Eng®, amongst others.

Use of Non-GAAP Measures

The Company reports its financial results in accordance with U.S. generally accepted accounting principles (“GAAP”). The press release contains the non-GAAP measures: (i) earnings before interest, taxes, other income or expense, depreciation and amortization (“EBITDA”), (ii) adjusted EBITDA and (iii) adjusted EBITDA margin. The Company believes the presentation of these non-GAAP measures provides useful information for the understanding of its ongoing operations and enables investors to focus on period-over-period operating performance, and thereby enhances the user’s overall understanding of the Company’s current financial performance relative to past performance and provides, along with the nearest GAAP measures, a baseline for modeling future earnings expectations. Non-GAAP measures are reconciled to comparable GAAP financial measures within this press release. The Company cautions that non-GAAP measures should be considered in addition to, but not as a substitute for, the Company’s reported GAAP results. Additionally, the Company notes that there can be no assurance that the above referenced non-GAAP financial measures are comparable to similarly titled financial measures used by other publicly traded companies.

Forward-Looking Statements

Except for historical information, certain matters discussed in this press release may be forward-looking statements within the meaning of the Private Securities Litigation Reform Act of 1995. Forward-looking statements include but are not limited to all projections and anticipated levels of future performance. Forward-looking statements involve risks, uncertainties and other factors that may cause our actual results to differ materially from those discussed herein. Any number of factors could cause actual results to differ materially from projections or forward-looking statements in this press release, including, but not limited to, those risks and uncertainties more fully described from time to time in the Company’s public reports filed with the Securities and Exchange Commission, including under the section titled “Risk Factors” in the Company's Annual Report on Form 10-K, and/or Quarterly Reports on Form 10-Q, as well as in the Company’s Current Reports on Form 8-K. All forward-looking statements included in this press release are based upon information available to the Company as of the date of this press release and speak only as of the date hereof. We assume no obligation to update any forward-looking statements to reflect events or circumstances after the date of this press release.

Contact:

Gray Hudkins

Cadre Holdings, Inc.

203-550-7148

gray.hudkins@cadre-holdings.com

Investor Relations:

The IGB Group

Leon Berman / Matt Berkowitz

212-477-8438 / 212-227-7098

lberman@igbir.com / mberkowitz@igbir.com


Media Contact:

Jonathan Keehner / Andrew Siegel

Joele Frank, Wilkinson Brimmer Katcher

212-355-4449


CADRE HOLDINGS, INC.

CONSOLIDATED BALANCE SHEETS

(Unaudited)

(In thousands, except share and per share amounts)

June 30, 2023


December 31, 2022

Assets


Current assets


Cash and cash equivalents

$

55,782

$

45,286

Accounts receivable, net of allowance for doubtful accounts of $800 and $924, respectively

57,361

64,557

Inventories


82,777


70,273

Prepaid expenses


10,009


10,091

Other current assets


6,406


6,811

Total current assets


212,335


197,018

Property and equipment, net of accumulated depreciation and amortization of $47,046 and $42,694, respectively


44,531


45,285

Operating lease assets

6,657

8,489

Deferred tax assets, net


2,351


2,255

Intangible assets, net


46,919


50,695

Goodwill


81,560


81,576

Other assets


5,566


6,634

Total assets

$

399,919

$

391,952

Liabilities, Mezzanine Equity and Shareholders' Equity


Current liabilities


Accounts payable

$

29,640

$

23,406

Accrued liabilities


34,480


38,720

Income tax payable


4,279


4,584

Liabilities held for sale

Current portion of long-term debt


10,022


12,211

Total current liabilities


78,421


78,921

Long-term debt


132,712


137,476

Long-term operating lease liabilities

3,211

4,965

Deferred tax liabilities


3,759


3,508

Other liabilities


1,314


1,192

Total liabilities


219,417


226,062

Mezzanine equity


Preferred stock ($0.0001 par value, 10,000,000 shares authorized, no shares issued and outstanding as of June 30, 2023 and December 31, 2022)


Shareholders' equity


Common stock ($0.0001 par value, 190,000,000 shares authorized, 37,586,031 and 37,332,271 shares issued and outstanding as of June 30, 2023 and December 31, 2022, respectively)


4


4

Additional paid-in capital


208,492


206,540

Accumulated other comprehensive income


2,746


2,087

Accumulated deficit


(30,740)


(42,741)

Total shareholders’ equity


180,502


165,890

Total liabilities, mezzanine equity and shareholders' equity

$

399,919

$

391,952


CADRE HOLDINGS, INC.

CONSOLIDATED STATEMENTS OF OPERATIONS

(Unaudited)

(In thousands, except share and per share amounts)

Three Months Ended June 30, 

Six Months Ended June 30, 


2023


2022


2023


2022

Net sales

$

121,087

$

118,232

$

232,835

$

222,638

Cost of goods sold


70,340


75,011


135,470


139,228

Gross profit


50,747


43,221


97,365


83,410

Operating expenses


Selling, general and administrative


34,051


32,749


69,301


86,699

Restructuring and transaction costs


693


1,203


693


1,802

Related party expense


115


1,112


263


1,234

Total operating expenses


34,859


35,064


70,257


89,735

Operating income (loss)


15,888


8,157


27,108


(6,325)

Other expense


Interest expense


(1,013)


(1,439)


(2,654)


(2,929)

Other income (expense), net


346


(756)


710


(961)

Total other expense, net


(667)


(2,195)


(1,944)


(3,890)

Income (loss) before provision for income taxes


15,221


5,962


25,164


(10,215)

(Provision) benefit for income taxes


(4,229)


(1,517)


(7,170)


4,495

Net income (loss)

$

10,992

$

4,445

$

17,994

$

(5,720)

Net income (loss) per share:


Basic

$

0.29

$

0.13

$

0.48

$

(0.16)

Diluted

$

0.29

$

0.12

$

0.48

$

(0.16)

Weighted average shares outstanding:


Basic


37,586,031


35,320,314


37,480,367


34,888,703

Diluted


37,850,708


35,688,620


37,758,998


34,888,703


CADRE HOLDINGS, INC.

CONSOLIDATED STATEMENTS OF CASH FLOWS

(Unaudited)

(In thousands)

Six Months Ended June 30, 


2023


2022

Cash Flows From Operating Activities:


Net income (loss)

$

17,994

$

(5,720)

Adjustments to reconcile net income (loss) to net cash provided by operating activities:


Depreciation and amortization


8,220


7,380

Amortization of original issue discount and debt issue costs


374


367

Amortization of inventory step-up

1,344

Deferred income taxes


14


(4,594)

Stock-based compensation

4,852

26,327

Gain on sale of fixed assets

(108)

(Recoveries from) provision for losses on accounts receivable


(21)


240

Foreign exchange (gain) loss


(776)


1,107

Other

(325)

Changes in operating assets and liabilities, net of impact of acquisitions:


Accounts receivable


7,605


(3,243)

Inventories


(11,986)


(1,461)

Prepaid expenses and other assets


3,397


3,616

Accounts payable and other liabilities


(971)


(345)

Net cash provided by operating activities


28,269


25,018

Cash Flows From Investing Activities:


Purchase of property and equipment


(2,404)


(2,473)

Proceeds from disposition of property and equipment

206

Business acquisitions, net of cash acquired


(55,039)

Net cash used in investing activities


(2,198)


(57,512)

Cash Flows From Financing Activities:


Proceeds from revolving credit facilities


48,000

Principal payments on revolving credit facilities


(48,000)

Principal payments on term loans


(5,000)


(5,009)

Principal payments on insurance premium financing


(2,189)


(2,853)

Payment of capital leases


(22)

Taxes paid in connection with employee stock transactions

(2,725)

(6,216)

Proceeds from secondary offering, net of underwriter discounts

49,703

Deferred offering costs

(2,715)

Dividends distributed


(5,993)


(5,533)

Net cash (used in) provided by financing activities


(15,907)


27,355

Effect of foreign exchange rates on cash and cash equivalents


332


144

Change in cash and cash equivalents


10,496


(4,995)

Cash and cash equivalents, beginning of period


45,286


33,857

Cash and cash equivalents, end of period

$

55,782

$

28,862

Supplemental Disclosure of Cash Flows Information:

Cash paid for income taxes, net

$

7,288

$

241

Cash paid for interest

$

4,859

$

2,330

Supplemental Disclosure of Non-Cash Investing and Financing Activities:

Accruals and accounts payable for capital expenditures

$

129

$

17


CADRE HOLDINGS, INC.

SEGMENT INFORMATION

(Unaudited)

(In thousands)


Three Months Ended June 30, 2023

Reconciling


Product

Distribution

 Items(1)


Total

Net sales


$

103,368


$

25,726


$

(8,007)


$

121,087

Cost of goods sold

58,216

19,779

(7,655)

70,340

Gross profit

$

45,152

$

5,947

$

(352)

$

50,747


Three Months Ended June 30, 2022

Reconciling


Product


Distribution


 Items(1)


Total

Net sales


$

99,837


$

23,728


$

(5,333)


$

118,232

Cost of goods sold

60,947

19,406

(5,342)

75,011

Gross profit

$

38,890

$

4,322

$

9

$

43,221


Six Months Ended June 30, 2023

Reconciling


    Product    


Distribution


 Items(1)


      Total      

Net sales


$

196,562


$

50,386


$

(14,113)


$

232,835

Cost of goods sold

110,824

38,476

(13,830)

135,470

Gross profit

$

85,738

$

11,910

$

(283)

$

97,365


Six Months Ended June 30, 2022

Reconciling


    Product    


Distribution


 Items(1)


      Total      

Net sales


$

185,223


$

47,824


$

(10,409)


$

222,638

Cost of goods sold

112,067

37,578

(10,417)

139,228

Gross profit

$

73,156

$

10,246

$

8

$

83,410


(1)Reconciling items consist primarily of intercompany eliminations and items not directly attributable to operating segments.


CADRE HOLDINGS, INC.

RECONCILIATION OF GAAP TO NON-GAAP FINANCIAL MEASURES

(Unaudited)

(In thousands)

Year ended

Three Months

Three Months Ended

Six Months Ended

Last Twelve

December 31, 

Ended March 31,

June 30, 

June 30, 

Months

2022

2023

2023

2022

2023

2022

June 30, 2023

Net income (loss)

$

5,820

$

7,002

$

10,992

$

4,445

$

17,994

$

(5,720)

$

29,534

Add back:


Depreciation and amortization


15,651


4,261


3,959


3,836


8,220


7,380


16,491

Interest expense


6,206


1,641


1,013


1,439


2,654


2,929


5,931

Provision (benefit) for income taxes


3,553


2,941


4,229


1,517


7,170


(4,495)


15,218

EBITDA

$

31,230

$

15,845

$

20,193

$

11,237

$

36,038

$

94

$

67,174

Add back:


Restructuring and transaction costs(1)


5,355


693


2,203


693


2,802


3,246

Other general income(2)

(159)

(159)

Other expense (income), net(3)


1,137


(364)


(346)


756


(710)


961


(534)

Stock-based compensation expense(4)

32,239

2,747

2,105

2,818

4,852

26,541

10,550

Stock-based compensation payroll tax expense(5)

305

220

7

220

305

220

LTIP bonus(6)


1,369


144


160


174


304


558


1,115

Amortization of inventory step-up(7)

4,255

1,191

1,344

2,911

Adjusted EBITDA

$

75,731

$

18,592

$

22,805

$

18,386

$

41,397

$

32,605

$

84,523

Adjusted EBITDA margin(8)


16.5

%


16.6

%


18.8

%


15.6

%


17.8

%


14.6

%


(1)Reflects the “Restructuring and transaction costs” line item on our consolidated statement of operations, which primarily includes transaction costs composed of legal and consulting fees, and $1.0 million paid to Kanders & Company, Inc., a company controlled by our Chief Executive Officer, for services related to the acquisition of Cyalume, which is included in related party expense in the Company’s consolidated statements of operations for the year ended December 31, 2022.
(2)Reflects the “Other general income” line item on our consolidated statement of operations and includes a gain from a long-lived asset sale.
(3)Reflects the “Other (income) expense, net” line item on our consolidated statement of operations and primarily includes gains and losses on foreign currency transactions.
(4)Reflects compensation expense related to equity and liability classified stock-based compensation plans.
(5)Reflects payroll taxes associated with vested stock-based compensation awards.
(6)Reflects the cost of a cash-based long-term incentive plan awarded to employees that vests over three years.
(7)Reflects amortization expense related to the step-up inventory adjustment recorded as a result of our recent acquisitions.
(8)Reflects Adjusted EBITDA / Net Sales for the relevant periods.

Exhibit 99.2

GRAPHIC

SECOND QUARTER 2023

GRAPHIC

2 FORWARD-LOOKING STATEMENTS Except for historical information, certain matters discussed in this presentation may be forward-looking statements within the meaning of the Private Securities Litigation Reform Act of 1995. Forward-looking statements include but are not limited to all projections and anticipated levels of future performance. Forward-looking statements involve risks, uncertainties and other factors that may cause our actual results to differ materially from those discussed herein. Any number of factors could cause actual results to differ materially from projections or forward-looking statements, including without limitation, changes to global economic, social and political conditions, spending patterns of government agencies, competitive pressures, the impact of acquisitions and related integration activities, logistical challenges related to disruptions and delays, product liability claims, the success of new product introductions, currency exchange rate fluctuations and the risks of doing business in the markets in which we operate, including foreign countries. More information on potential factors that could affect the Company’s financial results are more fully described from time to time in the Company’s public reports filed with the Securities and Exchange Commission, including the Company’s Annual Report on Form 10-K, Quarterly Reports on Form 10-Q, and Current Reports on Form 8-K. All forward-looking statements included in this presentation are based upon information available to the Company as of the date of this presentation, and speak only as of the date hereof. We assume no obligation to update any forward-looking statements to reflect events or circumstances after the date of this presentation. 2

GRAPHIC

TODAY’S PRESENTERS 3 BRAD WILLIAMS President BLAINE BROWERS Chief Financial Officer WARREN KANDERS Chief Executive Officer and Chairman of the Board

GRAPHIC

4 AGENDA • Q2 Highlights • Business Overview • Financial Summary • Full Year Outlook • Conclusion and Q&A

GRAPHIC

5 CONTINUED EXECUTION IN Q2 Cadre continues to deliver on strategic objectives, generating record quarterly adj. EBITDA and achieving significant margin expansion Pricing Growth: ✓ Exceeded target Q2 Mix: ✓ Favorable mix in duty gear, armor and Distribution, offset by lower EOD volume Orders Backlog: ✓ Increased by $15.3 million in 2023; driven by higher demand for armor, offset by a decline in Distribution backlog Healthy M&A Funnel: ✓ Continue to actively evaluate pipeline of opportunities Returned Capital to Shareholders: ✓ Declared eighth consecutive quarterly dividend of $0.08 Commentary:

GRAPHIC

6 MACRO TAILWINDS SUPPORT LONG TERM SUSTAINABLE GROWTH OPPORTUNITY Two-thirds of all NATO countries spend less than 2% of GDP targets on defense and security Amidst current geopolitical turmoil, European leaders have advocated for significant increases in defense budgets Police protection expenditures have continued to trend upward even during previous financial and industrial recessions Major US cities continue to increase police budgets The American Rescue Plan provides $350 billion to hire more police

GRAPHIC

7 • Spend per officer increasing but police departments still struggling to fill open positions • Given increasing scale of unexploded ordinance in Ukraine, expectation is that the de-mining process will take decades, which represents a longer cycle of opportunity for Cadre • Improving supply chain with limited pockets of extended lead times • Managing labor force for long-term • Demand for Cadre’s products is strong but monitoring broader macro consumer demand environment • Continue to hear positive feedback on newly introduced HyperX tactical armor platform, Xpertfit 3D body sizing app and SafariVault line of holsters North American Law Enforcement Geopolitical Landscape Supply Chain/ Labor Consumer LATEST MARKET TRENDS New Products/ Innovation

GRAPHIC

81320 CADRE'S KEY M&ACRITERIA Niche market No large-cap competition Leading market position Cost structurewherematerial> labor Leading and defensible technology High cost of substitution Mission-critical tocustomer Recurring revenueprofile Asset-light Business Financial Market Strong brandrecognition Attractive ROIC Resiliency through market cycles CADRE'S KEY M&A CRITERIA 8

GRAPHIC

9 SECOND QUARTER 2023 FINANCIAL PERFORMANCE 1. Non-GAAP financial measures. See slide 19 for definitions and reconciliations to the nearest GAAP measures • Increased quarterly net sales, adjusted EBITDA, net income, gross profit and adjusted EBITDA margin sequentially and year-over-year • Achieved pricing growth that exceeded target and grew orders backlog YTD Q2 2023 Q1 2023 Q2 2022 NET SALES $121.1M $111.7M $118.2M GROSS MARGIN 41.9% 41.7% 36.6% NET INCOME $11.0M / $0.29 per diluted share $7.0M / $0.19 per diluted share $4.4M / $0.12 per diluted share ADJUSTED EBITDA 1 $22.8M $18.6M $18.4M ADJUSTED EBITDA MARGIN 1 18.8% 16.6% 15.6%

GRAPHIC

10 Current Period Net Sales and Adj. EBITDA Full Year Guidance for Net Sales and Adj. EBITDA NET SALES AND ADJUSTED EBITDA NET SALES ($MM) $222.6M 2Q22 $232.8M 2Q23 FY 2022 $457.8M FY 2023 Guidance Range $472M to $484M 2022 2023 YTD % Y/Y GROWTH 4.6% % Y/Y GROWTH 4 % at Guidance Midpoint ADJ. EBITDA1 ($MM) FY 2022 $75.7m $41.4M 2Q23 FY 2023 Guidance Range $80M to $84M 2022 2023 YTD % Y/Y GROWTH 27.0% 1. A non-GAAP financial measure. See slide 19 for definitions and reconciliations to the nearest GAAP measures $32.6M 2Q22 % Y/Y GROWTH 8 % at Guidance Midpoint

GRAPHIC

11 Q2 2023 CAPITAL STRUCTURE 1. Non-GAAP financial measures. See slide 19 for definitions and reconciliations to the nearest GAAPmeasures June 30, 2023 (in thousands) Cash and cash equivalents $ 55,782 Debt: Revolver $ — Current portion of long-term debt 10,022 Long-term debt 134,089 Capitalized discount/issuance costs (1,377) Total debt, net $ 142,734 Net debt (Total debt net of cash) $ 86,952 Total debt / Adj. EBITDA(1) 1.7 Net debt / Adj. EBITDA(1) 1.0 Adj. EBITDA(1) $ 84,523

GRAPHIC

12 UPDATED 2023 MANAGEMENT OUTLOOK 2023 GUIDANCE NET SALES $472M to $484M ADJ. EBITDA $80M to $84M CAPITAL EXPENDITURES $8M to $9M 1. A non-GAAP financial measure. See slide 19 for definitions and reconciliations to the nearest GAAP measures

GRAPHIC

CONCLUSION 13 Outstanding execution in Q2 Revenue, Net Income and Adjusted EBITDA Growth Y/Y Ongoing implementation of Cadre operating model Committed to improving gross and Adj. EBITDA margins Capitalizing on strong macro tailwinds driving demand and visibility for Cadre's mission-critical products Continuously focused on M&A opportunities

GRAPHIC

14 APPENDIX

GRAPHIC

15 BALANCE SHEET UNAUDITED (IN THOUSANDS, EXCEPT SHARE AND PER SHARE AMOUNTS) June 30, 2023 December 31, 2022 Assets Current assets Cash and cash equivalents $ 55,782 $ 45,286 Accounts receivable, net of allowance for doubtful accounts of $800 and $924, respectively 57,361 64,557 Inventories 82,777 70,273 Prepaid expenses 10,009 10,091 Other current assets 6,406 6,811 Total current assets 212,335 197,018 Property and equipment, net of accumulated depreciation and amortization of $47,046 and $42,694, respectively 44,531 45,285 Operating lease assets 6,657 8,489 Deferred tax assets, net 2,351 2,255 Intangible assets, net 46,919 50,695 Goodwill 81,560 81,576 Other assets 5,566 6,634 Total assets $ 399,919 $ 391,952 Liabilities, Mezzanine Equity and Shareholders' Equity Current liabilities Accounts payable $ 29,640 $ 23,406 Accrued liabilities 34,480 38,720 Income tax payable 4,279 4,584 Liabilities held for sale — — Current portion of long-term debt 10,022 12,211 Total current liabilities 78,421 78,921 Long-term debt 132,712 137,476 Long-term operating lease liabilities 3,211 4,965 Deferred tax liabilities 3,759 3,508 Other liabilities 1,314 1,192 Total liabilities 219,417 226,062 Mezzanine equity Preferred stock ($0.0001 par value, 10,000,000 shares authorized, no shares issued and outstanding as of June 30, 2023 and December 31, 2022) — — Shareholders' equity Common stock ($0.0001 par value, 190,000,000 shares authorized, 37,586,031 and 37,332,271 shares issued and outstanding as of June 30, 2023 and December 31, 2022, respectively) 4 4 Additional paid-in capital 208,492 206,540 Accumulated other comprehensive income 2,746 2,087 Accumulated deficit (30,740) (42,741) Total shareholders’ equity 180,502 165,890 Total liabilities, mezzanine equity and shareholders' equity $ 399,919 $ 391,952

GRAPHIC

16 STATEMENT OF OPERATIONS UNAUDITED (IN THOUSANDS, EXCEPT SHARE AND PER SHARE AMOUNTS) Three Months Ended June 30, Six Months Ended June 30, 2023 2022 2023 2022 Net sales $ 121,087 $ 118,232 $ 232,835 $ 222,638 Cost of goods sold 70,340 75,011 135,470 139,228 Gross profit 50,747 43,221 97,365 83,410 Operating expenses Selling, general and administrative 34,051 32,749 69,301 86,699 Restructuring and transaction costs 693 1,203 693 1,802 Related party expense 115 1,112 263 1,234 Total operating expenses 34,859 35,064 70,257 89,735 Operating income (loss) 15,888 8,157 27,108 (6,325) Other expense Interest expense (1,013) (1,439) (2,654) (2,929) Other income (expense), net 346 (756) 710 (961) Total other expense, net (667) (2,195) (1,944) (3,890) Income (loss) before provision for income taxes 15,221 5,962 25,164 (10,215) (Provision) benefit for income taxes (4,229) (1,517) (7,170) 4,495 Net income (loss) $ 10,992 $ 4,445 $ 17,994 $ (5,720) Net income (loss) per share: Basic $ 0.29 $ 0.13 $ 0.48 $ (0.16) Diluted $ 0.29 $ 0.12 $ 0.48 $ (0.16) Weighted average shares outstanding: Basic 37,586,031 35,320,314 37,480,367 34,888,703 Diluted 37,850,708 35,688,620 37,758,998 34,888,703

GRAPHIC

17 STATEMENT OF CASH FLOWS UNAUDITED (IN THOUSANDS) Six Months Ended June 30, 2023 2022 Cash Flows From Operating Activities: Net income (loss) $ 17,994 $ (5,720) Adjustments to reconcile net income (loss) to net cash provided by operating activities: Depreciation and amortization 8,220 7,380 Amortization of original issue discount and debt issue costs 374 367 Amortization of inventory step-up — 1,344 Deferred income taxes 14 (4,594) Stock-based compensation 4,852 26,327 Gain on sale of fixed assets (108) — (Recoveries from) provision for losses on accounts receivable (21) 240 Foreign exchange (gain) loss (776) 1,107 Other (325) — Changes in operating assets and liabilities, net of impact of acquisitions: Accounts receivable 7,605 (3,243) Inventories (11,986) (1,461) Prepaid expenses and other assets 3,397 3,616 Accounts payable and other liabilities (971) (345) Net cash provided by operating activities 28,269 25,018 Cash Flows From Investing Activities: Purchase of property and equipment (2,404) (2,473) Proceeds from disposition of property and equipment 206 — Business acquisitions, net of cash acquired — (55,039) Net cash used in investing activities (2,198) (57,512) Continued on next slide

GRAPHIC

18 STATEMENT OF CASH FLOWS - CONTINUED UNAUDITED (IN THOUSANDS) Year Ended June 30, 2023 2022 Cash Flows From Financing Activities: Proceeds from revolving credit facilities — 48,000 Principal payments on revolving credit facilities — (48,000) Principal payments on term loans (5,000) (5,009) Principal payments on insurance premium financing (2,189) (2,853) Payment of capital leases — (22) Taxes paid in connection with employee stock transactions (2,725) (6,216) Proceeds from secondary offering, net of underwriter discounts — 49,703 Deferred offering costs — (2,715) Dividends distributed (5,993) (5,533) Net cash (used in) provided by financing activities (15,907) 27,355 Effect of foreign exchange rates on cash and cash equivalents 332 144 Change in cash and cash equivalents 10,496 (4,995) Cash and cash equivalents, beginning of period 45,286 33,857 Cash and cash equivalents, end of period $ 55,782 $ 28,862 Supplemental Disclosure of Cash Flows Information: Cash paid for income taxes, net $ 7,288 $ 241 Cash paid for interest $ 4,859 $ 2,330 Supplemental Disclosure of Non-Cash Investing and Financing Activities: Accruals and accounts payable for capital expenditures $ 129 $ 17

GRAPHIC

19 1. Reflects the “Restructuring and transaction costs” line item on our consolidated statement of operations, which primarily includes transaction costs composed of legal and consulting fees, and $1.0 million paid to Kanders & Company, Inc., a company controlled by our Chief Executive Officer, for services related to the acquisition of Cyalume, which is included in related party expense in the Company’s consolidated statements of operations for the three and six months ended June 30, 2022. 2. Reflects the “Other general income” line item on our consolidated statement of operations and includes a gain from a long-lived asset sale. 3. Reflects the “Other (income) expense, net” line item on our consolidated statement of operations and primarily includes gains and losses on foreign currency transactions. 4. Reflects compensation expense related to equity and liability classified stock-based compensation plans. 5. Reflects payroll taxes associated with vested stock-based compensation awards. 6. Reflects the cost of a cash-based long-term incentive plan awarded to employees that vests over three years. 7. Reflects amortization expense related to the step-up inventory adjustment recorded as a result of our recent acquisitions. 8. Reflects Adjusted EBITDA / Net Sales for the relevant periods. 19 (IN THOUSANDS) NON-GAAP RECONCILIATION Year ended Three Months Three Months Ended Six Months Ended Last Twelve December 31, Ended March 31, June 30, June 30, Months 2022 2023 2023 2022 2023 2022 June 30, 2023 Net income (loss) $ 5,820 $ 7,002 $ 10,992 $ 4,445 $ 17,994 $ (5,720) $ 29,534 Add back: Depreciation and amortization 15,651 4,261 3,959 3,836 8,220 7,380 16,491 Interest expense 6,206 1,641 1,013 1,439 2,654 2,929 5,931 Provision (benefit) for income taxes 3,553 2,941 4,229 1,517 7,170 (4,495) 15,218 EBITDA $ 31,230 $ 15,845 $ 20,193 $ 11,237 $ 36,038 $ 94 $ 67,174 Add back: Restructuring and transaction costs(1) 5,335 — 693 2,203 693 2,802 3,246 Other general income(2) (159) — — — — — (159) Other expense, net(3) 1,137 (364) (346) 756 (710) 961 (534) Stock-based compensation expense(4) 32,239 2,747 2,105 2,818 4,852 26,541 10,550 Stock-based compensation payroll tax expense(5) 305 220 — 7 220 305 220 LTIP bonus(6) 1,369 144 160 174 304 558 1,115 Amortization of inventory step-up(7) 4,255 — — 1,191 — 1,344 2,911 Adjusted EBITDA $ 75,731 $ 18,592 $ 22,805 $ 18,386 $ 41,397 $ 32,605 $ 84,523 Adjusted EBITDA margin(9) 16.5% 16.6% 18.8% 15.6% 17.8 % 14.6 %

v3.23.2
Document and Entity Information
Aug. 08, 2023
Document and Entity Information [Abstract]  
Document Type 8-K
Document Period End Date Aug. 08, 2023
Entity File Number 001-40698
Entity Registrant Name CADRE HOLDINGS, INC.
Entity Incorporation, State or Country Code DE
Entity Tax Identification Number 38-3873146
Entity Address State Or Province FL
Entity Address, Address Line One 13386 International Pkwy
Entity Address, City or Town Jacksonville
Entity Address, Postal Zip Code 32218
City Area Code 904
Local Phone Number 741-5400
Title of 12(b) Security Common Stock, par value $0.0001
Trading Symbol CDRE
Security Exchange Name NYSE
Entity Emerging Growth Company true
Entity Ex Transition Period false
Written Communications false
Soliciting Material false
Pre-commencement Tender Offer false
Pre-commencement Issuer Tender Offer false
Entity Central Index Key 0001860543
Amendment Flag false

Cadre (NYSE:CDRE)
Historical Stock Chart
From Apr 2024 to May 2024 Click Here for more Cadre Charts.
Cadre (NYSE:CDRE)
Historical Stock Chart
From May 2023 to May 2024 Click Here for more Cadre Charts.