Cirrus Logic, Inc. (Nasdaq: CRUS), a leader in high-precision
analog and digital signal processing components, today posted on
its investor relations website at http://investor.cirrus.com the
quarterly Shareholder Letter that contains the complete financial
results for the second quarter of fiscal year 2013, which ended
Sept. 29, as well as the company’s current business outlook.
“Our outstanding revenue and earnings growth demonstrate that
Cirrus Logic is targeting the right opportunities and our product
development efforts remain on track,” said Jason Rhode, president
and chief executive officer. “The new product ramps driving this
growth have required extraordinary efforts from Cirrus Logic
employees as well as from our external partners. We are very
thankful for their support.”
Reported Financial Results – Second Quarter FY2013
- Revenue of $194 million;
- Gross margin of 52 percent;
- GAAP operating expenses of $50 million
and non-GAAP operating expenses of $44 million;
- GAAP diluted earnings per share of
$0.51 and non-GAAP diluted earnings per share of $0.79.
A reconciliation of the non-GAAP charges is included in the
tables accompanying this press release.
Business Outlook – Third Quarter FY2013
- Revenue is expected to range between
$270 million and $300 million;
- Gross margin is expected to be between
50 percent and 52 percent;
- Combined R&D and SG&A expenses
are expected to range between $49 million and $53 million, which
includes approximately $6 million in share-based compensation.
Cirrus Logic will host a live Q&A session at 5 p.m. EDT on
Wednesday, October 31, 2012, to answer questions related to its
financial results and business outlook. Shareholders who would like
to submit a question to be addressed during the call are requested
to email investor.relations@cirrus.com. A live webcast of the
Q&A session can be accessed on the Cirrus Logic website, and a
replay will be available approximately two hours after the
completion of the call, or by dialing (404) 537-3406, or toll-free
at (855) 859-2056 (Access Code: 35941792).
Cirrus Logic, Inc.
Cirrus Logic develops high-precision, analog and mixed-signal
integrated circuits for a broad range of innovative customers.
Building on its diverse analog and signal-processing patent
portfolio, Cirrus Logic delivers highly optimized products for a
variety of audio and energy-related applications. The company
operates from headquarters in Austin, Texas, with offices in
Tucson, Ariz., Europe, Japan and Asia. More information about
Cirrus Logic is available at www.cirrus.com.
Use of non-GAAP Financial Information
To supplement Cirrus Logic's financial statements presented on a
GAAP basis, Cirrus has provided non-GAAP financial information,
including operating expenses, net income, operating margin and
diluted earnings per share. A reconciliation of the adjustments to
GAAP results is included in the tables below. Non-GAAP financial
information is not meant as a substitute for GAAP results, but is
included because management believes such information is useful to
our investors for informational and comparative purposes. In
addition, certain non-GAAP financial information is used internally
by management to evaluate and manage the company. The non-GAAP
financial information used by Cirrus Logic may differ from that
used by other companies. These non-GAAP measures should be
considered in addition to, and not as a substitute for, the results
prepared in accordance with GAAP.
Safe Harbor Statement
Except for historical information contained herein, the matters
set forth in this news release contain forward-looking statements,
including our estimates of third quarter fiscal year 2013 revenue,
gross margin, combined research and development and selling,
general and administrative expense levels, and share-based
compensation expense. In some cases, forward-looking statements are
identified by words such as “expect,” “anticipate,” “target,”
“project,” “believe,” “goals,” “opportunity,” “estimates,”
“intend,” and variations of these types of words and similar
expressions. In addition, any statements that refer to our plans,
expectations, strategies or other characterizations of future
events or circumstances are forward-looking statements. These
forward-looking statements are based on our current expectations,
estimates and assumptions and are subject to certain risks and
uncertainties that could cause actual results to differ materially.
These risks and uncertainties include, but are not limited to, the
following: the level of orders and shipments during the third
quarter and complete fiscal year 2013, as well as customer
cancellations of orders, or the failure to place orders consistent
with forecasts; our ability to introduce and ramp production of new
products in a timely manner; and the risk factors listed in our
Form 10-K for the year ended March 31, 2012, and in our other
filings with the Securities and Exchange Commission, which are
available at www.sec.gov. The foregoing information concerning our
business outlook represents our outlook as of the date of this news
release, and we undertake no obligation to update or revise any
forward-looking statements, whether as a result of new developments
or otherwise.
Cirrus Logic and Cirrus are trademarks of Cirrus Logic Inc.
CRUS-F
Summary financial data follows:
CIRRUS LOGIC, INC. CONSOLIDATED CONDENSED
STATEMENT OF OPERATIONS (unaudited) (in thousands,
except per share data)
Three Months Ended Six Months Ended Sep. 29,
Jun. 30, Sep. 24, Sep. 29, Sep. 24,
2012 2012 2011 2012 2011
Q2'13 Q1'13 Q2'12 Q2'13 Q2'12
Audio products $ 177,915 $ 80,747 $ 83,683 $ 258,662 $ 154,802
Energy products 15,859 18,259
17,919 34,118 39,042
Net
revenue 193,774 99,006
101,602 292,780
193,844 Cost of sales 93,687
45,566 47,247 139,253
91,780
Gross Profit 100,087
53,440 54,355 153,527 102,064
Research and development 29,468 24,910 19,682 54,378 38,449
Selling, general and administrative 20,194
18,059 16,760 38,253
31,366 Total operating expenses 49,662
42,969 36,442 92,631
69,815
Operating income 50,425
10,471 17,913 60,896 32,249
Interest income, net 131 127 112 258 266 Other income (expense),
net (40 ) (23 ) (27 ) (63 ) (44
)
Income before income taxes 50,516 10,575
17,998 61,091 32,471 Provision (benefit) for
income taxes 15,067 3,648 6,751
18,715 12,046
Net income
$ 35,449 $ 6,927 $
11,247 $ 42,376 $
20,425 Basic earnings per share: $ 0.55 $ 0.11
$ 0.17 $ 0.65 $ 0.31 Diluted earnings per share: $ 0.51 $ 0.10 $
0.17 $ 0.61 $ 0.30 Weighted average number of shares: Basic
64,924 64,470 64,426 64,697 65,763 Diluted 69,207 68,529 67,265
68,920 68,657
See notes to Consolidated Condensed
Statement of Operations Prepared in accordance with Generally
Accepted Accounting Principles
CIRRUS LOGIC, INC.RECONCILIATION
BETWEEN GAAP AND NON-GAAP FINANCIAL INFORMATION(unaudited,
in thousands, except per share data)(not prepared in
accordance with GAAP)
Non-GAAP financial information is not meant as a substitute for
GAAP results, but is included because management believes such
information is useful to our investors for informational and
comparative purposes. In addition, certain non-GAAP financial
information is used internally by management to evaluate and manage
the company. As a note, the non-GAAP financial information used by
Cirrus Logic may differ from that used by other companies. These
non-GAAP measures should be considered in addition to, and not as a
substitute for, the results prepared in accordance with GAAP.
Three Months Ended Six Months Ended
Sep. 29, Jun. 30, Sep. 24, Sep.
29, Sep. 24, 2012 2012 2011
2012 2011 Net Income Reconciliation
Q2'13
Q1'13 Q2'12 Q2'13 Q2'12 GAAP Net
Income $ 35,449 $ 6,927 $
11,247 $ 42,376 $ 20,425
Amortization of acquisition intangibles 251 353 353 604 706 Stock
based compensation expense 5,563 4,173 3,517 9,736 5,959 Other
expenses ** - - 622 - 622 Provision (benefit) for income taxes
13,580 3,355 6,163
16,935 11,147
Non-GAAP Net Income
$ 54,843 $ 14,808
$ 21,902 $ 69,651
$ 38,859 Earnings Per Share
Reconciliation *
GAAP Diluted earnings per share $
0.51 $ 0.10 $ 0.17 $
0.61 $ 0.30 Effect of Amortization of
acquisition intangibles - 0.01 0.01 0.01 0.01 Effect of Stock based
compensation expense 0.08 0.06 0.05 0.14 0.09 Effect of Other
expenses ** - - 0.01 - 0.01 Effect of Provision (benefit) for
income taxes 0.20 0.05 0.09
0.25 0.16
Non-GAAP Diluted
earnings per share $ 0.79 $
0.22 $ 0.33 $ 1.01
$ 0.57 Operating Income
Reconciliation
GAAP Operating Income $ 50,425
$ 10,471 $ 17,913 $
60,896 $ 32,249 GAAP Operating Margin 26 % 11
% 18 % 21 % 17 % Amortization of acquisition intangibles 251 353
353 604 706 Stock compensation expense - COGS 119 118 104 237 193
Stock compensation expense - R&D 2,097 2,243 1,181 4,340 2,224
Stock compensation expense - SG&A 3,347 1,812 2,232 5,159 3,542
Other expenses ** - - 622
- 622
Non-GAAP Operating Income
$ 56,239 $ 14,997
$ 22,405 $ 71,236
$ 39,536 Non-GAAP Operating Margin 29 % 15 %
22 % 24 % 20 % Operating Expense Reconciliation
GAAP
Operating Expenses $ 49,662 $
42,969 $ 36,442 $ 92,631
$ 69,815 Amortization of acquisition intangibles (251
) (353 ) (353 ) (604 ) (706 ) Stock compensation expense - R&D
(2,097 ) (2,243 ) (1,181 ) (4,340 ) (2,224 ) Stock compensation
expense - SG&A (3,347 ) (1,812 ) (2,232 ) (5,159 ) (3,542 )
Other expenses ** - - (622 )
- (622 )
Non-GAAP Operating Expenses
$ 43,967 $ 38,561
$ 32,054 $ 82,528
$ 62,721 * Certain YTD numbers may not
tie to individual quarter presentation due to YTD share count
dilution ** Other expenses (proceeds) may contain certain items
such as litigation expenses , proceeds from a patent agreement,
restructuring items, and impairments of non-marketable securities.
CIRRUS LOGIC,
INC. CONSOLIDATED CONDENSED BALANCE SHEET unaudited;
in thousands Sep. 29, Jun.
30, Sep. 24, 2012 2012 2011 ASSETS
Current assets Cash and cash equivalents $ 67,846 $ 84,312 $ 39,268
Restricted investments - - 2,898 Marketable securities 66,731
82,359 100,130 Accounts receivable, net 130,870 49,262 44,898
Inventories 144,881 96,790 49,552 Deferred tax asset 53,144 53,139
30,803 Other current assets 19,845 14,574
10,865 Total Current Assets 483,317 380,436
278,414 Long-term marketable securities - - 8,703 Property
and equipment, net 86,992 85,337 50,102 Intangibles, net 5,208
18,457 18,905 Goodwill 6,027 6,027 6,027 Deferred tax asset 72,150
85,721 90,995 Other assets 21,402 9,300
7,517 Total Assets $ 675,096 $ 585,278
$ 460,663 LIABILITIES AND STOCKHOLDERS' EQUITY
Current liabilities Accounts payable $ 103,366 $ 75,507 $ 35,256
Accrued salaries and benefits 15,594 10,956 10,942 Other accrued
liabilities 14,218 9,498 10,105 Deferred income on shipments to
distributors 6,580 7,158 9,334
Total Current Liabilities 139,758 103,119 65,637
Other long-term obligations 10,042 4,159 6,505 Stockholders'
equity: Capital stock 1,025,272 1,013,442 998,572 Accumulated
deficit (499,233 ) (534,682 ) (609,167 ) Accumulated other
comprehensive loss (743 ) (760 ) (884 ) Total
Stockholders' Equity 525,296 478,000
388,521 Total Liabilities and Stockholders' Equity $
675,096 $ 585,278 $ 460,663 Prepared in
accordance with Generally Accepted Accounting Principles
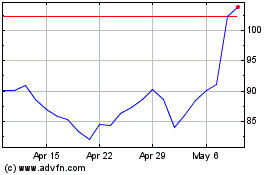
Cirrus Logic (NASDAQ:CRUS)
Historical Stock Chart
From Jun 2024 to Jul 2024

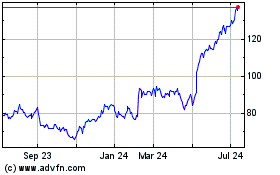
Cirrus Logic (NASDAQ:CRUS)
Historical Stock Chart
From Jul 2023 to Jul 2024
