Apollo Reports Higher Profit, Thanks to Gain on Insurance Stake
October 28 2015 - 8:50AM
Dow Jones News
Apollo Global Management LLC posted higher earnings for the
third quarter as a gain from the company's stake in insurance
business Athene helped offset the impact of volatile markets.
The New York investment firm reported a profit of $41.1 million,
or 20 cents a Class A share, up from a year-earlier profit of $2.21
million.
Apollo posted $104 million, or 26 cents a share, of economic net
income in the third quarter, compared with $32.4 million, or 18
cents, in the year-ago quarter. The profitability measure, which
includes fluctuations in the value of the firm's investments as
well as cash earnings, beat Wall Street's expectations for a loss
of 11 cents a share.
The results come in contrast to the firm's peers. Earlier this
month, investment firm Blackstone Group LP said whipsawing markets
reduced the value of some holdings and that firm lost 35 cents a
share of economic net income in the quarter. Earlier Wednesday,
Carlyle Group LP said it swung to a loss as its private equity and
energy funds lost value.
The value of Apollo's private-equity funds depreciated 3.7%
during the quarter, while Apollo's credit funds depreciated 0.8%.
But the value of the company's Athene investment rose about 20% and
offset weakness elsewhere.
One of Apollo's biggest share holdings, oil-and-gas producer EP
Energy Corp., has been a drag as the price of crude remains under
pressure. The price of oil tumbled 21% during the third quarter,
and EP shares fell roughly 61% during the period.
Apollo had $28.7 billion in cash available for investments at
the end of September, up from $27.9 billion at the end of June.
Assets under management as of Sept. 30 dropped to $161.8 billion
from $162.5 billion in the second quarter and $163.9 billion a year
earlier.
Apollo said Wednesday that it would pay a dividend of 35 cents
for the quarter, down from the 73 cents it paid out a year earlier,
but higher than the 34 cents analysts expected.
Write to Lisa Beilfuss at lisa.beilfuss@wsj.com
Subscribe to WSJ: http://online.wsj.com?mod=djnwires
(END) Dow Jones Newswires
October 28, 2015 08:35 ET (12:35 GMT)
Copyright (c) 2015 Dow Jones & Company, Inc.
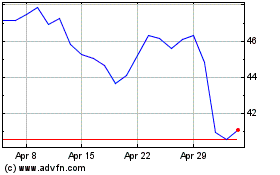
Carlyle (NASDAQ:CG)
Historical Stock Chart
From Jun 2024 to Jul 2024

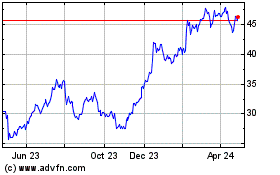
Carlyle (NASDAQ:CG)
Historical Stock Chart
From Jul 2023 to Jul 2024
