Westward Gold
Provides Update on Drill Targeting and Historical Data
Review
Vancouver, British Columbia, December 16, 2021 --
InvestorsHub NewsWire -- Westward Gold Inc. (CSE:
WG, FSE: IM50) ("Westward" or the
"Company") is pleased
to provide an update on the results of an extensive technical
review of historical drill data at its Toiyabe Gold Project in
Lander County, Nevada ("Toiyabe"). The historical
information analyzed during this review, in combination with field
activities carried out by the Company in recent months
(see press releases dated
August 10, October 5, and November 9, 2021), are
providing the foundation for Westward's targeting efforts and a
maiden drill campaign slated for the first half of 2022.
The review of historical drill data was led by Steven
Koehler, a member of the Company's Technical Advisory Committee,
and Dave Browning, Vice President of Exploration. Mr. Koehler is an
exploration geologist with extensive experience working along the
Battle Mountain - Eureka Trend, and has been involved in 11
Carlin-type gold discoveries, including nearby Cortez
Hills.
Dave Browning, Vice President of Exploration, noted: "The
vast amount of data we've accumulated - through both historical
review and Westward-led programs in 2021 - continues to suggest
that we find ourselves in a highly-prospective gold environment. We
have no shortage of near-term targets and we're excited to test out
our theses through the drill bit in 2022."
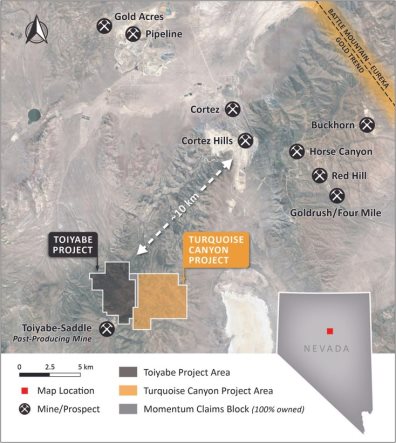
Figure 1:
Toiyabe Location Map

The review covered over 30 years of exploration data from 6
previous operators, and results demonstrate widespread near-surface
gold mineralization. The Company's maiden drill campaign will focus
on under-explored areas, including testing potential lateral
extensions of the 173koz historical gold
resource(1)
at the Courtney Zone, which has seen the bulk of drilling
activities to date.
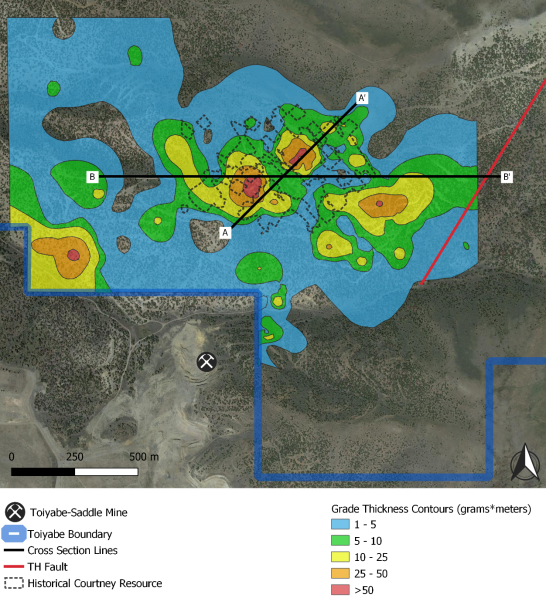
Given the substantial amount of historical drill holes across
the property for which data was available (~350), results have been
evaluated using grade thickness (expressed in gram-meters). This
metric is an effective tool when dealing with a large number of
intersections over many holes, as it accounts for both
higher-grade, narrower intervals, as well as lower-grade, wider
intervals. Westward's technical team calculated grade thickness and
mapped results across Toiyabe to highlight significant
mineralization trends, and to help identify potential new zones of
open mineralization.
Review Highlights(2):
-
Large areas of open
mineralization identified outside of the historical resource at the
Courtney Zone
-
Understanding of
lithologic/stratigraphic (Figure 3) and structural (Figure 4)
controls on mineralization has led to the identification of
step-out drill targets
-
Completion of a drill hole grade
thickness contour map which contributed to the identification of
E-W and NW-SE trends of mineralization at Toiyabe
-
Open mineralization will be
tested in step-out drilling
Grade Thickness
Highlights(2):
-
346 holes were evaluated;
mineralization remains open in all directions and at
depth
-
45 holes identified with
>
0.14 g Au/t beginning at the
current topographic surface
-
271 holes of >1 gram-meters
(78% of total holes intersected anomalous gold)
-
97 holes of >10 gram-meters
(36% of mineralized holes / 28% of all holes)
Notable Near-Surface
Intersections(2):
The following intersections represent near-surface
mineralization discovered in early drilling efforts from previous
operators. Subsequent drilling
confirmed the shallow mineralization, while also identifying a
second deeper mineralized zone.
-
DH88-280: 16.8m @ 3.5 g Au/t,
from a depth of 10.6m (incl. 10.7m @ 5.4 g Au/t)
-
DH88-296: 19.8m @ 4.03 g Au/t,
from surface (incl. 13.7m @ 5.54 g Au/t)
-
DH88-369: 27.4m @ 2.6 g Au/t,
from a depth of 41.2m (incl. 9.1m @ 7.29 g Au/t)
-
DH88-373: 67.1m @ 0.88 g Au/t,
from surface (incl. 21.3m @ 2.1 g Au/t)
-
DTY008: 22.9m @ 1.62 g Au/t, from
103.6m (incl. 15.2m @ 2.20 g Au/t)
-
DTY020: 15.2m @ 0.72 g Au/t from
surface, and 36.6m @ 1.12 g Au/t from a depth of 19.8m
-
T-603: 18.3m @ 4.47 g Au/t, from
a depth of 38.1m (incl. 6.1m @ 12.85 g Au/t)
-
T-706C: 16.8m @ 3.66 g Au/t, from
a depth of 47.2m (incl. 7.6m @ 7.37 g Au/t)
-
T-706C: 9.1m @ 9.18 g Au/t, from
a depth of 71.6m (incl. 3.1m @ 26.4 g Au/t)
-
T-719: 27.4m @ 2.21 g Au/t, from
a depth of 45.7m (incl. 9.1m @ 5.45 g Au/t)
-
T-722: 10.7m of 3.68 g Au/t, from
surface (incl. 1.5m @ 21.8 g Au/t)
(1) Source: NI 43-101 Technical
Report, American Consolidated Minerals Corporation, Prepared by
Paul D. Noland, P. Geo., May 27, 2009 (the "2009 Technical
Report"). A qualified person
has not done sufficient work to classify the historical estimate at
Toiyabe (the "Historical
Estimate") as current
mineral resources and Westward is not treating the Historical
Estimate on Toiyabe as a current mineral resource, as defined in
National Instrument 43-101 - Standards of Disclosure for Mineral
Projects ("NI
43-101"). The Historical
Estimate was calculated using mining industry standard practices
for estimating Mineral Resource and Mineral Reserves (2005) which
was prior to the implementation of the current CIM standards for
mineral resource estimation (as defined by the CIM Definition
Standard on Mineral Resources and Ore Reserves dated May 10, 2014).
The key assumptions, parameters and methods used to prepare the
Historical Estimate on Toiyabe are described in the 2009 Technical
Report. While Westward considers the Historical Estimate on Toiyabe
disclosed in this news release to be relevant to investors, it
cautions readers that it should not be unduly relied upon in
drawing inferences on the mineralization on Toiyabe, as additional
work is required to upgrade or verify the Historical Estimate as a
current mineral resource. This additional work includes (but may
not be limited to): re-sampling and re-assaying of available core
and/or pulps, verification of assay certificates and digital assay
data, verification of select drillhole collars, review and
verification of drill hole geologic logs versus the preserved core
and RC cuttings, incorporation of AuCN assays to provide a general
understanding of the metallurgical characteristics, review and
verification of mineralization controls and modelling
techniques.
(2) Sources: NI 43-101 Technical
Report, IM Exploration Inc., Prepared by Donald E. Cameron, P.Geo.,
August 5, 2021; Toiyabe data room and drill log files inherited
from previous operators. The Company and its qualified person have
relied on third-party data during its review of the information
presented herein, and while it believes the information to be
relevant to investors, it cautions readers that it should not be
unduly relied upon in drawing inferences on the mineralization at
Toiyabe, as additional work is required to confirm drill intercepts
and/or soil samples, including (but not limited to): re-sampling
and re-assaying of available core and/or pulps, verification of
assay certificates where available, review and verification of
drillhole geologic logs versus the preserved core and RC
cuttings.
Figure 2:
Past Drilling at Toiyabe - Grade Thickness Map


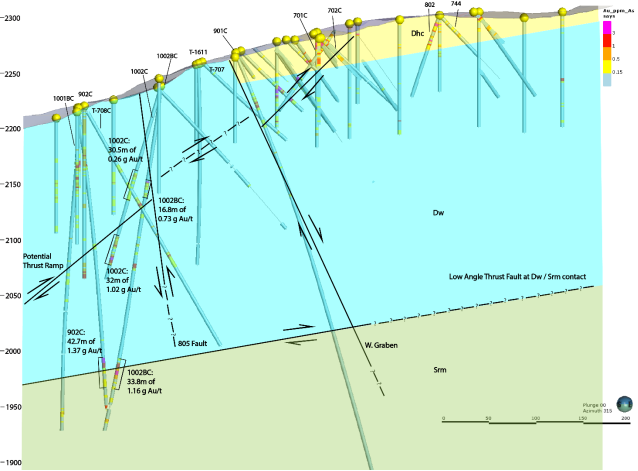
Figure 3:
A-A' Mineralization-Focused Cross Section (Looking
Northwest)


A review of drill assays and logs confirmed near-surface and
at-depth mineralization in several holes.
Anomalous gold is often associated with structures,
particularly at the contact between the Devonian Wenban and
Silurian Roberts Mountains Formations.
This contact is interpreted as a low-angle thrust fault, a
compressional feature observed in many Carlin-type
deposits. The contact zone is
untested to the northeast.
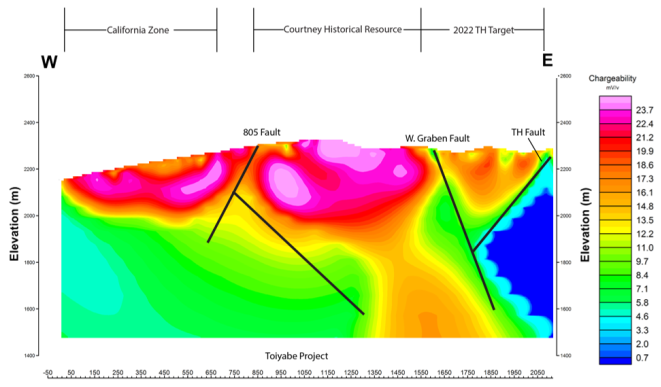
Figure 4:
B-B' Structurally-Focused Cross Section (Looking North)

Recently-collected induced polarization ("IP") data across Toiyabe shows
high-chargeability anomalies around the historical Courtney
resource zone (warm colours above).
These anomalies are also present to the west (California
Target Zone) and coincide with anomalous gold-in-soil
samples. The Toiyabe Hills fault
(the "TH Fault",
also shown in Figure 2) is adjacent to a graben structure with
similar chargeability values as the known mineralized
zones.
High-Priority Target Zones (see
Figure 2):
TH Target Zone
-
Area surrounding the TH Fault,
mapped as part of the Company's 2021 field program
-
Soil samples within the 600m x
100m TH Target zone returned anomalous values of gold, silver,
arsenic, and mercury along the TH Fault trace
-
Jasperoid (decalcified and
silica-enriched lower-plate carbonate rocks), a common alteration
feature associated with Carlin-type gold deposits, is present along
fault strike
-
IP anomalies suggest the TH Fault
intersects faults associated with the historical Courtney
resource
-
IP data indicates that the TH
Fault is associated with horst and graben structures as observed in
the historical Courtney resource
-
TH Target Zone step-out ranges
from 100-400m to the nearest previous drilling
-
Near-term TH Target Zone has a
strike length of ~600m with the potential to test extensions in
future drill programs
Courtney Extension Target
Zone
-
Drillhole DTY008 intersected
22.9m @ 1.62 g Au/t, from 103.6m (incl. 15.2m @ 2.20 g Au/t)
contributing to a grade thickness of 57.4 gram-meters (see Figure
2). Adjacent holes 60-100 meters away contained grade thicknesses
of 25 to 50 gram-meters
-
Soil samples within the 100m x
100m target zone exhibit anomalous values of gold, silver, arsenic,
and mercury centred on DTY008
-
DTY008 also intersected anomalous
gold (25.9m @ 0.23 g Au/t from 195.1m) at the same depth as a
resistivity-high observed in CSAMT (Controlled Source Audio
Magnetotelluric) geophysical data from a historical survey
(approximately 200-meter depth)
-
Resistivity highs in the area
correspond to a southeast trend of mineralization observed in the
historical Courtney resource
-
Follow-up drilling will step out
from the historical Courtney resource and from previous exploration
targets to test the CSAMT anomaly, and near-surface gold
mineralization which is open in all directions
California Target
Zone
-
Immediately northwest of the
past-producing Toiyabe-Saddle Mine, with mineralization open along
a northwest-southeast trend (see Figure 2)
-
Mineralization is trending in the
same direction as observed at the historical Courtney
resource
-
Significantly less drilling
activity when compared to the area surrounding the historical
Courtney resource
-
Drillhole DTY020 intersected
15.2m @ 0.72 g Au/t from surface, and 36.6m @ 1.12 g Au/t from a
depth of 19.8m (see Figure 2)
-
DTY020 intersected anomalous gold
at <60 meters and >150m indicating multiple mineralized
zones, near-surface and at depth
-
Soil samples within the 250m x
500m California Target Zone contain anomalous values of gold,
silver, arsenic, and mercury centered on DTY020.
The northwest trend of these anomalous soils
will guide the current step out drilling planned for
2022
-
Follow-up drilling will test
surface soil anomalies, near-surface mineralization, and
mineralization at depth
Next Steps:
Shareholders can expect an additional update in relation to
the 17 line-kilometer IP program completed this fall at Toiyabe and
the neighbouring Turquoise Canyon Property ("Turquoise Canyon"), with the bulk
of the survey at Turquoise Canyon. These results will provide
further support for ongoing modeling and targeting efforts.
Preliminary review has identified several high-resistivity areas
which host carbonate rocks, along with high-conductivity areas
demonstrating the potential for new mineralized zones at Turquoise
Canyon (which historically has not seen drilling).
The first phase of the Company's 2022 drill program will
focus on high-priority targets at the Toiyabe Project. Results at
the TH Target and Courtney Extension Target Zones will also inform
future programs as Westward looks to extend exploration drilling
east onto Turquoise Canyon.
Qualified Person
The technical information contained in this news release was
reviewed and approved by Steven R. Koehler, Technical Advisor to
the Company, who is a Qualified Person under National Instrument
43-101 - Standards of
Disclosure for Mineral Projects.
About Westward Gold
Westward Gold is a mineral exploration company focused on
developing the Toiyabe and Turquoise Canyon Projects located in the
Cortez Hills area of Lander County, Nevada. From time to time, the
Company may also evaluate the acquisition of other mineral
exploration assets and opportunities.
For further information contact:
Raymond D.
Harari
Chief Executive Officer
Westward Gold Inc.
rdh@canaliscapital.com
Tel: +507-6675-2221
The Canadian Securities Exchange
has neither approved nor disapproved the contents of this news
release. The Canadian Securities Exchange does not accept
responsibility for the adequacy or accuracy of this news
release.
Forward-looking statements or
information are subject to a variety of known and unknown risks,
uncertainties and other factors that could cause actual events or
results to differ from those reflected in the forward-looking
statements or information, including, without limitation, the need
for additional capital by the Company through financings, and the
risk that such funds may not be raised; the speculative nature of
exploration and the stages of the Company's properties; the effect
of changes in commodity prices; regulatory risks that development
of the Company's material properties will not be acceptable for
social, environmental or other reasons, availability of equipment
(including drills) and personnel to carry out work programs, that
each stage of work will be completed within expected time frames,
that current geological models and interpretations prove correct,
the results of ongoing work programs may lead to a change of
exploration priorities, and the efforts and abilities of the senior
management team. This list is not exhaustive of the factors that
may affect any of the Company's forward-looking statements or
information. These and other factors may cause the Company to
change its exploration and work programs, not proceed with work
programs, or change the timing or order of planned work programs.
Although the Company has attempted to identify important factors
that could cause actual results to differ materially, there may be
other factors that cause results not to be as anticipated,
estimated, described or intended. Accordingly, readers should not
place undue reliance on forward-looking statements or information.
The Company's forward-looking statements and information are based
on the assumptions, beliefs, expectations and opinions of
management as of the date of this press release, and other than as
required by applicable securities laws, the Company does not assume
any obligation to update forward-looking statements and information
if circumstances or management's assumptions, beliefs, expectations
or opinions should change, or changes in any other events affecting
such statements or information.