Australia's Top Miners Hit Five-Month High on China Demand Hopes
November 13 2022 - 10:50PM
Dow Jones News
By Rhiannon Hoyle
Shares in some of Australia's biggest mining stocks jumped
Monday, buoyed by hopes for improving commodity demand after China
signaled a loosening of pandemic restrictions and a reversal in its
property-sector crackdown.
Shares in BHP Group Ltd., the world's No. 1 miner by market
value and a major producer of steelmaking commodities iron ore and
metallurgical coal, were recently 5.0% higher at 44.20 Australian
dollars (US$29.65) a share.
Rival Rio Tinto Ltd., the world's top iron-ore producer and No.
2 miner overall by market value, was 4.3% higher at A$107.03 a
share.
Both stocks are at their highest price since June. Other miners
including Fortescue Metals Group Ltd. and South32 Ltd. also
rallied.
China's central bank and top banking regulator issued a
wide-ranging series of measures aimed at bolstering housing demand
and supply, according to a notice circulated Friday to the
country's financial institutions and officials involved in
policy-making.
China's property sector accounts for roughly 30% of China's
steel demand and 20%-30% of China's aluminum, zinc and copper
consumption, according to Commonwealth Bank of Australia analyst
Vivek Dhar.
Still, the outlook for commodity demand is opaque after a deep
slump in the country's real-estate market in recent times, he said
in a client note Monday.
"With homebuyer and creditor confidence so eroded, it's hard to
gauge how quickly China's property sector can recover, even if
China's Covid-zero policy has been relaxed," Mr. Dhar said. "We'd
likely need to see a more meaningful relaxation of China's
Covid-zero policy and a greater tolerance to live with Covid-19
than to eliminate it."
Write to Rhiannon Hoyle at rhiannon.hoyle@wsj.com
(END) Dow Jones Newswires
November 13, 2022 22:35 ET (03:35 GMT)
Copyright (c) 2022 Dow Jones & Company, Inc.
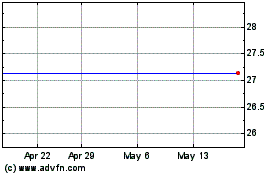
Fortescue Metals (ASX:FMGCD)
Historical Stock Chart
From Dec 2024 to Jan 2025

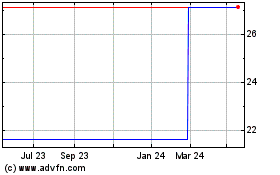
Fortescue Metals (ASX:FMGCD)
Historical Stock Chart
From Jan 2024 to Jan 2025
