0000875355false--12-31FY2023truefalsefalse0.010.0157140001797000174300000009.600.000000677000P5Y00008753552023-01-012023-12-310000875355ldwy:AcquisitionOfBloomiaBVMemberus-gaap:SubsequentEventMember2024-02-012024-02-220000875355ldwy:CreditAgreementMemberus-gaap:SubsequentEventMember2024-06-300000875355ldwy:CreditAgreementMember2023-01-012023-12-310000875355ldwy:CreditAgreementMember2023-12-310000875355ldwy:AcquisitionOfBloomiaBVMember2023-12-310000875355ldwy:AcquisitionOfBloomiaBVMember2023-01-012023-12-310000875355us-gaap:RepurchaseAgreementsMember2023-01-012023-12-310000875355us-gaap:RepurchaseAgreementsMembersrt:BoardOfDirectorsChairmanMember2023-08-280000875355us-gaap:StateAndLocalJurisdictionMember2023-12-310000875355us-gaap:DomesticCountryMember2023-12-3100008753552020-12-310000875355us-gaap:EmployeeStockMember2023-12-310000875355us-gaap:EmployeeStockMember2022-01-012022-12-310000875355us-gaap:EmployeeStockMember2023-01-012023-12-310000875355us-gaap:RestrictedStockUnitsRSUMember2022-08-012022-08-310000875355us-gaap:RestrictedStockUnitsRSUMember2023-12-310000875355ldwy:ExercisePriceRangeOneMember2023-01-012023-12-310000875355ldwy:ExercisePriceRangeOneMember2023-12-310000875355ldwy:OtherMember2023-01-012023-12-310000875355ldwy:OtherMember2022-01-012022-12-310000875355ldwy:CorporateHeadquartersMember2023-01-012023-12-3100008753552022-01-012022-09-300000875355ldwy:NewsAmericaMember2022-01-012022-09-300000875355ldwy:NewsAmericaMember2022-07-0100008753552023-08-0300008753552024-02-012024-02-220000875355srt:MaximumMemberus-gaap:LeaseholdImprovementsMember2023-01-012023-12-310000875355srt:MinimumMemberus-gaap:LeaseholdImprovementsMember2023-01-012023-12-310000875355srt:MaximumMemberldwy:ComputerEquipmentAndSoftwareMember2023-01-012023-12-310000875355srt:MinimumMemberldwy:ComputerEquipmentAndSoftwareMember2023-01-012023-12-310000875355srt:MaximumMemberus-gaap:FurnitureAndFixturesMember2023-01-012023-12-310000875355srt:MinimumMemberus-gaap:FurnitureAndFixturesMember2023-01-012023-12-310000875355us-gaap:RetainedEarningsMember2023-12-310000875355us-gaap:AdditionalPaidInCapitalMember2023-12-310000875355us-gaap:CommonStockMember2023-12-310000875355us-gaap:RetainedEarningsMember2023-01-012023-12-310000875355us-gaap:AdditionalPaidInCapitalMember2023-01-012023-12-310000875355us-gaap:CommonStockMember2023-01-012023-12-310000875355us-gaap:RetainedEarningsMember2022-12-310000875355us-gaap:AdditionalPaidInCapitalMember2022-12-310000875355us-gaap:CommonStockMember2022-12-310000875355us-gaap:RetainedEarningsMember2022-01-012022-12-310000875355us-gaap:AdditionalPaidInCapitalMember2022-01-012022-12-310000875355us-gaap:CommonStockMember2022-01-012022-12-3100008753552021-12-310000875355us-gaap:RetainedEarningsMember2021-12-310000875355us-gaap:AdditionalPaidInCapitalMember2021-12-310000875355us-gaap:CommonStockMember2021-12-3100008753552022-01-012022-12-3100008753552022-12-3100008753552023-12-3100008753552024-03-2700008753552023-06-30iso4217:USDxbrli:sharesiso4217:USDxbrli:sharesxbrli:pure
UNITED STATES
SECURITIES AND EXCHANGE COMMISSION
Washington, D.C. 20549
FORM 10-K
ANNUAL REPORT PURSUANT TO SECTION 13 OR 15(d)
OF THE SECURITIES EXCHANGE ACT OF 1934
For the fiscal year ended December 31, 2023 | | Commission File Number 001-13471 |
LENDWAY, INC. |
(Exact name of registrant as specified in its charter) |
Delaware | | 41-1656308 |
(State or other jurisdiction of incorporation or organization) | | (IRS Employer Identification No.) |
5000 West 36th Street, Suite 220, Minneapolis, MN 55416 |
(Address of principal executive offices; zip code) |
(763) 392-6200 |
(Registrant’s telephone number, including area code) |
Insignia Systems, Inc.; 212 Third Avenue N, Suite 356, Minneapolis, MN 55401 |
(Former name, former address and former fiscal year, if changed since last report) |
Securities Registered Pursuant to Section 12(b) of the Act:
Title of each class | | Trading Symbol | | Name of each exchange on which registered |
Common Stock, $0.01 par value | | LDWY | | The Nasdaq Stock Market LLC |
Securities Registered Pursuant to Section 12(g) of the Act: None
Indicate by check mark if the registrant is a well-known seasoned issuer, as defined in Rule 405 of the Securities Act. Yes ☐ No ☒
Indicate by check mark if the registrant is not required to file reports pursuant to Section 13 or Section 15(d) of the Act. Yes ☐ No ☒
Indicate by check mark whether the registrant (1) has filed all reports required to be filed by Section 13 or 15(d) of the Securities Exchange Act of 1934 during the preceding 12 months (or for such shorter period that the registrant was required to file such reports), and (2) has been subject to such filing requirements for the past 90 days. Yes ☒ No ☐
Indicate by check mark whether the registrant has submitted electronically every Interactive Data File required to be submitted pursuant to Rule 405 of Regulation S-T (§232.405 of this chapter) during the preceding 12 months (or for such shorter period that the registrant was required to submit such files). Yes ☒ No ☐
Indicate by check mark whether the registrant is a large accelerated filer, an accelerated filer, a non-accelerated filer, a smaller reporting company, or emerging growth company. See the definitions of “large accelerated filer,” “accelerated filer,” “smaller reporting company” and “emerging growth company” in Rule 12b-2 of the Exchange Act.
Large accelerated filer | ☐ | Accelerated filer | ☐ |
Non-accelerated filer | ☒ | Smaller reporting company | ☒ |
| | Emerging growth company | ☐ |
If an emerging growth company, indicate by check mark if the registrant has elected not to use the extended transition period for complying with any new or revised financial accounting standards provided pursuant to Section 13(a) of the Exchange Act. ☐
Indicate by check mark whether the registrant has filed a report on and attestation to its management’s assessment of the effectiveness of its internal control over financial reporting under Section 404(b) of the Sarbanes-Oxley Act (15 U.S.C. 7262(b)) by the registered public accounting firm that prepared or issued its audit report. ☐
If securities are registered pursuant to Section 12(b) of the Act, indicate by check mark whether the financial statements of the registrant included in the filing reflect the correction of an error to previously issued financial statements. ☐
Indicate by check mark whether any of those error corrections are restatements that required a recovery analysis of incentive-based compensation received by any of the registrant’s executive officers during the relevant recovery period pursuant to §240.10D-1(b). ☐
Indicate by check mark whether the registrant is a shell company (as defined in Rule 12b-2 of the Exchange Act). Yes ☐ No ☒
The aggregate market value of the voting and non-voting common equity held by non-affiliates of the registrant as of the last business day of the registrant’s most recently completed second fiscal quarter (June 30, 2023) was approximately $4,692,000 based upon the price of the registrant’s Common Stock on such date.
Number of shares outstanding of Common Stock, $0.01 par value, as of March 27, 2024 was 1,742,599.
DOCUMENTS INCORPORATED BY REFERENCE:
Portions of the registrant’s definitive proxy statement for its 2024 Annual Meeting of Stockholders are incorporated by reference into Part III of this Annual Report on Form 10-K where indicated. Such proxy statement will be filed with the U.S. Securities and Exchange Commission within 120 days after the end of the fiscal year to which this report relates.
TABLE OF CONTENTS
PART I.
Item 1. Business
General
This Annual Report on Form 10-K is being filed by the registrant, Lendway, Inc. (“Lendway,” “we,” “us,” “our” and the “Company”), a Delaware corporation. Effective August 4, 2023, we changed our name from “Insignia Systems, Inc.” and reincorporated from Minnesota to Delaware. As part of the name change, our common stock now trades under the symbol “LDWY” on The Nasdaq Stock Market LLC.
The Company has evolved into a specialty agricultural (“ag”) and finance company focused on making and managing its ag investments in the United States (“U.S.”) and internationally. The Company is the majority owner of Bloomia B.V. and its affiliated entities, representing a significant producer of fresh cut tulips (“stems”) in the U.S. The Company also fully owns and operates FarmlandCredit.com, a non-bank lending business that seeks to purchase existing loans and/or originate and fund new loans domestically. During the past twelve months, the Company took three major steps in its evolution.
The Company is building a scalable non-bank lending business (“Lending Business”) to purchase existing loans or originate and fund new loans, all of which will be secured by collateral. Initially, we intend to focus on loans secured by real estate, primarily for agricultural purposes. We expect to expand our product offerings over time as we identify needs and opportunities in the marketplace for loans generally. Our plan, therefore, is to build a portfolio of well-secured loans, with a portion of the credit risk being participated to third parties in most cases, to maintain a low net loss experience and to charge fully compensatory rates and fees.
On August 3, 2023, the Company completed the sale of certain assets and certain liabilities relating to the Company’s legacy business of providing in-store advertising solutions to brands, retailers, shopper marketing agencies and brokerages (the “In-Store Marketing Business”) for a price of $3.5 million, subject to escrows and a post-closing adjustment.
The operations of the In-Store Marketing Business are presented as discontinued operations beginning with the Quarterly Report on Form 10-Q for the three months ended September 30, 2023, the quarter in which the sale of the In-Store Marketing Business met the criteria as discontinued operations. All previous periods presented have been restated to present the In-Store Marketing Business as discontinued operations. See Note 2 to the Consolidated Financial Statements appearing in Part II, Item 8, of this Annual Report on Form 10-K for a further description of the impact of the sale of the In-Store Marketing Business on the consolidated financial statements.
On February 22, 2024, the Company acquired Bloomia B.V. (“Bloomia”) for a price of $47.5 million financed with Company cash, a new credit facility and promissory notes payable to the sellers. Bloomia is one of the largest producers of fresh cut tulips in the United States, nurturing over 75 million stems annually. Bloomia purchases tulip bulbs, hydroponically grows tulips from the bulbs, and sells the stems to retail stores. The Company’s primary focus in the near-term will be on the Bloomia business.
Our internet address is www.lendway.com. We make all reports we file with the Securities and Exchange Commission (“SEC”), including our annual reports on Form 10-K; quarterly reports on Form 10-Q; current reports on Form 8-K; and amendments to those reports, if any, available free of charge on its website, as soon as reasonably practicable after electronically filing such materials with, or furnishing them to the SEC. Our website is not incorporated by reference into this Annual Report on Form 10-K. Copies of reports can also be obtained free of charge by requesting them from Lendway, Inc. Our mailing address is 5000 West 36th Street, Suite 220, Minneapolis, MN 55416; telephone 763-392-6200.
Recent Acquisitions
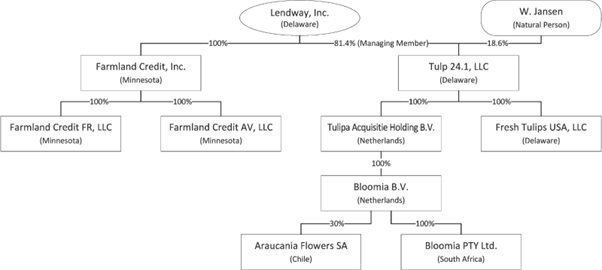
On February 22, 2024, we completed the acquisition of Bloomia B.V., a private company with limited liability (besloten vennootschap met beperkte aansprakelijkheid) incorporated under the laws of the Netherlands (“Bloomia”). The Acquisition was completed through Tulp 24.1, LLC, a Delaware limited liability company ( “Tulp 24.1”) and Tulipa Acquisitie Holding B.V., a private company with limited liability (besloten vennootschap met beperkte aansprakelijkheid) incorporated under the laws of the Netherlands and a wholly owned subsidiary of Tulp 24.1 ( “Tulipa”, together with Tulp 24.1, the “Purchasers”), pursuant to an Agreement for the Sale and Purchase of Shares (the “Purchase Agreement”) by and among Tulp 24.1, Tulipa, Botman Bloembollen B.V. (“Botman”), W.F. Jansen, who has continued to serve as chief executive officer of Bloomia (“Jansen”), and H.J. Strengers (“Strengers”, together with Botman and Jansen, the “Sellers”) and Lendway, as the Guarantor. Following the Acquisition, Tulp 24.1 became the holder of 100% of the ownership interests of Bloomia. As a result of the acquisition, Lendway holds an 81.4% ownership interest in Tulp 24.1 and Jansen owns the remaining 18.6% ownership interest.
We acquired Bloomia for $47.5 million. The acquisition price was paid with $9.2 million of the Company’s cash, $22.8 million of proceeds from a new credit agreement, and promissory notes payable to the sellers totaling $15.5 million.
We entered into a revolving credit and term loan agreement (the “Credit Agreement”), together with Tulp 24.1 as the borrower. Under the terms of the Credit Agreement, Tulp 24.1 had an $18.0 million term loan funded. The Credit Agreement also contains a $6.0 million revolving credit facility, which may be used by Tulp 24.1 for general business purposes and working capital. The Credit Agreement contains ongoing affirmative and negative covenants that Tulp 24.1 is required to comply with. The Company provided an unsecured guaranty of the obligations of Tulp 24.1 under the Credit Agreement.
The Company acquired Farmland Credit, Inc., a Minnesota corporation (“FCI”), and FCI’s subsidiaries, Farmland Credit FR, LLC and Farmland Credit AV, LLC for a nominal amount from a related party, Air T, Inc., a member of the group that holds 38.9% of Lendway’s outstanding shares. This transaction was part of starting the non-bank lending business discussed below.
The following summarizes the current entity structure of the Company:
Segments
With the February 2024 acquisition of Bloomia, we operate in two industry segments:
| · | Specialty Ag, consisting of the Bloomia business |
| | |
| · | Non-bank Lending, consisting of the Lending Business |
Specialty Ag
Our Specialty Ag segment consists of Bloomia’s operations. Bloomia was founded in the Netherlands and has grown to become a leader in the fresh cut tulip industry in the U.S. Bloomia nurtured over 75 million stems annually in 2023 and 2022. Bloomia operates from three strategically positioned locations in the United States, the Netherlands and South Africa, and also has a 30% interest in a greenhouse business in Chile.
Bloomia operates greenhouses to hydroponically grow tulips at its United States and South Africa locations. Bloomia has invested in automation in its U.S. greenhouse in recent years that has increased production efficiency. Bloomia has historically sourced tulip bulbs from producers in the Netherlands, Chile, and New Zealand, which provides for year-round supply. Bulbs from the Southern Hemisphere are generally used from the end of August to early December, with the Northern Hemisphere produced bulbs used the remainder of the year.
Bloomia has established business relationships with prominent retailers. A small number of mass-market retailers in the U.S. have historically accounted for more than 99% of Bloomia’s total annual sales. Revenues are mainly generated on the East Coast, leaving potential for growth on the West Coast. Bloomia aims to offer premium tulip stems, the result of sourcing larger bulbs, that have a longer shelf life than imported stems. Growing bulbs domestically also allows for higher margins because the freight costs for importing bulbs by sea have been substantially less than the costs associated with importing stems by air.
In the Netherlands, Bloomia’s office facilitates the sourcing of bulbs, conditioning to prepare bulbs for planting, and shipping of bulbs to its United States and South Africa facilities.
In South Africa, Bloomia’s wholly owned subsidiary operates a greenhouse that has produced an average of approximately 3.5 million tulip stems per year over the last five years. The facility is capable of growing tulips hydroponically year-round.
In Chile, Bloomia has a minority ownership interest in Araucania Flowers S.A. (“Araucania”). The operation grows tulips hydroponically year-round. Its growing and production complex consists of about 8,600 square feet of greenhouse, 7,000 cubic feet of cold storage, and more than 2,400 square feet of processing space. Araucania traditionally sells to retailers located in Chile, Bolivia, and Peru.
Customers
Bloomia has well established customer relationships. In the U.S., Bloomia sells stems to some of the largest mass-market retailers. During 2023, Bloomia had approximately 15 customers in the U.S. Of those customers, three individually represented greater than 10% of Bloomia’s revenue, accounting for 37.7%, 16.2%, and 10.4% of its U.S. revenue during the 12 months ended December 31, 2023.
Industry
The estimated market for cut flowers in the United States for 2023 is approximately $8 billion, of which approximately 80% is imported and around 20% is produced within the U.S. Of overall cut flowers sales, approximately 15% is represented by tulip stems. Bloomia believes it has a market share of approximately 20% of the cut tulips grown in the U.S. Barriers to entry are considered high due to the need for high volumes and efficient operations to generate significant profitability.
Seasonality
In the U.S., the tulip industry has historically been highly seasonal due to peak demand between January to May, supported by the Valentine’s Day, Easter, and Mother’s Day holidays, and also because of the tulip bulbs’ growing season in traditional sourcing areas. The tulip market is growing outside of the peak season, as demand increases for other events such as birthdays and weddings. As one of only a few tulip producers in the U.S. with sourcing of bulbs from the Southern Hemisphere, we believe Bloomia is well positioned to fill this growing demand.
Competition
Bloomia competes with both local (U.S.) producers and foreign producers who import cut tulips, primarily from the Netherlands. Bloomia has carved out a strong competitive position amongst U.S. growers by developing unique infrastructure through the combination of hydroponics and an integrated supply chain. Growing tulips in a greenhouse using hydroponics enables year-round production and requires less water and nutrients to grow the stems, and results in tulips that are better quality and have a longer shelf life. By sourcing tulip bulbs from both the Netherlands and the Southern Hemisphere, Bloomia is able to offer quality fresh cut tulips year-round, meeting unmet demand.
Supply Chain
The supply chain steps for U.S. operations are detailed below:
Step 1: Procure bulbs: Purchase bulbs from established suppliers in the Netherlands or Southern Hemisphere.
Step 2: Buffer storage: Bulbs kept in cooled storage in the Netherlands.
Step 3: Shipping to U.S.: Bulbs are shipped via ocean containers.
Step 4: Rooting: Bulbs are prepared for growing.
Step 5: Growing: Bulbs are moved into the greenhouse.
Step 6: Harvesting: Tulips are cut and wrapped.
Step 7: Storage: Stems are stored in a cooled warehouse to prevent spoilage.
Step 8: Transport: Stems are transported to retailer’s distribution centers.
Step 9: Sales: Consumer sales at mass-market retailers.
During 2023 Bloomia sourced bulbs to grow around 75 million stems. The Netherlands has around 1,500 bulb suppliers, who jointly export over 2.5 billion tulip bulbs each year. Over the past five years, Bloomia has sourced from the 10 largest producers, 20 medium-sized producers, as well as from smaller producers.
The Netherlands’ large-scale production of tulip bulbs has created an efficient marketplace for Bloomia to source bulbs. The large majority of Bloomia’s contracts for purchase of bulbs from growers in the Netherlands are short term; however, Bloomia has a long history with most of its suppliers. Bulb contracts obligate Bloomia only to buy an agreed upon volume of bulbs; bulb price is established through market pricing.
To help facilitate year-round growing, Bloomia has routinely sourced bulbs from Chile and more recently began sourcing bulbs from New Zealand. Chile and New Zealand are currently the only countries in the Southern Hemisphere with bulb production at volume. By sourcing bulbs from around the world, Bloomia has bulbs that are ready for planting year-round, limiting its reliance on importing stems. Year-round production results in Bloomia being less exposed to higher logistics costs that result from importing stems.
Bloomia has also made investments to automate its greenhouse. The automation of the greenhouse allows Bloomia to:
| · | scale production faster if needed to meet demand; |
| | |
| · | increase greenhouse efficiency resulting in higher margins, and; |
| | |
| · | reduce its dependence on seasonal labor. |
Bloomia and its customers conduct regular purchase planning meetings, enabling Bloomia to fine-tune its planning for delivery volume and timing. Bloomia is also a member of three trade associations; providing import/export logistics support, marketing support, and support for conducting business with wholesalers.
Non-Bank Lending Segment
We are building a scalable Lending Business to purchase existing loans or originate and fund new loans, all of which will be secured by collateral (individually or collectively, “Secured Loans”). In April 2023, we launched our Lending Business, through the hiring of a Senior Vice President of Lending with over 20 years of experience in credit and lending.
Initially, we intend to focus on loans secured by real estate, primarily for agricultural purposes. We expect to expand our product offerings over time as we identify needs and opportunities in the marketplace for loans generally. Our plan, therefore, is to build a portfolio of well-secured loans, with a portion of the credit risk being participated to third parties in most cases, to maintain a low net loss experience and to charge fully compensatory rates and fees.
We are building our strategy and long-term growth initiatives through development of customized niche products to support identified customer needs and opportunities in the marketplace, and effective funding structures to maximize returns.
Competition
We face competition from other entities that originate, purchase, securitize, or provide financing for Secured Loans. These entities include commercial and investment banks, insurance companies, Farm Credit System institutions, and financial funds.
We plan to compete through development of niche products and effective fundings structures, while controlling overhead costs. The relative competitiveness and our ability to grow loan volume will be affected by many factors, including demand for the lending products we offer, availability of capital, and liquidity and cost of funds from third-party funding sources.
Activity to Date
The Company met with a number of prospects for loan originations and/or purchases since the start of the lending business. Deals were negotiated, but ultimately did not close. With the Company’s decision to allocate capital to the Bloomia acquisition, capital available for the lending business will be significantly constrained in the near term. Accordingly, we anticipate minimal revenue and operating losses from the lending business during the remainder of 2024.
Intellectual Property: Patents and Trademarks
Bloomia holds a trademark on its name and logo. Certain employees are required to enter into nondisclosure and invention assignment agreements. Customers, vendors and other third parties also must agree to nondisclosure restrictions to prevent unauthorized disclosure of the Company’s trade secrets or other confidential or proprietary information.
Environmental Matters
We believe our operations follow all applicable environmental regulations within the jurisdictions in which we operate. The costs and effects of compliance with these regulations have not been and are not expected to become material.
Importers of cut flowers air ship stems to the U.S., while Bloomia ships bulbs via sea containers. Bloomia’s business model (shipping bulbs for local production) lowers its carbon footprint compared to importers of cut flowers. Hydroponic farming method is free of pesticides, requires less water and has fewer diseases, and requires substantially fewer import shipments.
Governmental Regulation
The Company and its subsidiaries are subject to regulation by various governmental agencies. Bloomia has an import permit from the USDA for shipments of tulip bulbs. For import of bulbs from the Netherlands to the U.S., Bloomia participates in a pre-clearance program with the USDA where the climate-controlled tulip bulb shipments are inspected in the Netherlands, and the containers are sealed in the Netherlands. While there is a process for random inspection by the USDA once the shipment arrives on U.S. shores, receiving of the shipment is generally expedited. Chile has a similar process through the USDA. The European Union regulations may impact aspects of the growing of tulip bulbs in the Netherlands. Farmland Credit FR, LLC has a money broker’s license in North Dakota.
Employee and Human Capital Resources
As of March 1, 2024, the Company and its subsidiaries had 156 employees, of which 5 were part-time employees. None of the employees are represented by labor unions. During 2023, approximately 50% of our hourly workers were hired for seasonal support during January through the end of May. As of March 1, 2024, 54 employees were seasonal. We employ temporary foreign agricultural workers (H2A employees).
We regard our relationship with our employees as favorable. Our human capital resources objectives include, as applicable, identifying, recruiting, retaining, incenting, and integrating our employees. Our human capital department also requests quarterly feedback through surveys and focus groups to continuously improve the workplace and employee relations. As it relates to our employees:
Oversight and Management
Our executive officers are tasked with leading our organization and managing employment-related matters, including recruiting, hiring, onboarding, training, compensation planning, talent management and development. We are committed to providing team members with the training and resources necessary to continually strengthen their skills both inside and outside the workplace. In 2023, Bloomia added to its Human Capital and Human Resources team, to take on initiatives such as employee wellness programs and continuing education.
Our executive team is responsible for periodically reviewing team member programs and initiatives, including healthcare and other benefits, as well as our management development and succession planning practices. Management periodically reports to the Board regarding our human capital measures and results that guide how we attract, retain, and develop a workforce to enable our business strategies.
Workplace Safety and Health
A vital part of our business is providing our workforce with a safe, healthy, and sustainable working environment. We focus on implementing change through workforce observation and feedback channels to recognize risk and continuously improve our processes. Our team continues to also focus on improving our educational materials for employees to be informed of the best safety practices based on OSHA guidelines and workplace observations.
Item 1A. Risk Factors
Our business is subject to many risks. The following are significant factors known to us that could materially adversely affect our business, reputation, operating results, industry, financial position, or future financial performance.
RISKS RELATING TO OUR BUSINESS AND OPERATIONS
We face competition and cannot guarantee our continued ability to compete effectively.
Our Bloomia business competes against other providers of cut tulips and other participants in the broader cut floral industry. Competition is based on, among other things, price, quality, product perception and ability to fulfill orders, particularly during seasonal peaks. We face direct competition from other growers as well as indirect competition through retailers who are supplied by our competitors, including on-line flower delivery websites. If competitors succeed in diverting business from our current customers or capturing a greater share of the overall market for cut tulips or cut flowers generally, Bloomia’s revenues and related operations would be adversely affected, potentially materially.
Our revenue is highly concentrated among a small number of customers.
During calendar 2023, three customers accounted for approximately 64.3% of Bloomia’s revenue. Although those customers have a history of purchasing fresh-cut tulips from Bloomia, there are no long-term purchase commitments. If one or more of Bloomia’s traditional customers significantly reduces or ceases purchasing fresh-cut tulips from Bloomia, then Bloomia could experience a significant decrease in revenue. Bloomia has historically had a high retention rate, with the majority of our significant customers having business relationships in excess of five years.
We may be unable to prevent our competitors from benefiting from the expertise of our former executives.
In connection with the acquisition of Bloomia, we entered into non-compete agreements with its former owners. These agreements prohibit the former owners from competing with Bloomia’s business for a three-year period from the February 22, 2024 acquisition date. We may be unable to enforce these agreements under the laws of the jurisdictions in which our business operates and it may be difficult for us to restrict our competitors from benefiting from the expertise that our former owners developed while working for us. If we cannot demonstrate that such interests will be harmed, we may be unable to prevent our competitors from benefiting from the expertise of our former owners and our ability to remain competitive may be diminished.
RISKS RELATING TO ECONOMY AND MARKET CONDITIONS
We are subject to changes in interest rates.
The majority of our debt carries floating interest rates and is subject to interest rate fluctuations. Borrowings under the Credit Agreement bear interest at a rate per annum equal to Term SOFR for an interest period of one month plus 3.0%. Changes in interest rates are caused by a number of factors beyond our control. If the SOFR interest rate increases significantly, our interest expense and cash paid for interest will increase, and our ability to obtain additional financing may decrease, which may materially adversely affect our operations.
Our net sales and earnings have been and could continue to be adversely affected by economic conditions and outlook in the markets in which we conduct business.
Adverse economic conditions and outlook in the U.S. and in other countries in which we conduct business, such as South Africa and South America, have previously and could in the future impact our net sales and earnings. These adverse economic conditions could include, but are not limited to, business closures, slowdowns, suspensions or delays of production and commercial activity; recessionary conditions; slow or negative economic growth rates; reduced consumer spending levels; increased or prolonged high unemployment rates; higher costs, longer lead times, and reduced availability of commodities, components, parts, and accessories, including as a result of transportation-related costs, inflation, changing prices, foreign currency fluctuations, tariffs, and/or duties; inflationary or deflationary pressures; reduced infrastructure spending; the impact of U.S. federal debt, state debt, and sovereign debt defaults and austerity measures by certain European countries; reduced credit availability or unfavorable credit terms for our distributors, dealers, and end-user customers; higher short-term, mortgage, and other interest rates; government shutdowns; and general economic and political conditions and expectations. Fresh cut tulips are something of a discretionary purchase and consumers may reduce purchases of tulips in slower economic times. In the past, some of these factors have caused and may continue to cause customers to reduce spending and delay or forego purchases of our products, which has had an adverse effect on our net sales and earnings.
STRATEGIC RISKS
Our company’s results are highly dependent on Bloomia’s success.
Although we intend to continue to develop our non-bank lending business, we have committed a substantial portion of our capital to the acquisition and growth of Bloomia’s business. With this lack of diversification, for at least the near term, our cash flow and ability to service our debt is highly dependent on the performance of the Bloomia business. Risks inherent in the Bloomia business are discussed in this section.
Failure to successfully manage the recently acquired Bloomia business and other future acquisitions could adversely affect our business.
As part of our strategy to develop our specialty ag and finance strategy, we recently acquired Bloomia, and may make additional acquisitions in the future. We cannot be certain that the businesses we acquire will become profitable or remain so. Our management and integration of the operations of acquired businesses requires significant efforts, including the coordination of information technologies and finance. These efforts result in additional expenses and involve significant amounts of management’s time that cannot then be dedicated to other projects. Factors that will affect the success of our acquisitions include:
| · | the presence or absence of adequate internal controls and/or significant fraud in the financial systems of acquired companies, |
| | |
| · | our ability or inability to integrate information technology systems of acquired companies in a secure and reliable manner, |
| | |
| · | any decrease in customer loyalty and product orders caused by dissatisfaction with the Company’s product lines and sales and marketing practices, including price increases, |
| | |
| · | our ability to retain key employees, and |
| | |
| · | ability to generate adequate cash flow to service the debt incurred for the acquisitions. |
These effects, individually or in the aggregate, could cause a deterioration of our credit and result in increased borrowing costs and interest expense.
We may not generate enough cash or secure enough capital to execute our business plans.
As we develop and grow our businesses, we may be required to finance this process through equity offerings or additional debt financings. To the extent that we raise additional capital through the sale of equity or debt financing, the ownership interest of our stockholders would be diluted, and the terms of those securities may include liquidation or other preferences that adversely affect the rights of our stockholders. Debt financing and preferred equity financing, if available, may involve agreements that include additional covenants limiting or restricting our ability to take specific actions, such as incurring additional debt, making capital expenditures or declaring dividends. Additional capital may not be available when needed, on reasonable terms, or at all, and our ability to raise additional capital may be adversely impacted by potential worsening global economic conditions and the recent disruptions to and volatility in the credit and financial markets in the U.S. and worldwide. If we are unable to raise additional funds when needed we may not be able to grow our businesses, or complete transactions related to our strategy.
OPERATIONAL RISKS
Restrictions in the Credit Agreement, could adversely affect the Bloomia business, financial condition, and results of operations.
The obligations under the Credit Agreement are secured by substantially all of the personal property assets of Tulp 24.1 and its subsidiaries. The Company provided an unsecured guaranty of the obligations of Tulp 24.1 under the Credit Agreement.
The Credit Agreement contains customary affirmative and negative covenants, including covenants that restrict the ability of Tulp 24.1 and its subsidiaries to incur additional indebtedness, dispose of significant assets, make distributions or pay dividends to the Company, make certain investments, including any acquisitions other than permitted acquisitions, make certain payments, enter into sale and leaseback transactions or grant liens on its assets, subject to certain limitations.
The provisions of the Company’s credit agreement or other debt instruments may restrict its ability to obtain additional financing and pursue attractive business opportunities and its flexibility in planning for, and reacting to, changes in business conditions. In addition, a failure to comply with the provisions of the Company’s credit agreement, any future credit facility or other debt instruments could result in a default or an event of default that could enable its lenders or other debt holders to declare the outstanding principal of that debt, together with accrued and unpaid interest, to be immediately due and payable. If the payment obligations of Tulp 24.1 or the Company under the Credit Agreement are accelerated, its assets may be insufficient to repay such debt in full. These factors could have a material adverse effect on the Company’s business, financial condition and results of operations.
The Credit Agreement restricts Tulp 24.1’s ability to make distributions to Lendway.
Under terms of the Credit Agreement, the Bloomia business is permitted to pay a management fee of $60,000 monthly to Lendway, but generally is not permitted to make distributions to its members, including Lendway. This may constrain cash available to Lendway for corporate expenses and expenses of the Lending Business. This constraint significantly limits the capital available for the Lending Business, for which we anticipate minimal revenue and losses during the remainder of 2024. The restriction on distributions will also limit our ability to fund additional strategic acquisitions using capital we have contributed to the Bloomia business.
The Company’s success depends on its key personnel.
The Company’s business results depend largely upon the continued contributions of our CEO Randy Uglem, as it relates to the Lending Business, and Bloomia’s CEO Werner Jansen as it relates to the tulip business. If Mr. Uglem or Mr. Jansen no longer serves in (or serves in some lesser capacity than) their current roles, or if the Company loses other members of our management team, we may not be able to successfully execute on our business strategy and our business, financial condition and results of operations, as well as the market price of its securities, could be adversely affected.
If we fail to establish and maintain effective internal control over financial reporting, then we may not be able to accurately or timely report our financial condition or results of operations, which may adversely affect our business and the market price of our common stock.
Company management is responsible for establishing and maintaining effective internal controls designed to provide reasonable assurance regarding the achievement of objectives relating to operations, reporting, and compliance. Any internal control system, no matter how well designed and operated, can only provide reasonable, not absolute, assurance that the objectives of the control system are met. Further, the design of a control system must reflect the fact that there are resource constraints, and the benefits of controls must be considered relative to their costs. Given the limited current number of employees, this resource constraint causes challenges in effectively providing appropriate segregation of duties. Because of the inherent limitations in all internal control systems, internal control over business processes and financial reporting may not prevent or detect fraud or misstatements.
We are required, pursuant to Section 404 of the Sarbanes Oxley Act (SOX), to furnish a report by management on, among other things, the effectiveness of our internal control over financial reporting. This assessment includes disclosure of any material weaknesses identified by our management in our internal control over financial reporting. As a smaller reporting company, the Company is not required to have an attestation from its external auditor on the effectiveness of its internal control over financial reporting and disclosure controls and procedures. With regards to its February 2024 acquisition of Bloomia, the Company intends to elect the provision under SOX to exclude the evaluation of internal control over financial reporting and disclosure controls and procedures for Bloomia for a one-year period after the acquisition date.
We cannot assure you that the measures we have taken to date, and actions we may take in the future, will prevent or avoid potential future material weaknesses. If we are unable to maintain effective internal control over financial reporting, the accuracy and timing of our financial reporting may be adversely affected, investors could lose confidence in the accuracy and completeness of our financial reports, the market price of our common stock could decline, we could be subject to sanctions or investigations by the Nasdaq Stock Market, the SEC or other regulatory authorities, and our ability to access the capital markets could be limited.
Bloomia’s international operations involve additional market and operational risks, and failure to manage these risks may adversely affect our business and operating results.
We operate in several countries throughout the world including South Africa, Chile and the Netherlands. Accordingly, we face significant operational risks from doing business internationally, including:
| · | fluctuations in foreign currency exchange rates; |
| · | potentially adverse tax consequences; |
| · | difficulties in staffing and managing foreign operations; |
| · | laws and business practices favoring local competition; |
| · | compliance with a wide variety of complex foreign laws, treaties and regulations; |
| · | tariffs, trade barriers and other regulatory or contractual limitations on their ability to sell or develop their products in certain foreign markets; and |
| · | being subject to the laws, regulations and the court systems of many jurisdictions. |
Our failure to manage the market and operational risks associated with our international operations effectively could limit the future growth of our business and adversely affect our operating results.
Exchange rate fluctuations between the U.S. dollar and the Euro and other non-U.S. currencies may negatively affect the earnings of our operations.
We report our financial results and most of our revenues are recorded in U.S. dollars. However, most of our tulip bulb costs as well as a portion of our general and administrative expenses, are incurred in euros. As a result, we are exposed to exchange rate risks that may adversely affect our financial results. For example, if the euro appreciates against the U.S. dollar, then the U.S. dollar cost of our operations in the Netherlands would increase and our results of operations would be adversely affected.
From time to time, we engage in currency hedging activities. These measures, however, may not adequately protect us from material adverse effects due to the fluctuations in the relative values of the U.S. dollar and the euro and other foreign currencies in which we transact business, and may result in a financial loss.
Failure to comply with the U.S. Foreign Corrupt Practices Act or other applicable anti-corruption legislation could result in fines, criminal penalties and an adverse effect on our business.
We are committed to doing business in accordance with applicable anti-corruption laws. We are subject, however, to the risk that our affiliated entities or our affiliates’ respective officers, directors, employees and agents may take action determined to be in violation of such anti-corruption laws, including the U.S. Foreign Corrupt Practices Act of 1977 and similar anti-bribery laws in non-U.S. jurisdictions, as well as trade sanctions administered by the Office of Foreign Assets Control and the U.S. Department of Commerce. Any such violation could result in substantial fines, sanctions, civil and/or criminal penalties, curtailment of operations in certain jurisdictions, and might adversely affect our results of operations. In addition, actual or alleged violations could damage our reputation and ability to do business.
Compliance with employment laws may adversely affect Bloomia’s business.
With the acquisition of Bloomia, we significantly increased the size and scope of our workforce. Various federal and state labor laws govern the relationship with Bloomia’s employees in the United States and impact operating costs. These laws include:
| · | employee classification as exempt or non-exempt for overtime and other purposes; |
| · | minimum wage requirements; |
| · | unemployment tax rates; |
| · | workers’ compensation rates; |
| · | immigration status; |
| · | mandatory health benefits; |
| · | paid leaves of absence, including paid sick leave; |
| · | tax reporting; and |
| · | other wage and benefit requirements. |
Although Bloomia verifies the employment eligibility status of its employees, some of its employees may, without Bloomia’s knowledge, be unauthorized workers. Unauthorized workers are subject to deportation and may subject Bloomia to fines or penalties, and if any of Bloomia’s workers are found to be unauthorized, Bloomia could experience adverse publicity that negatively impacts its brand and may make it more difficult to hire and keep qualified employees. Termination of a significant number of employees who were unauthorized employees may disrupt Bloomia’s operations, cause temporary increases in its labor costs as it trains new employees and result in additional adverse publicity. Bloomia could also become subject to fines, penalties and other costs related to claims that it did not fully comply with all recordkeeping obligations of federal and state immigration compliance laws. Failure to fully comply with one or more of these requirements could have a material adverse effect on the Company’s business, financial condition and results of operations.
Through Bloomia, we are subject to risks inherent in the operation of an agricultural business.
Our business involves agricultural products with the procuring of tulip bulbs and the growing of tulips. Such business is subject to the risks inherent in the agricultural business, such as insects, plant diseases, government regulations regarding bulb production and similar agricultural risks. We can reduce, but cannot eliminate, the impacts of adverse weather conditions because the significant majority of our tulips are grown in a hydroponic greenhouse.
Tulip bulbs, like any plant, are subject to quality issues and disease, and we could have significant inventory loss or production delays resulting from low quality tulips. In June of 2023 Bloomia wrote off $900,000 of tulip bulb inventory due to the bulbs not meeting Bloomia’s quality standards. The bulbs were sourced during the off-season which we believe contributed to the quality issues and subsequent write-off. Additionally, although we coordinate with recurring customers to plan production based on anticipated demand and projections, we may have to write down inventory or recognize a material impairment if our production significantly exceeds customer demand.
Accordingly, any of these factors may have a material adverse effect on our inventory and any future production of tulips and a corresponding adverse effect on our results of operations.
Energy and water price increases could adversely impact our profit margins.
Bloomia’s hydroponic greenhouse cultivation process uses significant energy and water. Certain factors which may impact the availability of energy and water are out of Bloomia’s control including, but not limited to, disruptions resulting from weather, economic conditions, and interruption of energy supply. Significant increases in the cost or access of energy and water, and the failure to fully pass any such increased prices and costs through to our customers or to modify our activities to mitigate the impact, would have an adverse effect on our production results and operating income.
Inclement weather and other disruptions to the transportation network could adversely impact our distribution system and demand for our products.
Bloomia’s operations rely on dependable and efficient transportation services, the disruption of which could result in difficulties supplying materials to Bloomia’s facilities and impair Bloomia’s ability to deliver products to its retail customers in a timely manner. Specifically, our ability to receive shipments of tulip bulbs from Bloomia’s Netherlands or Chilean facilities on a timely basis and to provide efficient distribution of our stems to our retail customers are integral components of our overall business strategy. The volumes handled by, and operating challenges at, ocean ports have at times been volatile and can delay the receipt of tulip bulbs or cause the cost of shipping goods to be more expensive. Additionally, the availability and reliability of truck transportation has been negatively impacted by a number of factors, including limited availability of qualified drivers and equipment and limitations on drivers’ hours of service. Impairment in our ability to receive timely shipments of tulip bulbs or distribute stems to our retail customers may affect our ability to both maintain core products in inventory and deliver products to customers on a timely basis, which may in turn adversely affect our consolidated results of operations.
TECHNOLOGY AND CYBERSECURITY RISKS
We rely on our management information systems for inventory management, distribution, and other key functions. If our information systems fail to adequately perform these functions, or if we experience an interruption in their operation, our business and operating results could be adversely affected.
The efficient operation of our business is dependent on our management information systems, both internal and outsourced. We rely on our management information systems to, among other things, effectively manage our accounting and financial functions, including maintaining our internal controls, and to manage our procurement, greenhouse, distribution and sales processes. The failure of our management information systems to perform properly could disrupt our business, which may result in decreased sales, increased overhead costs, excess or obsolete inventory, causing our business and operating results to suffer. We also have automated processes in our greenhouse operations, which could be adversely impacted by interruptions in their operations. Although we take steps to secure our management information systems and automated processes, including our computer systems, intranet and internet sites, email and other telecommunications and data networks, the security measures we have implemented may not be effective and our systems may be vulnerable to theft, loss, damage and interruption from a number of potential sources and events, including unauthorized access or security breaches, natural or man-made disasters, cyber-attacks, computer viruses, power loss, or other disruptive events. Our reputation, brand, and financial condition could be adversely affected if, as a result of a significant cyber event or otherwise, our operations are disrupted or shutdown; our confidential, proprietary information is stolen or disclosed; we incur costs or are required to pay fines in connection with stolen customer, employee, or other confidential information; we must dedicate significant resources to system repairs or increase cyber security protection; or we otherwise incur significant litigation or other costs.
RISKS RELATED TO AN INVESTMENT IN OUR COMPANY
Our Results of Operations Have Been and May Be Subject to Significant Fluctuations.
Our quarterly and annual operating results have fluctuated in the past and may vary in the future due to a wide variety of factors including:
| · | our ability to successfully operate the acquired Bloomia business at the levels of revenue and cash flow planned; |
| · | inability to close loans; |
| · | changes in interest rates; and |
| · | the impact of other strategic activities. |
Due to these factors, our quarterly and annual net sales, expenses and results of operations could vary significantly in the future, and this could adversely affect the market price of our common stock.
Investment in Our Stock Could Result in Fluctuating Returns.
During 2023, the sale prices of our common stock as reported by The Nasdaq Stock Market ranged from a low of $4.05 to a high of $9.67. We believe factors such as the fluctuations in our quarterly and annual operating results described above, the market’s acceptance of our services and products, the performance of our business relative to market expectations, the results of our acquired Bloomia business, as well as limited daily trading volume of our stock and general volatility in the securities markets, could cause the market price of our common stock to fluctuate substantially. In addition, the stock markets have experienced price and volume fluctuations, resulting in changes in the market prices of the stock of many companies, which may not have been directly related to the operating performance of those companies.
We may need to raise additional capital, which might not be available or might be available only on terms unfavorable to us or our investors.
In order to continue to operate and grow our businesses, we will likely need to raise additional capital beyond this current financing round by offering shares of our common or preferred stock and/or other classes of equity. All of these would result in dilution to our existing investors, plus they may include additional rights or terms that may be unfavorable to our existing investor base. We cannot assure you that the necessary funds will be available on a timely basis, on favorable terms, or at all, or that such funds, if raised, would be sufficient. The level and timing of future expenditure will depend on a number of factors, many of which are outside our control. If we are not able to obtain additional capital on acceptable terms, or at all, we may be forced to curtail or abandon our growth plans, which could adversely impact the Company, its business, development, financial condition, operating results or prospects.
We may be required to recognize impairment charges that could materially affect our results of operations.
We assess our intangible assets, and our other long-lived assets as and when required by GAAP to determine whether they are impaired. If they are impaired, we will record appropriate impairment charges. It is possible that we may be required to record significant impairment charges in the future and, if we do so, our results of operations could be materially adversely affected.
Certain significant stockholders of our company may exert a degree of control in a manner that conflicts with the interests of other stockholders.
Current significant holders of shares may have interests that are different than or adverse to our other stockholders. Based on public filings with the SEC, we believe that our largest stockholders and its affiliates hold approximately 38.9% of our issued and outstanding common shares. Based on this share ownership and the simple majority vote of shares present in person or by proxy that is sufficient for the approval of most actions at any stockholders meeting, those stockholders may be able to exercise a certain degree of control over certain matters requiring stockholders’ approval. Those matters include the election of directors, amendment of our articles of association and approval of significant corporate transactions, subject to rules requiring the approval of a special majority among non-interested stockholders in certain situations. This control could have the effect of delaying or preventing a change of control of our Company or changes in management and will make the approval of certain transactions difficult without the support of those significant stockholders, including transactions in which a non-significant stockholder might otherwise receive a premium for its shares over the then-current market price.
We could be deemed to have been a “shell company” after completion of the August 2023 asset sale and, as such, we and our stockholders could be restricted in reliance on certain rules or forms.
We have been focused on the successful startup and growth of our Lending Business since before the sale of assets relating to our former In-Store Marketing Business. Following the recent acquisition of the Bloomia business we have also been focused on managing Bloomia’s operations and growth. We do not believe that the Company, even after completion of the sale of the In-Store Marketing Business was a “shell company” as described under Rule 405 promulgated under the Securities Act and Rule 12b-2 promulgated under the Exchange Act, which is a company that has: no or nominal operations; and either (a) no or nominal assets; (b) assets consisting solely of cash and cash equivalents; or (c) assets consisting of any amount of cash and cash equivalents and nominal other assets.
However, a designation as a “shell company” could result in the application of Rule 144(i), which would limit the availability of the exemption from registration provided in Rule 144 for certain shares of Company common stock and could result in certain persons affiliated with the Company being deemed “statutory underwriters under Rule 145(c). Some of the presently outstanding shares of our common stock are “restricted securities” as defined under Rule 144 promulgated under the Securities Act and may only be sold pursuant to an effective registration statement or an exemption from registration, if available. Pursuant to Rule 144, if we were designated a “shell company” as defined in Rule 405 of the Securities Act and Rule 12b-2 of the Exchange Act, one year would be required to elapse from the time, we ceased to be a “shell company” and filed a Form 8-K addressing Item 5.06 with such information as may be required in a Form 10 Registration Statement with the SEC, before our restricted stockholders could resell their holdings in reliance on Rule 144. The Form 10 information or disclosure is equivalent to the information that a company would be required to file if it were registering a class of securities on Form 10 under the Exchange Act. Under amended Rule 144, restricted or unrestricted securities that were initially issued by a reporting or non-reporting shell company, or a company that was at any time previously a reporting or non-reporting shell company, can only be resold in reliance on Rule 144 if the following conditions are met:
| · | The issuer of the securities that was formerly a shell company has ceased to be a shell company; |
| · | The issuer of the securities has filed all reports and material required to be filed under Section 13 or 15(d) of the Exchange Act, as applicable, during the preceding twelve months (or shorter period that the issuer was required to file such reports and materials), other than Form 8-K reports; and |
| · | At least one year has elapsed from the time the issuer filed the current Form 10 type information with the SEC reflecting its status as an entity that is not a shell company. |
We have never been classified as a “shell company” under rules promulgated under the Securities Act or the Exchange Act. However, in the event we were to be so designated, we may have to retroactively adjust our reporting or accounting for affected periods.
Item 1B. Unresolved Staff Comments
Smaller reporting companies are not required to provide disclosure pursuant to this Item.
Item 1C. Cybersecurity
Lendway’s cyber environment at December 31, 2023 consisted primarily of outsourced information technology (“IT”) operations. The outsourced provider has a cybersecurity framework which includes multiple products implemented to ensure the security of Lendway’s environment. Annual internal and external vulnerability scans are also completed to ensure we mitigate any risks proactively. The Company’s internal operations are PC based and the PCs have up to date security software. Regular phishing exercises are conducted, and employee awareness training is conducted annually by our outsourced provider.
Our full Board of Directors and our Audit Committee provide oversight of our risk management program, which includes cybersecurity. The Audit Committee, as part of its charter to review the Company’s practices with respect to risk assessment and risk management, receives updates on internal control, including those relating to IT general controls and cybersecurity.
With the acquisition of Bloomia on February 22, 2024, the Company will include the IT environment of Bloomia in its cybersecurity processes and oversight at the corporate and board level. Bloomia’s cybersecurity is managed by a third party vendor.
As of the date of this report, we did not identify any cybersecurity threats that have materially affected or are reasonably likely to materially affect our business strategy, results of operations, or financial condition. However, despite our efforts, we cannot eliminate all risks from cybersecurity threats, or provide assurances that we have not experienced an undetected cybersecurity incident.
Item 2. Properties
We believe that our facilities are adequate and suitable for the purposes they serve, including absorption of reasonable growth. We believe that we carry customary levels of insurance covering the replacement of damaged property.
The Company leases 1,700 square feet for its corporate headquarters in Minneapolis, Minnesota through September 30, 2025. Fresh Tulips USA, LLC leases a 360,000 square foot greenhouse facility in King George, Virginia through 2028. In the Netherlands, Bloomia leases a 107,000 square foot office and warehouse space through 2027. In South Africa, Bloomia operates a 21,000 square foot greenhouse located in Rawsonville (near Cape Town) through 2028.
Item 3. Legal Proceedings
The Company is party to legal actions, proceedings, and claims in the ordinary course of business. The outcome of these matters is not expected to have a material effect on the Company’s financial position or results of operations.
Item 4. Mine Safety Disclosures
Not applicable.
PART II.
Item 5. Market for Registrant’s Common Equity, Related Stockholder Matters and Issuer Purchases of Equity Securities
Market Information and Holders
The Company’s common stock is listed on the Nasdaq Capital Market under the symbol LDWY.
As of March 27, 2024, our common stock was held by approximately 115 holders of record.
Dividends
The Company has not historically paid dividends, other than two one-time special dividends declared in 2011 and 2016. The Board of Directors periodically evaluates our ability to pay dividends in light of our financial condition and business plans.
Share Repurchases
On August 28, 2023, we announced that our Board of Directors had approved a stock repurchase authorization providing for the repurchase of up to 400,000 shares of the Company’s common stock. We may purchase shares of our common stock from time to time in open market transactions at prevailing market prices, in privately negotiated transaction, or by other means in accordance with federal securities laws. Open market repurchases may be effected pursuant to Rule 10b5-1 trading plans. The repurchase authorization does not obligate the Company to acquire any particular amount of its common stock or to acquire shares on any particular timetable and may be suspended or discontinued at any time at the Company’s discretion.
Repurchase activity for the twelve months ended December 31, 2023, was as follows:
Period | | Total number of shares purchased | | | Average price paid per share | | | Total number of shares purchased as part of publicly announced plans or programs | | | Approximate dollar value of shares purchased under the plans or programs | | | Maximum Number of Shares that May Yet Be Purchased under the Plans or Programs | |
October 1 - 31, 2023 | | | 5,546 | | | $ | 5.09 | | | | 5,546 | | | $ | 27,864 | | | | 319,109 | |
November 1 - 30, 2023 | | | 3,137 | | | | 4.99 | | | | 3,137 | | | | 16,267 | | | | 315,972 | |
December 1 - 31, 2023 | | | - | | | | - | | | | - | | | | - | | | | 315,972 | |
| | | 8,683 | | | | | | | | 8,683 | | | $ | 44,131 | | | | | |
Item 6. [Reserved]
Item 7. Management’s Discussion and Analysis of Financial Condition and Results of Operations
The following discussion should be read in conjunction with the financial statements and the related notes included in this Annual Report on Form 10-K. This report contains forward-looking statements that involve risks and uncertainties. Our actual results could differ materially from those in such forward-looking statements as a result of many factors, including those discussed in “Cautionary Statement Regarding Forward-Looking Statements” and elsewhere in this report.
Overview
The Company has evolved into a specialty agricultural and finance company focused on making and managing its agricultural investments in the United States and internationally. During the past twelve months, the Company took three major steps in this evolution.
In April 2023, the Company launched its lending business, through the hiring of a Senior Vice President of Lending with over 20 years of experience in credit and lending. The Company is seeking to build a scalable non-bank lending business to purchase existing loans or originate and fund new loans, all of which will be secured by collateral.
On August 3, 2023, the Company completed the sale of its In-Store Marketing Business. The operations of the In-Store Marketing Business are presented as discontinued operations. All prior periods presented have been restated to present the In-Store Marketing Business as discontinued operations. Related to change in strategy of the Company, on August 4, 2023, we changed our name from “Insignia Systems, Inc.” and reincorporated from Minnesota to Delaware. As part of the name change, our common stock now trades under the symbol “LDWY” on The Nasdaq Stock Market LLC.
Bloomia Business
On February 22, 2024, the Company acquired majority ownership in Bloomia B.V. and its subsidiaries (“Bloomia”). Bloomia produces and sells fresh cut tulips.
Bloomia purchases tulip bulbs, hydroponically grows tulips from the bulbs, and sells the stems to retail stores. Bloomia is a leading producer of fresh cut tulips in the United States, nurturing over 75 million stems annually. Net sales (unaudited) of Bloomia for the twelve months ended December 31, 2023 and 2022 were approximately $45 million and $43 million, respectively. Bloomia was founded in the Netherlands and is now strategically positioned in the United States, Netherlands, South Africa and Chile. Bloomia has relationships with prominent U.S. mass market retailers.
The Company acquired Bloomia for $47.5 million. The acquisition resulted in significantly leveraging the Company’s balance sheet. The acquisition price was paid with $9.2 million of the Company’s cash, $22.8 million of proceeds from a new credit facility, and notes payable of $15.5 million to the sellers. The new credit facility contains financial covenants that the Company is required to meet. See description of the credit facility below.
Non-Bank Lending Business
While the Company’s primary near-term focus will be on the Bloomia business, the Company plans to continue building a scalable non-bank lending business (our “Lending Business”) to purchase existing loans or originate and fund new loans, all of which will be secured by collateral (individually or collectively, the “Secured Loans”). In April 2023, we launched our Lending Business, through the hiring of Randy Uglem as Senior Vice President of Lending, now CEO, with over 20 years of experience in credit and lending.
Initially, we intend to focus on loans secured by real estate, primarily for agricultural purposes. We expect to expand our product offerings over time as we identify needs and opportunities in the marketplace for loans generally. Our plan, therefore, is to build a portfolio of well-secured loans, with a portion of the credit risk being participated to third parties in most cases, to maintain a low net loss experience and to charge fully compensatory rates and fees. We are building our strategy and long-term growth initiatives through development of customized niche products to support identified customer needs and opportunities in the marketplace, and effective funding structures to maximize returns.
The Company met with a number of prospects for loan originations and/or purchases since the start of the lending business. Deals were negotiated, but ultimately did not close. With the Company’s decision to allocate capital to the Bloomia acquisition, capital available for the lending business will be significantly constrained in the near term. Accordingly, we anticipate minimal revenue and operating losses from the lending business during the remainder of 2024.
Sale of In-Store Marketing Business
On August 3, 2023, we completed the sale of our former In-Store Marketing Business for a sale price of $3.5 million to TIMIBO LLC, an affiliate of Park Printing, Inc. (the “Buyer”), under an Asset Purchase Agreement dated May 24, 2023 (the “Purchase Agreement”). The Company retained accounts receivable, as well as all cash, cash equivalents and marketable securities. The cash consideration for the sale was subject to a post-closing adjustment that depended on the net balance of (i) cash received by the Company for programs that remained unexecuted as of August 3, 2023, minus (ii) the payments made by the Company to vendors for unexecuted programs. The final purchase adjustment for the net balance was to reduce the cash consideration by $1.5 million, with the Company retaining an equal amount of cash that had been received for unexecuted programs. Under the Purchase Agreement, $200,000 was escrowed for a twelve-month period for any future claims, as defined in the Purchase Agreement by the Buyer against the Company.
We also incurred transaction-related severance and other separation benefits in connection with the termination of certain of our officers and employees of approximately $1,416,000, $490,000 of which was attributed to the sale of the In-Store Marketing Business, as well as retention award payouts totaling $343,000 and employee bonuses totaling $164,000, each of which were recorded as expense. The sum of transaction-related severance, retention awards and bonuses were $1,923,000, of which $974,000 was recorded in continuing operations and $949,000 was recorded in discontinued operations in 2023.
Results of Operations
The following table sets forth, for the periods indicated, certain items from our continuing operations in our consolidated statements of operations and the percentage change year-over-year. The Company had no revenue from continuing operations subsequent to the sale of the In-Store Marketing Business.
| | Year Ended December 31, | | | Increase (decrease) from 2022 to 2023 | |
| | 2023 | | | 2022 | | | Amount | | | Percent | |
Operating expenses: | | | | | | | | | | | | |
Sales and marketing | | $ | 196,000 | | | $ | - | | | $ | 196,000 | | | | 100.0 | % |
General and administrative | | | 3,323,000 | | | | 2,442,000 | | | | 881,000 | | | | 36.1 | % |
Total operating expenses | | | 3,519,000 | | | | 2,442,000 | | | | 1,077,000 | | | | 44.1 | % |
Operating loss | | | (3,519,000 | ) | | | (2,442,000 | ) | | | (1,077,000 | ) | | | 44.1 | % |
Interest income | | | 518,000 | | | | 154,000 | | | | 364,000 | | | | 236.4 | % |
Loss from continuing operations before income taxes | | | (3,001,000 | ) | | | (2,288,000 | ) | | | (713,000 | ) | | | 31.2 | % |
Income tax expense | | | 20,000 | | | | 6,000 | | | | 14,000 | | | | 233.3 | % |
Net loss from continuing operations | | | (3,021,000 | ) | | | (2,294,000 | ) | | | (727,000 | ) | | | 31.7 | % |
Income from discontinued operations, net of tax | | | 2,474,000 | | | | 12,340,000 | | | | (9,866,000 | ) | | | -80.0 | % |
Gain from sale of discontinued operations, net of tax | | | 2,961,000 | | | | - | | | | 2,961,000 | | | | 100.0 | % |
Net income | | $ | 2,414,000 | | | $ | 10,046,000 | | | $ | (7,632,000 | ) | | | -76.0 | % |
Year Ended December 31, 2023 Compared to Year Ended December 31, 2022
Operating Expenses
Sales and Marketing. Sales and marketing expenses for the year ended December 31, 2023 were $196,000, consisting of a portion of our CEO’s compensation, as well as travel and entertainment, website and public relations costs. There was no comparable expense for the year ended December 31, 2022.
General and Administrative. General and administrative expenses for the year ended December 31, 2023 increased 36.1% to $3,323,000, compared to $2,442,000 for the year ended December 31, 2022. The increase was primarily due to transaction-related severance and other separation benefits amounting to $926,000 in connection with the termination of Kristine Glancy, our previous CEO, in addition to the comparison of reduced expense in 2022 from the Director Deferred Compensation Plan due to a reduction in our share price during the year ended December 31, 2022.
Interest Income. Interest income for the year ended December 31, 2023 was $518,000 compared to interest income of $154,000 for the year ended December 31, 2022. Interest income in 2023 increased over 2022 primarily due to higher invested balances in short-term treasury bills and interest-bearing savings, and the higher interest rates available on the investments. The higher invested balances were primarily due to the net proceeds from litigation of $12 million received in July 2022, proceeds related to the sale of the In-Store Marketing Business, and collection of accounts receivable.
Income Taxes. For the year ended December 31, 2023, the Company recorded income tax expense on continuing operations of $20,000, compared to income tax expense on continuing operations of $6,000 for the year ended December 31, 2022. The effective tax rate on continuing operations was (0.7)% and (0.3)% for the years ended December 31, 2023 and 2022, respectively. The primary differences between the Company’s 2023 and 2022 effective tax rates and the statutory federal rates include state taxes and an increase in the Company’s valuation allowance against its deferred assets. The effective tax rate fluctuates between periods based on the level of permanent differences and other discrete items relative to the level of pre-tax income or loss for the period.
Net Loss from Continuing Operations. For the reasons stated above, net loss from continuing operations for the year ended December 31, 2023 was $3,021,000, compared to loss of $2,294,000 for the year ended December 31, 2022.
Income from Discontinued Operations, Net of Tax and Gain from Sale of Discontinued Operations, Net of Tax. Income from discontinued operations, net of tax, was $2,474,000 for the year ended December 31, 2023 compared to $12,340,000 for the year ended December 31, 2022. In 2022, the Company recorded a pre-tax gain of $12 million as a gain on litigation settlement. For the year ended December 31, 2023, the Company recorded a gain from the sale of discontinued operations before tax of $3,044,000 from the sale of its In-Store Marketing Business. Information on the sale of the In-Store Marketing Business and statement of operations details of the discontinued operations are included in Note 2 to the Consolidated Financial Statements in Item 8 of this Annual Report on Form 10-K.
Liquidity and Capital Resources
We have historically financed our operations with proceeds from stock sales and sales of our services and products, subject to occasional supplemental proceeds from the settlement of litigation. The sale of the In-Store Marketing Business on August 3, 2023 generated approximately $1.6 million in cash, directly from the buyer. On December 31, 2023, working capital (current assets less current liabilities) was $15,525,000, compared to $13,379,000 at December 31, 2022. During the year ended December 31, 2023, cash, cash equivalents and restricted cash increased $1,553,000 from $14,524,000 at December 31, 2022, to $16,077,000 at December 31, 2023.
Operating Activities. Net cash used in continuing operating activities during the year ended December 31, 2023 was $2,905,000. Net income of $2,414,000, less income from discontinued operations of $2,474,000, less gain from the sale of discontinued operations of $2,961,000 resulted in net cash used in continuing operations before adjustments and changes in operating assets and liabilities of $65,000. Non-cash adjustments for depreciation and stock-based compensation during the year ended December 31, 2023 was $51,000. The largest component of the change in operating assets and liabilities was accrued liabilities, which increased $376,000 from December 31, 2022. The increase was primarily due to $330,000 of severance related payments that remained to be paid to the Company’s prior CEO, Ms. Glancy.
Investing Activities. Net cash provided by investing activities from continuing operations during the year ended December 31, 2023 was $1,532,000, which was due to the proceeds from the sale of our In-Store Marketing Business.
Financing Activities. Net cash used in financing activities during the year ended December 31, 2023 was $473,000, which related to cash used for the repurchase of common stock, partially offset by proceeds from the issuance of shares per the Director Deferred Compensation Plan for two former non-employee directors.
On February 22, 2024, the Company acquired majority ownership in Bloomia for $47.5 million. The acquisition price was paid with $9.2 million of the Company’s cash, $22.8 million of proceeds from a new credit facility, and notes payable of $15.5 million to the sellers. The Company expects that the new credit facility will provide sufficient credit availability to support its ongoing operations, fund its new debt service requirements, capital expenditures and working capital for at least the next 12 months. The credit facility described below contains ongoing financial covenants that the Company is required to meet.
As the Company grows its businesses, we may be required to obtain additional capital through equity offerings or additional debt financings. To the extent that we raise additional capital through the sale of equity or convertible debt securities, the ownership interest of our stockholders will be diluted, and the terms of those securities may include liquidation or other preferences that adversely affect the rights of our stockholders. Debt financing and preferred equity financing, if available, may involve agreements that include additional covenants limiting or restricting our ability to take specific actions, such as incurring additional debt, making capital expenditures or declaring dividends. Additional capital may not be available when needed, on reasonable terms, or at all, and our ability to raise additional capital may be adversely impacted by potential worsening global economic conditions and the recent disruptions to and volatility in the credit and financial markets in the U.S. and worldwide. If we are unable to raise additional funds when needed we may not be able to grow our businesses, or complete transactions related to the strategy.
Credit Agreement
To finance the Bloomia acquisition, the Company entered into the Credit Agreement, together with Tulp 24.1 as the borrower. Under the terms of the Credit Agreement, Tulp 24.1 had an $18.0 million term loan funded. The Credit Agreement also contains a $6.0 million revolving credit facility, which may be used by Tulp 24.1 for general business purposes and working capital.
Borrowings under the Credit Agreement bear interest at a rate per annum equal to Term SOFR for an interest period of one month plus 3.0%. In addition to paying interest on the outstanding principal under the Credit Agreement, Tulp 24.1 is required to pay a commitment fee of 0.50% on the unutilized commitments under the revolving credit facility.
The term loans will be repaid in quarterly installments of $450,000, commencing on June 30, 2024. The remaining outstanding balance will be repaid in full after five years. The scheduled maturity of the revolving facility is February 20, 2029.
The obligations under the Credit Agreement are secured by substantially all of the personal property assets of Tulp 24.1 and its subsidiaries. The Company provided an unsecured guaranty of the obligations of Tulp 24.1 under the Credit Agreement.
Commencing with the fiscal quarter ending on March 31, 2024, the Credit Agreement will require Tulp 24.1 and its subsidiaries to maintain (a) a minimum fixed charge coverage ratio of not less than 1.25 to 1.00 and (b) a maximum senior cash flow leverage ratio of 3.0 to 1.0 until September 30, 2024, and stepping down to 2.00 to 1.00 on December 31, 2027, until the maturity date of the Credit Agreement. The Credit Agreement also contains other customary affirmative and negative covenants, including covenants that restrict the ability of Tulp 24.1 and its subsidiaries to incur additional indebtedness, dispose of significant assets, make distributions or pay dividends to the Company, make certain investments, including any acquisitions other than permitted acquisitions, make certain payments, enter into sale and leaseback transactions or grant liens on its assets, subject to certain limitations.
The Credit Agreement contains customary events of default, the occurrence of which would permit the lenders to terminate their commitments and accelerate loans under the Credit Agreement, including failure to make payments under the credit facility, failure to comply with covenants in the Credit Agreement and other loan documents, cross default to other material indebtedness of Tulp 24.1 or any of its subsidiaries, failure of Tulp 24.1 or any of its subsidiaries to pay or discharge material judgments, bankruptcy of Tulp 24.1 or any of its subsidiaries, and change of control of the Company.
Promissory Notes
As part of the financing of the Bloomia acquisition, Tulp 24.1 entered into notes payable with the sellers. Notes payable for $12.8 million have a term of five years, subject to requiring principal payments based on “excess cash flow” as defined. Interest is at 8% per annum in the first year and increases annually by 2 percentage points. Notes payable for $2.7 million have a term of nine calendar weeks after the closing date. Interest is at 8% per annum.
Critical Accounting Estimates
Our discussion of our financial condition and results of operations is based upon our financial statements, which have been prepared in accordance with accounting principles generally accepted in the United States of America. During the preparation of these financial statements, we are required to make estimates and assumptions that affect the reported amounts of assets, liabilities, net sales, costs and expenses and related disclosures. Critical accounting estimates are those estimates made in accordance with GAAP which involve a significant level of estimation uncertainty and have had or are reasonably likely to have a material impact on our financial condition and results of operations. On an ongoing basis, we evaluate our estimates and assumptions, including those related to income taxes. We base our estimates on historical experience and on various other assumptions that we believe are reasonable under the circumstances. The results of our analysis form the basis for making assumptions about the carrying values of assets and liabilities that are not readily apparent from other sources. Actual results may differ from these estimates under different assumptions or conditions, and the impact of such differences may be material to our financial statements.
We believe the following is our critical accounting estimate used in preparation of our consolidated financial statements:
Income Taxes. Deferred income taxes are determined based on the estimated future tax effects of differences between the financial statement and tax basis of assets and liabilities given the provisions of enacted tax laws. Deferred income tax provisions and benefits are based on changes to the assets or liabilities from year to year. In providing for deferred taxes, the Company considers tax regulations of the jurisdictions in which it operates, estimates of future taxable income, and available tax planning strategies. If tax regulations, operating results, or the ability to implement tax-planning strategies vary, adjustments to the carrying value of deferred tax assets and liabilities may be required. Valuation allowances are recorded related to deferred tax assets based on the “more likely than not” criteria.
The Company recognizes the financial statement benefit of a tax position only after determining that the relevant tax authority would more likely than not sustain the position following an audit. For tax positions meeting the more-likely-than-not threshold, the amount recognized in the financial statements is the largest benefit that has a greater than 50 percent likelihood of being realized upon ultimate settlement with the relevant tax authority.
Cautionary Statement Regarding Forward-Looking Statements
Certain statements made in this Annual Report on Form 10-K, in the Company’s other SEC filings, in press releases and in oral statements to stockholders and securities analysts that are not statements of historical or current facts are “forward-looking statements.” Such forward-looking statements involve known and unknown risks, uncertainties and other factors that may cause the actual results or performance of the Company to be materially different from the results or performance expressed or implied by such forward-looking statements. The words “anticipate,” “believe,” “could,” “estimate,” “expect,” “future,” “intend,” “likely,” “may,” “plan,” “project,” “will” and similar expressions identify forward-looking statements. Forward-looking statements include statements expressing the intent, belief or current expectations of the Company and members of our management team regarding, for instance: (i) our belief that our cash balance, cash generated by operations and borrowings available under our Credit Agreement, will provide adequate liquidity and capital resources for at least the next twelve months, and (ii) regarding the potential for growth and other opportunities for our businesses. Readers are cautioned not to place undue reliance on these forward-looking statements, which speak only as of the date the statement was made. These statements are subject to the risks and uncertainties that could cause actual results to differ materially and adversely from the forward-looking statements. These forward-looking statements are based on current information, which we have assessed and which by its nature is dynamic and subject to rapid and even abrupt changes.
Factors that could cause our estimates and assumptions as to future performance, and our actual results, to differ materially include the following: (1) our ability to integrate and continue to successfully operate the newly acquired Bloomia business, (2) our ability to compete, (3) concentration of Bloomia’s historical revenue among a small number of customers, (4) changes in interest rates, (5) ability to comply with the requirements of the Credit Agreement, (6) the limited history of our Lending Business, (7) the substantial risk of loss associated with lending generally, (8) market conditions that may restrict or delay appropriate or desirable opportunities, (9) our ability to develop and maintain necessary processes and controls relating to our businesses (10) reliance on one or a small number of employees in each of our businesses, (11) potential adverse classifications of our Company if we are unsuccessful in executing our business plans, (12) other economic, business, market, financial, competitive and/or regulatory factors affecting the Company’s businesses generally; (13) our ability to attract and retain highly qualified managerial, operational and sales personnel; and (14) the availability of additional capital on desirable terms, if at all. Forward-looking statements involve known and unknown risks, uncertainties and other factors, including those set forth in this report and additional risks, if any, identified in this Form 10-K, our Quarterly Reports on Form 10-Q, and our Current Reports on Form 8-K filed with the SEC. Such forward-looking statements should be read in conjunction with the Company’s filings with the SEC. Lendway assumes no responsibility to update the forward-looking statements contained in this report or the reasons why actual results would differ from those anticipated in any such forward-looking statement, other than as required by law.
Item 7A. Quantitative and Qualitative Disclosures About Market Risk
Smaller reporting companies are not required to provide disclosure pursuant to this Item.
Item 8. Financial Statements and Supplementary Data
Index to Financial Statements
The following are included on the pages indicated:
Boulay PLLP
Boulay PLLP
Minneapolis, Minnesota
Lendway, Inc., and Subsidiaries |
(formerly Insignia Systems, Inc.) |
CONSOLIDATED BALANCE SHEETS |
| | | | | | |
As of December 31 | | 2023 | | | 2022 | |
ASSETS | | | | | | |
Current Assets: | | | | | | |
Cash and cash equivalents | | $ | 16,077,000 | | | $ | 14,439,000 | |
Restricted cash | | | — | | | | 85,000 | |
Receivable from escrow account | | | 200,000 | | | | — | |
Income tax receivable | | | 14,000 | | | | 28,000 | |
Prepaid expense | | | 38,000 | | | | 30,000 | |
Other current assets related to discontinued operations | | | 292,000 | | | | 6,171,000 | |
Total Current Assets | | | 16,621,000 | | | | 20,753,000 | |
| | | | | | | | |
Other Assets: | | | | | | | | |
Property and equipment, net | | | 35,000 | | | | — | |
Operating lease right-of-use assets | | | 7,000 | | | | — | |
Other, net | | | 10,000 | | | | — | |
Non-current assets related to discontinued operations | | | — | | | | 215,000 | |
Total Other Assets | | | 52,000 | | | | 215,000 | |
| | | | | | | | |
Total Assets | | $ | 16,673,000 | | | $ | 20,968,000 | |
| | | | | | | | |
LIABILITIES AND STOCKHOLDER'S' EQUITY | | | | | | | | |
Current Liabilities: | | | | | | | | |
Accounts payable | | $ | 32,000 | | | $ | 138,000 | |
Accrued liabilities: | | | | | | | | |
Compensation | | | 635,000 | | | | 264,000 | |
Other | | | 168,000 | | | | 306,000 | |
Current portion of operating lease liabilities | | | 4,000 | | | | — | |
Current liabilities related to discontinued operations | | | 257,000 | | | | 6,666,000 | |
Total Current Liabilities | | | 1,096,000 | | | | 7,374,000 | |
| | | | | | | | |
Long-Term Liabilities: | | | | | | | | |
Accrued income taxes | | | 42,000 | | | | 53,000 | |
Operating lease liabilities | | | 3,000 | | | | — | |
Non-current liabilities related to discontinued operations | | | — | | | | 140,000 | |
Total Long-Term Liabilities | | | 45,000 | | | | 193,000 | |
| | | | | | | | |
Commitments and Contingencies | | | — | | | | — | |
| | | | | | | | |
Stockholders' Equity: | | | | | | | | |
Common stock, par value $.01: | | | | | | | | |
Authorized shares - 5,714,000 | | | | | | | | |
Issued and outstanding shares - 1,743,000 and 1,797,000 at December 31, 2023 and 2022, respectively | | | 17,000 | | | | 18,000 | |
Additional paid-in capital | | | 16,176,000 | | | | 16,458,000 | |
Accumulated deficit | | | (661,000 | ) | | | (3,075,000 | ) |
Total Stockholders' Equity | | | 15,532,000 | | | | 13,401,000 | |
| | | | | | | | |
Total Liabilities and Stockholders' Equity | | $ | 16,673,000 | | | $ | 20,968,000 | |
| | | | | | | | |
See accompanying notes to consolidated financial statements. |
Lendway, Inc., and Subsidiaries |
(formerly Insignia Systems, Inc.) |
CONSOLIDATED STATEMENTS OF OPERATIONS |
| | | | | | |
Years Ended December 31 | | 2023 | | | 2022 | |
Operating Expenses: | | | | | | |
Sales and marketing | | $ | 196,000 | | | $ | - | |
General and administrative | | | 3,323,000 | | | | 2,442,000 | |
Total Operating Expenses | | | 3,519,000 | | | | 2,442,000 | |
Operating Loss | | | (3,519,000 | ) | | | (2,442,000 | ) |
| | | | | | | | |
Interest income | | | 518,000 | | | | 154,000 | |
Loss from continuing operations before income taxes | | | (3,001,000 | ) | | | (2,288,000 | ) |
| | | | | | | | |
Income tax expense | | | 20,000 | | | | 6,000 | |
Net loss from continuing operations | | | (3,021,000 | ) | | | (2,294,000 | ) |
| | | | | | | | |
Income from discontinued operations, net of tax | | | 2,474,000 | | | | 12,340,000 | |
Gain from sale of discontinued operations, net of tax | | | 2,961,000 | | | | - | |
Net Income | | $ | 2,414,000 | | | $ | 10,046,000 | |
| | | | | | | | |
Net income (loss) per basic and diluted share: | | | | | | | | |
Continuing operations | | $ | (1.70 | ) | | $ | (1.28 | ) |
Discontinued operations | | | 3.06 | | | | 6.89 | |
Basic and diluted earnings per share | | $ | 1.36 | | | $ | 5.61 | |
| | | | | | | | |
Shares used in calculation of net income (loss) per share: | | | | | | | | |
Basic and diluted | | | 1,781,000 | | | | 1,791,000 | |
| | | | | | | | |
See accompanying notes to consolidated financial statements. |
Lendway, Inc., and Subsidiaries |
(formerly Insignia Systems, Inc.) |
CONSOLIDATED STATEMENTS OF STOCKHOLDERS' EQUITY |
| | | | | | | | | | | | | | | |
| | Common Stock | | | Additional Paid-In | | | Accumulated | | | | |
| | Shares | | | Amount | | | Capital | | | Deficit | | | Total | |
Balance at January 1, 2022 | | | 1,782,000 | | | $ | 18,000 | | | $ | 16,296,000 | | | $ | (13,121,000 | ) | | $ | 3,193,000 | |
Issuance of common stock, net | | | 6,000 | | | | — | | | | 39,000 | | | | — | | | | 39,000 | |
Issuance of common stock upon vesting of restricted stock units | | | 9,000 | | | | — | | | | — | | | | — | | | | — | |
Value of stock-based compensation | | | — | | | | — | | | | 123,000 | | | | — | | | | 123,000 | |
Net income | | | — | | | | — | | | | — | | | | 10,046,000 | | | | 10,046,000 | |
Balance at December 31, 2022 | | | 1,797,000 | | | $ | 18,000 | | | $ | 16,458,000 | | | $ | (3,075,000 | ) | | $ | 13,401,000 | |
| | | | | | | | | | | | | | | | | | | | |
Repurchase of common stock | | | (84,000 | ) | | | (1,000 | ) | | | (481,000 | ) | | | — | | | | (482,000 | ) |
Issuance of common stock, net | | | 24,000 | | | | — | | | | 155,000 | | | | — | | | | 155,000 | |
Issuance of common stock upon vesting of restricted stock units | | | 6,000 | | | | — | | | | — | | | | — | | | | — | |
Value of stock-based compensation | | | — | | | | — | | | | 44,000 | | | | — | | | | 44,000 | |
Net income | | | — | | | | — | | | | — | | | | 2,414,000 | | | | 2,414,000 | |
Balance at December 31, 2023 | | | 1,743,000 | | | $ | 17,000 | | | $ | 16,176,000 | | | $ | (661,000 | ) | | $ | 15,532,000 | |
| | | | | | | | | | | | | | | | | | | | |
See accompanying notes to consolidated financial statements. | | | | | | | | | | | | | | | | | | | | |
Lendway, Inc., and Subsidiaries |
(formerly Insignia Systems, Inc.) |
CONSOLIDATED STATEMENTS OF CASH FLOWS |
| | | | | | |
Years Ended December 31 | | 2023 | | | 2022 | |
Operating Activities: | | | | | | |
Net income | | $ | 2,414,000 | | | $ | 10,046,000 | |
Income from discontinued operations, net of tax | | | (2,474,000 | ) | | | (12,340,000 | ) |
Gain from sale of discontinued operations, net of tax | | | (2,961,000 | ) | | | - | |
Net loss from continuing operations | | | (3,021,000 | ) | | | (2,294,000 | ) |
Adjustments to reconcile net loss from continuing operations to net cash used in operating activities of continuing operations: | | | | | | | | |
Depreciation and amortization | | | 7,000 | | | | - | |
Stock-based compensation expense | | | 44,000 | | | | 123,000 | |
Changes in operating assets and liabilities: | | | | | | | | |
Receivable from escrow account | | | (200,000 | ) | | | - | |
Income tax receivable | | | 14,000 | | | | (24,000 | ) |
Prepaid expenses and other | | | (8,000 | ) | | | 151,000 | |
Accounts payable | | | (106,000 | ) | | | 52,000 | |
Accrued liabilities | | | 376,000 | | | | (187,000 | ) |
Accrued income taxes | | | (11,000 | ) | | | (658,000 | ) |
Net cash used in operating activities of continuing operations | | | (2,905,000 | ) | | | (2,837,000 | ) |
Net cash provided by operating activities of discontinued operations | | | 3,423,000 | | | | 13,500,000 | |
Net cash provided by operating activities | | | 518,000 | | | | 10,663,000 | |
| | | | | | | | |
Investing Activities: | | | | | | | | |
Proceeds from sale of business | | | 1,581,000 | | | | - | |
Purchase of other long-term assets | | | (10,000 | ) | | | - | |
Purchases of property and equipment | | | (39,000 | ) | | | - | |
Net cash provided by investing activities of continuing operations | | | 1,532,000 | | | | - | |
Net cash used in investing activities of discontinued operations | | | (24,000 | ) | | | (29,000 | ) |
Net cash provided by (used in) investing activities | | | 1,508,000 | | | | (29,000 | ) |
| | | | | | | | |
Financing Activities: | | | | | | | | |
Proceeds from issuance of common stock, net | | | 9,000 | | | | 39,000 | |
Repurchase of common stock, net | | | (482,000 | ) | | | - | |
Net cash (used in) provided by financing activities | | | (473,000 | ) | | | 39,000 | |
| | | | | | | | |
Increase in cash, cash equivalents and restricted cash | | | 1,553,000 | | | | 10,673,000 | |
| | | | | | | | |
Cash, cash equivalents and restricted cash at beginning of period | | | 14,524,000 | | | | 3,851,000 | |
Cash, cash equivalents and restricted cash at end of period | | $ | 16,077,000 | | | $ | 14,524,000 | |
| | | | | | | | |
Supplemental disclosures for cash flow information: | | | | | | | | |
Cash paid during the period for income taxes | | $ | 88,000 | | | $ | 464,000 | |
| | | | | | | | |
Non-cash investing and financing activity: | | | | | | | | |
Operating lease right-of-use asset obtained in exchange for lease obligations | | $ | 8,000 | | | $ | 38,000 | |
Purchase of property and equipment included in accrued liabilities | | $ | 3,000 | | | $ | 1,000 | |
Common stock issued for settlement of accrued liabilities | | $ | 146,000 | | | $ | - | |
| | | | | | | | |
See accompanying notes to consolidated financial statements. | | | | | | | | |
Lendway, Inc. and Subsidiaries
Notes to Consolidated Financial Statements
1. Summary of Significant Accounting Policies.
Description of Business. The consolidated financial statements include the accounts of Lendway, Inc. (the “Company”), its wholly owned subsidiary, Farmland Credit, Inc., a Minnesota corporation (“FCI”), and FCI’s wholly owned subsidiaries, Farmland Credit FR, LLC and Farmland Credit AV, LLC. All significant inter-company balances and transactions have been eliminated.
The Company has evolved into a specialty agricultural and finance company with operational focus on its agricultural investments. In April 2023, the Company launched its lending business, through the hiring of a Senior Vice President of Lending with over 20 years of experience in credit and lending. The Company is seeking to build a scalable non-bank lending business (the “Lending Business”) to purchase existing loans or originate and fund new loans, all of which will be secured by collateral.
As described further in Note 2, on August 3, 2023, the Company completed the sale of certain assets and certain liabilities relating to the Company’s legacy business of providing in-store advertising solutions to brands, retailers, shopper marketing agencies and brokerages (the “In-Store Marketing Business”). The operations of the In-Store Marketing Business are presented as discontinued operations. All prior periods presented have been restated to present the In-Store Marketing Business as discontinued operations.
As described further in Note 9, on February 22, 2024, the Company acquired majority ownership in Bloomia B.V. and its affiliated entities (“Bloomia”) for a price of $47.5 million financed with Company cash, a new credit facility and a note payable to the sellers. Bloomia produces fresh cut tulip stems. Bloomia purchases tulip bulbs, hydroponically grows tulips from the bulbs, and sells the stems to retail stores.
Cash and Cash Equivalents. The Company considers all highly liquid investments with an original maturity date of three months or less to be cash equivalents. Cash equivalents are stated at cost, which approximates fair value. Cash and cash equivalents of $15,859,000 and $14,227,000 were in interest-bearing investments such as an insured sweep account, U.S. Treasury bills and a money market account at December 31, 2023 and 2022, respectively. The balances in cash accounts, at times, may exceed federally insured limits. The Company has not experienced any losses in such accounts and believes it is not exposed to any significant credit risk on cash and cash equivalents. Amounts held in checking accounts and in insured cash sweep accounts during the years ended December 31, 2023 and 2022 were fully insured under the Federal Deposit Insurance Corporation.
December 31 | | 2023 | | | 2021 | |
Cash and cash equivalents | | $ | 16,077,000 | | | $ | 14,439,000 | |
Restricted cash | | | - | | | | 85,000 | |
Total cash, cash equivalents and restricted cash | | $ | 16,077,000 | | | $ | 14,524,000 | |
Restricted Cash. The Company’s restricted cash consists of cash the Company was contractually obligated to maintain in accordance with the terms of the lease for its headquarters space in Minneapolis.
Fair Value of Financial Instruments. Fair value is defined as the exit price, or the amount that would be received to sell an asset, or paid to transfer a liability, in an orderly transaction between market participants as of the measurement date. Accounting Standards Codification (“ASC”) 820-10 also establishes a hierarchy for inputs used in measuring fair value that maximizes the use of observable inputs and minimizes the use of unobservable inputs by requiring that the most observable inputs be used when available. Observable inputs are inputs market participants would use in valuing the asset or liability, developed based on market data obtained from sources independent of the Company. Unobservable inputs are inputs that reflect management’s assumptions about the factors market participants would use in valuing the asset or liability developed based upon the best information available in the circumstances.
The hierarchy is divided into three levels. Level 1 inputs are quoted prices (unadjusted) in active markets for identical assets or liabilities. Level 2 inputs include quoted prices for similar assets or liabilities in active markets, quoted prices for identical or similar assets or liabilities in markets that are not active and inputs (other than quoted prices) that are observable for the asset or liability, either directly or indirectly. Level 3 inputs are unobservable inputs for the asset or liability. Categorization within the valuation hierarchy is based upon the lowest level of input that is significant to the fair value measurement. As of December 31, 2023 and 2022, the Company had no financial assets or liabilities measured at a fair value on a recurring basis.
The Company records certain financial assets and liabilities at their carrying amounts that approximate fair value, based on their short-term nature. These financial assets and liabilities included cash and cash equivalents, other current assets related to discontinued operations, and accounts payable.
Property and Equipment. Property and equipment are recorded at cost. Significant additions or improvements extending asset lives are capitalized, while repairs and maintenance are charged to expense when incurred. Expenditures are capitalized for development activities, while expenditures related to planning, training, and maintenance are expensed. Depreciation is provided in amounts sufficient to relate the cost of assets to operations over their estimated useful lives. The straight-line method of depreciation is used for financial reporting purposes and accelerated methods are used for tax purposes. Estimated useful lives of the assets are as follows:
Office furniture and fixtures | 1 – 3 years |
Computer equipment and software | 3 – 5 years |
Leasehold improvements | 12 – 18 months |
Leases. The Company determines if an arrangement contains a lease at inception. Operating leases are included in operating lease right-of-use (ROU) assets, the current portion of operating lease liabilities, and the operating lease liabilities on the balance sheets. The ROU assets represent our right to control the use of an underlying asset for the lease term, and lease liabilities represent our obligation to make lease payments arising from the lease. Operating lease ROU assets and lease liabilities are recognized at commencement date and date of any lease modification based on the present value of lease payments over the lease term. The operating lease ROU assets also include any prepaid lease payments made and exclude lease incentives. Lease expense is recognized on a straight-line basis over the lease term. The Company has elected the practical expedient to exclude short-term leases (one year or less) from our ROU assets and lease liabilities.
Impairment of Long-Lived Assets. The Company records impairment losses on long-lived assets used in operations when indicators of impairment are present and the undiscounted cash flows estimated to be generated by those assets are less than the assets’ carrying amount. Impaired assets are then recorded at their estimated fair value.
Restructuring. In connection with the change in the Company’s strategy to the specialty agricultural and finance company, the Company’s prior CEO, Kristine A. Glancy, departed on August 31, 2023. Included in general and administrative expense of continuing operations is expense of $926,000 relating to change of control and other severance related payments and benefits to Ms. Glancy. As of December 31, 2023, $305,000 remained to be paid to Ms. Glancy and was included in accrued compensation. Subsequent to December 31, 2023 this amount was paid to Ms. Glancy.
Income Taxes. Income taxes are accounted for under the liability method. Deferred income taxes are provided for temporary differences between the financial reporting and tax basis of assets and liabilities. Deferred taxes are reduced by a valuation allowance when, in the opinion of management, it is more likely than not that some portion or the entire deferred tax asset will not be realized. Deferred tax assets and liabilities are adjusted for the effects of changes in tax laws and rates on the date of the enactment. It is the Company’s policy to provide for uncertain tax positions and the related interest and penalties based upon management’s assessment of whether a tax benefit is more likely than not to be sustained upon examination by tax authorities. The Company recognizes interest and penalties accrued on any unrecognized tax benefits as a component of income tax expense (benefit).
Stock-Based Compensation. The Company measures and recognizes compensation expense for all stock-based awards at fair value. Restricted stock units and awards are valued at the closing market price of the Company’s stock on the date of the grant. The Company uses the Black-Scholes option pricing model to determine the weighted average fair value of options and employee stock purchase plan rights. The determination of fair value of share-based payment awards on the date of grant using an option-pricing model is affected by our stock price as well as by assumptions regarding several complex and subjective variables. These variables include, but are not limited to, the expected stock price volatility over the term of the awards, and actual and projected employee stock option exercise behaviors.
The expected lives of the options and employee stock purchase plan rights are based on evaluations of historical and expected future employee exercise behavior. The risk-free interest rate is based on the U.S. Treasury rates at the date of grant with maturity dates approximately equal to the expected term at grant date. Volatility is based on historical and expected future volatility of the Company’s stock. The Company has not historically issued any dividends beyond one-time dividends declared in 2011 and 2016 and does not expect to in the future.
Net Income (Loss) Per Share. Basic net income (loss) per share is computed by dividing net income (loss) by the weighted average shares outstanding and excludes any dilutive effects of stock options and restricted stock units and awards. Diluted net income (loss) per share gives effect to all diluted potential common shares outstanding during the year.
In determining diluted net income (loss) per share, whether net income from continuing operations is positive or negative controls whether dilutive shares are included in the determination. For all periods presented, net income from continuing operations is negative, a net loss. Accordingly, since including dilutive shares would dilute the loss from continuing operations, no dilutive shares are included in any of the per share calculations.
Due to the net loss from continuing operations incurred during the year ended December 31, 2023 and 2022, all outstanding stock awards were considered anti-dilutive for those periods. Options to purchase approximately 1,000 shares of common stock with a weighted average exercise price of $15.54 were outstanding at December 31, 2023. Options to purchase approximately 53,000 shares of common stock with a weighted average exercise price of $11.69 were outstanding at December 31, 2022.
Weighted average common shares outstanding for the years ended December 31, 2023 and 2022 were as follows:
Year ended December 31 | | 2023 | | | 2022 | |
Denominator for basic net income (loss) per share - weighted average shares | | | 1,781,000 | | | | 1,791,000 | |
Effect of dilutive securities: | | | | | | | | |
Stock options, restricted stock units and restricted stock awards | | | - | | | | - | |
Denominator for diluted net income (loss) per share - weighted average shares | | | 1,781,000 | | | | 1,791,000 | |
Use of Estimates. The preparation of financial statements in conformity with accounting principles generally accepted in the United States of America requires management to make estimates and assumptions that affect the amounts reported in the financial statements and accompanying notes. Actual results could differ from these estimates.
2. Sale of In-Store Marketing Business and Presentation as Discontinued Operations.
On August 3, 2023, the Company completed the sale of certain assets and certain liabilities relating to the Company’s In-Store Marketing Business for a price of $3.5 million to TIMIBO LLC, an affiliate of Park Printing, Inc. (the “Buyer”), under an Asset Purchase Agreement (the “Purchase Agreement”). The Company retained accounts receivable, as well as cash, cash equivalents and marketable securities. The cash consideration for the sale was subject to a post-closing adjustment depending on the net balance of (i) cash received by the Company for programs that remained unexecuted as of August 3, 2023, minus (ii) the payments made by the Company to vendors for unexecuted programs. The final purchase adjustment for the net balance was to reduce the cash consideration by $1.5 million, with the Company retaining an equal amount of cash that had been received for unexecuted programs. Under the Purchase Agreement, $200,000 was escrowed for a twelve-month period for any future claims, as defined in the Purchase Agreement, by the Buyer against the Company.
The gain on sale (before income taxes) of the In-Store Marketing Business was determined as follows:
Gross sale price | | $ | 3,500,000 | |
Adjustments per Purchase Agreement | | | (1,555,000 | ) |
Adjusted Price | | | 1,945,000 | |
| | | | |
Liabilities assumed in excess of assets | | | 1,308,000 | |
Transaction costs not previously expensed | | | (209,000 | ) |
Gain on sale of In-Store Marketing Business | | $ | 3,044,000 | |
The Company incurred transaction-related severance and other separation benefits in connection with the termination of certain officers and employees of the discontinued operations of approximately $490,000, as well as retention award payouts totaling $343,000, of which $48,000 was included in continuing operations, and employee bonuses totaling $164,000, each of which was recorded as expense in the year ended December 31, 2023.
The results of the In-Store Marketing Business have been presented as discontinued operations and the related assets and liabilities have been classified as related to discontinued operations, for all periods presented.
The carrying amounts of major classes of assets and liabilities that were reclassified as related to discontinued operations on the Consolidated Balance Sheets were as follows:
| | December 31, | | | December 31, | |
| | 2023 | | | 2022 | |
Current Assets: | | | | | | |
Accounts receivable | | $ | 292,000 | | | $ | 5,557,000 | |
Inventories | | | - | | | | 29,000 | |
Prepaid production costs | | | - | | | | 535,000 | |
Other prepaid expense | | | - | | | | 50,000 | |
Current assets related to discontinued operations | | $ | 292,000 | | | $ | 6,171,000 | |
| | | | | | | | |
Other Assets: | | | | | | | | |
Property and equipment, net | | $ | - | | | $ | 71,000 | |
Operating lease right-of-use assets | | | - | | | | 144,000 | |
Non-current assets related to discontinued operations | | $ | - | | | $ | 215,000 | |
| | | | | | | | |
Current Liabilities: | | | | | | | | |
Accounts payable | | $ | 7,000 | | | $ | 2,515,000 | |
Sales tax | | | 169,000 | | | | 717,000 | |
Accrued liabilities | | | 81,000 | | | | 1,003,000 | |
Current portion of operating lease liabilities | | | - | | | | 4,000 | |
Deferred revenue | | | - | | | | 2,427,000 | |
Current liabilities related to discontinued operations | | $ | 257,000 | | | $ | 6,666,000 | |
| | | | | | | | |
Long-Term Liabilities: | | | | | | | | |
Operating lease liabilities | | $ | - | | | $ | 140,000 | |
Non-current liabilities related to discontinued operations | | $ | - | | | $ | 140,000 | |
Results of discontinued operations are summarized below:
Years Ended December 31 | | 2023 | | | 2022 | |
Net services revenues | | $ | 21,078,000 | | | $ | 18,800,000 | |
| | | | | | | | |
Cost of services | | | 16,087,000 | | | | 15,499,000 | |
Gross Profit | | | 4,991,000 | | | | 3,301,000 | |
| | | | | | | | |
Operating Expenses: | | | | | | | | |
Selling | | | 1,136,000 | | | | 1,325,000 | |
Marketing | | | 805,000 | | | | 1,050,000 | |
General and administrative | | | 679,000 | | | | 878,000 | |
Total Operating Expenses | | | 2,620,000 | | | | 3,253,000 | |
| | | | | | | | |
Gain from litigation settlement, net | | | - | | | | 12,000,000 | |
| | | | | | | | |
Operating Income | | | 2,371,000 | | | | 12,048,000 | |
| | | | | | | | |
Other income | | | 91,000 | | | | 68,000 | |
Income from discontinued operations before income taxes | | | 2,462,000 | | | | 12,116,000 | |
Income tax benefit | | | (12,000 | ) | | | (224,000 | ) |
Income from discontinued operations, net of tax | | $ | 2,474,000 | | | $ | 12,340,000 | |
| | | | | | | | |
Gain from sale of discontinued operations before income taxes | | $ | 3,044,000 | | | $ | - | |
Income tax expense | | | 83,000 | | | | - | |
Gain from sale of discontinued operations, net of tax | | $ | 2,961,000 | | | $ | - | |
In July 2019, the Company filed suit against News Corporation, News America Marketing FSI L.L.C., and News America Marketing In-Store Services L.L.C. (collectively, “News America”), alleging violations of federal and state antitrust and tort laws by News America. On July 1, 2022, the Company entered into a $20 million settlement agreement with News America. The agreement resulted in net proceeds before income tax of $12,000,000 for the Company, which was recorded as a gain on litigation settlement in the discontinued operations of the In-Store Marketing Business for the year ended December 31, 2022.
The income tax benefit for 2022 included a decrease of approximately $678,000 in unrecognized tax benefits related to state exposure in the third quarter of 2022, which reduced accrued income taxes and increased the current tax benefit.
3. Leases. As of December 31, 2023, the Company leased space from a related party under a non-cancelable operating lease for its corporate headquarters. The lease has monthly payments of $375 through September 30, 2025. The lease does not include a renewal option.
The amounts included in “Other” below relate to an office lease that was terminated on September 30, 2023. The cost components in continuing operations of the Company’s operating leases were as follows:
| | Year ended December 31, 2023 | | | Year ended December 31, 2022 | |
| | Corporate | | | | | | | | | | |
| | Headquarters | | | Other | | | Total | | | Operating Leases - Other | |
Operating lease cost | | $ | 1,000 | | | $ | 4,000 | | | $ | 5,000 | | | $ | 14,000 | |
Short-term lease costs | | | 2,000 | | | | 10,000 | | | | 12,000 | | | | - | |
Total | | $ | 3,000 | | | $ | 14,000 | | | $ | 17,000 | | | $ | 14,000 | |
Maturities of the Company’s lease liabilities for its corporate headquarters and its warehouse operating leases were as follows as of December 31, 2023:
2024 | | $ | 5,000 | |
2025 | | | 3,000 | |
Total lease payments | | $ | 8,000 | |
Less: Interest | | | (1,000 | ) |
Present value of lease liabilities | | $ | 7,000 | |
The Company used its incremental borrowing rate of approximately 6.0% in determining the present value of the lease payments based on the information available at the lease commencement date.
The remaining lease term as of December 31, 2023 for the Company’s corporate headquarters is 1.8 years. The cash outflow for operating leases including discontinued operations for the years ended December 31, 2023 and 2022 were $28,000 and $28,000, respectively.
4. Commitments and Contingencies.
Legal. The Company is subject to various legal matters in the normal course of business. The outcome of these matters is not expected to have a material effect on the Company’s financial position or results of operations.
5. Stockholders’ Equity.
Stock-Based Compensation. The Company’s stock-based compensation plans are administered by the Compensation Committee of the Board of Directors, which, subject to approval by the Board of Directors, selects persons to receive awards and determines the number of shares subject to each award and the terms, conditions, performance measures and other provisions of the award.
Stock-based compensation expense that was recognized in the continuing operations of the Company’s consolidated statements of operations for the years ended December 31, 2023 and 2022 was $39,000 and $91,000, respectively. Stock based compensation for discontinued operations for the years ended December 31, 2023 and 2022 was $5,000 and $32,000, respectively
The Company uses the Black-Scholes option pricing model to estimate fair value of stock-based awards with the following weighted-average assumptions:
| | 2023 | | | 2022 | |
Employee Stock Purchase Plan: | | | | | | |
Expected life (years) | | | 1.0 | | | | 1.0 | |
Expected volatility | | | 95 | % | | | 169 | % |
Dividend yield | | | 0 | % | | | 0 | % |
Risk-free interest rate | | | 4.7 | % | | | 0.4 | % |
The Company uses the graded attribution method to recognize expense for unvested stock-based awards. Forfeitures are recognized as incurred.
Stock Options, Restricted Stock, Restricted Stock Units, and Other Stock-Based Compensation Awards. The Company maintains stock and incentive plans (the “Plans).
Under the terms of the Plans, the Company may grant awards in a variety of instruments including stock options, restricted stock and restricted stock units to employees, consultants and directors generally at an exercise price at or above 100% of fair market value at the close of business on the date of grant. Stock options expire 10 years after the date of grant and generally vest over three years. The Company issues new shares of common stock upon grant of restricted stock, when stock options are exercised, and when restricted stock units are vested and/or settled.
The following table summarizes activity under the Plans:
| | Plan Shares Available for Grant | | | Plan Options Outstanding | | | Weighted Average Exercise Price Per Share | | | Aggregate Intrinsic Value | |
Balance at January 1, 2022 | | | 97,648 | | | | 19,122 | | | $ | 13.23 | | | | |
Restricted stock units and awards granted | | | (6,248 | ) | | | — | | | | | | | | |
Stock options exercised | | | — | | | | (1,300 | ) | | | 8.26 | | | $ | 2,422 | |
Cancelled or forfeited options | | | 1,462 | | | | (3,736 | ) | | | 11.41 | | | | | |
Balance at December 31, 2022 | | | 92,862 | | | | 14,086 | | | | 14.17 | | | | | |
| | | | | | | | | | | | | | | | |
Cancelled or forfeited options | | | 12,623 | | | | (12,623 | ) | | | 14.02 | | | | | |
Balance at December 31, 2023 | | | 105,485 | | | | 1,463 | | | | 15.54 | | | | | |
The following table summarizes information about the stock options outstanding at December 31, 2023:
| | | Options Outstanding | | | Options Exercisable | |
Exercise Prices | | | Number Outstanding | | | Weighted Average Remaining Contractual Life | | Weighted Average Exercise Price Per Share | | | Number Exercisable | | | Weighted Average Exercise Price Per Share | |
| $ | 15.54 | | | | 1,463 | | | | 0.39 | | | years | | $ | 15.54 | | | | 1,463 | | | $ | 15.54 | |
Options outstanding under the Plans expire in May 2024. Options outstanding at December 31, 2023 and 2022 had no intrinsic value.
Options exercisable at December 31, 2022 had a weighted average remaining life of 4.44 years and no intrinsic value.
During the year ended December 31, 2023 and 2022, no equity awards were issued by the Company except for the following awards to non-employee members of the Board of Directors.
In August 2022, non-employee members of the Board of Directors received restricted stock grants totaling 6,248 shares. The shares underlying the awards were assigned a value of $9.60 per share, which was the closing price of the Company’s common stock on the date of grant, for a total grant date value of $60,000. The shares vested July 26, 2023.
Restricted stock and restricted stock unit transactions during the years ended December 31, 2023 and 2022 are summarized as follows:
As of December 31, 2023, there was no unrecognized compensation costs related to outstanding stock options or restricted stock.
| | Number of Shares | | | Weighted average grant date fair value | |
Unvested shares at January 1, 2022 | | | 8,531 | | | $ | 10.01 | |
Granted | | | 6,248 | | | | 9.60 | |
Vested | | | (8,910 | ) | | | 10.25 | |
Unvested shares at December 31, 2022 | | | 5,869 | | | $ | 9.21 | |
| | | | | | | | |
Granted | | | — | | | | | |
Vested | | | (5,869 | ) | | | 7.66 | |
Unvested shares at December 31, 2023 | | | — | | | | — | |
Employee Stock Purchase Plan. The Company has an Employee Stock Purchase Plan (the “ESPP”) that enables employees to contribute up to 10% of their base compensation toward the purchase of the Company’s common stock at 85% of its market value on the first or last day of the year. During the years ended December 31, 2023 and 2022, respectively, participants purchased 338 and 1,153 shares under the ESPP. At December 31, 2023, 22,945 shares were reserved for future employee purchases of common stock under the ESPP. For the years ended December 31, 2023 and 2022, the Company recognized $7,000 and $32,000, respectively, of stock-based compensation expense related to the ESPP that was recognized in the continuing operations.
Dividends. The Company has not historically paid dividends, other than one-time dividends declared in 2011 and 2016. The Company intends to retain earnings from operations for use in advancing our business strategy; however, the Company may consider special dividends in the future.
6. Income Taxes. Income tax expense from continuing operations consists of the following:
Year Ended December 31 | | 2023 | | | 2022 | |
Current taxes - Federal | | $ | - | | | $ | - | |
Current taxes - State | | | 20,000 | | | | 6,000 | |
Income tax expense | | $ | 20,000 | | | $ | 6,000 | |
The actual tax (expense) benefit attributable to income (loss) from continuing operations before taxes differs from the expected tax benefit (expense) computed by applying the U.S. federal corporate income tax rate of 21% as follows:
Year Ended December 31 | | 2023 | | | 2022 | |
Federal statutory rate | | | 21.0 | % | | | 21.0 | % |
Stock-based awards | | | (0.5 | ) | | | (0.7 | ) |
State benefit | | | 3.1 | | | | 2.7 | |
Valuation allowance | | | (24.6 | ) | | | (24.6 | ) |
Other | | | 0.3 | | | | 1.3 | |
| | | | | | | | |
Effective federal income tax rate | | | (0.7 | )% | | | (0.3 | )% |
Components of resulting noncurrent deferred tax assets (liabilities) are as follows:
As of December 31 | | 2023 | | | 2022 | |
Deferred tax assets | | | | | | |
Accrued expenses | | $ | 117,000 | | | $ | 231,000 | |
Inventory reserve | | | - | | | | 23,000 | |
Stock-based awards | | | 9,000 | | | | 24,000 | |
Reserve for bad debts | | | 2,000 | | | | 26,000 | |
Net operating loss and credit carryforwards | | | 529,000 | | | | 824,000 | |
Other | | | 2,000 | | | | 23,000 | |
Depreciation | | | - | | | | 43,000 | |
Valuation allowance | | | (645,000 | ) | | | (1,175,000 | ) |
| | | | | | | | |
Total deferred tax assets | | $ | 14,000 | | | $ | 19,000 | |
| | | | | | | | |
Deferred tax liabilities | | | | | | | | |
Depreciation | | $ | (5,000 | ) | | $ | - | |
Prepaid expenses | | | (9,000 | ) | | | (19,000 | ) |
| | | | | | | | |
Total deferred tax liabilities | | | (14,000 | ) | | | (19,000 | ) |
| | | | | | | | |
Net deferred income tax | | $ | - | | | $ | - | |
As of December 31, 2023, the Company had a Federal pre-tax net operating loss (NOL) to carry forward of approximately $1,607,000 and state pre-tax NOLs of approximately $2,914,000 to carry forward. The Federal NOLs can be carried forward indefinitely. The expiration of state NOLs carried forward varies by taxing jurisdiction. Future utilization of NOLs carried forward may be subject to certain limitations under Section 382 of the Internal Revenue Code.
The Company evaluates all significant available positive and negative evidence, including the existence of losses in prior years and its forecast of future taxable income, in assessing the need for a valuation allowance. The underlying assumptions the Company uses in forecasting future taxable income require significant judgment and take into consideration the Company’s recent performance. The change in the valuation allowance for the years ended December 31, 2023 and 2022 was a decrease of $530,000 and $1,970,000, respectively. The valuation allowance decreases in 2023 and 2022 were primarily related to the utilization of the Company’s net operating losses carried forward against the Company’s taxable income. Such utilization was limited to 80% of the Company’s taxable income for the year.
The Company has recorded a liability of $42,000 and $53,000 for uncertain tax positions taken on tax returns in previous years as of December 31, 2023 and 2022, respectively. This liability is reflected as accrued income taxes on the Company’s balance sheets. The Company files income tax returns in the United States and numerous state and local tax jurisdictions. Tax years 2020 and forward are open for examination and assessment by the Internal Revenue Service. With limited exceptions, tax years prior to 2020 are no longer open in major state and local tax jurisdictions. The Company has recorded a decrease of approximately $16,000 in unrecognized tax benefits related to state exposure in the third quarter of 2023, which reduced accrued income taxes and increased the current income tax benefit. The Company determined it was no longer more likely than not that the Company would realize the tax expense.
A reconciliation of the beginning and ending amount of the liability for uncertain tax positions is as follows:
Balance at January 1, 2022 | | $ | 711,000 | |
Decrease due to state tax expense | | | (678,000 | ) |
Increases due to interest and state tax | | | 20,000 | |
Balance at December 31, 2022 | | $ | 53,000 | |
| | | | |
Decrease due to state tax expense | | $ | (16,000 | ) |
Increases due to interest and state tax | | | 5,000 | |
Balance at December 31, 2023 | | $ | 42,000 | |
7. Employee Benefit Plans. The Company sponsors a Retirement Profit Sharing and Savings Plan under Section 401(k) of the Internal Revenue Code. The plan allows employees to defer up to 50% of their wages, subject to Federal limitations, on a pre-tax basis through contributions to the plan. During the years ended December 31, 2023 and 2022, the Company’s expense in continuing operations for matching contributions was $13,000 and $8,000, respectively.
8. Stock Repurchases. On August 23, 2023, the Company’s Board of Directors authorized the repurchase of up to 400,000 shares of the Company’s common stock. The authorization allows the purchases to be made in the open market or in privately negotiated transactions. The authorization does not obligate the Company to repurchase any particular number of shares; and may be suspended anytime at the Company’s discretion. During the year ended December 31, 2023, the Company repurchased 84,028 shares for $482,000.
9. Subsequent Events
Acquisition of Bloomia
On February 22, 2024, the Company acquired majority ownership in Bloomia B.V. and its subsidiaries for a price of $47.5 million. The acquisition price was paid with $9.2 million of the Company’s cash, $22.8 million of proceeds from a new credit facility, and notes payable of $15.5 million to the sellers. Bloomia purchases tulip bulbs, hydroponically grows tulips from the bulbs, and sells the stems to retail stores. Lendway owns a significant majority and is the managing member of Tulp 24.1, LLC, which holds the Bloomia enitities. Bloomia’s continuing CEO owns the remaining approximately 18.6% of Tulp 24.1, LLC.
The acquisition will be accounted for as a business combination using the acquisition method of accounting. The acquisition method of accounting requires, among other things, that assets acquired and liabilities assumed be recognized at their fair values as of the acquisition date. Due to the limited amount of time since the acquisition date and the complexity of Bloomia’s financial records prepated under Dutch GAAP, the preliminary acquisition valuation for the business combination is incomplete at this time. As a result, the Company is unable to provide the amounts recognized as of the acquisition date for the major classes of assets acquired and liabilities assumed, including the information required for valuation of intangible assets and goodwill.
The unaudited pro forma net sales of the combined entity for the twelve months ended December 31, 2023 are approximately $45 million. The unaudited pro forma net sales of the combined entity are based on historical net sales from continuing operations from Lendway and the net sales for Bloomia. The unaudited pro forma net sales values are not necessarily indicative of the results that would have been obtained if the acquisition had occurred as of the beginning of 2023 or that may be obtained in the future. Because the initial accounting for the business combination is incomplete at this time, the Company is unable to provide pro forma net earnings of the combined entity.
Credit Agreement
To finance the Bloomia acquisition, the Company entered into a revolving credit and term loan agreement (the “Credit Agreement”), together with Tulp 24.1 as the borrower. Under the terms of the Credit Agreement, the Company had an $18.0 million term loan funded. The Credit Agreement also contains a $6.0 million revolving credit facility, which may be used by the Company for general business purposes and working capital.
Borrowings under the Credit Agreement bear interest at a rate per annum equal to Term SOFR for an interest period of one month plus 3.0%. In addition to paying interest on the outstanding principal under the Credit Agreement, Tulp 24.1 is required to pay a commitment fee of 0.50% on the unutilized commitments under the revolving credit facility.
The term loans will be repaid in quarterly installments of $450,000, commencing on June 30, 2024. The remaining outstanding balance will be repaid in full after five years. The scheduled maturity of the revolving facility is February 20, 2029.
The obligations under the Credit Agreement are secured by substantially all of the personal property assets of Tulp 24.1 and its subsidiaries. The Company provided an unsecured guaranty of the obligations of Tulp 24.1 under the Credit Agreement.
Commencing with the fiscal quarter ending on March 31, 2024, the Credit Agreement will require Tulp 24.1 and its subsidiaries to maintain (a) a minimum fixed charge coverage ratio of not less than 1.25 to 1.00 and (b) a maximum senior cash flow leverage ratio of 3.0 to 1.0 until September 30, 2024, and stepping down to 2.00 to 1.00 on December 31, 2027, until the maturity date of the Credit Agreement. The Credit Agreement also contains other customary affirmative and negative covenants, including covenants that restrict the ability of Tulp 24.1 and its subsidiaries to incur additional indebtedness, dispose of significant assets, make distributions or pay dividends to the Company, make certain investments, including any acquisitions other than permitted acquisitions, make certain payments, enter into sale and leaseback transactions or grant liens on its assets, subject to certain limitations.
The Credit Agreement contains customary events of default, the occurrence of which would permit the lenders to terminate their commitments and accelerate loans under the Credit Agreement, including failure to make payments under the credit facility, failure to comply with covenants in the Credit Agreement and other loan documents, cross default to other material indebtedness of Tulp 24.1 or any of its subsidiaries, failure of Tulp 24.1 or any of its subsidiaries to pay or discharge material judgments, bankruptcy of Tulp 24.1 or any of its subsidiaries, and change of control of the Company.
Notes Payable to Sellers
As part of the financing of the Bloomia acquisition, Tulp 24.1 entered into notes payable with the sellers. Notes payable for $12.8 million have a term of five years, subject to requiring principal payments based on “excess cash flow” as defined. Interest is at 8% per annum in the first year and increase annually by 2 percentage points. Notes payable for $2.7 million have a term of nine calendar weeks after the closing date. Interest is at 8%.
Item 9. Changes in and Disagreements with Accountants on Accounting and Financial Disclosures
On November 20, 2023, the Audit Committee (the “Committee”) of the Board of Directors of the Company approved the dismissal of Baker Tilly US, LLP (“Baker Tilly”) as the Company’s independent registered public accounting firm, effective immediately. On November 20, 2023, the Committee approved the appointment of Boulay PLLP as the Company’s independent registered public accounting firm to perform independent audit services, including the audit of the Company’s consolidated financial statements for the fiscal year ending December 31, 2023. Our independent registered public accounting firms’ reports on our consolidated financial statements for each of the past two years did not contain adverse opinions or disclaimers of opinions, and were not qualified or modified as to uncertainty, audit scope, or accounting principles.
In connection with the audit of the Company’s financial statements for the fiscal years ended December 31, 2022, and the subsequent interim period through September 30, 2023, (i) there were no disagreements with Baker Tilly on any matter of accounting principles or practices, financial statement disclosure, or auditing scope or procedure, which disagreements, if not resolved to Baker Tilly’s satisfaction, would have caused Baker Tilly to make reference, in connection with its opinion, to the subject matter of such disagreements and (ii) there was no “reportable event” as defined in Item 304(a)(1)(v) of Regulation S-K.
Item 9A. Controls and Procedures
Evaluation of Disclosure Controls and Procedures
The Company’s management carried out an evaluation, under the supervision and with the participation of the Company’s Chief Executive Officer (principal executive officer) and the Company’s Vice President of Finance (principal financial and accounting officer), of the effectiveness of the design and operation of the Company’s disclosure controls and procedures (as such term is defined in Rules 13a-15(e) and 15d-15(e) under the Securities Exchange Act of 1934, as amended) as of December 31, 2023, pursuant to Exchange Act Rule 13a-15. Based upon that evaluation, the Company’s principal executive officer and the principal accounting officer concluded that the Company’s disclosure controls and procedures as of December 31, 2023 were effective.
Management’s Annual Report on Internal Control Over Financial Reporting
Our management is responsible for establishing and maintaining adequate control over financial reporting, as such term is defined in Rule 13a-15(f) of the Exchange Act. Under the supervision and with the participation of our management, including our Chief Executive Officer and Vice President of Finance, we conducted an evaluation of the effectiveness of our internal control over financial reporting as of December 31, 2023. In conducting its evaluation, our management used the criteria set forth by the framework in the 2013 Internal Control – Integrated Framework issued by the Committee of Sponsoring Organizations of the Treadway Commission. Based on that evaluation, management believes our internal control over financial reporting was effective as of December 31, 2023.
Inherent Limitations on Control Systems
Because of the inherent limitations in all control systems, no evaluation of controls can provide absolute assurance that all control issues and instances of fraud, if any, will be or have been detected. These inherent limitations include the realities that judgments in decision making can be faulty, and that breakdowns can occur because of simple error or mistake. Additionally, controls can be circumvented by the individual acts of some persons, by collusion of two or more people, or by management override of the control. The design of any system of controls is also based in part upon certain assumptions about the likelihood of future events and there can be no assurance that any design will succeed in achieving its stated goals under all potential future conditions. Over time, controls may become inadequate because of changes in conditions, or the degree of compliance with the policies or procedures may deteriorate.
Changes in Internal Control Over Financial Reporting
There was no change in the Company’s internal control over financial reporting occurred during the Company’s most recently completed fiscal quarter that would have materially affected, or is reasonably likely to materially affect, the Company’s internal control over financial reporting.
This Annual Report on Form 10-K does not include an attestation report of the Company’s registered public accounting firm regarding internal control over financial reporting. Management’s report was not subject to attestation by the Company’s registered public accounting firm pursuant to rules of the Securities and Exchange Commission that permit the Company to provide only management’s report in this Annual Report on Form 10-K.
Item 9B. Other Information
None.
Item 9C. Disclosure Regarding Foreign Jurisdictions that Prevent Inspections
Not applicable.
PART III.
Item 10. Directors, Executive Officers and Corporate Governance
Incorporated into this Item by reference is the information appearing under the headings “Proposal One – Election of Directors,” “Corporate Governance and Board Matters,” “Submission of Stockholder Proposals and Nominations” and, if any, “Delinquent Section 16(a) Reports,” in our Proxy Statement for our 2024 Annual Meeting of Stockholders we intend to file with the SEC (the “Proxy Statement”).
Information about our Executive Officers
As of the date of filing this Form 10-K, the following individuals were executive officers of the Company:
Name | | Age | | Position |
Randy D. Uglem | | 46 | | President, Chief Executive Officer and Secretary |
Zackery A. Weber | | 44 | | Vice President of Finance |
Werner F. Jansen | | 33 | | Chief Executive Officer of Bloomia B.V. |
Randy D. Uglem has served as President and CEO since August 2023. Previously he served as Senior Vice President of Lending from March 2023 to August 2023. Mr. Uglem has over twenty years of experience in credit and lending, most recently as Ag Credit and Lending Director at Air T, Inc. from February 2019 to March 2023. Mr. Uglem spent nearly 13 years at CHS Inc., serving most recently as Credit Director from 2014 to January 2019. Early in his career, he held positions at AgCountry Farm Credit Services and Affinity Plus Credit Union, as well as being involved in his family’s farming operation in North Dakota. Mr. Uglem holds a Bachelor of Science in Agricultural Economics from North Dakota State University.
Zackery A. Weber has served as Vice President of Finance since January 2022. Previously he served as Senior Director of Financial Planning and Analysis from December 2020 to January 2022. He has served in the role of principal accounting officer since January 2021. He served as Director of Financial Planning and Analysis from 2015 to December 2020, and as a Senior Financial Analyst for the Company from 2013 to 2015. Before joining the Company, Mr. Weber held analyst and accounting positions at Target Corporation with increasing responsibility from 2003 to 2013. He began his career as an auditor at McGladrey & Pullen from 2002 to 2003. Mr. Weber holds a Bachelor of Arts degree in Accounting from the University of St. Thomas and an MBA in Finance & Management, from the University of St. Thomas - Opus College of Business.
Werner F. Jansen has served as the Chief Executive Officer of Bloomia B.V. since June 2022. Previously, he served as General Manager of Fresh Tulips USA, LLC, then a wholly owned subsidiary of Bloomia B.V. comprising its U.S. operations, from 2018 to June 2022. From 2016 to 2022, he served as Director of Information and Communications Technology (ICT). Born and raised in the Netherlands, Mr. Jansen holds a Bachelor of Art degree in International Manager from University of Westminster, UK and ana Master of Art degree in Finance and Management from Cranfield University, UK. Over the past 12 years, Mr. Jansen has developed a broad set of skills at the Bloomia level and has developed a strategic view of the cut flower industry globally and a vision for Bloomia’s growing role in the cut tulips market.
There are no family relationships among any of the executive officers and directors of the Company.
Code of Ethics/Code of Conduct
We have in place a “code of ethics” within the meaning of Rule 406 of Regulation S-K, which is applicable to our senior financial management, including specifically our principal executive officer, principal financial officer, and principal accounting officer. A copy of the Code of Ethics is available on our website (www.lendway.com) under the “Corporate Governance” caption. We intend to satisfy our disclosure obligations regarding any amendment to, or a waiver from, a provision of this code of ethics by posting such information on the same website.
Item 11. Executive Compensation
The information appearing under the headings “Executive Compensation” and “Corporate Governance and Board Matters – Compensation of Non-Employee Directors” in the Proxy Statement is incorporated herein by reference.
Item 12. Security Ownership of Certain Beneficial Owners and Management and Related Stockholder Matters
The information appearing under the headings “Equity Compensation Plan Information” and “Security Ownership of Certain Beneficial Owners and Management” in the Proxy Statement is incorporated herein by reference.
Item 13. Certain Relationships and Related Transactions and Director Independence
The information appearing under the heading “Certain Relationships and Related-Party Transactions” and regarding director independence appearing under the heading “Corporate Governance and Board Matters” in the Proxy Statement is incorporated herein by reference.
Item 14. Principal Accountant Fees and Services
The information regarding principal accounting fees and services appearing under the heading “Ratification of Appointment of Independent Registered Public Accounting Firm” in the Proxy Statement is incorporated herein by reference.
PART IV.
Item 15. Exhibits and Financial Statement Schedules
The following financial statements of Lendway, Inc. are included in Item 8:
(a) Exhibits
Exhibit Number | | Description | | Incorporated by Reference To |
*2.1 | | Asset Purchase Agreement dated May 24, 2023 | | Exhibit 2.1 to Current Report filed May 25, 2023 |
| | | | |
*2.2 | | Agreement for the Sale and Purchase of Shares, dated February 21, 2024, by and among Tulp 24.1, LLC, Tulipa Acquisitie Holding B.V., Botman Bloembollen B.V., W.F. Jansen, H.J. Strengers and the Company | | Exhibit 2.1 to Current Report filed February 26, 2024 |
| | | | |
3.1 | | Certificate of Incorporation | | Exhibit 3.1 to Current Report filed August 9, 2023 |
| | | | |
3.2 | | Bylaws | | Exhibit 3.2 to Current Report filed August 9, 2023 |
| | | | |
+4.1 | | Description of Securities | | |
| | | | |
**10.1 | | Employment Agreement with Kristine Glancy dated April 8, 2016 | | Exhibit 10.1 to Form 8-K filed April 13, 2016 |
| | | | |
**10.2 | | Change in Control Severance Agreement with Kristine Glancy dated April 8, 2016 | | Exhibit 10.2 to Form 8-K filed April 13, 2016 |
| | | | |
**10.3 | | First Amendment to Change in Control Agreement with Kristine A. Glancy dated April 28, 2018 | | Exhibit 10.1 to Form 10-Q for the quarterly period ended March 31, 2019 |
| | | | |
**10.4 | | Letter Agreement with Kristine A. Glancy dated as of July 13, 2023 | | Exhibit 10.1 to Form 8-K filed July 19, 2023 |
| | | | |
**10.5 | | Employment Agreement with Adam May dated December 20, 2019 | | Exhibit 10.18 to Annual Report on Form 10-K for the year ended December 31, 2019 |
| | | | |
**10.6 | | Change in Control Agreement with Adam May dated December 20, 2019 | | Exhibit 10.19 to Annual Report on Form 10-K for the year ended December 31, 2019 |
| | | | |
**10.7 | | Retention Agreement with Adam D. May dated January 13, 2023 | | Exhibit 10.1 to Form 8-K filed January 19, 2023 |
| | | | |
**10.8 | | Letter Agreement with Adam D. May, dated May 24, 2023 | | Exhibit 10.2 to Form 8-K filed May 25, 2023 |
**10.9 | | Employment Agreement with Zackery A. Weber dated September 10, 2021 | | Exhibit 10.1 to Form 8-K filed September 16, 2021 |
| | | | |
**10.10 | | Retention Agreement with Zackery A. Weber dated January 13, 2023 | | Exhibit 10.2 to Form 8-K filed January 19, 2023 |
| | | | |
**10.11 | | Letter Agreement with Zackery A. Weber dated August 4, 2023 | | Exhibit 10.1 to Form 8-K filed August 9, 2023 |
| | | | |
**10.12 | | Employment Agreement with Randy Uglem dated March 31, 2023 | | Exhibit 10.3 to Form 10-Q for the three months ended March 31, 2023 |
| | | | |
**10.13 | | 2013 Omnibus Stock and Incentive Plan, as amended | | Exhibit 10.2 to Form 8-K filed December 2, 2016 |
| | | | |
**10.14 | | Form of Incentive Stock Option Agreement under 2013 Omnibus Stock and Incentive Plan | | Exhibit 10.1 to Form 8-K filed August 23, 2013 |
| | | | |
**10.15 | | 2018 Equity Incentive Plan | | Exhibit 99.1 to Registration Statement on Form S-8, Reg. No. 333-226670 |
| | | | |
**10.16 | | Employee Stock Purchase Plan, as amended | | Exhibit 99.2 to Registration Statement on Form S-8, filed August 8, 2018 |
| | | | |
**10.17 | | Deferred Compensation Plan for Directors | | Exhibit 10.1 to Form 10-Q for the quarterly period ended March 31, 2018 |
| | | | |
**10.18 | | Form of Retention Agreement | | Exhibit 10.2 to Form 8-K filed September 16, 2021 |
| | | | |
**10.19 | | Form of Annual Cash Incentive Compensation Agreement for fiscal year ending December 31, 2022 | | Exhibit 10.2 to Form 10-Q for the quarterly period ended September 30, 2022 |
| | | | |
10.20 | | Bridge Loan Agreement, dated February 22, 2024, by and between Botman Bloembollen B.V., W.F. Jansen, H.J. Strengers, Tulp 24.1, LLC, Tulipa Acquisitie Holding B.V. and the Company | | Exhibit 10.1 to Form 8-K filed February 26, 2024 |
| | | | |
10.21 | | Bridge Loan Agreement, dated February 22, 2024, by and between Botman Bloembollen B.V. and Tulipa Acquisitie Holding B.V. | | Exhibit 10.2 to Form 8-K filed February 26, 2024 |
| | | | |
*10.22 | | Credit Agreement, dated February 20, 2024, by and among the Company, TULP 24.1, LLC, Tulipa Acquisitie Holding B.V., Bloomia B.V., Fresh Tulips USA, LLC, and Associated Bank, N.A., a national banking association | | Exhibit 10.3 to Form 8-K filed February 26, 2024 |
| | | | |
10.23 | | Amended and Restated Limited Liability Company Agreement, dated February 22, 2024, by and among the Company, Tulp 24.1, LLC and Werner F. Jansen | | Exhibit 10.4 to Form 8-K filed February 26, 2024 |
10.24 | | Management Services Agreement, dated February 22, 2024, by and between the Company and Tulp 24.1, LLC | | Exhibit 10.5 to Form 8-K filed February 26, 2024 |
| | | | |
10.25 | | Lease Agreement, dated July 1, 2021, by and between Horti-Group, LLC and Fresh Tulips USA, LLC dba Bloomia | | Exhibit 10.6 to Form 8-K filed February 26, 2024 |
| | | | |
+21.1 | | List of Subsidiaries | | |
| | | | |
+23.1 | | Consent of Independent Registered Public Accounting Firm | | |
| | | | |
+23.2 | | Consent of Independent Registered Public Accounting Firm | | |
| | | | |
+24.1 | | Powers of Attorney | | |
| | | | |
+31 | | Certification of Principal Executive and Financial Officer pursuant to Section 302 of the Sarbanes Oxley Act of 2002 | | |
| | | | |
++32 | | Section 1350 Certifications | | |
| | | | |
+97 | | Compensation Recoupment Policy | | |
| | | | |
+101 | | The following materials from Lendway Inc.’s Annual Report on Form 10-K for the year ended December 31, 2023 are filed herewith, formatted in inline XBRL (Extensible Business Reporting Language): (i) Balance Sheets, (ii) Statements of Operations, (iii) Statements of Stockholders’ Equity (iv) Statements of Cash Flows, and (v) Notes to Financial Statements. | | |
| | | | |
+104 | | Cover Page Interactive Data File (the cover page XBRL tags are embedded in the inline XBRL document) | | |
* Schedules have been omitted pursuant to Item 601(a)(5) of Regulation S-K. A copy of any omitted schedule will be furnished to the SEC upon request; provided, however, that the parties may request confidential treatment pursuant to Rule 24b-2 of the Securities Exchange Act of 1934, as amended, for any document so furnished.
** Denotes a management contract or compensatory plan or arrangement required to be filed as an exhibit to this report pursuant to Item 15(b) of Form 10-K.
+ Filed herewith.
++ Furnished herewith.
Item 16. Form 10-K Summary
None.
SIGNATURES
Pursuant to the requirements of Section 13 or 15(d) of the Securities Exchange Act of 1934, the registrant has duly caused this report to be signed on its behalf by the undersigned, thereunto duly authorized.
| | Lendway, Inc. | |
| | | |
| By: | /s/ Randy D. Uglem | |
| | Randy D. Uglem | |
| | President and Chief Executive Officer | |
Dated: April 1, 2024
Pursuant to the requirements of the Securities Exchange Act of 1934, this report has been signed by the following persons on behalf of the registrant in the capacities and on the dates indicated.
Signature | | Title | | Date |
| | | | |
/s/ Randy D. Uglem | | President, Chief Executive Officer and Secretary | | April 1, 2024 |
Randy D. Uglem | | (principal executive officer) | | |
| | | | |
/s/ Zackery A. Weber | | Vice President of Finance | | April 1, 2024 |
Zackery A. Weber | | (principal financial and accounting officer) | | |
| | | | |
* | | Chairman of the Board, Director | | April 1, 2024 |
Mark R. Jundt | | | | |
| | | | |
* | | Director | | April 1, 2024 |
Mary H. Herfurth | | | | |
| | | | |
* | | Director | | April 1, 2024 |
Chad B. Johnson | | | | |
| | | | |
* | | Director | | April 1, 2024 |
Matthew R. Kelly | | | | |
| | | | |
* | | Director | | April 1, 2024 |
Daniel C. Philp | | | | |
| | | | |
* | | Director | | April 1, 2024 |
Nicholas J. Swenson | | | | |
* Randy D. Uglem, by signing his name hereto, does hereby sign this document on behalf of each of the above-named directors of the registrant pursuant to Powers of Attorney duly executed by such persons.
| By: | /s/ Randy D. Uglem | |
| | Randy D. Uglem | |
| | Attorney-in-fact | |
nullnullnullnullnullnullnullnullnull
v3.24.1
Cover - USD ($)
|
12 Months Ended |
|
|
Dec. 31, 2023 |
Mar. 27, 2024 |
Jun. 30, 2023 |
| Cover [Abstract] |
|
|
|
| Entity Registrant Name |
LENDWAY, INC.
|
|
|
| Entity Central Index Key |
0000875355
|
|
|
| Document Type |
10-K
|
|
|
| Amendment Flag |
false
|
|
|
| Entity Voluntary Filers |
No
|
|
|
| Current Fiscal Year End Date |
--12-31
|
|
|
| Entity Well Known Seasoned Issuer |
No
|
|
|
| Entity Small Business |
true
|
|
|
| Entity Shell Company |
false
|
|
|
| Entity Emerging Growth Company |
false
|
|
|
| Entity Current Reporting Status |
Yes
|
|
|
| Document Period End Date |
Dec. 31, 2023
|
|
|
| Entity Filer Category |
Non-accelerated Filer
|
|
|
| Document Fiscal Period Focus |
FY
|
|
|
| Document Fiscal Year Focus |
2023
|
|
|
| Entity Common Stock Shares Outstanding |
|
1,742,599
|
|
| Entity Public Float |
|
|
$ 4,692,000
|
| Document Annual Report |
true
|
|
|
| Document Transition Report |
false
|
|
|
| Document Fin Stmt Error Correction Flag |
false
|
|
|
| Entity File Number |
001-13471
|
|
|
| Entity Incorporation State Country Code |
DE
|
|
|
| Entity Tax Identification Number |
41-1656308
|
|
|
| Entity Address Address Line 1 |
5000 West 36th Street
|
|
|
| Entity Address Address Line 2 |
Suite 220
|
|
|
| Entity Address City Or Town |
Minneapolis
|
|
|
| Entity Address State Or Province |
MN
|
|
|
| Entity Address Postal Zip Code |
55416
|
|
|
| City Area Code |
763
|
|
|
| Icfr Auditor Attestation Flag |
false
|
|
|
| Auditor Name |
Boulay PLLP
|
|
|
| Auditor Location |
Minneapolis, Minnesota
|
|
|
| Auditor Firm Id |
542
|
|
|
| Local Phone Number |
392-6200
|
|
|
| Security 12b Title |
Common Stock, $0.01 par value
|
|
|
| Trading Symbol |
LDWY
|
|
|
| Security Exchange Name |
NASDAQ
|
|
|
| Entity Interactive Data Current |
Yes
|
|
|
| X |
- DefinitionBoolean flag that is true when the XBRL content amends previously-filed or accepted submission.
| Name: |
dei_AmendmentFlag |
| Namespace Prefix: |
dei_ |
| Data Type: |
xbrli:booleanItemType |
| Balance Type: |
na |
| Period Type: |
duration |
|
| X |
- DefinitionPCAOB issued Audit Firm Identifier Reference 1: http://www.xbrl.org/2003/role/presentationRef
-Publisher SEC
-Name Form 10-K
-Number 249
-Section 310
Reference 2: http://www.xbrl.org/2003/role/presentationRef
-Publisher SEC
-Name Form 20-F
-Number 249
-Section 220
-Subsection f
Reference 3: http://www.xbrl.org/2003/role/presentationRef
-Publisher SEC
-Name Form 40-F
-Number 249
-Section 240
-Subsection f
| Name: |
dei_AuditorFirmId |
| Namespace Prefix: |
dei_ |
| Data Type: |
dei:nonemptySequenceNumberItemType |
| Balance Type: |
na |
| Period Type: |
duration |
|
| X |
- ReferencesReference 1: http://www.xbrl.org/2003/role/presentationRef
-Publisher SEC
-Name Form 10-K
-Number 249
-Section 310
Reference 2: http://www.xbrl.org/2003/role/presentationRef
-Publisher SEC
-Name Form 20-F
-Number 249
-Section 220
-Subsection f
Reference 3: http://www.xbrl.org/2003/role/presentationRef
-Publisher SEC
-Name Form 40-F
-Number 249
-Section 240
-Subsection f
| Name: |
dei_AuditorLocation |
| Namespace Prefix: |
dei_ |
| Data Type: |
dei:internationalNameItemType |
| Balance Type: |
na |
| Period Type: |
duration |
|
| X |
- ReferencesReference 1: http://www.xbrl.org/2003/role/presentationRef
-Publisher SEC
-Name Form 10-K
-Number 249
-Section 310
Reference 2: http://www.xbrl.org/2003/role/presentationRef
-Publisher SEC
-Name Form 20-F
-Number 249
-Section 220
-Subsection f
Reference 3: http://www.xbrl.org/2003/role/presentationRef
-Publisher SEC
-Name Form 40-F
-Number 249
-Section 240
-Subsection f
| Name: |
dei_AuditorName |
| Namespace Prefix: |
dei_ |
| Data Type: |
dei:internationalNameItemType |
| Balance Type: |
na |
| Period Type: |
duration |
|
| X |
- DefinitionEnd date of current fiscal year in the format --MM-DD.
| Name: |
dei_CurrentFiscalYearEndDate |
| Namespace Prefix: |
dei_ |
| Data Type: |
xbrli:gMonthDayItemType |
| Balance Type: |
na |
| Period Type: |
duration |
|
| X |
- DefinitionBoolean flag that is true only for a form used as an annual report. Reference 1: http://www.xbrl.org/2003/role/presentationRef
-Publisher SEC
-Name Form 10-K
-Number 249
-Section 310
Reference 2: http://www.xbrl.org/2003/role/presentationRef
-Publisher SEC
-Name Form 20-F
-Number 249
-Section 220
-Subsection f
Reference 3: http://www.xbrl.org/2003/role/presentationRef
-Publisher SEC
-Name Form 40-F
-Number 249
-Section 240
-Subsection f
| Name: |
dei_DocumentAnnualReport |
| Namespace Prefix: |
dei_ |
| Data Type: |
xbrli:booleanItemType |
| Balance Type: |
na |
| Period Type: |
duration |
|
| X |
- DefinitionIndicates whether any of the financial statement period in the filing include a restatement due to error correction. Reference 1: http://www.xbrl.org/2003/role/presentationRef
-Publisher SEC
-Name Regulation S-K
-Number 229
-Section 402
-Subsection w
Reference 2: http://www.xbrl.org/2003/role/presentationRef
-Publisher SEC
-Name Form 10-K
-Number 249
-Section 310
Reference 3: http://www.xbrl.org/2003/role/presentationRef
-Publisher SEC
-Name Form 20-F
-Number 249
-Section 220
-Subsection f
Reference 4: http://www.xbrl.org/2003/role/presentationRef
-Publisher SEC
-Name Form 40-F
-Number 249
-Section 240
-Subsection f
| Name: |
dei_DocumentFinStmtErrorCorrectionFlag |
| Namespace Prefix: |
dei_ |
| Data Type: |
xbrli:booleanItemType |
| Balance Type: |
na |
| Period Type: |
duration |
|
| X |
- DefinitionFiscal period values are FY, Q1, Q2, and Q3. 1st, 2nd and 3rd quarter 10-Q or 10-QT statements have value Q1, Q2, and Q3 respectively, with 10-K, 10-KT or other fiscal year statements having FY.
| Name: |
dei_DocumentFiscalPeriodFocus |
| Namespace Prefix: |
dei_ |
| Data Type: |
dei:fiscalPeriodItemType |
| Balance Type: |
na |
| Period Type: |
duration |
|
| X |
- DefinitionThis is focus fiscal year of the document report in YYYY format. For a 2006 annual report, which may also provide financial information from prior periods, fiscal 2006 should be given as the fiscal year focus. Example: 2006.
| Name: |
dei_DocumentFiscalYearFocus |
| Namespace Prefix: |
dei_ |
| Data Type: |
xbrli:gYearItemType |
| Balance Type: |
na |
| Period Type: |
duration |
|
| X |
- DefinitionFor the EDGAR submission types of Form 8-K: the date of the report, the date of the earliest event reported; for the EDGAR submission types of Form N-1A: the filing date; for all other submission types: the end of the reporting or transition period. The format of the date is YYYY-MM-DD.
| Name: |
dei_DocumentPeriodEndDate |
| Namespace Prefix: |
dei_ |
| Data Type: |
xbrli:dateItemType |
| Balance Type: |
na |
| Period Type: |
duration |
|
| X |
- DefinitionBoolean flag that is true only for a form used as a transition report. Reference 1: http://www.xbrl.org/2003/role/presentationRef
-Publisher SEC
-Name Forms 10-K, 10-Q, 20-F
-Number 240
-Section 13
-Subsection a-1
| Name: |
dei_DocumentTransitionReport |
| Namespace Prefix: |
dei_ |
| Data Type: |
xbrli:booleanItemType |
| Balance Type: |
na |
| Period Type: |
duration |
|
| X |
- DefinitionThe type of document being provided (such as 10-K, 10-Q, 485BPOS, etc). The document type is limited to the same value as the supporting SEC submission type, or the word 'Other'.
| Name: |
dei_DocumentType |
| Namespace Prefix: |
dei_ |
| Data Type: |
dei:submissionTypeItemType |
| Balance Type: |
na |
| Period Type: |
duration |
|
| X |
- DefinitionAddress Line 1 such as Attn, Building Name, Street Name
| Name: |
dei_EntityAddressAddressLine1 |
| Namespace Prefix: |
dei_ |
| Data Type: |
xbrli:normalizedStringItemType |
| Balance Type: |
na |
| Period Type: |
duration |
|
| X |
- DefinitionAddress Line 2 such as Street or Suite number
| Name: |
dei_EntityAddressAddressLine2 |
| Namespace Prefix: |
dei_ |
| Data Type: |
xbrli:normalizedStringItemType |
| Balance Type: |
na |
| Period Type: |
duration |
|
| X |
- Definition
+ References
+ Details
| Name: |
dei_EntityAddressCityOrTown |
| Namespace Prefix: |
dei_ |
| Data Type: |
xbrli:normalizedStringItemType |
| Balance Type: |
na |
| Period Type: |
duration |
|
| X |
- DefinitionCode for the postal or zip code
| Name: |
dei_EntityAddressPostalZipCode |
| Namespace Prefix: |
dei_ |
| Data Type: |
xbrli:normalizedStringItemType |
| Balance Type: |
na |
| Period Type: |
duration |
|
| X |
- DefinitionName of the state or province.
| Name: |
dei_EntityAddressStateOrProvince |
| Namespace Prefix: |
dei_ |
| Data Type: |
dei:stateOrProvinceItemType |
| Balance Type: |
na |
| Period Type: |
duration |
|
| X |
- DefinitionA unique 10-digit SEC-issued value to identify entities that have filed disclosures with the SEC. It is commonly abbreviated as CIK. Reference 1: http://www.xbrl.org/2003/role/presentationRef
-Publisher SEC
-Name Exchange Act
-Number 240
-Section 12
-Subsection b-2
| Name: |
dei_EntityCentralIndexKey |
| Namespace Prefix: |
dei_ |
| Data Type: |
dei:centralIndexKeyItemType |
| Balance Type: |
na |
| Period Type: |
duration |
|
| X |
- DefinitionIndicate number of shares or other units outstanding of each of registrant's classes of capital or common stock or other ownership interests, if and as stated on cover of related periodic report. Where multiple classes or units exist define each class/interest by adding class of stock items such as Common Class A [Member], Common Class B [Member] or Partnership Interest [Member] onto the Instrument [Domain] of the Entity Listings, Instrument.
| Name: |
dei_EntityCommonStockSharesOutstanding |
| Namespace Prefix: |
dei_ |
| Data Type: |
xbrli:sharesItemType |
| Balance Type: |
na |
| Period Type: |
instant |
|
| X |
- DefinitionIndicate 'Yes' or 'No' whether registrants (1) have filed all reports required to be filed by Section 13 or 15(d) of the Securities Exchange Act of 1934 during the preceding 12 months (or for such shorter period that registrants were required to file such reports), and (2) have been subject to such filing requirements for the past 90 days. This information should be based on the registrant's current or most recent filing containing the related disclosure.
| Name: |
dei_EntityCurrentReportingStatus |
| Namespace Prefix: |
dei_ |
| Data Type: |
dei:yesNoItemType |
| Balance Type: |
na |
| Period Type: |
duration |
|
| X |
- DefinitionIndicate if registrant meets the emerging growth company criteria. Reference 1: http://www.xbrl.org/2003/role/presentationRef
-Publisher SEC
-Name Exchange Act
-Number 240
-Section 12
-Subsection b-2
| Name: |
dei_EntityEmergingGrowthCompany |
| Namespace Prefix: |
dei_ |
| Data Type: |
xbrli:booleanItemType |
| Balance Type: |
na |
| Period Type: |
duration |
|
| X |
- DefinitionCommission file number. The field allows up to 17 characters. The prefix may contain 1-3 digits, the sequence number may contain 1-8 digits, the optional suffix may contain 1-4 characters, and the fields are separated with a hyphen.
| Name: |
dei_EntityFileNumber |
| Namespace Prefix: |
dei_ |
| Data Type: |
dei:fileNumberItemType |
| Balance Type: |
na |
| Period Type: |
duration |
|
| X |
- DefinitionIndicate whether the registrant is one of the following: Large Accelerated Filer, Accelerated Filer, Non-accelerated Filer. Definitions of these categories are stated in Rule 12b-2 of the Exchange Act. This information should be based on the registrant's current or most recent filing containing the related disclosure. Reference 1: http://www.xbrl.org/2003/role/presentationRef
-Publisher SEC
-Name Exchange Act
-Number 240
-Section 12
-Subsection b-2
| Name: |
dei_EntityFilerCategory |
| Namespace Prefix: |
dei_ |
| Data Type: |
dei:filerCategoryItemType |
| Balance Type: |
na |
| Period Type: |
duration |
|
| X |
- DefinitionTwo-character EDGAR code representing the state or country of incorporation.
| Name: |
dei_EntityIncorporationStateCountryCode |
| Namespace Prefix: |
dei_ |
| Data Type: |
dei:edgarStateCountryItemType |
| Balance Type: |
na |
| Period Type: |
duration |
|
| X |
- DefinitionBoolean flag that is true when the registrant has submitted electronically every Interactive Data File required to be submitted pursuant to Rule 405 of Regulation S-T during the preceding 12 months (or for such shorter period that the registrant was required to submit such files). Reference 1: http://www.xbrl.org/2003/role/presentationRef
-Publisher SEC
-Name Regulation S-T
-Number 232
-Section 405
| Name: |
dei_EntityInteractiveDataCurrent |
| Namespace Prefix: |
dei_ |
| Data Type: |
dei:yesNoItemType |
| Balance Type: |
na |
| Period Type: |
duration |
|
| X |
- DefinitionThe aggregate market value of the voting and non-voting common equity held by non-affiliates computed by reference to the price at which the common equity was last sold, or the average bid and asked price of such common equity, as of the last business day of the registrant's most recently completed second fiscal quarter.
| Name: |
dei_EntityPublicFloat |
| Namespace Prefix: |
dei_ |
| Data Type: |
xbrli:monetaryItemType |
| Balance Type: |
credit |
| Period Type: |
instant |
|
| X |
- DefinitionThe exact name of the entity filing the report as specified in its charter, which is required by forms filed with the SEC. Reference 1: http://www.xbrl.org/2003/role/presentationRef
-Publisher SEC
-Name Exchange Act
-Number 240
-Section 12
-Subsection b-2
| Name: |
dei_EntityRegistrantName |
| Namespace Prefix: |
dei_ |
| Data Type: |
xbrli:normalizedStringItemType |
| Balance Type: |
na |
| Period Type: |
duration |
|
| X |
- DefinitionBoolean flag that is true when the registrant is a shell company as defined in Rule 12b-2 of the Exchange Act. Reference 1: http://www.xbrl.org/2003/role/presentationRef
-Publisher SEC
-Name Exchange Act
-Number 240
-Section 12
-Subsection b-2
| Name: |
dei_EntityShellCompany |
| Namespace Prefix: |
dei_ |
| Data Type: |
xbrli:booleanItemType |
| Balance Type: |
na |
| Period Type: |
duration |
|
| X |
- DefinitionIndicates that the company is a Smaller Reporting Company (SRC). Reference 1: http://www.xbrl.org/2003/role/presentationRef
-Publisher SEC
-Name Exchange Act
-Number 240
-Section 12
-Subsection b-2
| Name: |
dei_EntitySmallBusiness |
| Namespace Prefix: |
dei_ |
| Data Type: |
xbrli:booleanItemType |
| Balance Type: |
na |
| Period Type: |
duration |
|
| X |
- DefinitionThe Tax Identification Number (TIN), also known as an Employer Identification Number (EIN), is a unique 9-digit value assigned by the IRS. Reference 1: http://www.xbrl.org/2003/role/presentationRef
-Publisher SEC
-Name Exchange Act
-Number 240
-Section 12
-Subsection b-2
| Name: |
dei_EntityTaxIdentificationNumber |
| Namespace Prefix: |
dei_ |
| Data Type: |
dei:employerIdItemType |
| Balance Type: |
na |
| Period Type: |
duration |
|
| X |
- DefinitionIndicate 'Yes' or 'No' if the registrant is not required to file reports pursuant to Section 13 or Section 15(d) of the Act.
| Name: |
dei_EntityVoluntaryFilers |
| Namespace Prefix: |
dei_ |
| Data Type: |
dei:yesNoItemType |
| Balance Type: |
na |
| Period Type: |
duration |
|
| X |
- DefinitionIndicate 'Yes' or 'No' if the registrant is a well-known seasoned issuer, as defined in Rule 405 of the Securities Act. Is used on Form Type: 10-K, 10-Q, 8-K, 20-F, 6-K, 10-K/A, 10-Q/A, 20-F/A, 6-K/A, N-CSR, N-Q, N-1A. Reference 1: http://www.xbrl.org/2003/role/presentationRef
-Publisher SEC
-Name Securities Act
-Number 230
-Section 405
| Name: |
dei_EntityWellKnownSeasonedIssuer |
| Namespace Prefix: |
dei_ |
| Data Type: |
dei:yesNoItemType |
| Balance Type: |
na |
| Period Type: |
duration |
|
| X |
- ReferencesReference 1: http://www.xbrl.org/2003/role/presentationRef
-Publisher SEC
-Name Form 10-K
-Number 249
-Section 310
Reference 2: http://www.xbrl.org/2003/role/presentationRef
-Publisher SEC
-Name Form 20-F
-Number 249
-Section 220
-Subsection f
Reference 3: http://www.xbrl.org/2003/role/presentationRef
-Publisher SEC
-Name Form 40-F
-Number 249
-Section 240
-Subsection f
| Name: |
dei_IcfrAuditorAttestationFlag |
| Namespace Prefix: |
dei_ |
| Data Type: |
xbrli:booleanItemType |
| Balance Type: |
na |
| Period Type: |
duration |
|
| X |
- DefinitionLocal phone number for entity.
| Name: |
dei_LocalPhoneNumber |
| Namespace Prefix: |
dei_ |
| Data Type: |
xbrli:normalizedStringItemType |
| Balance Type: |
na |
| Period Type: |
duration |
|
| X |
- DefinitionTitle of a 12(b) registered security. Reference 1: http://www.xbrl.org/2003/role/presentationRef
-Publisher SEC
-Name Exchange Act
-Number 240
-Section 12
-Subsection b
| Name: |
dei_Security12bTitle |
| Namespace Prefix: |
dei_ |
| Data Type: |
dei:securityTitleItemType |
| Balance Type: |
na |
| Period Type: |
duration |
|
| X |
- DefinitionName of the Exchange on which a security is registered. Reference 1: http://www.xbrl.org/2003/role/presentationRef
-Publisher SEC
-Name Exchange Act
-Number 240
-Section 12
-Subsection d1-1
| Name: |
dei_SecurityExchangeName |
| Namespace Prefix: |
dei_ |
| Data Type: |
dei:edgarExchangeCodeItemType |
| Balance Type: |
na |
| Period Type: |
duration |
|
| X |
- DefinitionTrading symbol of an instrument as listed on an exchange.
| Name: |
dei_TradingSymbol |
| Namespace Prefix: |
dei_ |
| Data Type: |
dei:tradingSymbolItemType |
| Balance Type: |
na |
| Period Type: |
duration |
|
v3.24.1
CONSOLIDATED BALANCE SHEETS - USD ($)
|
Dec. 31, 2023 |
Dec. 31, 2022 |
| Current Assets: |
|
|
| Cash and cash equivalents |
$ 16,077,000
|
$ 14,439,000
|
| Restricted cash |
0
|
85,000
|
| Receivable from escrow account |
200,000
|
0
|
| Income tax receivable |
14,000
|
28,000
|
| Prepaid expense |
38,000
|
30,000
|
| Other current assets related to discontinued operations |
292,000
|
6,171,000
|
| Total Current Assets |
16,621,000
|
20,753,000
|
| Other Assets: |
|
|
| Property and equipment, net |
35,000
|
0
|
| Operating lease right-of-use assets |
7,000
|
0
|
| Other, net |
10,000
|
0
|
| Non-current assets related to discontinued operations |
0
|
215,000
|
| Total Other Assets |
52,000
|
215,000
|
| Total Assets |
16,673,000
|
20,968,000
|
| Current Liabilities: |
|
|
| Accounts payable |
32,000
|
138,000
|
| Accrued liabilities: |
|
|
| Compensation |
635,000
|
264,000
|
| Other |
168,000
|
306,000
|
| Current portion of operating lease liabilities |
4,000
|
0
|
| Current liabilities related to discontinued operations |
257,000
|
6,666,000
|
| Total Current Liabilities |
1,096,000
|
7,374,000
|
| Long-Term Liabilities: |
|
|
| Accrued income taxes |
42,000
|
53,000
|
| Operating lease liabilities |
3,000
|
0
|
| Non-current liabilities related to discontinued operations |
0
|
140,000
|
| Total Long-Term Liabilities |
45,000
|
193,000
|
| Commitments and Contingencies |
0
|
0
|
| Stockholders Equity: |
|
|
| Common stock, par value $.01: Authorized shares - 5,714,000 Issued and outstanding shares - 1,743,000 and 1,797,000 at December 31, 2023 and 2022, respectively |
17,000
|
18,000
|
| Additional paid-in capital |
16,176,000
|
16,458,000
|
| Accumulated deficit |
(661,000)
|
(3,075,000)
|
| Total Stockholders Equity |
15,532,000
|
13,401,000
|
| Total Liabilities and Stockholders Equity |
$ 16,673,000
|
$ 20,968,000
|
| X |
- DefinitionCarrying value as of the balance sheet date of liabilities incurred (and for which invoices have typically been received) and payable to vendors for goods and services received that are used in an entity's business. Used to reflect the current portion of the liabilities (due within one year or within the normal operating cycle if longer). Reference 1: http://www.xbrl.org/2003/role/exampleRef
-Topic 852
-SubTopic 10
-Name Accounting Standards Codification
-Section 55
-Paragraph 10
-Publisher FASB
-URI https://asc.fasb.org//1943274/2147481372/852-10-55-10
Reference 2: http://fasb.org/us-gaap/role/ref/legacyRef
-Name Accounting Standards Codification
-Topic 210
-SubTopic 10
-Section S99
-Paragraph 1
-Subparagraph (SX 210.5-02.19(a))
-Publisher FASB
-URI https://asc.fasb.org//1943274/2147480566/210-10-S99-1
| Name: |
us-gaap_AccountsPayableCurrent |
| Namespace Prefix: |
us-gaap_ |
| Data Type: |
xbrli:monetaryItemType |
| Balance Type: |
credit |
| Period Type: |
instant |
|
| X |
- References
+ Details
| Name: |
us-gaap_AccruedLiabilitiesCurrentAbstract |
| Namespace Prefix: |
us-gaap_ |
| Data Type: |
xbrli:stringItemType |
| Balance Type: |
na |
| Period Type: |
duration |
|
| X |
- DefinitionAmount of excess of issue price over par or stated value of stock and from other transaction involving stock or stockholder. Includes, but is not limited to, additional paid-in capital (APIC) for common and preferred stock. Reference 1: http://www.xbrl.org/2003/role/exampleRef
-Topic 852
-SubTopic 10
-Name Accounting Standards Codification
-Section 55
-Paragraph 10
-Publisher FASB
-URI https://asc.fasb.org//1943274/2147481372/852-10-55-10
Reference 2: http://www.xbrl.org/2009/role/commonPracticeRef
-Topic 946
-SubTopic 210
-Name Accounting Standards Codification
-Section S99
-Paragraph 1
-Subparagraph (SX 210.6-04(18))
-Publisher FASB
-URI https://asc.fasb.org//1943274/2147479617/946-210-S99-1
Reference 3: http://fasb.org/us-gaap/role/ref/legacyRef
-Topic 210
-SubTopic 10
-Name Accounting Standards Codification
-Section S99
-Paragraph 1
-Subparagraph (SX 210.5-02(30)(a)(1))
-Publisher FASB
-URI https://asc.fasb.org//1943274/2147480566/210-10-S99-1
| Name: |
us-gaap_AdditionalPaidInCapital |
| Namespace Prefix: |
us-gaap_ |
| Data Type: |
xbrli:monetaryItemType |
| Balance Type: |
credit |
| Period Type: |
instant |
|
| X |
- DefinitionSum of the carrying amounts as of the balance sheet date of all assets that are recognized. Assets are probable future economic benefits obtained or controlled by an entity as a result of past transactions or events. Reference 1: http://www.xbrl.org/2003/role/disclosureRef
-Topic 810
-SubTopic 10
-Name Accounting Standards Codification
-Section 50
-Paragraph 3
-Subparagraph (bb)
-Publisher FASB
-URI https://asc.fasb.org//1943274/2147481203/810-10-50-3
Reference 2: http://www.xbrl.org/2003/role/disclosureRef
-Topic 810
-SubTopic 10
-Name Accounting Standards Codification
-Section 45
-Paragraph 25
-Subparagraph (a)
-Publisher FASB
-URI https://asc.fasb.org//1943274/2147481231/810-10-45-25
Reference 3: http://www.xbrl.org/2003/role/disclosureRef
-Topic 235
-SubTopic 10
-Name Accounting Standards Codification
-Section S99
-Paragraph 1
-Subparagraph (SX 210.4-08(g)(1)(ii))
-Publisher FASB
-URI https://asc.fasb.org//1943274/2147480678/235-10-S99-1
Reference 4: http://www.xbrl.org/2003/role/disclosureRef
-Topic 323
-SubTopic 10
-Name Accounting Standards Codification
-Section 50
-Paragraph 3
-Subparagraph (c)
-Publisher FASB
-URI https://asc.fasb.org//1943274/2147481687/323-10-50-3
Reference 5: http://www.xbrl.org/2003/role/disclosureRef
-Topic 825
-SubTopic 10
-Name Accounting Standards Codification
-Section 50
-Paragraph 28
-Subparagraph (f)
-Publisher FASB
-URI https://asc.fasb.org//1943274/2147482907/825-10-50-28
Reference 6: http://www.xbrl.org/2003/role/exampleRef
-Topic 852
-SubTopic 10
-Name Accounting Standards Codification
-Section 55
-Paragraph 10
-Publisher FASB
-URI https://asc.fasb.org//1943274/2147481372/852-10-55-10
Reference 7: http://www.xbrl.org/2003/role/exampleRef
-Topic 946
-SubTopic 830
-Name Accounting Standards Codification
-Section 55
-Paragraph 12
-Publisher FASB
-URI https://asc.fasb.org//1943274/2147480167/946-830-55-12
Reference 8: http://www.xbrl.org/2003/role/disclosureRef
-Topic 944
-SubTopic 210
-Name Accounting Standards Codification
-Section S99
-Paragraph 1
-Subparagraph (SX 210.7-03(a)(12))
-Publisher FASB
-URI https://asc.fasb.org//1943274/2147479440/944-210-S99-1
Reference 9: http://www.xbrl.org/2003/role/disclosureRef
-Topic 280
-SubTopic 10
-Name Accounting Standards Codification
-Section 50
-Paragraph 22
-Publisher FASB
-URI https://asc.fasb.org//1943274/2147482810/280-10-50-22
Reference 10: http://www.xbrl.org/2003/role/disclosureRef
-Topic 946
-SubTopic 210
-Name Accounting Standards Codification
-Section S99
-Paragraph 1
-Subparagraph (SX 210.6-04(8))
-Publisher FASB
-URI https://asc.fasb.org//1943274/2147479617/946-210-S99-1
Reference 11: http://www.xbrl.org/2003/role/disclosureRef
-Topic 210
-SubTopic 10
-Name Accounting Standards Codification
-Section S99
-Paragraph 1
-Subparagraph (SX 210.5-02(18))
-Publisher FASB
-URI https://asc.fasb.org//1943274/2147480566/210-10-S99-1
Reference 12: http://www.xbrl.org/2003/role/disclosureRef
-Topic 470
-SubTopic 10
-Name Accounting Standards Codification
-Section S99
-Paragraph 1A
-Subparagraph (SX 210.13-01(a)(4)(i))
-Publisher FASB
-URI https://asc.fasb.org//1943274/2147480097/470-10-S99-1A
Reference 13: http://www.xbrl.org/2009/role/commonPracticeRef
-Topic 470
-SubTopic 10
-Name Accounting Standards Codification
-Section S99
-Paragraph 1A
-Subparagraph (SX 210.13-01(a)(4)(ii))
-Publisher FASB
-URI https://asc.fasb.org//1943274/2147480097/470-10-S99-1A
Reference 14: http://www.xbrl.org/2009/role/commonPracticeRef
-Topic 470
-SubTopic 10
-Name Accounting Standards Codification
-Section S99
-Paragraph 1A
-Subparagraph (SX 210.13-01(a)(4)(iii))
-Publisher FASB
-URI https://asc.fasb.org//1943274/2147480097/470-10-S99-1A
Reference 15: http://www.xbrl.org/2003/role/disclosureRef
-Topic 470
-SubTopic 10
-Name Accounting Standards Codification
-Section S99
-Paragraph 1A
-Subparagraph (SX 210.13-01(a)(4)(iii)(A))
-Publisher FASB
-URI https://asc.fasb.org//1943274/2147480097/470-10-S99-1A
Reference 16: http://www.xbrl.org/2003/role/disclosureRef
-Topic 470
-SubTopic 10
-Name Accounting Standards Codification
-Section S99
-Paragraph 1A
-Subparagraph (SX 210.13-01(a)(4)(iv))
-Publisher FASB
-URI https://asc.fasb.org//1943274/2147480097/470-10-S99-1A
Reference 17: http://www.xbrl.org/2003/role/disclosureRef
-Topic 470
-SubTopic 10
-Name Accounting Standards Codification
-Section S99
-Paragraph 1A
-Subparagraph (SX 210.13-01(a)(5))
-Publisher FASB
-URI https://asc.fasb.org//1943274/2147480097/470-10-S99-1A
Reference 18: http://www.xbrl.org/2003/role/disclosureRef
-Topic 470
-SubTopic 10
-Name Accounting Standards Codification
-Section S99
-Paragraph 1B
-Subparagraph (SX 210.13-02(a)(4)(i))
-Publisher FASB
-URI https://asc.fasb.org//1943274/2147480097/470-10-S99-1B
Reference 19: http://www.xbrl.org/2003/role/disclosureRef
-Topic 470
-SubTopic 10
-Name Accounting Standards Codification
-Section S99
-Paragraph 1B
-Subparagraph (SX 210.13-02(a)(4)(iii)(A))
-Publisher FASB
-URI https://asc.fasb.org//1943274/2147480097/470-10-S99-1B
Reference 20: http://www.xbrl.org/2003/role/disclosureRef
-Topic 470
-SubTopic 10
-Name Accounting Standards Codification
-Section S99
-Paragraph 1B
-Subparagraph (SX 210.13-02(a)(4)(iii)(B))
-Publisher FASB
-URI https://asc.fasb.org//1943274/2147480097/470-10-S99-1B
Reference 21: http://www.xbrl.org/2003/role/disclosureRef
-Topic 470
-SubTopic 10
-Name Accounting Standards Codification
-Section S99
-Paragraph 1B
-Subparagraph (SX 210.13-02(a)(4)(iv))
-Publisher FASB
-URI https://asc.fasb.org//1943274/2147480097/470-10-S99-1B
Reference 22: http://www.xbrl.org/2003/role/disclosureRef
-Topic 470
-SubTopic 10
-Name Accounting Standards Codification
-Section S99
-Paragraph 1B
-Subparagraph (SX 210.13-02(a)(5))
-Publisher FASB
-URI https://asc.fasb.org//1943274/2147480097/470-10-S99-1B
Reference 23: http://www.xbrl.org/2009/role/commonPracticeRef
-Topic 852
-SubTopic 10
-Name Accounting Standards Codification
-Section 50
-Paragraph 7
-Subparagraph (a)
-Publisher FASB
-URI https://asc.fasb.org//1943274/2147481404/852-10-50-7
Reference 24: http://www.xbrl.org/2003/role/disclosureRef
-Topic 280
-SubTopic 10
-Name Accounting Standards Codification
-Section 50
-Paragraph 30
-Subparagraph (c)
-Publisher FASB
-URI https://asc.fasb.org//1943274/2147482810/280-10-50-30
Reference 25: http://www.xbrl.org/2003/role/disclosureRef
-Topic 280
-SubTopic 10
-Name Accounting Standards Codification
-Section 50
-Paragraph 32
-Subparagraph (d)
-Publisher FASB
-URI https://asc.fasb.org//1943274/2147482810/280-10-50-32
Reference 26: http://fasb.org/us-gaap/role/ref/legacyRef
-Topic 942
-SubTopic 210
-Name Accounting Standards Codification
-Section S99
-Paragraph 1
-Subparagraph (SX 210.9-03(11))
-Publisher FASB
-URI https://asc.fasb.org//1943274/2147479853/942-210-S99-1
| Name: |
us-gaap_Assets |
| Namespace Prefix: |
us-gaap_ |
| Data Type: |
xbrli:monetaryItemType |
| Balance Type: |
debit |
| Period Type: |
instant |
|
| X |
- DefinitionSum of the carrying amounts as of the balance sheet date of all assets that are expected to be realized in cash, sold, or consumed within one year (or the normal operating cycle, if longer). Assets are probable future economic benefits obtained or controlled by an entity as a result of past transactions or events. Reference 1: http://www.xbrl.org/2003/role/disclosureRef
-Topic 810
-SubTopic 10
-Name Accounting Standards Codification
-Section 50
-Paragraph 3
-Subparagraph (bb)
-Publisher FASB
-URI https://asc.fasb.org//1943274/2147481203/810-10-50-3
Reference 2: http://www.xbrl.org/2003/role/disclosureRef
-Topic 810
-SubTopic 10
-Name Accounting Standards Codification
-Section 45
-Paragraph 25
-Subparagraph (a)
-Publisher FASB
-URI https://asc.fasb.org//1943274/2147481231/810-10-45-25
Reference 3: http://www.xbrl.org/2003/role/disclosureRef
-Topic 235
-SubTopic 10
-Name Accounting Standards Codification
-Section S99
-Paragraph 1
-Subparagraph (SX 210.4-08(g)(1)(ii))
-Publisher FASB
-URI https://asc.fasb.org//1943274/2147480678/235-10-S99-1
Reference 4: http://www.xbrl.org/2003/role/disclosureRef
-Topic 323
-SubTopic 10
-Name Accounting Standards Codification
-Section 50
-Paragraph 3
-Subparagraph (c)
-Publisher FASB
-URI https://asc.fasb.org//1943274/2147481687/323-10-50-3
Reference 5: http://www.xbrl.org/2003/role/disclosureRef
-Topic 825
-SubTopic 10
-Name Accounting Standards Codification
-Section 50
-Paragraph 28
-Subparagraph (f)
-Publisher FASB
-URI https://asc.fasb.org//1943274/2147482907/825-10-50-28
Reference 6: http://www.xbrl.org/2003/role/exampleRef
-Topic 852
-SubTopic 10
-Name Accounting Standards Codification
-Section 55
-Paragraph 10
-Publisher FASB
-URI https://asc.fasb.org//1943274/2147481372/852-10-55-10
Reference 7: http://www.xbrl.org/2003/role/disclosureRef
-Topic 210
-SubTopic 10
-Name Accounting Standards Codification
-Section 45
-Paragraph 1
-Publisher FASB
-URI https://asc.fasb.org//1943274/2147483467/210-10-45-1
Reference 8: http://www.xbrl.org/2003/role/disclosureRef
-Topic 210
-SubTopic 10
-Name Accounting Standards Codification
-Section S99
-Paragraph 1
-Subparagraph (SX 210.5-02(9))
-Publisher FASB
-URI https://asc.fasb.org//1943274/2147480566/210-10-S99-1
Reference 9: http://www.xbrl.org/2003/role/disclosureRef
-Topic 470
-SubTopic 10
-Name Accounting Standards Codification
-Section S99
-Paragraph 1A
-Subparagraph (SX 210.13-01(a)(4)(i))
-Publisher FASB
-URI https://asc.fasb.org//1943274/2147480097/470-10-S99-1A
Reference 10: http://www.xbrl.org/2009/role/commonPracticeRef
-Topic 470
-SubTopic 10
-Name Accounting Standards Codification
-Section S99
-Paragraph 1A
-Subparagraph (SX 210.13-01(a)(4)(ii))
-Publisher FASB
-URI https://asc.fasb.org//1943274/2147480097/470-10-S99-1A
Reference 11: http://www.xbrl.org/2009/role/commonPracticeRef
-Topic 470
-SubTopic 10
-Name Accounting Standards Codification
-Section S99
-Paragraph 1A
-Subparagraph (SX 210.13-01(a)(4)(iii))
-Publisher FASB
-URI https://asc.fasb.org//1943274/2147480097/470-10-S99-1A
Reference 12: http://www.xbrl.org/2003/role/disclosureRef
-Topic 470
-SubTopic 10
-Name Accounting Standards Codification
-Section S99
-Paragraph 1A
-Subparagraph (SX 210.13-01(a)(4)(iii)(A))
-Publisher FASB
-URI https://asc.fasb.org//1943274/2147480097/470-10-S99-1A
Reference 13: http://www.xbrl.org/2003/role/disclosureRef
-Topic 470
-SubTopic 10
-Name Accounting Standards Codification
-Section S99
-Paragraph 1A
-Subparagraph (SX 210.13-01(a)(4)(iv))
-Publisher FASB
-URI https://asc.fasb.org//1943274/2147480097/470-10-S99-1A
Reference 14: http://www.xbrl.org/2003/role/disclosureRef
-Topic 470
-SubTopic 10
-Name Accounting Standards Codification
-Section S99
-Paragraph 1A
-Subparagraph (SX 210.13-01(a)(5))
-Publisher FASB
-URI https://asc.fasb.org//1943274/2147480097/470-10-S99-1A
Reference 15: http://www.xbrl.org/2003/role/disclosureRef
-Topic 470
-SubTopic 10
-Name Accounting Standards Codification
-Section S99
-Paragraph 1B
-Subparagraph (SX 210.13-02(a)(4)(i))
-Publisher FASB
-URI https://asc.fasb.org//1943274/2147480097/470-10-S99-1B
Reference 16: http://www.xbrl.org/2003/role/disclosureRef
-Topic 470
-SubTopic 10
-Name Accounting Standards Codification
-Section S99
-Paragraph 1B
-Subparagraph (SX 210.13-02(a)(4)(iii)(A))
-Publisher FASB
-URI https://asc.fasb.org//1943274/2147480097/470-10-S99-1B
Reference 17: http://www.xbrl.org/2003/role/disclosureRef
-Topic 470
-SubTopic 10
-Name Accounting Standards Codification
-Section S99
-Paragraph 1B
-Subparagraph (SX 210.13-02(a)(4)(iii)(B))
-Publisher FASB
-URI https://asc.fasb.org//1943274/2147480097/470-10-S99-1B
Reference 18: http://www.xbrl.org/2003/role/disclosureRef
-Topic 470
-SubTopic 10
-Name Accounting Standards Codification
-Section S99
-Paragraph 1B
-Subparagraph (SX 210.13-02(a)(4)(iv))
-Publisher FASB
-URI https://asc.fasb.org//1943274/2147480097/470-10-S99-1B
Reference 19: http://www.xbrl.org/2003/role/disclosureRef
-Topic 470
-SubTopic 10
-Name Accounting Standards Codification
-Section S99
-Paragraph 1B
-Subparagraph (SX 210.13-02(a)(5))
-Publisher FASB
-URI https://asc.fasb.org//1943274/2147480097/470-10-S99-1B
Reference 20: http://www.xbrl.org/2009/role/commonPracticeRef
-Topic 852
-SubTopic 10
-Name Accounting Standards Codification
-Section 50
-Paragraph 7
-Subparagraph (a)
-Publisher FASB
-URI https://asc.fasb.org//1943274/2147481404/852-10-50-7
| Name: |
us-gaap_AssetsCurrent |
| Namespace Prefix: |
us-gaap_ |
| Data Type: |
xbrli:monetaryItemType |
| Balance Type: |
debit |
| Period Type: |
instant |
|
| X |
- References
+ Details
| Name: |
us-gaap_AssetsCurrentAbstract |
| Namespace Prefix: |
us-gaap_ |
| Data Type: |
xbrli:stringItemType |
| Balance Type: |
na |
| Period Type: |
duration |
|
| X |
- DefinitionAmount classified as assets attributable to disposal group held for sale or disposed of, expected to be disposed of within one year or the normal operating cycle, if longer. Reference 1: http://fasb.org/us-gaap/role/ref/legacyRef
-Name Accounting Standards Codification
-Section 45
-Paragraph 10
-SubTopic 20
-Topic 205
-Publisher FASB
-URI https://asc.fasb.org//1943274/2147483475/205-20-45-10
Reference 2: http://www.xbrl.org/2003/role/disclosureRef
-Topic 205
-SubTopic 20
-Name Accounting Standards Codification
-Section 50
-Paragraph 7
-Publisher FASB
-URI https://asc.fasb.org//1943274/2147483499/205-20-50-7
Reference 3: http://www.xbrl.org/2003/role/disclosureRef
-Topic 205
-SubTopic 20
-Name Accounting Standards Codification
-Section 50
-Paragraph 5C
-Subparagraph (a)(2)
-Publisher FASB
-URI https://asc.fasb.org//1943274/2147483499/205-20-50-5C
Reference 4: http://fasb.org/us-gaap/role/ref/legacyRef
-Topic 360
-SubTopic 10
-Name Accounting Standards Codification
-Section 45
-Paragraph 9
-Publisher FASB
-URI https://asc.fasb.org//1943274/2147482130/360-10-45-9
Reference 5: http://fasb.org/us-gaap/role/ref/legacyRef
-Topic 205
-SubTopic 20
-Name Accounting Standards Codification
-Section 50
-Paragraph 5B
-Subparagraph (e)
-Publisher FASB
-URI https://asc.fasb.org//1943274/2147483499/205-20-50-5B
Reference 6: http://fasb.org/us-gaap/role/ref/legacyRef
-Topic 360
-SubTopic 10
-Name Accounting Standards Codification
-Section 50
-Paragraph 3
-Subparagraph (e)
-Publisher FASB
-URI https://asc.fasb.org//1943274/2147482099/360-10-50-3
Reference 7: http://fasb.org/us-gaap/role/ref/legacyRef
-Topic 205
-SubTopic 20
-Name Accounting Standards Codification
-Section 45
-Paragraph 11
-Publisher FASB
-URI https://asc.fasb.org//1943274/2147483475/205-20-45-11
| Name: |
us-gaap_AssetsOfDisposalGroupIncludingDiscontinuedOperationCurrent |
| Namespace Prefix: |
us-gaap_ |
| Data Type: |
xbrli:monetaryItemType |
| Balance Type: |
debit |
| Period Type: |
instant |
|
| X |
- DefinitionAmount of short-term, highly liquid investments that are both readily convertible to known amounts of cash and so near their maturity that they present insignificant risk of changes in value because of changes in interest rates. Excludes cash and cash equivalents within disposal group and discontinued operation. Reference 1: http://www.xbrl.org/2009/role/commonPracticeRef
-Topic 944
-SubTopic 210
-Name Accounting Standards Codification
-Section S99
-Paragraph 1
-Subparagraph (SX 210.7-03(a)(2))
-Publisher FASB
-URI https://asc.fasb.org//1943274/2147479440/944-210-S99-1
Reference 2: http://www.xbrl.org/2009/role/commonPracticeRef
-Topic 210
-SubTopic 10
-Name Accounting Standards Codification
-Section S99
-Paragraph 1
-Subparagraph (SX 210.5-02(1))
-Publisher FASB
-URI https://asc.fasb.org//1943274/2147480566/210-10-S99-1
| Name: |
us-gaap_CashEquivalentsAtCarryingValue |
| Namespace Prefix: |
us-gaap_ |
| Data Type: |
xbrli:monetaryItemType |
| Balance Type: |
debit |
| Period Type: |
instant |
|
| X |
- DefinitionRepresents the caption on the face of the balance sheet to indicate that the entity has entered into (1) purchase or supply arrangements that will require expending a portion of its resources to meet the terms thereof, and (2) is exposed to potential losses or, less frequently, gains, arising from (a) possible claims against a company's resources due to future performance under contract terms, and (b) possible losses or likely gains from uncertainties that will ultimately be resolved when one or more future events that are deemed likely to occur do occur or fail to occur. Reference 1: http://www.xbrl.org/2003/role/disclosureRef
-Topic 944
-SubTopic 210
-Name Accounting Standards Codification
-Section S99
-Paragraph 1
-Subparagraph (SX 210.7-03(a)(19))
-Publisher FASB
-URI https://asc.fasb.org//1943274/2147479440/944-210-S99-1
Reference 2: http://www.xbrl.org/2003/role/disclosureRef
-Topic 946
-SubTopic 210
-Name Accounting Standards Codification
-Section S99
-Paragraph 1
-Subparagraph (SX 210.6-04(15))
-Publisher FASB
-URI https://asc.fasb.org//1943274/2147479617/946-210-S99-1
Reference 3: http://fasb.org/us-gaap/role/ref/legacyRef
-Name Accounting Standards Codification
-Topic 942
-SubTopic 210
-Section S99
-Paragraph 1
-Subparagraph (SX 210.9-03.17)
-Publisher FASB
-URI https://asc.fasb.org//1943274/2147479853/942-210-S99-1
Reference 4: http://fasb.org/us-gaap/role/ref/legacyRef
-Name Accounting Standards Codification
-Topic 210
-SubTopic 10
-Section S99
-Paragraph 1
-Subparagraph (SX 210.5-02.25)
-Publisher FASB
-URI https://asc.fasb.org//1943274/2147480566/210-10-S99-1
| Name: |
us-gaap_CommitmentsAndContingencies |
| Namespace Prefix: |
us-gaap_ |
| Data Type: |
xbrli:monetaryItemType |
| Balance Type: |
credit |
| Period Type: |
instant |
|
| X |
- DefinitionAggregate par or stated value of issued nonredeemable common stock (or common stock redeemable solely at the option of the issuer). This item includes treasury stock repurchased by the entity. Note: elements for number of nonredeemable common shares, par value and other disclosure concepts are in another section within stockholders' equity. Reference 1: http://www.xbrl.org/2003/role/exampleRef
-Topic 852
-SubTopic 10
-Name Accounting Standards Codification
-Section 55
-Paragraph 10
-Publisher FASB
-URI https://asc.fasb.org//1943274/2147481372/852-10-55-10
Reference 2: http://www.xbrl.org/2003/role/disclosureRef
-Topic 944
-SubTopic 210
-Name Accounting Standards Codification
-Section S99
-Paragraph 1
-Subparagraph (SX 210.7-03(a)(22))
-Publisher FASB
-URI https://asc.fasb.org//1943274/2147479440/944-210-S99-1
Reference 3: http://fasb.org/us-gaap/role/ref/legacyRef
-Topic 210
-SubTopic 10
-Name Accounting Standards Codification
-Section S99
-Paragraph 1
-Subparagraph (SX 210.5-02(29))
-Publisher FASB
-URI https://asc.fasb.org//1943274/2147480566/210-10-S99-1
| Name: |
us-gaap_CommonStockValue |
| Namespace Prefix: |
us-gaap_ |
| Data Type: |
xbrli:monetaryItemType |
| Balance Type: |
credit |
| Period Type: |
instant |
|
| X |
- DefinitionAggregate carrying value as of the balance sheet date of the liabilities for all deferred compensation arrangements payable within one year (or the operating cycle, if longer). Represents currently earned compensation under compensation arrangements that is not actually paid until a later date. Reference 1: http://fasb.org/us-gaap/role/ref/legacyRef
-Topic 710
-SubTopic 10
-Name Accounting Standards Codification
-Section 25
-Paragraph 9
-Publisher FASB
-URI https://asc.fasb.org//1943274/2147483070/710-10-25-9
Reference 2: http://fasb.org/us-gaap/role/ref/legacyRef
-Name Accounting Standards Codification
-Topic 710
-SubTopic 10
-Section 30
-Paragraph 2
-Publisher FASB
-URI https://asc.fasb.org//1943274/2147483043/710-10-30-2
| Name: |
us-gaap_DeferredCompensationLiabilityCurrent |
| Namespace Prefix: |
us-gaap_ |
| Data Type: |
xbrli:monetaryItemType |
| Balance Type: |
credit |
| Period Type: |
instant |
|
| X |
- DefinitionAmount classified as assets attributable to disposal group held for sale or disposed of, expected to be disposed of after one year or the normal operating cycle, if longer. Reference 1: http://fasb.org/us-gaap/role/ref/legacyRef
-Name Accounting Standards Codification
-Section 45
-Paragraph 10
-SubTopic 20
-Topic 205
-Publisher FASB
-URI https://asc.fasb.org//1943274/2147483475/205-20-45-10
Reference 2: http://fasb.org/us-gaap/role/ref/legacyRef
-Name Accounting Standards Codification
-Section 45
-Paragraph 11
-SubTopic 10
-Topic 360
-Publisher FASB
-URI https://asc.fasb.org//1943274/2147482130/360-10-45-11
Reference 3: http://www.xbrl.org/2003/role/disclosureRef
-Topic 205
-SubTopic 20
-Name Accounting Standards Codification
-Section 50
-Paragraph 7
-Publisher FASB
-URI https://asc.fasb.org//1943274/2147483499/205-20-50-7
Reference 4: http://www.xbrl.org/2003/role/disclosureRef
-Topic 205
-SubTopic 20
-Name Accounting Standards Codification
-Section 50
-Paragraph 5C
-Subparagraph (a)(2)
-Publisher FASB
-URI https://asc.fasb.org//1943274/2147483499/205-20-50-5C
Reference 5: http://fasb.org/us-gaap/role/ref/legacyRef
-Topic 205
-SubTopic 20
-Name Accounting Standards Codification
-Section 50
-Paragraph 5B
-Subparagraph (e)
-Publisher FASB
-URI https://asc.fasb.org//1943274/2147483499/205-20-50-5B
Reference 6: http://fasb.org/us-gaap/role/ref/legacyRef
-Topic 360
-SubTopic 10
-Name Accounting Standards Codification
-Section 50
-Paragraph 3
-Subparagraph (e)
-Publisher FASB
-URI https://asc.fasb.org//1943274/2147482099/360-10-50-3
Reference 7: http://fasb.org/us-gaap/role/ref/legacyRef
-Topic 205
-SubTopic 20
-Name Accounting Standards Codification
-Section 45
-Paragraph 11
-Publisher FASB
-URI https://asc.fasb.org//1943274/2147483475/205-20-45-11
| Name: |
us-gaap_DisposalGroupIncludingDiscontinuedOperationAssetsNoncurrent |
| Namespace Prefix: |
us-gaap_ |
| Data Type: |
xbrli:monetaryItemType |
| Balance Type: |
debit |
| Period Type: |
instant |
|
| X |
- DefinitionAmount of liabilities and equity items, including the portion of equity attributable to noncontrolling interests, if any. Reference 1: http://www.xbrl.org/2003/role/exampleRef
-Topic 852
-SubTopic 10
-Name Accounting Standards Codification
-Section 55
-Paragraph 10
-Publisher FASB
-URI https://asc.fasb.org//1943274/2147481372/852-10-55-10
Reference 2: http://www.xbrl.org/2003/role/disclosureRef
-Topic 944
-SubTopic 210
-Name Accounting Standards Codification
-Section S99
-Paragraph 1
-Subparagraph (SX 210.7-03(a)(25))
-Publisher FASB
-URI https://asc.fasb.org//1943274/2147479440/944-210-S99-1
Reference 3: http://www.xbrl.org/2009/role/commonPracticeRef
-Topic 235
-SubTopic 10
-Name Accounting Standards Codification
-Section S99
-Paragraph 1
-Subparagraph (SX 210.4-08(g)(1)(ii))
-Publisher FASB
-URI https://asc.fasb.org//1943274/2147480678/235-10-S99-1
Reference 4: http://www.xbrl.org/2009/role/commonPracticeRef
-Topic 323
-SubTopic 10
-Name Accounting Standards Codification
-Section 50
-Paragraph 3
-Subparagraph (c)
-Publisher FASB
-URI https://asc.fasb.org//1943274/2147481687/323-10-50-3
Reference 5: http://www.xbrl.org/2009/role/commonPracticeRef
-Topic 825
-SubTopic 10
-Name Accounting Standards Codification
-Section 50
-Paragraph 28
-Subparagraph (f)
-Publisher FASB
-URI https://asc.fasb.org//1943274/2147482907/825-10-50-28
Reference 6: http://fasb.org/us-gaap/role/ref/legacyRef
-Topic 942
-SubTopic 210
-Name Accounting Standards Codification
-Section S99
-Paragraph 1
-Subparagraph (SX 210.9-03(23))
-Publisher FASB
-URI https://asc.fasb.org//1943274/2147479853/942-210-S99-1
Reference 7: http://fasb.org/us-gaap/role/ref/legacyRef
-Topic 210
-SubTopic 10
-Name Accounting Standards Codification
-Section S99
-Paragraph 1
-Subparagraph (SX 210.5-02(32))
-Publisher FASB
-URI https://asc.fasb.org//1943274/2147480566/210-10-S99-1
| Name: |
us-gaap_LiabilitiesAndStockholdersEquity |
| Namespace Prefix: |
us-gaap_ |
| Data Type: |
xbrli:monetaryItemType |
| Balance Type: |
credit |
| Period Type: |
instant |
|
| X |
- DefinitionTotal obligations incurred as part of normal operations that are expected to be paid during the following twelve months or within one business cycle, if longer. Reference 1: http://www.xbrl.org/2003/role/disclosureRef
-Topic 810
-SubTopic 10
-Name Accounting Standards Codification
-Section 50
-Paragraph 3
-Subparagraph (c)
-Publisher FASB
-URI https://asc.fasb.org//1943274/2147481203/810-10-50-3
Reference 2: http://www.xbrl.org/2003/role/disclosureRef
-Topic 810
-SubTopic 10
-Name Accounting Standards Codification
-Section 45
-Paragraph 25
-Subparagraph (b)
-Publisher FASB
-URI https://asc.fasb.org//1943274/2147481231/810-10-45-25
Reference 3: http://www.xbrl.org/2003/role/disclosureRef
-Topic 810
-SubTopic 10
-Name Accounting Standards Codification
-Section 50
-Paragraph 3
-Subparagraph (bb)
-Publisher FASB
-URI https://asc.fasb.org//1943274/2147481203/810-10-50-3
Reference 4: http://www.xbrl.org/2003/role/disclosureRef
-Topic 235
-SubTopic 10
-Name Accounting Standards Codification
-Section S99
-Paragraph 1
-Subparagraph (SX 210.4-08(g)(1)(ii))
-Publisher FASB
-URI https://asc.fasb.org//1943274/2147480678/235-10-S99-1
Reference 5: http://www.xbrl.org/2003/role/disclosureRef
-Topic 323
-SubTopic 10
-Name Accounting Standards Codification
-Section 50
-Paragraph 3
-Subparagraph (c)
-Publisher FASB
-URI https://asc.fasb.org//1943274/2147481687/323-10-50-3
Reference 6: http://www.xbrl.org/2003/role/disclosureRef
-Topic 825
-SubTopic 10
-Name Accounting Standards Codification
-Section 50
-Paragraph 28
-Subparagraph (f)
-Publisher FASB
-URI https://asc.fasb.org//1943274/2147482907/825-10-50-28
Reference 7: http://www.xbrl.org/2003/role/exampleRef
-Topic 852
-SubTopic 10
-Name Accounting Standards Codification
-Section 55
-Paragraph 10
-Publisher FASB
-URI https://asc.fasb.org//1943274/2147481372/852-10-55-10
Reference 8: http://www.xbrl.org/2003/role/disclosureRef
-Topic 210
-SubTopic 10
-Name Accounting Standards Codification
-Section 45
-Paragraph 5
-Publisher FASB
-URI https://asc.fasb.org//1943274/2147483467/210-10-45-5
Reference 9: http://www.xbrl.org/2003/role/disclosureRef
-Topic 470
-SubTopic 10
-Name Accounting Standards Codification
-Section S99
-Paragraph 1A
-Subparagraph (SX 210.13-01(a)(4)(i))
-Publisher FASB
-URI https://asc.fasb.org//1943274/2147480097/470-10-S99-1A
Reference 10: http://www.xbrl.org/2009/role/commonPracticeRef
-Topic 470
-SubTopic 10
-Name Accounting Standards Codification
-Section S99
-Paragraph 1A
-Subparagraph (SX 210.13-01(a)(4)(ii))
-Publisher FASB
-URI https://asc.fasb.org//1943274/2147480097/470-10-S99-1A
Reference 11: http://www.xbrl.org/2003/role/disclosureRef
-Topic 470
-SubTopic 10
-Name Accounting Standards Codification
-Section S99
-Paragraph 1A
-Subparagraph (SX 210.13-01(a)(4)(iii)(A))
-Publisher FASB
-URI https://asc.fasb.org//1943274/2147480097/470-10-S99-1A
Reference 12: http://www.xbrl.org/2003/role/disclosureRef
-Topic 470
-SubTopic 10
-Name Accounting Standards Codification
-Section S99
-Paragraph 1A
-Subparagraph (SX 210.13-01(a)(4)(iv))
-Publisher FASB
-URI https://asc.fasb.org//1943274/2147480097/470-10-S99-1A
Reference 13: http://www.xbrl.org/2003/role/disclosureRef
-Topic 470
-SubTopic 10
-Name Accounting Standards Codification
-Section S99
-Paragraph 1A
-Subparagraph (SX 210.13-01(a)(5))
-Publisher FASB
-URI https://asc.fasb.org//1943274/2147480097/470-10-S99-1A
Reference 14: http://www.xbrl.org/2003/role/disclosureRef
-Topic 470
-SubTopic 10
-Name Accounting Standards Codification
-Section S99
-Paragraph 1B
-Subparagraph (SX 210.13-02(a)(4)(i))
-Publisher FASB
-URI https://asc.fasb.org//1943274/2147480097/470-10-S99-1B
Reference 15: http://www.xbrl.org/2003/role/disclosureRef
-Topic 470
-SubTopic 10
-Name Accounting Standards Codification
-Section S99
-Paragraph 1B
-Subparagraph (SX 210.13-02(a)(4)(iii)(A))
-Publisher FASB
-URI https://asc.fasb.org//1943274/2147480097/470-10-S99-1B
Reference 16: http://www.xbrl.org/2003/role/disclosureRef
-Topic 470
-SubTopic 10
-Name Accounting Standards Codification
-Section S99
-Paragraph 1B
-Subparagraph (SX 210.13-02(a)(4)(iii)(B))
-Publisher FASB
-URI https://asc.fasb.org//1943274/2147480097/470-10-S99-1B
Reference 17: http://www.xbrl.org/2003/role/disclosureRef
-Topic 470
-SubTopic 10
-Name Accounting Standards Codification
-Section S99
-Paragraph 1B
-Subparagraph (SX 210.13-02(a)(4)(iv))
-Publisher FASB
-URI https://asc.fasb.org//1943274/2147480097/470-10-S99-1B
Reference 18: http://www.xbrl.org/2003/role/disclosureRef
-Topic 470
-SubTopic 10
-Name Accounting Standards Codification
-Section S99
-Paragraph 1B
-Subparagraph (SX 210.13-02(a)(5))
-Publisher FASB
-URI https://asc.fasb.org//1943274/2147480097/470-10-S99-1B
Reference 19: http://www.xbrl.org/2009/role/commonPracticeRef
-Topic 852
-SubTopic 10
-Name Accounting Standards Codification
-Section 50
-Paragraph 7
-Subparagraph (a)
-Publisher FASB
-URI https://asc.fasb.org//1943274/2147481404/852-10-50-7
Reference 20: http://www.xbrl.org/2009/role/commonPracticeRef
-Topic 852
-SubTopic 10
-Name Accounting Standards Codification
-Section 50
-Paragraph 7
-Subparagraph (b)
-Publisher FASB
-URI https://asc.fasb.org//1943274/2147481404/852-10-50-7
Reference 21: http://fasb.org/us-gaap/role/ref/legacyRef
-Name Accounting Standards Codification
-Topic 210
-SubTopic 10
-Section S99
-Paragraph 1
-Subparagraph (SX 210.5-02.21)
-Publisher FASB
-URI https://asc.fasb.org//1943274/2147480566/210-10-S99-1
| Name: |
us-gaap_LiabilitiesCurrent |
| Namespace Prefix: |
us-gaap_ |
| Data Type: |
xbrli:monetaryItemType |
| Balance Type: |
credit |
| Period Type: |
instant |
|
| X |
- References
+ Details
| Name: |
us-gaap_LiabilitiesCurrentAbstract |
| Namespace Prefix: |
us-gaap_ |
| Data Type: |
xbrli:stringItemType |
| Balance Type: |
na |
| Period Type: |
duration |
|
| X |
- DefinitionAmount of obligation due after one year or beyond the normal operating cycle, if longer. Reference 1: http://fasb.org/us-gaap/role/ref/legacyRef
-Name Accounting Standards Codification
-Section S99
-Paragraph 1
-Subparagraph (SX 210.5-02(22))
-SubTopic 10
-Topic 210
-Publisher FASB
-URI https://asc.fasb.org//1943274/2147480566/210-10-S99-1
Reference 2: http://www.xbrl.org/2003/role/disclosureRef
-Topic 810
-SubTopic 10
-Name Accounting Standards Codification
-Section 50
-Paragraph 3
-Subparagraph (c)
-Publisher FASB
-URI https://asc.fasb.org//1943274/2147481203/810-10-50-3
Reference 3: http://www.xbrl.org/2003/role/disclosureRef
-Topic 810
-SubTopic 10
-Name Accounting Standards Codification
-Section 45
-Paragraph 25
-Subparagraph (b)
-Publisher FASB
-URI https://asc.fasb.org//1943274/2147481231/810-10-45-25
Reference 4: http://www.xbrl.org/2003/role/disclosureRef
-Topic 810
-SubTopic 10
-Name Accounting Standards Codification
-Section 50
-Paragraph 3
-Subparagraph (bb)
-Publisher FASB
-URI https://asc.fasb.org//1943274/2147481203/810-10-50-3
Reference 5: http://www.xbrl.org/2003/role/disclosureRef
-Topic 235
-SubTopic 10
-Name Accounting Standards Codification
-Section S99
-Paragraph 1
-Subparagraph (SX 210.4-08(g)(1)(ii))
-Publisher FASB
-URI https://asc.fasb.org//1943274/2147480678/235-10-S99-1
Reference 6: http://www.xbrl.org/2003/role/disclosureRef
-Topic 323
-SubTopic 10
-Name Accounting Standards Codification
-Section 50
-Paragraph 3
-Subparagraph (c)
-Publisher FASB
-URI https://asc.fasb.org//1943274/2147481687/323-10-50-3
Reference 7: http://www.xbrl.org/2003/role/disclosureRef
-Topic 825
-SubTopic 10
-Name Accounting Standards Codification
-Section 50
-Paragraph 28
-Subparagraph (f)
-Publisher FASB
-URI https://asc.fasb.org//1943274/2147482907/825-10-50-28
Reference 8: http://www.xbrl.org/2003/role/disclosureRef
-Topic 470
-SubTopic 10
-Name Accounting Standards Codification
-Section S99
-Paragraph 1A
-Subparagraph (SX 210.13-01(a)(4)(i))
-Publisher FASB
-URI https://asc.fasb.org//1943274/2147480097/470-10-S99-1A
Reference 9: http://www.xbrl.org/2009/role/commonPracticeRef
-Topic 470
-SubTopic 10
-Name Accounting Standards Codification
-Section S99
-Paragraph 1A
-Subparagraph (SX 210.13-01(a)(4)(ii))
-Publisher FASB
-URI https://asc.fasb.org//1943274/2147480097/470-10-S99-1A
Reference 10: http://www.xbrl.org/2003/role/disclosureRef
-Topic 470
-SubTopic 10
-Name Accounting Standards Codification
-Section S99
-Paragraph 1A
-Subparagraph (SX 210.13-01(a)(4)(iii)(A))
-Publisher FASB
-URI https://asc.fasb.org//1943274/2147480097/470-10-S99-1A
Reference 11: http://www.xbrl.org/2003/role/disclosureRef
-Topic 470
-SubTopic 10
-Name Accounting Standards Codification
-Section S99
-Paragraph 1A
-Subparagraph (SX 210.13-01(a)(4)(iv))
-Publisher FASB
-URI https://asc.fasb.org//1943274/2147480097/470-10-S99-1A
Reference 12: http://www.xbrl.org/2003/role/disclosureRef
-Topic 470
-SubTopic 10
-Name Accounting Standards Codification
-Section S99
-Paragraph 1A
-Subparagraph (SX 210.13-01(a)(5))
-Publisher FASB
-URI https://asc.fasb.org//1943274/2147480097/470-10-S99-1A
Reference 13: http://www.xbrl.org/2003/role/disclosureRef
-Topic 470
-SubTopic 10
-Name Accounting Standards Codification
-Section S99
-Paragraph 1B
-Subparagraph (SX 210.13-02(a)(4)(i))
-Publisher FASB
-URI https://asc.fasb.org//1943274/2147480097/470-10-S99-1B
Reference 14: http://www.xbrl.org/2003/role/disclosureRef
-Topic 470
-SubTopic 10
-Name Accounting Standards Codification
-Section S99
-Paragraph 1B
-Subparagraph (SX 210.13-02(a)(4)(iii)(A))
-Publisher FASB
-URI https://asc.fasb.org//1943274/2147480097/470-10-S99-1B
Reference 15: http://www.xbrl.org/2003/role/disclosureRef
-Topic 470
-SubTopic 10
-Name Accounting Standards Codification
-Section S99
-Paragraph 1B
-Subparagraph (SX 210.13-02(a)(4)(iii)(B))
-Publisher FASB
-URI https://asc.fasb.org//1943274/2147480097/470-10-S99-1B
Reference 16: http://www.xbrl.org/2003/role/disclosureRef
-Topic 470
-SubTopic 10
-Name Accounting Standards Codification
-Section S99
-Paragraph 1B
-Subparagraph (SX 210.13-02(a)(4)(iv))
-Publisher FASB
-URI https://asc.fasb.org//1943274/2147480097/470-10-S99-1B
Reference 17: http://www.xbrl.org/2003/role/disclosureRef
-Topic 470
-SubTopic 10
-Name Accounting Standards Codification
-Section S99
-Paragraph 1B
-Subparagraph (SX 210.13-02(a)(5))
-Publisher FASB
-URI https://asc.fasb.org//1943274/2147480097/470-10-S99-1B
Reference 18: http://www.xbrl.org/2009/role/commonPracticeRef
-Topic 852
-SubTopic 10
-Name Accounting Standards Codification
-Section 50
-Paragraph 7
-Subparagraph (a)
-Publisher FASB
-URI https://asc.fasb.org//1943274/2147481404/852-10-50-7
Reference 19: http://www.xbrl.org/2009/role/commonPracticeRef
-Topic 852
-SubTopic 10
-Name Accounting Standards Codification
-Section 50
-Paragraph 7
-Subparagraph (b)
-Publisher FASB
-URI https://asc.fasb.org//1943274/2147481404/852-10-50-7
Reference 20: http://fasb.org/us-gaap/role/ref/legacyRef
-Topic 210
-SubTopic 10
-Name Accounting Standards Codification
-Section S99
-Paragraph 1
-Subparagraph (SX 210.5-02(23))
-Publisher FASB
-URI https://asc.fasb.org//1943274/2147480566/210-10-S99-1
Reference 21: http://fasb.org/us-gaap/role/ref/legacyRef
-Topic 210
-SubTopic 10
-Name Accounting Standards Codification
-Section S99
-Paragraph 1
-Subparagraph (SX 201.5-02(24))
-Publisher FASB
-URI https://asc.fasb.org//1943274/2147480566/210-10-S99-1
Reference 22: http://fasb.org/us-gaap/role/ref/legacyRef
-Topic 210
-SubTopic 10
-Name Accounting Standards Codification
-Section S99
-Paragraph 1
-Subparagraph (SX 201.5-02(25))
-Publisher FASB
-URI https://asc.fasb.org//1943274/2147480566/210-10-S99-1
Reference 23: http://fasb.org/us-gaap/role/ref/legacyRef
-Topic 210
-SubTopic 10
-Name Accounting Standards Codification
-Section S99
-Paragraph 1
-Subparagraph (SX 201.5-02(26))
-Publisher FASB
-URI https://asc.fasb.org//1943274/2147480566/210-10-S99-1
| Name: |
us-gaap_LiabilitiesNoncurrent |
| Namespace Prefix: |
us-gaap_ |
| Data Type: |
xbrli:monetaryItemType |
| Balance Type: |
credit |
| Period Type: |
instant |
|
| X |
- References
+ Details
| Name: |
us-gaap_LiabilitiesNoncurrentAbstract |
| Namespace Prefix: |
us-gaap_ |
| Data Type: |
xbrli:stringItemType |
| Balance Type: |
na |
| Period Type: |
duration |
|
| X |
- DefinitionAmount classified as liabilities attributable to disposal group held for sale or disposed of, expected to be disposed of within one year or the normal operating cycle, if longer. Reference 1: http://fasb.org/us-gaap/role/ref/legacyRef
-Name Accounting Standards Codification
-Section 45
-Paragraph 10
-SubTopic 20
-Topic 205
-Publisher FASB
-URI https://asc.fasb.org//1943274/2147483475/205-20-45-10
Reference 2: http://www.xbrl.org/2003/role/disclosureRef
-Topic 205
-SubTopic 20
-Name Accounting Standards Codification
-Section 50
-Paragraph 7
-Publisher FASB
-URI https://asc.fasb.org//1943274/2147483499/205-20-50-7
Reference 3: http://www.xbrl.org/2003/role/disclosureRef
-Topic 205
-SubTopic 20
-Name Accounting Standards Codification
-Section 50
-Paragraph 5C
-Subparagraph (a)(2)
-Publisher FASB
-URI https://asc.fasb.org//1943274/2147483499/205-20-50-5C
Reference 4: http://fasb.org/us-gaap/role/ref/legacyRef
-Topic 360
-SubTopic 10
-Name Accounting Standards Codification
-Section 45
-Paragraph 9
-Publisher FASB
-URI https://asc.fasb.org//1943274/2147482130/360-10-45-9
Reference 5: http://fasb.org/us-gaap/role/ref/legacyRef
-Topic 205
-SubTopic 20
-Name Accounting Standards Codification
-Section 50
-Paragraph 5B
-Subparagraph (e)
-Publisher FASB
-URI https://asc.fasb.org//1943274/2147483499/205-20-50-5B
Reference 6: http://fasb.org/us-gaap/role/ref/legacyRef
-Topic 360
-SubTopic 10
-Name Accounting Standards Codification
-Section 50
-Paragraph 3
-Subparagraph (e)
-Publisher FASB
-URI https://asc.fasb.org//1943274/2147482099/360-10-50-3
Reference 7: http://fasb.org/us-gaap/role/ref/legacyRef
-Topic 205
-SubTopic 20
-Name Accounting Standards Codification
-Section 45
-Paragraph 11
-Publisher FASB
-URI https://asc.fasb.org//1943274/2147483475/205-20-45-11
| Name: |
us-gaap_LiabilitiesOfDisposalGroupIncludingDiscontinuedOperationCurrent |
| Namespace Prefix: |
us-gaap_ |
| Data Type: |
xbrli:monetaryItemType |
| Balance Type: |
credit |
| Period Type: |
instant |
|
| X |
- DefinitionAmount classified as liabilities attributable to disposal group held for sale or disposed of, expected to be disposed of beyond one year or the normal operating cycle, if longer. Reference 1: http://fasb.org/us-gaap/role/ref/legacyRef
-Name Accounting Standards Codification
-Section 45
-Paragraph 10
-SubTopic 20
-Topic 205
-Publisher FASB
-URI https://asc.fasb.org//1943274/2147483475/205-20-45-10
Reference 2: http://fasb.org/us-gaap/role/ref/legacyRef
-Name Accounting Standards Codification
-Section 45
-Paragraph 11
-SubTopic 10
-Topic 360
-Publisher FASB
-URI https://asc.fasb.org//1943274/2147482130/360-10-45-11
Reference 3: http://www.xbrl.org/2003/role/disclosureRef
-Topic 205
-SubTopic 20
-Name Accounting Standards Codification
-Section 50
-Paragraph 7
-Publisher FASB
-URI https://asc.fasb.org//1943274/2147483499/205-20-50-7
Reference 4: http://www.xbrl.org/2003/role/disclosureRef
-Topic 205
-SubTopic 20
-Name Accounting Standards Codification
-Section 50
-Paragraph 5C
-Subparagraph (a)(2)
-Publisher FASB
-URI https://asc.fasb.org//1943274/2147483499/205-20-50-5C
Reference 5: http://fasb.org/us-gaap/role/ref/legacyRef
-Topic 205
-SubTopic 20
-Name Accounting Standards Codification
-Section 50
-Paragraph 5B
-Subparagraph (e)
-Publisher FASB
-URI https://asc.fasb.org//1943274/2147483499/205-20-50-5B
Reference 6: http://fasb.org/us-gaap/role/ref/legacyRef
-Topic 360
-SubTopic 10
-Name Accounting Standards Codification
-Section 50
-Paragraph 3
-Subparagraph (e)
-Publisher FASB
-URI https://asc.fasb.org//1943274/2147482099/360-10-50-3
Reference 7: http://fasb.org/us-gaap/role/ref/legacyRef
-Topic 205
-SubTopic 20
-Name Accounting Standards Codification
-Section 45
-Paragraph 11
-Publisher FASB
-URI https://asc.fasb.org//1943274/2147483475/205-20-45-11
| Name: |
us-gaap_LiabilitiesOfDisposalGroupIncludingDiscontinuedOperationNoncurrent |
| Namespace Prefix: |
us-gaap_ |
| Data Type: |
xbrli:monetaryItemType |
| Balance Type: |
credit |
| Period Type: |
instant |
|
| X |
- DefinitionPresent value of lessee's discounted obligation for lease payments from operating lease, classified as current. Reference 1: http://www.xbrl.org/2003/role/disclosureRef
-Topic 842
-SubTopic 20
-Name Accounting Standards Codification
-Section 45
-Paragraph 1
-Subparagraph (b)
-Publisher FASB
-URI https://asc.fasb.org//1943274/2147479041/842-20-45-1
| Name: |
us-gaap_OperatingLeaseLiabilityCurrent |
| Namespace Prefix: |
us-gaap_ |
| Data Type: |
xbrli:monetaryItemType |
| Balance Type: |
credit |
| Period Type: |
instant |
|
| X |
- DefinitionPresent value of lessee's discounted obligation for lease payments from operating lease, classified as noncurrent. Reference 1: http://www.xbrl.org/2003/role/disclosureRef
-Topic 842
-SubTopic 20
-Name Accounting Standards Codification
-Section 45
-Paragraph 1
-Subparagraph (b)
-Publisher FASB
-URI https://asc.fasb.org//1943274/2147479041/842-20-45-1
| Name: |
us-gaap_OperatingLeaseLiabilityNoncurrent |
| Namespace Prefix: |
us-gaap_ |
| Data Type: |
xbrli:monetaryItemType |
| Balance Type: |
credit |
| Period Type: |
instant |
|
| X |
- DefinitionAmount of lessee's right to use underlying asset under operating lease. Reference 1: http://www.xbrl.org/2003/role/disclosureRef
-Topic 842
-SubTopic 20
-Name Accounting Standards Codification
-Section 45
-Paragraph 1
-Subparagraph (a)
-Publisher FASB
-URI https://asc.fasb.org//1943274/2147479041/842-20-45-1
| Name: |
us-gaap_OperatingLeaseRightOfUseAsset |
| Namespace Prefix: |
us-gaap_ |
| Data Type: |
xbrli:monetaryItemType |
| Balance Type: |
debit |
| Period Type: |
instant |
|
| X |
- DefinitionAmount of assets classified as other. Reference 1: http://www.xbrl.org/2003/role/exampleRef
-Topic 946
-SubTopic 830
-Name Accounting Standards Codification
-Section 55
-Paragraph 12
-Publisher FASB
-URI https://asc.fasb.org//1943274/2147480167/946-830-55-12
Reference 2: http://www.xbrl.org/2003/role/disclosureRef
-Topic 944
-SubTopic 210
-Name Accounting Standards Codification
-Section S99
-Paragraph 1
-Subparagraph (SX 210.7-03(a)(10))
-Publisher FASB
-URI https://asc.fasb.org//1943274/2147479440/944-210-S99-1
Reference 3: http://www.xbrl.org/2003/role/disclosureRef
-Topic 210
-SubTopic 10
-Name Accounting Standards Codification
-Section S99
-Paragraph 1
-Subparagraph (SX 210.5-02(17))
-Publisher FASB
-URI https://asc.fasb.org//1943274/2147480566/210-10-S99-1
Reference 4: http://fasb.org/us-gaap/role/ref/legacyRef
-Topic 942
-SubTopic 210
-Name Accounting Standards Codification
-Section S99
-Paragraph 1
-Subparagraph (SX 210.9-03(10))
-Publisher FASB
-URI https://asc.fasb.org//1943274/2147479853/942-210-S99-1
| Name: |
us-gaap_OtherAssets |
| Namespace Prefix: |
us-gaap_ |
| Data Type: |
xbrli:monetaryItemType |
| Balance Type: |
debit |
| Period Type: |
instant |
|
| X |
- DefinitionAmount of noncurrent assets classified as other. Reference 1: http://www.xbrl.org/2003/role/disclosureRef
-Topic 210
-SubTopic 10
-Name Accounting Standards Codification
-Section S99
-Paragraph 1
-Subparagraph (SX 210.5-02(17))
-Publisher FASB
-URI https://asc.fasb.org//1943274/2147480566/210-10-S99-1
| Name: |
us-gaap_OtherAssetsNoncurrent |
| Namespace Prefix: |
us-gaap_ |
| Data Type: |
xbrli:monetaryItemType |
| Balance Type: |
debit |
| Period Type: |
instant |
|
| X |
- References
+ Details
| Name: |
us-gaap_OtherAssetsNoncurrentAbstract |
| Namespace Prefix: |
us-gaap_ |
| Data Type: |
xbrli:stringItemType |
| Balance Type: |
na |
| Period Type: |
duration |
|
| X |
- DefinitionAmount of liabilities classified as other. Reference 1: http://www.xbrl.org/2003/role/exampleRef
-Topic 946
-SubTopic 830
-Name Accounting Standards Codification
-Section 55
-Paragraph 12
-Publisher FASB
-URI https://asc.fasb.org//1943274/2147480167/946-830-55-12
Reference 2: http://www.xbrl.org/2003/role/disclosureRef
-Topic 946
-SubTopic 210
-Name Accounting Standards Codification
-Section S99
-Paragraph 1
-Subparagraph (SX 210.6-04(12)(b)(2))
-Publisher FASB
-URI https://asc.fasb.org//1943274/2147479617/946-210-S99-1
Reference 3: http://www.xbrl.org/2003/role/disclosureRef
-Topic 946
-SubTopic 210
-Name Accounting Standards Codification
-Section S99
-Paragraph 1
-Subparagraph (SX 210.6-04(12)(b)(3))
-Publisher FASB
-URI https://asc.fasb.org//1943274/2147479617/946-210-S99-1
Reference 4: http://www.xbrl.org/2003/role/disclosureRef
-Topic 944
-SubTopic 210
-Name Accounting Standards Codification
-Section S99
-Paragraph 1
-Subparagraph (SX 210.7-03(15))
-Publisher FASB
-URI https://asc.fasb.org//1943274/2147479440/944-210-S99-1
Reference 5: http://www.xbrl.org/2009/role/commonPracticeRef
-Topic 946
-SubTopic 210
-Name Accounting Standards Codification
-Section S99
-Paragraph 1
-Subparagraph (SX 210.6-04(12)(b)(1))
-Publisher FASB
-URI https://asc.fasb.org//1943274/2147479617/946-210-S99-1
Reference 6: http://fasb.org/us-gaap/role/ref/legacyRef
-Name Accounting Standards Codification
-Topic 942
-SubTopic 210
-Section S99
-Paragraph 1
-Subparagraph (SX 210.9-03.15)
-Publisher FASB
-URI https://asc.fasb.org//1943274/2147479853/942-210-S99-1
| Name: |
us-gaap_OtherLiabilities |
| Namespace Prefix: |
us-gaap_ |
| Data Type: |
xbrli:monetaryItemType |
| Balance Type: |
credit |
| Period Type: |
instant |
|
| X |
- DefinitionAmount of asset related to consideration paid in advance for costs that provide economic benefits in future periods, and amount of other assets that are expected to be realized or consumed within one year or the normal operating cycle, if longer. Reference 1: http://www.xbrl.org/2009/role/commonPracticeRef
-Topic 210
-SubTopic 10
-Name Accounting Standards Codification
-Section S99
-Paragraph 1
-Subparagraph (SX 210.5-02(9))
-Publisher FASB
-URI https://asc.fasb.org//1943274/2147480566/210-10-S99-1
| Name: |
us-gaap_PrepaidExpenseAndOtherAssetsCurrent |
| Namespace Prefix: |
us-gaap_ |
| Data Type: |
xbrli:monetaryItemType |
| Balance Type: |
debit |
| Period Type: |
instant |
|
| X |
- DefinitionAmount after accumulated depreciation, depletion and amortization of physical assets used in the normal conduct of business to produce goods and services and not intended for resale. Examples include, but are not limited to, land, buildings, machinery and equipment, office equipment, and furniture and fixtures. Reference 1: http://fasb.org/us-gaap/role/ref/legacyRef
-Name Accounting Standards Codification
-Section 50
-Paragraph 1
-SubTopic 10
-Topic 360
-Publisher FASB
-URI https://asc.fasb.org//1943274/2147482099/360-10-50-1
Reference 2: http://www.xbrl.org/2003/role/exampleRef
-Topic 852
-SubTopic 10
-Name Accounting Standards Codification
-Section 55
-Paragraph 10
-Publisher FASB
-URI https://asc.fasb.org//1943274/2147481372/852-10-55-10
Reference 3: http://www.xbrl.org/2003/role/disclosureRef
-Topic 944
-SubTopic 210
-Name Accounting Standards Codification
-Section S99
-Paragraph 1
-Subparagraph (SX 210.7-03(a)(8))
-Publisher FASB
-URI https://asc.fasb.org//1943274/2147479440/944-210-S99-1
Reference 4: http://www.xbrl.org/2003/role/disclosureRef
-Topic 942
-SubTopic 360
-Name Accounting Standards Codification
-Section 50
-Paragraph 1
-Publisher FASB
-URI https://asc.fasb.org//1943274/2147480842/942-360-50-1
| Name: |
us-gaap_PropertyPlantAndEquipmentNet |
| Namespace Prefix: |
us-gaap_ |
| Data Type: |
xbrli:monetaryItemType |
| Balance Type: |
debit |
| Period Type: |
instant |
|
| X |
- DefinitionThe total amount due to the entity within one year of the balance sheet date (or one operating cycle, if longer) from outside sources, including trade accounts receivable, notes and loans receivable, as well as any other types of receivables, net of allowances established for the purpose of reducing such receivables to an amount that approximates their net realizable value. Reference 1: http://www.xbrl.org/2003/role/exampleRef
-Topic 852
-SubTopic 10
-Name Accounting Standards Codification
-Section 55
-Paragraph 10
-Publisher FASB
-URI https://asc.fasb.org//1943274/2147481372/852-10-55-10
| Name: |
us-gaap_ReceivablesNetCurrent |
| Namespace Prefix: |
us-gaap_ |
| Data Type: |
xbrli:monetaryItemType |
| Balance Type: |
debit |
| Period Type: |
instant |
|
| X |
- DefinitionAmount of cash restricted as to withdrawal or usage, classified as current. Cash includes, but is not limited to, currency on hand, demand deposits with banks or financial institutions, and other accounts with general characteristics of demand deposits. Reference 1: http://www.xbrl.org/2009/role/commonPracticeRef
-Topic 210
-SubTopic 10
-Name Accounting Standards Codification
-Section S99
-Paragraph 1
-Subparagraph (SX 210.5-02(1))
-Publisher FASB
-URI https://asc.fasb.org//1943274/2147480566/210-10-S99-1
Reference 2: http://www.xbrl.org/2009/role/commonPracticeRef
-Topic 230
-SubTopic 10
-Name Accounting Standards Codification
-Section 50
-Paragraph 8
-Publisher FASB
-URI https://asc.fasb.org//1943274/2147482913/230-10-50-8
| Name: |
us-gaap_RestrictedCashCurrent |
| Namespace Prefix: |
us-gaap_ |
| Data Type: |
xbrli:monetaryItemType |
| Balance Type: |
debit |
| Period Type: |
instant |
|
| X |
- DefinitionAmount of accumulated undistributed earnings (deficit). Reference 1: http://www.xbrl.org/2003/role/exampleRef
-Topic 852
-SubTopic 10
-Name Accounting Standards Codification
-Section 55
-Paragraph 10
-Publisher FASB
-URI https://asc.fasb.org//1943274/2147481372/852-10-55-10
Reference 2: http://www.xbrl.org/2003/role/disclosureRef
-Topic 944
-SubTopic 40
-Name Accounting Standards Codification
-Section 65
-Paragraph 2
-Subparagraph (g)(2)(i)
-Publisher FASB
-URI https://asc.fasb.org//1943274/2147480016/944-40-65-2
Reference 3: http://www.xbrl.org/2003/role/disclosureRef
-Topic 944
-SubTopic 40
-Name Accounting Standards Codification
-Section 65
-Paragraph 2
-Subparagraph (h)(2)
-Publisher FASB
-URI https://asc.fasb.org//1943274/2147480016/944-40-65-2
Reference 4: http://www.xbrl.org/2003/role/disclosureRef
-Topic 946
-SubTopic 20
-Name Accounting Standards Codification
-Section 50
-Paragraph 11
-Publisher FASB
-URI https://asc.fasb.org//1943274/2147480990/946-20-50-11
Reference 5: http://www.xbrl.org/2003/role/disclosureRef
-Topic 944
-SubTopic 210
-Name Accounting Standards Codification
-Section S99
-Paragraph 1
-Subparagraph (SX 210.7-03(a)(23)(a)(4))
-Publisher FASB
-URI https://asc.fasb.org//1943274/2147479440/944-210-S99-1
Reference 6: http://www.xbrl.org/2003/role/disclosureRef
-Topic 946
-SubTopic 210
-Name Accounting Standards Codification
-Section S99
-Paragraph 1
-Subparagraph (SX 210.6-04(17))
-Publisher FASB
-URI https://asc.fasb.org//1943274/2147479617/946-210-S99-1
Reference 7: http://fasb.org/us-gaap/role/ref/legacyRef
-Topic 505
-SubTopic 10
-Name Accounting Standards Codification
-Section S99
-Paragraph 1
-Subparagraph (SX 210.3-04)
-Publisher FASB
-URI https://asc.fasb.org//1943274/2147480008/505-10-S99-1
Reference 8: http://fasb.org/us-gaap/role/ref/legacyRef
-Topic 210
-SubTopic 10
-Name Accounting Standards Codification
-Section S99
-Paragraph 1
-Subparagraph (SX 210.5-02(30)(a)(3))
-Publisher FASB
-URI https://asc.fasb.org//1943274/2147480566/210-10-S99-1
| Name: |
us-gaap_RetainedEarningsAccumulatedDeficit |
| Namespace Prefix: |
us-gaap_ |
| Data Type: |
xbrli:monetaryItemType |
| Balance Type: |
credit |
| Period Type: |
instant |
|
| X |
- DefinitionAmount of equity (deficit) attributable to parent. Excludes temporary equity and equity attributable to noncontrolling interest. Reference 1: http://www.xbrl.org/2003/role/exampleRef
-Topic 852
-SubTopic 10
-Name Accounting Standards Codification
-Section 55
-Paragraph 10
-Publisher FASB
-URI https://asc.fasb.org//1943274/2147481372/852-10-55-10
Reference 2: http://www.xbrl.org/2003/role/exampleRef
-Topic 946
-SubTopic 830
-Name Accounting Standards Codification
-Section 55
-Paragraph 12
-Publisher FASB
-URI https://asc.fasb.org//1943274/2147480167/946-830-55-12
Reference 3: http://www.xbrl.org/2003/role/disclosureRef
-Topic 946
-SubTopic 210
-Name Accounting Standards Codification
-Section S99
-Paragraph 1
-Subparagraph (SX 210.6-04(19))
-Publisher FASB
-URI https://asc.fasb.org//1943274/2147479617/946-210-S99-1
Reference 4: http://www.xbrl.org/2003/role/disclosureRef
-Topic 946
-SubTopic 210
-Name Accounting Standards Codification
-Section S99
-Paragraph 2
-Subparagraph (SX 210.6-05(4))
-Publisher FASB
-URI https://asc.fasb.org//1943274/2147479617/946-210-S99-2
Reference 5: http://www.xbrl.org/2009/role/commonPracticeRef
-Topic 946
-SubTopic 220
-Name Accounting Standards Codification
-Section S99
-Paragraph 3
-Subparagraph (SX 210.6-09(4)(b))
-Publisher FASB
-URI https://asc.fasb.org//1943274/2147483575/946-220-S99-3
Reference 6: http://www.xbrl.org/2003/role/disclosureRef
-Topic 946
-SubTopic 220
-Name Accounting Standards Codification
-Section S99
-Paragraph 3
-Subparagraph (SX 210.6-09(6))
-Publisher FASB
-URI https://asc.fasb.org//1943274/2147483575/946-220-S99-3
Reference 7: http://www.xbrl.org/2003/role/disclosureRef
-Topic 946
-SubTopic 220
-Name Accounting Standards Codification
-Section S99
-Paragraph 3
-Subparagraph (SX 210.6-09(7))
-Publisher FASB
-URI https://asc.fasb.org//1943274/2147483575/946-220-S99-3
Reference 8: http://www.xbrl.org/2009/role/commonPracticeRef
-Topic 235
-SubTopic 10
-Name Accounting Standards Codification
-Section S99
-Paragraph 1
-Subparagraph (SX 210.4-08(g)(1)(ii))
-Publisher FASB
-URI https://asc.fasb.org//1943274/2147480678/235-10-S99-1
Reference 9: http://www.xbrl.org/2009/role/commonPracticeRef
-Topic 323
-SubTopic 10
-Name Accounting Standards Codification
-Section 50
-Paragraph 3
-Subparagraph (c)
-Publisher FASB
-URI https://asc.fasb.org//1943274/2147481687/323-10-50-3
Reference 10: http://www.xbrl.org/2009/role/commonPracticeRef
-Topic 825
-SubTopic 10
-Name Accounting Standards Codification
-Section 50
-Paragraph 28
-Subparagraph (f)
-Publisher FASB
-URI https://asc.fasb.org//1943274/2147482907/825-10-50-28
Reference 11: http://fasb.org/us-gaap/role/ref/legacyRef
-Topic 210
-SubTopic 10
-Name Accounting Standards Codification
-Section S99
-Paragraph 1
-Subparagraph (SX 210.5-02(29))
-Publisher FASB
-URI https://asc.fasb.org//1943274/2147480566/210-10-S99-1
Reference 12: http://fasb.org/us-gaap/role/ref/legacyRef
-Topic 210
-SubTopic 10
-Name Accounting Standards Codification
-Section S99
-Paragraph 1
-Subparagraph (SX 210.5-02(31))
-Publisher FASB
-URI https://asc.fasb.org//1943274/2147480566/210-10-S99-1
Reference 13: http://fasb.org/us-gaap/role/ref/legacyRef
-Topic 210
-SubTopic 10
-Name Accounting Standards Codification
-Section S99
-Paragraph 1
-Subparagraph (SX 210.5-02(30))
-Publisher FASB
-URI https://asc.fasb.org//1943274/2147480566/210-10-S99-1
Reference 14: http://fasb.org/us-gaap/role/ref/legacyRef
-Topic 310
-SubTopic 10
-Name Accounting Standards Codification
-Section S99
-Paragraph 2
-Subparagraph (SAB Topic 4.E)
-Publisher FASB
-URI https://asc.fasb.org//1943274/2147480418/310-10-S99-2
| Name: |
us-gaap_StockholdersEquity |
| Namespace Prefix: |
us-gaap_ |
| Data Type: |
xbrli:monetaryItemType |
| Balance Type: |
credit |
| Period Type: |
instant |
|
| X |
- References
+ Details
| Name: |
us-gaap_StockholdersEquityAbstract |
| Namespace Prefix: |
us-gaap_ |
| Data Type: |
xbrli:stringItemType |
| Balance Type: |
na |
| Period Type: |
duration |
|
v3.24.1
CONSOLIDATED BALANCE SHEETS (Parenthetical) - $ / shares
|
Dec. 31, 2023 |
Dec. 31, 2022 |
| CONSOLIDATED BALANCE SHEETS |
|
|
| Common Stock, Par Value |
$ 0.01
|
$ 0.01
|
| Common Stock, Shares Authorized |
5,714,000
|
5,714,000
|
| Common Stock, Shares Issued |
1,743,000
|
1,797,000
|
| Common Stock, Shares Outstanding |
1,743,000
|
1,797,000
|
| X |
- DefinitionFace amount or stated value per share of common stock. Reference 1: http://fasb.org/us-gaap/role/ref/legacyRef
-Topic 210
-SubTopic 10
-Name Accounting Standards Codification
-Section S99
-Paragraph 1
-Subparagraph (SX 210.5-02(29))
-Publisher FASB
-URI https://asc.fasb.org//1943274/2147480566/210-10-S99-1
| Name: |
us-gaap_CommonStockParOrStatedValuePerShare |
| Namespace Prefix: |
us-gaap_ |
| Data Type: |
dtr-types:perShareItemType |
| Balance Type: |
na |
| Period Type: |
instant |
|
| X |
- DefinitionThe maximum number of common shares permitted to be issued by an entity's charter and bylaws. Reference 1: http://www.xbrl.org/2003/role/disclosureRef
-Topic 946
-SubTopic 210
-Name Accounting Standards Codification
-Section S99
-Paragraph 1
-Subparagraph (SX 210.6-04(16)(a))
-Publisher FASB
-URI https://asc.fasb.org//1943274/2147479617/946-210-S99-1
Reference 2: http://fasb.org/us-gaap/role/ref/legacyRef
-Topic 210
-SubTopic 10
-Name Accounting Standards Codification
-Section S99
-Paragraph 1
-Subparagraph (SX 210.5-02(29))
-Publisher FASB
-URI https://asc.fasb.org//1943274/2147480566/210-10-S99-1
| Name: |
us-gaap_CommonStockSharesAuthorized |
| Namespace Prefix: |
us-gaap_ |
| Data Type: |
xbrli:sharesItemType |
| Balance Type: |
na |
| Period Type: |
instant |
|
| X |
- DefinitionTotal number of common shares of an entity that have been sold or granted to shareholders (includes common shares that were issued, repurchased and remain in the treasury). These shares represent capital invested by the firm's shareholders and owners, and may be all or only a portion of the number of shares authorized. Shares issued include shares outstanding and shares held in the treasury. Reference 1: http://fasb.org/us-gaap/role/ref/legacyRef
-Topic 210
-SubTopic 10
-Name Accounting Standards Codification
-Section S99
-Paragraph 1
-Subparagraph (SX 210.5-02(29))
-Publisher FASB
-URI https://asc.fasb.org//1943274/2147480566/210-10-S99-1
| Name: |
us-gaap_CommonStockSharesIssued |
| Namespace Prefix: |
us-gaap_ |
| Data Type: |
xbrli:sharesItemType |
| Balance Type: |
na |
| Period Type: |
instant |
|
| X |
- DefinitionNumber of shares of common stock outstanding. Common stock represent the ownership interest in a corporation. Reference 1: http://fasb.org/us-gaap/role/ref/legacyRef
-Name Accounting Standards Codification
-Section 50
-Paragraph 2
-SubTopic 10
-Topic 505
-Publisher FASB
-URI https://asc.fasb.org//1943274/2147481112/505-10-50-2
Reference 2: http://www.xbrl.org/2003/role/disclosureRef
-Topic 946
-SubTopic 210
-Name Accounting Standards Codification
-Section S99
-Paragraph 2
-Subparagraph (SX 210.6-05(4))
-Publisher FASB
-URI https://asc.fasb.org//1943274/2147479617/946-210-S99-2
Reference 3: http://www.xbrl.org/2009/role/commonPracticeRef
-Topic 946
-SubTopic 220
-Name Accounting Standards Codification
-Section S99
-Paragraph 3
-Subparagraph (SX 210.6-09(4)(b))
-Publisher FASB
-URI https://asc.fasb.org//1943274/2147483575/946-220-S99-3
Reference 4: http://www.xbrl.org/2003/role/disclosureRef
-Topic 946
-SubTopic 210
-Name Accounting Standards Codification
-Section S99
-Paragraph 1
-Subparagraph (SX 210.6-04(16)(a))
-Publisher FASB
-URI https://asc.fasb.org//1943274/2147479617/946-210-S99-1
Reference 5: http://www.xbrl.org/2009/role/commonPracticeRef
-Topic 946
-SubTopic 220
-Name Accounting Standards Codification
-Section S99
-Paragraph 3
-Subparagraph (SX 210.6-09(7))
-Publisher FASB
-URI https://asc.fasb.org//1943274/2147483575/946-220-S99-3
Reference 6: http://fasb.org/us-gaap/role/ref/legacyRef
-Topic 210
-SubTopic 10
-Name Accounting Standards Codification
-Section S99
-Paragraph 1
-Subparagraph (SX 210.5-02(29))
-Publisher FASB
-URI https://asc.fasb.org//1943274/2147480566/210-10-S99-1
| Name: |
us-gaap_CommonStockSharesOutstanding |
| Namespace Prefix: |
us-gaap_ |
| Data Type: |
xbrli:sharesItemType |
| Balance Type: |
na |
| Period Type: |
instant |
|
| X |
- References
+ Details
| Name: |
us-gaap_StatementOfFinancialPositionAbstract |
| Namespace Prefix: |
us-gaap_ |
| Data Type: |
xbrli:stringItemType |
| Balance Type: |
na |
| Period Type: |
duration |
|
v3.24.1
CONSOLIDATED STATEMENTS OF OPERATIONS - USD ($)
|
12 Months Ended |
Dec. 31, 2023 |
Dec. 31, 2022 |
| Operating Expenses: |
|
|
| Sales and marketing |
$ 196,000
|
$ 0
|
| General and administrative |
3,323,000
|
2,442,000
|
| Total Operating Expenses |
3,519,000
|
2,442,000
|
| Operating Loss |
(3,519,000)
|
(2,442,000)
|
| Interest income |
518,000
|
154,000
|
| Loss from continuing operations before income taxes |
(3,001,000)
|
(2,288,000)
|
| Income tax expense |
20,000
|
6,000
|
| Net loss from continuing operations |
(3,021,000)
|
(2,294,000)
|
| Income from discontinued operations, net of tax |
2,474,000
|
12,340,000
|
| Gain from sale of discontinued operations, net of tax |
2,961,000
|
0
|
| Net Income |
$ 2,414,000
|
$ 10,046,000
|
| Net income (loss) per basic and diluted share: |
|
|
| Continuing operations |
$ (1.70)
|
$ (1.28)
|
| Discontinued operations |
3.06
|
6.89
|
| Basic and diluted earnings per share |
$ 1.36
|
$ 5.61
|
| Shares used in calculation of net income (loss) per share: |
|
|
| Basic and diluted |
1,781,000
|
1,791,000
|
| X |
- References
+ Details
| Name: |
ldwy_EarningPerShareBasicAndDiluted |
| Namespace Prefix: |
ldwy_ |
| Data Type: |
num:perShareItemType |
| Balance Type: |
na |
| Period Type: |
duration |
|
| X |
- References
+ Details
| Name: |
ldwy_IncomeLossFromContinuingOperationPerBasicAndDilutedShare |
| Namespace Prefix: |
ldwy_ |
| Data Type: |
num:perShareItemType |
| Balance Type: |
na |
| Period Type: |
duration |
|
| X |
- References
+ Details
| Name: |
ldwy_IncomeLossFromDiscontinuedOperationNetOfTaxPerBasicAndDilutedShare |
| Namespace Prefix: |
ldwy_ |
| Data Type: |
num:perShareItemType |
| Balance Type: |
na |
| Period Type: |
duration |
|
| X |
- References
+ Details
| Name: |
ldwy_NetIncomeLossPerBasicAndDilutedShareNewAbstract |
| Namespace Prefix: |
ldwy_ |
| Data Type: |
xbrli:stringItemType |
| Balance Type: |
na |
| Period Type: |
duration |
|
| X |
- References
+ Details
| Name: |
ldwy_WeightedAverageNumberOfShareOutstandingBasicAndDiluted1 |
| Namespace Prefix: |
ldwy_ |
| Data Type: |
xbrli:sharesItemType |
| Balance Type: |
na |
| Period Type: |
duration |
|
| X |
- DefinitionAmount after tax of (gain) loss recognized for the (reversal of write-down) write-down to fair value, less cost to sell, of a discontinued operation. Reference 1: http://fasb.org/us-gaap/role/ref/legacyRef
-Topic 205
-SubTopic 20
-Name Accounting Standards Codification
-Section 50
-Paragraph 5C
-Subparagraph (b)(2)
-Publisher FASB
-URI https://asc.fasb.org//1943274/2147483499/205-20-50-5C
Reference 2: http://fasb.org/us-gaap/role/ref/legacyRef
-Topic 205
-SubTopic 20
-Name Accounting Standards Codification
-Section 45
-Paragraph 3B
-Publisher FASB
-URI https://asc.fasb.org//1943274/2147483475/205-20-45-3B
Reference 3: http://fasb.org/us-gaap/role/ref/legacyRef
-Topic 205
-SubTopic 20
-Name Accounting Standards Codification
-Section 50
-Paragraph 1
-Subparagraph (b)
-Publisher FASB
-URI https://asc.fasb.org//1943274/2147483499/205-20-50-1
Reference 4: http://fasb.org/us-gaap/role/ref/legacyRef
-Topic 205
-SubTopic 20
-Name Accounting Standards Codification
-Section 45
-Paragraph 3
-Publisher FASB
-URI https://asc.fasb.org//1943274/2147483475/205-20-45-3
| Name: |
us-gaap_DiscontinuedOperationProvisionForLossGainOnDisposalNetOfTax |
| Namespace Prefix: |
us-gaap_ |
| Data Type: |
xbrli:monetaryItemType |
| Balance Type: |
debit |
| Period Type: |
duration |
|
| X |
- DefinitionThe aggregate total of expenses of managing and administering the affairs of an entity, including affiliates of the reporting entity, which are not directly or indirectly associated with the manufacture, sale or creation of a product or product line. Reference 1: http://www.xbrl.org/2003/role/disclosureRef
-Topic 946
-SubTopic 220
-Name Accounting Standards Codification
-Section S99
-Paragraph 1
-Subparagraph (SX 210.6-07(2)(a))
-Publisher FASB
-URI https://asc.fasb.org//1943274/2147483575/946-220-S99-1
Reference 2: http://fasb.org/us-gaap/role/ref/legacyRef
-Topic 220
-SubTopic 10
-Name Accounting Standards Codification
-Section S99
-Paragraph 2
-Subparagraph (SX 210.5-03.4)
-Publisher FASB
-URI https://asc.fasb.org//1943274/2147483621/220-10-S99-2
| Name: |
us-gaap_GeneralAndAdministrativeExpense |
| Namespace Prefix: |
us-gaap_ |
| Data Type: |
xbrli:monetaryItemType |
| Balance Type: |
debit |
| Period Type: |
duration |
|
| X |
- DefinitionAmount after tax of income (loss) from continuing operations including portion attributable to the noncontrolling interest. Reference 1: http://fasb.org/us-gaap/role/ref/legacyRef
-Topic 810
-SubTopic 10
-Name Accounting Standards Codification
-Section 45
-Paragraph 19
-Publisher FASB
-URI https://asc.fasb.org//1943274/2147481231/810-10-45-19
Reference 2: http://www.xbrl.org/2003/role/disclosureRef
-Topic 235
-SubTopic 10
-Name Accounting Standards Codification
-Section S99
-Paragraph 1
-Subparagraph (SX 210.4-08(g)(1)(ii))
-Publisher FASB
-URI https://asc.fasb.org//1943274/2147480678/235-10-S99-1
Reference 3: http://www.xbrl.org/2003/role/disclosureRef
-Topic 323
-SubTopic 10
-Name Accounting Standards Codification
-Section 50
-Paragraph 3
-Subparagraph (c)
-Publisher FASB
-URI https://asc.fasb.org//1943274/2147481687/323-10-50-3
Reference 4: http://www.xbrl.org/2003/role/disclosureRef
-Topic 825
-SubTopic 10
-Name Accounting Standards Codification
-Section 50
-Paragraph 28
-Subparagraph (f)
-Publisher FASB
-URI https://asc.fasb.org//1943274/2147482907/825-10-50-28
Reference 5: http://www.xbrl.org/2003/role/disclosureRef
-Topic 250
-SubTopic 10
-Name Accounting Standards Codification
-Section 50
-Paragraph 1
-Subparagraph (b)(2)
-Publisher FASB
-URI https://asc.fasb.org//1943274/2147483443/250-10-50-1
Reference 6: http://www.xbrl.org/2003/role/disclosureRef
-Topic 815
-SubTopic 40
-Name Accounting Standards Codification
-Section 65
-Paragraph 1
-Subparagraph (f)
-Publisher FASB
-URI https://asc.fasb.org//1943274/2147480175/815-40-65-1
Reference 7: http://www.xbrl.org/2003/role/disclosureRef
-Topic 944
-SubTopic 220
-Name Accounting Standards Codification
-Section S99
-Paragraph 1
-Subparagraph (SX 210.7-04(11))
-Publisher FASB
-URI https://asc.fasb.org//1943274/2147483586/944-220-S99-1
Reference 8: http://www.xbrl.org/2003/role/disclosureRef
-Topic 280
-SubTopic 10
-Name Accounting Standards Codification
-Section 50
-Paragraph 22
-Publisher FASB
-URI https://asc.fasb.org//1943274/2147482810/280-10-50-22
Reference 9: http://www.xbrl.org/2003/role/disclosureRef
-Topic 470
-SubTopic 10
-Name Accounting Standards Codification
-Section S99
-Paragraph 1A
-Subparagraph (SX 210.13-01(a)(4)(i))
-Publisher FASB
-URI https://asc.fasb.org//1943274/2147480097/470-10-S99-1A
Reference 10: http://www.xbrl.org/2009/role/commonPracticeRef
-Topic 470
-SubTopic 10
-Name Accounting Standards Codification
-Section S99
-Paragraph 1A
-Subparagraph (SX 210.13-01(a)(4)(ii))
-Publisher FASB
-URI https://asc.fasb.org//1943274/2147480097/470-10-S99-1A
Reference 11: http://www.xbrl.org/2003/role/disclosureRef
-Topic 470
-SubTopic 10
-Name Accounting Standards Codification
-Section S99
-Paragraph 1A
-Subparagraph (SX 210.13-01(a)(4)(iii)(A))
-Publisher FASB
-URI https://asc.fasb.org//1943274/2147480097/470-10-S99-1A
Reference 12: http://www.xbrl.org/2003/role/disclosureRef
-Topic 470
-SubTopic 10
-Name Accounting Standards Codification
-Section S99
-Paragraph 1A
-Subparagraph (SX 210.13-01(a)(4)(iv))
-Publisher FASB
-URI https://asc.fasb.org//1943274/2147480097/470-10-S99-1A
Reference 13: http://www.xbrl.org/2003/role/disclosureRef
-Topic 470
-SubTopic 10
-Name Accounting Standards Codification
-Section S99
-Paragraph 1A
-Subparagraph (SX 210.13-01(a)(5))
-Publisher FASB
-URI https://asc.fasb.org//1943274/2147480097/470-10-S99-1A
Reference 14: http://www.xbrl.org/2003/role/disclosureRef
-Topic 470
-SubTopic 10
-Name Accounting Standards Codification
-Section S99
-Paragraph 1B
-Subparagraph (SX 210.13-02(a)(4)(i))
-Publisher FASB
-URI https://asc.fasb.org//1943274/2147480097/470-10-S99-1B
Reference 15: http://www.xbrl.org/2003/role/disclosureRef
-Topic 470
-SubTopic 10
-Name Accounting Standards Codification
-Section S99
-Paragraph 1B
-Subparagraph (SX 210.13-02(a)(4)(iii)(A))
-Publisher FASB
-URI https://asc.fasb.org//1943274/2147480097/470-10-S99-1B
Reference 16: http://www.xbrl.org/2003/role/disclosureRef
-Topic 470
-SubTopic 10
-Name Accounting Standards Codification
-Section S99
-Paragraph 1B
-Subparagraph (SX 210.13-02(a)(4)(iii)(B))
-Publisher FASB
-URI https://asc.fasb.org//1943274/2147480097/470-10-S99-1B
Reference 17: http://www.xbrl.org/2003/role/disclosureRef
-Topic 470
-SubTopic 10
-Name Accounting Standards Codification
-Section S99
-Paragraph 1B
-Subparagraph (SX 210.13-02(a)(4)(iv))
-Publisher FASB
-URI https://asc.fasb.org//1943274/2147480097/470-10-S99-1B
Reference 18: http://www.xbrl.org/2003/role/disclosureRef
-Topic 470
-SubTopic 10
-Name Accounting Standards Codification
-Section S99
-Paragraph 1B
-Subparagraph (SX 210.13-02(a)(5))
-Publisher FASB
-URI https://asc.fasb.org//1943274/2147480097/470-10-S99-1B
Reference 19: http://www.xbrl.org/2003/role/disclosureRef
-Topic 280
-SubTopic 10
-Name Accounting Standards Codification
-Section 50
-Paragraph 30
-Subparagraph (b)
-Publisher FASB
-URI https://asc.fasb.org//1943274/2147482810/280-10-50-30
Reference 20: http://www.xbrl.org/2003/role/disclosureRef
-Topic 280
-SubTopic 10
-Name Accounting Standards Codification
-Section 50
-Paragraph 32
-Subparagraph (f)
-Publisher FASB
-URI https://asc.fasb.org//1943274/2147482810/280-10-50-32
Reference 21: http://www.xbrl.org/2003/role/exampleRef
-Topic 280
-SubTopic 10
-Name Accounting Standards Codification
-Section 50
-Paragraph 31
-Publisher FASB
-URI https://asc.fasb.org//1943274/2147482810/280-10-50-31
Reference 22: http://www.xbrl.org/2003/role/disclosureRef
-Topic 280
-SubTopic 10
-Name Accounting Standards Codification
-Section 50
-Paragraph 32
-Subparagraph (c)
-Publisher FASB
-URI https://asc.fasb.org//1943274/2147482810/280-10-50-32
| Name: |
us-gaap_IncomeLossFromContinuingOperationsIncludingPortionAttributableToNoncontrollingInterest |
| Namespace Prefix: |
us-gaap_ |
| Data Type: |
xbrli:monetaryItemType |
| Balance Type: |
credit |
| Period Type: |
duration |
|
| X |
- DefinitionAmount after tax of income (loss) from a discontinued operation including the portion attributable to the noncontrolling interest. Includes, but is not limited to, the income (loss) from operations during the phase-out period, gain (loss) on disposal, gain (loss) for reversal of write-down (write-down) to fair value, less cost to sell, and adjustments to a prior period gain (loss) on disposal. Reference 1: http://www.xbrl.org/2003/role/disclosureRef
-Topic 944
-SubTopic 220
-Name Accounting Standards Codification
-Section S99
-Paragraph 1
-Subparagraph (SX 210.7-04(12))
-Publisher FASB
-URI https://asc.fasb.org//1943274/2147483586/944-220-S99-1
Reference 2: http://www.xbrl.org/2003/role/disclosureRef
-Topic 740
-SubTopic 270
-Name Accounting Standards Codification
-Section 45
-Paragraph 3
-Publisher FASB
-URI https://asc.fasb.org//1943274/2147482551/740-270-45-3
Reference 3: http://www.xbrl.org/2003/role/disclosureRef
-Topic 205
-SubTopic 20
-Name Accounting Standards Codification
-Section 50
-Paragraph 7
-Publisher FASB
-URI https://asc.fasb.org//1943274/2147483499/205-20-50-7
Reference 4: http://fasb.org/us-gaap/role/ref/legacyRef
-Topic 205
-SubTopic 20
-Name Accounting Standards Codification
-Section 45
-Paragraph 3A
-Publisher FASB
-URI https://asc.fasb.org//1943274/2147483475/205-20-45-3A
Reference 5: http://fasb.org/us-gaap/role/ref/legacyRef
-Topic 205
-SubTopic 20
-Name Accounting Standards Codification
-Section 50
-Paragraph 5C
-Subparagraph (b)(2)
-Publisher FASB
-URI https://asc.fasb.org//1943274/2147483499/205-20-50-5C
Reference 6: http://fasb.org/us-gaap/role/ref/legacyRef
-Topic 205
-SubTopic 20
-Name Accounting Standards Codification
-Section 45
-Paragraph 3B
-Publisher FASB
-URI https://asc.fasb.org//1943274/2147483475/205-20-45-3B
Reference 7: http://fasb.org/us-gaap/role/ref/legacyRef
-Topic 205
-SubTopic 20
-Name Accounting Standards Codification
-Section 45
-Paragraph 4
-Publisher FASB
-URI https://asc.fasb.org//1943274/2147483475/205-20-45-4
Reference 8: http://fasb.org/us-gaap/role/ref/legacyRef
-Topic 205
-SubTopic 20
-Name Accounting Standards Codification
-Section 50
-Paragraph 1
-Subparagraph (b)
-Publisher FASB
-URI https://asc.fasb.org//1943274/2147483499/205-20-50-1
Reference 9: http://fasb.org/us-gaap/role/ref/legacyRef
-Topic 205
-SubTopic 20
-Name Accounting Standards Codification
-Section 45
-Paragraph 3
-Publisher FASB
-URI https://asc.fasb.org//1943274/2147483475/205-20-45-3
| Name: |
us-gaap_IncomeLossFromDiscontinuedOperationsNetOfTax |
| Namespace Prefix: |
us-gaap_ |
| Data Type: |
xbrli:monetaryItemType |
| Balance Type: |
credit |
| Period Type: |
duration |
|
| X |
- DefinitionAmount of interest income earned from interest bearing assets classified as other.
| Name: |
us-gaap_InterestIncomeOther |
| Namespace Prefix: |
us-gaap_ |
| Data Type: |
xbrli:monetaryItemType |
| Balance Type: |
credit |
| Period Type: |
duration |
|
| X |
- DefinitionGenerally recurring costs associated with normal operations except for the portion of these expenses which can be clearly related to production and included in cost of sales or services. Includes selling, general and administrative expense.
| Name: |
us-gaap_OperatingExpenses |
| Namespace Prefix: |
us-gaap_ |
| Data Type: |
xbrli:monetaryItemType |
| Balance Type: |
debit |
| Period Type: |
duration |
|
| X |
- References
+ Details
| Name: |
us-gaap_OperatingExpensesAbstract |
| Namespace Prefix: |
us-gaap_ |
| Data Type: |
xbrli:stringItemType |
| Balance Type: |
na |
| Period Type: |
duration |
|
| X |
- DefinitionThe net result for the period of deducting operating expenses from operating revenues. Reference 1: http://www.xbrl.org/2003/role/disclosureRef
-Topic 280
-SubTopic 10
-Name Accounting Standards Codification
-Section 50
-Paragraph 22
-Publisher FASB
-URI https://asc.fasb.org//1943274/2147482810/280-10-50-22
Reference 2: http://www.xbrl.org/2003/role/disclosureRef
-Topic 280
-SubTopic 10
-Name Accounting Standards Codification
-Section 50
-Paragraph 30
-Subparagraph (b)
-Publisher FASB
-URI https://asc.fasb.org//1943274/2147482810/280-10-50-30
Reference 3: http://www.xbrl.org/2003/role/disclosureRef
-Topic 280
-SubTopic 10
-Name Accounting Standards Codification
-Section 50
-Paragraph 32
-Subparagraph (f)
-Publisher FASB
-URI https://asc.fasb.org//1943274/2147482810/280-10-50-32
Reference 4: http://www.xbrl.org/2003/role/exampleRef
-Topic 280
-SubTopic 10
-Name Accounting Standards Codification
-Section 50
-Paragraph 31
-Publisher FASB
-URI https://asc.fasb.org//1943274/2147482810/280-10-50-31
Reference 5: http://www.xbrl.org/2003/role/disclosureRef
-Topic 280
-SubTopic 10
-Name Accounting Standards Codification
-Section 50
-Paragraph 32
-Subparagraph (c)
-Publisher FASB
-URI https://asc.fasb.org//1943274/2147482810/280-10-50-32
| Name: |
us-gaap_OperatingIncomeLoss |
| Namespace Prefix: |
us-gaap_ |
| Data Type: |
xbrli:monetaryItemType |
| Balance Type: |
credit |
| Period Type: |
duration |
|
| X |
- DefinitionThe consolidated profit or loss for the period, net of income taxes, including the portion attributable to the noncontrolling interest. Reference 1: http://www.xbrl.org/2003/role/disclosureRef
-Topic 235
-SubTopic 10
-Name Accounting Standards Codification
-Section S99
-Paragraph 1
-Subparagraph (SX 210.4-08(g)(1)(ii))
-Publisher FASB
-URI https://asc.fasb.org//1943274/2147480678/235-10-S99-1
Reference 2: http://www.xbrl.org/2003/role/disclosureRef
-Topic 323
-SubTopic 10
-Name Accounting Standards Codification
-Section 50
-Paragraph 3
-Subparagraph (c)
-Publisher FASB
-URI https://asc.fasb.org//1943274/2147481687/323-10-50-3
Reference 3: http://www.xbrl.org/2003/role/disclosureRef
-Topic 825
-SubTopic 10
-Name Accounting Standards Codification
-Section 50
-Paragraph 28
-Subparagraph (f)
-Publisher FASB
-URI https://asc.fasb.org//1943274/2147482907/825-10-50-28
Reference 4: http://www.xbrl.org/2003/role/disclosureRef
-Topic 250
-SubTopic 10
-Name Accounting Standards Codification
-Section 50
-Paragraph 1
-Subparagraph (b)(2)
-Publisher FASB
-URI https://asc.fasb.org//1943274/2147483443/250-10-50-1
Reference 5: http://www.xbrl.org/2003/role/disclosureRef
-Topic 815
-SubTopic 40
-Name Accounting Standards Codification
-Section 65
-Paragraph 1
-Subparagraph (f)
-Publisher FASB
-URI https://asc.fasb.org//1943274/2147480175/815-40-65-1
Reference 6: http://www.xbrl.org/2003/role/disclosureRef
-Topic 250
-SubTopic 10
-Name Accounting Standards Codification
-Section 50
-Paragraph 8
-Publisher FASB
-URI https://asc.fasb.org//1943274/2147483443/250-10-50-8
Reference 7: http://www.xbrl.org/2003/role/disclosureRef
-Topic 250
-SubTopic 10
-Name Accounting Standards Codification
-Section 50
-Paragraph 9
-Publisher FASB
-URI https://asc.fasb.org//1943274/2147483443/250-10-50-9
Reference 8: http://www.xbrl.org/2003/role/exampleRef
-Topic 946
-SubTopic 830
-Name Accounting Standards Codification
-Section 55
-Paragraph 11
-Publisher FASB
-URI https://asc.fasb.org//1943274/2147480167/946-830-55-11
Reference 9: http://www.xbrl.org/2003/role/disclosureRef
-Topic 946
-SubTopic 205
-Name Accounting Standards Codification
-Section 45
-Paragraph 3
-Subparagraph (a)
-Publisher FASB
-URI https://asc.fasb.org//1943274/2147480767/946-205-45-3
Reference 10: http://www.xbrl.org/2003/role/disclosureRef
-Topic 946
-SubTopic 220
-Name Accounting Standards Codification
-Section 45
-Paragraph 7
-Publisher FASB
-URI https://asc.fasb.org//1943274/2147483581/946-220-45-7
Reference 11: http://www.xbrl.org/2003/role/disclosureRef
-Topic 944
-SubTopic 220
-Name Accounting Standards Codification
-Section S99
-Paragraph 1
-Subparagraph (SX 210.7-04(16))
-Publisher FASB
-URI https://asc.fasb.org//1943274/2147483586/944-220-S99-1
Reference 12: http://www.xbrl.org/2003/role/disclosureRef
-Topic 280
-SubTopic 10
-Name Accounting Standards Codification
-Section 50
-Paragraph 22
-Publisher FASB
-URI https://asc.fasb.org//1943274/2147482810/280-10-50-22
Reference 13: http://www.xbrl.org/2003/role/disclosureRef
-Topic 946
-SubTopic 220
-Name Accounting Standards Codification
-Section S99
-Paragraph 1
-Subparagraph (SX 210.6-07(9))
-Publisher FASB
-URI https://asc.fasb.org//1943274/2147483575/946-220-S99-1
Reference 14: http://www.xbrl.org/2003/role/disclosureRef
-Topic 946
-SubTopic 220
-Name Accounting Standards Codification
-Section S99
-Paragraph 3
-Subparagraph (SX 210.6-09(1)(d))
-Publisher FASB
-URI https://asc.fasb.org//1943274/2147483575/946-220-S99-3
Reference 15: http://www.xbrl.org/2003/role/disclosureRef
-Topic 810
-SubTopic 10
-Name Accounting Standards Codification
-Section 45
-Paragraph 19
-Publisher FASB
-URI https://asc.fasb.org//1943274/2147481231/810-10-45-19
Reference 16: http://www.xbrl.org/2009/role/commonPracticeRef
-Topic 220
-SubTopic 10
-Name Accounting Standards Codification
-Section 50
-Paragraph 6
-Publisher FASB
-URI https://asc.fasb.org//1943274/2147482765/220-10-50-6
Reference 17: http://www.xbrl.org/2003/role/disclosureRef
-Topic 470
-SubTopic 10
-Name Accounting Standards Codification
-Section S99
-Paragraph 1A
-Subparagraph (SX 210.13-01(a)(4)(i))
-Publisher FASB
-URI https://asc.fasb.org//1943274/2147480097/470-10-S99-1A
Reference 18: http://www.xbrl.org/2009/role/commonPracticeRef
-Topic 470
-SubTopic 10
-Name Accounting Standards Codification
-Section S99
-Paragraph 1A
-Subparagraph (SX 210.13-01(a)(4)(ii))
-Publisher FASB
-URI https://asc.fasb.org//1943274/2147480097/470-10-S99-1A
Reference 19: http://www.xbrl.org/2003/role/disclosureRef
-Topic 470
-SubTopic 10
-Name Accounting Standards Codification
-Section S99
-Paragraph 1A
-Subparagraph (SX 210.13-01(a)(4)(iii)(A))
-Publisher FASB
-URI https://asc.fasb.org//1943274/2147480097/470-10-S99-1A
Reference 20: http://www.xbrl.org/2003/role/disclosureRef
-Topic 470
-SubTopic 10
-Name Accounting Standards Codification
-Section S99
-Paragraph 1A
-Subparagraph (SX 210.13-01(a)(4)(iv))
-Publisher FASB
-URI https://asc.fasb.org//1943274/2147480097/470-10-S99-1A
Reference 21: http://www.xbrl.org/2003/role/disclosureRef
-Topic 470
-SubTopic 10
-Name Accounting Standards Codification
-Section S99
-Paragraph 1A
-Subparagraph (SX 210.13-01(a)(5))
-Publisher FASB
-URI https://asc.fasb.org//1943274/2147480097/470-10-S99-1A
Reference 22: http://www.xbrl.org/2003/role/disclosureRef
-Topic 470
-SubTopic 10
-Name Accounting Standards Codification
-Section S99
-Paragraph 1B
-Subparagraph (SX 210.13-02(a)(4)(i))
-Publisher FASB
-URI https://asc.fasb.org//1943274/2147480097/470-10-S99-1B
Reference 23: http://www.xbrl.org/2003/role/disclosureRef
-Topic 470
-SubTopic 10
-Name Accounting Standards Codification
-Section S99
-Paragraph 1B
-Subparagraph (SX 210.13-02(a)(4)(iii)(A))
-Publisher FASB
-URI https://asc.fasb.org//1943274/2147480097/470-10-S99-1B
Reference 24: http://www.xbrl.org/2003/role/disclosureRef
-Topic 470
-SubTopic 10
-Name Accounting Standards Codification
-Section S99
-Paragraph 1B
-Subparagraph (SX 210.13-02(a)(4)(iii)(B))
-Publisher FASB
-URI https://asc.fasb.org//1943274/2147480097/470-10-S99-1B
Reference 25: http://www.xbrl.org/2003/role/disclosureRef
-Topic 470
-SubTopic 10
-Name Accounting Standards Codification
-Section S99
-Paragraph 1B
-Subparagraph (SX 210.13-02(a)(4)(iv))
-Publisher FASB
-URI https://asc.fasb.org//1943274/2147480097/470-10-S99-1B
Reference 26: http://www.xbrl.org/2003/role/disclosureRef
-Topic 470
-SubTopic 10
-Name Accounting Standards Codification
-Section S99
-Paragraph 1B
-Subparagraph (SX 210.13-02(a)(5))
-Publisher FASB
-URI https://asc.fasb.org//1943274/2147480097/470-10-S99-1B
Reference 27: http://www.xbrl.org/2003/role/disclosureRef
-Topic 280
-SubTopic 10
-Name Accounting Standards Codification
-Section 50
-Paragraph 30
-Subparagraph (b)
-Publisher FASB
-URI https://asc.fasb.org//1943274/2147482810/280-10-50-30
Reference 28: http://www.xbrl.org/2003/role/disclosureRef
-Topic 280
-SubTopic 10
-Name Accounting Standards Codification
-Section 50
-Paragraph 32
-Subparagraph (f)
-Publisher FASB
-URI https://asc.fasb.org//1943274/2147482810/280-10-50-32
Reference 29: http://www.xbrl.org/2003/role/exampleRef
-Topic 280
-SubTopic 10
-Name Accounting Standards Codification
-Section 50
-Paragraph 31
-Publisher FASB
-URI https://asc.fasb.org//1943274/2147482810/280-10-50-31
Reference 30: http://www.xbrl.org/2003/role/disclosureRef
-Topic 280
-SubTopic 10
-Name Accounting Standards Codification
-Section 50
-Paragraph 32
-Subparagraph (c)
-Publisher FASB
-URI https://asc.fasb.org//1943274/2147482810/280-10-50-32
Reference 31: http://www.xbrl.org/2003/role/disclosureRef
-Topic 942
-SubTopic 235
-Name Accounting Standards Codification
-Section S99
-Paragraph 1
-Subparagraph (SX 210.9-05(b)(2))
-Publisher FASB
-URI https://asc.fasb.org//1943274/2147479557/942-235-S99-1
Reference 32: http://www.xbrl.org/2003/role/disclosureRef
-Topic 205
-SubTopic 20
-Name Accounting Standards Codification
-Section 50
-Paragraph 7
-Publisher FASB
-URI https://asc.fasb.org//1943274/2147483499/205-20-50-7
Reference 33: http://www.xbrl.org/2003/role/exampleRef
-Topic 810
-SubTopic 10
-Name Accounting Standards Codification
-Section 55
-Paragraph 4J
-Publisher FASB
-URI https://asc.fasb.org//1943274/2147481175/810-10-55-4J
Reference 34: http://www.xbrl.org/2003/role/exampleRef
-Topic 810
-SubTopic 10
-Name Accounting Standards Codification
-Section 55
-Paragraph 4K
-Publisher FASB
-URI https://asc.fasb.org//1943274/2147481175/810-10-55-4K
Reference 35: http://www.xbrl.org/2003/role/disclosureRef
-Topic 220
-SubTopic 10
-Name Accounting Standards Codification
-Section 45
-Paragraph 1A
-Subparagraph (a)
-Publisher FASB
-URI https://asc.fasb.org//1943274/2147482790/220-10-45-1A
Reference 36: http://www.xbrl.org/2003/role/disclosureRef
-Topic 220
-SubTopic 10
-Name Accounting Standards Codification
-Section 45
-Paragraph 1B
-Subparagraph (a)
-Publisher FASB
-URI https://asc.fasb.org//1943274/2147482790/220-10-45-1B
Reference 37: http://www.xbrl.org/2003/role/disclosureRef
-Topic 230
-SubTopic 10
-Name Accounting Standards Codification
-Section 45
-Paragraph 2
-Publisher FASB
-URI https://asc.fasb.org//1943274/2147482740/230-10-45-2
Reference 38: http://www.xbrl.org/2003/role/disclosureRef
-Topic 810
-SubTopic 10
-Name Accounting Standards Codification
-Section 50
-Paragraph 1A
-Subparagraph (a)(1)
-Publisher FASB
-URI https://asc.fasb.org//1943274/2147481203/810-10-50-1A
Reference 39: http://www.xbrl.org/2003/role/disclosureRef
-Topic 810
-SubTopic 10
-Name Accounting Standards Codification
-Section 50
-Paragraph 1A
-Subparagraph (c)(1)
-Publisher FASB
-URI https://asc.fasb.org//1943274/2147481203/810-10-50-1A
| Name: |
us-gaap_ProfitLoss |
| Namespace Prefix: |
us-gaap_ |
| Data Type: |
xbrli:monetaryItemType |
| Balance Type: |
credit |
| Period Type: |
duration |
|
| X |
- DefinitionThe aggregate total amount of expenses directly related to the marketing or selling of products or services.
| Name: |
us-gaap_SellingAndMarketingExpense |
| Namespace Prefix: |
us-gaap_ |
| Data Type: |
xbrli:monetaryItemType |
| Balance Type: |
debit |
| Period Type: |
duration |
|
| X |
- References
+ Details
| Name: |
us-gaap_WeightedAverageNumberOfSharesOutstandingAbstract |
| Namespace Prefix: |
us-gaap_ |
| Data Type: |
xbrli:stringItemType |
| Balance Type: |
na |
| Period Type: |
duration |
|
v3.24.1
CONSOLIDATED STATEMENTS OF STOCKHOLDERS' EQUITY - USD ($)
|
Total |
Common Stock |
Additional Paid-In Capital |
Accumulated Deficit |
| Balance, shares at Dec. 31, 2021 |
|
1,782,000
|
|
|
| Balance, amount at Dec. 31, 2021 |
$ 3,193,000
|
$ 18,000
|
$ 16,296,000
|
$ (13,121,000)
|
| Issuance of common stock, net, shares |
|
6,000
|
|
|
| Issuance of common stock, net, amount |
39,000
|
$ 0
|
39,000
|
0
|
| Issuance of common stock upon vesting of restricted stock units, shares |
|
9,000
|
|
|
| Issuance of common stock upon vesting of restricted stock units, amount |
0
|
$ 0
|
0
|
0
|
| Value of stock-based compensation |
123,000
|
0
|
123,000
|
0
|
| Net income |
10,046,000
|
$ 0
|
0
|
10,046,000
|
| Balance, shares at Dec. 31, 2022 |
|
1,797,000
|
|
|
| Balance, amount at Dec. 31, 2022 |
13,401,000
|
$ 18,000
|
16,458,000
|
(3,075,000)
|
| Issuance of common stock, net, shares |
|
24,000
|
|
|
| Issuance of common stock, net, amount |
155,000
|
$ 0
|
155,000
|
0
|
| Issuance of common stock upon vesting of restricted stock units, shares |
|
6,000
|
|
|
| Issuance of common stock upon vesting of restricted stock units, amount |
0
|
$ 0
|
0
|
0
|
| Value of stock-based compensation |
44,000
|
0
|
44,000
|
0
|
| Net income |
2,414,000
|
$ 0
|
0
|
2,414,000
|
| Repurchase of common stock, shares |
|
(84,000)
|
|
|
| Repurchase of common stock, amount |
(482,000)
|
$ (1,000)
|
(481,000)
|
0
|
| Balance, shares at Dec. 31, 2023 |
|
1,743,000
|
|
|
| Balance, amount at Dec. 31, 2023 |
$ 15,532,000
|
$ 17,000
|
$ 16,176,000
|
$ (661,000)
|
| X |
- References
+ Details
| Name: |
ldwy_IssuanceOfCommonStockUponVestingOfRestrictedStockUnitsAmount |
| Namespace Prefix: |
ldwy_ |
| Data Type: |
xbrli:monetaryItemType |
| Balance Type: |
credit |
| Period Type: |
duration |
|
| X |
- References
+ Details
| Name: |
ldwy_IssuanceOfCommonStockUponVestingOfRestrictedStockUnitsShares |
| Namespace Prefix: |
ldwy_ |
| Data Type: |
xbrli:sharesItemType |
| Balance Type: |
na |
| Period Type: |
duration |
|
| X |
- References
+ Details
| Name: |
ldwy_RepurchaseOfCommonStockAmount |
| Namespace Prefix: |
ldwy_ |
| Data Type: |
xbrli:monetaryItemType |
| Balance Type: |
credit |
| Period Type: |
duration |
|
| X |
- References
+ Details
| Name: |
ldwy_RepurchaseOfCommonStockShares |
| Namespace Prefix: |
ldwy_ |
| Data Type: |
xbrli:sharesItemType |
| Balance Type: |
na |
| Period Type: |
duration |
|
| X |
- References
+ Details
| Name: |
ldwy_ValueOfStockBasedCompensation |
| Namespace Prefix: |
ldwy_ |
| Data Type: |
xbrli:monetaryItemType |
| Balance Type: |
debit |
| Period Type: |
duration |
|
| X |
- DefinitionThe portion of profit or loss for the period, net of income taxes, which is attributable to the parent. Reference 1: http://www.xbrl.org/2003/role/disclosureRef
-Topic 235
-SubTopic 10
-Name Accounting Standards Codification
-Section S99
-Paragraph 1
-Subparagraph (SX 210.4-08(g)(1)(ii))
-Publisher FASB
-URI https://asc.fasb.org//1943274/2147480678/235-10-S99-1
Reference 2: http://www.xbrl.org/2003/role/disclosureRef
-Topic 323
-SubTopic 10
-Name Accounting Standards Codification
-Section 50
-Paragraph 3
-Subparagraph (c)
-Publisher FASB
-URI https://asc.fasb.org//1943274/2147481687/323-10-50-3
Reference 3: http://www.xbrl.org/2003/role/disclosureRef
-Topic 825
-SubTopic 10
-Name Accounting Standards Codification
-Section 50
-Paragraph 28
-Subparagraph (f)
-Publisher FASB
-URI https://asc.fasb.org//1943274/2147482907/825-10-50-28
Reference 4: http://www.xbrl.org/2003/role/disclosureRef
-Topic 220
-SubTopic 10
-Name Accounting Standards Codification
-Section 50
-Paragraph 6
-Publisher FASB
-URI https://asc.fasb.org//1943274/2147482765/220-10-50-6
Reference 5: http://www.xbrl.org/2003/role/disclosureRef
-Topic 250
-SubTopic 10
-Name Accounting Standards Codification
-Section 50
-Paragraph 3
-Publisher FASB
-URI https://asc.fasb.org//1943274/2147483443/250-10-50-3
Reference 6: http://www.xbrl.org/2003/role/disclosureRef
-Topic 250
-SubTopic 10
-Name Accounting Standards Codification
-Section 50
-Paragraph 1
-Subparagraph (b)(2)
-Publisher FASB
-URI https://asc.fasb.org//1943274/2147483443/250-10-50-1
Reference 7: http://www.xbrl.org/2003/role/disclosureRef
-Topic 815
-SubTopic 40
-Name Accounting Standards Codification
-Section 65
-Paragraph 1
-Subparagraph (f)
-Publisher FASB
-URI https://asc.fasb.org//1943274/2147480175/815-40-65-1
Reference 8: http://www.xbrl.org/2003/role/disclosureRef
-Topic 250
-SubTopic 10
-Name Accounting Standards Codification
-Section 50
-Paragraph 8
-Publisher FASB
-URI https://asc.fasb.org//1943274/2147483443/250-10-50-8
Reference 9: http://www.xbrl.org/2003/role/disclosureRef
-Topic 250
-SubTopic 10
-Name Accounting Standards Codification
-Section 50
-Paragraph 9
-Publisher FASB
-URI https://asc.fasb.org//1943274/2147483443/250-10-50-9
Reference 10: http://www.xbrl.org/2003/role/disclosureRef
-Topic 250
-SubTopic 10
-Name Accounting Standards Codification
-Section 50
-Paragraph 11
-Subparagraph (a)
-Publisher FASB
-URI https://asc.fasb.org//1943274/2147483443/250-10-50-11
Reference 11: http://www.xbrl.org/2003/role/disclosureRef
-Topic 250
-SubTopic 10
-Name Accounting Standards Codification
-Section 50
-Paragraph 11
-Subparagraph (b)
-Publisher FASB
-URI https://asc.fasb.org//1943274/2147483443/250-10-50-11
Reference 12: http://www.xbrl.org/2003/role/disclosureRef
-Topic 250
-SubTopic 10
-Name Accounting Standards Codification
-Section 50
-Paragraph 4
-Publisher FASB
-URI https://asc.fasb.org//1943274/2147483443/250-10-50-4
Reference 13: http://www.xbrl.org/2003/role/exampleRef
-Topic 946
-SubTopic 830
-Name Accounting Standards Codification
-Section 55
-Paragraph 10
-Publisher FASB
-URI https://asc.fasb.org//1943274/2147480167/946-830-55-10
Reference 14: http://www.xbrl.org/2003/role/disclosureRef
-Topic 946
-SubTopic 220
-Name Accounting Standards Codification
-Section 45
-Paragraph 7
-Publisher FASB
-URI https://asc.fasb.org//1943274/2147483581/946-220-45-7
Reference 15: http://www.xbrl.org/2003/role/disclosureRef
-Topic 944
-SubTopic 220
-Name Accounting Standards Codification
-Section S99
-Paragraph 1
-Subparagraph (SX 210.7-04(18))
-Publisher FASB
-URI https://asc.fasb.org//1943274/2147483586/944-220-S99-1
Reference 16: http://www.xbrl.org/2003/role/disclosureRef
-Topic 280
-SubTopic 10
-Name Accounting Standards Codification
-Section 50
-Paragraph 22
-Publisher FASB
-URI https://asc.fasb.org//1943274/2147482810/280-10-50-22
Reference 17: http://www.xbrl.org/2003/role/disclosureRef
-Topic 946
-SubTopic 220
-Name Accounting Standards Codification
-Section S99
-Paragraph 1
-Subparagraph (SX 210.6-07(9))
-Publisher FASB
-URI https://asc.fasb.org//1943274/2147483575/946-220-S99-1
Reference 18: http://www.xbrl.org/2003/role/disclosureRef
-Topic 946
-SubTopic 220
-Name Accounting Standards Codification
-Section S99
-Paragraph 3
-Subparagraph (SX 210.6-09(1)(d))
-Publisher FASB
-URI https://asc.fasb.org//1943274/2147483575/946-220-S99-3
Reference 19: http://www.xbrl.org/2003/role/disclosureRef
-Topic 470
-SubTopic 10
-Name Accounting Standards Codification
-Section S99
-Paragraph 1A
-Subparagraph (SX 210.13-01(a)(4)(i))
-Publisher FASB
-URI https://asc.fasb.org//1943274/2147480097/470-10-S99-1A
Reference 20: http://www.xbrl.org/2009/role/commonPracticeRef
-Topic 470
-SubTopic 10
-Name Accounting Standards Codification
-Section S99
-Paragraph 1A
-Subparagraph (SX 210.13-01(a)(4)(ii))
-Publisher FASB
-URI https://asc.fasb.org//1943274/2147480097/470-10-S99-1A
Reference 21: http://www.xbrl.org/2003/role/disclosureRef
-Topic 470
-SubTopic 10
-Name Accounting Standards Codification
-Section S99
-Paragraph 1A
-Subparagraph (SX 210.13-01(a)(4)(iii)(A))
-Publisher FASB
-URI https://asc.fasb.org//1943274/2147480097/470-10-S99-1A
Reference 22: http://www.xbrl.org/2003/role/disclosureRef
-Topic 470
-SubTopic 10
-Name Accounting Standards Codification
-Section S99
-Paragraph 1A
-Subparagraph (SX 210.13-01(a)(4)(iv))
-Publisher FASB
-URI https://asc.fasb.org//1943274/2147480097/470-10-S99-1A
Reference 23: http://www.xbrl.org/2003/role/disclosureRef
-Topic 470
-SubTopic 10
-Name Accounting Standards Codification
-Section S99
-Paragraph 1A
-Subparagraph (SX 210.13-01(a)(5))
-Publisher FASB
-URI https://asc.fasb.org//1943274/2147480097/470-10-S99-1A
Reference 24: http://www.xbrl.org/2003/role/disclosureRef
-Topic 470
-SubTopic 10
-Name Accounting Standards Codification
-Section S99
-Paragraph 1B
-Subparagraph (SX 210.13-02(a)(4)(i))
-Publisher FASB
-URI https://asc.fasb.org//1943274/2147480097/470-10-S99-1B
Reference 25: http://www.xbrl.org/2003/role/disclosureRef
-Topic 470
-SubTopic 10
-Name Accounting Standards Codification
-Section S99
-Paragraph 1B
-Subparagraph (SX 210.13-02(a)(4)(iii)(A))
-Publisher FASB
-URI https://asc.fasb.org//1943274/2147480097/470-10-S99-1B
Reference 26: http://www.xbrl.org/2003/role/disclosureRef
-Topic 470
-SubTopic 10
-Name Accounting Standards Codification
-Section S99
-Paragraph 1B
-Subparagraph (SX 210.13-02(a)(4)(iii)(B))
-Publisher FASB
-URI https://asc.fasb.org//1943274/2147480097/470-10-S99-1B
Reference 27: http://www.xbrl.org/2003/role/disclosureRef
-Topic 470
-SubTopic 10
-Name Accounting Standards Codification
-Section S99
-Paragraph 1B
-Subparagraph (SX 210.13-02(a)(4)(iv))
-Publisher FASB
-URI https://asc.fasb.org//1943274/2147480097/470-10-S99-1B
Reference 28: http://www.xbrl.org/2003/role/disclosureRef
-Topic 470
-SubTopic 10
-Name Accounting Standards Codification
-Section S99
-Paragraph 1B
-Subparagraph (SX 210.13-02(a)(5))
-Publisher FASB
-URI https://asc.fasb.org//1943274/2147480097/470-10-S99-1B
Reference 29: http://www.xbrl.org/2003/role/disclosureRef
-Topic 280
-SubTopic 10
-Name Accounting Standards Codification
-Section 50
-Paragraph 30
-Subparagraph (b)
-Publisher FASB
-URI https://asc.fasb.org//1943274/2147482810/280-10-50-30
Reference 30: http://www.xbrl.org/2003/role/disclosureRef
-Topic 280
-SubTopic 10
-Name Accounting Standards Codification
-Section 50
-Paragraph 32
-Subparagraph (f)
-Publisher FASB
-URI https://asc.fasb.org//1943274/2147482810/280-10-50-32
Reference 31: http://www.xbrl.org/2003/role/disclosureRef
-Topic 260
-SubTopic 10
-Name Accounting Standards Codification
-Section 45
-Paragraph 60B
-Subparagraph (a)
-Publisher FASB
-URI https://asc.fasb.org//1943274/2147482689/260-10-45-60B
Reference 32: http://www.xbrl.org/2003/role/exampleRef
-Topic 280
-SubTopic 10
-Name Accounting Standards Codification
-Section 50
-Paragraph 31
-Publisher FASB
-URI https://asc.fasb.org//1943274/2147482810/280-10-50-31
Reference 33: http://www.xbrl.org/2003/role/disclosureRef
-Topic 280
-SubTopic 10
-Name Accounting Standards Codification
-Section 50
-Paragraph 32
-Subparagraph (c)
-Publisher FASB
-URI https://asc.fasb.org//1943274/2147482810/280-10-50-32
Reference 34: http://www.xbrl.org/2003/role/disclosureRef
-Topic 205
-SubTopic 20
-Name Accounting Standards Codification
-Section 50
-Paragraph 7
-Publisher FASB
-URI https://asc.fasb.org//1943274/2147483499/205-20-50-7
Reference 35: http://fasb.org/us-gaap/role/ref/legacyRef
-Topic 230
-SubTopic 10
-Name Accounting Standards Codification
-Section 45
-Paragraph 28
-Publisher FASB
-URI https://asc.fasb.org//1943274/2147482740/230-10-45-28
Reference 36: http://www.xbrl.org/2003/role/disclosureRef
-Topic 220
-SubTopic 10
-Name Accounting Standards Codification
-Section 45
-Paragraph 1A
-Subparagraph (a)
-Publisher FASB
-URI https://asc.fasb.org//1943274/2147482790/220-10-45-1A
Reference 37: http://www.xbrl.org/2003/role/disclosureRef
-Topic 220
-SubTopic 10
-Name Accounting Standards Codification
-Section 45
-Paragraph 1B
-Subparagraph (a)
-Publisher FASB
-URI https://asc.fasb.org//1943274/2147482790/220-10-45-1B
Reference 38: http://fasb.org/us-gaap/role/ref/legacyRef
-Topic 220
-SubTopic 10
-Name Accounting Standards Codification
-Section S99
-Paragraph 2
-Subparagraph (SX 210.5-03(20))
-Publisher FASB
-URI https://asc.fasb.org//1943274/2147483621/220-10-S99-2
Reference 39: http://fasb.org/us-gaap/role/ref/legacyRef
-Topic 942
-SubTopic 220
-Name Accounting Standards Codification
-Section S99
-Paragraph 1
-Subparagraph (SX 210.9-04(22))
-Publisher FASB
-URI https://asc.fasb.org//1943274/2147483589/942-220-S99-1
| Name: |
us-gaap_NetIncomeLoss |
| Namespace Prefix: |
us-gaap_ |
| Data Type: |
xbrli:monetaryItemType |
| Balance Type: |
credit |
| Period Type: |
duration |
|
| X |
- DefinitionNumber of shares of stock issued as of the balance sheet date, including shares that had been issued and were previously outstanding but which are now held in the treasury. Reference 1: http://fasb.org/us-gaap/role/ref/legacyRef
-Name Accounting Standards Codification
-Section 50
-Paragraph 2
-SubTopic 10
-Topic 505
-Publisher FASB
-URI https://asc.fasb.org//1943274/2147481112/505-10-50-2
| Name: |
us-gaap_SharesIssued |
| Namespace Prefix: |
us-gaap_ |
| Data Type: |
xbrli:sharesItemType |
| Balance Type: |
na |
| Period Type: |
instant |
|
| X |
- DefinitionNumber of new stock issued during the period. Reference 1: http://fasb.org/us-gaap/role/ref/legacyRef
-Name Accounting Standards Codification
-Section 50
-Paragraph 2
-SubTopic 10
-Topic 505
-Publisher FASB
-URI https://asc.fasb.org//1943274/2147481112/505-10-50-2
Reference 2: http://www.xbrl.org/2003/role/disclosureRef
-Topic 946
-SubTopic 505
-Name Accounting Standards Codification
-Section 50
-Paragraph 2
-Subparagraph (a)
-Publisher FASB
-URI https://asc.fasb.org//1943274/2147481004/946-505-50-2
Reference 3: http://www.xbrl.org/2003/role/disclosureRef
-Topic 946
-SubTopic 220
-Name Accounting Standards Codification
-Section S99
-Paragraph 3
-Subparagraph (SX 210.6-09(4)(b))
-Publisher FASB
-URI https://asc.fasb.org//1943274/2147483575/946-220-S99-3
Reference 4: http://www.xbrl.org/2003/role/disclosureRef
-Topic 946
-SubTopic 10
-Name Accounting Standards Codification
-Section S99
-Paragraph 3
-Subparagraph (SX 210.6-03(i)(1))
-Publisher FASB
-URI https://asc.fasb.org//1943274/2147479886/946-10-S99-3
Reference 5: http://fasb.org/us-gaap/role/ref/legacyRef
-Topic 210
-SubTopic 10
-Name Accounting Standards Codification
-Section S99
-Paragraph 1
-Subparagraph (SX 210.5-02(28))
-Publisher FASB
-URI https://asc.fasb.org//1943274/2147480566/210-10-S99-1
Reference 6: http://fasb.org/us-gaap/role/ref/legacyRef
-Topic 505
-SubTopic 10
-Name Accounting Standards Codification
-Section S99
-Paragraph 1
-Subparagraph (SX 210.3-04)
-Publisher FASB
-URI https://asc.fasb.org//1943274/2147480008/505-10-S99-1
Reference 7: http://fasb.org/us-gaap/role/ref/legacyRef
-Topic 210
-SubTopic 10
-Name Accounting Standards Codification
-Section S99
-Paragraph 1
-Subparagraph (SX 210.5-02(29))
-Publisher FASB
-URI https://asc.fasb.org//1943274/2147480566/210-10-S99-1
| Name: |
us-gaap_StockIssuedDuringPeriodSharesNewIssues |
| Namespace Prefix: |
us-gaap_ |
| Data Type: |
xbrli:sharesItemType |
| Balance Type: |
na |
| Period Type: |
duration |
|
| X |
- DefinitionEquity impact of the value of new stock issued during the period. Includes shares issued in an initial public offering or a secondary public offering. Reference 1: http://fasb.org/us-gaap/role/ref/legacyRef
-Name Accounting Standards Codification
-Section 50
-Paragraph 2
-SubTopic 10
-Topic 505
-Publisher FASB
-URI https://asc.fasb.org//1943274/2147481112/505-10-50-2
Reference 2: http://www.xbrl.org/2003/role/exampleRef
-Topic 946
-SubTopic 830
-Name Accounting Standards Codification
-Section 55
-Paragraph 11
-Publisher FASB
-URI https://asc.fasb.org//1943274/2147480167/946-830-55-11
Reference 3: http://www.xbrl.org/2003/role/disclosureRef
-Topic 946
-SubTopic 205
-Name Accounting Standards Codification
-Section 45
-Paragraph 4
-Subparagraph (a)
-Publisher FASB
-URI https://asc.fasb.org//1943274/2147480767/946-205-45-4
Reference 4: http://www.xbrl.org/2003/role/disclosureRef
-Topic 946
-SubTopic 505
-Name Accounting Standards Codification
-Section 50
-Paragraph 2
-Subparagraph (a)
-Publisher FASB
-URI https://asc.fasb.org//1943274/2147481004/946-505-50-2
Reference 5: http://www.xbrl.org/2003/role/disclosureRef
-Topic 946
-SubTopic 220
-Name Accounting Standards Codification
-Section S99
-Paragraph 3
-Subparagraph (SX 210.6-09(4)(b))
-Publisher FASB
-URI https://asc.fasb.org//1943274/2147483575/946-220-S99-3
Reference 6: http://fasb.org/us-gaap/role/ref/legacyRef
-Topic 210
-SubTopic 10
-Name Accounting Standards Codification
-Section S99
-Paragraph 1
-Subparagraph (SX 210.5-02(28))
-Publisher FASB
-URI https://asc.fasb.org//1943274/2147480566/210-10-S99-1
Reference 7: http://fasb.org/us-gaap/role/ref/legacyRef
-Topic 505
-SubTopic 10
-Name Accounting Standards Codification
-Section S99
-Paragraph 1
-Subparagraph (SX 210.3-04)
-Publisher FASB
-URI https://asc.fasb.org//1943274/2147480008/505-10-S99-1
Reference 8: http://fasb.org/us-gaap/role/ref/legacyRef
-Topic 210
-SubTopic 10
-Name Accounting Standards Codification
-Section S99
-Paragraph 1
-Subparagraph (SX 210.5-02(29))
-Publisher FASB
-URI https://asc.fasb.org//1943274/2147480566/210-10-S99-1
| Name: |
us-gaap_StockIssuedDuringPeriodValueNewIssues |
| Namespace Prefix: |
us-gaap_ |
| Data Type: |
xbrli:monetaryItemType |
| Balance Type: |
credit |
| Period Type: |
duration |
|
| X |
- DefinitionAmount of equity (deficit) attributable to parent. Excludes temporary equity and equity attributable to noncontrolling interest. Reference 1: http://www.xbrl.org/2003/role/exampleRef
-Topic 852
-SubTopic 10
-Name Accounting Standards Codification
-Section 55
-Paragraph 10
-Publisher FASB
-URI https://asc.fasb.org//1943274/2147481372/852-10-55-10
Reference 2: http://www.xbrl.org/2003/role/exampleRef
-Topic 946
-SubTopic 830
-Name Accounting Standards Codification
-Section 55
-Paragraph 12
-Publisher FASB
-URI https://asc.fasb.org//1943274/2147480167/946-830-55-12
Reference 3: http://www.xbrl.org/2003/role/disclosureRef
-Topic 946
-SubTopic 210
-Name Accounting Standards Codification
-Section S99
-Paragraph 1
-Subparagraph (SX 210.6-04(19))
-Publisher FASB
-URI https://asc.fasb.org//1943274/2147479617/946-210-S99-1
Reference 4: http://www.xbrl.org/2003/role/disclosureRef
-Topic 946
-SubTopic 210
-Name Accounting Standards Codification
-Section S99
-Paragraph 2
-Subparagraph (SX 210.6-05(4))
-Publisher FASB
-URI https://asc.fasb.org//1943274/2147479617/946-210-S99-2
Reference 5: http://www.xbrl.org/2009/role/commonPracticeRef
-Topic 946
-SubTopic 220
-Name Accounting Standards Codification
-Section S99
-Paragraph 3
-Subparagraph (SX 210.6-09(4)(b))
-Publisher FASB
-URI https://asc.fasb.org//1943274/2147483575/946-220-S99-3
Reference 6: http://www.xbrl.org/2003/role/disclosureRef
-Topic 946
-SubTopic 220
-Name Accounting Standards Codification
-Section S99
-Paragraph 3
-Subparagraph (SX 210.6-09(6))
-Publisher FASB
-URI https://asc.fasb.org//1943274/2147483575/946-220-S99-3
Reference 7: http://www.xbrl.org/2003/role/disclosureRef
-Topic 946
-SubTopic 220
-Name Accounting Standards Codification
-Section S99
-Paragraph 3
-Subparagraph (SX 210.6-09(7))
-Publisher FASB
-URI https://asc.fasb.org//1943274/2147483575/946-220-S99-3
Reference 8: http://www.xbrl.org/2009/role/commonPracticeRef
-Topic 235
-SubTopic 10
-Name Accounting Standards Codification
-Section S99
-Paragraph 1
-Subparagraph (SX 210.4-08(g)(1)(ii))
-Publisher FASB
-URI https://asc.fasb.org//1943274/2147480678/235-10-S99-1
Reference 9: http://www.xbrl.org/2009/role/commonPracticeRef
-Topic 323
-SubTopic 10
-Name Accounting Standards Codification
-Section 50
-Paragraph 3
-Subparagraph (c)
-Publisher FASB
-URI https://asc.fasb.org//1943274/2147481687/323-10-50-3
Reference 10: http://www.xbrl.org/2009/role/commonPracticeRef
-Topic 825
-SubTopic 10
-Name Accounting Standards Codification
-Section 50
-Paragraph 28
-Subparagraph (f)
-Publisher FASB
-URI https://asc.fasb.org//1943274/2147482907/825-10-50-28
Reference 11: http://fasb.org/us-gaap/role/ref/legacyRef
-Topic 210
-SubTopic 10
-Name Accounting Standards Codification
-Section S99
-Paragraph 1
-Subparagraph (SX 210.5-02(29))
-Publisher FASB
-URI https://asc.fasb.org//1943274/2147480566/210-10-S99-1
Reference 12: http://fasb.org/us-gaap/role/ref/legacyRef
-Topic 210
-SubTopic 10
-Name Accounting Standards Codification
-Section S99
-Paragraph 1
-Subparagraph (SX 210.5-02(31))
-Publisher FASB
-URI https://asc.fasb.org//1943274/2147480566/210-10-S99-1
Reference 13: http://fasb.org/us-gaap/role/ref/legacyRef
-Topic 210
-SubTopic 10
-Name Accounting Standards Codification
-Section S99
-Paragraph 1
-Subparagraph (SX 210.5-02(30))
-Publisher FASB
-URI https://asc.fasb.org//1943274/2147480566/210-10-S99-1
Reference 14: http://fasb.org/us-gaap/role/ref/legacyRef
-Topic 310
-SubTopic 10
-Name Accounting Standards Codification
-Section S99
-Paragraph 2
-Subparagraph (SAB Topic 4.E)
-Publisher FASB
-URI https://asc.fasb.org//1943274/2147480418/310-10-S99-2
| Name: |
us-gaap_StockholdersEquity |
| Namespace Prefix: |
us-gaap_ |
| Data Type: |
xbrli:monetaryItemType |
| Balance Type: |
credit |
| Period Type: |
instant |
|
v3.24.1
CONSOLIDATED STATEMENTS OF CASH FLOWS - USD ($)
|
12 Months Ended |
Dec. 31, 2023 |
Dec. 31, 2022 |
| Operating Activities: |
|
|
| Net income |
$ 2,414,000
|
$ 10,046,000
|
| Income from discontinued operations, net of tax |
(2,474,000)
|
(12,340,000)
|
| Gain from sale of discontinued operations, net of tax |
(2,961,000)
|
0
|
| Net loss from continuing operations |
(3,021,000)
|
(2,294,000)
|
| Adjustments to reconcile net loss from continuing operations to net cash used in operating activities of continuing operations: |
|
|
| Depreciation and amortization |
7,000
|
0
|
| Stock-based compensation expense |
44,000
|
123,000
|
| Changes in operating assets and liabilities: |
|
|
| Receivable from escrow account |
(200,000)
|
0
|
| Income tax receivable |
14,000
|
(24,000)
|
| Prepaid expenses and other |
(8,000)
|
151,000
|
| Accounts payable |
(106,000)
|
52,000
|
| Accrued liabilities |
376,000
|
(187,000)
|
| Accrued income taxes |
(11,000)
|
(658,000)
|
| Net cash used in operating activities of continuing operations |
(2,905,000)
|
(2,837,000)
|
| Net cash provided by operating activities of discontinued operations |
3,423,000
|
13,500,000
|
| Net cash provided by operating activities |
518,000
|
10,663,000
|
| Investing Activities: |
|
|
| Proceeds from sale of business |
1,581,000
|
0
|
| Purchase of other long-term assets |
(10,000)
|
0
|
| Purchases of property and equipment |
(39,000)
|
0
|
| Net cash provided by investing activities of continuing operations |
1,532,000
|
0
|
| Net cash used in investing activities of discontinued operations |
(24,000)
|
(29,000)
|
| Net cash provided by (used in) investing activities |
1,508,000
|
(29,000)
|
| Financing Activities: |
|
|
| Proceeds from issuance of common stock, net |
9,000
|
39,000
|
| Repurchase of common stock, net |
(482,000)
|
0
|
| Net cash (used in) provided by financing activities |
(473,000)
|
39,000
|
| Increase in cash, cash equivalents and restricted cash |
1,553,000
|
10,673,000
|
| Cash, cash equivalents and restricted cash at beginning of period |
14,524,000
|
3,851,000
|
| Cash, cash equivalents and restricted cash at end of period |
16,077,000
|
14,524,000
|
| Supplemental disclosures for cash flow information: |
|
|
| Cash paid during the period for income taxes |
88,000
|
464,000
|
| Non-cash investing and financing activity: |
|
|
| Operating lease right-of-use asset obtained in exchange for lease obligations |
8,000
|
38,000
|
| Purchase of property and equipment included in accrued liabilities |
3,000
|
1,000
|
| Common stock issued for settlement of accrued liabilities |
$ 146,000
|
$ 0
|
| X |
- References
+ Details
| Name: |
ldwy_AdjustmentsToReconcileNetLossFromContinuingOperationsToNetCashUsedInOperatingActivitiesOfContinuingOperationsNewAbstract |
| Namespace Prefix: |
ldwy_ |
| Data Type: |
xbrli:stringItemType |
| Balance Type: |
na |
| Period Type: |
duration |
|
| X |
- References
+ Details
| Name: |
ldwy_CommonStockIssuedForSettlementOfAccruedLiabilities |
| Namespace Prefix: |
ldwy_ |
| Data Type: |
xbrli:monetaryItemType |
| Balance Type: |
credit |
| Period Type: |
duration |
|
| X |
- References
+ Details
| Name: |
ldwy_IncomeLossFromDiscontinuedOperationsNetOfTax1 |
| Namespace Prefix: |
ldwy_ |
| Data Type: |
xbrli:monetaryItemType |
| Balance Type: |
credit |
| Period Type: |
duration |
|
| X |
- References
+ Details
| Name: |
ldwy_NoncashInvestingAndFinancingActivityNewAbstract |
| Namespace Prefix: |
ldwy_ |
| Data Type: |
xbrli:stringItemType |
| Balance Type: |
na |
| Period Type: |
duration |
|
| X |
- References
+ Details
| Name: |
ldwy_ProceedsFromSaleOfBusiness |
| Namespace Prefix: |
ldwy_ |
| Data Type: |
xbrli:monetaryItemType |
| Balance Type: |
debit |
| Period Type: |
duration |
|
| X |
- DefinitionAmount of cash and cash equivalents, and cash and cash equivalents restricted to withdrawal or usage. Excludes amount for disposal group and discontinued operations. Cash includes, but is not limited to, currency on hand, demand deposits with banks or financial institutions, and other accounts with general characteristics of demand deposits. Cash equivalents include, but are not limited to, short-term, highly liquid investments that are both readily convertible to known amounts of cash and so near their maturity that they present insignificant risk of changes in value because of changes in interest rates. Reference 1: http://www.xbrl.org/2003/role/disclosureRef
-Topic 230
-SubTopic 10
-Name Accounting Standards Codification
-Section 50
-Paragraph 8
-Publisher FASB
-URI https://asc.fasb.org//1943274/2147482913/230-10-50-8
Reference 2: http://fasb.org/us-gaap/role/ref/legacyRef
-Topic 230
-SubTopic 10
-Name Accounting Standards Codification
-Section 45
-Paragraph 24
-Publisher FASB
-URI https://asc.fasb.org//1943274/2147482740/230-10-45-24
Reference 3: http://fasb.org/us-gaap/role/ref/legacyRef
-Name Accounting Standards Codification
-Topic 230
-SubTopic 10
-Section 45
-Paragraph 4
-Publisher FASB
-URI https://asc.fasb.org//1943274/2147482740/230-10-45-4
| Name: |
us-gaap_CashCashEquivalentsRestrictedCashAndRestrictedCashEquivalents |
| Namespace Prefix: |
us-gaap_ |
| Data Type: |
xbrli:monetaryItemType |
| Balance Type: |
debit |
| Period Type: |
instant |
|
| X |
- DefinitionAmount of increase (decrease) in cash, cash equivalents, and cash and cash equivalents restricted to withdrawal or usage; including effect from exchange rate change. Cash includes, but is not limited to, currency on hand, demand deposits with banks or financial institutions, and other accounts with general characteristics of demand deposits. Cash equivalents include, but are not limited to, short-term, highly liquid investments that are both readily convertible to known amounts of cash and so near their maturity that they present insignificant risk of changes in value because of changes in interest rates. Reference 1: http://fasb.org/us-gaap/role/ref/legacyRef
-Topic 230
-SubTopic 10
-Name Accounting Standards Codification
-Section 45
-Paragraph 24
-Publisher FASB
-URI https://asc.fasb.org//1943274/2147482740/230-10-45-24
Reference 2: http://fasb.org/us-gaap/role/ref/legacyRef
-Name Accounting Standards Codification
-Section 45
-Paragraph 1
-SubTopic 230
-Topic 830
-Publisher FASB
-URI https://asc.fasb.org//1943274/2147481877/830-230-45-1
| Name: |
us-gaap_CashCashEquivalentsRestrictedCashAndRestrictedCashEquivalentsPeriodIncreaseDecreaseIncludingExchangeRateEffect |
| Namespace Prefix: |
us-gaap_ |
| Data Type: |
xbrli:monetaryItemType |
| Balance Type: |
debit |
| Period Type: |
duration |
|
| X |
- DefinitionAmount of cash inflow (outflow) of investing activities of discontinued operations. Investing activity cash flows include making and collecting loans and acquiring and disposing of debt or equity instruments and property, plant, and equipment and other productive assets. Reference 1: http://fasb.org/us-gaap/role/ref/legacyRef
-Topic 230
-SubTopic 10
-Name Accounting Standards Codification
-Section 45
-Paragraph 24
-Publisher FASB
-URI https://asc.fasb.org//1943274/2147482740/230-10-45-24
Reference 2: http://fasb.org/us-gaap/role/ref/legacyRef
-Topic 205
-SubTopic 20
-Name Accounting Standards Codification
-Section 50
-Paragraph 5B
-Subparagraph (c)(1)
-Publisher FASB
-URI https://asc.fasb.org//1943274/2147483499/205-20-50-5B
| Name: |
us-gaap_CashProvidedByUsedInInvestingActivitiesDiscontinuedOperations |
| Namespace Prefix: |
us-gaap_ |
| Data Type: |
xbrli:monetaryItemType |
| Balance Type: |
debit |
| Period Type: |
duration |
|
| X |
- DefinitionAmount of cash inflow (outflow) of operating activities of discontinued operations. Operating activity cash flows include transactions, adjustments, and changes in value not defined as investing or financing activities. Reference 1: http://fasb.org/us-gaap/role/ref/legacyRef
-Topic 230
-SubTopic 10
-Name Accounting Standards Codification
-Section 45
-Paragraph 24
-Publisher FASB
-URI https://asc.fasb.org//1943274/2147482740/230-10-45-24
Reference 2: http://fasb.org/us-gaap/role/ref/legacyRef
-Topic 205
-SubTopic 20
-Name Accounting Standards Codification
-Section 50
-Paragraph 5B
-Subparagraph (c)(1)
-Publisher FASB
-URI https://asc.fasb.org//1943274/2147483499/205-20-50-5B
| Name: |
us-gaap_CashProvidedByUsedInOperatingActivitiesDiscontinuedOperations |
| Namespace Prefix: |
us-gaap_ |
| Data Type: |
xbrli:monetaryItemType |
| Balance Type: |
debit |
| Period Type: |
duration |
|
| X |
- DefinitionThe current period expense charged against earnings on long-lived, physical assets not used in production, and which are not intended for resale, to allocate or recognize the cost of such assets over their useful lives; or to record the reduction in book value of an intangible asset over the benefit period of such asset; or to reflect consumption during the period of an asset that is not used in production. Reference 1: http://fasb.org/us-gaap/role/ref/legacyRef
-Name Accounting Standards Codification
-Section 45
-Paragraph 28
-Subparagraph (b)
-SubTopic 10
-Topic 230
-Publisher FASB
-URI https://asc.fasb.org//1943274/2147482740/230-10-45-28
Reference 2: http://fasb.org/us-gaap/role/ref/legacyRef
-Name Accounting Standards Codification
-Topic 360
-SubTopic 10
-Section 50
-Paragraph 1
-Subparagraph (a)
-Publisher FASB
-URI https://asc.fasb.org//1943274/2147482099/360-10-50-1
| Name: |
us-gaap_DepreciationAndAmortization |
| Namespace Prefix: |
us-gaap_ |
| Data Type: |
xbrli:monetaryItemType |
| Balance Type: |
debit |
| Period Type: |
duration |
|
| X |
- DefinitionAmount after tax of gain (loss) not previously recognized resulting from the disposal of a discontinued operation. Reference 1: http://fasb.org/us-gaap/role/ref/legacyRef
-Topic 205
-SubTopic 20
-Name Accounting Standards Codification
-Section 50
-Paragraph 5C
-Subparagraph (b)(2)
-Publisher FASB
-URI https://asc.fasb.org//1943274/2147483499/205-20-50-5C
Reference 2: http://fasb.org/us-gaap/role/ref/legacyRef
-Topic 205
-SubTopic 20
-Name Accounting Standards Codification
-Section 45
-Paragraph 3B
-Publisher FASB
-URI https://asc.fasb.org//1943274/2147483475/205-20-45-3B
Reference 3: http://fasb.org/us-gaap/role/ref/legacyRef
-Topic 205
-SubTopic 20
-Name Accounting Standards Codification
-Section 50
-Paragraph 1
-Subparagraph (b)
-Publisher FASB
-URI https://asc.fasb.org//1943274/2147483499/205-20-50-1
Reference 4: http://fasb.org/us-gaap/role/ref/legacyRef
-Topic 205
-SubTopic 20
-Name Accounting Standards Codification
-Section 45
-Paragraph 3
-Publisher FASB
-URI https://asc.fasb.org//1943274/2147483475/205-20-45-3
| Name: |
us-gaap_DiscontinuedOperationGainLossOnDisposalOfDiscontinuedOperationNetOfTax |
| Namespace Prefix: |
us-gaap_ |
| Data Type: |
xbrli:monetaryItemType |
| Balance Type: |
credit |
| Period Type: |
duration |
|
| X |
- DefinitionAmount after tax of income (loss) from continuing operations attributable to the parent. Reference 1: http://www.xbrl.org/2003/role/disclosureRef
-Topic 250
-SubTopic 10
-Name Accounting Standards Codification
-Section 50
-Paragraph 3
-Publisher FASB
-URI https://asc.fasb.org//1943274/2147483443/250-10-50-3
Reference 2: http://www.xbrl.org/2003/role/disclosureRef
-Topic 250
-SubTopic 10
-Name Accounting Standards Codification
-Section 50
-Paragraph 11
-Subparagraph (a)
-Publisher FASB
-URI https://asc.fasb.org//1943274/2147483443/250-10-50-11
Reference 3: http://www.xbrl.org/2003/role/disclosureRef
-Topic 250
-SubTopic 10
-Name Accounting Standards Codification
-Section 50
-Paragraph 11
-Subparagraph (b)
-Publisher FASB
-URI https://asc.fasb.org//1943274/2147483443/250-10-50-11
Reference 4: http://www.xbrl.org/2003/role/disclosureRef
-Topic 250
-SubTopic 10
-Name Accounting Standards Codification
-Section 50
-Paragraph 4
-Publisher FASB
-URI https://asc.fasb.org//1943274/2147483443/250-10-50-4
Reference 5: http://www.xbrl.org/2003/role/disclosureRef
-Topic 260
-SubTopic 10
-Name Accounting Standards Codification
-Section 50
-Paragraph 1
-Subparagraph (a)
-Publisher FASB
-URI https://asc.fasb.org//1943274/2147482662/260-10-50-1
Reference 6: http://www.xbrl.org/2003/role/disclosureRef
-Topic 260
-SubTopic 10
-Name Accounting Standards Codification
-Section 45
-Paragraph 60B
-Subparagraph (a)
-Publisher FASB
-URI https://asc.fasb.org//1943274/2147482689/260-10-45-60B
Reference 7: http://fasb.org/us-gaap/role/ref/legacyRef
-Topic 230
-SubTopic 10
-Name Accounting Standards Codification
-Section 45
-Paragraph 28
-Publisher FASB
-URI https://asc.fasb.org//1943274/2147482740/230-10-45-28
Reference 8: http://fasb.org/us-gaap/role/ref/legacyRef
-Name Accounting Standards Codification
-Topic 810
-SubTopic 10
-Section 45
-Paragraph 18
-Publisher FASB
-URI https://asc.fasb.org//1943274/2147481231/810-10-45-18
Reference 9: http://fasb.org/us-gaap/role/ref/legacyRef
-Topic 220
-SubTopic 10
-Name Accounting Standards Codification
-Section S99
-Paragraph 2
-Subparagraph (SX 210.5-03.13)
-Publisher FASB
-URI https://asc.fasb.org//1943274/2147483621/220-10-S99-2
| Name: |
us-gaap_IncomeLossFromContinuingOperations |
| Namespace Prefix: |
us-gaap_ |
| Data Type: |
xbrli:monetaryItemType |
| Balance Type: |
credit |
| Period Type: |
duration |
|
| X |
- DefinitionThe increase (decrease) during the reporting period in the aggregate amount of liabilities incurred (and for which invoices have typically been received) and payable to vendors for goods and services received that are used in an entity's business. Reference 1: http://fasb.org/us-gaap/role/ref/legacyRef
-Name Accounting Standards Codification
-Section 45
-Paragraph 28
-Subparagraph (a)
-SubTopic 10
-Topic 230
-Publisher FASB
-URI https://asc.fasb.org//1943274/2147482740/230-10-45-28
| Name: |
us-gaap_IncreaseDecreaseInAccountsPayable |
| Namespace Prefix: |
us-gaap_ |
| Data Type: |
xbrli:monetaryItemType |
| Balance Type: |
debit |
| Period Type: |
duration |
|
| X |
- DefinitionThe increase (decrease) during the reporting period in amount due within one year (or one business cycle) from customers for the credit sale of goods and services. Reference 1: http://fasb.org/us-gaap/role/ref/legacyRef
-Name Accounting Standards Codification
-Section 45
-Paragraph 28
-Subparagraph (a)
-SubTopic 10
-Topic 230
-Publisher FASB
-URI https://asc.fasb.org//1943274/2147482740/230-10-45-28
| Name: |
us-gaap_IncreaseDecreaseInAccountsReceivable |
| Namespace Prefix: |
us-gaap_ |
| Data Type: |
xbrli:monetaryItemType |
| Balance Type: |
credit |
| Period Type: |
duration |
|
| X |
- DefinitionThe increase (decrease) during the reporting period in the aggregate amount of expenses incurred but not yet paid. Reference 1: http://fasb.org/us-gaap/role/ref/legacyRef
-Name Accounting Standards Codification
-Section 45
-Paragraph 28
-Subparagraph (a)
-SubTopic 10
-Topic 230
-Publisher FASB
-URI https://asc.fasb.org//1943274/2147482740/230-10-45-28
| Name: |
us-gaap_IncreaseDecreaseInAccruedLiabilities |
| Namespace Prefix: |
us-gaap_ |
| Data Type: |
xbrli:monetaryItemType |
| Balance Type: |
debit |
| Period Type: |
duration |
|
| X |
- References
+ Details
| Name: |
us-gaap_IncreaseDecreaseInOperatingCapitalAbstract |
| Namespace Prefix: |
us-gaap_ |
| Data Type: |
xbrli:stringItemType |
| Balance Type: |
na |
| Period Type: |
duration |
|
| X |
- DefinitionAmount of increase (decrease) in prepaid expenses, and assets classified as other. Reference 1: http://fasb.org/us-gaap/role/ref/legacyRef
-Name Accounting Standards Codification
-Section 45
-Paragraph 28
-Subparagraph (a)
-SubTopic 10
-Topic 230
-Publisher FASB
-URI https://asc.fasb.org//1943274/2147482740/230-10-45-28
| Name: |
us-gaap_IncreaseDecreaseInPrepaidDeferredExpenseAndOtherAssets |
| Namespace Prefix: |
us-gaap_ |
| Data Type: |
xbrli:monetaryItemType |
| Balance Type: |
credit |
| Period Type: |
duration |
|
| X |
- DefinitionAmount of cash inflow (outflow) from financing activities, including discontinued operations. Financing activity cash flows include obtaining resources from owners and providing them with a return on, and a return of, their investment; borrowing money and repaying amounts borrowed, or settling the obligation; and obtaining and paying for other resources obtained from creditors on long-term credit. Reference 1: http://www.xbrl.org/2003/role/disclosureRef
-Topic 230
-SubTopic 10
-Name Accounting Standards Codification
-Section 45
-Paragraph 24
-Publisher FASB
-URI https://asc.fasb.org//1943274/2147482740/230-10-45-24
| Name: |
us-gaap_NetCashProvidedByUsedInFinancingActivities |
| Namespace Prefix: |
us-gaap_ |
| Data Type: |
xbrli:monetaryItemType |
| Balance Type: |
debit |
| Period Type: |
duration |
|
| X |
- References
+ Details
| Name: |
us-gaap_NetCashProvidedByUsedInFinancingActivitiesAbstract |
| Namespace Prefix: |
us-gaap_ |
| Data Type: |
xbrli:stringItemType |
| Balance Type: |
na |
| Period Type: |
duration |
|
| X |
- DefinitionAmount of cash inflow (outflow) from investing activities, including discontinued operations. Investing activity cash flows include making and collecting loans and acquiring and disposing of debt or equity instruments and property, plant, and equipment and other productive assets. Reference 1: http://www.xbrl.org/2003/role/disclosureRef
-Topic 230
-SubTopic 10
-Name Accounting Standards Codification
-Section 45
-Paragraph 24
-Publisher FASB
-URI https://asc.fasb.org//1943274/2147482740/230-10-45-24
| Name: |
us-gaap_NetCashProvidedByUsedInInvestingActivities |
| Namespace Prefix: |
us-gaap_ |
| Data Type: |
xbrli:monetaryItemType |
| Balance Type: |
debit |
| Period Type: |
duration |
|
| X |
- References
+ Details
| Name: |
us-gaap_NetCashProvidedByUsedInInvestingActivitiesAbstract |
| Namespace Prefix: |
us-gaap_ |
| Data Type: |
xbrli:stringItemType |
| Balance Type: |
na |
| Period Type: |
duration |
|
| X |
- DefinitionAmount of cash inflow (outflow) of investing activities, excluding discontinued operations. Investing activity cash flows include making and collecting loans and acquiring and disposing of debt or equity instruments and property, plant, and equipment and other productive assets. Reference 1: http://www.xbrl.org/2009/role/commonPracticeRef
-Topic 230
-SubTopic 10
-Name Accounting Standards Codification
-Section 45
-Paragraph 24
-Publisher FASB
-URI https://asc.fasb.org//1943274/2147482740/230-10-45-24
| Name: |
us-gaap_NetCashProvidedByUsedInInvestingActivitiesContinuingOperations |
| Namespace Prefix: |
us-gaap_ |
| Data Type: |
xbrli:monetaryItemType |
| Balance Type: |
debit |
| Period Type: |
duration |
|
| X |
- DefinitionAmount of cash inflow (outflow) from operating activities, including discontinued operations. Operating activity cash flows include transactions, adjustments, and changes in value not defined as investing or financing activities. Reference 1: http://fasb.org/us-gaap/role/ref/legacyRef
-Topic 230
-SubTopic 10
-Name Accounting Standards Codification
-Section 45
-Paragraph 28
-Publisher FASB
-URI https://asc.fasb.org//1943274/2147482740/230-10-45-28
Reference 2: http://fasb.org/us-gaap/role/ref/legacyRef
-Topic 230
-SubTopic 10
-Name Accounting Standards Codification
-Section 45
-Paragraph 24
-Publisher FASB
-URI https://asc.fasb.org//1943274/2147482740/230-10-45-24
Reference 3: http://fasb.org/us-gaap/role/ref/legacyRef
-Topic 230
-SubTopic 10
-Name Accounting Standards Codification
-Section 45
-Paragraph 25
-Publisher FASB
-URI https://asc.fasb.org//1943274/2147482740/230-10-45-25
| Name: |
us-gaap_NetCashProvidedByUsedInOperatingActivities |
| Namespace Prefix: |
us-gaap_ |
| Data Type: |
xbrli:monetaryItemType |
| Balance Type: |
na |
| Period Type: |
duration |
|
| X |
- References
+ Details
| Name: |
us-gaap_NetCashProvidedByUsedInOperatingActivitiesAbstract |
| Namespace Prefix: |
us-gaap_ |
| Data Type: |
xbrli:stringItemType |
| Balance Type: |
na |
| Period Type: |
duration |
|
| X |
- DefinitionAmount of cash inflow (outflow) from operating activities, excluding discontinued operations. Operating activity cash flows include transactions, adjustments, and changes in value not defined as investing or financing activities. Reference 1: http://fasb.org/us-gaap/role/ref/legacyRef
-Topic 230
-SubTopic 10
-Name Accounting Standards Codification
-Section 45
-Paragraph 28
-Publisher FASB
-URI https://asc.fasb.org//1943274/2147482740/230-10-45-28
Reference 2: http://fasb.org/us-gaap/role/ref/legacyRef
-Topic 230
-SubTopic 10
-Name Accounting Standards Codification
-Section 45
-Paragraph 24
-Publisher FASB
-URI https://asc.fasb.org//1943274/2147482740/230-10-45-24
Reference 3: http://fasb.org/us-gaap/role/ref/legacyRef
-Topic 230
-SubTopic 10
-Name Accounting Standards Codification
-Section 45
-Paragraph 25
-Publisher FASB
-URI https://asc.fasb.org//1943274/2147482740/230-10-45-25
| Name: |
us-gaap_NetCashProvidedByUsedInOperatingActivitiesContinuingOperations |
| Namespace Prefix: |
us-gaap_ |
| Data Type: |
xbrli:monetaryItemType |
| Balance Type: |
na |
| Period Type: |
duration |
|
| X |
- DefinitionThe portion of profit or loss for the period, net of income taxes, which is attributable to the parent. Reference 1: http://www.xbrl.org/2003/role/disclosureRef
-Topic 235
-SubTopic 10
-Name Accounting Standards Codification
-Section S99
-Paragraph 1
-Subparagraph (SX 210.4-08(g)(1)(ii))
-Publisher FASB
-URI https://asc.fasb.org//1943274/2147480678/235-10-S99-1
Reference 2: http://www.xbrl.org/2003/role/disclosureRef
-Topic 323
-SubTopic 10
-Name Accounting Standards Codification
-Section 50
-Paragraph 3
-Subparagraph (c)
-Publisher FASB
-URI https://asc.fasb.org//1943274/2147481687/323-10-50-3
Reference 3: http://www.xbrl.org/2003/role/disclosureRef
-Topic 825
-SubTopic 10
-Name Accounting Standards Codification
-Section 50
-Paragraph 28
-Subparagraph (f)
-Publisher FASB
-URI https://asc.fasb.org//1943274/2147482907/825-10-50-28
Reference 4: http://www.xbrl.org/2003/role/disclosureRef
-Topic 220
-SubTopic 10
-Name Accounting Standards Codification
-Section 50
-Paragraph 6
-Publisher FASB
-URI https://asc.fasb.org//1943274/2147482765/220-10-50-6
Reference 5: http://www.xbrl.org/2003/role/disclosureRef
-Topic 250
-SubTopic 10
-Name Accounting Standards Codification
-Section 50
-Paragraph 3
-Publisher FASB
-URI https://asc.fasb.org//1943274/2147483443/250-10-50-3
Reference 6: http://www.xbrl.org/2003/role/disclosureRef
-Topic 250
-SubTopic 10
-Name Accounting Standards Codification
-Section 50
-Paragraph 1
-Subparagraph (b)(2)
-Publisher FASB
-URI https://asc.fasb.org//1943274/2147483443/250-10-50-1
Reference 7: http://www.xbrl.org/2003/role/disclosureRef
-Topic 815
-SubTopic 40
-Name Accounting Standards Codification
-Section 65
-Paragraph 1
-Subparagraph (f)
-Publisher FASB
-URI https://asc.fasb.org//1943274/2147480175/815-40-65-1
Reference 8: http://www.xbrl.org/2003/role/disclosureRef
-Topic 250
-SubTopic 10
-Name Accounting Standards Codification
-Section 50
-Paragraph 8
-Publisher FASB
-URI https://asc.fasb.org//1943274/2147483443/250-10-50-8
Reference 9: http://www.xbrl.org/2003/role/disclosureRef
-Topic 250
-SubTopic 10
-Name Accounting Standards Codification
-Section 50
-Paragraph 9
-Publisher FASB
-URI https://asc.fasb.org//1943274/2147483443/250-10-50-9
Reference 10: http://www.xbrl.org/2003/role/disclosureRef
-Topic 250
-SubTopic 10
-Name Accounting Standards Codification
-Section 50
-Paragraph 11
-Subparagraph (a)
-Publisher FASB
-URI https://asc.fasb.org//1943274/2147483443/250-10-50-11
Reference 11: http://www.xbrl.org/2003/role/disclosureRef
-Topic 250
-SubTopic 10
-Name Accounting Standards Codification
-Section 50
-Paragraph 11
-Subparagraph (b)
-Publisher FASB
-URI https://asc.fasb.org//1943274/2147483443/250-10-50-11
Reference 12: http://www.xbrl.org/2003/role/disclosureRef
-Topic 250
-SubTopic 10
-Name Accounting Standards Codification
-Section 50
-Paragraph 4
-Publisher FASB
-URI https://asc.fasb.org//1943274/2147483443/250-10-50-4
Reference 13: http://www.xbrl.org/2003/role/exampleRef
-Topic 946
-SubTopic 830
-Name Accounting Standards Codification
-Section 55
-Paragraph 10
-Publisher FASB
-URI https://asc.fasb.org//1943274/2147480167/946-830-55-10
Reference 14: http://www.xbrl.org/2003/role/disclosureRef
-Topic 946
-SubTopic 220
-Name Accounting Standards Codification
-Section 45
-Paragraph 7
-Publisher FASB
-URI https://asc.fasb.org//1943274/2147483581/946-220-45-7
Reference 15: http://www.xbrl.org/2003/role/disclosureRef
-Topic 944
-SubTopic 220
-Name Accounting Standards Codification
-Section S99
-Paragraph 1
-Subparagraph (SX 210.7-04(18))
-Publisher FASB
-URI https://asc.fasb.org//1943274/2147483586/944-220-S99-1
Reference 16: http://www.xbrl.org/2003/role/disclosureRef
-Topic 280
-SubTopic 10
-Name Accounting Standards Codification
-Section 50
-Paragraph 22
-Publisher FASB
-URI https://asc.fasb.org//1943274/2147482810/280-10-50-22
Reference 17: http://www.xbrl.org/2003/role/disclosureRef
-Topic 946
-SubTopic 220
-Name Accounting Standards Codification
-Section S99
-Paragraph 1
-Subparagraph (SX 210.6-07(9))
-Publisher FASB
-URI https://asc.fasb.org//1943274/2147483575/946-220-S99-1
Reference 18: http://www.xbrl.org/2003/role/disclosureRef
-Topic 946
-SubTopic 220
-Name Accounting Standards Codification
-Section S99
-Paragraph 3
-Subparagraph (SX 210.6-09(1)(d))
-Publisher FASB
-URI https://asc.fasb.org//1943274/2147483575/946-220-S99-3
Reference 19: http://www.xbrl.org/2003/role/disclosureRef
-Topic 470
-SubTopic 10
-Name Accounting Standards Codification
-Section S99
-Paragraph 1A
-Subparagraph (SX 210.13-01(a)(4)(i))
-Publisher FASB
-URI https://asc.fasb.org//1943274/2147480097/470-10-S99-1A
Reference 20: http://www.xbrl.org/2009/role/commonPracticeRef
-Topic 470
-SubTopic 10
-Name Accounting Standards Codification
-Section S99
-Paragraph 1A
-Subparagraph (SX 210.13-01(a)(4)(ii))
-Publisher FASB
-URI https://asc.fasb.org//1943274/2147480097/470-10-S99-1A
Reference 21: http://www.xbrl.org/2003/role/disclosureRef
-Topic 470
-SubTopic 10
-Name Accounting Standards Codification
-Section S99
-Paragraph 1A
-Subparagraph (SX 210.13-01(a)(4)(iii)(A))
-Publisher FASB
-URI https://asc.fasb.org//1943274/2147480097/470-10-S99-1A
Reference 22: http://www.xbrl.org/2003/role/disclosureRef
-Topic 470
-SubTopic 10
-Name Accounting Standards Codification
-Section S99
-Paragraph 1A
-Subparagraph (SX 210.13-01(a)(4)(iv))
-Publisher FASB
-URI https://asc.fasb.org//1943274/2147480097/470-10-S99-1A
Reference 23: http://www.xbrl.org/2003/role/disclosureRef
-Topic 470
-SubTopic 10
-Name Accounting Standards Codification
-Section S99
-Paragraph 1A
-Subparagraph (SX 210.13-01(a)(5))
-Publisher FASB
-URI https://asc.fasb.org//1943274/2147480097/470-10-S99-1A
Reference 24: http://www.xbrl.org/2003/role/disclosureRef
-Topic 470
-SubTopic 10
-Name Accounting Standards Codification
-Section S99
-Paragraph 1B
-Subparagraph (SX 210.13-02(a)(4)(i))
-Publisher FASB
-URI https://asc.fasb.org//1943274/2147480097/470-10-S99-1B
Reference 25: http://www.xbrl.org/2003/role/disclosureRef
-Topic 470
-SubTopic 10
-Name Accounting Standards Codification
-Section S99
-Paragraph 1B
-Subparagraph (SX 210.13-02(a)(4)(iii)(A))
-Publisher FASB
-URI https://asc.fasb.org//1943274/2147480097/470-10-S99-1B
Reference 26: http://www.xbrl.org/2003/role/disclosureRef
-Topic 470
-SubTopic 10
-Name Accounting Standards Codification
-Section S99
-Paragraph 1B
-Subparagraph (SX 210.13-02(a)(4)(iii)(B))
-Publisher FASB
-URI https://asc.fasb.org//1943274/2147480097/470-10-S99-1B
Reference 27: http://www.xbrl.org/2003/role/disclosureRef
-Topic 470
-SubTopic 10
-Name Accounting Standards Codification
-Section S99
-Paragraph 1B
-Subparagraph (SX 210.13-02(a)(4)(iv))
-Publisher FASB
-URI https://asc.fasb.org//1943274/2147480097/470-10-S99-1B
Reference 28: http://www.xbrl.org/2003/role/disclosureRef
-Topic 470
-SubTopic 10
-Name Accounting Standards Codification
-Section S99
-Paragraph 1B
-Subparagraph (SX 210.13-02(a)(5))
-Publisher FASB
-URI https://asc.fasb.org//1943274/2147480097/470-10-S99-1B
Reference 29: http://www.xbrl.org/2003/role/disclosureRef
-Topic 280
-SubTopic 10
-Name Accounting Standards Codification
-Section 50
-Paragraph 30
-Subparagraph (b)
-Publisher FASB
-URI https://asc.fasb.org//1943274/2147482810/280-10-50-30
Reference 30: http://www.xbrl.org/2003/role/disclosureRef
-Topic 280
-SubTopic 10
-Name Accounting Standards Codification
-Section 50
-Paragraph 32
-Subparagraph (f)
-Publisher FASB
-URI https://asc.fasb.org//1943274/2147482810/280-10-50-32
Reference 31: http://www.xbrl.org/2003/role/disclosureRef
-Topic 260
-SubTopic 10
-Name Accounting Standards Codification
-Section 45
-Paragraph 60B
-Subparagraph (a)
-Publisher FASB
-URI https://asc.fasb.org//1943274/2147482689/260-10-45-60B
Reference 32: http://www.xbrl.org/2003/role/exampleRef
-Topic 280
-SubTopic 10
-Name Accounting Standards Codification
-Section 50
-Paragraph 31
-Publisher FASB
-URI https://asc.fasb.org//1943274/2147482810/280-10-50-31
Reference 33: http://www.xbrl.org/2003/role/disclosureRef
-Topic 280
-SubTopic 10
-Name Accounting Standards Codification
-Section 50
-Paragraph 32
-Subparagraph (c)
-Publisher FASB
-URI https://asc.fasb.org//1943274/2147482810/280-10-50-32
Reference 34: http://www.xbrl.org/2003/role/disclosureRef
-Topic 205
-SubTopic 20
-Name Accounting Standards Codification
-Section 50
-Paragraph 7
-Publisher FASB
-URI https://asc.fasb.org//1943274/2147483499/205-20-50-7
Reference 35: http://fasb.org/us-gaap/role/ref/legacyRef
-Topic 230
-SubTopic 10
-Name Accounting Standards Codification
-Section 45
-Paragraph 28
-Publisher FASB
-URI https://asc.fasb.org//1943274/2147482740/230-10-45-28
Reference 36: http://www.xbrl.org/2003/role/disclosureRef
-Topic 220
-SubTopic 10
-Name Accounting Standards Codification
-Section 45
-Paragraph 1A
-Subparagraph (a)
-Publisher FASB
-URI https://asc.fasb.org//1943274/2147482790/220-10-45-1A
Reference 37: http://www.xbrl.org/2003/role/disclosureRef
-Topic 220
-SubTopic 10
-Name Accounting Standards Codification
-Section 45
-Paragraph 1B
-Subparagraph (a)
-Publisher FASB
-URI https://asc.fasb.org//1943274/2147482790/220-10-45-1B
Reference 38: http://fasb.org/us-gaap/role/ref/legacyRef
-Topic 220
-SubTopic 10
-Name Accounting Standards Codification
-Section S99
-Paragraph 2
-Subparagraph (SX 210.5-03(20))
-Publisher FASB
-URI https://asc.fasb.org//1943274/2147483621/220-10-S99-2
Reference 39: http://fasb.org/us-gaap/role/ref/legacyRef
-Topic 942
-SubTopic 220
-Name Accounting Standards Codification
-Section S99
-Paragraph 1
-Subparagraph (SX 210.9-04(22))
-Publisher FASB
-URI https://asc.fasb.org//1943274/2147483589/942-220-S99-1
| Name: |
us-gaap_NetIncomeLoss |
| Namespace Prefix: |
us-gaap_ |
| Data Type: |
xbrli:monetaryItemType |
| Balance Type: |
credit |
| Period Type: |
duration |
|
| X |
- DefinitionThe value of the noncash (or part noncash) consideration given (for example, liability, equity) in a transaction. Noncash is defined as transactions during a period that do not result in cash receipts or cash payments in the period. "Part noncash" refers to that portion of a transaction not resulting in cash receipts or cash payments in the period. Reference 1: http://fasb.org/us-gaap/role/ref/legacyRef
-Name Accounting Standards Codification
-Topic 230
-SubTopic 10
-Section 50
-Paragraph 4
-Publisher FASB
-URI https://asc.fasb.org//1943274/2147482913/230-10-50-4
Reference 2: http://fasb.org/us-gaap/role/ref/legacyRef
-Name Accounting Standards Codification
-Topic 230
-SubTopic 10
-Section 50
-Paragraph 3
-Publisher FASB
-URI https://asc.fasb.org//1943274/2147482913/230-10-50-3
Reference 3: http://fasb.org/us-gaap/role/ref/legacyRef
-Name Accounting Standards Codification
-Topic 230
-SubTopic 10
-Section 50
-Paragraph 5
-Publisher FASB
-URI https://asc.fasb.org//1943274/2147482913/230-10-50-5
| Name: |
us-gaap_OtherSignificantNoncashTransactionValueOfConsiderationGiven1 |
| Namespace Prefix: |
us-gaap_ |
| Data Type: |
xbrli:monetaryItemType |
| Balance Type: |
credit |
| Period Type: |
duration |
|
| X |
- DefinitionThe cash outflow to reacquire common stock during the period. Reference 1: http://fasb.org/us-gaap/role/ref/legacyRef
-Name Accounting Standards Codification
-Topic 230
-SubTopic 10
-Section 45
-Paragraph 15
-Subparagraph (a)
-Publisher FASB
-URI https://asc.fasb.org//1943274/2147482740/230-10-45-15
| Name: |
us-gaap_PaymentsForRepurchaseOfCommonStock |
| Namespace Prefix: |
us-gaap_ |
| Data Type: |
xbrli:monetaryItemType |
| Balance Type: |
credit |
| Period Type: |
duration |
|
| X |
- DefinitionThe cash outflow associated with the purchase of all investments (debt, security, other) during the period. Reference 1: http://fasb.org/us-gaap/role/ref/legacyRef
-Topic 230
-SubTopic 10
-Name Accounting Standards Codification
-Section 45
-Paragraph 13
-Publisher FASB
-URI https://asc.fasb.org//1943274/2147482740/230-10-45-13
| Name: |
us-gaap_PaymentsToAcquireInvestments |
| Namespace Prefix: |
us-gaap_ |
| Data Type: |
xbrli:monetaryItemType |
| Balance Type: |
credit |
| Period Type: |
duration |
|
| X |
- DefinitionThe cash outflow associated with the acquisition of long-lived, physical assets that are used in the normal conduct of business to produce goods and services and not intended for resale; includes cash outflows to pay for construction of self-constructed assets. Reference 1: http://fasb.org/us-gaap/role/ref/legacyRef
-Topic 230
-SubTopic 10
-Name Accounting Standards Codification
-Section 45
-Paragraph 13
-Subparagraph (c)
-Publisher FASB
-URI https://asc.fasb.org//1943274/2147482740/230-10-45-13
| Name: |
us-gaap_PaymentsToAcquirePropertyPlantAndEquipment |
| Namespace Prefix: |
us-gaap_ |
| Data Type: |
xbrli:monetaryItemType |
| Balance Type: |
credit |
| Period Type: |
duration |
|
| X |
- DefinitionThe cash inflow from the additional capital contribution to the entity. Reference 1: http://fasb.org/us-gaap/role/ref/legacyRef
-Name Accounting Standards Codification
-Section 45
-Paragraph 14
-Subparagraph (a)
-SubTopic 10
-Topic 230
-Publisher FASB
-URI https://asc.fasb.org//1943274/2147482740/230-10-45-14
| Name: |
us-gaap_ProceedsFromIssuanceOfCommonStock |
| Namespace Prefix: |
us-gaap_ |
| Data Type: |
xbrli:monetaryItemType |
| Balance Type: |
debit |
| Period Type: |
duration |
|
| X |
- DefinitionAmount of increase in right-of-use asset obtained in exchange for operating lease liability. Reference 1: http://www.xbrl.org/2003/role/exampleRef
-Topic 842
-SubTopic 20
-Name Accounting Standards Codification
-Section 55
-Paragraph 53
-Publisher FASB
-URI https://asc.fasb.org//1943274/2147479589/842-20-55-53
Reference 2: http://www.xbrl.org/2003/role/disclosureRef
-Topic 842
-SubTopic 20
-Name Accounting Standards Codification
-Section 50
-Paragraph 4
-Subparagraph (g)(2)
-Publisher FASB
-URI https://asc.fasb.org//1943274/2147478964/842-20-50-4
| Name: |
us-gaap_RightOfUseAssetObtainedInExchangeForOperatingLeaseLiability |
| Namespace Prefix: |
us-gaap_ |
| Data Type: |
xbrli:monetaryItemType |
| Balance Type: |
debit |
| Period Type: |
duration |
|
| X |
- DefinitionAmount of noncash expense for share-based payment arrangement. Reference 1: http://fasb.org/us-gaap/role/ref/legacyRef
-Name Accounting Standards Codification
-Section 45
-Paragraph 28
-Subparagraph (a)
-SubTopic 10
-Topic 230
-Publisher FASB
-URI https://asc.fasb.org//1943274/2147482740/230-10-45-28
| Name: |
us-gaap_ShareBasedCompensation |
| Namespace Prefix: |
us-gaap_ |
| Data Type: |
xbrli:monetaryItemType |
| Balance Type: |
debit |
| Period Type: |
duration |
|
v3.24.1
Summary of Significant Accounting Policies
|
12 Months Ended |
Dec. 31, 2023 |
|---|
| Summary of Significant Accounting Policies |
|
| Summary Of Significant Accounting Policies |
1. Summary of Significant Accounting Policies. Description of Business. The consolidated financial statements include the accounts of Lendway, Inc. (the “Company”), its wholly owned subsidiary, Farmland Credit, Inc., a Minnesota corporation (“FCI”), and FCI’s wholly owned subsidiaries, Farmland Credit FR, LLC and Farmland Credit AV, LLC. All significant inter-company balances and transactions have been eliminated. The Company has evolved into a specialty agricultural and finance company with operational focus on its agricultural investments. In April 2023, the Company launched its lending business, through the hiring of a Senior Vice President of Lending with over 20 years of experience in credit and lending. The Company is seeking to build a scalable non-bank lending business (the “Lending Business”) to purchase existing loans or originate and fund new loans, all of which will be secured by collateral. As described further in Note 2, on August 3, 2023, the Company completed the sale of certain assets and certain liabilities relating to the Company’s legacy business of providing in-store advertising solutions to brands, retailers, shopper marketing agencies and brokerages (the “In-Store Marketing Business”). The operations of the In-Store Marketing Business are presented as discontinued operations. All prior periods presented have been restated to present the In-Store Marketing Business as discontinued operations. As described further in Note 9, on February 22, 2024, the Company acquired majority ownership in Bloomia B.V. and its affiliated entities (“Bloomia”) for a price of $47.5 million financed with Company cash, a new credit facility and a note payable to the sellers. Bloomia produces fresh cut tulip stems. Bloomia purchases tulip bulbs, hydroponically grows tulips from the bulbs, and sells the stems to retail stores. Cash and Cash Equivalents. The Company considers all highly liquid investments with an original maturity date of three months or less to be cash equivalents. Cash equivalents are stated at cost, which approximates fair value. Cash and cash equivalents of $15,859,000 and $14,227,000 were in interest-bearing investments such as an insured sweep account, U.S. Treasury bills and a money market account at December 31, 2023 and 2022, respectively. The balances in cash accounts, at times, may exceed federally insured limits. The Company has not experienced any losses in such accounts and believes it is not exposed to any significant credit risk on cash and cash equivalents. Amounts held in checking accounts and in insured cash sweep accounts during the years ended December 31, 2023 and 2022 were fully insured under the Federal Deposit Insurance Corporation. December 31 | | 2023 | | | 2021 | | Cash and cash equivalents | | $ | 16,077,000 | | | $ | 14,439,000 | | Restricted cash | | | - | | | | 85,000 | | Total cash, cash equivalents and restricted cash | | $ | 16,077,000 | | | $ | 14,524,000 | |
Restricted Cash. The Company’s restricted cash consists of cash the Company was contractually obligated to maintain in accordance with the terms of the lease for its headquarters space in Minneapolis. Fair Value of Financial Instruments. Fair value is defined as the exit price, or the amount that would be received to sell an asset, or paid to transfer a liability, in an orderly transaction between market participants as of the measurement date. Accounting Standards Codification (“ASC”) 820-10 also establishes a hierarchy for inputs used in measuring fair value that maximizes the use of observable inputs and minimizes the use of unobservable inputs by requiring that the most observable inputs be used when available. Observable inputs are inputs market participants would use in valuing the asset or liability, developed based on market data obtained from sources independent of the Company. Unobservable inputs are inputs that reflect management’s assumptions about the factors market participants would use in valuing the asset or liability developed based upon the best information available in the circumstances. The hierarchy is divided into three levels. Level 1 inputs are quoted prices (unadjusted) in active markets for identical assets or liabilities. Level 2 inputs include quoted prices for similar assets or liabilities in active markets, quoted prices for identical or similar assets or liabilities in markets that are not active and inputs (other than quoted prices) that are observable for the asset or liability, either directly or indirectly. Level 3 inputs are unobservable inputs for the asset or liability. Categorization within the valuation hierarchy is based upon the lowest level of input that is significant to the fair value measurement. As of December 31, 2023 and 2022, the Company had no financial assets or liabilities measured at a fair value on a recurring basis. The Company records certain financial assets and liabilities at their carrying amounts that approximate fair value, based on their short-term nature. These financial assets and liabilities included cash and cash equivalents, other current assets related to discontinued operations, and accounts payable. Property and Equipment. Property and equipment are recorded at cost. Significant additions or improvements extending asset lives are capitalized, while repairs and maintenance are charged to expense when incurred. Expenditures are capitalized for development activities, while expenditures related to planning, training, and maintenance are expensed. Depreciation is provided in amounts sufficient to relate the cost of assets to operations over their estimated useful lives. The straight-line method of depreciation is used for financial reporting purposes and accelerated methods are used for tax purposes. Estimated useful lives of the assets are as follows: Office furniture and fixtures | 1 – 3 years | Computer equipment and software | 3 – 5 years | Leasehold improvements | 12 – 18 months |
Leases. The Company determines if an arrangement contains a lease at inception. Operating leases are included in operating lease right-of-use (ROU) assets, the current portion of operating lease liabilities, and the operating lease liabilities on the balance sheets. The ROU assets represent our right to control the use of an underlying asset for the lease term, and lease liabilities represent our obligation to make lease payments arising from the lease. Operating lease ROU assets and lease liabilities are recognized at commencement date and date of any lease modification based on the present value of lease payments over the lease term. The operating lease ROU assets also include any prepaid lease payments made and exclude lease incentives. Lease expense is recognized on a straight-line basis over the lease term. The Company has elected the practical expedient to exclude short-term leases (one year or less) from our ROU assets and lease liabilities. Impairment of Long-Lived Assets. The Company records impairment losses on long-lived assets used in operations when indicators of impairment are present and the undiscounted cash flows estimated to be generated by those assets are less than the assets’ carrying amount. Impaired assets are then recorded at their estimated fair value. Restructuring. In connection with the change in the Company’s strategy to the specialty agricultural and finance company, the Company’s prior CEO, Kristine A. Glancy, departed on August 31, 2023. Included in general and administrative expense of continuing operations is expense of $926,000 relating to change of control and other severance related payments and benefits to Ms. Glancy. As of December 31, 2023, $305,000 remained to be paid to Ms. Glancy and was included in accrued compensation. Subsequent to December 31, 2023 this amount was paid to Ms. Glancy. Income Taxes. Income taxes are accounted for under the liability method. Deferred income taxes are provided for temporary differences between the financial reporting and tax basis of assets and liabilities. Deferred taxes are reduced by a valuation allowance when, in the opinion of management, it is more likely than not that some portion or the entire deferred tax asset will not be realized. Deferred tax assets and liabilities are adjusted for the effects of changes in tax laws and rates on the date of the enactment. It is the Company’s policy to provide for uncertain tax positions and the related interest and penalties based upon management’s assessment of whether a tax benefit is more likely than not to be sustained upon examination by tax authorities. The Company recognizes interest and penalties accrued on any unrecognized tax benefits as a component of income tax expense (benefit). Stock-Based Compensation. The Company measures and recognizes compensation expense for all stock-based awards at fair value. Restricted stock units and awards are valued at the closing market price of the Company’s stock on the date of the grant. The Company uses the Black-Scholes option pricing model to determine the weighted average fair value of options and employee stock purchase plan rights. The determination of fair value of share-based payment awards on the date of grant using an option-pricing model is affected by our stock price as well as by assumptions regarding several complex and subjective variables. These variables include, but are not limited to, the expected stock price volatility over the term of the awards, and actual and projected employee stock option exercise behaviors. The expected lives of the options and employee stock purchase plan rights are based on evaluations of historical and expected future employee exercise behavior. The risk-free interest rate is based on the U.S. Treasury rates at the date of grant with maturity dates approximately equal to the expected term at grant date. Volatility is based on historical and expected future volatility of the Company’s stock. The Company has not historically issued any dividends beyond one-time dividends declared in 2011 and 2016 and does not expect to in the future. Net Income (Loss) Per Share. Basic net income (loss) per share is computed by dividing net income (loss) by the weighted average shares outstanding and excludes any dilutive effects of stock options and restricted stock units and awards. Diluted net income (loss) per share gives effect to all diluted potential common shares outstanding during the year. In determining diluted net income (loss) per share, whether net income from continuing operations is positive or negative controls whether dilutive shares are included in the determination. For all periods presented, net income from continuing operations is negative, a net loss. Accordingly, since including dilutive shares would dilute the loss from continuing operations, no dilutive shares are included in any of the per share calculations. Due to the net loss from continuing operations incurred during the year ended December 31, 2023 and 2022, all outstanding stock awards were considered anti-dilutive for those periods. Options to purchase approximately 1,000 shares of common stock with a weighted average exercise price of $15.54 were outstanding at December 31, 2023. Options to purchase approximately 53,000 shares of common stock with a weighted average exercise price of $11.69 were outstanding at December 31, 2022. Weighted average common shares outstanding for the years ended December 31, 2023 and 2022 were as follows: Year ended December 31 | | 2023 | | | 2022 | | Denominator for basic net income (loss) per share - weighted average shares | | | 1,781,000 | | | | 1,791,000 | | Effect of dilutive securities: | | | | | | | | | Stock options, restricted stock units and restricted stock awards | | | - | | | | - | | Denominator for diluted net income (loss) per share - weighted average shares | | | 1,781,000 | | | | 1,791,000 | |
Use of Estimates. The preparation of financial statements in conformity with accounting principles generally accepted in the United States of America requires management to make estimates and assumptions that affect the amounts reported in the financial statements and accompanying notes. Actual results could differ from these estimates.
|
| X |
- References
+ Details
| Name: |
us-gaap_AccountingPoliciesAbstract |
| Namespace Prefix: |
us-gaap_ |
| Data Type: |
xbrli:stringItemType |
| Balance Type: |
na |
| Period Type: |
duration |
|
| X |
- DefinitionThe entire disclosure for all significant accounting policies of the reporting entity. Reference 1: http://www.xbrl.org/2003/role/disclosureRef
-Topic 235
-SubTopic 10
-Name Accounting Standards Codification
-Section 50
-Paragraph 1
-Publisher FASB
-URI https://asc.fasb.org//1943274/2147483426/235-10-50-1
Reference 2: http://fasb.org/us-gaap/role/ref/legacyRef
-Topic 235
-Name Accounting Standards Codification
-Publisher FASB
-URI https://asc.fasb.org//235/tableOfContent
| Name: |
us-gaap_SignificantAccountingPoliciesTextBlock |
| Namespace Prefix: |
us-gaap_ |
| Data Type: |
dtr-types:textBlockItemType |
| Balance Type: |
na |
| Period Type: |
duration |
|
v3.24.1
Sale of In-Store Marketing Business and Presentation as Discontinued Operations
|
12 Months Ended |
Dec. 31, 2023 |
|---|
| Sale of In-Store Marketing Business and Presentation as Discontinued Operations |
|
| Sale of In-Store Marketing Business and Presentation as Discontinued Operations |
2. Sale of In-Store Marketing Business and Presentation as Discontinued Operations. On August 3, 2023, the Company completed the sale of certain assets and certain liabilities relating to the Company’s In-Store Marketing Business for a price of $3.5 million to TIMIBO LLC, an affiliate of Park Printing, Inc. (the “Buyer”), under an Asset Purchase Agreement (the “Purchase Agreement”). The Company retained accounts receivable, as well as cash, cash equivalents and marketable securities. The cash consideration for the sale was subject to a post-closing adjustment depending on the net balance of (i) cash received by the Company for programs that remained unexecuted as of August 3, 2023, minus (ii) the payments made by the Company to vendors for unexecuted programs. The final purchase adjustment for the net balance was to reduce the cash consideration by $1.5 million, with the Company retaining an equal amount of cash that had been received for unexecuted programs. Under the Purchase Agreement, $200,000 was escrowed for a twelve-month period for any future claims, as defined in the Purchase Agreement, by the Buyer against the Company. The gain on sale (before income taxes) of the In-Store Marketing Business was determined as follows: Gross sale price | | $ | 3,500,000 | | Adjustments per Purchase Agreement | | | (1,555,000 | ) | Adjusted Price | | | 1,945,000 | | | | | | | Liabilities assumed in excess of assets | | | 1,308,000 | | Transaction costs not previously expensed | | | (209,000 | ) | Gain on sale of In-Store Marketing Business | | $ | 3,044,000 | |
The Company incurred transaction-related severance and other separation benefits in connection with the termination of certain officers and employees of the discontinued operations of approximately $490,000, as well as retention award payouts totaling $343,000, of which $48,000 was included in continuing operations, and employee bonuses totaling $164,000, each of which was recorded as expense in the year ended December 31, 2023. The results of the In-Store Marketing Business have been presented as discontinued operations and the related assets and liabilities have been classified as related to discontinued operations, for all periods presented. The carrying amounts of major classes of assets and liabilities that were reclassified as related to discontinued operations on the Consolidated Balance Sheets were as follows: | | December 31, | | | December 31, | | | | 2023 | | | 2022 | | Current Assets: | | | | | | | Accounts receivable | | $ | 292,000 | | | $ | 5,557,000 | | Inventories | | | - | | | | 29,000 | | Prepaid production costs | | | - | | | | 535,000 | | Other prepaid expense | | | - | | | | 50,000 | | Current assets related to discontinued operations | | $ | 292,000 | | | $ | 6,171,000 | | | | | | | | | | | Other Assets: | | | | | | | | | Property and equipment, net | | $ | - | | | $ | 71,000 | | Operating lease right-of-use assets | | | - | | | | 144,000 | | Non-current assets related to discontinued operations | | $ | - | | | $ | 215,000 | | | | | | | | | | | Current Liabilities: | | | | | | | | | Accounts payable | | $ | 7,000 | | | $ | 2,515,000 | | Sales tax | | | 169,000 | | | | 717,000 | | Accrued liabilities | | | 81,000 | | | | 1,003,000 | | Current portion of operating lease liabilities | | | - | | | | 4,000 | | Deferred revenue | | | - | | | | 2,427,000 | | Current liabilities related to discontinued operations | | $ | 257,000 | | | $ | 6,666,000 | | | | | | | | | | | Long-Term Liabilities: | | | | | | | | | Operating lease liabilities | | $ | - | | | $ | 140,000 | | Non-current liabilities related to discontinued operations | | $ | - | | | $ | 140,000 | |
Results of discontinued operations are summarized below: Years Ended December 31 | | 2023 | | | 2022 | | Net services revenues | | $ | 21,078,000 | | | $ | 18,800,000 | | | | | | | | | | | Cost of services | | | 16,087,000 | | | | 15,499,000 | | Gross Profit | | | 4,991,000 | | | | 3,301,000 | | | | | | | | | | | Operating Expenses: | | | | | | | | | Selling | | | 1,136,000 | | | | 1,325,000 | | Marketing | | | 805,000 | | | | 1,050,000 | | General and administrative | | | 679,000 | | | | 878,000 | | Total Operating Expenses | | | 2,620,000 | | | | 3,253,000 | | | | | | | | | | | Gain from litigation settlement, net | | | - | | | | 12,000,000 | | | | | | | | | | | Operating Income | | | 2,371,000 | | | | 12,048,000 | | | | | | | | | | | Other income | | | 91,000 | | | | 68,000 | | Income from discontinued operations before income taxes | | | 2,462,000 | | | | 12,116,000 | | Income tax benefit | | | (12,000 | ) | | | (224,000 | ) | Income from discontinued operations, net of tax | | $ | 2,474,000 | | | $ | 12,340,000 | | | | | | | | | | | Gain from sale of discontinued operations before income taxes | | $ | 3,044,000 | | | $ | - | | Income tax expense | | | 83,000 | | | | - | | Gain from sale of discontinued operations, net of tax | | $ | 2,961,000 | | | $ | - | |
In July 2019, the Company filed suit against News Corporation, News America Marketing FSI L.L.C., and News America Marketing In-Store Services L.L.C. (collectively, “News America”), alleging violations of federal and state antitrust and tort laws by News America. On July 1, 2022, the Company entered into a $20 million settlement agreement with News America. The agreement resulted in net proceeds before income tax of $12,000,000 for the Company, which was recorded as a gain on litigation settlement in the discontinued operations of the In-Store Marketing Business for the year ended December 31, 2022. The income tax benefit for 2022 included a decrease of approximately $678,000 in unrecognized tax benefits related to state exposure in the third quarter of 2022, which reduced accrued income taxes and increased the current tax benefit.
|
| X |
- References
+ Details
| Name: |
ldwy_SaleOfInStoreMarketingBusinessAndPresentationAsDiscontinuedOperationsAbstract |
| Namespace Prefix: |
ldwy_ |
| Data Type: |
xbrli:stringItemType |
| Balance Type: |
na |
| Period Type: |
duration |
|
| X |
- References
+ Details
| Name: |
ldwy_SaleOfInStoreMarketingBusinessAndPresentationAsDiscontinuedOperationsTextBlock |
| Namespace Prefix: |
ldwy_ |
| Data Type: |
nonnum:textBlockItemType |
| Balance Type: |
na |
| Period Type: |
duration |
|
v3.24.1
Leases
|
12 Months Ended |
Dec. 31, 2023 |
|---|
| Leases |
|
| Leases |
3. Leases. As of December 31, 2023, the Company leased space from a related party under a non-cancelable operating lease for its corporate headquarters. The lease has monthly payments of $375 through September 30, 2025. The lease does not include a renewal option. The amounts included in “Other” below relate to an office lease that was terminated on September 30, 2023. The cost components in continuing operations of the Company’s operating leases were as follows: | | Year ended December 31, 2023 | | | Year ended December 31, 2022 | | | | Corporate | | | | | | | | | | | | | Headquarters | | | Other | | | Total | | | Operating Leases - Other | | Operating lease cost | | $ | 1,000 | | | $ | 4,000 | | | $ | 5,000 | | | $ | 14,000 | | Short-term lease costs | | | 2,000 | | | | 10,000 | | | | 12,000 | | | | - | | Total | | $ | 3,000 | | | $ | 14,000 | | | $ | 17,000 | | | $ | 14,000 | |
Maturities of the Company’s lease liabilities for its corporate headquarters and its warehouse operating leases were as follows as of December 31, 2023: 2024 | | $ | 5,000 | | 2025 | | | 3,000 | | Total lease payments | | $ | 8,000 | | Less: Interest | | | (1,000 | ) | Present value of lease liabilities | | $ | 7,000 | |
The Company used its incremental borrowing rate of approximately 6.0% in determining the present value of the lease payments based on the information available at the lease commencement date. The remaining lease term as of December 31, 2023 for the Company’s corporate headquarters is 1.8 years. The cash outflow for operating leases including discontinued operations for the years ended December 31, 2023 and 2022 were $28,000 and $28,000, respectively.
|
| X |
- References
+ Details
| Name: |
us-gaap_LeasesAbstract |
| Namespace Prefix: |
us-gaap_ |
| Data Type: |
xbrli:stringItemType |
| Balance Type: |
na |
| Period Type: |
duration |
|
| X |
- DefinitionThe entire disclosure for lessee entity's leasing arrangements including, but not limited to, all of the following: (a.) The basis on which contingent rental payments are determined, (b.) The existence and terms of renewal or purchase options and escalation clauses, (c.) Restrictions imposed by lease agreements, such as those concerning dividends, additional debt, and further leasing. Reference 1: http://fasb.org/us-gaap/role/ref/otherTransitionRef
-Topic 840
-Name Accounting Standards Codification
-Publisher FASB
-URI https://asc.fasb.org//840/tableOfContent
| Name: |
us-gaap_LeasesOfLesseeDisclosureTextBlock |
| Namespace Prefix: |
us-gaap_ |
| Data Type: |
dtr-types:textBlockItemType |
| Balance Type: |
na |
| Period Type: |
duration |
|
v3.24.1
Commitments and Contingencies
|
12 Months Ended |
Dec. 31, 2023 |
|---|
| Commitments and Contingencies |
|
| Commitments and Contingencies |
4. Commitments and Contingencies. Legal. The Company is subject to various legal matters in the normal course of business. The outcome of these matters is not expected to have a material effect on the Company’s financial position or results of operations.
|
| X |
- References
+ Details
| Name: |
us-gaap_CommitmentsAndContingenciesDisclosureAbstract |
| Namespace Prefix: |
us-gaap_ |
| Data Type: |
xbrli:stringItemType |
| Balance Type: |
na |
| Period Type: |
duration |
|
| X |
- DefinitionThe entire disclosure for commitments and contingencies. Reference 1: http://www.xbrl.org/2003/role/disclosureRef
-Topic 440
-SubTopic 10
-Name Accounting Standards Codification
-Section 50
-Paragraph 4
-Subparagraph (a)
-Publisher FASB
-URI https://asc.fasb.org//1943274/2147482648/440-10-50-4
Reference 2: http://www.xbrl.org/2009/role/commonPracticeRef
-Topic 450
-Name Accounting Standards Codification
-Publisher FASB
-URI https://asc.fasb.org//450/tableOfContent
Reference 3: http://www.xbrl.org/2003/role/disclosureRef
-Topic 954
-SubTopic 440
-Name Accounting Standards Codification
-Section 50
-Paragraph 1
-Subparagraph (a)
-Publisher FASB
-URI https://asc.fasb.org//1943274/2147480327/954-440-50-1
Reference 4: http://www.xbrl.org/2003/role/disclosureRef
-Topic 440
-SubTopic 10
-Name Accounting Standards Codification
-Section 50
-Paragraph 4
-Subparagraph (c)
-Publisher FASB
-URI https://asc.fasb.org//1943274/2147482648/440-10-50-4
Reference 5: http://fasb.org/us-gaap/role/ref/legacyRef
-Topic 440
-Name Accounting Standards Codification
-Publisher FASB
-URI https://asc.fasb.org//440/tableOfContent
| Name: |
us-gaap_CommitmentsAndContingenciesDisclosureTextBlock |
| Namespace Prefix: |
us-gaap_ |
| Data Type: |
dtr-types:textBlockItemType |
| Balance Type: |
na |
| Period Type: |
duration |
|
v3.24.1
Stockholders Equity
|
12 Months Ended |
Dec. 31, 2023 |
|---|
| Stockholders Equity |
|
| Shareholders' Equity |
5. Stockholders’ Equity. Stock-Based Compensation. The Company’s stock-based compensation plans are administered by the Compensation Committee of the Board of Directors, which, subject to approval by the Board of Directors, selects persons to receive awards and determines the number of shares subject to each award and the terms, conditions, performance measures and other provisions of the award. Stock-based compensation expense that was recognized in the continuing operations of the Company’s consolidated statements of operations for the years ended December 31, 2023 and 2022 was $39,000 and $91,000, respectively. Stock based compensation for discontinued operations for the years ended December 31, 2023 and 2022 was $5,000 and $32,000, respectively The Company uses the Black-Scholes option pricing model to estimate fair value of stock-based awards with the following weighted-average assumptions: | | 2023 | | | 2022 | | Employee Stock Purchase Plan: | | | | | | | Expected life (years) | | | 1.0 | | | | 1.0 | | Expected volatility | | | 95 | % | | | 169 | % | Dividend yield | | | 0 | % | | | 0 | % | Risk-free interest rate | | | 4.7 | % | | | 0.4 | % |
The Company uses the graded attribution method to recognize expense for unvested stock-based awards. Forfeitures are recognized as incurred. Stock Options, Restricted Stock, Restricted Stock Units, and Other Stock-Based Compensation Awards. The Company maintains stock and incentive plans (the “Plans). Under the terms of the Plans, the Company may grant awards in a variety of instruments including stock options, restricted stock and restricted stock units to employees, consultants and directors generally at an exercise price at or above 100% of fair market value at the close of business on the date of grant. Stock options expire 10 years after the date of grant and generally vest over three years. The Company issues new shares of common stock upon grant of restricted stock, when stock options are exercised, and when restricted stock units are vested and/or settled. The following table summarizes activity under the Plans: | | Plan Shares Available for Grant | | | Plan Options Outstanding | | | Weighted Average Exercise Price Per Share | | | Aggregate Intrinsic Value | | Balance at January 1, 2022 | | | 97,648 | | | | 19,122 | | | $ | 13.23 | | | | | Restricted stock units and awards granted | | | (6,248 | ) | | | — | | | | | | | | | Stock options exercised | | | — | | | | (1,300 | ) | | | 8.26 | | | $ | 2,422 | | Cancelled or forfeited options | | | 1,462 | | | | (3,736 | ) | | | 11.41 | | | | | | Balance at December 31, 2022 | | | 92,862 | | | | 14,086 | | | | 14.17 | | | | | | | | | | | | | | | | | | | | | | | Cancelled or forfeited options | | | 12,623 | | | | (12,623 | ) | | | 14.02 | | | | | | Balance at December 31, 2023 | | | 105,485 | | | | 1,463 | | | | 15.54 | | | | | |
The following table summarizes information about the stock options outstanding at December 31, 2023: | | | Options Outstanding | | | Options Exercisable | | Exercise Prices | | | Number Outstanding | | | Weighted Average Remaining Contractual Life | | Weighted Average Exercise Price Per Share | | | Number Exercisable | | | Weighted Average Exercise Price Per Share | | | $ | 15.54 | | | | 1,463 | | | | 0.39 | | | years | | $ | 15.54 | | | | 1,463 | | | $ | 15.54 | |
Options outstanding under the Plans expire in May 2024. Options outstanding at December 31, 2023 and 2022 had no intrinsic value. Options exercisable at December 31, 2022 had a weighted average remaining life of 4.44 years and no intrinsic value. During the year ended December 31, 2023 and 2022, no equity awards were issued by the Company except for the following awards to non-employee members of the Board of Directors. In August 2022, non-employee members of the Board of Directors received restricted stock grants totaling 6,248 shares. The shares underlying the awards were assigned a value of $9.60 per share, which was the closing price of the Company’s common stock on the date of grant, for a total grant date value of $60,000. The shares vested July 26, 2023. Restricted stock and restricted stock unit transactions during the years ended December 31, 2023 and 2022 are summarized as follows: As of December 31, 2023, there was no unrecognized compensation costs related to outstanding stock options or restricted stock. | | Number of Shares | | | Weighted average grant date fair value | | Unvested shares at January 1, 2022 | | | 8,531 | | | $ | 10.01 | | Granted | | | 6,248 | | | | 9.60 | | Vested | | | (8,910 | ) | | | 10.25 | | Unvested shares at December 31, 2022 | | | 5,869 | | | $ | 9.21 | | | | | | | | | | | Granted | | | — | | | | | | Vested | | | (5,869 | ) | | | 7.66 | | Unvested shares at December 31, 2023 | | | — | | | | — | |
Employee Stock Purchase Plan. The Company has an Employee Stock Purchase Plan (the “ESPP”) that enables employees to contribute up to 10% of their base compensation toward the purchase of the Company’s common stock at 85% of its market value on the first or last day of the year. During the years ended December 31, 2023 and 2022, respectively, participants purchased 338 and 1,153 shares under the ESPP. At December 31, 2023, 22,945 shares were reserved for future employee purchases of common stock under the ESPP. For the years ended December 31, 2023 and 2022, the Company recognized $7,000 and $32,000, respectively, of stock-based compensation expense related to the ESPP that was recognized in the continuing operations. Dividends. The Company has not historically paid dividends, other than one-time dividends declared in 2011 and 2016. The Company intends to retain earnings from operations for use in advancing our business strategy; however, the Company may consider special dividends in the future.
|
| X |
- DefinitionThe entire disclosure for shareholders' equity and share-based payment arrangement. Includes, but is not limited to, disclosure of policy and terms of share-based payment arrangement, deferred compensation arrangement, and employee stock purchase plan (ESPP). Reference 1: http://fasb.org/us-gaap/role/ref/legacyRef
-Topic 505
-Name Accounting Standards Codification
-Publisher FASB
-URI https://asc.fasb.org//505/tableOfContent
Reference 2: http://fasb.org/us-gaap/role/ref/legacyRef
-Topic 718
-Name Accounting Standards Codification
-Publisher FASB
-URI https://asc.fasb.org//718/tableOfContent
| Name: |
us-gaap_ShareholdersEquityAndShareBasedPaymentsTextBlock |
| Namespace Prefix: |
us-gaap_ |
| Data Type: |
dtr-types:textBlockItemType |
| Balance Type: |
na |
| Period Type: |
duration |
|
| X |
- References
+ Details
| Name: |
us-gaap_StockholdersEquityNoteAbstract |
| Namespace Prefix: |
us-gaap_ |
| Data Type: |
xbrli:stringItemType |
| Balance Type: |
na |
| Period Type: |
duration |
|
v3.24.1
Income Taxes
|
12 Months Ended |
Dec. 31, 2023 |
|---|
| Income Taxes |
|
| Income Taxes |
6. Income Taxes. Income tax expense from continuing operations consists of the following: Year Ended December 31 | | 2023 | | | 2022 | | Current taxes - Federal | | $ | - | | | $ | - | | Current taxes - State | | | 20,000 | | | | 6,000 | | Income tax expense | | $ | 20,000 | | | $ | 6,000 | |
The actual tax (expense) benefit attributable to income (loss) from continuing operations before taxes differs from the expected tax benefit (expense) computed by applying the U.S. federal corporate income tax rate of 21% as follows: Year Ended December 31 | | 2023 | | | 2022 | | Federal statutory rate | | | 21.0 | % | | | 21.0 | % | Stock-based awards | | | (0.5 | ) | | | (0.7 | ) | State benefit | | | 3.1 | | | | 2.7 | | Valuation allowance | | | (24.6 | ) | | | (24.6 | ) | Other | | | 0.3 | | | | 1.3 | | | | | | | | | | | Effective federal income tax rate | | | (0.7 | )% | | | (0.3 | )% |
Components of resulting noncurrent deferred tax assets (liabilities) are as follows: As of December 31 | | 2023 | | | 2022 | | Deferred tax assets | | | | | | | Accrued expenses | | $ | 117,000 | | | $ | 231,000 | | Inventory reserve | | | - | | | | 23,000 | | Stock-based awards | | | 9,000 | | | | 24,000 | | Reserve for bad debts | | | 2,000 | | | | 26,000 | | Net operating loss and credit carryforwards | | | 529,000 | | | | 824,000 | | Other | | | 2,000 | | | | 23,000 | | Depreciation | | | - | | | | 43,000 | | Valuation allowance | | | (645,000 | ) | | | (1,175,000 | ) | | | | | | | | | | Total deferred tax assets | | $ | 14,000 | | | $ | 19,000 | | | | | | | | | | | Deferred tax liabilities | | | | | | | | | Depreciation | | $ | (5,000 | ) | | $ | - | | Prepaid expenses | | | (9,000 | ) | | | (19,000 | ) | | | | | | | | | | Total deferred tax liabilities | | | (14,000 | ) | | | (19,000 | ) | | | | | | | | | | Net deferred income tax | | $ | - | | | $ | - | |
As of December 31, 2023, the Company had a Federal pre-tax net operating loss (NOL) to carry forward of approximately $1,607,000 and state pre-tax NOLs of approximately $2,914,000 to carry forward. The Federal NOLs can be carried forward indefinitely. The expiration of state NOLs carried forward varies by taxing jurisdiction. Future utilization of NOLs carried forward may be subject to certain limitations under Section 382 of the Internal Revenue Code. The Company evaluates all significant available positive and negative evidence, including the existence of losses in prior years and its forecast of future taxable income, in assessing the need for a valuation allowance. The underlying assumptions the Company uses in forecasting future taxable income require significant judgment and take into consideration the Company’s recent performance. The change in the valuation allowance for the years ended December 31, 2023 and 2022 was a decrease of $530,000 and $1,970,000, respectively. The valuation allowance decreases in 2023 and 2022 were primarily related to the utilization of the Company’s net operating losses carried forward against the Company’s taxable income. Such utilization was limited to 80% of the Company’s taxable income for the year. The Company has recorded a liability of $42,000 and $53,000 for uncertain tax positions taken on tax returns in previous years as of December 31, 2023 and 2022, respectively. This liability is reflected as accrued income taxes on the Company’s balance sheets. The Company files income tax returns in the United States and numerous state and local tax jurisdictions. Tax years 2020 and forward are open for examination and assessment by the Internal Revenue Service. With limited exceptions, tax years prior to 2020 are no longer open in major state and local tax jurisdictions. The Company has recorded a decrease of approximately $16,000 in unrecognized tax benefits related to state exposure in the third quarter of 2023, which reduced accrued income taxes and increased the current income tax benefit. The Company determined it was no longer more likely than not that the Company would realize the tax expense. A reconciliation of the beginning and ending amount of the liability for uncertain tax positions is as follows: Balance at January 1, 2022 | | $ | 711,000 | | Decrease due to state tax expense | | | (678,000 | ) | Increases due to interest and state tax | | | 20,000 | | Balance at December 31, 2022 | | $ | 53,000 | | | | | | | Decrease due to state tax expense | | $ | (16,000 | ) | Increases due to interest and state tax | | | 5,000 | | Balance at December 31, 2023 | | $ | 42,000 | |
|
| X |
- DefinitionThe entire disclosure for income taxes. Disclosures may include net deferred tax liability or asset recognized in an enterprise's statement of financial position, net change during the year in the total valuation allowance, approximate tax effect of each type of temporary difference and carryforward that gives rise to a significant portion of deferred tax liabilities and deferred tax assets, utilization of a tax carryback, and tax uncertainties information. Reference 1: http://www.xbrl.org/2003/role/disclosureRef
-Topic 946
-SubTopic 20
-Name Accounting Standards Codification
-Section 50
-Paragraph 13
-Publisher FASB
-URI https://asc.fasb.org//1943274/2147480990/946-20-50-13
Reference 2: http://www.xbrl.org/2003/role/disclosureRef
-Topic 235
-SubTopic 10
-Name Accounting Standards Codification
-Section S99
-Paragraph 1
-Subparagraph (SX 210.4-08(h)(2))
-Publisher FASB
-URI https://asc.fasb.org//1943274/2147480678/235-10-S99-1
Reference 3: http://www.xbrl.org/2003/role/disclosureRef
-Topic 740
-Name Accounting Standards Codification
-Publisher FASB
-URI https://asc.fasb.org//740/tableOfContent
Reference 4: http://www.xbrl.org/2003/role/disclosureRef
-Topic 740
-SubTopic 10
-Name Accounting Standards Codification
-Section 50
-Paragraph 14
-Publisher FASB
-URI https://asc.fasb.org//1943274/2147482685/740-10-50-14
Reference 5: http://www.xbrl.org/2003/role/disclosureRef
-Topic 740
-SubTopic 10
-Name Accounting Standards Codification
-Section 50
-Paragraph 21
-Publisher FASB
-URI https://asc.fasb.org//1943274/2147482685/740-10-50-21
Reference 6: http://www.xbrl.org/2003/role/disclosureRef
-Topic 740
-SubTopic 270
-Name Accounting Standards Codification
-Section 50
-Paragraph 1
-Publisher FASB
-URI https://asc.fasb.org//1943274/2147482526/740-270-50-1
Reference 7: http://www.xbrl.org/2003/role/disclosureRef
-Topic 740
-SubTopic 10
-Name Accounting Standards Codification
-Section 50
-Paragraph 17
-Subparagraph (b)
-Publisher FASB
-URI https://asc.fasb.org//1943274/2147482685/740-10-50-17
Reference 8: http://www.xbrl.org/2003/role/disclosureRef
-Topic 740
-SubTopic 10
-Name Accounting Standards Codification
-Section S99
-Paragraph 1
-Subparagraph (SAB TOPIC 6.I.5.Q1)
-Publisher FASB
-URI https://asc.fasb.org//1943274/2147479360/740-10-S99-1
Reference 9: http://www.xbrl.org/2003/role/disclosureRef
-Topic 740
-SubTopic 10
-Name Accounting Standards Codification
-Section S99
-Paragraph 2
-Subparagraph (SAB Topic 11.C)
-Publisher FASB
-URI https://asc.fasb.org//1943274/2147479360/740-10-S99-2
Reference 10: http://www.xbrl.org/2003/role/disclosureRef
-Topic 740
-SubTopic 30
-Name Accounting Standards Codification
-Section 50
-Paragraph 2
-Subparagraph (a)
-Publisher FASB
-URI https://asc.fasb.org//1943274/2147482603/740-30-50-2
| Name: |
us-gaap_IncomeTaxDisclosureTextBlock |
| Namespace Prefix: |
us-gaap_ |
| Data Type: |
dtr-types:textBlockItemType |
| Balance Type: |
na |
| Period Type: |
duration |
|
v3.24.1
Employee Benefit Plans
|
12 Months Ended |
Dec. 31, 2023 |
|---|
| Employee Benefit Plans |
|
| Employee Benefit Plans |
7. Employee Benefit Plans. The Company sponsors a Retirement Profit Sharing and Savings Plan under Section 401(k) of the Internal Revenue Code. The plan allows employees to defer up to 50% of their wages, subject to Federal limitations, on a pre-tax basis through contributions to the plan. During the years ended December 31, 2023 and 2022, the Company’s expense in continuing operations for matching contributions was $13,000 and $8,000, respectively.
|
| X |
- References
+ Details
| Name: |
us-gaap_CompensationAndRetirementDisclosureAbstract |
| Namespace Prefix: |
us-gaap_ |
| Data Type: |
xbrli:stringItemType |
| Balance Type: |
na |
| Period Type: |
duration |
|
| X |
- DefinitionThe entire disclosure for retirement benefits. Reference 1: http://www.xbrl.org/2003/role/disclosureRef
-Topic 715
-SubTopic 70
-Name Accounting Standards Codification
-Section 50
-Paragraph 1
-Publisher FASB
-URI https://asc.fasb.org//1943274/2147480794/715-70-50-1
Reference 2: http://www.xbrl.org/2003/role/exampleRef
-Topic 715
-SubTopic 20
-Name Accounting Standards Codification
-Section 55
-Paragraph 17
-Publisher FASB
-URI https://asc.fasb.org//1943274/2147480482/715-20-55-17
Reference 3: http://www.xbrl.org/2003/role/disclosureRef
-Topic 715
-SubTopic 20
-Name Accounting Standards Codification
-Section 50
-Paragraph 1
-Subparagraph (d)(iv)(03)
-Publisher FASB
-URI https://asc.fasb.org//1943274/2147480506/715-20-50-1
Reference 4: http://www.xbrl.org/2003/role/disclosureRef
-Topic 715
-SubTopic 20
-Name Accounting Standards Codification
-Section 50
-Paragraph 1
-Subparagraph (d)(i)
-Publisher FASB
-URI https://asc.fasb.org//1943274/2147480506/715-20-50-1
Reference 5: http://www.xbrl.org/2003/role/disclosureRef
-Topic 715
-SubTopic 20
-Name Accounting Standards Codification
-Section 50
-Paragraph 1
-Subparagraph (q)
-Publisher FASB
-URI https://asc.fasb.org//1943274/2147480506/715-20-50-1
Reference 6: http://www.xbrl.org/2003/role/disclosureRef
-Topic 715
-SubTopic 20
-Name Accounting Standards Codification
-Section 50
-Paragraph 1
-Subparagraph (l)
-Publisher FASB
-URI https://asc.fasb.org//1943274/2147480506/715-20-50-1
Reference 7: http://www.xbrl.org/2003/role/disclosureRef
-Topic 715
-Name Accounting Standards Codification
-Publisher FASB
-URI https://asc.fasb.org//715/tableOfContent
Reference 8: http://www.xbrl.org/2003/role/disclosureRef
-Topic 715
-SubTopic 20
-Name Accounting Standards Codification
-Section 50
-Paragraph 1
-Subparagraph (d)(iii)
-Publisher FASB
-URI https://asc.fasb.org//1943274/2147480506/715-20-50-1
Reference 9: http://www.xbrl.org/2003/role/disclosureRef
-Topic 715
-SubTopic 20
-Name Accounting Standards Codification
-Section 50
-Paragraph 1
-Subparagraph (o)
-Publisher FASB
-URI https://asc.fasb.org//1943274/2147480506/715-20-50-1
Reference 10: http://www.xbrl.org/2003/role/disclosureRef
-Topic 715
-SubTopic 20
-Name Accounting Standards Codification
-Section 50
-Paragraph 1
-Subparagraph (p)
-Publisher FASB
-URI https://asc.fasb.org//1943274/2147480506/715-20-50-1
Reference 11: http://www.xbrl.org/2003/role/disclosureRef
-Topic 715
-SubTopic 20
-Name Accounting Standards Codification
-Section 50
-Paragraph 1
-Subparagraph (r)(1)
-Publisher FASB
-URI https://asc.fasb.org//1943274/2147480506/715-20-50-1
Reference 12: http://www.xbrl.org/2003/role/disclosureRef
-Topic 715
-SubTopic 20
-Name Accounting Standards Codification
-Section 50
-Paragraph 1
-Subparagraph (r)(2)
-Publisher FASB
-URI https://asc.fasb.org//1943274/2147480506/715-20-50-1
Reference 13: http://www.xbrl.org/2003/role/disclosureRef
-Topic 715
-SubTopic 20
-Name Accounting Standards Codification
-Section S99
-Paragraph 2
-Publisher FASB
-URI https://asc.fasb.org//1943274/2147480126/715-20-S99-2
Reference 14: http://www.xbrl.org/2003/role/disclosureRef
-Topic 715
-SubTopic 60
-Name Accounting Standards Codification
-Section 50
-Paragraph 3
-Subparagraph (c)
-Publisher FASB
-URI https://asc.fasb.org//1943274/2147480266/715-60-50-3
| Name: |
us-gaap_PensionAndOtherPostretirementBenefitsDisclosureTextBlock |
| Namespace Prefix: |
us-gaap_ |
| Data Type: |
dtr-types:textBlockItemType |
| Balance Type: |
na |
| Period Type: |
duration |
|
v3.24.1
Stock Repurchases
|
12 Months Ended |
Dec. 31, 2023 |
|---|
| Stock Repurchases |
|
| Stock Repurchase Plan |
8. Stock Repurchases. On August 23, 2023, the Company’s Board of Directors authorized the repurchase of up to 400,000 shares of the Company’s common stock. The authorization allows the purchases to be made in the open market or in privately negotiated transactions. The authorization does not obligate the Company to repurchase any particular number of shares; and may be suspended anytime at the Company’s discretion. During the year ended December 31, 2023, the Company repurchased 84,028 shares for $482,000.
|
| X |
- References
+ Details
| Name: |
ldwy_StockRepurchasePlanDisclosureTextBlock |
| Namespace Prefix: |
ldwy_ |
| Data Type: |
nonnum:textBlockItemType |
| Balance Type: |
na |
| Period Type: |
duration |
|
| X |
- References
+ Details
| Name: |
ldwy_StockRepurchasesAbstract |
| Namespace Prefix: |
ldwy_ |
| Data Type: |
xbrli:stringItemType |
| Balance Type: |
na |
| Period Type: |
duration |
|
v3.24.1
Subsequent Events
|
12 Months Ended |
Dec. 31, 2023 |
|---|
| Subsequent Events |
|
| Subsequent Events |
9. Subsequent Events Acquisition of Bloomia On February 22, 2024, the Company acquired majority ownership in Bloomia B.V. and its subsidiaries for a price of $47.5 million. The acquisition price was paid with $9.2 million of the Company’s cash, $22.8 million of proceeds from a new credit facility, and notes payable of $15.5 million to the sellers. Bloomia purchases tulip bulbs, hydroponically grows tulips from the bulbs, and sells the stems to retail stores. Lendway owns a significant majority and is the managing member of Tulp 24.1, LLC, which holds the Bloomia enitities. Bloomia’s continuing CEO owns the remaining approximately 18.6% of Tulp 24.1, LLC. The acquisition will be accounted for as a business combination using the acquisition method of accounting. The acquisition method of accounting requires, among other things, that assets acquired and liabilities assumed be recognized at their fair values as of the acquisition date. Due to the limited amount of time since the acquisition date and the complexity of Bloomia’s financial records prepated under Dutch GAAP, the preliminary acquisition valuation for the business combination is incomplete at this time. As a result, the Company is unable to provide the amounts recognized as of the acquisition date for the major classes of assets acquired and liabilities assumed, including the information required for valuation of intangible assets and goodwill. The unaudited pro forma net sales of the combined entity for the twelve months ended December 31, 2023 are approximately $45 million. The unaudited pro forma net sales of the combined entity are based on historical net sales from continuing operations from Lendway and the net sales for Bloomia. The unaudited pro forma net sales values are not necessarily indicative of the results that would have been obtained if the acquisition had occurred as of the beginning of 2023 or that may be obtained in the future. Because the initial accounting for the business combination is incomplete at this time, the Company is unable to provide pro forma net earnings of the combined entity. Credit Agreement To finance the Bloomia acquisition, the Company entered into a revolving credit and term loan agreement (the “Credit Agreement”), together with Tulp 24.1 as the borrower. Under the terms of the Credit Agreement, the Company had an $18.0 million term loan funded. The Credit Agreement also contains a $6.0 million revolving credit facility, which may be used by the Company for general business purposes and working capital. Borrowings under the Credit Agreement bear interest at a rate per annum equal to Term SOFR for an interest period of one month plus 3.0%. In addition to paying interest on the outstanding principal under the Credit Agreement, Tulp 24.1 is required to pay a commitment fee of 0.50% on the unutilized commitments under the revolving credit facility. The term loans will be repaid in quarterly installments of $450,000, commencing on June 30, 2024. The remaining outstanding balance will be repaid in full after five years. The scheduled maturity of the revolving facility is February 20, 2029. The obligations under the Credit Agreement are secured by substantially all of the personal property assets of Tulp 24.1 and its subsidiaries. The Company provided an unsecured guaranty of the obligations of Tulp 24.1 under the Credit Agreement. Commencing with the fiscal quarter ending on March 31, 2024, the Credit Agreement will require Tulp 24.1 and its subsidiaries to maintain (a) a minimum fixed charge coverage ratio of not less than 1.25 to 1.00 and (b) a maximum senior cash flow leverage ratio of 3.0 to 1.0 until September 30, 2024, and stepping down to 2.00 to 1.00 on December 31, 2027, until the maturity date of the Credit Agreement. The Credit Agreement also contains other customary affirmative and negative covenants, including covenants that restrict the ability of Tulp 24.1 and its subsidiaries to incur additional indebtedness, dispose of significant assets, make distributions or pay dividends to the Company, make certain investments, including any acquisitions other than permitted acquisitions, make certain payments, enter into sale and leaseback transactions or grant liens on its assets, subject to certain limitations. The Credit Agreement contains customary events of default, the occurrence of which would permit the lenders to terminate their commitments and accelerate loans under the Credit Agreement, including failure to make payments under the credit facility, failure to comply with covenants in the Credit Agreement and other loan documents, cross default to other material indebtedness of Tulp 24.1 or any of its subsidiaries, failure of Tulp 24.1 or any of its subsidiaries to pay or discharge material judgments, bankruptcy of Tulp 24.1 or any of its subsidiaries, and change of control of the Company. Notes Payable to Sellers As part of the financing of the Bloomia acquisition, Tulp 24.1 entered into notes payable with the sellers. Notes payable for $12.8 million have a term of five years, subject to requiring principal payments based on “excess cash flow” as defined. Interest is at 8% per annum in the first year and increase annually by 2 percentage points. Notes payable for $2.7 million have a term of nine calendar weeks after the closing date. Interest is at 8%.
|
| X |
- References
+ Details
| Name: |
us-gaap_SubsequentEventsAbstract |
| Namespace Prefix: |
us-gaap_ |
| Data Type: |
xbrli:stringItemType |
| Balance Type: |
na |
| Period Type: |
duration |
|
| X |
- DefinitionThe entire disclosure for significant events or transactions that occurred after the balance sheet date through the date the financial statements were issued or the date the financial statements were available to be issued. Examples include: the sale of a capital stock issue, purchase of a business, settlement of litigation, catastrophic loss, significant foreign exchange rate changes, loans to insiders or affiliates, and transactions not in the ordinary course of business. Reference 1: http://www.xbrl.org/2003/role/disclosureRef
-Topic 855
-Name Accounting Standards Codification
-Publisher FASB
-URI https://asc.fasb.org//855/tableOfContent
Reference 2: http://www.xbrl.org/2003/role/disclosureRef
-Topic 855
-SubTopic 10
-Name Accounting Standards Codification
-Section 50
-Paragraph 2
-Subparagraph (a)
-Publisher FASB
-URI https://asc.fasb.org//1943274/2147483399/855-10-50-2
| Name: |
us-gaap_SubsequentEventsTextBlock |
| Namespace Prefix: |
us-gaap_ |
| Data Type: |
dtr-types:textBlockItemType |
| Balance Type: |
na |
| Period Type: |
duration |
|
v3.24.1
Summary of Significant Accounting Policies (Policies)
|
12 Months Ended |
Dec. 31, 2023 |
|---|
| Summary of Significant Accounting Policies |
|
| Description of Business |
Description of Business. The consolidated financial statements include the accounts of Lendway, Inc. (the “Company”), its wholly owned subsidiary, Farmland Credit, Inc., a Minnesota corporation (“FCI”), and FCI’s wholly owned subsidiaries, Farmland Credit FR, LLC and Farmland Credit AV, LLC. All significant inter-company balances and transactions have been eliminated. The Company has evolved into a specialty agricultural and finance company with operational focus on its agricultural investments. In April 2023, the Company launched its lending business, through the hiring of a Senior Vice President of Lending with over 20 years of experience in credit and lending. The Company is seeking to build a scalable non-bank lending business (the “Lending Business”) to purchase existing loans or originate and fund new loans, all of which will be secured by collateral. As described further in Note 2, on August 3, 2023, the Company completed the sale of certain assets and certain liabilities relating to the Company’s legacy business of providing in-store advertising solutions to brands, retailers, shopper marketing agencies and brokerages (the “In-Store Marketing Business”). The operations of the In-Store Marketing Business are presented as discontinued operations. All prior periods presented have been restated to present the In-Store Marketing Business as discontinued operations. As described further in Note 9, on February 22, 2024, the Company acquired majority ownership in Bloomia B.V. and its affiliated entities (“Bloomia”) for a price of $47.5 million financed with Company cash, a new credit facility and a note payable to the sellers. Bloomia produces fresh cut tulip stems. Bloomia purchases tulip bulbs, hydroponically grows tulips from the bulbs, and sells the stems to retail stores.
|
| Cash and Cash Equivalents |
Cash and Cash Equivalents. The Company considers all highly liquid investments with an original maturity date of three months or less to be cash equivalents. Cash equivalents are stated at cost, which approximates fair value. Cash and cash equivalents of $15,859,000 and $14,227,000 were in interest-bearing investments such as an insured sweep account, U.S. Treasury bills and a money market account at December 31, 2023 and 2022, respectively. The balances in cash accounts, at times, may exceed federally insured limits. The Company has not experienced any losses in such accounts and believes it is not exposed to any significant credit risk on cash and cash equivalents. Amounts held in checking accounts and in insured cash sweep accounts during the years ended December 31, 2023 and 2022 were fully insured under the Federal Deposit Insurance Corporation. December 31 | | 2023 | | | 2021 | | Cash and cash equivalents | | $ | 16,077,000 | | | $ | 14,439,000 | | Restricted cash | | | - | | | | 85,000 | | Total cash, cash equivalents and restricted cash | | $ | 16,077,000 | | | $ | 14,524,000 | |
|
| Restricted Cash |
Restricted Cash. The Company’s restricted cash consists of cash the Company was contractually obligated to maintain in accordance with the terms of the lease for its headquarters space in Minneapolis.
|
| Fair Value of Financial Instruments |
Fair Value of Financial Instruments. Fair value is defined as the exit price, or the amount that would be received to sell an asset, or paid to transfer a liability, in an orderly transaction between market participants as of the measurement date. Accounting Standards Codification (“ASC”) 820-10 also establishes a hierarchy for inputs used in measuring fair value that maximizes the use of observable inputs and minimizes the use of unobservable inputs by requiring that the most observable inputs be used when available. Observable inputs are inputs market participants would use in valuing the asset or liability, developed based on market data obtained from sources independent of the Company. Unobservable inputs are inputs that reflect management’s assumptions about the factors market participants would use in valuing the asset or liability developed based upon the best information available in the circumstances. The hierarchy is divided into three levels. Level 1 inputs are quoted prices (unadjusted) in active markets for identical assets or liabilities. Level 2 inputs include quoted prices for similar assets or liabilities in active markets, quoted prices for identical or similar assets or liabilities in markets that are not active and inputs (other than quoted prices) that are observable for the asset or liability, either directly or indirectly. Level 3 inputs are unobservable inputs for the asset or liability. Categorization within the valuation hierarchy is based upon the lowest level of input that is significant to the fair value measurement. As of December 31, 2023 and 2022, the Company had no financial assets or liabilities measured at a fair value on a recurring basis. The Company records certain financial assets and liabilities at their carrying amounts that approximate fair value, based on their short-term nature. These financial assets and liabilities included cash and cash equivalents, other current assets related to discontinued operations, and accounts payable.
|
| Property and Equipment |
Property and Equipment. Property and equipment are recorded at cost. Significant additions or improvements extending asset lives are capitalized, while repairs and maintenance are charged to expense when incurred. Expenditures are capitalized for development activities, while expenditures related to planning, training, and maintenance are expensed. Depreciation is provided in amounts sufficient to relate the cost of assets to operations over their estimated useful lives. The straight-line method of depreciation is used for financial reporting purposes and accelerated methods are used for tax purposes. Estimated useful lives of the assets are as follows: Office furniture and fixtures | 1 – 3 years | Computer equipment and software | 3 – 5 years | Leasehold improvements | 12 – 18 months |
|
| Leases |
Leases. The Company determines if an arrangement contains a lease at inception. Operating leases are included in operating lease right-of-use (ROU) assets, the current portion of operating lease liabilities, and the operating lease liabilities on the balance sheets. The ROU assets represent our right to control the use of an underlying asset for the lease term, and lease liabilities represent our obligation to make lease payments arising from the lease. Operating lease ROU assets and lease liabilities are recognized at commencement date and date of any lease modification based on the present value of lease payments over the lease term. The operating lease ROU assets also include any prepaid lease payments made and exclude lease incentives. Lease expense is recognized on a straight-line basis over the lease term. The Company has elected the practical expedient to exclude short-term leases (one year or less) from our ROU assets and lease liabilities.
|
| Impairment of Long-Lived Assets |
Impairment of Long-Lived Assets. The Company records impairment losses on long-lived assets used in operations when indicators of impairment are present and the undiscounted cash flows estimated to be generated by those assets are less than the assets’ carrying amount. Impaired assets are then recorded at their estimated fair value.
|
| Restructuring |
Restructuring. In connection with the change in the Company’s strategy to the specialty agricultural and finance company, the Company’s prior CEO, Kristine A. Glancy, departed on August 31, 2023. Included in general and administrative expense of continuing operations is expense of $926,000 relating to change of control and other severance related payments and benefits to Ms. Glancy. As of December 31, 2023, $305,000 remained to be paid to Ms. Glancy and was included in accrued compensation. Subsequent to December 31, 2023 this amount was paid to Ms. Glancy.
|
| Income Taxes |
Income Taxes. Income taxes are accounted for under the liability method. Deferred income taxes are provided for temporary differences between the financial reporting and tax basis of assets and liabilities. Deferred taxes are reduced by a valuation allowance when, in the opinion of management, it is more likely than not that some portion or the entire deferred tax asset will not be realized. Deferred tax assets and liabilities are adjusted for the effects of changes in tax laws and rates on the date of the enactment. It is the Company’s policy to provide for uncertain tax positions and the related interest and penalties based upon management’s assessment of whether a tax benefit is more likely than not to be sustained upon examination by tax authorities. The Company recognizes interest and penalties accrued on any unrecognized tax benefits as a component of income tax expense (benefit).
|
| Stock-Based Compensation |
Stock-Based Compensation. The Company measures and recognizes compensation expense for all stock-based awards at fair value. Restricted stock units and awards are valued at the closing market price of the Company’s stock on the date of the grant. The Company uses the Black-Scholes option pricing model to determine the weighted average fair value of options and employee stock purchase plan rights. The determination of fair value of share-based payment awards on the date of grant using an option-pricing model is affected by our stock price as well as by assumptions regarding several complex and subjective variables. These variables include, but are not limited to, the expected stock price volatility over the term of the awards, and actual and projected employee stock option exercise behaviors. The expected lives of the options and employee stock purchase plan rights are based on evaluations of historical and expected future employee exercise behavior. The risk-free interest rate is based on the U.S. Treasury rates at the date of grant with maturity dates approximately equal to the expected term at grant date. Volatility is based on historical and expected future volatility of the Company’s stock. The Company has not historically issued any dividends beyond one-time dividends declared in 2011 and 2016 and does not expect to in the future.
|
| Net Income (Loss) Per Share |
Net Income (Loss) Per Share. Basic net income (loss) per share is computed by dividing net income (loss) by the weighted average shares outstanding and excludes any dilutive effects of stock options and restricted stock units and awards. Diluted net income (loss) per share gives effect to all diluted potential common shares outstanding during the year. In determining diluted net income (loss) per share, whether net income from continuing operations is positive or negative controls whether dilutive shares are included in the determination. For all periods presented, net income from continuing operations is negative, a net loss. Accordingly, since including dilutive shares would dilute the loss from continuing operations, no dilutive shares are included in any of the per share calculations. Due to the net loss from continuing operations incurred during the year ended December 31, 2023 and 2022, all outstanding stock awards were considered anti-dilutive for those periods. Options to purchase approximately 1,000 shares of common stock with a weighted average exercise price of $15.54 were outstanding at December 31, 2023. Options to purchase approximately 53,000 shares of common stock with a weighted average exercise price of $11.69 were outstanding at December 31, 2022. Weighted average common shares outstanding for the years ended December 31, 2023 and 2022 were as follows: Year ended December 31 | | 2023 | | | 2022 | | Denominator for basic net income (loss) per share - weighted average shares | | | 1,781,000 | | | | 1,791,000 | | Effect of dilutive securities: | | | | | | | | | Stock options, restricted stock units and restricted stock awards | | | - | | | | - | | Denominator for diluted net income (loss) per share - weighted average shares | | | 1,781,000 | | | | 1,791,000 | |
|
| Use of Estimates |
Use of Estimates. The preparation of financial statements in conformity with accounting principles generally accepted in the United States of America requires management to make estimates and assumptions that affect the amounts reported in the financial statements and accompanying notes. Actual results could differ from these estimates.
|
| X |
- References
+ Details
| Name: |
ldwy_DescriptionOfBusinessPolicyTextBlock |
| Namespace Prefix: |
ldwy_ |
| Data Type: |
nonnum:textBlockItemType |
| Balance Type: |
na |
| Period Type: |
duration |
|
| X |
- References
+ Details
| Name: |
ldwy_RestrictedCashpolicytextblock |
| Namespace Prefix: |
ldwy_ |
| Data Type: |
nonnum:textBlockItemType |
| Balance Type: |
na |
| Period Type: |
duration |
|
| X |
- References
+ Details
| Name: |
ldwy_RestructuringAndRelatedActivitiesPolicyTextBlock |
| Namespace Prefix: |
ldwy_ |
| Data Type: |
nonnum:textBlockItemType |
| Balance Type: |
na |
| Period Type: |
duration |
|
| X |
- References
+ Details
| Name: |
us-gaap_AccountingPoliciesAbstract |
| Namespace Prefix: |
us-gaap_ |
| Data Type: |
xbrli:stringItemType |
| Balance Type: |
na |
| Period Type: |
duration |
|
| X |
- DefinitionDisclosure of accounting policy for cash and cash equivalents, including the policy for determining which items are treated as cash equivalents. Other information that may be disclosed includes (1) the nature of any restrictions on the entity's use of its cash and cash equivalents, (2) whether the entity's cash and cash equivalents are insured or expose the entity to credit risk, (3) the classification of any negative balance accounts (overdrafts), and (4) the carrying basis of cash equivalents (for example, at cost) and whether the carrying amount of cash equivalents approximates fair value. Reference 1: http://fasb.org/us-gaap/role/ref/legacyRef
-Name Accounting Standards Codification
-Topic 230
-SubTopic 10
-Section 50
-Paragraph 1
-Publisher FASB
-URI https://asc.fasb.org//1943274/2147482913/230-10-50-1
| Name: |
us-gaap_CashAndCashEquivalentsPolicyTextBlock |
| Namespace Prefix: |
us-gaap_ |
| Data Type: |
dtr-types:textBlockItemType |
| Balance Type: |
na |
| Period Type: |
duration |
|
| X |
- DefinitionDisclosure of accounting policy for computing basic and diluted earnings or loss per share for each class of common stock and participating security. Addresses all significant policy factors, including any antidilutive items that have been excluded from the computation and takes into account stock dividends, splits and reverse splits that occur after the balance sheet date of the latest reporting period but before the issuance of the financial statements. Reference 1: http://fasb.org/us-gaap/role/ref/legacyRef
-Name Accounting Standards Codification
-Topic 260
-SubTopic 10
-Section 50
-Paragraph 1
-Subparagraph (c)
-Publisher FASB
-URI https://asc.fasb.org//1943274/2147482662/260-10-50-1
Reference 2: http://fasb.org/us-gaap/role/ref/legacyRef
-Name Accounting Standards Codification
-Topic 260
-SubTopic 10
-Section 50
-Paragraph 2
-Publisher FASB
-URI https://asc.fasb.org//1943274/2147482662/260-10-50-2
| Name: |
us-gaap_EarningsPerSharePolicyTextBlock |
| Namespace Prefix: |
us-gaap_ |
| Data Type: |
dtr-types:textBlockItemType |
| Balance Type: |
na |
| Period Type: |
duration |
|
| X |
- DefinitionDisclosure of accounting policy for determining the fair value of financial instruments. Reference 1: http://fasb.org/us-gaap/role/ref/legacyRef
-Name Accounting Standards Codification
-Section 60
-Paragraph 1
-SubTopic 10
-Topic 820
-Publisher FASB
-URI https://asc.fasb.org//1943274/2147482053/820-10-60-1
Reference 2: http://fasb.org/us-gaap/role/ref/legacyRef
-Name Accounting Standards Codification
-Section 50
-Paragraph 1
-SubTopic 10
-Topic 825
-Publisher FASB
-URI https://asc.fasb.org//1943274/2147482907/825-10-50-1
| Name: |
us-gaap_FairValueOfFinancialInstrumentsPolicy |
| Namespace Prefix: |
us-gaap_ |
| Data Type: |
dtr-types:textBlockItemType |
| Balance Type: |
na |
| Period Type: |
duration |
|
| X |
- DefinitionDisclosure of accounting policy for goodwill and intangible assets. This accounting policy also may address how an entity assesses and measures impairment of goodwill and intangible assets. Reference 1: http://fasb.org/us-gaap/role/ref/legacyRef
-Name Accounting Standards Codification
-Topic 350
-SubTopic 20
-Section 50
-Paragraph 1
-Publisher FASB
-URI https://asc.fasb.org//1943274/2147482573/350-20-50-1
Reference 2: http://fasb.org/us-gaap/role/ref/legacyRef
-Name Accounting Standards Codification
-Section 50
-Paragraph 1
-SubTopic 30
-Topic 350
-Publisher FASB
-URI https://asc.fasb.org//1943274/2147482665/350-30-50-1
| Name: |
us-gaap_GoodwillAndIntangibleAssetsPolicyTextBlock |
| Namespace Prefix: |
us-gaap_ |
| Data Type: |
dtr-types:textBlockItemType |
| Balance Type: |
na |
| Period Type: |
duration |
|
| X |
- DefinitionDisclosure of accounting policy for income taxes, which may include its accounting policies for recognizing and measuring deferred tax assets and liabilities and related valuation allowances, recognizing investment tax credits, operating loss carryforwards, tax credit carryforwards, and other carryforwards, methodologies for determining its effective income tax rate and the characterization of interest and penalties in the financial statements. Reference 1: http://www.xbrl.org/2003/role/disclosureRef
-Topic 946
-SubTopic 10
-Name Accounting Standards Codification
-Section S99
-Paragraph 3
-Subparagraph (SX 210.6-03(h)(1))
-Publisher FASB
-URI https://asc.fasb.org//1943274/2147479886/946-10-S99-3
Reference 2: http://www.xbrl.org/2003/role/disclosureRef
-Topic 740
-SubTopic 10
-Name Accounting Standards Codification
-Section 50
-Paragraph 17
-Subparagraph (b)
-Publisher FASB
-URI https://asc.fasb.org//1943274/2147482685/740-10-50-17
Reference 3: http://www.xbrl.org/2003/role/disclosureRef
-Topic 740
-SubTopic 10
-Name Accounting Standards Codification
-Section 50
-Paragraph 9
-Publisher FASB
-URI https://asc.fasb.org//1943274/2147482685/740-10-50-9
Reference 4: http://www.xbrl.org/2003/role/disclosureRef
-Topic 740
-SubTopic 10
-Name Accounting Standards Codification
-Section 45
-Paragraph 25
-Publisher FASB
-URI https://asc.fasb.org//1943274/2147482525/740-10-45-25
Reference 5: http://www.xbrl.org/2003/role/disclosureRef
-Topic 740
-SubTopic 10
-Name Accounting Standards Codification
-Section 45
-Paragraph 28
-Publisher FASB
-URI https://asc.fasb.org//1943274/2147482525/740-10-45-28
Reference 6: http://www.xbrl.org/2003/role/disclosureRef
-Topic 740
-SubTopic 10
-Name Accounting Standards Codification
-Section 50
-Paragraph 19
-Publisher FASB
-URI https://asc.fasb.org//1943274/2147482685/740-10-50-19
Reference 7: http://www.xbrl.org/2003/role/disclosureRef
-Topic 220
-SubTopic 10
-Name Accounting Standards Codification
-Section 50
-Paragraph 1
-Publisher FASB
-URI https://asc.fasb.org//1943274/2147482765/220-10-50-1
Reference 8: http://www.xbrl.org/2003/role/disclosureRef
-Topic 740
-SubTopic 10
-Name Accounting Standards Codification
-Section 50
-Paragraph 20
-Publisher FASB
-URI https://asc.fasb.org//1943274/2147482685/740-10-50-20
| Name: |
us-gaap_IncomeTaxPolicyTextBlock |
| Namespace Prefix: |
us-gaap_ |
| Data Type: |
dtr-types:textBlockItemType |
| Balance Type: |
na |
| Period Type: |
duration |
|
| X |
- DefinitionDisclosure of accounting policy for leasing arrangement entered into by lessee. Reference 1: http://www.xbrl.org/2003/role/disclosureRef
-Topic 842
-SubTopic 20
-Name Accounting Standards Codification
-Section 50
-Paragraph 1
-Subparagraph (b)
-Publisher FASB
-URI https://asc.fasb.org//1943274/2147478964/842-20-50-1
| Name: |
us-gaap_LesseeLeasesPolicyTextBlock |
| Namespace Prefix: |
us-gaap_ |
| Data Type: |
dtr-types:textBlockItemType |
| Balance Type: |
na |
| Period Type: |
duration |
|
| X |
- DefinitionDisclosure of accounting policy for assessing and recognizing impairments of its property, plant and equipment. Reference 1: http://fasb.org/us-gaap/role/ref/legacyRef
-Name Accounting Standards Codification
-Topic 360
-SubTopic 10
-Section 50
-Paragraph 2
-Subparagraph (c)
-Publisher FASB
-URI https://asc.fasb.org//1943274/2147482099/360-10-50-2
| Name: |
us-gaap_PropertyPlantAndEquipmentImpairment |
| Namespace Prefix: |
us-gaap_ |
| Data Type: |
dtr-types:textBlockItemType |
| Balance Type: |
na |
| Period Type: |
duration |
|
| X |
- DefinitionDisclosure of accounting policy for award under share-based payment arrangement. Includes, but is not limited to, methodology and assumption used in measuring cost. Reference 1: http://www.xbrl.org/2003/role/disclosureRef
-Topic 718
-SubTopic 10
-Name Accounting Standards Codification
-Section 50
-Paragraph 2
-Subparagraph (f)(2)(i)
-Publisher FASB
-URI https://asc.fasb.org//1943274/2147480429/718-10-50-2
Reference 2: http://www.xbrl.org/2003/role/disclosureRef
-Topic 718
-SubTopic 10
-Name Accounting Standards Codification
-Section 50
-Paragraph 2
-Subparagraph (f)(2)(ii)
-Publisher FASB
-URI https://asc.fasb.org//1943274/2147480429/718-10-50-2
Reference 3: http://www.xbrl.org/2003/role/disclosureRef
-Topic 718
-SubTopic 10
-Name Accounting Standards Codification
-Section 50
-Paragraph 2
-Subparagraph (f)(2)(v)
-Publisher FASB
-URI https://asc.fasb.org//1943274/2147480429/718-10-50-2
Reference 4: http://www.xbrl.org/2003/role/disclosureRef
-Topic 718
-SubTopic 10
-Name Accounting Standards Codification
-Section S99
-Paragraph 1
-Subparagraph (SAB Topic 14.C.Q3)
-Publisher FASB
-URI https://asc.fasb.org//1943274/2147479830/718-10-S99-1
Reference 5: http://www.xbrl.org/2003/role/disclosureRef
-Topic 718
-SubTopic 10
-Name Accounting Standards Codification
-Section S99
-Paragraph 1
-Subparagraph (SAB Topic 14.D.1.Q5)
-Publisher FASB
-URI https://asc.fasb.org//1943274/2147479830/718-10-S99-1
Reference 6: http://www.xbrl.org/2003/role/disclosureRef
-Topic 718
-SubTopic 10
-Name Accounting Standards Codification
-Section S99
-Paragraph 1
-Subparagraph (SAB Topic 14.D.3.Q2)
-Publisher FASB
-URI https://asc.fasb.org//1943274/2147479830/718-10-S99-1
Reference 7: http://www.xbrl.org/2003/role/disclosureRef
-Topic 718
-SubTopic 10
-Name Accounting Standards Codification
-Section S99
-Paragraph 1
-Subparagraph (SAB Topic 14.D.2.Q6)
-Publisher FASB
-URI https://asc.fasb.org//1943274/2147479830/718-10-S99-1
Reference 8: http://www.xbrl.org/2003/role/disclosureRef
-Topic 718
-Name Accounting Standards Codification
-Publisher FASB
-URI https://asc.fasb.org//718/tableOfContent
Reference 9: http://www.xbrl.org/2003/role/disclosureRef
-Topic 718
-SubTopic 10
-Name Accounting Standards Codification
-Section 50
-Paragraph 2
-Subparagraph (b)
-Publisher FASB
-URI https://asc.fasb.org//1943274/2147480429/718-10-50-2
Reference 10: http://www.xbrl.org/2003/role/disclosureRef
-Topic 718
-SubTopic 10
-Name Accounting Standards Codification
-Section 50
-Paragraph 2
-Subparagraph (f)(1)
-Publisher FASB
-URI https://asc.fasb.org//1943274/2147480429/718-10-50-2
Reference 11: http://www.xbrl.org/2003/role/disclosureRef
-Topic 718
-SubTopic 10
-Name Accounting Standards Codification
-Section 50
-Paragraph 2
-Subparagraph (f)(2)
-Publisher FASB
-URI https://asc.fasb.org//1943274/2147480429/718-10-50-2
| Name: |
us-gaap_ShareBasedCompensationOptionAndIncentivePlansPolicy |
| Namespace Prefix: |
us-gaap_ |
| Data Type: |
dtr-types:textBlockItemType |
| Balance Type: |
na |
| Period Type: |
duration |
|
| X |
- DefinitionDisclosure of accounting policy for the use of estimates in the preparation of financial statements in conformity with generally accepted accounting principles. Reference 1: http://fasb.org/us-gaap/role/ref/legacyRef
-Name Accounting Standards Codification
-Topic 275
-SubTopic 10
-Section 50
-Paragraph 9
-Publisher FASB
-URI https://asc.fasb.org//1943274/2147482861/275-10-50-9
Reference 2: http://fasb.org/us-gaap/role/ref/legacyRef
-Name Accounting Standards Codification
-Topic 275
-SubTopic 10
-Section 50
-Paragraph 4
-Publisher FASB
-URI https://asc.fasb.org//1943274/2147482861/275-10-50-4
Reference 3: http://www.xbrl.org/2003/role/disclosureRef
-Name Accounting Standards Codification
-Section 50
-Paragraph 1
-Subparagraph (b)
-SubTopic 10
-Topic 275
-Publisher FASB
-URI https://asc.fasb.org//1943274/2147482861/275-10-50-1
Reference 4: http://www.xbrl.org/2003/role/disclosureRef
-Name Accounting Standards Codification
-Section 50
-Paragraph 1
-Subparagraph (c)
-SubTopic 10
-Topic 275
-Publisher FASB
-URI https://asc.fasb.org//1943274/2147482861/275-10-50-1
Reference 5: http://www.xbrl.org/2003/role/disclosureRef
-Name Accounting Standards Codification
-Section 50
-Paragraph 11
-SubTopic 10
-Topic 275
-Publisher FASB
-URI https://asc.fasb.org//1943274/2147482861/275-10-50-11
Reference 6: http://www.xbrl.org/2003/role/disclosureRef
-Name Accounting Standards Codification
-Section 50
-Paragraph 12
-SubTopic 10
-Topic 275
-Publisher FASB
-URI https://asc.fasb.org//1943274/2147482861/275-10-50-12
Reference 7: http://fasb.org/us-gaap/role/ref/legacyRef
-Name Accounting Standards Codification
-Topic 275
-SubTopic 10
-Section 50
-Paragraph 8
-Publisher FASB
-URI https://asc.fasb.org//1943274/2147482861/275-10-50-8
| Name: |
us-gaap_UseOfEstimates |
| Namespace Prefix: |
us-gaap_ |
| Data Type: |
dtr-types:textBlockItemType |
| Balance Type: |
na |
| Period Type: |
duration |
|
v3.24.1
Summary of Significant Accounting Policies (Tables)
|
12 Months Ended |
Dec. 31, 2023 |
|---|
| Summary of Significant Accounting Policies |
|
| Schedule of Cash And Cash Equivalents |
December 31 | | 2023 | | | 2021 | | Cash and cash equivalents | | $ | 16,077,000 | | | $ | 14,439,000 | | Restricted cash | | | - | | | | 85,000 | | Total cash, cash equivalents and restricted cash | | $ | 16,077,000 | | | $ | 14,524,000 | |
|
| Summary of Estimmated useful lives of the assets |
Office furniture and fixtures | 1 – 3 years | Computer equipment and software | 3 – 5 years | Leasehold improvements | 12 – 18 months |
|
| Schdule of Weighted Average Common Shares Outstanding |
Year ended December 31 | | 2023 | | | 2022 | | Denominator for basic net income (loss) per share - weighted average shares | | | 1,781,000 | | | | 1,791,000 | | Effect of dilutive securities: | | | | | | | | | Stock options, restricted stock units and restricted stock awards | | | - | | | | - | | Denominator for diluted net income (loss) per share - weighted average shares | | | 1,781,000 | | | | 1,791,000 | |
|
| X |
- References
+ Details
| Name: |
ldwy_EstimatedUsefulLivesAssetsTableTextBlock |
| Namespace Prefix: |
ldwy_ |
| Data Type: |
nonnum:textBlockItemType |
| Balance Type: |
na |
| Period Type: |
duration |
|
| X |
- References
+ Details
| Name: |
us-gaap_AccountingPoliciesAbstract |
| Namespace Prefix: |
us-gaap_ |
| Data Type: |
xbrli:stringItemType |
| Balance Type: |
na |
| Period Type: |
duration |
|
| X |
- DefinitionTabular disclosure of the components of cash and cash equivalents.
| Name: |
us-gaap_ScheduleOfCashAndCashEquivalentsTableTextBlock |
| Namespace Prefix: |
us-gaap_ |
| Data Type: |
dtr-types:textBlockItemType |
| Balance Type: |
na |
| Period Type: |
duration |
|
| X |
- DefinitionTabular disclosure of the weighted average number of shares used in calculating basic net earnings per share (or unit) and diluted earnings per share (or unit). Reference 1: http://fasb.org/us-gaap/role/ref/legacyRef
-Name Accounting Standards Codification
-Topic 260
-SubTopic 10
-Section 50
-Paragraph 1
-Publisher FASB
-URI https://asc.fasb.org//1943274/2147482662/260-10-50-1
| Name: |
us-gaap_ScheduleOfWeightedAverageNumberOfSharesTableTextBlock |
| Namespace Prefix: |
us-gaap_ |
| Data Type: |
dtr-types:textBlockItemType |
| Balance Type: |
na |
| Period Type: |
duration |
|
v3.24.1
Sale of In-Store Marketing Business and Presentation as Discontinued Operations (Tables)
|
12 Months Ended |
Dec. 31, 2023 |
|---|
| Sale of In-Store Marketing Business and Presentation as Discontinued Operations |
|
| Summary of gain on sale of buiness |
Gross sale price | | $ | 3,500,000 | | Adjustments per Purchase Agreement | | | (1,555,000 | ) | Adjusted Price | | | 1,945,000 | | | | | | | Liabilities assumed in excess of assets | | | 1,308,000 | | Transaction costs not previously expensed | | | (209,000 | ) | Gain on sale of In-Store Marketing Business | | $ | 3,044,000 | |
|
| Summary of balance sheet adjustments |
| | December 31, | | | December 31, | | | | 2023 | | | 2022 | | Current Assets: | | | | | | | Accounts receivable | | $ | 292,000 | | | $ | 5,557,000 | | Inventories | | | - | | | | 29,000 | | Prepaid production costs | | | - | | | | 535,000 | | Other prepaid expense | | | - | | | | 50,000 | | Current assets related to discontinued operations | | $ | 292,000 | | | $ | 6,171,000 | | | | | | | | | | | Other Assets: | | | | | | | | | Property and equipment, net | | $ | - | | | $ | 71,000 | | Operating lease right-of-use assets | | | - | | | | 144,000 | | Non-current assets related to discontinued operations | | $ | - | | | $ | 215,000 | | | | | | | | | | | Current Liabilities: | | | | | | | | | Accounts payable | | $ | 7,000 | | | $ | 2,515,000 | | Sales tax | | | 169,000 | | | | 717,000 | | Accrued liabilities | | | 81,000 | | | | 1,003,000 | | Current portion of operating lease liabilities | | | - | | | | 4,000 | | Deferred revenue | | | - | | | | 2,427,000 | | Current liabilities related to discontinued operations | | $ | 257,000 | | | $ | 6,666,000 | | | | | | | | | | | Long-Term Liabilities: | | | | | | | | | Operating lease liabilities | | $ | - | | | $ | 140,000 | | Non-current liabilities related to discontinued operations | | $ | - | | | $ | 140,000 | |
|
| Summary of operations adjustments |
Years Ended December 31 | | 2023 | | | 2022 | | Net services revenues | | $ | 21,078,000 | | | $ | 18,800,000 | | | | | | | | | | | Cost of services | | | 16,087,000 | | | | 15,499,000 | | Gross Profit | | | 4,991,000 | | | | 3,301,000 | | | | | | | | | | | Operating Expenses: | | | | | | | | | Selling | | | 1,136,000 | | | | 1,325,000 | | Marketing | | | 805,000 | | | | 1,050,000 | | General and administrative | | | 679,000 | | | | 878,000 | | Total Operating Expenses | | | 2,620,000 | | | | 3,253,000 | | | | | | | | | | | Gain from litigation settlement, net | | | - | | | | 12,000,000 | | | | | | | | | | | Operating Income | | | 2,371,000 | | | | 12,048,000 | | | | | | | | | | | Other income | | | 91,000 | | | | 68,000 | | Income from discontinued operations before income taxes | | | 2,462,000 | | | | 12,116,000 | | Income tax benefit | | | (12,000 | ) | | | (224,000 | ) | Income from discontinued operations, net of tax | | $ | 2,474,000 | | | $ | 12,340,000 | | | | | | | | | | | Gain from sale of discontinued operations before income taxes | | $ | 3,044,000 | | | $ | - | | Income tax expense | | | 83,000 | | | | - | | Gain from sale of discontinued operations, net of tax | | $ | 2,961,000 | | | $ | - | |
|
| X |
- References
+ Details
| Name: |
ldwy_SaleOfInStoreMarketingBusinessAndPresentationAsDiscontinuedOperationsAbstract |
| Namespace Prefix: |
ldwy_ |
| Data Type: |
xbrli:stringItemType |
| Balance Type: |
na |
| Period Type: |
duration |
|
| X |
- References
+ Details
| Name: |
ldwy_SummaryOfGainOnSaleOfBuinessTableTextBlock |
| Namespace Prefix: |
ldwy_ |
| Data Type: |
nonnum:textBlockItemType |
| Balance Type: |
na |
| Period Type: |
duration |
|
| X |
- DefinitionTabular disclosure of condensed balance sheet, including, but not limited to, balance sheets of consolidated entities and consolidation eliminations. Reference 1: http://www.xbrl.org/2009/role/commonPracticeRef
-Name Regulation S-X (SX)
-Number 210
-Section 12
-Subsection 04
-Paragraph (a)
-Publisher SEC
Reference 2: http://www.xbrl.org/2009/role/commonPracticeRef
-Topic 235
-SubTopic 10
-Name Accounting Standards Codification
-Section S99
-Paragraph 3
-Subparagraph (SX 210.12-04(a))
-Publisher FASB
-URI https://asc.fasb.org//1943274/2147480678/235-10-S99-3
| Name: |
srt_ScheduleOfCondensedBalanceSheetTableTextBlock |
| Namespace Prefix: |
srt_ |
| Data Type: |
dtr-types:textBlockItemType |
| Balance Type: |
na |
| Period Type: |
duration |
|
| X |
- DefinitionTabular disclosure of condensed income statement, including, but not limited to, income statements of consolidated entities and consolidation eliminations. Reference 1: http://www.xbrl.org/2009/role/commonPracticeRef
-Name Regulation S-X (SX)
-Number 210
-Section 12
-Subsection 04
-Paragraph (a)
-Publisher SEC
Reference 2: http://www.xbrl.org/2009/role/commonPracticeRef
-Topic 235
-SubTopic 10
-Name Accounting Standards Codification
-Section S99
-Paragraph 3
-Subparagraph (SX 210.12-04(a))
-Publisher FASB
-URI https://asc.fasb.org//1943274/2147480678/235-10-S99-3
| Name: |
srt_ScheduleOfCondensedIncomeStatementTableTextBlock |
| Namespace Prefix: |
srt_ |
| Data Type: |
dtr-types:textBlockItemType |
| Balance Type: |
na |
| Period Type: |
duration |
|
v3.24.1
Leases (Tables)
|
12 Months Ended |
Dec. 31, 2023 |
|---|
| Leases |
|
| Schedule of Maturities of Lease Liabilities of operating leases |
2024 | | $ | 5,000 | | 2025 | | | 3,000 | | Total lease payments | | $ | 8,000 | | Less: Interest | | | (1,000 | ) | Present value of lease liabilities | | $ | 7,000 | |
|
| Schedule of Cost components in continuing operation of operating leases |
| | Year ended December 31, 2023 | | | Year ended December 31, 2022 | | | | Corporate | | | | | | | | | | | | | Headquarters | | | Other | | | Total | | | Operating Leases - Other | | Operating lease cost | | $ | 1,000 | | | $ | 4,000 | | | $ | 5,000 | | | $ | 14,000 | | Short-term lease costs | | | 2,000 | | | | 10,000 | | | | 12,000 | | | | - | | Total | | $ | 3,000 | | | $ | 14,000 | | | $ | 17,000 | | | $ | 14,000 | |
|
| X |
- DefinitionTabular disclosure of lessee's lease cost. Includes, but is not limited to, interest expense for finance lease, amortization of right-of-use asset for finance lease, operating lease cost, short-term lease cost, variable lease cost and sublease income. Reference 1: http://www.xbrl.org/2009/role/commonPracticeRef
-Topic 842
-SubTopic 20
-Name Accounting Standards Codification
-Section 50
-Paragraph 4
-Publisher FASB
-URI https://asc.fasb.org//1943274/2147478964/842-20-50-4
| Name: |
us-gaap_LeaseCostTableTextBlock |
| Namespace Prefix: |
us-gaap_ |
| Data Type: |
dtr-types:textBlockItemType |
| Balance Type: |
na |
| Period Type: |
duration |
|
| X |
- References
+ Details
| Name: |
us-gaap_LeasesAbstract |
| Namespace Prefix: |
us-gaap_ |
| Data Type: |
xbrli:stringItemType |
| Balance Type: |
na |
| Period Type: |
duration |
|
| X |
- DefinitionTabular disclosure of summarized financial data of the closed block, typically including the liabilities of the closed block, assets allocated thereto, and maximum expected future earnings from the operations thereof. Reference 1: http://fasb.org/us-gaap/role/ref/legacyRef
-Name Accounting Standards Codification
-Topic 944
-SubTopic 805
-Section 55
-Paragraph 4
-Publisher FASB
-URI https://asc.fasb.org//1943274/2147479805/944-805-55-4
Reference 2: http://fasb.org/us-gaap/role/ref/legacyRef
-Name Accounting Standards Codification
-Topic 944
-SubTopic 805
-Section 50
-Paragraph 3
-Subparagraph (b)
-Publisher FASB
-URI https://asc.fasb.org//1943274/2147479835/944-805-50-3
| Name: |
us-gaap_ScheduleOfClosedBlockAssetsAndLiabilities |
| Namespace Prefix: |
us-gaap_ |
| Data Type: |
dtr-types:textBlockItemType |
| Balance Type: |
na |
| Period Type: |
duration |
|
v3.24.1
Stockholders Equity (Tables)
|
12 Months Ended |
Dec. 31, 2023 |
|---|
| Stockholders Equity |
|
| Schedule of Weighted average assumptions |
| | 2023 | | | 2022 | | Employee Stock Purchase Plan: | | | | | | | Expected life (years) | | | 1.0 | | | | 1.0 | | Expected volatility | | | 95 | % | | | 169 | % | Dividend yield | | | 0 | % | | | 0 | % | Risk-free interest rate | | | 4.7 | % | | | 0.4 | % |
|
| Schedule of Stock option activity |
| | Plan Shares Available for Grant | | | Plan Options Outstanding | | | Weighted Average Exercise Price Per Share | | | Aggregate Intrinsic Value | | Balance at January 1, 2022 | | | 97,648 | | | | 19,122 | | | $ | 13.23 | | | | | Restricted stock units and awards granted | | | (6,248 | ) | | | — | | | | | | | | | Stock options exercised | | | — | | | | (1,300 | ) | | | 8.26 | | | $ | 2,422 | | Cancelled or forfeited options | | | 1,462 | | | | (3,736 | ) | | | 11.41 | | | | | | Balance at December 31, 2022 | | | 92,862 | | | | 14,086 | | | | 14.17 | | | | | | | | | | | | | | | | | | | | | | | Cancelled or forfeited options | | | 12,623 | | | | (12,623 | ) | | | 14.02 | | | | | | Balance at December 31, 2023 | | | 105,485 | | | | 1,463 | | | | 15.54 | | | | | |
|
| Schedule of Stock options outstanding |
| | | Options Outstanding | | | Options Exercisable | | Exercise Prices | | | Number Outstanding | | | Weighted Average Remaining Contractual Life | | Weighted Average Exercise Price Per Share | | | Number Exercisable | | | Weighted Average Exercise Price Per Share | | | $ | 15.54 | | | | 1,463 | | | | 0.39 | | | years | | $ | 15.54 | | | | 1,463 | | | $ | 15.54 | |
|
| Schedule of Restricted stock and restricted stock unit activity |
| | Number of Shares | | | Weighted average grant date fair value | | Unvested shares at January 1, 2022 | | | 8,531 | | | $ | 10.01 | | Granted | | | 6,248 | | | | 9.60 | | Vested | | | (8,910 | ) | | | 10.25 | | Unvested shares at December 31, 2022 | | | 5,869 | | | $ | 9.21 | | | | | | | | | | | Granted | | | — | | | | | | Vested | | | (5,869 | ) | | | 7.66 | | Unvested shares at December 31, 2023 | | | — | | | | — | |
|
| X |
- DefinitionTabular disclosure of the number and weighted-average grant date fair value for restricted stock units that were outstanding at the beginning and end of the year, and the number of restricted stock units that were granted, vested, or forfeited during the year. Reference 1: http://fasb.org/us-gaap/role/ref/legacyRef
-Name Accounting Standards Codification
-Topic 718
-SubTopic 10
-Section 50
-Paragraph 2
-Subparagraph (c)(1)
-Publisher FASB
-URI https://asc.fasb.org//1943274/2147480429/718-10-50-2
| Name: |
us-gaap_ScheduleOfShareBasedCompensationRestrictedStockUnitsAwardActivityTableTextBlock |
| Namespace Prefix: |
us-gaap_ |
| Data Type: |
dtr-types:textBlockItemType |
| Balance Type: |
na |
| Period Type: |
duration |
|
| X |
- DefinitionTabular disclosure of option exercise prices, by grouped ranges, including the upper and lower limits of the price range, the number of shares under option, weighted average exercise price and remaining contractual option terms. Reference 1: http://fasb.org/us-gaap/role/ref/legacyRef
-Name Accounting Standards Codification
-Topic 718
-SubTopic 10
-Section 50
-Paragraph 2
-Publisher FASB
-URI https://asc.fasb.org//1943274/2147480429/718-10-50-2
| Name: |
us-gaap_ScheduleOfShareBasedCompensationSharesAuthorizedUnderStockOptionPlansByExercisePriceRangeTextBlock |
| Namespace Prefix: |
us-gaap_ |
| Data Type: |
dtr-types:textBlockItemType |
| Balance Type: |
na |
| Period Type: |
duration |
|
| X |
- DefinitionTabular disclosure for stock option plans. Includes, but is not limited to, outstanding awards at beginning and end of year, grants, exercises, forfeitures, and weighted-average grant date fair value. Reference 1: http://fasb.org/us-gaap/role/ref/legacyRef
-Name Accounting Standards Codification
-Topic 718
-SubTopic 10
-Section 50
-Paragraph 2
-Subparagraph (c)(1)
-Publisher FASB
-URI https://asc.fasb.org//1943274/2147480429/718-10-50-2
Reference 2: http://fasb.org/us-gaap/role/ref/legacyRef
-Name Accounting Standards Codification
-Section 50
-Paragraph 2
-Subparagraph (d)
-SubTopic 10
-Topic 718
-Publisher FASB
-URI https://asc.fasb.org//1943274/2147480429/718-10-50-2
Reference 3: http://fasb.org/us-gaap/role/ref/legacyRef
-Name Accounting Standards Codification
-Section 50
-Paragraph 2
-Subparagraph (e)
-SubTopic 10
-Topic 718
-Publisher FASB
-URI https://asc.fasb.org//1943274/2147480429/718-10-50-2
| Name: |
us-gaap_ScheduleOfShareBasedCompensationStockOptionsActivityTableTextBlock |
| Namespace Prefix: |
us-gaap_ |
| Data Type: |
dtr-types:textBlockItemType |
| Balance Type: |
na |
| Period Type: |
duration |
|
| X |
- DefinitionTabular disclosure of the significant assumptions used during the year to estimate the fair value of stock options, including, but not limited to: (a) expected term of share options and similar instruments, (b) expected volatility of the entity's shares, (c) expected dividends, (d) risk-free rate(s), and (e) discount for post-vesting restrictions. Reference 1: http://fasb.org/us-gaap/role/ref/legacyRef
-Topic 718
-SubTopic 10
-Subparagraph (f)(2)
-Name Accounting Standards Codification
-Paragraph 2
-Section 50
-Publisher FASB
-URI https://asc.fasb.org//1943274/2147480429/718-10-50-2
| Name: |
us-gaap_ScheduleOfShareBasedPaymentAwardStockOptionsValuationAssumptionsTableTextBlock |
| Namespace Prefix: |
us-gaap_ |
| Data Type: |
dtr-types:textBlockItemType |
| Balance Type: |
na |
| Period Type: |
duration |
|
| X |
- References
+ Details
| Name: |
us-gaap_StockholdersEquityNoteAbstract |
| Namespace Prefix: |
us-gaap_ |
| Data Type: |
xbrli:stringItemType |
| Balance Type: |
na |
| Period Type: |
duration |
|
v3.24.1
Income Taxes (Tables)
|
12 Months Ended |
Dec. 31, 2023 |
|---|
| Income Taxes |
|
| Income tax benefit |
Year Ended December 31 | | 2023 | | | 2022 | | Current taxes - Federal | | $ | - | | | $ | - | | Current taxes - State | | | 20,000 | | | | 6,000 | | Income tax expense | | $ | 20,000 | | | $ | 6,000 | |
|
| Reconciliation of effective federal income tax rate |
Year Ended December 31 | | 2023 | | | 2022 | | Federal statutory rate | | | 21.0 | % | | | 21.0 | % | Stock-based awards | | | (0.5 | ) | | | (0.7 | ) | State benefit | | | 3.1 | | | | 2.7 | | Valuation allowance | | | (24.6 | ) | | | (24.6 | ) | Other | | | 0.3 | | | | 1.3 | | | | | | | | | | | Effective federal income tax rate | | | (0.7 | )% | | | (0.3 | )% |
|
| Schedule of Deferred tax assets (liabilities) |
As of December 31 | | 2023 | | | 2022 | | Deferred tax assets | | | | | | | Accrued expenses | | $ | 117,000 | | | $ | 231,000 | | Inventory reserve | | | - | | | | 23,000 | | Stock-based awards | | | 9,000 | | | | 24,000 | | Reserve for bad debts | | | 2,000 | | | | 26,000 | | Net operating loss and credit carryforwards | | | 529,000 | | | | 824,000 | | Other | | | 2,000 | | | | 23,000 | | Depreciation | | | - | | | | 43,000 | | Valuation allowance | | | (645,000 | ) | | | (1,175,000 | ) | | | | | | | | | | Total deferred tax assets | | $ | 14,000 | | | $ | 19,000 | | | | | | | | | | | Deferred tax liabilities | | | | | | | | | Depreciation | | $ | (5,000 | ) | | $ | - | | Prepaid expenses | | | (9,000 | ) | | | (19,000 | ) | | | | | | | | | | Total deferred tax liabilities | | | (14,000 | ) | | | (19,000 | ) | | | | | | | | | | Net deferred income tax | | $ | - | | | $ | - | |
|
| Summary of Uncertain tax positions |
Balance at January 1, 2022 | | $ | 711,000 | | Decrease due to state tax expense | | | (678,000 | ) | Increases due to interest and state tax | | | 20,000 | | Balance at December 31, 2022 | | $ | 53,000 | | | | | | | Decrease due to state tax expense | | $ | (16,000 | ) | Increases due to interest and state tax | | | 5,000 | | Balance at December 31, 2023 | | $ | 42,000 | |
|
| X |
- DefinitionTabular disclosure of the components of income tax expense attributable to continuing operations for each year presented including, but not limited to: current tax expense (benefit), deferred tax expense (benefit), investment tax credits, government grants, the benefits of operating loss carryforwards, tax expense that results from allocating certain tax benefits either directly to contributed capital or to reduce goodwill or other noncurrent intangible assets of an acquired entity, adjustments of a deferred tax liability or asset for enacted changes in tax laws or rates or a change in the tax status of the entity, and adjustments of the beginning-of-the-year balances of a valuation allowance because of a change in circumstances that causes a change in judgment about the realizability of the related deferred tax asset in future years. Reference 1: http://fasb.org/us-gaap/role/ref/legacyRef
-Topic 740
-SubTopic 10
-Name Accounting Standards Codification
-Paragraph 9
-Section 50
-Publisher FASB
-URI https://asc.fasb.org//1943274/2147482685/740-10-50-9
| Name: |
us-gaap_ScheduleOfComponentsOfIncomeTaxExpenseBenefitTableTextBlock |
| Namespace Prefix: |
us-gaap_ |
| Data Type: |
dtr-types:textBlockItemType |
| Balance Type: |
na |
| Period Type: |
duration |
|
| X |
- DefinitionTabular disclosure of the components of net deferred tax asset or liability recognized in an entity's statement of financial position, including the following: the total of all deferred tax liabilities, the total of all deferred tax assets, the total valuation allowance recognized for deferred tax assets. Reference 1: http://fasb.org/us-gaap/role/ref/legacyRef
-Topic 740
-SubTopic 10
-Name Accounting Standards Codification
-Paragraph 2
-Section 50
-Publisher FASB
-URI https://asc.fasb.org//1943274/2147482685/740-10-50-2
| Name: |
us-gaap_ScheduleOfDeferredTaxAssetsAndLiabilitiesTableTextBlock |
| Namespace Prefix: |
us-gaap_ |
| Data Type: |
dtr-types:textBlockItemType |
| Balance Type: |
na |
| Period Type: |
duration |
|
| X |
- DefinitionTabular disclosure of the reconciliation using percentage or dollar amounts of the reported amount of income tax expense attributable to continuing operations for the year to the amount of income tax expense that would result from applying domestic federal statutory tax rates to pretax income from continuing operations. Reference 1: http://fasb.org/us-gaap/role/ref/legacyRef
-Topic 740
-SubTopic 10
-Name Accounting Standards Codification
-Paragraph 12
-Section 50
-Publisher FASB
-URI https://asc.fasb.org//1943274/2147482685/740-10-50-12
| Name: |
us-gaap_ScheduleOfEffectiveIncomeTaxRateReconciliationTableTextBlock |
| Namespace Prefix: |
us-gaap_ |
| Data Type: |
dtr-types:textBlockItemType |
| Balance Type: |
na |
| Period Type: |
duration |
|
| X |
- DefinitionTabular disclosure for tax positions taken in the tax returns filed or to be filed for which it is more likely than not that the tax position will not be sustained upon examination by taxing authorities and other income tax contingencies. Includes, but is not limited to, interest and penalties, reconciliation of unrecognized tax benefits, unrecognized tax benefits that would affect the effective tax rate, tax years that remain subject to examination by tax jurisdictions, and information about positions for which it is reasonably possible that amounts unrecognized will significantly change within 12 months. Reference 1: http://fasb.org/us-gaap/role/ref/legacyRef
-Topic 740
-SubTopic 10
-Name Accounting Standards Codification
-Section 50
-Paragraph 15
-Subparagraph (d)
-Publisher FASB
-URI https://asc.fasb.org//1943274/2147482685/740-10-50-15
Reference 2: http://fasb.org/us-gaap/role/ref/legacyRef
-Topic 740
-SubTopic 10
-Name Accounting Standards Codification
-Section 50
-Paragraph 15A
-Publisher FASB
-URI https://asc.fasb.org//1943274/2147482685/740-10-50-15A
Reference 3: http://fasb.org/us-gaap/role/ref/legacyRef
-Name Accounting Standards Codification
-Section 50
-Paragraph 19
-SubTopic 10
-Topic 740
-Publisher FASB
-URI https://asc.fasb.org//1943274/2147482685/740-10-50-19
| Name: |
us-gaap_SummaryOfIncomeTaxContingenciesTextBlock |
| Namespace Prefix: |
us-gaap_ |
| Data Type: |
dtr-types:textBlockItemType |
| Balance Type: |
na |
| Period Type: |
duration |
|
v3.24.1
Summary of Significant Accounting Policies (Details) - USD ($)
|
Dec. 31, 2023 |
Dec. 31, 2022 |
| Summary of Significant Accounting Policies |
|
|
| Cash and cash equivalents |
$ 16,077,000
|
$ 14,439,000
|
| Restricted cash |
0
|
85,000
|
| Total cash, cash equivalents and retricted cash |
$ 16,077,000
|
$ 14,524,000
|
| X |
- References
+ Details
| Name: |
us-gaap_AccountingPoliciesAbstract |
| Namespace Prefix: |
us-gaap_ |
| Data Type: |
xbrli:stringItemType |
| Balance Type: |
na |
| Period Type: |
duration |
|
| X |
- DefinitionAmount of short-term, highly liquid investments that are both readily convertible to known amounts of cash and so near their maturity that they present insignificant risk of changes in value because of changes in interest rates. Excludes cash and cash equivalents within disposal group and discontinued operation. Reference 1: http://www.xbrl.org/2009/role/commonPracticeRef
-Topic 944
-SubTopic 210
-Name Accounting Standards Codification
-Section S99
-Paragraph 1
-Subparagraph (SX 210.7-03(a)(2))
-Publisher FASB
-URI https://asc.fasb.org//1943274/2147479440/944-210-S99-1
Reference 2: http://www.xbrl.org/2009/role/commonPracticeRef
-Topic 210
-SubTopic 10
-Name Accounting Standards Codification
-Section S99
-Paragraph 1
-Subparagraph (SX 210.5-02(1))
-Publisher FASB
-URI https://asc.fasb.org//1943274/2147480566/210-10-S99-1
| Name: |
us-gaap_CashEquivalentsAtCarryingValue |
| Namespace Prefix: |
us-gaap_ |
| Data Type: |
xbrli:monetaryItemType |
| Balance Type: |
debit |
| Period Type: |
instant |
|
| X |
- DefinitionAmount of cash and cash equivalents restricted as to withdrawal or usage, classified as current. Cash includes, but is not limited to, currency on hand, demand deposits with banks or financial institutions, and other accounts with general characteristics of demand deposits. Cash equivalents include, but are not limited to, short-term, highly liquid investments that are both readily convertible to known amounts of cash and so near their maturity that they present insignificant risk of changes in value because of changes in interest rates. Reference 1: http://www.xbrl.org/2003/role/disclosureRef
-Topic 210
-SubTopic 10
-Name Accounting Standards Codification
-Section S99
-Paragraph 1
-Subparagraph (SX 210.5-02(1))
-Publisher FASB
-URI https://asc.fasb.org//1943274/2147480566/210-10-S99-1
Reference 2: http://www.xbrl.org/2003/role/disclosureRef
-Topic 230
-SubTopic 10
-Name Accounting Standards Codification
-Section 50
-Paragraph 8
-Publisher FASB
-URI https://asc.fasb.org//1943274/2147482913/230-10-50-8
Reference 3: http://fasb.org/us-gaap/role/ref/legacyRef
-Name Accounting Standards Codification
-Topic 230
-SubTopic 10
-Section 45
-Paragraph 4
-Publisher FASB
-URI https://asc.fasb.org//1943274/2147482740/230-10-45-4
| Name: |
us-gaap_RestrictedCashAndCashEquivalentsAtCarryingValue |
| Namespace Prefix: |
us-gaap_ |
| Data Type: |
xbrli:monetaryItemType |
| Balance Type: |
debit |
| Period Type: |
instant |
|
| X |
- DefinitionThe current cash, cash equivalents and investments that are restricted as to withdrawal or usage. Restrictions may include legally restricted deposits held as compensating balances against short-term borrowing arrangements, contracts entered into with others, or entity statements of intention with regard to particular deposits; however, time deposits and short-term certificates of deposit are not generally included in legally restricted deposits. Excludes compensating balance arrangements that are not agreements which legally restrict the use of cash amounts shown on the balance sheet. Includes current cash equivalents and investments that are similarly restricted as to withdrawal, usage or disposal. Reference 1: http://www.xbrl.org/2009/role/commonPracticeRef
-Topic 210
-SubTopic 10
-Name Accounting Standards Codification
-Section S99
-Paragraph 1
-Subparagraph (SX 210.5-02(9))
-Publisher FASB
-URI https://asc.fasb.org//1943274/2147480566/210-10-S99-1
Reference 2: http://www.xbrl.org/2003/role/disclosureRef
-Topic 954
-SubTopic 210
-Name Accounting Standards Codification
-Section 45
-Paragraph 4
-Publisher FASB
-URI https://asc.fasb.org//1943274/2147480632/954-210-45-4
Reference 3: http://www.xbrl.org/2003/role/disclosureRef
-Topic 954
-SubTopic 210
-Name Accounting Standards Codification
-Section 50
-Paragraph 2
-Publisher FASB
-URI https://asc.fasb.org//1943274/2147480602/954-210-50-2
| Name: |
us-gaap_RestrictedCashAndInvestmentsCurrent |
| Namespace Prefix: |
us-gaap_ |
| Data Type: |
xbrli:monetaryItemType |
| Balance Type: |
debit |
| Period Type: |
instant |
|
v3.24.1
| X |
- DefinitionUseful life of assets related to fuels owned by public utility, in 'PnYnMnDTnHnMnS' format, for example, 'P1Y5M13D' represents the reported fact of one year, five months, and thirteen days.
| Name: |
us-gaap_PublicUtilitiesPropertyPlantAndEquipmentFuelUsefulLife |
| Namespace Prefix: |
us-gaap_ |
| Data Type: |
xbrli:durationItemType |
| Balance Type: |
na |
| Period Type: |
duration |
|
| X |
- Details
| Name: |
srt_RangeAxis=srt_MinimumMember |
| Namespace Prefix: |
|
| Data Type: |
na |
| Balance Type: |
|
| Period Type: |
|
|
| X |
- Details
| Name: |
us-gaap_PropertyPlantAndEquipmentByTypeAxis=us-gaap_FurnitureAndFixturesMember |
| Namespace Prefix: |
|
| Data Type: |
na |
| Balance Type: |
|
| Period Type: |
|
|
| X |
- Details
| Name: |
us-gaap_PropertyPlantAndEquipmentByTypeAxis=ldwy_ComputerEquipmentAndSoftwareMember |
| Namespace Prefix: |
|
| Data Type: |
na |
| Balance Type: |
|
| Period Type: |
|
|
| X |
- Details
| Name: |
us-gaap_PropertyPlantAndEquipmentByTypeAxis=us-gaap_LeaseholdImprovementsMember |
| Namespace Prefix: |
|
| Data Type: |
na |
| Balance Type: |
|
| Period Type: |
|
|
| X |
- Details
| Name: |
srt_RangeAxis=srt_MaximumMember |
| Namespace Prefix: |
|
| Data Type: |
na |
| Balance Type: |
|
| Period Type: |
|
|
v3.24.1
Summary of Significant Accounting Policies (Details 2) - shares
|
12 Months Ended |
Dec. 31, 2023 |
Dec. 31, 2022 |
| Summary of Significant Accounting Policies |
|
|
| Denominator for basic net loss per share - weighted average shares |
1,781,000
|
1,791,000
|
| Denominator for diluted net loss per share - weighted average shares |
1,781,000
|
1,791,000
|
| X |
- References
+ Details
| Name: |
us-gaap_AccountingPoliciesAbstract |
| Namespace Prefix: |
us-gaap_ |
| Data Type: |
xbrli:stringItemType |
| Balance Type: |
na |
| Period Type: |
duration |
|
| X |
- DefinitionThe average number of shares or units issued and outstanding that are used in calculating diluted EPS or earnings per unit (EPU), determined based on the timing of issuance of shares or units in the period. Reference 1: http://www.xbrl.org/2003/role/disclosureRef
-Topic 260
-SubTopic 10
-Name Accounting Standards Codification
-Section 50
-Paragraph 1
-Subparagraph (a)
-Publisher FASB
-URI https://asc.fasb.org//1943274/2147482662/260-10-50-1
Reference 2: http://www.xbrl.org/2003/role/disclosureRef
-Topic 260
-SubTopic 10
-Name Accounting Standards Codification
-Section 45
-Paragraph 16
-Publisher FASB
-URI https://asc.fasb.org//1943274/2147482689/260-10-45-16
| Name: |
us-gaap_WeightedAverageNumberOfDilutedSharesOutstanding |
| Namespace Prefix: |
us-gaap_ |
| Data Type: |
xbrli:sharesItemType |
| Balance Type: |
na |
| Period Type: |
duration |
|
| X |
- DefinitionNumber of [basic] shares or units, after adjustment for contingently issuable shares or units and other shares or units not deemed outstanding, determined by relating the portion of time within a reporting period that common shares or units have been outstanding to the total time in that period. Reference 1: http://www.xbrl.org/2003/role/disclosureRef
-Topic 260
-SubTopic 10
-Name Accounting Standards Codification
-Section 50
-Paragraph 1
-Subparagraph (a)
-Publisher FASB
-URI https://asc.fasb.org//1943274/2147482662/260-10-50-1
Reference 2: http://www.xbrl.org/2003/role/disclosureRef
-Topic 260
-SubTopic 10
-Name Accounting Standards Codification
-Section 45
-Paragraph 10
-Publisher FASB
-URI https://asc.fasb.org//1943274/2147482689/260-10-45-10
| Name: |
us-gaap_WeightedAverageNumberOfSharesOutstandingBasic |
| Namespace Prefix: |
us-gaap_ |
| Data Type: |
xbrli:sharesItemType |
| Balance Type: |
na |
| Period Type: |
duration |
|
v3.24.1
Summary of Significant Accounting Policies (Details Narrative) - USD ($)
|
1 Months Ended |
12 Months Ended |
|
Feb. 22, 2024 |
Dec. 31, 2023 |
Dec. 31, 2022 |
| Summary of Significant Accounting Policies |
|
|
|
| Weighted average exercise price |
|
$ 15.54
|
$ 11.69
|
| Acquisition of Bisiness |
$ 47,500,000
|
|
|
| Insured cash sweep account |
|
$ 15,859,000
|
$ 14,227,000
|
| Administrative Expense |
|
926,000
|
|
| Accured compensation |
|
$ 305,000
|
|
| Option to puchase shares of common stock |
|
1,000
|
53,000
|
| X |
- References
+ Details
| Name: |
ldwy_CashInvestedInInsuredCashSweepAccount |
| Namespace Prefix: |
ldwy_ |
| Data Type: |
xbrli:monetaryItemType |
| Balance Type: |
debit |
| Period Type: |
instant |
|
| X |
- References
+ Details
| Name: |
ldwy_OptionToPuchaseSharesOfCommonStock |
| Namespace Prefix: |
ldwy_ |
| Data Type: |
xbrli:sharesItemType |
| Balance Type: |
na |
| Period Type: |
instant |
|
| X |
- References
+ Details
| Name: |
ldwy_WeightedAverageExercisePrice |
| Namespace Prefix: |
ldwy_ |
| Data Type: |
num:perShareItemType |
| Balance Type: |
na |
| Period Type: |
instant |
|
| X |
- References
+ Details
| Name: |
us-gaap_AccountingPoliciesAbstract |
| Namespace Prefix: |
us-gaap_ |
| Data Type: |
xbrli:stringItemType |
| Balance Type: |
na |
| Period Type: |
duration |
|
| X |
- DefinitionCurrent portion of reclamation reserve to restore a mining or drilling site to the condition agreed upon within the mining or drilling contract. Reference 1: http://fasb.org/us-gaap/role/ref/legacyRef
-Name Accounting Standards Codification
-Topic 210
-SubTopic 10
-Section S99
-Paragraph 1
-Subparagraph (SX 210.5-02.20)
-Publisher FASB
-URI https://asc.fasb.org//1943274/2147480566/210-10-S99-1
| Name: |
us-gaap_AccruedReclamationCostsCurrent |
| Namespace Prefix: |
us-gaap_ |
| Data Type: |
xbrli:monetaryItemType |
| Balance Type: |
credit |
| Period Type: |
instant |
|
| X |
- DefinitionAmount of consideration transferred, consisting of acquisition-date fair value of assets transferred by the acquirer, liabilities incurred by the acquirer, and equity interest issued by the acquirer. Reference 1: http://fasb.org/us-gaap/role/ref/legacyRef
-Name Accounting Standards Codification
-Section 30
-Paragraph 8
-SubTopic 30
-Topic 805
-Publisher FASB
-URI https://asc.fasb.org//1943274/2147479637/805-30-30-8
Reference 2: http://fasb.org/us-gaap/role/ref/legacyRef
-Name Accounting Standards Codification
-Section 50
-Paragraph 1
-Subparagraph (b)
-SubTopic 30
-Topic 805
-Publisher FASB
-URI https://asc.fasb.org//1943274/2147479581/805-30-50-1
Reference 3: http://fasb.org/us-gaap/role/ref/legacyRef
-Name Accounting Standards Codification
-Section 30
-Paragraph 7
-SubTopic 30
-Topic 805
-Publisher FASB
-URI https://asc.fasb.org//1943274/2147479637/805-30-30-7
| Name: |
us-gaap_BusinessCombinationConsiderationTransferred1 |
| Namespace Prefix: |
us-gaap_ |
| Data Type: |
xbrli:monetaryItemType |
| Balance Type: |
credit |
| Period Type: |
duration |
|
| X |
- DefinitionAmount of general and administrative expense classified as other. Reference 1: http://www.xbrl.org/2009/role/commonPracticeRef
-Topic 946
-SubTopic 220
-Name Accounting Standards Codification
-Section S99
-Paragraph 1
-Subparagraph (SX 210.6-07(2)(b))
-Publisher FASB
-URI https://asc.fasb.org//1943274/2147483575/946-220-S99-1
Reference 2: http://fasb.org/us-gaap/role/ref/legacyRef
-Topic 220
-SubTopic 10
-Name Accounting Standards Codification
-Section S99
-Paragraph 2
-Subparagraph (SX 210.5-03.4)
-Publisher FASB
-URI https://asc.fasb.org//1943274/2147483621/220-10-S99-2
| Name: |
us-gaap_OtherGeneralAndAdministrativeExpense |
| Namespace Prefix: |
us-gaap_ |
| Data Type: |
xbrli:monetaryItemType |
| Balance Type: |
debit |
| Period Type: |
duration |
|
v3.24.1
Sale of InStore Marketing Business and Presentation as Discontinued Operations (Details)
|
12 Months Ended |
|
Dec. 31, 2023
USD ($)
|
|---|
| Sale of In-Store Marketing Business and Presentation as Discontinued Operations |
|
| Gross sale price |
$ 3,500,000
|
| Adjustments per Purchase Agreement |
(1,555,000)
|
| Adjusted Price |
1,945,000
|
| Liabilities assumed in excess of assets |
1,308,000
|
| Transaction cost not previously expensed |
(209,000)
|
| Gain on sale of in-store marketing business |
$ 3,044,000
|
| X |
- References
+ Details
| Name: |
ldwy_AdjustedPrice |
| Namespace Prefix: |
ldwy_ |
| Data Type: |
xbrli:monetaryItemType |
| Balance Type: |
credit |
| Period Type: |
duration |
|
| X |
- References
+ Details
| Name: |
ldwy_SaleOfInStoreMarketingBusinessAndPresentationAsDiscontinuedOperationsAbstract |
| Namespace Prefix: |
ldwy_ |
| Data Type: |
xbrli:stringItemType |
| Balance Type: |
na |
| Period Type: |
duration |
|
| X |
- References
+ Details
| Name: |
ldwy_TransactionCost |
| Namespace Prefix: |
ldwy_ |
| Data Type: |
xbrli:monetaryItemType |
| Balance Type: |
debit |
| Period Type: |
duration |
|
| X |
- DefinitionThe amount needed to adjust previously recorded stockholders' equity balances to the actual aggregate amounts paid, whether in cash or other consideration, to acquire all of the shares purchased under an Accelerated Share Repurchase arrangement.
| Name: |
us-gaap_AcceleratedShareRepurchaseProgramAdjustment |
| Namespace Prefix: |
us-gaap_ |
| Data Type: |
xbrli:monetaryItemType |
| Balance Type: |
credit |
| Period Type: |
duration |
|
| X |
- DefinitionAmount of gain (loss) from sale and disposal of integrated set of activities and assets capable of being conducted and managed for purpose of providing return in form of dividend, lower cost, or other economic benefit to investor, owner, member and participant. Reference 1: http://www.xbrl.org/2009/role/commonPracticeRef
-Topic 230
-SubTopic 10
-Name Accounting Standards Codification
-Section 45
-Paragraph 28
-Subparagraph (b)
-Publisher FASB
-URI https://asc.fasb.org//1943274/2147482740/230-10-45-28
Reference 2: http://www.xbrl.org/2003/role/disclosureRef
-Topic 810
-SubTopic 10
-Name Accounting Standards Codification
-Section 50
-Paragraph 1B
-Subparagraph (a)
-Publisher FASB
-URI https://asc.fasb.org//1943274/2147481203/810-10-50-1B
| Name: |
us-gaap_GainLossOnSaleOfBusiness |
| Namespace Prefix: |
us-gaap_ |
| Data Type: |
xbrli:monetaryItemType |
| Balance Type: |
credit |
| Period Type: |
duration |
|
| X |
- DefinitionThe gains and losses included in earning resulting from the sale of a project. Reference 1: http://www.xbrl.org/2009/role/commonPracticeRef
-Topic 230
-SubTopic 10
-Name Accounting Standards Codification
-Section 45
-Paragraph 28
-Subparagraph (b)
-Publisher FASB
-URI https://asc.fasb.org//1943274/2147482740/230-10-45-28
| Name: |
us-gaap_GainLossOnSaleOfProject |
| Namespace Prefix: |
us-gaap_ |
| Data Type: |
xbrli:monetaryItemType |
| Balance Type: |
credit |
| Period Type: |
duration |
|
| X |
- DefinitionThe fair value of liabilities assumed in noncash investing or financing activities. Reference 1: http://fasb.org/us-gaap/role/ref/legacyRef
-Name Accounting Standards Codification
-Topic 230
-SubTopic 10
-Section 50
-Paragraph 4
-Publisher FASB
-URI https://asc.fasb.org//1943274/2147482913/230-10-50-4
Reference 2: http://fasb.org/us-gaap/role/ref/legacyRef
-Name Accounting Standards Codification
-Topic 230
-SubTopic 10
-Section 50
-Paragraph 3
-Publisher FASB
-URI https://asc.fasb.org//1943274/2147482913/230-10-50-3
Reference 3: http://fasb.org/us-gaap/role/ref/legacyRef
-Name Accounting Standards Codification
-Topic 230
-SubTopic 10
-Section 50
-Paragraph 5
-Publisher FASB
-URI https://asc.fasb.org//1943274/2147482913/230-10-50-5
| Name: |
us-gaap_LiabilitiesAssumed1 |
| Namespace Prefix: |
us-gaap_ |
| Data Type: |
xbrli:monetaryItemType |
| Balance Type: |
credit |
| Period Type: |
duration |
|
v3.24.1
Sale of InStore Marketing Business and Presentation as Discontinued Operations (Details 1) - USD ($)
|
Dec. 31, 2023 |
Dec. 31, 2022 |
| Sale of In-Store Marketing Business and Presentation as Discontinued Operations |
|
|
| Accounts receivable |
$ 292,000
|
$ 5,557,000
|
| Inventories |
0
|
29,000
|
| Prepaid production costs |
0
|
535,000
|
| Other prepaid expense |
0
|
50,000
|
| Current assets related to discountinued operation |
292,000
|
6,171,000
|
| Property and equipment, net |
0
|
71,000
|
| Operating lease right-of-use assets |
0
|
144,000
|
| Non-Current assets related to discontinued opration |
0
|
215,000
|
| Accounts payable |
7,000
|
2,515,000
|
| Sales tax |
169,000
|
717,000
|
| Accrued liabilities |
81,000
|
1,003,000
|
| Current portion of operating lease liabilities |
0
|
4,000
|
| Deferred revenue |
0
|
2,427,000
|
| Current liabilities related to discontinued operation |
257,000
|
6,666,000
|
| Operating lease liabilities |
0
|
140,000
|
| Total Long-Term Liabilities |
$ 0
|
$ 140,000
|
| X |
- References
+ Details
| Name: |
ldwy_DisposalGroupIncludingDiscontinuedOperationOperatingLeaseLiabilityCurrent |
| Namespace Prefix: |
ldwy_ |
| Data Type: |
xbrli:monetaryItemType |
| Balance Type: |
credit |
| Period Type: |
instant |
|
| X |
- References
+ Details
| Name: |
ldwy_DisposalGroupIncludingDiscontinuedOperationOperatingLeaseLiabilityNonCurrent |
| Namespace Prefix: |
ldwy_ |
| Data Type: |
xbrli:monetaryItemType |
| Balance Type: |
credit |
| Period Type: |
instant |
|
| X |
- References
+ Details
| Name: |
ldwy_DisposalGroupIncludingDiscontinuedOperationOperatingLeaseRightOfUseAssetsNoncurrent |
| Namespace Prefix: |
ldwy_ |
| Data Type: |
xbrli:monetaryItemType |
| Balance Type: |
debit |
| Period Type: |
instant |
|
| X |
- References
+ Details
| Name: |
ldwy_DisposalGroupIncludingDiscontinuedOperationPrepaidProductionCostCurrent |
| Namespace Prefix: |
ldwy_ |
| Data Type: |
xbrli:monetaryItemType |
| Balance Type: |
debit |
| Period Type: |
instant |
|
| X |
- References
+ Details
| Name: |
ldwy_SaleOfInStoreMarketingBusinessAndPresentationAsDiscontinuedOperationsAbstract |
| Namespace Prefix: |
ldwy_ |
| Data Type: |
xbrli:stringItemType |
| Balance Type: |
na |
| Period Type: |
duration |
|
| X |
- DefinitionAmount classified as assets attributable to disposal group held for sale or disposed of, expected to be disposed of within one year or the normal operating cycle, if longer. Reference 1: http://fasb.org/us-gaap/role/ref/legacyRef
-Name Accounting Standards Codification
-Section 45
-Paragraph 10
-SubTopic 20
-Topic 205
-Publisher FASB
-URI https://asc.fasb.org//1943274/2147483475/205-20-45-10
Reference 2: http://www.xbrl.org/2003/role/disclosureRef
-Topic 205
-SubTopic 20
-Name Accounting Standards Codification
-Section 50
-Paragraph 7
-Publisher FASB
-URI https://asc.fasb.org//1943274/2147483499/205-20-50-7
Reference 3: http://www.xbrl.org/2003/role/disclosureRef
-Topic 205
-SubTopic 20
-Name Accounting Standards Codification
-Section 50
-Paragraph 5C
-Subparagraph (a)(2)
-Publisher FASB
-URI https://asc.fasb.org//1943274/2147483499/205-20-50-5C
Reference 4: http://fasb.org/us-gaap/role/ref/legacyRef
-Topic 360
-SubTopic 10
-Name Accounting Standards Codification
-Section 45
-Paragraph 9
-Publisher FASB
-URI https://asc.fasb.org//1943274/2147482130/360-10-45-9
Reference 5: http://fasb.org/us-gaap/role/ref/legacyRef
-Topic 205
-SubTopic 20
-Name Accounting Standards Codification
-Section 50
-Paragraph 5B
-Subparagraph (e)
-Publisher FASB
-URI https://asc.fasb.org//1943274/2147483499/205-20-50-5B
Reference 6: http://fasb.org/us-gaap/role/ref/legacyRef
-Topic 360
-SubTopic 10
-Name Accounting Standards Codification
-Section 50
-Paragraph 3
-Subparagraph (e)
-Publisher FASB
-URI https://asc.fasb.org//1943274/2147482099/360-10-50-3
Reference 7: http://fasb.org/us-gaap/role/ref/legacyRef
-Topic 205
-SubTopic 20
-Name Accounting Standards Codification
-Section 45
-Paragraph 11
-Publisher FASB
-URI https://asc.fasb.org//1943274/2147483475/205-20-45-11
| Name: |
us-gaap_AssetsOfDisposalGroupIncludingDiscontinuedOperationCurrent |
| Namespace Prefix: |
us-gaap_ |
| Data Type: |
xbrli:monetaryItemType |
| Balance Type: |
debit |
| Period Type: |
instant |
|
| X |
- DefinitionAmount classified as accounts, notes and loans receivable attributable to disposal group held for sale or disposed of. Reference 1: http://fasb.org/us-gaap/role/ref/legacyRef
-Name Accounting Standards Codification
-Section 45
-Paragraph 10
-SubTopic 20
-Topic 205
-Publisher FASB
-URI https://asc.fasb.org//1943274/2147483475/205-20-45-10
Reference 2: http://fasb.org/us-gaap/role/ref/legacyRef
-Topic 205
-SubTopic 20
-Name Accounting Standards Codification
-Section 50
-Paragraph 5B
-Subparagraph (e)
-Publisher FASB
-URI https://asc.fasb.org//1943274/2147483499/205-20-50-5B
Reference 3: http://fasb.org/us-gaap/role/ref/legacyRef
-Topic 360
-SubTopic 10
-Name Accounting Standards Codification
-Section 50
-Paragraph 3
-Subparagraph (e)
-Publisher FASB
-URI https://asc.fasb.org//1943274/2147482099/360-10-50-3
Reference 4: http://fasb.org/us-gaap/role/ref/legacyRef
-Topic 205
-SubTopic 20
-Name Accounting Standards Codification
-Section 45
-Paragraph 11
-Publisher FASB
-URI https://asc.fasb.org//1943274/2147483475/205-20-45-11
| Name: |
us-gaap_DisposalGroupIncludingDiscontinuedOperationAccountsNotesAndLoansReceivableNet |
| Namespace Prefix: |
us-gaap_ |
| Data Type: |
xbrli:monetaryItemType |
| Balance Type: |
debit |
| Period Type: |
instant |
|
| X |
- DefinitionAmount classified as accounts payable attributable to disposal group held for sale or disposed of, expected to be disposed of within one year or the normal operating cycle, if longer. Reference 1: http://fasb.org/us-gaap/role/ref/legacyRef
-Name Accounting Standards Codification
-Section 45
-Paragraph 10
-SubTopic 20
-Topic 205
-Publisher FASB
-URI https://asc.fasb.org//1943274/2147483475/205-20-45-10
Reference 2: http://fasb.org/us-gaap/role/ref/legacyRef
-Topic 360
-SubTopic 10
-Name Accounting Standards Codification
-Section 45
-Paragraph 9
-Publisher FASB
-URI https://asc.fasb.org//1943274/2147482130/360-10-45-9
Reference 3: http://fasb.org/us-gaap/role/ref/legacyRef
-Topic 205
-SubTopic 20
-Name Accounting Standards Codification
-Section 50
-Paragraph 5B
-Subparagraph (e)
-Publisher FASB
-URI https://asc.fasb.org//1943274/2147483499/205-20-50-5B
Reference 4: http://fasb.org/us-gaap/role/ref/legacyRef
-Topic 360
-SubTopic 10
-Name Accounting Standards Codification
-Section 50
-Paragraph 3
-Subparagraph (e)
-Publisher FASB
-URI https://asc.fasb.org//1943274/2147482099/360-10-50-3
Reference 5: http://fasb.org/us-gaap/role/ref/legacyRef
-Topic 205
-SubTopic 20
-Name Accounting Standards Codification
-Section 45
-Paragraph 11
-Publisher FASB
-URI https://asc.fasb.org//1943274/2147483475/205-20-45-11
| Name: |
us-gaap_DisposalGroupIncludingDiscontinuedOperationAccountsPayableCurrent |
| Namespace Prefix: |
us-gaap_ |
| Data Type: |
xbrli:monetaryItemType |
| Balance Type: |
credit |
| Period Type: |
instant |
|
| X |
- DefinitionAmount classified as accrued liabilities attributable to disposal group held for sale or disposed of, expected to be disposed of within one year or the normal operating cycle, if longer. Reference 1: http://fasb.org/us-gaap/role/ref/legacyRef
-Name Accounting Standards Codification
-Section 45
-Paragraph 10
-SubTopic 20
-Topic 205
-Publisher FASB
-URI https://asc.fasb.org//1943274/2147483475/205-20-45-10
Reference 2: http://fasb.org/us-gaap/role/ref/legacyRef
-Topic 360
-SubTopic 10
-Name Accounting Standards Codification
-Section 45
-Paragraph 9
-Publisher FASB
-URI https://asc.fasb.org//1943274/2147482130/360-10-45-9
Reference 3: http://fasb.org/us-gaap/role/ref/legacyRef
-Topic 205
-SubTopic 20
-Name Accounting Standards Codification
-Section 50
-Paragraph 5B
-Subparagraph (e)
-Publisher FASB
-URI https://asc.fasb.org//1943274/2147483499/205-20-50-5B
Reference 4: http://fasb.org/us-gaap/role/ref/legacyRef
-Topic 360
-SubTopic 10
-Name Accounting Standards Codification
-Section 50
-Paragraph 3
-Subparagraph (e)
-Publisher FASB
-URI https://asc.fasb.org//1943274/2147482099/360-10-50-3
Reference 5: http://fasb.org/us-gaap/role/ref/legacyRef
-Topic 205
-SubTopic 20
-Name Accounting Standards Codification
-Section 45
-Paragraph 11
-Publisher FASB
-URI https://asc.fasb.org//1943274/2147483475/205-20-45-11
| Name: |
us-gaap_DisposalGroupIncludingDiscontinuedOperationAccruedLiabilitiesCurrent |
| Namespace Prefix: |
us-gaap_ |
| Data Type: |
xbrli:monetaryItemType |
| Balance Type: |
credit |
| Period Type: |
instant |
|
| X |
- DefinitionAmount classified as assets attributable to disposal group held for sale or disposed of, expected to be disposed of after one year or the normal operating cycle, if longer. Reference 1: http://fasb.org/us-gaap/role/ref/legacyRef
-Name Accounting Standards Codification
-Section 45
-Paragraph 10
-SubTopic 20
-Topic 205
-Publisher FASB
-URI https://asc.fasb.org//1943274/2147483475/205-20-45-10
Reference 2: http://fasb.org/us-gaap/role/ref/legacyRef
-Name Accounting Standards Codification
-Section 45
-Paragraph 11
-SubTopic 10
-Topic 360
-Publisher FASB
-URI https://asc.fasb.org//1943274/2147482130/360-10-45-11
Reference 3: http://www.xbrl.org/2003/role/disclosureRef
-Topic 205
-SubTopic 20
-Name Accounting Standards Codification
-Section 50
-Paragraph 7
-Publisher FASB
-URI https://asc.fasb.org//1943274/2147483499/205-20-50-7
Reference 4: http://www.xbrl.org/2003/role/disclosureRef
-Topic 205
-SubTopic 20
-Name Accounting Standards Codification
-Section 50
-Paragraph 5C
-Subparagraph (a)(2)
-Publisher FASB
-URI https://asc.fasb.org//1943274/2147483499/205-20-50-5C
Reference 5: http://fasb.org/us-gaap/role/ref/legacyRef
-Topic 205
-SubTopic 20
-Name Accounting Standards Codification
-Section 50
-Paragraph 5B
-Subparagraph (e)
-Publisher FASB
-URI https://asc.fasb.org//1943274/2147483499/205-20-50-5B
Reference 6: http://fasb.org/us-gaap/role/ref/legacyRef
-Topic 360
-SubTopic 10
-Name Accounting Standards Codification
-Section 50
-Paragraph 3
-Subparagraph (e)
-Publisher FASB
-URI https://asc.fasb.org//1943274/2147482099/360-10-50-3
Reference 7: http://fasb.org/us-gaap/role/ref/legacyRef
-Topic 205
-SubTopic 20
-Name Accounting Standards Codification
-Section 45
-Paragraph 11
-Publisher FASB
-URI https://asc.fasb.org//1943274/2147483475/205-20-45-11
| Name: |
us-gaap_DisposalGroupIncludingDiscontinuedOperationAssetsNoncurrent |
| Namespace Prefix: |
us-gaap_ |
| Data Type: |
xbrli:monetaryItemType |
| Balance Type: |
debit |
| Period Type: |
instant |
|
| X |
- DefinitionAmount classified as deferred revenue attributable to disposal group held for sale or disposed of, expected to be disposed of within one year or the normal operating cycle, if longer. Reference 1: http://fasb.org/us-gaap/role/ref/legacyRef
-Name Accounting Standards Codification
-Section 45
-Paragraph 10
-SubTopic 20
-Topic 205
-Publisher FASB
-URI https://asc.fasb.org//1943274/2147483475/205-20-45-10
Reference 2: http://fasb.org/us-gaap/role/ref/legacyRef
-Topic 360
-SubTopic 10
-Name Accounting Standards Codification
-Section 45
-Paragraph 9
-Publisher FASB
-URI https://asc.fasb.org//1943274/2147482130/360-10-45-9
Reference 3: http://fasb.org/us-gaap/role/ref/legacyRef
-Topic 205
-SubTopic 20
-Name Accounting Standards Codification
-Section 50
-Paragraph 5B
-Subparagraph (e)
-Publisher FASB
-URI https://asc.fasb.org//1943274/2147483499/205-20-50-5B
Reference 4: http://fasb.org/us-gaap/role/ref/legacyRef
-Topic 360
-SubTopic 10
-Name Accounting Standards Codification
-Section 50
-Paragraph 3
-Subparagraph (e)
-Publisher FASB
-URI https://asc.fasb.org//1943274/2147482099/360-10-50-3
Reference 5: http://fasb.org/us-gaap/role/ref/legacyRef
-Topic 205
-SubTopic 20
-Name Accounting Standards Codification
-Section 45
-Paragraph 11
-Publisher FASB
-URI https://asc.fasb.org//1943274/2147483475/205-20-45-11
| Name: |
us-gaap_DisposalGroupIncludingDiscontinuedOperationDeferredRevenueCurrent |
| Namespace Prefix: |
us-gaap_ |
| Data Type: |
xbrli:monetaryItemType |
| Balance Type: |
credit |
| Period Type: |
instant |
|
| X |
- DefinitionAmount classified as inventory attributable to disposal group, expected to be disposed of within one year or the normal operating cycle, if longer. Reference 1: http://fasb.org/us-gaap/role/ref/legacyRef
-Name Accounting Standards Codification
-Section 45
-Paragraph 10
-SubTopic 20
-Topic 205
-Publisher FASB
-URI https://asc.fasb.org//1943274/2147483475/205-20-45-10
Reference 2: http://fasb.org/us-gaap/role/ref/legacyRef
-Topic 360
-SubTopic 10
-Name Accounting Standards Codification
-Section 45
-Paragraph 9
-Publisher FASB
-URI https://asc.fasb.org//1943274/2147482130/360-10-45-9
Reference 3: http://fasb.org/us-gaap/role/ref/legacyRef
-Topic 205
-SubTopic 20
-Name Accounting Standards Codification
-Section 50
-Paragraph 5B
-Subparagraph (e)
-Publisher FASB
-URI https://asc.fasb.org//1943274/2147483499/205-20-50-5B
Reference 4: http://fasb.org/us-gaap/role/ref/legacyRef
-Topic 360
-SubTopic 10
-Name Accounting Standards Codification
-Section 50
-Paragraph 3
-Subparagraph (e)
-Publisher FASB
-URI https://asc.fasb.org//1943274/2147482099/360-10-50-3
Reference 5: http://fasb.org/us-gaap/role/ref/legacyRef
-Topic 205
-SubTopic 20
-Name Accounting Standards Codification
-Section 45
-Paragraph 11
-Publisher FASB
-URI https://asc.fasb.org//1943274/2147483475/205-20-45-11
| Name: |
us-gaap_DisposalGroupIncludingDiscontinuedOperationInventoryCurrent |
| Namespace Prefix: |
us-gaap_ |
| Data Type: |
xbrli:monetaryItemType |
| Balance Type: |
debit |
| Period Type: |
instant |
|
| X |
- DefinitionAmount classified as prepaid and other assets attributable to disposal group held for sale or disposed of, expected to be disposed of within one year or the normal operating cycle, if longer. Reference 1: http://fasb.org/us-gaap/role/ref/legacyRef
-Name Accounting Standards Codification
-Section 45
-Paragraph 10
-SubTopic 20
-Topic 205
-Publisher FASB
-URI https://asc.fasb.org//1943274/2147483475/205-20-45-10
Reference 2: http://fasb.org/us-gaap/role/ref/legacyRef
-Topic 360
-SubTopic 10
-Name Accounting Standards Codification
-Section 45
-Paragraph 9
-Publisher FASB
-URI https://asc.fasb.org//1943274/2147482130/360-10-45-9
Reference 3: http://fasb.org/us-gaap/role/ref/legacyRef
-Topic 205
-SubTopic 20
-Name Accounting Standards Codification
-Section 50
-Paragraph 5B
-Subparagraph (e)
-Publisher FASB
-URI https://asc.fasb.org//1943274/2147483499/205-20-50-5B
Reference 4: http://fasb.org/us-gaap/role/ref/legacyRef
-Topic 360
-SubTopic 10
-Name Accounting Standards Codification
-Section 50
-Paragraph 3
-Subparagraph (e)
-Publisher FASB
-URI https://asc.fasb.org//1943274/2147482099/360-10-50-3
Reference 5: http://fasb.org/us-gaap/role/ref/legacyRef
-Topic 205
-SubTopic 20
-Name Accounting Standards Codification
-Section 45
-Paragraph 11
-Publisher FASB
-URI https://asc.fasb.org//1943274/2147483475/205-20-45-11
| Name: |
us-gaap_DisposalGroupIncludingDiscontinuedOperationPrepaidAndOtherAssetsCurrent |
| Namespace Prefix: |
us-gaap_ |
| Data Type: |
xbrli:monetaryItemType |
| Balance Type: |
debit |
| Period Type: |
instant |
|
| X |
- DefinitionAmount classified as property, plant and equipment attributable to disposal group held for sale or disposed of, expected to be disposed of after one year or the normal operating cycle, if longer. Reference 1: http://fasb.org/us-gaap/role/ref/legacyRef
-Name Accounting Standards Codification
-Section 45
-Paragraph 10
-SubTopic 20
-Topic 205
-Publisher FASB
-URI https://asc.fasb.org//1943274/2147483475/205-20-45-10
Reference 2: http://fasb.org/us-gaap/role/ref/legacyRef
-Name Accounting Standards Codification
-Section 45
-Paragraph 11
-SubTopic 10
-Topic 360
-Publisher FASB
-URI https://asc.fasb.org//1943274/2147482130/360-10-45-11
Reference 3: http://fasb.org/us-gaap/role/ref/legacyRef
-Topic 205
-SubTopic 20
-Name Accounting Standards Codification
-Section 50
-Paragraph 5B
-Subparagraph (e)
-Publisher FASB
-URI https://asc.fasb.org//1943274/2147483499/205-20-50-5B
Reference 4: http://fasb.org/us-gaap/role/ref/legacyRef
-Topic 360
-SubTopic 10
-Name Accounting Standards Codification
-Section 50
-Paragraph 3
-Subparagraph (e)
-Publisher FASB
-URI https://asc.fasb.org//1943274/2147482099/360-10-50-3
Reference 5: http://fasb.org/us-gaap/role/ref/legacyRef
-Topic 205
-SubTopic 20
-Name Accounting Standards Codification
-Section 45
-Paragraph 11
-Publisher FASB
-URI https://asc.fasb.org//1943274/2147483475/205-20-45-11
| Name: |
us-gaap_DisposalGroupIncludingDiscontinuedOperationPropertyPlantAndEquipmentNoncurrent |
| Namespace Prefix: |
us-gaap_ |
| Data Type: |
xbrli:monetaryItemType |
| Balance Type: |
debit |
| Period Type: |
instant |
|
| X |
- DefinitionAmount classified as liabilities attributable to disposal group held for sale or disposed of, expected to be disposed of within one year or the normal operating cycle, if longer. Reference 1: http://fasb.org/us-gaap/role/ref/legacyRef
-Name Accounting Standards Codification
-Section 45
-Paragraph 10
-SubTopic 20
-Topic 205
-Publisher FASB
-URI https://asc.fasb.org//1943274/2147483475/205-20-45-10
Reference 2: http://www.xbrl.org/2003/role/disclosureRef
-Topic 205
-SubTopic 20
-Name Accounting Standards Codification
-Section 50
-Paragraph 7
-Publisher FASB
-URI https://asc.fasb.org//1943274/2147483499/205-20-50-7
Reference 3: http://www.xbrl.org/2003/role/disclosureRef
-Topic 205
-SubTopic 20
-Name Accounting Standards Codification
-Section 50
-Paragraph 5C
-Subparagraph (a)(2)
-Publisher FASB
-URI https://asc.fasb.org//1943274/2147483499/205-20-50-5C
Reference 4: http://fasb.org/us-gaap/role/ref/legacyRef
-Topic 360
-SubTopic 10
-Name Accounting Standards Codification
-Section 45
-Paragraph 9
-Publisher FASB
-URI https://asc.fasb.org//1943274/2147482130/360-10-45-9
Reference 5: http://fasb.org/us-gaap/role/ref/legacyRef
-Topic 205
-SubTopic 20
-Name Accounting Standards Codification
-Section 50
-Paragraph 5B
-Subparagraph (e)
-Publisher FASB
-URI https://asc.fasb.org//1943274/2147483499/205-20-50-5B
Reference 6: http://fasb.org/us-gaap/role/ref/legacyRef
-Topic 360
-SubTopic 10
-Name Accounting Standards Codification
-Section 50
-Paragraph 3
-Subparagraph (e)
-Publisher FASB
-URI https://asc.fasb.org//1943274/2147482099/360-10-50-3
Reference 7: http://fasb.org/us-gaap/role/ref/legacyRef
-Topic 205
-SubTopic 20
-Name Accounting Standards Codification
-Section 45
-Paragraph 11
-Publisher FASB
-URI https://asc.fasb.org//1943274/2147483475/205-20-45-11
| Name: |
us-gaap_LiabilitiesOfDisposalGroupIncludingDiscontinuedOperationCurrent |
| Namespace Prefix: |
us-gaap_ |
| Data Type: |
xbrli:monetaryItemType |
| Balance Type: |
credit |
| Period Type: |
instant |
|
| X |
- DefinitionAmount classified as liabilities attributable to disposal group held for sale or disposed of, expected to be disposed of beyond one year or the normal operating cycle, if longer. Reference 1: http://fasb.org/us-gaap/role/ref/legacyRef
-Name Accounting Standards Codification
-Section 45
-Paragraph 10
-SubTopic 20
-Topic 205
-Publisher FASB
-URI https://asc.fasb.org//1943274/2147483475/205-20-45-10
Reference 2: http://fasb.org/us-gaap/role/ref/legacyRef
-Name Accounting Standards Codification
-Section 45
-Paragraph 11
-SubTopic 10
-Topic 360
-Publisher FASB
-URI https://asc.fasb.org//1943274/2147482130/360-10-45-11
Reference 3: http://www.xbrl.org/2003/role/disclosureRef
-Topic 205
-SubTopic 20
-Name Accounting Standards Codification
-Section 50
-Paragraph 7
-Publisher FASB
-URI https://asc.fasb.org//1943274/2147483499/205-20-50-7
Reference 4: http://www.xbrl.org/2003/role/disclosureRef
-Topic 205
-SubTopic 20
-Name Accounting Standards Codification
-Section 50
-Paragraph 5C
-Subparagraph (a)(2)
-Publisher FASB
-URI https://asc.fasb.org//1943274/2147483499/205-20-50-5C
Reference 5: http://fasb.org/us-gaap/role/ref/legacyRef
-Topic 205
-SubTopic 20
-Name Accounting Standards Codification
-Section 50
-Paragraph 5B
-Subparagraph (e)
-Publisher FASB
-URI https://asc.fasb.org//1943274/2147483499/205-20-50-5B
Reference 6: http://fasb.org/us-gaap/role/ref/legacyRef
-Topic 360
-SubTopic 10
-Name Accounting Standards Codification
-Section 50
-Paragraph 3
-Subparagraph (e)
-Publisher FASB
-URI https://asc.fasb.org//1943274/2147482099/360-10-50-3
Reference 7: http://fasb.org/us-gaap/role/ref/legacyRef
-Topic 205
-SubTopic 20
-Name Accounting Standards Codification
-Section 45
-Paragraph 11
-Publisher FASB
-URI https://asc.fasb.org//1943274/2147483475/205-20-45-11
| Name: |
us-gaap_LiabilitiesOfDisposalGroupIncludingDiscontinuedOperationNoncurrent |
| Namespace Prefix: |
us-gaap_ |
| Data Type: |
xbrli:monetaryItemType |
| Balance Type: |
credit |
| Period Type: |
instant |
|
v3.24.1
Sale of InStore Marketing Business and Presentation as Discontinued Operations (Details 2) - USD ($)
|
12 Months Ended |
Dec. 31, 2023 |
Dec. 31, 2022 |
| Sale of In-Store Marketing Business and Presentation as Discontinued Operations |
|
|
| Net services revenues |
$ 21,078,000
|
$ 18,800,000
|
| Cost of services |
16,087,000
|
15,499,000
|
| Gross Profit |
4,991,000
|
3,301,000
|
| Selling |
1,136,000
|
1,325,000
|
| Marketing |
805,000
|
1,050,000
|
| General and administrative |
679,000
|
878,000
|
| Total Operating Expenses |
2,620,000
|
3,253,000
|
| Gain from litigation settlement, net |
0
|
12,000,000
|
| Operating Income |
2,371,000
|
12,048,000
|
| Other income |
91,000
|
68,000
|
| Income from discontinued operations before income taxes |
2,462,000
|
12,116,000
|
| Income tax benefit |
(12,000)
|
(224,000)
|
| Income from discontinued operations, net of tax |
2,474,000
|
12,340,000
|
| Gain from sale of discountinued operation before income taxs |
3,044,000
|
0
|
| Income tax expense |
83,000
|
0
|
| Gain from sale of discountinued operation, net of tax |
$ 2,961,000
|
$ 0
|
| X |
- References
+ Details
| Name: |
ldwy_DisposalGroupIncludingDiscontinuedOperationMarketingExpense |
| Namespace Prefix: |
ldwy_ |
| Data Type: |
xbrli:monetaryItemType |
| Balance Type: |
debit |
| Period Type: |
duration |
|
| X |
- References
+ Details
| Name: |
ldwy_DisposalGroupIncludingDiscontinuedOperationSellingExpense |
| Namespace Prefix: |
ldwy_ |
| Data Type: |
xbrli:monetaryItemType |
| Balance Type: |
debit |
| Period Type: |
duration |
|
| X |
- References
+ Details
| Name: |
ldwy_SaleOfInStoreMarketingBusinessAndPresentationAsDiscontinuedOperationsAbstract |
| Namespace Prefix: |
ldwy_ |
| Data Type: |
xbrli:stringItemType |
| Balance Type: |
na |
| Period Type: |
duration |
|
| X |
- DefinitionAmount after tax of (gain) loss recognized for the (reversal of write-down) write-down to fair value, less cost to sell, of a discontinued operation. Reference 1: http://fasb.org/us-gaap/role/ref/legacyRef
-Topic 205
-SubTopic 20
-Name Accounting Standards Codification
-Section 50
-Paragraph 5C
-Subparagraph (b)(2)
-Publisher FASB
-URI https://asc.fasb.org//1943274/2147483499/205-20-50-5C
Reference 2: http://fasb.org/us-gaap/role/ref/legacyRef
-Topic 205
-SubTopic 20
-Name Accounting Standards Codification
-Section 45
-Paragraph 3B
-Publisher FASB
-URI https://asc.fasb.org//1943274/2147483475/205-20-45-3B
Reference 3: http://fasb.org/us-gaap/role/ref/legacyRef
-Topic 205
-SubTopic 20
-Name Accounting Standards Codification
-Section 50
-Paragraph 1
-Subparagraph (b)
-Publisher FASB
-URI https://asc.fasb.org//1943274/2147483499/205-20-50-1
Reference 4: http://fasb.org/us-gaap/role/ref/legacyRef
-Topic 205
-SubTopic 20
-Name Accounting Standards Codification
-Section 45
-Paragraph 3
-Publisher FASB
-URI https://asc.fasb.org//1943274/2147483475/205-20-45-3
| Name: |
us-gaap_DiscontinuedOperationProvisionForLossGainOnDisposalNetOfTax |
| Namespace Prefix: |
us-gaap_ |
| Data Type: |
xbrli:monetaryItemType |
| Balance Type: |
debit |
| Period Type: |
duration |
|
| X |
- DefinitionAmount of tax expense (benefit) related to a discontinued operation. Includes, but is not limited to, tax expense (benefit) related to income (loss) from operations during the phase-out period, tax expense (benefit) related to gain (loss) on disposal, tax expense (benefit) related to gain (loss) for reversal of write-down (write-down) to fair value, less cost to sell, and tax expense (benefit) related to adjustments of a prior period gain (loss) on disposal. Reference 1: http://www.xbrl.org/2003/role/disclosureRef
-Topic 740
-SubTopic 10
-Name Accounting Standards Codification
-Section 50
-Paragraph 10
-Publisher FASB
-URI https://asc.fasb.org//1943274/2147482685/740-10-50-10
Reference 2: http://www.xbrl.org/2003/role/disclosureRef
-Topic 740
-SubTopic 10
-Name Accounting Standards Codification
-Section S99
-Paragraph 1
-Subparagraph (SAB TOPIC 6.I.7)
-Publisher FASB
-URI https://asc.fasb.org//1943274/2147479360/740-10-S99-1
Reference 3: http://www.xbrl.org/2003/role/disclosureRef
-Topic 740
-SubTopic 20
-Name Accounting Standards Codification
-Section 45
-Paragraph 2
-Subparagraph (b)
-Publisher FASB
-URI https://asc.fasb.org//1943274/2147482659/740-20-45-2
Reference 4: http://fasb.org/us-gaap/role/ref/legacyRef
-Topic 205
-SubTopic 20
-Name Accounting Standards Codification
-Section 45
-Paragraph 3A
-Publisher FASB
-URI https://asc.fasb.org//1943274/2147483475/205-20-45-3A
Reference 5: http://fasb.org/us-gaap/role/ref/legacyRef
-Topic 205
-SubTopic 20
-Name Accounting Standards Codification
-Section 50
-Paragraph 5B
-Subparagraph (a)
-Publisher FASB
-URI https://asc.fasb.org//1943274/2147483499/205-20-50-5B
Reference 6: http://fasb.org/us-gaap/role/ref/legacyRef
-Topic 205
-SubTopic 20
-Name Accounting Standards Codification
-Section 50
-Paragraph 5C
-Subparagraph (b)(2)
-Publisher FASB
-URI https://asc.fasb.org//1943274/2147483499/205-20-50-5C
Reference 7: http://fasb.org/us-gaap/role/ref/legacyRef
-Topic 205
-SubTopic 20
-Name Accounting Standards Codification
-Section 45
-Paragraph 3B
-Publisher FASB
-URI https://asc.fasb.org//1943274/2147483475/205-20-45-3B
Reference 8: http://fasb.org/us-gaap/role/ref/legacyRef
-Topic 205
-SubTopic 20
-Name Accounting Standards Codification
-Section 45
-Paragraph 4
-Publisher FASB
-URI https://asc.fasb.org//1943274/2147483475/205-20-45-4
Reference 9: http://fasb.org/us-gaap/role/ref/legacyRef
-Topic 205
-SubTopic 20
-Name Accounting Standards Codification
-Section 50
-Paragraph 1
-Subparagraph (b)
-Publisher FASB
-URI https://asc.fasb.org//1943274/2147483499/205-20-50-1
| Name: |
us-gaap_DiscontinuedOperationTaxEffectOfDiscontinuedOperation |
| Namespace Prefix: |
us-gaap_ |
| Data Type: |
xbrli:monetaryItemType |
| Balance Type: |
debit |
| Period Type: |
duration |
|
| X |
- DefinitionAmount of tax (expense) benefit on (gain) loss recognized for the (reversal of write-down) write-down to fair value, less cost to sell, of a discontinued operation. Reference 1: http://www.xbrl.org/2009/role/commonPracticeRef
-Topic 740
-SubTopic 20
-Name Accounting Standards Codification
-Section 45
-Paragraph 2
-Subparagraph (b)
-Publisher FASB
-URI https://asc.fasb.org//1943274/2147482659/740-20-45-2
Reference 2: http://fasb.org/us-gaap/role/ref/legacyRef
-Topic 205
-SubTopic 20
-Name Accounting Standards Codification
-Section 50
-Paragraph 5C
-Subparagraph (b)(2)
-Publisher FASB
-URI https://asc.fasb.org//1943274/2147483499/205-20-50-5C
Reference 3: http://fasb.org/us-gaap/role/ref/legacyRef
-Topic 205
-SubTopic 20
-Name Accounting Standards Codification
-Section 45
-Paragraph 3B
-Publisher FASB
-URI https://asc.fasb.org//1943274/2147483475/205-20-45-3B
Reference 4: http://fasb.org/us-gaap/role/ref/legacyRef
-Topic 205
-SubTopic 20
-Name Accounting Standards Codification
-Section 50
-Paragraph 1
-Subparagraph (b)
-Publisher FASB
-URI https://asc.fasb.org//1943274/2147483499/205-20-50-1
| Name: |
us-gaap_DiscontinuedOperationTaxExpenseBenefitFromProvisionForGainLossOnDisposal |
| Namespace Prefix: |
us-gaap_ |
| Data Type: |
xbrli:monetaryItemType |
| Balance Type: |
credit |
| Period Type: |
duration |
|
| X |
- DefinitionAmount of costs of goods sold attributable to disposal group, including, but not limited to, discontinued operation. Reference 1: http://www.xbrl.org/2003/role/disclosureRef
-Topic 205
-SubTopic 20
-Name Accounting Standards Codification
-Section 50
-Paragraph 7
-Publisher FASB
-URI https://asc.fasb.org//1943274/2147483499/205-20-50-7
Reference 2: http://fasb.org/us-gaap/role/ref/legacyRef
-Topic 205
-SubTopic 20
-Name Accounting Standards Codification
-Section 50
-Paragraph 5B
-Subparagraph (b)
-Publisher FASB
-URI https://asc.fasb.org//1943274/2147483499/205-20-50-5B
| Name: |
us-gaap_DisposalGroupIncludingDiscontinuedOperationCostsOfGoodsSold |
| Namespace Prefix: |
us-gaap_ |
| Data Type: |
xbrli:monetaryItemType |
| Balance Type: |
debit |
| Period Type: |
duration |
|
| X |
- DefinitionAmount of general and administrative expense attributable to disposal group, including, but not limited to, discontinued operation. Reference 1: http://fasb.org/us-gaap/role/ref/legacyRef
-Topic 205
-SubTopic 20
-Name Accounting Standards Codification
-Section 50
-Paragraph 5B
-Subparagraph (b)
-Publisher FASB
-URI https://asc.fasb.org//1943274/2147483499/205-20-50-5B
| Name: |
us-gaap_DisposalGroupIncludingDiscontinuedOperationGeneralAndAdministrativeExpense |
| Namespace Prefix: |
us-gaap_ |
| Data Type: |
xbrli:monetaryItemType |
| Balance Type: |
debit |
| Period Type: |
duration |
|
| X |
- DefinitionAmount of gross profit attributable to disposal group, including, but not limited to, discontinued operation. Reference 1: http://www.xbrl.org/2003/role/disclosureRef
-Topic 205
-SubTopic 20
-Name Accounting Standards Codification
-Section 50
-Paragraph 7
-Publisher FASB
-URI https://asc.fasb.org//1943274/2147483499/205-20-50-7
Reference 2: http://fasb.org/us-gaap/role/ref/legacyRef
-Topic 205
-SubTopic 20
-Name Accounting Standards Codification
-Section 50
-Paragraph 5B
-Subparagraph (b)
-Publisher FASB
-URI https://asc.fasb.org//1943274/2147483499/205-20-50-5B
| Name: |
us-gaap_DisposalGroupIncludingDiscontinuedOperationGrossProfitLoss |
| Namespace Prefix: |
us-gaap_ |
| Data Type: |
xbrli:monetaryItemType |
| Balance Type: |
credit |
| Period Type: |
duration |
|
| X |
- DefinitionAmount of operating expense attributable to disposal group, including, but not limited to, discontinued operation. Reference 1: http://fasb.org/us-gaap/role/ref/legacyRef
-Topic 205
-SubTopic 20
-Name Accounting Standards Codification
-Section 50
-Paragraph 5B
-Subparagraph (b)
-Publisher FASB
-URI https://asc.fasb.org//1943274/2147483499/205-20-50-5B
| Name: |
us-gaap_DisposalGroupIncludingDiscontinuedOperationOperatingExpense |
| Namespace Prefix: |
us-gaap_ |
| Data Type: |
xbrli:monetaryItemType |
| Balance Type: |
debit |
| Period Type: |
duration |
|
| X |
- DefinitionAmount of operating income (loss) attributable to disposal group, including, but not limited to, discontinued operation. Reference 1: http://fasb.org/us-gaap/role/ref/legacyRef
-Topic 205
-SubTopic 20
-Name Accounting Standards Codification
-Section 50
-Paragraph 5B
-Subparagraph (b)
-Publisher FASB
-URI https://asc.fasb.org//1943274/2147483499/205-20-50-5B
| Name: |
us-gaap_DisposalGroupIncludingDiscontinuedOperationOperatingIncomeLoss |
| Namespace Prefix: |
us-gaap_ |
| Data Type: |
xbrli:monetaryItemType |
| Balance Type: |
credit |
| Period Type: |
duration |
|
| X |
- DefinitionAmount of other income attributable to disposal group, including, but not limited to, discontinued operation. Reference 1: http://fasb.org/us-gaap/role/ref/legacyRef
-Topic 205
-SubTopic 20
-Name Accounting Standards Codification
-Section 50
-Paragraph 5B
-Subparagraph (b)
-Publisher FASB
-URI https://asc.fasb.org//1943274/2147483499/205-20-50-5B
| Name: |
us-gaap_DisposalGroupIncludingDiscontinuedOperationOtherIncome |
| Namespace Prefix: |
us-gaap_ |
| Data Type: |
xbrli:monetaryItemType |
| Balance Type: |
credit |
| Period Type: |
duration |
|
| X |
- DefinitionAmount of revenue attributable to disposal group, including, but not limited to, discontinued operation. Reference 1: http://www.xbrl.org/2003/role/disclosureRef
-Topic 205
-SubTopic 20
-Name Accounting Standards Codification
-Section 50
-Paragraph 7
-Publisher FASB
-URI https://asc.fasb.org//1943274/2147483499/205-20-50-7
Reference 2: http://fasb.org/us-gaap/role/ref/legacyRef
-Topic 205
-SubTopic 20
-Name Accounting Standards Codification
-Section 50
-Paragraph 5B
-Subparagraph (b)
-Publisher FASB
-URI https://asc.fasb.org//1943274/2147483499/205-20-50-5B
| Name: |
us-gaap_DisposalGroupIncludingDiscontinuedOperationRevenue |
| Namespace Prefix: |
us-gaap_ |
| Data Type: |
xbrli:monetaryItemType |
| Balance Type: |
credit |
| Period Type: |
duration |
|
| X |
- DefinitionAmount after tax of income (loss) from a discontinued operation including the portion attributable to the noncontrolling interest. Includes, but is not limited to, the income (loss) from operations during the phase-out period, gain (loss) on disposal, gain (loss) for reversal of write-down (write-down) to fair value, less cost to sell, and adjustments to a prior period gain (loss) on disposal. Reference 1: http://www.xbrl.org/2003/role/disclosureRef
-Topic 944
-SubTopic 220
-Name Accounting Standards Codification
-Section S99
-Paragraph 1
-Subparagraph (SX 210.7-04(12))
-Publisher FASB
-URI https://asc.fasb.org//1943274/2147483586/944-220-S99-1
Reference 2: http://www.xbrl.org/2003/role/disclosureRef
-Topic 740
-SubTopic 270
-Name Accounting Standards Codification
-Section 45
-Paragraph 3
-Publisher FASB
-URI https://asc.fasb.org//1943274/2147482551/740-270-45-3
Reference 3: http://www.xbrl.org/2003/role/disclosureRef
-Topic 205
-SubTopic 20
-Name Accounting Standards Codification
-Section 50
-Paragraph 7
-Publisher FASB
-URI https://asc.fasb.org//1943274/2147483499/205-20-50-7
Reference 4: http://fasb.org/us-gaap/role/ref/legacyRef
-Topic 205
-SubTopic 20
-Name Accounting Standards Codification
-Section 45
-Paragraph 3A
-Publisher FASB
-URI https://asc.fasb.org//1943274/2147483475/205-20-45-3A
Reference 5: http://fasb.org/us-gaap/role/ref/legacyRef
-Topic 205
-SubTopic 20
-Name Accounting Standards Codification
-Section 50
-Paragraph 5C
-Subparagraph (b)(2)
-Publisher FASB
-URI https://asc.fasb.org//1943274/2147483499/205-20-50-5C
Reference 6: http://fasb.org/us-gaap/role/ref/legacyRef
-Topic 205
-SubTopic 20
-Name Accounting Standards Codification
-Section 45
-Paragraph 3B
-Publisher FASB
-URI https://asc.fasb.org//1943274/2147483475/205-20-45-3B
Reference 7: http://fasb.org/us-gaap/role/ref/legacyRef
-Topic 205
-SubTopic 20
-Name Accounting Standards Codification
-Section 45
-Paragraph 4
-Publisher FASB
-URI https://asc.fasb.org//1943274/2147483475/205-20-45-4
Reference 8: http://fasb.org/us-gaap/role/ref/legacyRef
-Topic 205
-SubTopic 20
-Name Accounting Standards Codification
-Section 50
-Paragraph 1
-Subparagraph (b)
-Publisher FASB
-URI https://asc.fasb.org//1943274/2147483499/205-20-50-1
Reference 9: http://fasb.org/us-gaap/role/ref/legacyRef
-Topic 205
-SubTopic 20
-Name Accounting Standards Codification
-Section 45
-Paragraph 3
-Publisher FASB
-URI https://asc.fasb.org//1943274/2147483475/205-20-45-3
| Name: |
us-gaap_IncomeLossFromDiscontinuedOperationsNetOfTax |
| Namespace Prefix: |
us-gaap_ |
| Data Type: |
xbrli:monetaryItemType |
| Balance Type: |
credit |
| Period Type: |
duration |
|
v3.24.1
Sale of InStore Marketing Business and Presentation as Discontinued Operations (Detail Narrative) - USD ($)
|
9 Months Ended |
12 Months Ended |
|
|
Sep. 30, 2022 |
Dec. 31, 2023 |
Aug. 03, 2023 |
Jul. 01, 2022 |
| Cash consideration |
|
|
$ 1,500,000
|
|
| Escrowed amount |
|
|
200,000
|
|
| Market price of business |
|
|
$ 3,500,000
|
|
| Addition in continuing operations and employee bonuses |
|
$ 48,000
|
|
|
| Employees bonuses |
|
164,000
|
|
|
| Retention payout |
|
343,000
|
|
|
| Other benefits |
|
$ 490,000
|
|
|
| Decrease in income ax benefit |
$ 678,000
|
|
|
|
| News America |
|
|
|
|
| Note payble |
|
|
|
$ 20,000,000
|
| Proceed from notes payble |
$ 12,000,000
|
|
|
|
| X |
- DefinitionAmount of currency on hand as well as demand deposits with banks or financial institutions. Includes other kinds of accounts that have the general characteristics of demand deposits. Excludes cash and cash equivalents within disposal group and discontinued operation. Reference 1: http://www.xbrl.org/2003/role/exampleRef
-Topic 852
-SubTopic 10
-Name Accounting Standards Codification
-Section 55
-Paragraph 10
-Publisher FASB
-URI https://asc.fasb.org//1943274/2147481372/852-10-55-10
Reference 2: http://www.xbrl.org/2003/role/exampleRef
-Topic 946
-SubTopic 830
-Name Accounting Standards Codification
-Section 55
-Paragraph 12
-Publisher FASB
-URI https://asc.fasb.org//1943274/2147480167/946-830-55-12
Reference 3: http://www.xbrl.org/2003/role/disclosureRef
-Topic 944
-SubTopic 210
-Name Accounting Standards Codification
-Section S99
-Paragraph 1
-Subparagraph (SX 210.7-03(a)(2))
-Publisher FASB
-URI https://asc.fasb.org//1943274/2147479440/944-210-S99-1
Reference 4: http://www.xbrl.org/2003/role/disclosureRef
-Topic 946
-SubTopic 210
-Name Accounting Standards Codification
-Section S99
-Paragraph 1
-Subparagraph (SX 210.6-04(4))
-Publisher FASB
-URI https://asc.fasb.org//1943274/2147479617/946-210-S99-1
Reference 5: http://www.xbrl.org/2003/role/disclosureRef
-Topic 946
-SubTopic 210
-Name Accounting Standards Codification
-Section 45
-Paragraph 21
-Publisher FASB
-URI https://asc.fasb.org//1943274/2147480555/946-210-45-21
Reference 6: http://www.xbrl.org/2009/role/commonPracticeRef
-Topic 210
-SubTopic 10
-Name Accounting Standards Codification
-Section S99
-Paragraph 1
-Subparagraph (SX 210.5-02(1))
-Publisher FASB
-URI https://asc.fasb.org//1943274/2147480566/210-10-S99-1
Reference 7: http://www.xbrl.org/2003/role/disclosureRef
-Name Accounting Standards Codification
-Section 45
-Paragraph 20
-SubTopic 210
-Topic 946
-Publisher FASB
-URI https://asc.fasb.org//1943274/2147480555/946-210-45-20
| Name: |
us-gaap_Cash |
| Namespace Prefix: |
us-gaap_ |
| Data Type: |
xbrli:monetaryItemType |
| Balance Type: |
debit |
| Period Type: |
instant |
|
| X |
- DefinitionAmount of expense for employee benefit and equity-based compensation.
| Name: |
us-gaap_EmployeeBenefitsAndShareBasedCompensation |
| Namespace Prefix: |
us-gaap_ |
| Data Type: |
xbrli:monetaryItemType |
| Balance Type: |
debit |
| Period Type: |
duration |
|
| X |
- DefinitionThe designation of funds furnished by a borrower to a lender to assure future payments of the borrower's real estate taxes and insurance obligations with respect to a mortgaged property. Escrow deposits may be made for a variety of other purposes such as earnest money and contingent payments. This element excludes replacement reserves which are an escrow separately provided for within the US GAAP taxonomy. Reference 1: http://www.xbrl.org/2003/role/disclosureRef
-Topic 954
-SubTopic 440
-Name Accounting Standards Codification
-Section 50
-Paragraph 1
-Subparagraph (d)
-Publisher FASB
-URI https://asc.fasb.org//1943274/2147480327/954-440-50-1
Reference 2: http://fasb.org/us-gaap/role/ref/legacyRef
-Name Accounting Standards Codification
-Topic 942
-SubTopic 210
-Section S99
-Paragraph 1
-Subparagraph (SX 210.9-03.10)
-Publisher FASB
-URI https://asc.fasb.org//1943274/2147479853/942-210-S99-1
| Name: |
us-gaap_EscrowDeposit |
| Namespace Prefix: |
us-gaap_ |
| Data Type: |
xbrli:monetaryItemType |
| Balance Type: |
debit |
| Period Type: |
instant |
|
| X |
- DefinitionThe increase (decrease) during the reporting period in the obligation created by employee agreements whereby earned compensation will be paid in the future. Reference 1: http://fasb.org/us-gaap/role/ref/legacyRef
-Name Accounting Standards Codification
-Section 45
-Paragraph 28
-Subparagraph (a)
-SubTopic 10
-Topic 230
-Publisher FASB
-URI https://asc.fasb.org//1943274/2147482740/230-10-45-28
| Name: |
us-gaap_IncreaseDecreaseInDeferredCompensation |
| Namespace Prefix: |
us-gaap_ |
| Data Type: |
xbrli:monetaryItemType |
| Balance Type: |
debit |
| Period Type: |
duration |
|
| X |
- DefinitionIncluding the current and noncurrent portions, aggregate carrying amount of all types of notes payable, as of the balance sheet date, with initial maturities beyond one year or beyond the normal operating cycle, if longer. Reference 1: http://fasb.org/us-gaap/role/ref/legacyRef
-Name Accounting Standards Codification
-Section S99
-Paragraph 1
-Subparagraph (SX 210.5-02(22))
-SubTopic 10
-Topic 210
-Publisher FASB
-URI https://asc.fasb.org//1943274/2147480566/210-10-S99-1
Reference 2: http://www.xbrl.org/2009/role/commonPracticeRef
-Topic 944
-SubTopic 210
-Name Accounting Standards Codification
-Section S99
-Paragraph 1
-Subparagraph (SX 210.7-03(a)(16)(a)(2))
-Publisher FASB
-URI https://asc.fasb.org//1943274/2147479440/944-210-S99-1
Reference 3: http://fasb.org/us-gaap/role/ref/legacyRef
-Topic 942
-SubTopic 210
-Name Accounting Standards Codification
-Section S99
-Paragraph 1
-Subparagraph (SX 210.9-03(16))
-Publisher FASB
-URI https://asc.fasb.org//1943274/2147479853/942-210-S99-1
| Name: |
us-gaap_NotesPayable |
| Namespace Prefix: |
us-gaap_ |
| Data Type: |
xbrli:monetaryItemType |
| Balance Type: |
credit |
| Period Type: |
instant |
|
| X |
- DefinitionPayments of cash to employees, including wages and salaries, during the current period. Reference 1: http://www.xbrl.org/2009/role/commonPracticeRef
-Topic 230
-SubTopic 10
-Name Accounting Standards Codification
-Section 45
-Paragraph 17
-Subparagraph (b)
-Publisher FASB
-URI https://asc.fasb.org//1943274/2147482740/230-10-45-17
| Name: |
us-gaap_PaymentsToEmployees |
| Namespace Prefix: |
us-gaap_ |
| Data Type: |
xbrli:monetaryItemType |
| Balance Type: |
credit |
| Period Type: |
duration |
|
| X |
- DefinitionThe cash inflow from a borrowing supported by a written promise to pay an obligation. Reference 1: http://fasb.org/us-gaap/role/ref/legacyRef
-Name Accounting Standards Codification
-Topic 230
-SubTopic 10
-Section 45
-Paragraph 14
-Subparagraph (b)
-Publisher FASB
-URI https://asc.fasb.org//1943274/2147482740/230-10-45-14
| Name: |
us-gaap_ProceedsFromNotesPayable |
| Namespace Prefix: |
us-gaap_ |
| Data Type: |
xbrli:monetaryItemType |
| Balance Type: |
debit |
| Period Type: |
duration |
|
| X |
- DefinitionThe cash outflow for debt initially having maturity due after one year or beyond the normal operating cycle, if longer. Reference 1: http://www.xbrl.org/2003/role/disclosureRef
-Topic 946
-SubTopic 10
-Name Accounting Standards Codification
-Section S99
-Paragraph 3
-Subparagraph (SX 210.6-03(i)(2))
-Publisher FASB
-URI https://asc.fasb.org//1943274/2147479886/946-10-S99-3
Reference 2: http://fasb.org/us-gaap/role/ref/legacyRef
-Name Accounting Standards Codification
-Topic 230
-SubTopic 10
-Section 45
-Paragraph 15
-Subparagraph (b)
-Publisher FASB
-URI https://asc.fasb.org//1943274/2147482740/230-10-45-15
| Name: |
us-gaap_RepaymentsOfLongTermDebt |
| Namespace Prefix: |
us-gaap_ |
| Data Type: |
xbrli:monetaryItemType |
| Balance Type: |
credit |
| Period Type: |
duration |
|
v3.24.1
Leases (Details) - USD ($)
|
12 Months Ended |
Dec. 31, 2023 |
Dec. 31, 2022 |
| Operating lease cost |
$ 5,000
|
|
| Short-term lease cost |
12,000
|
|
| Total |
17,000
|
|
| Corporate Headquarters |
|
|
| Operating lease cost |
1,000
|
|
| Short-term lease cost |
2,000
|
|
| Total |
3,000
|
|
| Other |
|
|
| Operating lease cost |
4,000
|
$ 14,000
|
| Short-term lease cost |
10,000
|
0
|
| Total |
$ 14,000
|
$ 14,000
|
| X |
- DefinitionAmount of lease cost recognized by lessee for lease contract. Reference 1: http://www.xbrl.org/2003/role/exampleRef
-Topic 842
-SubTopic 20
-Name Accounting Standards Codification
-Section 55
-Paragraph 53
-Publisher FASB
-URI https://asc.fasb.org//1943274/2147479589/842-20-55-53
Reference 2: http://www.xbrl.org/2003/role/disclosureRef
-Topic 842
-SubTopic 20
-Name Accounting Standards Codification
-Section 50
-Paragraph 4
-Publisher FASB
-URI https://asc.fasb.org//1943274/2147478964/842-20-50-4
| Name: |
us-gaap_LeaseCost |
| Namespace Prefix: |
us-gaap_ |
| Data Type: |
xbrli:monetaryItemType |
| Balance Type: |
debit |
| Period Type: |
duration |
|
| X |
- DefinitionAmount of single lease cost, calculated by allocation of remaining cost of lease over remaining lease term. Includes, but is not limited to, single lease cost, after impairment of right-of-use asset, calculated by amortization of remaining right-of-use asset and accretion of lease liability. Reference 1: http://www.xbrl.org/2003/role/exampleRef
-Topic 842
-SubTopic 20
-Name Accounting Standards Codification
-Section 55
-Paragraph 53
-Publisher FASB
-URI https://asc.fasb.org//1943274/2147479589/842-20-55-53
Reference 2: http://www.xbrl.org/2003/role/disclosureRef
-Topic 842
-SubTopic 20
-Name Accounting Standards Codification
-Section 50
-Paragraph 4
-Subparagraph (b)
-Publisher FASB
-URI https://asc.fasb.org//1943274/2147478964/842-20-50-4
| Name: |
us-gaap_OperatingLeaseCost |
| Namespace Prefix: |
us-gaap_ |
| Data Type: |
xbrli:monetaryItemType |
| Balance Type: |
debit |
| Period Type: |
duration |
|
| X |
- DefinitionAmount of short-term lease cost, excluding expense for lease with term of one month or less. Reference 1: http://www.xbrl.org/2003/role/exampleRef
-Topic 842
-SubTopic 20
-Name Accounting Standards Codification
-Section 55
-Paragraph 53
-Publisher FASB
-URI https://asc.fasb.org//1943274/2147479589/842-20-55-53
Reference 2: http://www.xbrl.org/2003/role/disclosureRef
-Topic 842
-SubTopic 20
-Name Accounting Standards Codification
-Section 50
-Paragraph 4
-Subparagraph (c)
-Publisher FASB
-URI https://asc.fasb.org//1943274/2147478964/842-20-50-4
| Name: |
us-gaap_ShortTermLeaseCost |
| Namespace Prefix: |
us-gaap_ |
| Data Type: |
xbrli:monetaryItemType |
| Balance Type: |
debit |
| Period Type: |
duration |
|
| X |
- Details
| Name: |
us-gaap_PropertySubjectToOrAvailableForOperatingLeaseAxis=ldwy_CorporateHeadquartersMember |
| Namespace Prefix: |
|
| Data Type: |
na |
| Balance Type: |
|
| Period Type: |
|
|
| X |
- Details
| Name: |
us-gaap_PropertySubjectToOrAvailableForOperatingLeaseAxis=ldwy_OtherMember |
| Namespace Prefix: |
|
| Data Type: |
na |
| Balance Type: |
|
| Period Type: |
|
|
v3.24.1
| X |
- References
+ Details
| Name: |
us-gaap_LeasesAbstract |
| Namespace Prefix: |
us-gaap_ |
| Data Type: |
xbrli:stringItemType |
| Balance Type: |
na |
| Period Type: |
duration |
|
| X |
- DefinitionAmount of lessee's undiscounted obligation for lease payment for operating lease. Reference 1: http://www.xbrl.org/2003/role/disclosureRef
-Topic 842
-SubTopic 20
-Name Accounting Standards Codification
-Section 50
-Paragraph 6
-Publisher FASB
-URI https://asc.fasb.org//1943274/2147478964/842-20-50-6
| Name: |
us-gaap_LesseeOperatingLeaseLiabilityPaymentsDue |
| Namespace Prefix: |
us-gaap_ |
| Data Type: |
xbrli:monetaryItemType |
| Balance Type: |
credit |
| Period Type: |
instant |
|
| X |
- DefinitionAmount of lessee's undiscounted obligation for lease payments for operating lease, due in second rolling twelve months following latest statement of financial position date. For interim and annual periods when interim periods are reported on a rolling approach, from latest statement of financial position date. Reference 1: http://www.xbrl.org/2009/role/commonPracticeRef
-Topic 842
-SubTopic 20
-Name Accounting Standards Codification
-Section 50
-Paragraph 6
-Publisher FASB
-URI https://asc.fasb.org//1943274/2147478964/842-20-50-6
| Name: |
us-gaap_LesseeOperatingLeaseLiabilityPaymentsDueInRollingYearTwo |
| Namespace Prefix: |
us-gaap_ |
| Data Type: |
xbrli:monetaryItemType |
| Balance Type: |
credit |
| Period Type: |
instant |
|
| X |
- DefinitionAmount of lessee's undiscounted obligation for lease payments for operating lease, due in next rolling twelve months following latest statement of financial position date. For interim and annual periods when interim periods are reported on a rolling approach, from latest statement of financial position date. Reference 1: http://www.xbrl.org/2009/role/commonPracticeRef
-Topic 842
-SubTopic 20
-Name Accounting Standards Codification
-Section 50
-Paragraph 6
-Publisher FASB
-URI https://asc.fasb.org//1943274/2147478964/842-20-50-6
| Name: |
us-gaap_LesseeOperatingLeaseLiabilityPaymentsDueNextRollingTwelveMonths |
| Namespace Prefix: |
us-gaap_ |
| Data Type: |
xbrli:monetaryItemType |
| Balance Type: |
credit |
| Period Type: |
instant |
|
| X |
- DefinitionAmount of lessee's undiscounted obligation for lease payments in excess of discounted obligation for lease payments for operating lease. Reference 1: http://www.xbrl.org/2003/role/disclosureRef
-Topic 842
-SubTopic 20
-Name Accounting Standards Codification
-Section 50
-Paragraph 6
-Publisher FASB
-URI https://asc.fasb.org//1943274/2147478964/842-20-50-6
| Name: |
us-gaap_LesseeOperatingLeaseLiabilityUndiscountedExcessAmount |
| Namespace Prefix: |
us-gaap_ |
| Data Type: |
xbrli:monetaryItemType |
| Balance Type: |
credit |
| Period Type: |
instant |
|
| X |
- DefinitionPresent value of lessee's discounted obligation for lease payments from operating lease. Reference 1: http://www.xbrl.org/2003/role/disclosureRef
-Topic 842
-SubTopic 20
-Name Accounting Standards Codification
-Section 45
-Paragraph 1
-Subparagraph (b)
-Publisher FASB
-URI https://asc.fasb.org//1943274/2147479041/842-20-45-1
| Name: |
us-gaap_OperatingLeaseLiability |
| Namespace Prefix: |
us-gaap_ |
| Data Type: |
xbrli:monetaryItemType |
| Balance Type: |
credit |
| Period Type: |
instant |
|
v3.24.1
| X |
- References
+ Details
| Name: |
ldwy_RemainingLeaseTerm |
| Namespace Prefix: |
ldwy_ |
| Data Type: |
xbrli:durationItemType |
| Balance Type: |
na |
| Period Type: |
duration |
|
| X |
- DefinitionAmount of cash outflow from operating lease, excluding payments to bring another asset to condition and location necessary for its intended use. Reference 1: http://www.xbrl.org/2003/role/disclosureRef
-Topic 842
-SubTopic 20
-Name Accounting Standards Codification
-Section 45
-Paragraph 5
-Subparagraph (c)
-Publisher FASB
-URI https://asc.fasb.org//1943274/2147479041/842-20-45-5
Reference 2: http://www.xbrl.org/2003/role/disclosureRef
-Topic 842
-SubTopic 20
-Name Accounting Standards Codification
-Section 50
-Paragraph 4
-Subparagraph (g)(1)
-Publisher FASB
-URI https://asc.fasb.org//1943274/2147478964/842-20-50-4
| Name: |
us-gaap_OperatingLeasePayments |
| Namespace Prefix: |
us-gaap_ |
| Data Type: |
xbrli:monetaryItemType |
| Balance Type: |
credit |
| Period Type: |
duration |
|
| X |
- DefinitionWeighted average discount rate for operating lease calculated at point in time. Reference 1: http://www.xbrl.org/2003/role/exampleRef
-Topic 842
-SubTopic 20
-Name Accounting Standards Codification
-Section 55
-Paragraph 53
-Publisher FASB
-URI https://asc.fasb.org//1943274/2147479589/842-20-55-53
Reference 2: http://www.xbrl.org/2003/role/disclosureRef
-Topic 842
-SubTopic 20
-Name Accounting Standards Codification
-Section 50
-Paragraph 4
-Subparagraph (g)(4)
-Publisher FASB
-URI https://asc.fasb.org//1943274/2147478964/842-20-50-4
| Name: |
us-gaap_OperatingLeaseWeightedAverageDiscountRatePercent |
| Namespace Prefix: |
us-gaap_ |
| Data Type: |
dtr-types:percentItemType |
| Balance Type: |
na |
| Period Type: |
instant |
|
| X |
- DefinitionAmount of cash outflow for variable lease payment excluded from lease liability. Reference 1: http://www.xbrl.org/2003/role/disclosureRef
-Topic 842
-SubTopic 20
-Name Accounting Standards Codification
-Section 45
-Paragraph 5
-Subparagraph (d)
-Publisher FASB
-URI https://asc.fasb.org//1943274/2147479041/842-20-45-5
| Name: |
us-gaap_VariableLeasePayment |
| Namespace Prefix: |
us-gaap_ |
| Data Type: |
xbrli:monetaryItemType |
| Balance Type: |
credit |
| Period Type: |
duration |
|
| X |
- Details
| Name: |
us-gaap_PropertySubjectToOrAvailableForOperatingLeaseAxis=ldwy_CorporateHeadquartersMember |
| Namespace Prefix: |
|
| Data Type: |
na |
| Balance Type: |
|
| Period Type: |
|
|
v3.24.1
| X |
- DefinitionThe estimated dividend rate (a percentage of the share price) to be paid (expected dividends) to holders of the underlying shares over the option's term. Reference 1: http://www.xbrl.org/2003/role/disclosureRef
-Topic 718
-SubTopic 10
-Name Accounting Standards Codification
-Section 50
-Paragraph 2
-Subparagraph (f)(2)(iii)
-Publisher FASB
-URI https://asc.fasb.org//1943274/2147480429/718-10-50-2
| Name: |
us-gaap_ShareBasedCompensationArrangementByShareBasedPaymentAwardFairValueAssumptionsExpectedDividendRate |
| Namespace Prefix: |
us-gaap_ |
| Data Type: |
dtr-types:percentItemType |
| Balance Type: |
na |
| Period Type: |
duration |
|
| X |
- DefinitionThe estimated measure of the percentage by which a share price is expected to fluctuate during a period. Volatility also may be defined as a probability-weighted measure of the dispersion of returns about the mean. The volatility of a share price is the standard deviation of the continuously compounded rates of return on the share over a specified period. That is the same as the standard deviation of the differences in the natural logarithms of the stock prices plus dividends, if any, over the period. Reference 1: http://www.xbrl.org/2003/role/disclosureRef
-Topic 718
-SubTopic 10
-Name Accounting Standards Codification
-Section 50
-Paragraph 2
-Subparagraph (f)(2)(ii)
-Publisher FASB
-URI https://asc.fasb.org//1943274/2147480429/718-10-50-2
| Name: |
us-gaap_ShareBasedCompensationArrangementByShareBasedPaymentAwardFairValueAssumptionsExpectedVolatilityRate |
| Namespace Prefix: |
us-gaap_ |
| Data Type: |
dtr-types:percentItemType |
| Balance Type: |
na |
| Period Type: |
duration |
|
| X |
- DefinitionThe risk-free interest rate assumption that is used in valuing an option on its own shares. Reference 1: http://www.xbrl.org/2003/role/disclosureRef
-Topic 718
-SubTopic 10
-Name Accounting Standards Codification
-Section 50
-Paragraph 2
-Subparagraph (f)(2)(iv)
-Publisher FASB
-URI https://asc.fasb.org//1943274/2147480429/718-10-50-2
| Name: |
us-gaap_ShareBasedCompensationArrangementByShareBasedPaymentAwardFairValueAssumptionsRiskFreeInterestRate |
| Namespace Prefix: |
us-gaap_ |
| Data Type: |
dtr-types:percentItemType |
| Balance Type: |
na |
| Period Type: |
duration |
|
| X |
- DefinitionExpected term of award under share-based payment arrangement, in 'PnYnMnDTnHnMnS' format, for example, 'P1Y5M13D' represents reported fact of one year, five months, and thirteen days. Reference 1: http://www.xbrl.org/2003/role/disclosureRef
-Topic 718
-SubTopic 10
-Name Accounting Standards Codification
-Section 50
-Paragraph 2
-Subparagraph (f)(2)(i)
-Publisher FASB
-URI https://asc.fasb.org//1943274/2147480429/718-10-50-2
| Name: |
us-gaap_SharebasedCompensationArrangementBySharebasedPaymentAwardFairValueAssumptionsExpectedTerm1 |
| Namespace Prefix: |
us-gaap_ |
| Data Type: |
xbrli:durationItemType |
| Balance Type: |
na |
| Period Type: |
duration |
|
| X |
- References
+ Details
| Name: |
us-gaap_StockholdersEquityNoteAbstract |
| Namespace Prefix: |
us-gaap_ |
| Data Type: |
xbrli:stringItemType |
| Balance Type: |
na |
| Period Type: |
duration |
|
v3.24.1
Stockholders Equity (Details 1) - USD ($)
|
12 Months Ended |
Dec. 31, 2023 |
Dec. 31, 2022 |
| Stockholders Equity |
|
|
| Plan shares available for grant, begin |
92,862
|
97,648
|
| Granted |
|
(6,248)
|
| Stock options exercised, plan shares available for grant |
|
0
|
| Cancelled or forfeited |
12,623
|
1,462
|
| Plan shares available for grant, ending |
105,485
|
92,862
|
| Plan options outstanding, begin |
14,086
|
19,122
|
| Granted |
|
0
|
| Stock options exercised, plan options outstanding |
|
(1,300)
|
| Cancelled |
$ (12,623)
|
$ (3,736)
|
| Plan options outstanding, ending |
1,463
|
14,086
|
| Weighted average exercise price per share, begin |
$ 14.17
|
$ 13.23
|
| Stock options exercised, weighted average exercise per share |
|
8.26
|
| Cancelled or forfeited per share |
14.02
|
11.41
|
| Weighted average exercise price per share, ending |
$ 15.54
|
$ 14.17
|
| Stock options exercised, aggregate intrinsic value |
|
$ 2,422
|
| X |
- References
+ Details
| Name: |
ldwy_ShareBasedCompensationArrangementByShareBasedPaymentAwardNumberOfForfeitedSharesAvailableForGrant |
| Namespace Prefix: |
ldwy_ |
| Data Type: |
xbrli:sharesItemType |
| Balance Type: |
na |
| Period Type: |
duration |
|
| X |
- References
+ Details
| Name: |
ldwy_ShareBasedCompensationArrangementByShareBasedPaymentAwardNumberOfGrantedSharesAvailableForGrant |
| Namespace Prefix: |
ldwy_ |
| Data Type: |
xbrli:sharesItemType |
| Balance Type: |
na |
| Period Type: |
duration |
|
| X |
- References
+ Details
| Name: |
ldwy_StockOptionsExercisedPlanOptionsOutstanding |
| Namespace Prefix: |
ldwy_ |
| Data Type: |
xbrli:sharesItemType |
| Balance Type: |
na |
| Period Type: |
duration |
|
| X |
- References
+ Details
| Name: |
ldwy_StockOptionsExercisedPlanSharesAvailableForGrant |
| Namespace Prefix: |
ldwy_ |
| Data Type: |
xbrli:sharesItemType |
| Balance Type: |
na |
| Period Type: |
duration |
|
| X |
- References
+ Details
| Name: |
ldwy_StockOptionsExercisedWeightedAverageExercisePerShare |
| Namespace Prefix: |
ldwy_ |
| Data Type: |
num:perShareItemType |
| Balance Type: |
na |
| Period Type: |
duration |
|
| X |
- DefinitionThe difference between the maximum number of shares (or other type of equity) authorized for issuance under the plan (including the effects of amendments and adjustments), and the sum of: 1) the number of shares (or other type of equity) already issued upon exercise of options or other equity-based awards under the plan; and 2) shares (or other type of equity) reserved for issuance on granting of outstanding awards, net of cancellations and forfeitures, if applicable. Reference 1: http://fasb.org/us-gaap/role/ref/legacyRef
-Name Accounting Standards Codification
-Topic 718
-SubTopic 10
-Section 50
-Paragraph 2
-Publisher FASB
-URI https://asc.fasb.org//1943274/2147480429/718-10-50-2
| Name: |
us-gaap_ShareBasedCompensationArrangementByShareBasedPaymentAwardNumberOfSharesAvailableForGrant |
| Namespace Prefix: |
us-gaap_ |
| Data Type: |
xbrli:sharesItemType |
| Balance Type: |
na |
| Period Type: |
instant |
|
| X |
- DefinitionGross number of share options (or share units) granted during the period. Reference 1: http://www.xbrl.org/2003/role/disclosureRef
-Topic 718
-SubTopic 10
-Name Accounting Standards Codification
-Section 50
-Paragraph 2
-Subparagraph (c)(1)(iv)(01)
-Publisher FASB
-URI https://asc.fasb.org//1943274/2147480429/718-10-50-2
| Name: |
us-gaap_ShareBasedCompensationArrangementByShareBasedPaymentAwardOptionsGrantsInPeriodGross |
| Namespace Prefix: |
us-gaap_ |
| Data Type: |
xbrli:sharesItemType |
| Balance Type: |
na |
| Period Type: |
duration |
|
| X |
- DefinitionNumber of options outstanding, including both vested and non-vested options. Reference 1: http://www.xbrl.org/2003/role/disclosureRef
-Topic 718
-SubTopic 10
-Name Accounting Standards Codification
-Section 50
-Paragraph 2
-Subparagraph (c)(1)(i)
-Publisher FASB
-URI https://asc.fasb.org//1943274/2147480429/718-10-50-2
Reference 2: http://www.xbrl.org/2003/role/disclosureRef
-Topic 718
-SubTopic 10
-Name Accounting Standards Codification
-Section 50
-Paragraph 2
-Subparagraph (c)(1)(ii)
-Publisher FASB
-URI https://asc.fasb.org//1943274/2147480429/718-10-50-2
| Name: |
us-gaap_ShareBasedCompensationArrangementByShareBasedPaymentAwardOptionsOutstandingNumber |
| Namespace Prefix: |
us-gaap_ |
| Data Type: |
xbrli:sharesItemType |
| Balance Type: |
na |
| Period Type: |
instant |
|
| X |
- DefinitionWeighted average price at which grantees can acquire the shares reserved for issuance under the stock option plan. Reference 1: http://www.xbrl.org/2003/role/disclosureRef
-Topic 718
-SubTopic 10
-Name Accounting Standards Codification
-Section 50
-Paragraph 2
-Subparagraph (c)(1)(i)
-Publisher FASB
-URI https://asc.fasb.org//1943274/2147480429/718-10-50-2
Reference 2: http://www.xbrl.org/2003/role/disclosureRef
-Topic 718
-SubTopic 10
-Name Accounting Standards Codification
-Section 50
-Paragraph 2
-Subparagraph (c)(1)(ii)
-Publisher FASB
-URI https://asc.fasb.org//1943274/2147480429/718-10-50-2
| Name: |
us-gaap_ShareBasedCompensationArrangementByShareBasedPaymentAwardOptionsOutstandingWeightedAverageExercisePrice |
| Namespace Prefix: |
us-gaap_ |
| Data Type: |
dtr-types:perShareItemType |
| Balance Type: |
na |
| Period Type: |
instant |
|
| X |
- DefinitionWeighted average price at which grantees could have acquired the underlying shares with respect to stock options that were terminated. Reference 1: http://www.xbrl.org/2003/role/disclosureRef
-Topic 718
-SubTopic 10
-Name Accounting Standards Codification
-Section 50
-Paragraph 2
-Subparagraph (c)(1)(iv)(03)
-Publisher FASB
-URI https://asc.fasb.org//1943274/2147480429/718-10-50-2
| Name: |
us-gaap_ShareBasedCompensationArrangementsByShareBasedPaymentAwardOptionsForfeituresInPeriodWeightedAverageExercisePrice |
| Namespace Prefix: |
us-gaap_ |
| Data Type: |
dtr-types:perShareItemType |
| Balance Type: |
na |
| Period Type: |
duration |
|
| X |
- DefinitionIntrinsic value of vested award under share-based payment arrangement. Excludes share and unit options.
| Name: |
us-gaap_SharebasedCompensationArrangementBySharebasedPaymentAwardEquityInstrumentsOtherThanOptionsAggregateIntrinsicValueVested |
| Namespace Prefix: |
us-gaap_ |
| Data Type: |
xbrli:monetaryItemType |
| Balance Type: |
debit |
| Period Type: |
duration |
|
| X |
- DefinitionFair value of options vested. Excludes equity instruments other than options, for example, but not limited to, share units, stock appreciation rights, restricted stock. Reference 1: http://www.xbrl.org/2003/role/disclosureRef
-Topic 718
-SubTopic 10
-Name Accounting Standards Codification
-Section 50
-Paragraph 2
-Subparagraph (d)(2)
-Publisher FASB
-URI https://asc.fasb.org//1943274/2147480429/718-10-50-2
| Name: |
us-gaap_SharebasedCompensationArrangementBySharebasedPaymentAwardOptionsVestedInPeriodFairValue1 |
| Namespace Prefix: |
us-gaap_ |
| Data Type: |
xbrli:monetaryItemType |
| Balance Type: |
credit |
| Period Type: |
duration |
|
| X |
- References
+ Details
| Name: |
us-gaap_StockholdersEquityNoteAbstract |
| Namespace Prefix: |
us-gaap_ |
| Data Type: |
xbrli:stringItemType |
| Balance Type: |
na |
| Period Type: |
duration |
|
v3.24.1
| X |
- DefinitionThe number of shares reserved for issuance pertaining to the outstanding exercisable stock options as of the balance sheet date in the customized range of exercise prices for which the market and performance vesting condition has been satisfied. Reference 1: http://fasb.org/us-gaap/role/ref/legacyRef
-Name Accounting Standards Codification
-Topic 718
-SubTopic 10
-Section 50
-Paragraph 2
-Subparagraph (c)(iii)
-Publisher FASB
-URI https://asc.fasb.org//1943274/2147480429/718-10-50-2
| Name: |
us-gaap_ShareBasedCompensationSharesAuthorizedUnderStockOptionPlansExercisePriceRangeNumberOfExercisableOptions |
| Namespace Prefix: |
us-gaap_ |
| Data Type: |
xbrli:sharesItemType |
| Balance Type: |
na |
| Period Type: |
instant |
|
| X |
- DefinitionThe number of shares reserved for issuance pertaining to the outstanding stock options as of the balance sheet date for all option plans in the customized range of exercise prices. Reference 1: http://fasb.org/us-gaap/role/ref/legacyRef
-Name Accounting Standards Codification
-Topic 718
-SubTopic 10
-Section 50
-Paragraph 2
-Subparagraph (c)(1)(i)-(ii)
-Publisher FASB
-URI https://asc.fasb.org//1943274/2147480429/718-10-50-2
| Name: |
us-gaap_ShareBasedCompensationSharesAuthorizedUnderStockOptionPlansExercisePriceRangeNumberOfOutstandingOptions |
| Namespace Prefix: |
us-gaap_ |
| Data Type: |
xbrli:sharesItemType |
| Balance Type: |
na |
| Period Type: |
instant |
|
| X |
- DefinitionThe ceiling of a customized range of exercise prices for purposes of disclosing shares potentially issuable under outstanding stock option awards on all stock option plans and other required information pertaining to awards in the customized range. Reference 1: http://fasb.org/us-gaap/role/ref/legacyRef
-Name Accounting Standards Codification
-Topic 718
-SubTopic 10
-Section 50
-Paragraph 2
-Subparagraph (g)
-Publisher FASB
-URI https://asc.fasb.org//1943274/2147480429/718-10-50-2
| Name: |
us-gaap_ShareBasedCompensationSharesAuthorizedUnderStockOptionPlansExercisePriceRangeUpperRangeLimit |
| Namespace Prefix: |
us-gaap_ |
| Data Type: |
dtr-types:perShareItemType |
| Balance Type: |
na |
| Period Type: |
duration |
|
| X |
- DefinitionWeighted average exercise price as of the balance sheet date for those equity-based payment arrangements exercisable and outstanding. Reference 1: http://fasb.org/us-gaap/role/ref/legacyRef
-Name Accounting Standards Codification
-Topic 718
-SubTopic 10
-Section 50
-Paragraph 2
-Subparagraph (c)(1)(iii)
-Publisher FASB
-URI https://asc.fasb.org//1943274/2147480429/718-10-50-2
| Name: |
us-gaap_SharebasedCompensationSharesAuthorizedUnderStockOptionPlansExercisePriceRangeExercisableOptionsWeightedAverageExercisePrice1 |
| Namespace Prefix: |
us-gaap_ |
| Data Type: |
dtr-types:perShareItemType |
| Balance Type: |
na |
| Period Type: |
instant |
|
| X |
- DefinitionThe weighted average price as of the balance sheet date at which grantees could acquire the underlying shares with respect to all outstanding stock options which are in the customized range of exercise prices. Reference 1: http://fasb.org/us-gaap/role/ref/legacyRef
-Name Accounting Standards Codification
-Topic 718
-SubTopic 10
-Section 50
-Paragraph 2
-Subparagraph (c)(1)(i)-(ii)
-Publisher FASB
-URI https://asc.fasb.org//1943274/2147480429/718-10-50-2
| Name: |
us-gaap_SharebasedCompensationSharesAuthorizedUnderStockOptionPlansExercisePriceRangeOutstandingOptionsWeightedAverageExercisePriceBeginningBalance1 |
| Namespace Prefix: |
us-gaap_ |
| Data Type: |
dtr-types:perShareItemType |
| Balance Type: |
na |
| Period Type: |
instant |
|
| X |
- DefinitionWeighted average remaining contractual term of outstanding stock options, in 'PnYnMnDTnHnMnS' format, for example, 'P1Y5M13D' represents the reported fact of one year, five months, and thirteen days. Reference 1: http://fasb.org/us-gaap/role/ref/legacyRef
-Topic 718
-SubTopic 10
-Subparagraph (e)(1)
-Name Accounting Standards Codification
-Paragraph 2
-Section 50
-Publisher FASB
-URI https://asc.fasb.org//1943274/2147480429/718-10-50-2
| Name: |
us-gaap_SharebasedCompensationSharesAuthorizedUnderStockOptionPlansExercisePriceRangeOutstandingOptionsWeightedAverageRemainingContractualTerm2 |
| Namespace Prefix: |
us-gaap_ |
| Data Type: |
xbrli:durationItemType |
| Balance Type: |
na |
| Period Type: |
duration |
|
| X |
- Details
| Name: |
us-gaap_ShareBasedCompensationSharesAuthorizedUnderStockOptionPlansByExercisePriceRangeAxis=ldwy_ExercisePriceRangeOneMember |
| Namespace Prefix: |
|
| Data Type: |
na |
| Balance Type: |
|
| Period Type: |
|
|
v3.24.1
Stockholders Equity (Details 3) - $ / shares
|
12 Months Ended |
Dec. 31, 2023 |
Dec. 31, 2022 |
| Stockholders Equity |
|
|
| Restricted stock and restricted stock units outstanding, beginning |
5,869
|
8,531
|
| Granted |
0
|
6,248
|
| Vested |
(5,869)
|
(8,910)
|
| Restricted stock and restricted stock units outstanding, ending |
0
|
5,869
|
| Weighted average grant date fair value outstanding, beginning |
$ 9.21
|
$ 10.01
|
| Granted |
9.60
|
9.60
|
| Vested |
7.66
|
10.25
|
| Weighted average grant date fair value outstanding, ending |
$ 0.00
|
$ 9.21
|
| X |
- DefinitionThe number of grants made during the period on other than stock (or unit) option plans (for example, phantom stock or unit plan, stock or unit appreciation rights plan, performance target plan). Reference 1: http://www.xbrl.org/2003/role/disclosureRef
-Topic 718
-SubTopic 10
-Name Accounting Standards Codification
-Section 50
-Paragraph 2
-Subparagraph (c)(2)(iii)(01)
-Publisher FASB
-URI https://asc.fasb.org//1943274/2147480429/718-10-50-2
| Name: |
us-gaap_ShareBasedCompensationArrangementByShareBasedPaymentAwardEquityInstrumentsOtherThanOptionsGrantsInPeriod |
| Namespace Prefix: |
us-gaap_ |
| Data Type: |
xbrli:sharesItemType |
| Balance Type: |
na |
| Period Type: |
duration |
|
| X |
- DefinitionThe weighted average fair value at grant date for nonvested equity-based awards issued during the period on other than stock (or unit) option plans (for example, phantom stock or unit plan, stock or unit appreciation rights plan, performance target plan). Reference 1: http://www.xbrl.org/2003/role/disclosureRef
-Topic 718
-SubTopic 10
-Name Accounting Standards Codification
-Section 50
-Paragraph 2
-Subparagraph (c)(2)(iii)(01)
-Publisher FASB
-URI https://asc.fasb.org//1943274/2147480429/718-10-50-2
| Name: |
us-gaap_ShareBasedCompensationArrangementByShareBasedPaymentAwardEquityInstrumentsOtherThanOptionsGrantsInPeriodWeightedAverageGrantDateFairValue |
| Namespace Prefix: |
us-gaap_ |
| Data Type: |
dtr-types:perShareItemType |
| Balance Type: |
na |
| Period Type: |
duration |
|
| X |
- DefinitionThe number of non-vested equity-based payment instruments, excluding stock (or unit) options, that validly exist and are outstanding as of the balance sheet date. Reference 1: http://www.xbrl.org/2003/role/disclosureRef
-Topic 718
-SubTopic 10
-Name Accounting Standards Codification
-Section 50
-Paragraph 2
-Subparagraph (c)(2)(i)
-Publisher FASB
-URI https://asc.fasb.org//1943274/2147480429/718-10-50-2
Reference 2: http://www.xbrl.org/2003/role/disclosureRef
-Topic 718
-SubTopic 10
-Name Accounting Standards Codification
-Section 50
-Paragraph 2
-Subparagraph (c)(2)(ii)
-Publisher FASB
-URI https://asc.fasb.org//1943274/2147480429/718-10-50-2
| Name: |
us-gaap_ShareBasedCompensationArrangementByShareBasedPaymentAwardEquityInstrumentsOtherThanOptionsNonvestedNumber |
| Namespace Prefix: |
us-gaap_ |
| Data Type: |
xbrli:sharesItemType |
| Balance Type: |
na |
| Period Type: |
instant |
|
| X |
- DefinitionPer share or unit weighted-average fair value of nonvested award under share-based payment arrangement. Excludes share and unit options. Reference 1: http://www.xbrl.org/2003/role/disclosureRef
-Topic 718
-SubTopic 10
-Name Accounting Standards Codification
-Section 50
-Paragraph 2
-Subparagraph (c)(2)(i)
-Publisher FASB
-URI https://asc.fasb.org//1943274/2147480429/718-10-50-2
Reference 2: http://www.xbrl.org/2003/role/disclosureRef
-Topic 718
-SubTopic 10
-Name Accounting Standards Codification
-Section 50
-Paragraph 2
-Subparagraph (c)(2)(ii)
-Publisher FASB
-URI https://asc.fasb.org//1943274/2147480429/718-10-50-2
| Name: |
us-gaap_ShareBasedCompensationArrangementByShareBasedPaymentAwardEquityInstrumentsOtherThanOptionsNonvestedWeightedAverageGrantDateFairValue |
| Namespace Prefix: |
us-gaap_ |
| Data Type: |
dtr-types:perShareItemType |
| Balance Type: |
na |
| Period Type: |
instant |
|
| X |
- DefinitionThe number of equity-based payment instruments, excluding stock (or unit) options, that vested during the reporting period. Reference 1: http://www.xbrl.org/2003/role/disclosureRef
-Topic 718
-SubTopic 10
-Name Accounting Standards Codification
-Section 50
-Paragraph 2
-Subparagraph (c)(2)(iii)(02)
-Publisher FASB
-URI https://asc.fasb.org//1943274/2147480429/718-10-50-2
| Name: |
us-gaap_ShareBasedCompensationArrangementByShareBasedPaymentAwardEquityInstrumentsOtherThanOptionsVestedInPeriod |
| Namespace Prefix: |
us-gaap_ |
| Data Type: |
xbrli:sharesItemType |
| Balance Type: |
na |
| Period Type: |
duration |
|
| X |
- DefinitionThe weighted average fair value as of grant date pertaining to an equity-based award plan other than a stock (or unit) option plan for which the grantee gained the right during the reporting period, by satisfying service and performance requirements, to receive or retain shares or units, other instruments, or cash in accordance with the terms of the arrangement. Reference 1: http://www.xbrl.org/2003/role/disclosureRef
-Topic 718
-SubTopic 10
-Name Accounting Standards Codification
-Section 50
-Paragraph 2
-Subparagraph (c)(2)(iii)(02)
-Publisher FASB
-URI https://asc.fasb.org//1943274/2147480429/718-10-50-2
| Name: |
us-gaap_ShareBasedCompensationArrangementByShareBasedPaymentAwardEquityInstrumentsOtherThanOptionsVestedInPeriodWeightedAverageGrantDateFairValue |
| Namespace Prefix: |
us-gaap_ |
| Data Type: |
dtr-types:perShareItemType |
| Balance Type: |
na |
| Period Type: |
duration |
|
| X |
- References
+ Details
| Name: |
us-gaap_StockholdersEquityNoteAbstract |
| Namespace Prefix: |
us-gaap_ |
| Data Type: |
xbrli:stringItemType |
| Balance Type: |
na |
| Period Type: |
duration |
|
v3.24.1
Stockholders Equity (Details Narrative) - USD ($)
|
1 Months Ended |
12 Months Ended |
Aug. 31, 2022 |
Dec. 31, 2023 |
Dec. 31, 2022 |
| Aggregate intrinsic value of options outstanding |
|
$ 0
|
|
| Weighted average remaining life of options exercisable |
|
4 years 5 months 8 days
|
|
| Aggregate intrinsic value of options exercisable |
|
$ 0
|
|
| Stock-based compensation expense |
|
39,000
|
$ 91,000
|
| Stock based compensation for discontinued operations |
|
$ 5,000
|
$ 32,000
|
| Employee Stock [Member] |
|
|
|
| Employees purchased shares |
|
338
|
1,153
|
| Shares are reserved for future employee purchases |
|
22,945
|
|
| Stock-based compensation expense |
|
$ 7,000
|
$ 32,000
|
| Restricted Stock and Restricted Stock Units |
|
|
|
| Unrecognized compensation costs related to restricted stock units |
|
$ 0
|
|
| Restricted stock received by non employee members,Total grant value |
$ 60,000
|
|
|
| Restricted stock received by non employee members,Numbers |
6,248
|
|
|
| Restricted stock received by non employee members,per share value |
$ 9.60
|
|
|
| X |
- References
+ Details
| Name: |
ldwy_RestrictedStockReceivedByNonEmployeeMembersNumbers |
| Namespace Prefix: |
ldwy_ |
| Data Type: |
xbrli:sharesItemType |
| Balance Type: |
na |
| Period Type: |
duration |
|
| X |
- References
+ Details
| Name: |
ldwy_RestrictedStockReceivedByNonEmployeeMembersPerShareValue |
| Namespace Prefix: |
ldwy_ |
| Data Type: |
num:perShareItemType |
| Balance Type: |
na |
| Period Type: |
duration |
|
| X |
- References
+ Details
| Name: |
ldwy_RestrictedStockReceivedByNonEmployeeMembersTotalGrantValue |
| Namespace Prefix: |
ldwy_ |
| Data Type: |
xbrli:monetaryItemType |
| Balance Type: |
credit |
| Period Type: |
duration |
|
| X |
- References
+ Details
| Name: |
ldwy_StockBasedCompensationForDiscontinuedOperations |
| Namespace Prefix: |
ldwy_ |
| Data Type: |
xbrli:monetaryItemType |
| Balance Type: |
debit |
| Period Type: |
duration |
|
| X |
- DefinitionAmount of expense for award under share-based payment arrangement. Excludes amount capitalized. Reference 1: http://www.xbrl.org/2003/role/disclosureRef
-Topic 718
-SubTopic 10
-Name Accounting Standards Codification
-Section S99
-Paragraph 1
-Subparagraph (SAB Topic 14.F)
-Publisher FASB
-URI https://asc.fasb.org//1943274/2147479830/718-10-S99-1
Reference 2: http://www.xbrl.org/2003/role/disclosureRef
-Topic 718
-SubTopic 10
-Name Accounting Standards Codification
-Section 50
-Paragraph 2
-Subparagraph (h)(1)(i)
-Publisher FASB
-URI https://asc.fasb.org//1943274/2147480429/718-10-50-2
| Name: |
us-gaap_AllocatedShareBasedCompensationExpense |
| Namespace Prefix: |
us-gaap_ |
| Data Type: |
xbrli:monetaryItemType |
| Balance Type: |
debit |
| Period Type: |
duration |
|
| X |
- DefinitionAggregate number of common shares reserved for future issuance. Reference 1: http://fasb.org/us-gaap/role/ref/legacyRef
-Name Accounting Standards Codification
-Topic 210
-SubTopic 10
-Section S99
-Paragraph 1
-Subparagraph (SX 210.5-02.29)
-Publisher FASB
-URI https://asc.fasb.org//1943274/2147480566/210-10-S99-1
| Name: |
us-gaap_CommonStockCapitalSharesReservedForFutureIssuance |
| Namespace Prefix: |
us-gaap_ |
| Data Type: |
xbrli:sharesItemType |
| Balance Type: |
na |
| Period Type: |
instant |
|
| X |
- DefinitionAmount of cost to be recognized for nonvested award under share-based payment arrangement. Excludes share and unit options. Reference 1: http://www.xbrl.org/2009/role/commonPracticeRef
-Topic 718
-SubTopic 10
-Name Accounting Standards Codification
-Section 50
-Paragraph 2
-Subparagraph (i)
-Publisher FASB
-URI https://asc.fasb.org//1943274/2147480429/718-10-50-2
| Name: |
us-gaap_EmployeeServiceShareBasedCompensationNonvestedAwardsTotalCompensationCostNotYetRecognizedShareBasedAwardsOtherThanOptions |
| Namespace Prefix: |
us-gaap_ |
| Data Type: |
xbrli:monetaryItemType |
| Balance Type: |
debit |
| Period Type: |
instant |
|
| X |
- DefinitionAmount by which the current fair value of the underlying stock exceeds the exercise price of options outstanding. Reference 1: http://fasb.org/us-gaap/role/ref/legacyRef
-Name Accounting Standards Codification
-Topic 718
-SubTopic 10
-Section 50
-Paragraph 2
-Publisher FASB
-URI https://asc.fasb.org//1943274/2147480429/718-10-50-2
| Name: |
us-gaap_ShareBasedCompensationArrangementByShareBasedPaymentAwardOptionsOutstandingIntrinsicValue |
| Namespace Prefix: |
us-gaap_ |
| Data Type: |
xbrli:monetaryItemType |
| Balance Type: |
debit |
| Period Type: |
instant |
|
| X |
- DefinitionNumber of shares purchased for issuance under share-based payment arrangement. Reference 1: http://www.xbrl.org/2009/role/commonPracticeRef
-Topic 718
-SubTopic 10
-Name Accounting Standards Codification
-Section 50
-Paragraph 2
-Subparagraph (l)
-Publisher FASB
-URI https://asc.fasb.org//1943274/2147480429/718-10-50-2
| Name: |
us-gaap_ShareBasedCompensationArrangementByShareBasedPaymentAwardSharesPurchasedForAward |
| Namespace Prefix: |
us-gaap_ |
| Data Type: |
xbrli:sharesItemType |
| Balance Type: |
na |
| Period Type: |
duration |
|
| X |
- DefinitionAmount of difference between fair value of the underlying shares reserved for issuance and exercise price of vested portions of options outstanding and currently exercisable. Reference 1: http://fasb.org/us-gaap/role/ref/legacyRef
-Name Accounting Standards Codification
-Topic 718
-SubTopic 10
-Section 50
-Paragraph 2
-Publisher FASB
-URI https://asc.fasb.org//1943274/2147480429/718-10-50-2
| Name: |
us-gaap_SharebasedCompensationArrangementBySharebasedPaymentAwardOptionsExercisableIntrinsicValue1 |
| Namespace Prefix: |
us-gaap_ |
| Data Type: |
xbrli:monetaryItemType |
| Balance Type: |
debit |
| Period Type: |
instant |
|
| X |
- DefinitionWeighted average remaining contractual term for vested portions of options outstanding and currently exercisable or convertible, in 'PnYnMnDTnHnMnS' format, for example, 'P1Y5M13D' represents the reported fact of one year, five months, and thirteen days. Reference 1: http://fasb.org/us-gaap/role/ref/legacyRef
-Name Accounting Standards Codification
-Topic 718
-SubTopic 10
-Section 50
-Paragraph 2
-Publisher FASB
-URI https://asc.fasb.org//1943274/2147480429/718-10-50-2
| Name: |
us-gaap_SharebasedCompensationArrangementBySharebasedPaymentAwardOptionsExercisableWeightedAverageRemainingContractualTerm1 |
| Namespace Prefix: |
us-gaap_ |
| Data Type: |
xbrli:durationItemType |
| Balance Type: |
na |
| Period Type: |
duration |
|
| X |
- Details
| Name: |
us-gaap_SubsidiarySaleOfStockAxis=us-gaap_EmployeeStockMember |
| Namespace Prefix: |
|
| Data Type: |
na |
| Balance Type: |
|
| Period Type: |
|
|
| X |
- Details
| Name: |
us-gaap_AwardTypeAxis=us-gaap_RestrictedStockUnitsRSUMember |
| Namespace Prefix: |
|
| Data Type: |
na |
| Balance Type: |
|
| Period Type: |
|
|
v3.24.1
| X |
- DefinitionAmount of current federal tax expense (benefit) attributable to income (loss) from continuing operations. Includes, but is not limited to, current national tax expense (benefit) for non-US (United States of America) jurisdiction. Reference 1: http://www.xbrl.org/2009/role/commonPracticeRef
-Topic 235
-SubTopic 10
-Name Accounting Standards Codification
-Section S99
-Paragraph 1
-Subparagraph (SX 210.4-08(h)(1)(Note 1))
-Publisher FASB
-URI https://asc.fasb.org//1943274/2147480678/235-10-S99-1
Reference 2: http://www.xbrl.org/2009/role/commonPracticeRef
-Name Accounting Standards Codification
-Section 50
-Paragraph 9
-Subparagraph (a)
-SubTopic 10
-Topic 740
-Publisher FASB
-URI https://asc.fasb.org//1943274/2147482685/740-10-50-9
Reference 3: http://www.xbrl.org/2009/role/commonPracticeRef
-Topic 740
-SubTopic 10
-Name Accounting Standards Codification
-Section S99
-Paragraph 1
-Subparagraph (SAB Topic 6.I.7)
-Publisher FASB
-URI https://asc.fasb.org//1943274/2147479360/740-10-S99-1
| Name: |
us-gaap_CurrentFederalTaxExpenseBenefit |
| Namespace Prefix: |
us-gaap_ |
| Data Type: |
xbrli:monetaryItemType |
| Balance Type: |
debit |
| Period Type: |
duration |
|
| X |
- DefinitionAmount of current state and local tax expense (benefit) attributable to income (loss) from continuing operations. Includes, but is not limited to, current regional, territorial, and provincial tax expense (benefit) for non-US (United States of America) jurisdiction. Reference 1: http://www.xbrl.org/2009/role/commonPracticeRef
-Topic 235
-SubTopic 10
-Name Accounting Standards Codification
-Section S99
-Paragraph 1
-Subparagraph (SX 210.4-08(h)(1)(Note 1))
-Publisher FASB
-URI https://asc.fasb.org//1943274/2147480678/235-10-S99-1
Reference 2: http://www.xbrl.org/2009/role/commonPracticeRef
-Name Accounting Standards Codification
-Section 50
-Paragraph 9
-Subparagraph (a)
-SubTopic 10
-Topic 740
-Publisher FASB
-URI https://asc.fasb.org//1943274/2147482685/740-10-50-9
Reference 3: http://www.xbrl.org/2009/role/commonPracticeRef
-Topic 740
-SubTopic 10
-Name Accounting Standards Codification
-Section S99
-Paragraph 1
-Subparagraph (SAB Topic 6.I.7)
-Publisher FASB
-URI https://asc.fasb.org//1943274/2147479360/740-10-S99-1
| Name: |
us-gaap_CurrentStateAndLocalTaxExpenseBenefit |
| Namespace Prefix: |
us-gaap_ |
| Data Type: |
xbrli:monetaryItemType |
| Balance Type: |
debit |
| Period Type: |
duration |
|
v3.24.1
v3.24.1
Income Taxes (Details 2) - USD ($)
|
Dec. 31, 2023 |
Dec. 31, 2022 |
| Deferred Tax Assets: |
|
|
| Accrued expenses |
$ 117,000
|
$ 231,000
|
| Inventory reserve |
0
|
23,000
|
| Stock-based awards |
9,000
|
24,000
|
| Reserve for bad debts |
2,000
|
26,000
|
| Net operating loss and credit carryforwards |
529,000
|
824,000
|
| Other |
2,000
|
23,000
|
| Depreciation |
0
|
43,000
|
| Valuation allowance |
(645,000)
|
(1,175,000)
|
| Total deferred tax assets |
14,000
|
19,000
|
| Deferred Tax Liabilities: |
|
|
| Depreciation |
(5,000)
|
0
|
| Prepaid expenses |
(9,000)
|
(19,000)
|
| Total deferred tax liabilities |
(14,000)
|
(19,000)
|
| Net deferred income tax liabilities |
$ 0
|
$ 0
|
| X |
- References
+ Details
| Name: |
ldwy_DeferredTaxAssetsNetCurrentClassificationsAbstract |
| Namespace Prefix: |
ldwy_ |
| Data Type: |
xbrli:stringItemType |
| Balance Type: |
na |
| Period Type: |
duration |
|
| X |
- References
+ Details
| Name: |
ldwy_DeferredTaxLiabilitiesClassificationsAbstract |
| Namespace Prefix: |
ldwy_ |
| Data Type: |
xbrli:stringItemType |
| Balance Type: |
na |
| Period Type: |
duration |
|
| X |
- DefinitionAmount before allocation of valuation allowances of deferred tax asset attributable to deductible temporary differences and carryforwards. Reference 1: http://www.xbrl.org/2003/role/disclosureRef
-Topic 740
-SubTopic 10
-Name Accounting Standards Codification
-Section 50
-Paragraph 2
-Subparagraph (b)
-Publisher FASB
-URI https://asc.fasb.org//1943274/2147482685/740-10-50-2
| Name: |
us-gaap_DeferredTaxAssetsGross |
| Namespace Prefix: |
us-gaap_ |
| Data Type: |
xbrli:monetaryItemType |
| Balance Type: |
debit |
| Period Type: |
instant |
|
| X |
- DefinitionAmount before allocation of valuation allowances of deferred tax asset attributable to deductible temporary differences from inventory. Reference 1: http://www.xbrl.org/2009/role/commonPracticeRef
-Topic 740
-SubTopic 10
-Name Accounting Standards Codification
-Section 50
-Paragraph 6
-Publisher FASB
-URI https://asc.fasb.org//1943274/2147482685/740-10-50-6
Reference 2: http://fasb.org/us-gaap/role/ref/legacyRef
-Name Accounting Standards Codification
-Topic 740
-SubTopic 10
-Section 50
-Paragraph 8
-Publisher FASB
-URI https://asc.fasb.org//1943274/2147482685/740-10-50-8
| Name: |
us-gaap_DeferredTaxAssetsInventory |
| Namespace Prefix: |
us-gaap_ |
| Data Type: |
xbrli:monetaryItemType |
| Balance Type: |
debit |
| Period Type: |
instant |
|
| X |
- DefinitionAmount before allocation of valuation allowances of deferred tax asset attributable to deductible operating loss carryforwards. Reference 1: http://www.xbrl.org/2009/role/commonPracticeRef
-Topic 740
-SubTopic 10
-Name Accounting Standards Codification
-Section 50
-Paragraph 6
-Publisher FASB
-URI https://asc.fasb.org//1943274/2147482685/740-10-50-6
Reference 2: http://fasb.org/us-gaap/role/ref/legacyRef
-Name Accounting Standards Codification
-Topic 740
-SubTopic 10
-Section 50
-Paragraph 8
-Publisher FASB
-URI https://asc.fasb.org//1943274/2147482685/740-10-50-8
| Name: |
us-gaap_DeferredTaxAssetsOperatingLossCarryforwards |
| Namespace Prefix: |
us-gaap_ |
| Data Type: |
xbrli:monetaryItemType |
| Balance Type: |
debit |
| Period Type: |
instant |
|
| X |
- DefinitionAmount, before allocation of valuation allowance, of deferred tax asset attributable to deductible temporary differences, classified as other. Reference 1: http://www.xbrl.org/2009/role/commonPracticeRef
-Topic 740
-SubTopic 10
-Name Accounting Standards Codification
-Section 50
-Paragraph 6
-Publisher FASB
-URI https://asc.fasb.org//1943274/2147482685/740-10-50-6
Reference 2: http://fasb.org/us-gaap/role/ref/legacyRef
-Name Accounting Standards Codification
-Topic 740
-SubTopic 10
-Section 50
-Paragraph 8
-Publisher FASB
-URI https://asc.fasb.org//1943274/2147482685/740-10-50-8
| Name: |
us-gaap_DeferredTaxAssetsOther |
| Namespace Prefix: |
us-gaap_ |
| Data Type: |
xbrli:monetaryItemType |
| Balance Type: |
debit |
| Period Type: |
instant |
|
| X |
- DefinitionAmount before allocation of valuation allowances of deferred tax asset attributable to deductible temporary differences from property, plant, and equipment.
| Name: |
us-gaap_DeferredTaxAssetsPropertyPlantAndEquipment |
| Namespace Prefix: |
us-gaap_ |
| Data Type: |
xbrli:monetaryItemType |
| Balance Type: |
debit |
| Period Type: |
instant |
|
| X |
- DefinitionAmount before allocation of valuation allowances of deferred tax asset attributable to deductible temporary differences from share-based compensation. Reference 1: http://www.xbrl.org/2009/role/commonPracticeRef
-Topic 740
-SubTopic 10
-Name Accounting Standards Codification
-Section 50
-Paragraph 6
-Publisher FASB
-URI https://asc.fasb.org//1943274/2147482685/740-10-50-6
Reference 2: http://fasb.org/us-gaap/role/ref/legacyRef
-Name Accounting Standards Codification
-Topic 740
-SubTopic 10
-Section 50
-Paragraph 8
-Publisher FASB
-URI https://asc.fasb.org//1943274/2147482685/740-10-50-8
| Name: |
us-gaap_DeferredTaxAssetsTaxDeferredExpenseCompensationAndBenefitsShareBasedCompensationCost |
| Namespace Prefix: |
us-gaap_ |
| Data Type: |
xbrli:monetaryItemType |
| Balance Type: |
debit |
| Period Type: |
instant |
|
| X |
- DefinitionAmount before allocation of valuation allowances of deferred tax asset attributable to deductible temporary differences from accrued liabilities. Reference 1: http://www.xbrl.org/2009/role/commonPracticeRef
-Topic 740
-SubTopic 10
-Name Accounting Standards Codification
-Section 50
-Paragraph 6
-Publisher FASB
-URI https://asc.fasb.org//1943274/2147482685/740-10-50-6
Reference 2: http://fasb.org/us-gaap/role/ref/legacyRef
-Name Accounting Standards Codification
-Topic 740
-SubTopic 10
-Section 50
-Paragraph 8
-Publisher FASB
-URI https://asc.fasb.org//1943274/2147482685/740-10-50-8
| Name: |
us-gaap_DeferredTaxAssetsTaxDeferredExpenseReservesAndAccrualsAccruedLiabilities |
| Namespace Prefix: |
us-gaap_ |
| Data Type: |
xbrli:monetaryItemType |
| Balance Type: |
debit |
| Period Type: |
instant |
|
| X |
- DefinitionAmount, before allocation of valuation allowance, of deferred tax asset attributable to deductible temporary difference from allowance for credit loss on accounts receivable. Reference 1: http://www.xbrl.org/2009/role/commonPracticeRef
-Topic 740
-SubTopic 10
-Name Accounting Standards Codification
-Section 50
-Paragraph 6
-Publisher FASB
-URI https://asc.fasb.org//1943274/2147482685/740-10-50-6
Reference 2: http://fasb.org/us-gaap/role/ref/legacyRef
-Name Accounting Standards Codification
-Topic 740
-SubTopic 10
-Section 50
-Paragraph 8
-Publisher FASB
-URI https://asc.fasb.org//1943274/2147482685/740-10-50-8
| Name: |
us-gaap_DeferredTaxAssetsTaxDeferredExpenseReservesAndAccrualsAllowanceForDoubtfulAccounts |
| Namespace Prefix: |
us-gaap_ |
| Data Type: |
xbrli:monetaryItemType |
| Balance Type: |
debit |
| Period Type: |
instant |
|
| X |
- DefinitionAmount of deferred tax assets for which it is more likely than not that a tax benefit will not be realized. Reference 1: http://www.xbrl.org/2003/role/disclosureRef
-Topic 740
-SubTopic 10
-Name Accounting Standards Codification
-Section 50
-Paragraph 2
-Subparagraph (c)
-Publisher FASB
-URI https://asc.fasb.org//1943274/2147482685/740-10-50-2
| Name: |
us-gaap_DeferredTaxAssetsValuationAllowance |
| Namespace Prefix: |
us-gaap_ |
| Data Type: |
xbrli:monetaryItemType |
| Balance Type: |
credit |
| Period Type: |
instant |
|
| X |
- DefinitionAmount, after deferred tax asset, of deferred tax liability attributable to taxable differences without jurisdictional netting. Reference 1: http://www.xbrl.org/2009/role/commonPracticeRef
-Topic 740
-SubTopic 10
-Name Accounting Standards Codification
-Section 50
-Paragraph 2
-Publisher FASB
-URI https://asc.fasb.org//1943274/2147482685/740-10-50-2
Reference 2: http://fasb.org/us-gaap/role/ref/legacyRef
-Name Accounting Standards Codification
-Topic 740
-SubTopic 10
-Section 45
-Paragraph 6
-Publisher FASB
-URI https://asc.fasb.org//1943274/2147482525/740-10-45-6
| Name: |
us-gaap_DeferredTaxLiabilities |
| Namespace Prefix: |
us-gaap_ |
| Data Type: |
xbrli:monetaryItemType |
| Balance Type: |
credit |
| Period Type: |
instant |
|
| X |
- DefinitionAmount of deferred tax consequences attributable to taxable temporary differences derived from prepaid expenses.
| Name: |
us-gaap_DeferredTaxLiabilitiesPrepaidExpenses |
| Namespace Prefix: |
us-gaap_ |
| Data Type: |
xbrli:monetaryItemType |
| Balance Type: |
credit |
| Period Type: |
instant |
|
v3.24.1
Income Taxes (Details 3) - USD ($)
|
12 Months Ended |
Dec. 31, 2023 |
Dec. 31, 2022 |
| Income Taxes |
|
|
| Liability for uncertain tax positions, beginning |
$ 53,000
|
$ 711,000
|
| Decrease due to state tax expense |
(16,000)
|
(678,000)
|
| Increases due to interest and state tax |
5,000
|
20,000
|
| Liability for uncertain tax positions, ending |
$ 42,000
|
$ 53,000
|
| X |
- DefinitionAmount recognized for uncertainty in income taxes classified as noncurrent. Reference 1: http://fasb.org/us-gaap/role/ref/legacyRef
-Name Accounting Standards Codification
-Topic 210
-SubTopic 10
-Section S99
-Paragraph 1
-Subparagraph (SX 210.5-02.24)
-Publisher FASB
-URI https://asc.fasb.org//1943274/2147480566/210-10-S99-1
| Name: |
us-gaap_LiabilityForUncertainTaxPositionsNoncurrent |
| Namespace Prefix: |
us-gaap_ |
| Data Type: |
xbrli:monetaryItemType |
| Balance Type: |
credit |
| Period Type: |
instant |
|
v3.24.1
Income Taxes (Details Narrative) - USD ($)
|
12 Months Ended |
|
|
Dec. 31, 2023 |
Dec. 31, 2022 |
Dec. 31, 2021 |
Dec. 31, 2020 |
| Unrecognized tax benefits |
$ 16,000
|
|
|
|
| Change in the valuation allowance |
530,000
|
$ 1,970,000
|
|
|
| Liability for uncertain tax positions |
$ 42,000
|
$ 53,000
|
$ 711,000
|
$ 677,000
|
| Estimated taxable income |
80.00%
|
|
|
|
| Federal corporate income tax rate |
21.00%
|
21.00%
|
|
|
| State And Local Jurisdiction [Member] |
|
|
|
|
| Net operating loss to carry forward |
$ 2,914,000
|
|
|
|
| Domestic Country [Member] |
|
|
|
|
| Net operating loss to carry forward |
$ 1,607,000
|
|
|
|
| X |
- DefinitionAmount recognized for uncertainty in income taxes classified as noncurrent. Reference 1: http://fasb.org/us-gaap/role/ref/legacyRef
-Name Accounting Standards Codification
-Topic 210
-SubTopic 10
-Section S99
-Paragraph 1
-Subparagraph (SX 210.5-02.24)
-Publisher FASB
-URI https://asc.fasb.org//1943274/2147480566/210-10-S99-1
| Name: |
us-gaap_LiabilityForUncertainTaxPositionsNoncurrent |
| Namespace Prefix: |
us-gaap_ |
| Data Type: |
xbrli:monetaryItemType |
| Balance Type: |
credit |
| Period Type: |
instant |
|
| X |
- DefinitionAmount of operating loss carryforward, before tax effects, available to reduce future taxable income under enacted tax laws. Reference 1: http://fasb.org/us-gaap/role/ref/legacyRef
-Name Accounting Standards Codification
-Topic 740
-SubTopic 10
-Section 50
-Paragraph 3
-Subparagraph (a)
-Publisher FASB
-URI https://asc.fasb.org//1943274/2147482685/740-10-50-3
| Name: |
us-gaap_OperatingLossCarryforwards |
| Namespace Prefix: |
us-gaap_ |
| Data Type: |
xbrli:monetaryItemType |
| Balance Type: |
debit |
| Period Type: |
instant |
|
| X |
- DefinitionAmount of decrease in unrecognized tax benefits resulting from tax positions taken in prior period tax returns. Reference 1: http://www.xbrl.org/2003/role/disclosureRef
-Topic 740
-SubTopic 10
-Name Accounting Standards Codification
-Section 50
-Paragraph 15A
-Subparagraph (a)(1)
-Publisher FASB
-URI https://asc.fasb.org//1943274/2147482685/740-10-50-15A
| Name: |
us-gaap_UnrecognizedTaxBenefitsDecreasesResultingFromPriorPeriodTaxPositions |
| Namespace Prefix: |
us-gaap_ |
| Data Type: |
xbrli:monetaryItemType |
| Balance Type: |
debit |
| Period Type: |
duration |
|
v3.24.1
| X |
- References
+ Details
| Name: |
us-gaap_CompensationAndRetirementDisclosureAbstract |
| Namespace Prefix: |
us-gaap_ |
| Data Type: |
xbrli:stringItemType |
| Balance Type: |
na |
| Period Type: |
duration |
|
| X |
- DefinitionAmount of discretionary contributions made by an employer to a defined contribution plan.
| Name: |
us-gaap_DefinedContributionPlanEmployerDiscretionaryContributionAmount |
| Namespace Prefix: |
us-gaap_ |
| Data Type: |
xbrli:monetaryItemType |
| Balance Type: |
debit |
| Period Type: |
duration |
|
| X |
- DefinitionMaximum percentage of employee gross pay the employee may contribute to a defined contribution plan.
| Name: |
us-gaap_DefinedContributionPlanMaximumAnnualContributionsPerEmployeePercent |
| Namespace Prefix: |
us-gaap_ |
| Data Type: |
dtr-types:percentItemType |
| Balance Type: |
na |
| Period Type: |
duration |
|
v3.24.1
| X |
- DefinitionThe number of shares authorized to be repurchased by an entity's Board of Directors under a stock repurchase plan.
| Name: |
us-gaap_StockRepurchaseProgramNumberOfSharesAuthorizedToBeRepurchased |
| Namespace Prefix: |
us-gaap_ |
| Data Type: |
xbrli:sharesItemType |
| Balance Type: |
na |
| Period Type: |
instant |
|
| X |
- DefinitionNumber of shares that have been repurchased during the period and have not been retired and are not held in treasury. Some state laws may govern the circumstances under which an entity may acquire its own stock and prescribe the accounting treatment therefore. This element is used when state law does not recognize treasury stock. Reference 1: http://fasb.org/us-gaap/role/ref/legacyRef
-Name Accounting Standards Codification
-Section 50
-Paragraph 2
-SubTopic 10
-Topic 505
-Publisher FASB
-URI https://asc.fasb.org//1943274/2147481112/505-10-50-2
Reference 2: http://www.xbrl.org/2003/role/disclosureRef
-Topic 946
-SubTopic 505
-Name Accounting Standards Codification
-Section 50
-Paragraph 2
-Subparagraph (c)
-Publisher FASB
-URI https://asc.fasb.org//1943274/2147481004/946-505-50-2
Reference 3: http://www.xbrl.org/2003/role/disclosureRef
-Topic 946
-SubTopic 220
-Name Accounting Standards Codification
-Section S99
-Paragraph 3
-Subparagraph (SX 210.6-09(4)(b))
-Publisher FASB
-URI https://asc.fasb.org//1943274/2147483575/946-220-S99-3
Reference 4: http://www.xbrl.org/2003/role/disclosureRef
-Topic 946
-SubTopic 10
-Name Accounting Standards Codification
-Section S99
-Paragraph 3
-Subparagraph (SX 210.6-03(i)(2))
-Publisher FASB
-URI https://asc.fasb.org//1943274/2147479886/946-10-S99-3
Reference 5: http://fasb.org/us-gaap/role/ref/legacyRef
-Topic 210
-SubTopic 10
-Name Accounting Standards Codification
-Section S99
-Paragraph 1
-Subparagraph (SX 210.5-02(28))
-Publisher FASB
-URI https://asc.fasb.org//1943274/2147480566/210-10-S99-1
Reference 6: http://fasb.org/us-gaap/role/ref/legacyRef
-Topic 505
-SubTopic 10
-Name Accounting Standards Codification
-Section S99
-Paragraph 1
-Subparagraph (SX 210.3-04)
-Publisher FASB
-URI https://asc.fasb.org//1943274/2147480008/505-10-S99-1
Reference 7: http://fasb.org/us-gaap/role/ref/legacyRef
-Topic 210
-SubTopic 10
-Name Accounting Standards Codification
-Section S99
-Paragraph 1
-Subparagraph (SX 210.5-02(29))
-Publisher FASB
-URI https://asc.fasb.org//1943274/2147480566/210-10-S99-1
| Name: |
us-gaap_StockRepurchasedDuringPeriodShares |
| Namespace Prefix: |
us-gaap_ |
| Data Type: |
xbrli:sharesItemType |
| Balance Type: |
na |
| Period Type: |
duration |
|
| X |
- DefinitionEquity impact of the value of stock that has been repurchased during the period and has not been retired and is not held in treasury. Some state laws may mandate the circumstances under which an entity may acquire its own stock and prescribe the accounting treatment therefore. This element is used when state law does not recognize treasury stock. Reference 1: http://fasb.org/us-gaap/role/ref/legacyRef
-Name Accounting Standards Codification
-Section 50
-Paragraph 2
-SubTopic 10
-Topic 505
-Publisher FASB
-URI https://asc.fasb.org//1943274/2147481112/505-10-50-2
Reference 2: http://www.xbrl.org/2003/role/exampleRef
-Topic 946
-SubTopic 830
-Name Accounting Standards Codification
-Section 55
-Paragraph 11
-Publisher FASB
-URI https://asc.fasb.org//1943274/2147480167/946-830-55-11
Reference 3: http://www.xbrl.org/2003/role/disclosureRef
-Topic 946
-SubTopic 205
-Name Accounting Standards Codification
-Section 45
-Paragraph 4
-Subparagraph (a)
-Publisher FASB
-URI https://asc.fasb.org//1943274/2147480767/946-205-45-4
Reference 4: http://www.xbrl.org/2003/role/disclosureRef
-Topic 946
-SubTopic 505
-Name Accounting Standards Codification
-Section 50
-Paragraph 2
-Subparagraph (c)
-Publisher FASB
-URI https://asc.fasb.org//1943274/2147481004/946-505-50-2
Reference 5: http://www.xbrl.org/2003/role/disclosureRef
-Topic 946
-SubTopic 220
-Name Accounting Standards Codification
-Section S99
-Paragraph 3
-Subparagraph (SX 210.6-09(4)(b))
-Publisher FASB
-URI https://asc.fasb.org//1943274/2147483575/946-220-S99-3
Reference 6: http://fasb.org/us-gaap/role/ref/legacyRef
-Topic 210
-SubTopic 10
-Name Accounting Standards Codification
-Section S99
-Paragraph 1
-Subparagraph (SX 210.5-02(28))
-Publisher FASB
-URI https://asc.fasb.org//1943274/2147480566/210-10-S99-1
Reference 7: http://fasb.org/us-gaap/role/ref/legacyRef
-Topic 505
-SubTopic 10
-Name Accounting Standards Codification
-Section S99
-Paragraph 1
-Subparagraph (SX 210.3-04)
-Publisher FASB
-URI https://asc.fasb.org//1943274/2147480008/505-10-S99-1
Reference 8: http://fasb.org/us-gaap/role/ref/legacyRef
-Topic 210
-SubTopic 10
-Name Accounting Standards Codification
-Section S99
-Paragraph 1
-Subparagraph (SX 210.5-02(29))
-Publisher FASB
-URI https://asc.fasb.org//1943274/2147480566/210-10-S99-1
| Name: |
us-gaap_StockRepurchasedDuringPeriodValue |
| Namespace Prefix: |
us-gaap_ |
| Data Type: |
xbrli:monetaryItemType |
| Balance Type: |
debit |
| Period Type: |
duration |
|
| X |
- Details
| Name: |
us-gaap_InvestmentTypeAxis=us-gaap_RepurchaseAgreementsMember |
| Namespace Prefix: |
|
| Data Type: |
na |
| Balance Type: |
|
| Period Type: |
|
|
v3.24.1
Subsequent Events (Details Narrative) - USD ($)
$ in Millions |
1 Months Ended |
12 Months Ended |
|
Feb. 22, 2024 |
Dec. 31, 2023 |
Jun. 30, 2024 |
| Acquisition of Bloomia B.V. |
|
|
|
| Pro forma net sales of combined entity |
|
$ 45.0
|
|
| Notes payable |
|
$ 12.8
|
|
| Interest rate per annum |
|
8.00%
|
|
| Notes payable, other |
|
$ 2.7
|
|
| Other notes payable, interest rate |
|
8.00%
|
|
| Remaining lease term |
|
5 years
|
|
| Acquisition of Bloomia B.V. | Subsequent Events |
|
|
|
| Acquisition of ownership |
$ 47.5
|
|
|
| Acquisition payment |
9.2
|
|
|
| Proceeds from new credit facility |
22.8
|
|
|
| Notes payable |
$ 15.5
|
|
|
| Ownership percentage |
18.60%
|
|
|
| Credit Agreement |
|
|
|
| Term loan funded amount |
|
$ 18.0
|
|
| Revolving credit facility, amount |
|
$ 6.0
|
|
| Borrowings under the Credit Agreement bear interest at a rate per annum |
|
Borrowings under the Credit Agreement bear interest at a rate per annum equal to Term SOFR for an interest period of one month plus 3.0%. In addition to paying interest on the outstanding principal under the Credit Agreement, Tulp 24.1 is required to pay a commitment fee of 0.50% on the unutilized commitments under the revolving credit facility
|
|
| Minimum fixed charge coverage ratio |
|
minimum fixed charge coverage ratio of not less than 1.25 to 1.00
|
|
| Maximum senior cash flow leverage ratio |
|
maximum senior cash flow leverage ratio of 3.0 to 1.0 until September 30, 2024, and stepping down to 2.00 to 1.00 on December 31, 2027
|
|
| Credit Agreement | Subsequent Events |
|
|
|
| Term loans quarterly installments |
|
|
$ 450,000.0
|
| X |
- References
+ Details
| Name: |
ldwy_BorrowingsUnderTheCreditAgreementBearInterestAtARatePerAnnum |
| Namespace Prefix: |
ldwy_ |
| Data Type: |
xbrli:stringItemType |
| Balance Type: |
na |
| Period Type: |
duration |
|
| X |
- References
+ Details
| Name: |
ldwy_MaximumSeniorCashFlowLeverageRatio |
| Namespace Prefix: |
ldwy_ |
| Data Type: |
xbrli:stringItemType |
| Balance Type: |
na |
| Period Type: |
duration |
|
| X |
- References
+ Details
| Name: |
ldwy_MinimumFixedChargeCoverageRatio |
| Namespace Prefix: |
ldwy_ |
| Data Type: |
xbrli:stringItemType |
| Balance Type: |
na |
| Period Type: |
duration |
|
| X |
- References
+ Details
| Name: |
ldwy_RemainingLeaseTerm |
| Namespace Prefix: |
ldwy_ |
| Data Type: |
xbrli:durationItemType |
| Balance Type: |
na |
| Period Type: |
duration |
|
| X |
- DefinitionThe capitalized costs incurred during the period (excluded from amortization) to purchase, lease or otherwise acquire an unproved property, including costs of lease bonuses and options to purchase or lease properties, the portion of costs applicable to minerals when land including mineral rights is purchased in fee, brokers' fees, recording fees, legal costs, and other costs incurred in acquiring properties. Reference 1: http://fasb.org/us-gaap/role/ref/legacyRef
-Topic 932
-SubTopic 10
-Name Accounting Standards Codification
-Section S99
-Paragraph 1
-Subparagraph (SX 210.4-10(c)(7)(ii))
-Publisher FASB
-URI https://asc.fasb.org//1943274/2147479664/932-10-S99-1
Reference 2: http://fasb.org/us-gaap/role/ref/legacyRef
-Topic 932
-SubTopic 10
-Name Accounting Standards Codification
-Section S99
-Paragraph 1
-Subparagraph (SX 210.4-10(c)(3)(ii)(A))
-Publisher FASB
-URI https://asc.fasb.org//1943274/2147479664/932-10-S99-1
| Name: |
us-gaap_AcquisitionCosts |
| Namespace Prefix: |
us-gaap_ |
| Data Type: |
xbrli:monetaryItemType |
| Balance Type: |
debit |
| Period Type: |
duration |
|
| X |
- DefinitionThe amount of cash deposited in financial institutions as of the balance sheet date that is insured by the Federal Deposit Insurance Corporation.
| Name: |
us-gaap_CashFDICInsuredAmount |
| Namespace Prefix: |
us-gaap_ |
| Data Type: |
xbrli:monetaryItemType |
| Balance Type: |
debit |
| Period Type: |
instant |
|
| X |
- DefinitionContractual interest rate for funds borrowed, under the debt agreement. Reference 1: http://www.xbrl.org/2003/role/disclosureRef
-Topic 470
-SubTopic 20
-Name Accounting Standards Codification
-Section 50
-Paragraph 1B
-Subparagraph (b)
-Publisher FASB
-URI https://asc.fasb.org//1943274/2147481139/470-20-50-1B
Reference 2: http://fasb.org/us-gaap/role/ref/legacyRef
-Name Accounting Standards Codification
-Topic 210
-SubTopic 10
-Section S99
-Paragraph 1
-Subparagraph (SX 210.5-02.22(a)(1))
-Publisher FASB
-URI https://asc.fasb.org//1943274/2147480566/210-10-S99-1
| Name: |
us-gaap_DebtInstrumentInterestRateStatedPercentage |
| Namespace Prefix: |
us-gaap_ |
| Data Type: |
dtr-types:percentItemType |
| Balance Type: |
na |
| Period Type: |
instant |
|
| X |
- DefinitionVariable interest rate in effect as of the balance sheet date related to the interest rate derivative.
| Name: |
us-gaap_DerivativeVariableInterestRate |
| Namespace Prefix: |
us-gaap_ |
| Data Type: |
dtr-types:percentItemType |
| Balance Type: |
na |
| Period Type: |
instant |
|
| X |
- DefinitionFair value of the amount outstanding under the credit facility. Reference 1: http://www.xbrl.org/2003/role/disclosureRef
-Topic 825
-SubTopic 10
-Name Accounting Standards Codification
-Section 50
-Paragraph 10
-Publisher FASB
-URI https://asc.fasb.org//1943274/2147482907/825-10-50-10
| Name: |
us-gaap_LineOfCreditFacilityFairValueOfAmountOutstanding |
| Namespace Prefix: |
us-gaap_ |
| Data Type: |
xbrli:monetaryItemType |
| Balance Type: |
credit |
| Period Type: |
instant |
|
| X |
- DefinitionIncluding the current and noncurrent portions, aggregate carrying amount of all types of notes payable, as of the balance sheet date, with initial maturities beyond one year or beyond the normal operating cycle, if longer. Reference 1: http://fasb.org/us-gaap/role/ref/legacyRef
-Name Accounting Standards Codification
-Section S99
-Paragraph 1
-Subparagraph (SX 210.5-02(22))
-SubTopic 10
-Topic 210
-Publisher FASB
-URI https://asc.fasb.org//1943274/2147480566/210-10-S99-1
Reference 2: http://www.xbrl.org/2009/role/commonPracticeRef
-Topic 944
-SubTopic 210
-Name Accounting Standards Codification
-Section S99
-Paragraph 1
-Subparagraph (SX 210.7-03(a)(16)(a)(2))
-Publisher FASB
-URI https://asc.fasb.org//1943274/2147479440/944-210-S99-1
Reference 3: http://fasb.org/us-gaap/role/ref/legacyRef
-Topic 942
-SubTopic 210
-Name Accounting Standards Codification
-Section S99
-Paragraph 1
-Subparagraph (SX 210.9-03(16))
-Publisher FASB
-URI https://asc.fasb.org//1943274/2147479853/942-210-S99-1
| Name: |
us-gaap_NotesPayable |
| Namespace Prefix: |
us-gaap_ |
| Data Type: |
xbrli:monetaryItemType |
| Balance Type: |
credit |
| Period Type: |
instant |
|
| X |
- DefinitionAmount of long-term notes payable classified as other. Reference 1: http://fasb.org/us-gaap/role/ref/legacyRef
-Name Accounting Standards Codification
-Section S99
-Paragraph 1
-Subparagraph (SX 210.5-02(22))
-SubTopic 10
-Topic 210
-Publisher FASB
-URI https://asc.fasb.org//1943274/2147480566/210-10-S99-1
Reference 2: http://www.xbrl.org/2009/role/commonPracticeRef
-Topic 944
-SubTopic 210
-Name Accounting Standards Codification
-Section S99
-Paragraph 1
-Subparagraph (SX 210.7-03(a)(16)(a)(2))
-Publisher FASB
-URI https://asc.fasb.org//1943274/2147479440/944-210-S99-1
Reference 3: http://fasb.org/us-gaap/role/ref/legacyRef
-Topic 942
-SubTopic 210
-Name Accounting Standards Codification
-Section S99
-Paragraph 1
-Subparagraph (SX 210.9-03(16))
-Publisher FASB
-URI https://asc.fasb.org//1943274/2147479853/942-210-S99-1
| Name: |
us-gaap_OtherNotesPayable |
| Namespace Prefix: |
us-gaap_ |
| Data Type: |
xbrli:monetaryItemType |
| Balance Type: |
credit |
| Period Type: |
instant |
|
| X |
- DefinitionThe cash outflow associated with the acquisition of business during the period. The cash portion only of the acquisition price. Reference 1: http://www.xbrl.org/2003/role/disclosureRef
-Topic 805
-SubTopic 30
-Name Accounting Standards Codification
-Section 50
-Paragraph 1
-Subparagraph (b)(1)
-Publisher FASB
-URI https://asc.fasb.org//1943274/2147479581/805-30-50-1
Reference 2: http://fasb.org/us-gaap/role/ref/legacyRef
-Name Accounting Standards Codification
-Topic 230
-SubTopic 10
-Section 45
-Paragraph 13
-Subparagraph (b)
-Publisher FASB
-URI https://asc.fasb.org//1943274/2147482740/230-10-45-13
| Name: |
us-gaap_PaymentsToAcquireBusinessesGross |
| Namespace Prefix: |
us-gaap_ |
| Data Type: |
xbrli:monetaryItemType |
| Balance Type: |
credit |
| Period Type: |
duration |
|
| X |
- DefinitionAmount of cash inflow from contractual arrangement with the lender, including but not limited to, letter of credit, standby letter of credit and revolving credit arrangements. Reference 1: http://www.xbrl.org/2009/role/commonPracticeRef
-Topic 235
-SubTopic 10
-Name Accounting Standards Codification
-Section S99
-Paragraph 1
-Subparagraph (SX 210.4-08(f))
-Publisher FASB
-URI https://asc.fasb.org//1943274/2147480678/235-10-S99-1
Reference 2: http://fasb.org/us-gaap/role/ref/legacyRef
-Name Accounting Standards Codification
-Topic 230
-SubTopic 10
-Section 45
-Paragraph 14
-Subparagraph (b)
-Publisher FASB
-URI https://asc.fasb.org//1943274/2147482740/230-10-45-14
| Name: |
us-gaap_ProceedsFromLinesOfCredit |
| Namespace Prefix: |
us-gaap_ |
| Data Type: |
xbrli:monetaryItemType |
| Balance Type: |
debit |
| Period Type: |
duration |
|
| X |
- DefinitionThe cash outflow for a borrowing supported by a written promise to pay an obligation. Reference 1: http://fasb.org/us-gaap/role/ref/legacyRef
-Name Accounting Standards Codification
-Topic 230
-SubTopic 10
-Section 45
-Paragraph 15
-Subparagraph (b)
-Publisher FASB
-URI https://asc.fasb.org//1943274/2147482740/230-10-45-15
| Name: |
us-gaap_RepaymentsOfNotesPayable |
| Namespace Prefix: |
us-gaap_ |
| Data Type: |
xbrli:monetaryItemType |
| Balance Type: |
credit |
| Period Type: |
duration |
|
| X |
- DefinitionDefinite liabilities to third parties under a termination loan agreement, whether or not guaranteed in whole or in part by the government. Reference 1: http://www.xbrl.org/2003/role/disclosureRef
-Topic 912
-SubTopic 405
-Name Accounting Standards Codification
-Section 45
-Paragraph 4
-Publisher FASB
-URI https://asc.fasb.org//1943274/2147482379/912-405-45-4
| Name: |
us-gaap_TerminationLoans |
| Namespace Prefix: |
us-gaap_ |
| Data Type: |
xbrli:monetaryItemType |
| Balance Type: |
credit |
| Period Type: |
instant |
|
| X |
- DefinitionPercentage of the Variable Interest Entity's (VIE) voting interest owned by (or beneficial interest in) the reporting entity (directly or indirectly). Reference 1: http://fasb.org/us-gaap/role/ref/legacyRef
-Name Accounting Standards Codification
-Topic 810
-SubTopic 10
-Section 50
-Paragraph 5A
-Subparagraph (d)
-Publisher FASB
-URI https://asc.fasb.org//1943274/2147481203/810-10-50-5A
| Name: |
us-gaap_VariableInterestEntityOwnershipPercentage |
| Namespace Prefix: |
us-gaap_ |
| Data Type: |
dtr-types:percentItemType |
| Balance Type: |
na |
| Period Type: |
duration |
|
| X |
- Details
| Name: |
us-gaap_BusinessAcquisitionAxis=ldwy_AcquisitionOfBloomiaBVMember |
| Namespace Prefix: |
|
| Data Type: |
na |
| Balance Type: |
|
| Period Type: |
|
|
| X |
- Details
| Name: |
us-gaap_SubsequentEventTypeAxis=us-gaap_SubsequentEventMember |
| Namespace Prefix: |
|
| Data Type: |
na |
| Balance Type: |
|
| Period Type: |
|
|
| X |
- Details
| Name: |
us-gaap_BusinessAcquisitionAxis=ldwy_CreditAgreementMember |
| Namespace Prefix: |
|
| Data Type: |
na |
| Balance Type: |
|
| Period Type: |
|
|
Insignia Systems (NASDAQ:ISIG)
Historical Stock Chart
From Mar 2024 to Apr 2024

Insignia Systems (NASDAQ:ISIG)
Historical Stock Chart
From Apr 2023 to Apr 2024
