false
0001419806
00-0000000
0001419806
2024-03-04
2024-03-04
iso4217:USD
xbrli:shares
iso4217:USD
xbrli:shares
UNITED STATES
SECURITIES AND EXCHANGE COMMISSION
Washington, D.C. 20549
FORM 8-K
CURRENT REPORT
Pursuant to Section 13 or 15(d) of the
Securities Exchange Act of 1934
Date of Report (Date of earliest event reported):
March 4, 2024
RARE ELEMENT
RESOURCES LTD.
(Exact name of registrant as specified in its charter)
| British Columbia, Canada | |
001-34852 | |
Not Applicable |
(State or other jurisdiction of
incorporation or organization) | |
(Commission File Number) | |
(IRS Employer
Identification No.) |
P.O. Box 271049
Littleton, Colorado | |
80127 |
| (Address of principal executive offices) | |
(Zip Code) |
| Registrant’s telephone number, including area code: |
(720) 278-2460 |
| Not Applicable |
| (Former name or former address, if changed since last report) |
Check the appropriate box below if the Form 8-K filing is intended
to simultaneously satisfy the filing obligation of the registrant under any of the following provisions:
| ¨ |
Written communications pursuant to Rule 425 under the Securities Act (17 CFR 230.425) |
| ¨ |
Soliciting material pursuant to Rule 14a-12 under the Exchange Act (17 CFR 240.14a-12) |
| ¨ |
Pre-commencement communications pursuant to Rule 14d-2(b) under the Exchange Act (17 CFR 240.14d-2(b)) |
| ¨ |
Pre-commencement communications pursuant to Rule 13e-4(c) under the Exchange Act (17 CFR 240.13e-4(c)) |
Securities registered pursuant to Section 12(b) of the Act:
None
Indicate by check mark whether the registrant is an emerging growth
company as defined in Rule 405 of the Securities Act of 1933 (§ 230.405 of this chapter) or Rule 12b-2 of the Securities Exchange
Act of 1934 (§ 240.12b-2 of this chapter).
Emerging
growth company ¨
If an emerging
growth company, indicate by check mark if the registrant has elected not to use the extended transition period for complying with any
new or revised financial accounting standards provided pursuant to Section 13(a) of the Exchange Act. o
| Item 7.01 | Regulation FD Disclosure. |
On March 4, 2024,
Rare Element Resources Ltd. (the “Company”) issued a press release announcing a new mineral resource estimate for the
Company’s Bear Lodge rare earth elements project in Wyoming (the “Bear Lodge REE Project”) and the publication of
the S-K 1300 Technical Report Summary (“TRS”) disclosing the mineral resources for the Bear Lodge REE Project. The TRS
was completed by Alan C. Noble, P.E. Q.P., Monica Barrero Bouza, EurGeol, Q.P., and Jaye T. Pickarts, P.E. Q.P. (the
“Qualified Persons”), in compliance with Item 1300 of Regulation S-K, with an effective date of February 29,
2024. A copy of the press release
is furnished with this Current Report on Form 8-K as Exhibit 99.1 and is incorporated herein by reference.
The information furnished
under this Item 7.01, including Exhibit 99.1, is being furnished and shall not be deemed “filed” for purposes of Section 18
of the Securities Exchange Act of 1934, as amended (the “Exchange Act”), or otherwise subject to the liabilities of that section,
or incorporated by reference in any filing under the Securities Act of 1933, as amended, or the Exchange Act, except as shall be expressly
set forth by specific reference in such filing.
On March 4, 2024, the Company issued the
TRS for the Bear Lodge REE Project. A copy of the TRS is attached as Exhibit 96.1.
| Item 9.01 | Financial Statements and Exhibits. |
(d) Exhibits.
SIGNATURE
Pursuant to the requirements
of the Securities Exchange Act of 1934, the registrant has duly caused this report to be signed on its behalf by the undersigned hereunto
duly authorized.
Date:
March 4, 2024
| |
RARE ELEMENT RESOURCES LTD. |
| |
|
|
| |
By: |
/s/ Wayne E. Rich |
| |
Name: |
Wayne E. Rich |
| |
Title: |
Chief Financial Officer |
Exhibit 23.1
Consent of Qualified Person
I, Alan C. Noble, P.E. Q.P., in connection with the SK-1300 Technical
Report Summary on the Bear Lodge REE Project, Wyoming, USA and any amendments or supplements and/or exhibits thereto, consent to:
| · | The filing and use of the Technical Report Summary for the Bear Lodge REE
Project with an effective date of 29 February 2024: |
| · | The use of and references to my name, including my status as an expert or
“qualified person” (as defined in Subpart 1300 of Regulation S-K promulgated by the U.S. Securities and Exchange Commission),
in connection with the Form 8-K and the Technical Report Summary; and |
| · | The use of information derived, summarized, quoted, or referenced from the
Technical Report Summary, or portions thereof, that was prepared by me, that I supervised the preparation of and/or that was reviewed
and approved by me, that is included or incorporated by reference in the Form 8-K. |
I am the qualified person responsible for authoring the following sections
of the Technical Report Summary: 1, 2, 11,22, and 23 and review of sections 3, 4, 5, 6, 7, 8, and 9.
I also consent to the incorporation by reference of the above items
in the registration statements of Rare Element Resources, Ltd. filed on Form S-1 (File No. 333-275892), Form S-3 (File
No. 333-255920), and Form S-8 (File No. 333-267097).
Dated March 4, 2024
| By: |
/s/ Alan C Noble,
PE, QP |
|
| Name: |
Alan C Noble, PE, QP. |
|
| Title: |
Owner, Ore Reserves Engineering |
|
Exhibit 23.2
Consent of Qualified
Person
I, Monica Barrero Bouza, EurGeol, Q.P.,
in connection with the SK-1300 Technical Report Summary on the Bear Lodge REE Project, Wyoming, USA, and any amendments or supplements
and/or exhibits thereto, consent to:
| · | The
filing and use of the Technical Report Summary for the Bear Lodge REE Project with an effective
date of 29 February 2024: |
| · | The
use of and references to my name, including my status as an expert or “qualified person”
(as defined in Subpart 1300 of Regulation S-K promulgated by the U.S. Securities and Exchange
Commission), in connection with the Form 8-K and the Technical Report Summary; and |
| · | The
use of information derived, summarized, quoted, or referenced from the Technical Report Summary,
or portions thereof, that was prepared by me, that I supervised the preparation of and/or
that was reviewed and approved by me, that is included or incorporated by reference in the
Form 8-K. |
I am the qualified person responsible
for authoring the following sections of the Technical Report Summary: 1, 2, 3, 4, 5, 6, 7, 8, 9, 11, 22, and 23.
I also consent to the incorporation
by reference of the above items in the registration statements of Rare Element Resources, Ltd. filed on Form S-1 (File No. 333-275892),
Form S-3 (File No. 333-255920), and Form S-8 (File No. 333-267097).
Dated March 4, 2024
| By: |
/s/ Monica Barrero Bouza |
|
| Name: |
Monica Barrero Bouza, EurGeol. |
|
| Title: |
Consultant |
|
Exhibit 23.3
Consent of Qualified
Person
I, Jaye T. Pickarts, P.E. Q.P., in connection
with the SK-1300 Technical Report Summary on the Bear Lodge REE Project, Wyoming, USA and any amendments or supplements and/or exhibits
thereto, consent to:
| · | The
filing and use of the Technical Report Summary for the Bear Lodge REE Project with an effective
date of 29 February 2024: |
| · | The
use of and references to my name, including my status as an expert or “qualified person”
(as defined in Subpart 1300 of Regulation S-K promulgated by the U.S. Securities and Exchange
Commission), in connection with the Form 8-K and the Technical Report Summary; and |
| · | The
use of information derived, summarized, quoted, or referenced from the Technical Report Summary,
or portions thereof, that was prepared by me, that I supervised the preparation of and/or
that was reviewed and approved by me, that is included or incorporated by reference in the
Form 8-K. |
I am the qualified person responsible
for authoring the following sections of the Technical Report Summary: 1, 2, 8, 10, 14, 17, 21, 22,and 23.
I also consent to the incorporation
by reference of the above items in the registration statements of Rare Element Resources, Ltd. filed on Form S-1 (File No. 333-275892),
Form S-3 (File No. 333-255920), and Form S-8 (File No. 333-267097).
Dated March 4, 2024
| By: |
/s/ Jaye T Pickarts |
|
| Name: |
Jaye T. Pickarts, P.E., Q.P. |
|
| Title: |
Consultant |
|
Exhibit 96.1
Technical Report
Summary
On the Bear Lodge
REE Project
Located in Crook
County, Wyoming.
Prepared For

Rare Element Resources, Inc.
P.O. Box 271049
Littleton, CO 80127
By:
Alan C. Noble, PE
Ore Reserves
Engineering
Highlands Ranch,
CO 80129
303.478.8271
In association with:
Monica Barrero Bouza,
EurGeol
Oviedo, 33001 Spain
+34 616565752
Jaye T. Pickarts,
P.E., Q.P.
Consultant
Littleton, CO 80128
303.570.3370
29 February 2024

Table
of Contents
| DATE AND SIGNATURE PAGE |
IX |
| 1 |
EXECUTIVE SUMMARY |
1-1 |
| |
1.1 |
Property Description and Ownership |
1-1 |
| |
1.2 |
Geology and Mineralization |
1-1 |
| |
1.3 |
Status of exploration, development, and operations |
1-2 |
| |
1.4 |
Mineral Resource Estimate |
1-2 |
| |
1.5 |
Summary of Capital and Operating Cost Estimates |
1-3 |
| |
1.6 |
Processing and Recovery Methods |
1-4 |
| |
1.7 |
Permitting Requirements |
1-4 |
| |
1.8 |
Qualified Persons’ Conclusions and Recommendations |
1-4 |
| 2 |
INTRODUCTION |
2-1 |
| |
2.1 |
Details of the Registrant |
2-1 |
| |
2.2 |
Purpose and Terms of Reference |
2-1 |
| |
2.3 |
Sources of Information |
2-1 |
| |
2.4 |
Units of Measure, Abbreviations, Acronyms, and Symbols |
2-2 |
| 3 |
PROPERTY DESCRIPTION |
3-1 |
| |
3.1 |
Property Location |
3-1 |
| |
|
3.1.1 |
Bear Lodge REE Project |
3-1 |
| |
3.2 |
Property Description and Ownership |
3-2 |
| |
|
3.2.1 |
Land Ownership |
3-2 |
| |
|
3.2.2 |
Mining Claims |
3-2 |
| 4 |
ACCESSIBILITY, CLIMATE, LOCAL RESOURCES, INFRASTRUCTURE, AND PHYSIOGRAPHY |
4-1 |
| |
4.1 |
Accessibility |
4-1 |
| |
4.2 |
Climate and Physiography |
4-3 |
| |
4.3 |
Local Resources and Infrastructure |
4-3 |
| 5 |
HISTORY |
5-1 |
| |
5.1 |
Exploration History |
5-1 |
| |
5.2 |
Historical Resource Estimates |
5-3 |
| 6 |
GEOLOGICAL SETTING, MINERALIZATION, AND DEPOSIT |
6-1 |
| |
6.1 |
Regional Geology |
6-1 |
| |
6.2 |
Local Geology |
6-2 |
| |
|
6.2.1 |
Igneous Rocks |
6-6 |
| |
|
6.2.1 |
Alteration |
6-6 |
| |
|
6.2.2 |
Mineralization |
6-8 |
| | | |
| Ore Reserves Engineering | Page i | 29 February 2024 |
| |
6.3 |
Project Geology |
6-8 |
| |
|
6.3.1 |
Mineralization Zones |
6-10 |
| |
|
6.3.1 |
Bear Lodge REE Project Deposits |
6-12 |
| |
6.4 |
Deposit Type |
6-14 |
| |
|
6.4.1 |
Carbonatite-Hosted Rare Earths |
6-14 |
| |
|
6.4.2 |
Bear Lodge REE Project |
6-15 |
| |
6.5 |
Qualified Persons’ Statement on Geological Setting, Mineralization, and Deposit |
6-16 |
| 7 |
EXPLORATION |
7-1 |
| |
7.1 |
Introduction |
7-1 |
| |
7.2 |
Exploration Target Areas |
7-2 |
| |
|
7.2.1 |
Bull Hill |
7-2 |
| |
|
7.2.1 |
Carbonatite Plug (Deep Bull Hill West) |
7-3 |
| |
|
7.2.2 |
Bull Hill Northwest |
7-3 |
| |
|
7.2.3 |
Whitetail Ridge |
7-4 |
| |
|
7.2.4 |
Carbon Hill and Taylor |
7-4 |
| |
7.3 |
Exploration Activities |
7-5 |
| |
|
7.3.1 |
Exploration between 2004 and 2013 |
7-5 |
| |
|
7.3.2 |
2014 Test Trench |
7-11 |
| |
|
7.3.3 |
Geotechnical Drilling |
7-12 |
| |
|
7.3.4 |
Hydrogeological Characterization |
7-13 |
| |
|
7.3.5 |
Qualified Persons’ Statement on Exploration Drilling |
7-13 |
| 8 |
SAMPLE PREPARATION, ANALYSES, AND SECURITY |
8-1 |
| |
8.1 |
Introduction |
8-1 |
| |
8.2 |
Sample Preparation Methods and Analytical Laboratories |
8-1 |
| |
|
8.2.1 |
Historic Sample Preparation and Analyses |
8-1 |
| |
8.3 |
Rare Element Resources (RER) Sample Preparation and Analyses |
8-1 |
| |
8.4 |
Laboratory Certifications |
8-1 |
| |
8.1 |
Quality Control & Quality Assurance |
8-2 |
| |
|
8.1.1 |
RER´s Internal Standards |
8-2 |
| |
|
8.1.2 |
2009-2013 Assay Quality Control & Quality Assurance |
8-3 |
| |
|
8.1.3 |
2009-2013 QA/QC Conclusions |
8-13 |
| |
8.2 |
Sample Security |
8-13 |
| |
8.3 |
Qualified Persons’ Statement on Sample Preparation, Analyses, and Security |
8-15 |
| 9 |
DATA VERIFICATION |
9-1 |
| |
9.1 |
Drill hole data |
9-1 |
| |
|
9.1.1 |
Drilling Database |
9-1 |
| |
|
9.1.2 |
Collar Locations and Down-Hole Survey Data |
9-2 |
| |
|
9.1.3 |
Assay Data and QAQC |
9-2 |
| |
|
9.1.4 |
Bulk Density Determination Methods |
9-2 |
| | | |
| Ore Reserves Engineering | Page ii | 29 February 2024 |
| |
9.2 |
Topographic Data |
9-2 |
| |
9.3 |
Metallurgical Test Work |
9-3 |
| |
9.4 |
Qualified Persons’ Statement on Data Verification |
9-3 |
| 10 |
MINERAL PROCESSING AND METALLURGICAL TESTING |
10-1 |
| |
10.1 |
Introduction |
10-1 |
| |
10.2 |
Historical Test work |
10-1 |
| |
|
10.2.1 |
Acid Leaching Tests |
10-2 |
| |
|
10.2.2 |
Pilot Test work |
10-4 |
| |
10.3 |
Pilot Testing |
10-6 |
| |
10.4 |
Demonstration Project |
10-8 |
| 11 |
MINERAL RESOURCE ESTIMATES |
11-1 |
| |
11.1 |
Introduction |
11-1 |
| |
11.2 |
Block Model Parameters |
11-1 |
| |
11.3 |
Estimation Domains and Trend Surfaces |
11-1 |
| |
11.4 |
Oxidation Model |
11-4 |
| |
11.5 |
Trend-Oriented Modeling |
11-6 |
| |
11.6 |
Compositing |
11-7 |
| |
|
11.6.1 |
Grade-Zoned Composite Statistics |
11-8 |
| |
|
11.6.1 |
Missing Grades for Iron, Manganese and Calcium Oxides |
11-12 |
| |
|
11.6.2 |
TREO-Grade Adjustments for Oxidation Zones |
11-13 |
| |
11.7 |
Variograms |
11-13 |
| |
11.8 |
OreZONE Block Model |
11-25 |
| |
11.9 |
Grade Estimation |
11-27 |
| |
11.10 |
Block Model Verification |
11-28 |
| |
11.11 |
Block Model Density Estimation |
11-31 |
| |
11.12 |
Dilution |
11-31 |
| |
11.13 |
Resource Classification |
11-32 |
| |
11.14 |
Mineral Resource |
11-33 |
| |
|
11.14.1 |
Key Assumptions and Parameters for Pit Optimization |
11-34 |
| |
|
11.14.2 |
Preliminary Pit design |
11-35 |
| |
|
11.14.3 |
Mineral Resource Summary |
11-39 |
| |
11.15 |
Mineral Resource Uncertainty Discussion |
11-41 |
| 12 |
MINERAL RESERVE ESTIMATES |
12-1 |
| 13 |
MINING METHODS |
13-1 |
| 14 |
PROCESSING AND RECOVERY METHODS |
14-1 |
| 15 |
INFRASTRUCTURE |
15-1 |
| 16 |
MARKET STUDIES |
16-1 |
| | | |
| Ore Reserves Engineering | Page iii | 29 February 2024 |
| 17 |
ENVIRONMENTAL STUDIES, PERMITTING, AND PLANS, NEGOTIATIONS, OR AGREEMENTS
WITH LOCAL INDIVIDUALS OR GROUPS |
17-1 |
| |
17.1 |
Introduction |
17-1 |
| |
17.2 |
Historical Permitting |
17-1 |
| |
17.3 |
Planned Regulatory Requirements |
17-2 |
| 18 |
CAPITAL AND OPERATING COSTS |
18-1 |
| 19 |
ECONOMIC ANALYSIS |
19-1 |
| 20 |
ADJACENT PROPERTIES |
20-1 |
| 21 |
OTHER RELEVANT DATA AND INFORMATION |
21-1 |
| |
21.1 |
Potential By-Products |
21-1 |
| 22 |
INTERPRETATION AND CONCLUSIONS |
22-1 |
| |
22.1 |
Resource Estimation |
22-1 |
| |
|
22.1.1 |
Risks |
22-1 |
| |
|
22.1.2 |
Opportunities |
22-1 |
| |
22.2 |
Demonstration Plant |
22-2 |
| |
|
22.2.1 |
Risks |
22-2 |
| |
|
22.2.2 |
Opportunities |
22-2 |
| |
22.3 |
Markets and Commodity Prices |
22-2 |
| |
|
22.3.1 |
Risks |
22-2 |
| |
|
22.3.2 |
Opportunities |
22-2 |
| |
22.4 |
Permitting & Environmental |
22-2 |
| |
|
22.4.1 |
Risks |
22-2 |
| |
|
22.4.2 |
Opportunities |
22-3 |
| 23 |
RECOMMENDATIONS |
23-1 |
| |
23.1 |
Mining |
23-1 |
| |
23.2 |
Processing |
23-1 |
| |
23.3 |
Government and Industrial Relations |
23-1 |
| |
|
23.3.1 |
Relationships with Downstream Domestic and Allied REE Industry |
23-2 |
| |
|
23.3.2 |
Government Support |
23-2 |
| |
23.4 |
Additional Studies |
23-2 |
| 24 |
REFERENCES |
24-1 |
| 25 |
RELIANCE ON INFORMATION PROVIDED BY THE REGISTRANT |
25-1 |
| | | |
| Ore Reserves Engineering | Page iv | 29 February 2024 |
| LIST
OF TABLES |
|
| |
|
| Table
1-1. Zonal REE Mineralogy in the Bear Lodge Carbonatite and Derivative Dikes and Veins from the Surface to Depth (Roche-Engineering,
2014) |
1-2 |
| Table 1-2. Bull Hill TREO Mineral Resource Summary for the Total Oxide (Ox & OxCa)-31 December 2023 (Noble & Barrero, 2023) |
1-3 |
| Table 1-3. Pay Factors, Hydromet Plant Recoveries, and Rare-Earth Elements Prices (provided by RER, 2023) |
1-3 |
| Table 2-1. List of fourteen (14) Rare Earth elements and Yttrium. Light Rare Earth Elements (LREE) include La, Ce, Pr, Nd, and Sm, the others are Heavy Rare Earth Elements (HREE) |
2-2 |
| Table 2-2. Acronyms used in this TRS |
2-3 |
| Table
2-3. Abbreviations and Symbols used in the TRS |
2-4 |
| Table
3-1. Listing of RER Mining Claims (Mineral & Records System of the Bureau of Land Management) |
3-6 |
| Table 5-1. Historic exploration activities by major companies |
5-1 |
| Table 6-1. Main igneous rock units at Bear Lodge REE Project (Roche-Engineering, 2014) |
6-7 |
| Table
6-2. Zonal REE Mineralogy in the Bear Lodge Carbonatite and Derivative Dikes and Veins from the surface to depth |
6-10 |
| Table 7-1. Bear Lodge REE Project Exploration Target Areas, 2004 through 2013 |
7-2 |
| Table 7-2. Bear Lodge REE Project Exploration Activities, 2004 through 2013 |
7-5 |
| Table 7-3. Exploration drilling for REE performed by RER |
7-6 |
| Table 7-4. Core Recovery by Oxide Type and FMR Content (Roche-Engineering, 2014) |
7-9 |
| Table 7-5. Summary of Density Measurements (Roche-Engineering, 2014) |
7-11 |
| Table 7-6. Apparent TREO grade bias for low and high core recovery samples (Roche-Engineering, 2014) |
7-13 |
| Table 8-1. Summary of the sample preparation procedures and assay methods (RER drilling programs) |
8-2 |
| Table 8-2. Standard Statistics Generated from 2009-2013 Drill Standard Analyses (Roche-Engineering, 2014) |
8-5 |
| Table 8-3. Standard RSDs Generated from 2009-2013 Drill Standard Analyses (Roche-Engineering, 2014) |
8-6 |
| Table
8-4. 2009-2013 Drill Standard Assay Results (Roche-Engineering, 2014) |
8-7 |
| Table 8-5. 2009-2013 Crush and duplicate statistics (Roche-Engineering, 2014) |
8-11 |
| Table 8-6. 2010-2013 Check Analysis Program Results (Roche-Engineering, 2014) |
8-12 |
| Table 10-1. Head Sample Composition (Bhappu, 2011) |
10-2 |
| Table 10-2. Leach Efficiency vs. Temperature (Bhappu, 2011) |
10-3 |
| Table 10-3. Leach Tests Results (Bhappu, 2011) |
10-3 |
| Table 10-4. Pilot Test Results (UIT, 2020) |
10-8 |
| Table
11-1. Model Size and Location Parameters (UTM Zone 13-NAD83-NADV88) |
11-1 |
| Table 11-2. Estimation Domains Detailed Description (A. Noble, in Roche-Engineering, 2014) |
11-4 |
| | | |
| Ore Reserves Engineering | Page v | 29 February 2024 |
| Table 11-3. Rotation Parameters to Flatten the Trend Models (A. Noble in Roche-Engineering, 2014) |
11-7 |
| Table 11-4. Parameters for Optimized Grade-Zone Compositing (Noble & Barrero, 2024) |
11-8 |
| Table 11-5. Basic Statistics for Grade-Zoned Composites of Bull Hill Deposit (updated from A. Noble, Roche-Engineering, 2014) |
11-9 |
| Table 11-6. Regression Formulas for the Estimation of Missing Iron, Manganese, and Calcium Oxides Grades for the Bull Hill Deposit (Roche-Engineering, 2014) |
11-13 |
| Table 11-7. Updated adjustment Factors for Grade Estimation–Block Zone and Composite Zone Combinations (Noble & Barrero, 2024) |
11-13 |
| Table 11-8. Summary of Exponential Variogram Models (Noble & Barrero, 2024) |
11-15 |
| Table 11-9. Search Parameters for IDP and NN Estimation of Grades (Noble & Barrero, 2023) |
11-27 |
| Table 11-10. Estimation Parameters for IDP Estimation of Grades (Noble & Barrero, 2023) |
11-28 |
| Table 11-11. Comparison of IDP vs. NN Estimates for TREO (Noble & Barrero, 2023) |
11-29 |
| Table 11-12. Comparison of IDP vs. NN Estimates for Fe2O3 (Noble & Barrero, 2023) |
11-29 |
| Table 11-13. Comparison of IDP vs. NN Estimates for CaO (Noble & Barrero, 2023) |
11-30 |
| Table 11-14. Comparison of IDP vs. NN Estimates for MnO (Noble & Barrero, 2023) |
11-30 |
| Table
11-15. Comparison of IDP vs. NN Estimates for thorium (Noble & Barrero, 2023) |
11-30 |
| Table 11-16. Comparison of IDP vs. NN Estimates for uranium (Noble & Barrero, 2023) |
11-31 |
| Table 11-17. Formulae for Block Density Estimation (A. Noble, in Roche-Engineering, 2014) |
11-31 |
| Table 11-18. Compositing Dilution Summary (Noble, 2023) |
11-32 |
| Table 11-19. Dilution from Inverse-Distance-Power Estimation (Noble, 2023) |
11-32 |
| Table 11-20. Parameters for Resource Classification in the Ox and OxCa zones (Noble & Barrero, 2023) |
11-33 |
| Table 11-21. Estimated Operating Costs; prices in US Dollars (provided by RER, 2023) |
11-34 |
| Table 11-22. Pay Factors, Hydromet Plant Recoveries, and Rare-Earth Elements Prices (provided by RER, 2023) |
11-35 |
| Table 11-23. Pit design parameters (Sierra Geotechnical LLC., 2013) |
11-36 |
| Table 11-24. Bull Hill TREO Mineral Resource Summary by Oxide Type, 31 December 2023 (Noble & Barrero,2023) |
11-40 |
| Table 16-1. Historical and forecasted TREO prices in 2023 US Dollars (CBEA, unpublished data,2024) |
16-2 |
| |
|
| LIST OF FIGURES |
| |
|
| Figure 3-1. General Property Location Map (Noble & Barrero, 2024) |
3-1 |
| Figure
3-2. Detailed Project Land Property Map (Noble & Barrero, 2024) |
3-3 |
| Figure
3-3. Rare Element Resources Mining Claims Map (Noble & Barrero, 2024) |
3-5 |
| Figure 4-1. General Access Map to the Bear Lodge REE Project (Noble & Barrero, 2024) |
4-1 |
| | | |
| Ore Reserves Engineering | Page vi | 29 February 2024 |
| Figure 4-2. Detailed Access Map to the Bear Lodge REE Project from Sundance (Noble & Barrero, 2024) |
4-2 |
| Figure 6-1. Simplified Geological Map of the Black Hills Uplift (Noble & Barrero 2024, modified from Lisenbee, 1985) |
6-1 |
| Figure 6-2. Geological Map of the Southern Bear Lodge Mountains (Noble & Barrero 2024, modified from Staatz, 1983) |
6-3 |
| Figure 6-3. Stratigraphic Column of the Southern Bear Lodge Mountains (Noble & Barrero 2024, modified from Staatz, 1983) |
6-4 |
| Figure 6-4. Geological Vertical Cross Cections of the Southern Bear Lodge Mountains (Noble & Barrero 2024, modified from Staatz, 1983). Section locations are shown in Figure 6-2 |
6-5 |
| Figure 6-5. Geological Map of the Bear Lodge REE Project (Noble & Barrero 2024, modified after J. Ray- RER 2013) |
6-9 |
| Figure 7-1. Location of exploration (REE) target areas and resource drill holes in the Bear Lodge REE Project |
7-1 |
| Figure 7-2. RER 2009-2013 Exploration drilling included in the mineral resource estimate (Noble & Barrero, 2024) |
7-7 |
| Figure 7-3. Core Recovery Distribution by Oxidation Type (Roche-Engineering, 2014) |
7-10 |
| Figure 7-4. View to the east of the Bull Hill Test Trench 2014 area showing the main cut parallel to the hill slope and four crosscut trenches along a trench length of 300 feet |
7-12 |
| Figure 8-1. RE09001X Standard Analyses for % TREO (Roche-Engineering, 2014) |
8-8 |
| Figure 8-2. RE09003X Standard Analyses for % TREO (Roche-Engineering, 2014) |
8-8 |
| Figure 8-3. RE09004X Standard Analyses for % TREO (Roche-Engineering, 2014) |
8-8 |
| Figure 8-4. RE09006X Standard Analyses for % TREO (Roche-Engineering, 2014) |
8-9 |
| Figure 8-5. RE09007X Standard Analyses for % TREO (Roche-Engineering, 2014) |
8-9 |
| Figure 8-6. RE01001X Standard Analyses for % TREO (Roche-Engineering, 2014) |
8-9 |
| Figure 8-7. RE01003X Standard Analyses for % TREO (Roche-Engineering, 2014) |
8-10 |
| Figure 8-8. 2009-2013 Crush and duplicate control plots (Roche-Engineering, 2014) |
8-11 |
| Figure 8-9. Control plot for the 2010-2013 check assay program (Roche-Engineering, 2014) |
8-12 |
| Figure 8-10. RER logging facility and storage warehouse at Sundance, Wyoming (Noble & Barrero, 2023) |
8-14 |
| Figure 11-1. Plan view of the estimation domains and trends (dash-lines) at 5600ft elevation; Whitetail estimation domains (WT1 and WT2) are shown for reference (after A. Noble, Roche-Engineering, 2014) |
11-3 |
| Figure 11-2. Plan view of the oxidation state model at 5600ft elevation (A. Noble, Roche- Engineering, 2014) |
11-5 |
| Figure 11-3. Vertical sections of the oxidation state model; the location of the sections is shown in Figure 11-2 |
11-6 |
| Figure 11-4. Lognormal grade cumulative frequency distributions and histograms for TREO by OreZONE- Oxides and OxCa Composites (Noble & Barrero, 2024) |
11-10 |
| | | |
| Ore Reserves Engineering | Page vii | 29 February 2024 |
| Figure 11-5. Log-transformed Histograms for TREO, FMR, Iron Oxide, Manganese Oxide, Thorium and Uranium (Noble & Barrero, 2024) |
11-11 |
| Figure 11-6. Log-transformed Histograms for Calcium Oxide by OreZONE and Oxide Type (Noble & Barrero, 2024) |
11-12 |
| Figure 11-7. Experimental Variograms and Models for the OreZONE Indicator (Noble & Barrero, 2024) |
11-16 |
| Figure 11-8. Experimental Variograms and Models for TREO in the Low-Grade OreZONE, domain M1 not included (Noble & Barrero, 2024) |
11-17 |
| Figure 11-9. Experimental Variograms and Models for TREO in the Low-Grade OreZONES in domain M1 (Noble & Barrero, 2024) |
11-18 |
| Figure 11-10. Experimental Variograms and Models for TREO in the High-Grade OreZONE, domain M1 not included (Noble & Barrero, 2024) |
11-19 |
| Figure 11-11. Experimental Variograms and Models for TREO in the High-Grade Zone OreZONE in domain M1 (Noble & Barrero, 2024) |
11-20 |
| Figure 11-12. Variogram models for FMR (%) in the low-grade (above) and high-grade OreZONES (below), in domain 1 (left) and the other domains (right), (Noble & Barrero, 2024) |
11-21 |
| Figure 11-13. Variogram models for calcium oxide (%) in the Oxide (above) and OxCa (below) zones, low- grade and high-grade zones OreZONES, in all domains (Noble & Barrero, 2024) |
11-22 |
| Figure 11-14. Variogram models for manganese oxide (%) in the Oxide zone, in the M1, and in the other domains for low-grade (above) and high-grade (below) OreZONES (Noble & Barrero, 2024) |
11-23 |
| Figure 11-15. Variogram models for manganese oxide (%) in the OxCa zone, for low-grade and high- grade zones OreZONEs in all domains (Noble & Barrero, 2024) |
11-24 |
| Figure 11-16. Variogram models for iron oxide (%) in all domains for the low-grade and high-grade OreZONEs (Noble & Barrero, 2024) |
11-24 |
| Figure 11-17. Variogram models for Thorium (above) and Uranium (below) in the low-grade and high- grade zones, in all domains (Noble & Barrero, 2024) |
11-25 |
| Figure 11-18. Plan Map Showing the OreZONE Block Model at Elevation 5600 ft; the estimation domain contours are plotted for reference (Noble & Barrero, 2024) |
11-26 |
| Figure 11-19. Plan View Showing the Slope Region Model (Noble & Barrero, 2024) |
11-36 |
| Figure 11-20. Plan view of the Preliminary Pit Design Used to Summarize the Bull Hill Mineral Resource (Noble & Barrero, 2024) |
11-37 |
| Figure 11-21. Plan View at 5800ft Elevation with the TREO Grade Model (Noble & Barrero, 2024) |
11-38 |
| Figure 11-22. Vertical Section (A-A’) Showing the Grade Model and the Preliminary Pit Design. Section Location is shown in Figure 11-21 (Noble & Barrero, 2024) |
11-39 |
| Figure 14-1. Demonstration Project Process Flowsheet (RER, 2022) |
14-2 |
| Figure 16-1. Global TREO Demand broken down by 10 end-product categories + Relative Global Magnet Demand + Relative total North American Demand (CBEA, 2024). |
16-2 |
| | | |
| Ore Reserves Engineering | Page viii | 29 February 2024 |
DATE
AND SIGNATURE PAGE
The effective date
of the Mineral Resource estimate is 31 December 2023.
The effective date
of this Technical Report Summary (TRS) is 29 February 2024
This
TRS has been prepared on behalf of Rare Element Resources Inc. in accordance with Regulation S-K (CFR Title 17 §§229.1300-1305
and §§229.601(b)(96)) promulgated by the Securities and Exchange Commission (SEC).
The table below
provides a list of the Qualified Persons and sections for which they are responsible for authoring:
| Qualified
Person |
Section (s) Author |
Section (s) Review |
Signature |
| Alan
C. Noble |
1,
2, 11, 22, 23 |
3,
4, 5, 6, 7, 8, 9, 11 |
“Digitally
Signed” |
| Monica
Barrero Bouza |
1,
2, 3, 4, 5, 6, 7, 8, 9, 11, 22, 23 |
|
“Digitally
Signed” |
| Jaye
Pickarts |
1,
2, 8, 10, 14, 17, 21, 22, 23 |
|
“Digitally
Signed" |
The Qualified Persons’
qualifications and relevant experience are summarized below:
Mr. Noble
(Ore Reserves Engineering) is a Qualified Person, as described in Subpart §229.1300 of Regulation S-K, for resource estimation based
on having received a B.S. Degree in Mining Engineering from the Colorado School of Mines, registration as a Professional Engineer in
the State of Colorado USA, and over 50 years of experience with resource estimation on over 156 mineral deposits throughout the world.
Mr. Noble is independent of Rare Element Resource Inc. and Bear Lodge REE Project.
Ms. Barrero
Bouza is a Qualified Person, as described in Subpart §229.1300 of Regulation S-K, for resource estimation based on having received
a BS Degree in Geology from the University of Oviedo (Spain), a registered member of the Official Association of Professional Geologists
of Spain (ICOG), a registered Eurogeologist, and over 25 years of diverse experience in geology and resource estimation of precious and
base metal projects. Ms. Barrero Bouza is independent of Rare Element Resource Inc. and Bear Lodge REE Project.
Mr. Pickarts
is a Qualified Person, as described in Subpart §229.1300 of Regulation S-K, for metallurgical and process engineering as well as
environmental management. Mr. Pickarts has a B.S Degree in Mineral Processing Engineering from Montana College of Mineral Science
and Technology (Montana Tech) and is a Qualified Professional (QP) certified by the Mining and Metallurgical Society of America (MMSA)
and a registered member of the Society of Mining, Metallurgy, and Exploration (SME). Mr. Pickarts is a Professional Engineer (P.E.)
registered in the State of Colorado, Nevada, and Wyoming. Mr. Pickarts is an independent consultant and former Chief Operating Officer
for Rare Element Resources, Inc.
| | | |
| Ore Reserves Engineering | Page ix | 29 February 2024 |
Rare
Element Resources Inc. (RER) engaged the authors of this report to prepare an initial assessment to support the disclosure of Mineral
Resources of the Bear Lodge REE Project in a Technical Report Summary (TRS) in compliance with the United States Securities and Exchange
Commission’s (SEC) Regulation S-K, CFR Title 17 §§229.1300-1305, Disclosure by Registrants
Engaged in Mining Operations, and Subpart §§229.601(b)(96) Technical Report Summary.
The Bear Lodge
REE Project is a rare-earth project located in Crook County, Wyoming, consisting of the Bull Hill and other rare-earths (REE) deposits.
The Bear Lodge REE Project is a greenfield project with no existing infrastructure or equipment on the property.
The Mineral Resource
estimate of the oxide zones of the Bull Hill rare-earth deposit (“the Bull Hill deposit”) is supported by this TRS, which
has an effective date of 31 December 2023.
| 1.1 | Property
Description and Ownership |
The Bear Lodge
REE Project is located in Central Crook County, northeastern Wyoming, within parts of Sections 5, 6, 7, 8, 9, 14, 15, 16, 17, 18, 19,
21, 22, 23, 26, 27, 28, 29, 30, 31, 32, 33, 34 and 35 in Township 52 North and Range 63 West, Sixth Principal Meridian.
The property comprises
499 unpatented lode mining claims located on land administered by the U.S. Forest Service (USFS), approximately 9,223 acres (3,732 hectares),
and a 640-acre parcel (259 hectares) located in Section 16 for a total of roughly 9,863 acres (3,991 hectares). RER holds a 100%
interest in the 499 unpatented mineral claims that constitute the bulk of the Bear Lodge REE Project area. Section 16 is owned by
Whitelaw Creek LLC.; RER has a re-purchase agreement in place with them once RER has determined the development plans for the project
(Rare Element Resources Inc., 2021).
| 1.2 | Geology
and Mineralization |
The Bear Lodge
REE Project is in the Bear Lodge alkaline-igneous complex, near the western end of the northern Black Hills intrusive belt. The Bear
Lodge alkaline-igneous complex consists predominantly of silica-undersaturated alkaline-igneous intrusive rocks, and it is the only intrusive
series in the alkaline belt where associated carbonatitic intrusions are found.
REE mineralization
is associated with carbonatite and silicocarbonatite dikes, veins, and stockwork that intrude diatreme, heterolithic breccias, and their
host trachyte and phonolite intrusions. The northwest alignment of the three diatreme pipes (Bull Hill, Whitetail Ridge, and Carbon Hill)
coincides with numerous north- to northwest-striking alkaline igneous dikes and mineralized zones.
Most rock units
within the project area are affected by widespread potassic alteration and have a thick near-surface oxidized zone. Carbonate is leached
from many surface exposures during the supergene oxidation of pyrite. Near-surface carbonatite is strongly weathered and depleted in
calcite; the RER team has termed this material as FMR, a mix of iron oxides, manganese oxides, and rare earth minerals. FMR dikes and
veins are interpreted to represent primary carbonatites that were subjected to heavy supergene oxidation and weathering.
| | | |
| Ore Reserves Engineering | Page 1-1 | 29 February 2024 |
REE mineralization
exhibits a generalized vertical zonation related to the degree of supergene oxidation, weathering, and hydrothermal alteration of the
carbonatite, which generally decreases with increasing depth. The generalized vertical distribution of REE mineralization zones (from
top to bottom) and the REE mineralogy is summarized in Table 1-1.
Table
1-1. Zonal REE Mineralogy in the Bear Lodge Carbonatite and Derivative Dikes and Veins from the
Surface to Depth (Roche-Engineering, 2014).
| Zones |
Mineralized
Body |
REE
Mineralogy |
| Oxide
(Ox) |
FMR
dikes and veins; oxidized and leached carbonatite (surface to appx. 5,600 feet/ 1,707 meters) elevation ±300-500 feet (91-152
meters) thickness)
FeOx-MnOx-REEs ± Ksp, ap, Q, bi |
Bastnäsite
group minerals (bastnäsite-dominant), monazite, ± variable, but generally subordinate cerianite |
| Oxide-Carbonate
(OxCa) |
Variably
oxidized and partially leached carbonatite
(variable thickness, surface to appx 5,600 feet/1,707 meters elevation)
FeOx-MnOx-REEs-calc ± Ksp, ap, Q, bi |
Bastnäsite
group minerals (bastnäsite-dominant), ancylite, monazite, ± variable, but generally subordinate cerianite |
Transitional
(Tran) |
Partly
oxidized carbonatite
(appx. 5,600 feet/1,707 meters elevation)
Calc-REE-sulfides-FeOx-REE ± Ksp, ap, aeg, bi |
Predominantly
ancylite; minor to significant bastnäsite group minerals, ± monazite |
Unoxidized/
Sulfide
(Sulf) |
Unoxidized
carbonatite and silicocarbonatite
( < 5,600 feet/1,707 meters elevation)
Calc-REE-sulfides (py-po±cp,sl,gn,mb)-bi ± Ksp, ap, aeg |
Predominantly
ancylite; minor to significant bastnäsite group minerals; ± minor monazite, carbocernaite, and burbankite |
The main ore phases
in the unoxidized dikes are ancylite-(Ce) plus lesser carbocernaite. REE minerals calcioancylite, bastnäsite, parisite, synchisite,
monazite, cheralite, burbankite, and cerianite occur in the oxidized and unoxidized carbonatites.
The greatest concentration
of REE-mineralized bodies occurs in NW-trending dike swarms and stockworks in the Bull Hill deposit, where Individual dikes can reach
80 feet in width (24.4m). Generally, it exhibits light REE enrichment (generally including cerium/Ce, lanthanum/La, neodymium/Nd, praseodymium/Pr,
and samarium/Sm). The mineralized zone extends approximately 1,700 feet (518 meters) in a north-westerly direction, by 300 feet (91 meters)
to more than 700 feet (213 meters) in a north-easterly direction, reflecting the overall orientation of a relatively persistent swarm
of steeply dipping, northwest-striking dikes and veins of FMR and carbonatite.
| 1.3 | Status
of exploration, development, and operations |
There are no current
exploration or development activities on the property.
| 1.4 | Mineral
Resource Estimate |
This Mineral Resource
estimate is reported in accordance with Regulation S-K (CFR Title 17 Part 229 Items 601(b)(96) and 1300-1305).
Bull Hill deposit
estimated measured, indicated, and inferred mineral resources contained in the preliminary open pit design, using a base-case cutoff
grade for resource reporting of 2.18% Total Rare earth Oxide (TREO), are summarized in Table 1-2. The effective date of the Mineral
Resource estimate is 31 December 2023.
| | | |
| Ore Reserves Engineering | Page 1-2 | 29 February 2024 |
Table
1-2. Bull Hill TREO Mineral Resource Summary for the Total Oxide (Ox & OxCa)-31 December 2023
(Noble & Barrero, 2023)
| Resource
Class |
Cutoff
%TREO |
Short
Tons |
Metric
Tonnes |
%TREO |
Contained
TREO
Metric
Tonnes |
Recovered
TREO Metric
Tonnes |
Recovered
NdPr Metric
Tonnes |
| (millions) |
(millions) |
(1000’s) |
(1000’s) |
(1000’s) |
| Measured |
2.18 |
2.25 |
2.04 |
4.53 |
92.4 |
60.6 |
18.4 |
| Indicated |
2.18 |
4.38 |
3.98 |
3.85 |
153.1 |
99.9 |
31.3 |
| Measured &
Indicated (MI) |
2.18 |
6.63 |
6.02 |
4.08 |
245.5 |
160.5 |
49.7 |
| Inferred |
2.18 |
2.09 |
1.90 |
3.61 |
68.5 |
44.9 |
14.4 |
Mineral Resources do not have
demonstrated economic viability. There is no guarantee that any part of the mineral resource will be converted to mineral reserves
in the future.
All figures are rounded to reflect
the accuracy of the grade and tonnage estimates. |
The metallurgical
recoveries, pay factors, and selected commodity price assumptions are shown in Table 1-3. Additional information about these assumptions
is provided in Chapter 11.
Table
1-3. Pay Factors, Hydromet Plant Recoveries, and Rare-Earth Elements Prices (provided by RER, 2023)
| Element |
Pay
Factor |
Hydromet
Plant Recoveries |
Prices
(US $ /Kg) |
| La
(Lanthanun) |
1 |
0.907 |
0.93 |
| Nd
(Neodymium) |
1 |
0.898 |
77.25 |
| Pr
(Praseodymium) |
1 |
0.902 |
76.48 |
| Dy
(Dysprosium) |
0.75 |
0.835 |
320 |
| *HREE
(Yb+Tm+Tb+Er+Ho+Lu) |
0.5 |
0.816 |
1200 |
| Ce
(Cerium) |
0 |
0.336 |
0 |
| Sm
(Samarium) |
0 |
0.912 |
0 |
| Eu
(Europium) |
0 |
0.913 |
0 |
| Gd
(Gadolinium) |
0 |
0.924 |
0 |
| Y
(Ytrrium) |
0 |
0.788 |
0 |
*HREE (Heavy
Rare Earth Elements) = Ytterbium (Yb)+Thulium (Tm)+ Terbium (Tb)+ Erbium (Er)+Holmium (Ho)+Lutetium (Lu)
| 1.5 | Summary
of Capital and Operating Cost Estimates |
Capital costs for
the Bear Lodge REE Project have not been estimated.
Operating mining
and processing cost estimates have been provided by RER and are factored from 2019 cost data, and contractor estimated costs. These operating
costs have been used as input parameters to analyze the economic pit limits to estimate the mineral resources. In the Qualified Persons’
opinion, these costs are considered reasonable for establishing the prospects of economic extraction for mineral resources at the time
of reporting.
| | | |
| Ore Reserves Engineering | Page 1-3 | 29 February 2024 |
| 1.6 | Processing
and Recovery Methods |
RER is proceeding
with the construction of a rare earth processing and separation demonstration plant. The demonstration plant is scheduled to be in operation
in 3rd Quarter of 2024. It is expected to advance RER’s proprietary processing and separation technology and generate the operational
and economic data necessary for the design of a commercial-scale facility.
| 1.7 | Permitting
Requirements |
RER will be required
to obtain permits and licenses to further develop the Bear Lodge REE Project from the United States Forest Service (USFS), the Wyoming
Department of Environmental Quality Land Quality Division (WDEQ-LQD), and the US Nuclear Regulatory Commission (NRC). In accordance with
RER’s Environmental, Health, and Safety Policy. RER will comply with applicable federal, state, and local environmental statutes,
standards, regulations, and guidelines under the National Environmental Policy Act (NEPA) for permitting and licensing of the Bear Lodge
REE Project.
| 1.8 | Qualified
Persons’ Conclusions and Recommendations |
The present Mineral
Resource estimate includes an update of the Bull Hill deposit oxide zones (Ox and OxCa) for more selective mining and a more conservative
resource classification criteria.
Based on the available
data and the analysis presented in this TRS, the resource block model has been validated using accepted industry methods. At the time
of reporting, the Mineral Resource summarized within the resulting preliminary pit design is considered to have reasonable prospects
for eventual economic extraction by open pit methods. Mineral resources are estimated from the current topography and are dated 31 December 2023.
The Mineral Resource
estimates are sensitive to commodity prices, operating and processing costs, and metallurgical recoveries, which directly affect the
cutoff grade. Additionally, the Lerchs-Grossmann (LG) analysis of economic pit limits and the subsequent pit design summarizing the mineral
resource are sensitive to the slope pit design parameters used.
Additional opportunities
exist, such as the potential to convert current inferred mineral resources into indicated and measured resources within the present pit
limits.
Furthermore, the
limits of the REE-mineralized system on the Bear Lodge property have yet to be determined; there is significant REE mineralization at
Whitetail, and important REE mineralization has been identified in the sulfide zone, both of which may be economical but are not examined
in this TRS.
A Demonstration
Plant, which is expected to be operational in the 3rd Quarter of 2024, will provide the necessary design criteria for a larger commercial-scale
facility and has the potential to reduce costs and improve metallurgical performance and product quality, positively affecting the project
economics. On the other hand, if the operation of the plant is unsuccessful or experiences technical problems, this would have a material
adverse effect on RER economics, funding, and future development plans.
| | | |
| Ore Reserves Engineering | Page 1-4 | 29 February 2024 |
| 2.1 | Details
of the Registrant |
This Technical
Report Summary (TRS) was prepared in accordance with Regulation S-K (CFR Title 17 Part 229 Items 601(b)(96) and 1300-1305) promulgated
by the Securities and Exchange Commission (SEC). This TRS was prepared for Rare Element Resources, Inc. (RER).
| 2.2 | Purpose
and Terms of Reference |
The purpose of
this TRS is to report Mineral Resource estimates for the oxide portion of the Bull Hill deposit, Bear Lodge REE Project. Several Qualified
Persons, as noted on the signature page, are responsible for authoring this TRS on behalf of RER; they are:
| · | Mr. Alan
C. Noble, P.E. |
| · | Ms. Monica
Barrero Bouza, EurGeol. |
| · | Mr. Jaye
Pickarts, P. E., Q.P. |
The effective date
of this TRS is 29 February 2024, while the effective date of the Mineral Resource estimate was 31 December 2023. In the Qualified
Persons’ opinion, no known material changes could materially affect the Mineral Resource estimates from 31 December 2023 and
the time of reporting.
Mr. Alan C.
Noble, P.E. of Ore Reserves Engineering, and Ms. Monica Barrero Bouza EurGeol visited the Bear Lodge REE Project on November 9-10,
2023. During the visit, they both toured the property area, core logging, and core storage facilities, reviewed site conditions and inspected
representative drill cores from the Bull Hill deposit.
Mr. Jaye T.
Pickarts, P.E., Q.P. is an independent consultant and former Chief Operating Officer for Rare Element Resources, Inc. Mr. Pickarts
visited the site with Mr. Noble and Ms. Barrero Bouza on November 9-10, 2023.
Mr. Alan C.
Noble, P.E., and Ms. Monica Barrero Bouza, EurGeol, are responsible for the preparation of the Mineral Resource estimate provided
in this TRS. Mr. Jaye Pickarts, P.E., Q.P., is responsible for the review and preparation of the metallurgical, processing, recovery,
and environmental sections of this report. They are independent Qualified Persons as described in Subpart §229.1300 of Regulation
S-K, have extensive experience in the mining industry, and have conducted this work as independent consulting engineers and geologists.
| 2.3 | Sources
of Information |
Much of the information
and data used in the development of this report was provided by RER (electronic data files containing geologic interpretations, drill
hole data, and surface topography) and existing previous Technical Reports completed from 2009 to 2014 and prepared on behalf of RER
in accordance with Form 43-101F1 and CIM Definition Standards for Mineral Resources and Mineral Reserves. A detailed list of the
technical reports mentioned is included in Section 24 of this TRS.
| | | |
| Ore Reserves Engineering | Page 2-1 | 29 February 2024 |
According to SEC's
Regulation S-K, this is the first TRS filed for the Bear Lodge REE Project.
| 2.4 | Units of Measure, Abbreviations,
Acronyms, and Symbols |
This TRS uses a
combination of the System International (SI or metric) and US Customary Units of measure. Ore grades are presented in weight percent
(wt.%) or part per million (ppm), while tonnages are stated in US Short Tons (or Tons), and product quantities are stated in Metric Tonnes
(or Tonnes). Unless otherwise noted, the primary linear distance units are feet (ft) or miles.
Currency units
are in U.S. dollars (US $), and rare earth element prices are in US $ per Kilogram (US $/Kg). All costs are presented in U.S. dollars
(US $).
Geographic coordinates
in this TRS are projected in the Universal Transverse Mercator (UTM) system relative to Zone 13 North (13N) of the geometric horizontal
North American Datum of 1983 (NAD83) and North American Vertical Datum of 1988 (NAVD88), in U.S. Survey feet or in metric units of measure
(meters).
TREO means Total
Rare Earth Oxide (expressed in wt.%) and represents the total of fourteen (14) individually assayed rare earth element oxides plus yttrium
oxide: La2O3, Ce2O3, Pr2O3, Nd2O3, Sm2O3,
Eu2O3, Gd2O3, Tb2O3, Dy2O3, Ho2O3,
Er2O3, Tm2O3, Yb2O3, Lu2O3, and Y2O3.
The list of REE elements is included in Table 2-1; all of them are incorporated in the 2023 Final Critical Materials List determined
by the U.S. Department of Energy (U. S. Department of Energy (DOE), 2023).
Table
2-1. List of fourteen (14) Rare Earth elements and Yttrium. Light Rare Earth Elements (LREE) include
La, Ce, Pr, Nd, and Sm, the others are Heavy Rare Earth Elements (HREE)
| Element |
Symbol |
Molecular |
Oxide |
Molecular |
Ratio |
| REE |
Wt |
Wt |
REE/TREO |
| Lanthanum |
La |
138.905 |
La2O3 |
325.8082 |
0.8527 |
| Cerium |
Ce |
140.116 |
Ce2O3 |
328.2302 |
0.8538 |
| Cerium |
Ce |
140.116 |
CeO2 |
172.1148 |
0.8141 |
| Praseodymium* |
Pr |
140.908 |
Pr2O3 |
329.8142 |
0.8545 |
| Neodymium |
Nd |
144.242 |
Nd2O3 |
336.4822 |
0.8574 |
| Samarium |
Sm |
150.36 |
Sm2O3 |
348.7182 |
0.8624 |
| Europium |
Eu |
151.964 |
Eu2O3 |
351.9262 |
0.8636 |
| Gadolinium |
Gd |
157.25 |
Gd2O3 |
362.4982 |
0.8676 |
| Terbium |
Tb |
158.925 |
Tb2O3 |
365.8482 |
0.8688 |
| Dysprosium |
Dy |
162.5 |
Dy2O3 |
372.9982 |
0.8713 |
| Holmium |
Ho |
164.93 |
Ho2O3 |
377.8582 |
0.873 |
| Erbium |
Er |
167.259 |
Er2O3 |
382.5162 |
0.8745 |
| Thulium |
Tm |
168.934 |
Tm2O3 |
385.8662 |
0.8756 |
| Ytterbium |
Yb |
173.054 |
Yb2O3 |
394.1062 |
0.8782 |
| Lutetium |
Lu |
174.967 |
Lu2O3 |
397.9322 |
0.8794 |
| Yttrium |
Y |
88.906 |
Y2O3 |
225.8102 |
0.7874 |
| | | |
| Ore Reserves Engineering | Page 2-2 | 29 February 2024 |
The acronyms and
abbreviations used in this TRS are listed in Table 2-2 and in Table 2-3.
Table
2-2. Acronyms used in this TRS
| ACRONYM |
Definition |
| BLM |
Bureau
of Land Management |
| CRS |
Coordinate
Reference System |
| CSAMT |
Controlled-Source
Audio-Magnetotelluric Technique |
| DDH |
Diamond
Drill Hole |
| DEM |
Digital
Elevation Model |
| DH |
Drill
Hole |
| EPSG |
European
Petroleum Survey Group |
| FMR |
FeOx
(Iron Oxides)-MnOx (Manganese Oxides)-REE (Rare earths) |
| HREE
or HREE |
Heavy
Rare Earth Elements |
| ICP-OES
|
Inductively
Coupled Plasma-Optical Emission Spectroscopy |
| IP |
Induced
Polarization; geophysical method |
| LREE
or LREEs |
Light
Rare Earth Elements |
| NAD |
North
American Datum |
| NAVD
|
North
American Vertical Datum |
| NRC |
US
Nuclear Regulatory Commission |
| NURE |
Natural
Uranium Resource Evaluation Aeromagnetic Data |
| RC |
Reverse
Circulation Holes |
| REE
or REEs |
Rare
Earth Elements/Metals |
| RSD |
Relative
Standard Deviation |
| TEM |
Time
Domain/Transient Electromagnetic; geophysical method |
| TREO |
Average
percent total rare earth oxide |
| USBM |
US
Bureau of Mines |
| USFS |
US
Forest Service |
| USGS |
US
Geological Survey |
| UTM |
Universal
Transverse Mercator geographic coordinate system |
| | | |
| Ore Reserves Engineering | Page 2-3 | 29 February 2024 |
Table
2-3. Abbreviations and Symbols used in the TRS.
| Abbreviation/Symbol |
Definition |
| $ |
U.S.
dollars |
| US
$/Kg |
U.S.
dollars/Kilogram |
| $/kg |
U.S.
dollars/Kilogram |
| % |
Percent |
| ° |
Degrees |
| °C |
Degrees
Celsius |
| °F |
Degrees
Fahrenheit |
| µm |
Microns |
| Ca |
Calcium
(chemical element) |
| cm |
Centimeter |
| Fe |
Iron
(chemical element) |
| ft |
Feet
(‘) |
| ft² |
Square
feet |
| ft³ |
Cubic
foot |
| g |
Gram |
| g/cc |
Gram
per cubic centimeter |
| h |
Hour |
| kg |
Kilogram |
| km |
Kilometer |
| lb/ft³ |
Pounds
per cubic foot |
| m |
Meter |
| m² |
Square
meter |
| Ma |
Mega-annum
(million years) |
| Mg |
Magnesium
(chemical element) |
| mil |
thousandth
of an inch |
| mL |
Milliliter |
| Mn |
Manganese
(chemical element) |
| mm |
Millimeter |
| oz |
Ounce |
| ppm |
Parts
per million |
| Ra |
Radium
(radioactive chemical element) |
| Th |
Thorium
(radioactive chemical element) |
| ton |
U.S.
short ton |
| tonne |
Metric
tonne |
| USD |
U.
S. dollars |
| wt.
% |
Weight
percent |
| U |
Uranium
(radioactive chemical element) |
| 1000's |
Thousands |
| | | |
| Ore Reserves Engineering | Page 2-4 | 29 February 2024 |
| 3.1.1 | Bear Lodge REE Project |
The Bear Lodge
REE Project is located in Central Crook County, northeastern Wyoming, in the northwestern portion of the Black Hills uplift. The property
is situated in the central Bear Lodge Mountains, a relatively small northwesterly trending range. The project is flanked to the west
by the Powder River Basin, famous for its extensive coal mining, and is adjoined by the Great Plains to the southeast (Figure 3-1).
The Bear Lodge
REE Project lies about 7 air miles (11 kilometers) or 12 road miles (19 kilometers) northwest of the town of Sundance (Wyoming), approximately
22 air miles (35 kilometers) west of the South Dakota state line, 55 air miles (89 kilometers) east of Gillette (Wyoming), and 230 miles
(370 kilometers) north of Cheyenne, the Wyoming state capitol. Gillette is the headquarters for much of the Wyoming coal mining industry.

Figure
3-1. General Property Location Map (Noble & Barrero, 2024).
The approximate
center of the project area is at a longitude of 104 degrees 27 minutes West and a latitude of 44 degrees 30 minutes North (4,927,000N
and 544,000E coordinates in meters, NAD83 UTM zone 13N).
| | | |
| Ore Reserves Engineering | Page 3-1 | 29 February 2024 |
| 3.2 | Property Description and Ownership |
The property is
located within parts of Sections 5, 6, 7, 8, 9, 14, 15, 16, 17, 18, 19, 21, 22, 23, 26, 27, 28, 29, 30, 31, 32, 33, 34 and 35 in Township
52 North and Range 63 West, Sixth Principal Meridian (Figure 3-2).
The property comprises
499 unpatented lode mining claims located on land administered by the USFS, approximately 9,223 acres (3,732 hectares), and a 640-acre
parcel (259 hectares) located in Section 16 for a total of roughly 9,863 acres (3,991 hectares).
Section 16
is owned by Whitelaw Creek LLC.; RER has a re-purchase agreement in place with them once RER has determined the development plans for
the project (Rare Element Resources Inc., 2021). The Bull Hill deposit is located within Section 17 (Figure 3-2).
Rare Element Resources, Inc.
(formerly known as Paso Rico (USA), Inc.), holds a 100% interest in the 499 unpatented mineral claims that constitute the bulk of
the Bear Lodge REE Project area. These claims were, in part, acquired from Phelps Dodge Exploration Company (Phelps Dodge) by way of
a “Mineral Lease and Option for Deed” in 2000, and an additional 327 claims were transferred from Newmont in 2010. Additional
claims were added in 2011. Some of the claims and a portion of a defined area of influence surrounding the claims were subject to a production
royalty of 2% of Net Smelter Returns (NSR) payable to Phelps Dodge (now Freeport McMoRan Corporation), but the royalty was purchased
subsequently by Rare Element Resources, Ltd. in March 2009. In July 2009, Rare Element Resources, Ltd. assigned the
Phelps Dodge royalty to RER and retained the royalty as it applies to the production of rare earth minerals.
| | | |
| Ore Reserves Engineering | Page 3-2 | 29 February 2024 |

Figure
3-2. Detailed Project Land Property Map (Noble & Barrero, 2024).
| | | |
| Ore Reserves Engineering | Page 3-3 | 29 February 2024 |
The Mineral &
Records System of the Bureau of Land Management Website (U.S. Department of Interior) has been consulted, and the information on the
499 mining claims has been downloaded and reviewed. A listing of the RER active mining claims is included in Table 3-1 and shown
graphically in Figure 3-3.
All the mining
claims are unpatented, such that the United States of America holds the paramount ownership and title of the land. All 499 unpatented
claims in the project are located on federal lands and are subject to annual maintenance fees payable to the United States Bureau of
Land Management. Claim maintenance payments and related documents must be filed annually with the Wyoming State Office of the Bureau
of Land Management (BLM) and recorded with the Crook County, Wyoming Clerk, and Recorder to keep the claims from terminating by operation
of law. The claims can be maintained in good standing so long as those requirements are met. Surface usage and access to the claims are
part of the rights held by the owners of mining claims.
To maintain all
claims in good standing, RER is responsible for paying annual federal claim maintenance fees (currently $165/claim) and recording the
annual claim maintenance and intent to hold notice with Crook County (Wyoming). Mineral and surface rights on the mining claims and the
640-acre private parcel allow RER to explore the Bear Lodge property, subject to the prior procurement of required permits and approvals
and compliance with applicable federal, state, and local laws, regulations and ordinances.
RER believes that
all its mining claims are in good standing, and the authors of this report have no reason to believe otherwise and have accepted the
land ownership and control to be as represented.
RER will comply
with all federal, state, and local permit and licensing requirements once the project parameters are better defined.
| | | |
| Ore Reserves Engineering | Page 3-4 | 29 February 2024 |

Figure
3-3. Rare Element Resources Mining Claims Map (Noble & Barrero, 2024).
| | | |
| Ore Reserves Engineering | Page 3-5 | 29 February 2024 |
Table
3-1. Listing of RER Mining Claims (Mineral & Records System of the Bureau of Land Management).
| No. |
Serial
Number |
Legacy
Serial Number |
Legacy
Lead File Number |
Claim
Name |
County |
Claim
Type |
Meridian |
Township |
Range |
Section |
| 1 |
WY101319970 |
WMC275726 |
WMC275664 |
SUN
63 |
CROOK |
LODE
CLAIM |
6 |
0520N |
0630W |
8 |
| 2 |
WY101319971 |
WMC275727 |
WMC275664 |
SUN
64 |
CROOK |
LODE
CLAIM |
6 |
0520N |
0630W |
7 |
| 6 |
0520N |
0630W |
8 |
| 3 |
WY101319972 |
WMC275728 |
WMC275664 |
SUN
65 |
CROOK |
LODE
CLAIM |
6 |
0520N |
0630W |
8 |
| 4 |
WY101319973 |
WMC275729 |
WMC275664 |
SUN
66 |
CROOK |
LODE
CLAIM |
6 |
0520N |
0630W |
7 |
| 6 |
0520N |
0630W |
8 |
| 5 |
WY101319974 |
WMC275730 |
WMC275664 |
SUN
67 |
CROOK |
LODE
CLAIM |
6 |
0520N |
0630W |
8 |
| 6 |
WY101319975 |
WMC275731 |
WMC275664 |
SUN
68 |
CROOK |
LODE
CLAIM |
6 |
0520N |
0630W |
7 |
| 6 |
0520N |
0630W |
8 |
| 7 |
WY101319976 |
WMC275732 |
WMC275664 |
SUN
69 |
CROOK |
LODE
CLAIM |
6 |
0520N |
0630W |
8 |
| 8 |
WY101319977 |
WMC275733 |
WMC275664 |
SUN
70 |
CROOK |
LODE
CLAIM |
6 |
0520N |
0630W |
7 |
| 6 |
0520N |
0630W |
8 |
| 9 |
WY101319978 |
WMC275734 |
WMC275664 |
SUN
71 |
CROOK |
LODE
CLAIM |
6 |
0520N |
0630W |
8 |
| 10 |
WY101319979 |
WMC275735 |
WMC275664 |
SUN
72 |
CROOK |
LODE
CLAIM |
6 |
0520N |
0630W |
7 |
| 6 |
0520N |
0630W |
8 |
| 6 |
0520N |
0630W |
17 |
| 6 |
0520N |
0630W |
18 |
| 11 |
WY101319980 |
WMC275736 |
WMC275664 |
SUN
73 |
CROOK |
LODE
CLAIM |
6 |
0520N |
0630W |
8 |
| 6 |
0520N |
0630W |
17 |
| 12 |
WY101319981 |
WMC275737 |
WMC275664 |
SUN
74 |
CROOK |
LODE
CLAIM |
6 |
0520N |
0630W |
17 |
| 13 |
WY101319982 |
WMC275746 |
WMC275664 |
SUN
83 |
CROOK |
LODE
CLAIM |
6 |
0520N |
0630W |
5 |
| 14 |
WY101319983 |
WMC275748 |
WMC275664 |
SUN
85 |
CROOK |
LODE
CLAIM |
6 |
0520N |
0630W |
5 |
| 15 |
WY101319984 |
WMC275750 |
WMC275664 |
SUN
87 |
CROOK |
LODE
CLAIM |
6 |
0520N |
0630W |
5 |
| 6 |
0520N |
0630W |
8 |
| 16 |
WY101319985 |
WMC275751 |
WMC275664 |
SUN
88 |
CROOK |
LODE
CLAIM |
6 |
0520N |
0630W |
4 |
| 6 |
0520N |
0630W |
5 |
| 6 |
0520N |
0630W |
8 |
| 6 |
0520N |
0630W |
9 |
| 17 |
WY101319986 |
WMC275752 |
WMC275664 |
SUN
89 |
CROOK |
LODE
CLAIM |
6 |
0520N |
0630W |
8 |
| 18 |
WY101319987 |
WMC275753 |
WMC275664 |
SUN
90 |
CROOK |
LODE
CLAIM |
6 |
0520N |
0630W |
8 |
| 6 |
0520N |
0630W |
9 |
| 19 |
WY101319988 |
WMC275754 |
WMC275664 |
SUN
91 |
CROOK |
LODE
CLAIM |
6 |
0520N |
0630W |
8 |
| 20 |
WY101319989 |
WMC275755 |
WMC275664 |
SUN
92 |
CROOK |
LODE
CLAIM |
6 |
0520N |
0630W |
8 |
| 6 |
0520N |
0630W |
9 |
| 21 |
WY101319990 |
WMC275756 |
WMC275664 |
SUN
93 |
CROOK |
LODE
CLAIM |
6 |
0520N |
0630W |
8 |
| 22 |
WY101340373 |
WMC247989 |
WMC247925 |
BL
#65 |
CROOK |
LODE
CLAIM |
6 |
0520N |
0630W |
17 |
| 23 |
WY101340397 |
WMC247996 |
WMC247925 |
BL
#72 |
CROOK |
LODE
CLAIM |
6 |
0520N |
0630W |
17 |
| 24 |
WY101340398 |
WMC249551 |
WMC249536 |
BL
315 |
CROOK |
LODE
CLAIM |
6 |
0520N |
0630W |
21 |
| 25 |
WY101340783 |
WMC247983 |
WMC247925 |
BL
#59 |
CROOK |
LODE
CLAIM |
6 |
0520N |
0630W |
17 |
| 26 |
WY101344576 |
WMC249554 |
WMC249536 |
BL
318 |
CROOK |
LODE
CLAIM |
6 |
0520N |
0630W |
21 |
| 27 |
WY101353276 |
WMC309537 |
WMC309537 |
BL
319A |
CROOK |
LODE
CLAIM |
6 |
0520N |
0630W |
21 |
| 28 |
WY101420800 |
WMC248001 |
WMC247925 |
BL
#77 |
CROOK |
LODE
CLAIM |
6 |
0520N |
0630W |
17 |
| 29 |
WY101422749 |
WMC247988 |
WMC247925 |
BL
#64 |
CROOK |
LODE
CLAIM |
6 |
0520N |
0630W |
17 |
| 30 |
WY101423174 |
WMC249544 |
WMC249536 |
BL
308 |
CROOK |
LODE
CLAIM |
6 |
0520N |
0630W |
21 |
| 31 |
WY101423925 |
WMC249553 |
WMC249536 |
BL
317 |
CROOK |
LODE
CLAIM |
6 |
0520N |
0630W |
21 |
| 32 |
WY101424316 |
WMC249552 |
WMC249536 |
BL
316 |
CROOK |
LODE
CLAIM |
6 |
0520N |
0630W |
21 |
| 33 |
WY101424702 |
WMC249545 |
WMC249536 |
BL
309 |
CROOK |
LODE
CLAIM |
6 |
0520N |
0630W |
21 |
| 34 |
WY101425598 |
WMC247987 |
WMC247925 |
BL
#63 |
CROOK |
LODE
CLAIM |
6 |
0520N |
0630W |
17 |
| 35 |
WY101426718 |
WMC248002 |
WMC247925 |
BL
#78 |
CROOK |
LODE
CLAIM |
6 |
0520N |
0630W |
17 |
| 36 |
WY101455170 |
WMC247984 |
WMC247925 |
BL
#60 |
CROOK |
LODE
CLAIM |
6 |
0520N |
0630W |
17 |
| 37 |
WY101455357 |
WMC247998 |
WMC247925 |
BL
#74 |
CROOK |
LODE
CLAIM |
6 |
0520N |
0630W |
17 |
| 38 |
WY101496708 |
WMC247985 |
WMC247925 |
BL
#61 |
CROOK |
LODE
CLAIM |
6 |
0520N |
0630W |
17 |
| 39 |
WY101498138 |
WMC270185 |
WMC270117 |
DEN
69 |
CROOK |
LODE
CLAIM |
6 |
0520N |
0630W |
29 |
| 6 |
0520N |
0630W |
32 |
| 40 |
WY101498139 |
WMC270186 |
WMC270117 |
DEN
70 |
CROOK |
LODE
CLAIM |
6 |
0520N |
0630W |
31 |
| 6 |
0520N |
0630W |
32 |
| 41 |
WY101498140 |
WMC270187 |
WMC270117 |
DEN
71 |
CROOK |
LODE
CLAIM |
6 |
0520N |
0630W |
29 |
| 6 |
0520N |
0630W |
30 |
| 6 |
0520N |
0630W |
31 |
| 6 |
0520N |
0630W |
32 |
| | | |
| Ore Reserves Engineering | Page 3-6 | 29 February 2024 |
| No. |
Serial
Number |
Legacy
Serial Number |
Legacy
Lead File Number |
Claim
Name |
County |
Claim
Type |
Meridian |
Township |
Range |
Section |
| 42 |
WY101498141 |
WMC270188 |
WMC270117 |
DEN
72 |
CROOK |
LODE
CLAIM |
6 |
0520N |
0630W |
31 |
| 43 |
WY101498142 |
WMC270189 |
WMC270117 |
DEN
73 |
CROOK |
LODE
CLAIM |
6 |
0520N |
0630W |
30 |
| 6 |
0520N |
0630W |
31 |
| 44 |
WY101498143 |
WMC270191 |
WMC270117 |
DEN
75 |
CROOK |
LODE
CLAIM |
6 |
0520N |
0630W |
30 |
| 6 |
0520N |
0630W |
31 |
| 45 |
WY101498144 |
WMC270204 |
WMC270117 |
DEN
88 |
CROOK |
LODE
CLAIM |
6 |
0520N |
0630W |
28 |
| 46 |
WY101498145 |
WMC270205 |
WMC270117 |
DEN
89 |
CROOK |
LODE
CLAIM |
6 |
0520N |
0630W |
28 |
| 47 |
WY101498146 |
WMC270206 |
WMC270117 |
DEN
90 |
CROOK |
LODE
CLAIM |
6 |
0520N |
0630W |
28 |
| 48 |
WY101498147 |
WMC270207 |
WMC270117 |
DEN
91 |
CROOK |
LODE
CLAIM |
6 |
0520N |
0630W |
28 |
| 49 |
WY101498148 |
WMC270208 |
WMC270117 |
DEN
92 |
CROOK |
LODE
CLAIM |
6 |
0520N |
0630W |
28 |
| 50 |
WY101498149 |
WMC270209 |
WMC270117 |
DEN
93 |
CROOK |
LODE
CLAIM |
6 |
0520N |
0630W |
29 |
| 51 |
WY101498150 |
WMC270210 |
WMC270117 |
DEN
94 |
CROOK |
LODE
CLAIM |
6 |
0520N |
0630W |
28 |
| 6 |
0520N |
0630W |
29 |
| 52 |
WY101498151 |
WMC270212 |
WMC270117 |
DEN
96 |
CROOK |
LODE
CLAIM |
6 |
0520N |
0630W |
29 |
| 53 |
WY101498152 |
WMC270213 |
WMC270117 |
DEN
97 |
CROOK |
LODE
CLAIM |
6 |
0520N |
0630W |
29 |
| 54 |
WY101498153 |
WMC270214 |
WMC270117 |
DEN
98 |
CROOK |
LODE
CLAIM |
6 |
0520N |
0630W |
29 |
| 55 |
WY101498154 |
WMC270215 |
WMC270117 |
DEN
99 |
CROOK |
LODE
CLAIM |
6 |
0520N |
0630W |
29 |
| 56 |
WY101498155 |
WMC270216 |
WMC270117 |
DEN
100 |
CROOK |
LODE
CLAIM |
6 |
0520N |
0630W |
29 |
| 57 |
WY101498156 |
WMC270217 |
WMC270117 |
DEN
101 |
CROOK |
LODE
CLAIM |
6 |
0520N |
0630W |
29 |
| 58 |
WY101498157 |
WMC270218 |
WMC270117 |
DEN
102 |
CROOK |
LODE
CLAIM |
6 |
0520N |
0630W |
29 |
| 59 |
WY101498158 |
WMC270219 |
WMC270117 |
DEN
103 |
CROOK |
LODE
CLAIM |
6 |
0520N |
0630W |
29 |
| 60 |
WY101498159 |
WMC270296 |
WMC270117 |
OGDEN
20 |
CROOK |
LODE
CLAIM |
6 |
0520N |
0630W |
21 |
| 6 |
0520N |
0630W |
22 |
| 6 |
0520N |
0630W |
27 |
| 6 |
0520N |
0630W |
28 |
| 61 |
WY101498160 |
WMC270297 |
WMC270117 |
OGDEN
21 |
CROOK |
LODE
CLAIM |
6 |
0520N |
0630W |
22 |
| 6 |
0520N |
0630W |
27 |
| 62 |
WY101498161 |
WMC270298 |
WMC270117 |
OGDEN
22 |
CROOK |
LODE
CLAIM |
6 |
0520N |
0630W |
22 |
| 6 |
0520N |
0630W |
27 |
| 63 |
WY101498162 |
WMC270299 |
WMC270117 |
OGDEN
23 |
CROOK |
LODE
CLAIM |
6 |
0520N |
0630W |
22 |
| 6 |
0520N |
0630W |
27 |
| 64 |
WY101498163 |
WMC270300 |
WMC270117 |
OGDEN
24 |
CROOK |
LODE
CLAIM |
6 |
0520N |
0630W |
22 |
| 6 |
0520N |
0630W |
27 |
| 65 |
WY101498164 |
WMC270301 |
WMC270117 |
OGDEN
25 |
CROOK |
LODE
CLAIM |
6 |
0520N |
0630W |
28 |
| 66 |
WY101498165 |
WMC270302 |
WMC270117 |
OGDEN
26 |
CROOK |
LODE
CLAIM |
6 |
0520N |
0630W |
27 |
| 6 |
0520N |
0630W |
28 |
| 67 |
WY101498166 |
WMC270303 |
WMC270117 |
OGDEN
27 |
CROOK |
LODE
CLAIM |
6 |
0520N |
0630W |
27 |
| 68 |
WY101498167 |
WMC270304 |
WMC270117 |
OGDEN
28 |
CROOK |
LODE
CLAIM |
6 |
0520N |
0630W |
27 |
| 69 |
WY101498168 |
WMC270305 |
WMC270117 |
OGDEN
29 |
CROOK |
LODE
CLAIM |
6 |
0520N |
0630W |
27 |
| 70 |
WY101498169 |
WMC270306 |
WMC270117 |
OGDEN
30 |
CROOK |
LODE
CLAIM |
6 |
0520N |
0630W |
27 |
| 71 |
WY101498170 |
WMC270307 |
WMC270117 |
OGDEN
31 |
CROOK |
LODE
CLAIM |
6 |
0520N |
0630W |
27 |
| 72 |
WY101498171 |
WMC270308 |
WMC270117 |
OGDEN
32 |
CROOK |
LODE
CLAIM |
6 |
0520N |
0630W |
27 |
| 73 |
WY101498172 |
WMC270309 |
WMC270117 |
OGDEN
33 |
CROOK |
LODE
CLAIM |
6 |
0520N |
0630W |
27 |
| 74 |
WY101498173 |
WMC270310 |
WMC270117 |
OGDEN
34 |
CROOK |
LODE
CLAIM |
6 |
0520N |
0630W |
27 |
| 75 |
WY101498174 |
WMC270311 |
WMC270117 |
OGDEN
35 |
CROOK |
LODE
CLAIM |
6 |
0520N |
0630W |
27 |
| 76 |
WY101498175 |
WMC270312 |
WMC270117 |
OGDEN
36 |
CROOK |
LODE
CLAIM |
6 |
0520N |
0630W |
27 |
| 77 |
WY101498176 |
WMC270313 |
WMC270117 |
OGDEN
37 |
CROOK |
LODE
CLAIM |
6 |
0520N |
0630W |
27 |
| 78 |
WY101498177 |
WMC270314 |
WMC270117 |
OGDEN
38 |
CROOK |
LODE
CLAIM |
6 |
0520N |
0630W |
26 |
| 6 |
0520N |
0630W |
27 |
| 79 |
WY101498178 |
WMC270315 |
WMC270117 |
OGDEN
39 |
CROOK |
LODE
CLAIM |
6 |
0520N |
0630W |
26 |
| 80 |
WY101498179 |
WMC270316 |
WMC270117 |
OGDEN
40 |
CROOK |
LODE
CLAIM |
6 |
0520N |
0630W |
26 |
| 81 |
WY101498581 |
WMC270320 |
WMC270117 |
OGDEN
44 |
CROOK |
LODE
CLAIM |
6 |
0520N |
0630W |
27 |
| 82 |
WY101498582 |
WMC270321 |
WMC270117 |
OGDEN
45 |
CROOK |
LODE
CLAIM |
6 |
0520N |
0630W |
27 |
| 83 |
WY101498583 |
WMC270322 |
WMC270117 |
OGDEN
46 |
CROOK |
LODE
CLAIM |
6 |
0520N |
0630W |
27 |
| 84 |
WY101498584 |
WMC270323 |
WMC270117 |
OGDEN
47 |
CROOK |
LODE
CLAIM |
6 |
0520N |
0630W |
27 |
| 85 |
WY101498585 |
WMC270324 |
WMC270117 |
OGDEN
48 |
CROOK |
LODE
CLAIM |
6 |
0520N |
0630W |
26 |
| 6 |
0520N |
0630W |
27 |
| 86 |
WY101498586 |
WMC270325 |
WMC270117 |
OGDEN
49 |
CROOK |
LODE
CLAIM |
6 |
0520N |
0630W |
26 |
| 87 |
WY101498587 |
WMC270326 |
WMC270117 |
OGDEN
50 |
CROOK |
LODE
CLAIM |
6 |
0520N |
0630W |
26 |
| 88 |
WY101498588 |
WMC270330 |
WMC270117 |
OGDEN
54 |
CROOK |
LODE
CLAIM |
6 |
0520N |
0630W |
27 |
| | | |
| Ore Reserves Engineering | Page 3-7 | 29 February 2024 |
| No. |
Serial
Number |
Legacy
Serial Number |
Legacy
Lead File Number |
Claim
Name |
County |
Claim
Type |
Meridian |
Township |
Range |
Section |
| 89 |
WY101498589 |
WMC270331 |
WMC270117 |
OGDEN
55 |
CROOK |
LODE
CLAIM |
6 |
0520N |
0630W |
27 |
| 90 |
WY101498590 |
WMC270332 |
WMC270117 |
OGDEN
56 |
CROOK |
LODE
CLAIM |
6 |
0520N |
0630W |
27 |
| 91 |
WY101498591 |
WMC270333 |
WMC270117 |
OGDEN
57 |
CROOK |
LODE
CLAIM |
6 |
0520N |
0630W |
27 |
| 92 |
WY101498592 |
WMC270334 |
WMC270117 |
OGDEN
58 |
CROOK |
LODE
CLAIM |
6 |
0520N |
0630W |
26 |
| 6 |
0520N |
0630W |
27 |
| 93 |
WY101498593 |
WMC270335 |
WMC270117 |
OGDEN
59 |
CROOK |
LODE
CLAIM |
6 |
0520N |
0630W |
27 |
| 6 |
0520N |
0630W |
34 |
| 94 |
WY101498594 |
WMC270336 |
WMC270117 |
OGDEN
60 |
CROOK |
LODE
CLAIM |
6 |
0520N |
0630W |
27 |
| 6 |
0520N |
0630W |
34 |
| 95 |
WY101498595 |
WMC270337 |
WMC270117 |
OGDEN
61 |
CROOK |
LODE
CLAIM |
6 |
0520N |
0630W |
27 |
| 6 |
0520N |
0630W |
34 |
| 96 |
WY101498596 |
WMC270338 |
WMC270117 |
OGDEN
62 |
CROOK |
LODE
CLAIM |
6 |
0520N |
0630W |
27 |
| 6 |
0520N |
0630W |
34 |
| 97 |
WY101498597 |
WMC270339 |
WMC270117 |
OGDEN
63 |
CROOK |
LODE
CLAIM |
6 |
0520N |
0630W |
26 |
| 6 |
0520N |
0630W |
27 |
| 6 |
0520N |
0630W |
34 |
| 6 |
0520N |
0630W |
35 |
| 98 |
WY101498598 |
WMC270340 |
WMC270117 |
OGDEN
64 |
CROOK |
LODE
CLAIM |
6 |
0520N |
0630W |
33 |
| 99 |
WY101498599 |
WMC270341 |
WMC270117 |
OGDEN
65 |
CROOK |
LODE
CLAIM |
6 |
0520N |
0630W |
33 |
| 100 |
WY101498600 |
WMC270342 |
WMC270117 |
OGDEN
66 |
CROOK |
LODE
CLAIM |
6 |
0520N |
0630W |
33 |
| 6 |
0520N |
0630W |
34 |
| 101 |
WY101498758 |
WMC270343 |
WMC270117 |
OGDEN
67 |
CROOK |
LODE
CLAIM |
6 |
0520N |
0630W |
34 |
| 102 |
WY101499149 |
WMC270220 |
WMC270117 |
DEN
104 |
CROOK |
LODE
CLAIM |
6 |
0520N |
0630W |
29 |
| 103 |
WY101499150 |
WMC270221 |
WMC270117 |
DEN
105 |
CROOK |
LODE
CLAIM |
6 |
0520N |
0630W |
29 |
| 104 |
WY101499151 |
WMC270222 |
WMC270117 |
DEN
106 |
CROOK |
LODE
CLAIM |
6 |
0520N |
0630W |
29 |
| 105 |
WY101499152 |
WMC270223 |
WMC270117 |
DEN
107 |
CROOK |
LODE
CLAIM |
6 |
0520N |
0630W |
29 |
| 106 |
WY101499153 |
WMC270224 |
WMC270117 |
DEN
108 |
CROOK |
LODE
CLAIM |
6 |
0520N |
0630W |
29 |
| 107 |
WY101499154 |
WMC270225 |
WMC270117 |
DEN
109 |
CROOK |
LODE
CLAIM |
6 |
0520N |
0630W |
29 |
| 6 |
0520N |
0630W |
30 |
| 108 |
WY101499155 |
WMC270226 |
WMC270117 |
DEN
110 |
CROOK |
LODE
CLAIM |
6 |
0520N |
0630W |
29 |
| 6 |
0520N |
0630W |
30 |
| 109 |
WY101499156 |
WMC270227 |
WMC270117 |
DEN
111 |
CROOK |
LODE
CLAIM |
6 |
0520N |
0630W |
30 |
| 110 |
WY101499157 |
WMC270228 |
WMC270117 |
DEN
112 |
CROOK |
LODE
CLAIM |
6 |
0520N |
0630W |
30 |
| 111 |
WY101499158 |
WMC270229 |
WMC270117 |
DEN
113 |
CROOK |
LODE
CLAIM |
6 |
0520N |
0630W |
30 |
| 112 |
WY101499159 |
WMC270230 |
WMC270117 |
DEN
114 |
CROOK |
LODE
CLAIM |
6 |
0520N |
0630W |
30 |
| 113 |
WY101499160 |
WMC270231 |
WMC270117 |
DEN
115 |
CROOK |
LODE
CLAIM |
6 |
0520N |
0630W |
30 |
| 114 |
WY101499161 |
WMC270232 |
WMC270117 |
DEN
116 |
CROOK |
LODE
CLAIM |
6 |
0520N |
0630W |
30 |
| 115 |
WY101499162 |
WMC270233 |
WMC270117 |
DEN
117 |
CROOK |
LODE
CLAIM |
6 |
0520N |
0630W |
30 |
| 116 |
WY101499163 |
WMC270234 |
WMC270117 |
DEN
118 |
CROOK |
LODE
CLAIM |
6 |
0520N |
0630W |
30 |
| 117 |
WY101499164 |
WMC270243 |
WMC270117 |
DEN
127 |
CROOK |
LODE
CLAIM |
6 |
0520N |
0630W |
29 |
| 6 |
0520N |
0630W |
30 |
| 118 |
WY101499165 |
WMC270244 |
WMC270117 |
DEN
128 |
CROOK |
LODE
CLAIM |
6 |
0520N |
0630W |
30 |
| 119 |
WY101499166 |
WMC270245 |
WMC270117 |
DEN
129 |
CROOK |
LODE
CLAIM |
6 |
0520N |
0630W |
30 |
| 120 |
WY101499167 |
WMC270246 |
WMC270117 |
DEN
130 |
CROOK |
LODE
CLAIM |
6 |
0520N |
0630W |
19 |
| 6 |
0520N |
0630W |
30 |
| 121 |
WY101499168 |
WMC270247 |
WMC270117 |
DEN
131 |
CROOK |
LODE
CLAIM |
6 |
0520N |
0630W |
30 |
| 122 |
WY101499169 |
WMC270248 |
WMC270117 |
DEN
132 |
CROOK |
LODE
CLAIM |
6 |
0520N |
0630W |
19 |
| 6 |
0520N |
0630W |
30 |
| 123 |
WY101499731 |
WMC270344 |
WMC270117 |
OGDEN
68 |
CROOK |
LODE
CLAIM |
6 |
0520N |
0630W |
34 |
| 124 |
WY101499732 |
WMC270345 |
WMC270117 |
OGDEN
69 |
CROOK |
LODE
CLAIM |
6 |
0520N |
0630W |
34 |
| 125 |
WY101499733 |
WMC270346 |
WMC270117 |
OGDEN
70 |
CROOK |
LODE
CLAIM |
6 |
0520N |
0630W |
34 |
| 126 |
WY101499734 |
WMC270347 |
WMC270117 |
OGDEN
71 |
CROOK |
LODE
CLAIM |
6 |
0520N |
0630W |
34 |
| 127 |
WY101499735 |
WMC270348 |
WMC270117 |
OGDEN
72 |
CROOK |
LODE
CLAIM |
6 |
0520N |
0630W |
34 |
| 128 |
WY101499736 |
WMC270349 |
WMC270117 |
OGDEN
73 |
CROOK |
LODE
CLAIM |
6 |
0520N |
0630W |
34 |
| 129 |
WY101499737 |
WMC270350 |
WMC270117 |
OGDEN
74 |
CROOK |
LODE
CLAIM |
6 |
0520N |
0630W |
34 |
| 6 |
0520N |
0630W |
35 |
| 130 |
WY101499738 |
WMC270351 |
WMC270117 |
OGDEN
75 |
CROOK |
LODE
CLAIM |
6 |
0520N |
0630W |
21 |
| 131 |
WY101499739 |
WMC270352 |
WMC270117 |
OGDEN
76 |
CROOK |
LODE
CLAIM |
6 |
0520N |
0630W |
21 |
| 132 |
WY101499740 |
WMC270353 |
WMC270117 |
OGDEN
77 |
CROOK |
LODE
CLAIM |
6 |
0520N |
0630W |
21 |
| 6 |
0520N |
0630W |
28 |
| | | |
| Ore Reserves Engineering | Page 3-8 | 29 February 2024 |
| No. |
Serial
Number |
Legacy
Serial Number |
Legacy
Lead File Number |
Claim
Name |
County |
Claim
Type |
Meridian |
Township |
Range |
Section |
| 133 |
WY101499741 |
WMC270354 |
WMC270117 |
OGDEN
78 |
CROOK |
LODE
CLAIM |
6 |
0520N |
0630W |
21 |
| 6 |
0520N |
0630W |
28 |
| 134 |
WY101499742 |
WMC270355 |
WMC270117 |
OGDEN
79 |
CROOK |
LODE
CLAIM |
6 |
0520N |
0630W |
28 |
| 135 |
WY101499743 |
WMC270356 |
WMC270117 |
OGDEN
80 |
CROOK |
LODE
CLAIM |
6 |
0520N |
0630W |
28 |
| 136 |
WY101499744 |
WMC270357 |
WMC270117 |
OGDEN
81 |
CROOK |
LODE
CLAIM |
6 |
0520N |
0630W |
21 |
| 137 |
WY101499745 |
WMC270358 |
WMC270117 |
OGDEN
82 |
CROOK |
LODE
CLAIM |
6 |
0520N |
0630W |
21 |
| 6 |
0520N |
0630W |
22 |
| 138 |
WY101499746 |
WMC270359 |
WMC270117 |
OGDEN
83 |
CROOK |
LODE
CLAIM |
6 |
0520N |
0630W |
21 |
| 6 |
0520N |
0630W |
28 |
| 139 |
WY101499747 |
WMC270360 |
WMC270117 |
OGDEN
84 |
CROOK |
LODE
CLAIM |
6 |
0520N |
0630W |
21 |
| 140 |
WY101499748 |
WMC270361 |
WMC270117 |
OGDEN
85 |
CROOK |
LODE
CLAIM |
6 |
0520N |
0630W |
21 |
| 141 |
WY101502924 |
WMC305380 |
WMC305380 |
COLE
61 |
CROOK |
LODE
CLAIM |
6 |
0520N |
0630W |
15 |
| 6 |
0520N |
0630W |
22 |
| 142 |
WY101502925 |
WMC305381 |
WMC305380 |
COLE
61A |
CROOK |
LODE
CLAIM |
6 |
0520N |
0630W |
15 |
| 6 |
0520N |
0630W |
22 |
| 143 |
WY101502926 |
WMC305382 |
WMC305380 |
COLE
62 |
CROOK |
LODE
CLAIM |
6 |
0520N |
0630W |
15 |
| 144 |
WY101502927 |
WMC305383 |
WMC305380 |
COLE
62A |
CROOK |
LODE
CLAIM |
6 |
0520N |
0630W |
15 |
| 145 |
WY101502928 |
WMC305384 |
WMC305380 |
SUN
117 |
CROOK |
LODE
CLAIM |
6 |
0520N |
0630W |
9 |
| 6 |
0520N |
0630W |
16 |
| 146 |
WY101503439 |
WMC247997 |
WMC247925 |
BL
#73 |
CROOK |
LODE
CLAIM |
6 |
0520N |
0630W |
17 |
| 147 |
WY101511136 |
WMC275672 |
WMC275664 |
SUN
9 |
CROOK |
LODE
CLAIM |
6 |
0520N |
0630W |
7 |
| 6 |
0520N |
0640W |
12 |
| 148 |
WY101511137 |
WMC275673 |
WMC275664 |
SUN
10 |
CROOK |
LODE
CLAIM |
6 |
0520N |
0630W |
7 |
| 6 |
0520N |
0640W |
12 |
| 149 |
WY101511138 |
WMC275674 |
WMC275664 |
SUN
11 |
CROOK |
LODE
CLAIM |
6 |
0520N |
0630W |
7 |
| 6 |
0520N |
0640W |
12 |
| 150 |
WY101511139 |
WMC275675 |
WMC275664 |
SUN
12 |
CROOK |
LODE
CLAIM |
6 |
0520N |
0630W |
7 |
| 6 |
0520N |
0640W |
12 |
| 151 |
WY101511140 |
WMC275757 |
WMC275664 |
SUN
94 |
CROOK |
LODE
CLAIM |
6 |
0520N |
0630W |
8 |
| 6 |
0520N |
0630W |
9 |
| 152 |
WY101511141 |
WMC275758 |
WMC275664 |
SUN
95 |
CROOK |
LODE
CLAIM |
6 |
0520N |
0630W |
8 |
| 153 |
WY101511142 |
WMC275759 |
WMC275664 |
SUN
96 |
CROOK |
LODE
CLAIM |
6 |
0520N |
0630W |
8 |
| 6 |
0520N |
0630W |
9 |
| 154 |
WY101511143 |
WMC275760 |
WMC275664 |
SUN
97 |
CROOK |
LODE
CLAIM |
6 |
0520N |
0630W |
8 |
| 155 |
WY101511144 |
WMC275761 |
WMC275664 |
SUN
98 |
CROOK |
LODE
CLAIM |
6 |
0520N |
0630W |
8 |
| 6 |
0520N |
0630W |
9 |
| 156 |
WY101511145 |
WMC275762 |
WMC275664 |
SUN
99 |
CROOK |
LODE
CLAIM |
6 |
0520N |
0630W |
8 |
| 157 |
WY101511146 |
WMC275763 |
WMC275664 |
SUN
100 |
CROOK |
LODE
CLAIM |
6 |
0520N |
0630W |
8 |
| 6 |
0520N |
0630W |
9 |
| 158 |
WY101511147 |
WMC275764 |
WMC275664 |
SUN
101 |
CROOK |
LODE
CLAIM |
6 |
0520N |
0630W |
8 |
| 159 |
WY101511148 |
WMC275765 |
WMC275664 |
SUN
102 |
CROOK |
LODE
CLAIM |
6 |
0520N |
0630W |
8 |
| 6 |
0520N |
0630W |
9 |
| 160 |
WY101511149 |
WMC275766 |
WMC275664 |
SUN
103 |
CROOK |
LODE
CLAIM |
6 |
0520N |
0630W |
8 |
| 161 |
WY101511150 |
WMC275767 |
WMC275664 |
SUN
104 |
CROOK |
LODE
CLAIM |
6 |
0520N |
0630W |
8 |
| 6 |
0520N |
0630W |
9 |
| 162 |
WY101511151 |
WMC275768 |
WMC275664 |
SUN
105 |
CROOK |
LODE
CLAIM |
6 |
0520N |
0630W |
8 |
| 6 |
0520N |
0630W |
17 |
| 163 |
WY101511152 |
WMC275769 |
WMC275664 |
SUN
106 |
CROOK |
LODE
CLAIM |
6 |
0520N |
0630W |
8 |
| 6 |
0520N |
0630W |
9 |
| 6 |
0520N |
0630W |
16 |
| 6 |
0520N |
0630W |
17 |
| 164 |
WY101511153 |
WMC275770 |
WMC275664 |
SUN
107 |
CROOK |
LODE
CLAIM |
6 |
0520N |
0630W |
17 |
| 165 |
WY101511154 |
WMC275771 |
WMC275664 |
SUN
108 |
CROOK |
LODE
CLAIM |
6 |
0520N |
0630W |
16 |
| 6 |
0520N |
0630W |
17 |
| 166 |
WY101511155 |
WMC275772 |
WMC275664 |
SUN
109 |
CROOK |
LODE
CLAIM |
6 |
0520N |
0630W |
9 |
| 167 |
WY101511156 |
WMC275773 |
WMC275664 |
SUN
110 |
CROOK |
LODE
CLAIM |
6 |
0520N |
0630W |
9 |
| 168 |
WY101511157 |
WMC275774 |
WMC275664 |
SUN
111 |
CROOK |
LODE
CLAIM |
6 |
0520N |
0630W |
9 |
| 169 |
WY101511158 |
WMC275775 |
WMC275664 |
SUN
112 |
CROOK |
LODE
CLAIM |
6 |
0520N |
0630W |
9 |
| 170 |
WY101511159 |
WMC275776 |
WMC275664 |
SUN
113 |
CROOK |
LODE
CLAIM |
6 |
0520N |
0630W |
9 |
| 171 |
WY101511160 |
WMC275777 |
WMC275664 |
SUN
114 |
CROOK |
LODE
CLAIM |
6 |
0520N |
0630W |
9 |
| 172 |
WY101512289 |
WMC275778 |
WMC275664 |
SUN
115 |
CROOK |
LODE
CLAIM |
6 |
0520N |
0630W |
9 |
| | | |
| Ore Reserves Engineering | Page 3-9 | 29 February 2024 |
| No. |
Serial
Number |
Legacy
Serial Number |
Legacy
Lead File Number |
Claim
Name |
County |
Claim
Type |
Meridian |
Township |
Range |
Section |
| 173 |
WY101512290 |
WMC275779 |
WMC275664 |
SUN
116 |
CROOK |
LODE
CLAIM |
6 |
0520N |
0630W |
7 |
| 174 |
WY101513436 |
WMC275676 |
WMC275664 |
SUN
13 |
CROOK |
LODE
CLAIM |
6 |
0520N |
0630W |
7 |
| 6 |
0520N |
0640W |
12 |
| 175 |
WY101513437 |
WMC275677 |
WMC275664 |
SUN
14 |
CROOK |
LODE
CLAIM |
6 |
0520N |
0630W |
7 |
| 6 |
0520N |
0640W |
12 |
| 176 |
WY101513438 |
WMC275678 |
WMC275664 |
SUN
15 |
CROOK |
LODE
CLAIM |
6 |
0520N |
0630W |
7 |
| 6 |
0520N |
0640W |
12 |
| 6 |
0520N |
0640W |
13 |
| 177 |
WY101513439 |
WMC275679 |
WMC275664 |
SUN
16 |
CROOK |
LODE
CLAIM |
6 |
0520N |
0630W |
7 |
| 6 |
0520N |
0630W |
18 |
| 6 |
0520N |
0640W |
13 |
| 178 |
WY101513440 |
WMC275680 |
WMC275664 |
SUN
17 |
CROOK |
LODE
CLAIM |
6 |
0520N |
0630W |
7 |
| 6 |
0520N |
0630W |
18 |
| 179 |
WY101513441 |
WMC275697 |
WMC275664 |
SUN
34 |
CROOK |
LODE
CLAIM |
6 |
0520N |
0630W |
7 |
| 180 |
WY101513442 |
WMC275698 |
WMC275664 |
SUN
35 |
CROOK |
LODE
CLAIM |
6 |
0520N |
0630W |
7 |
| 181 |
WY101513443 |
WMC275699 |
WMC275664 |
SUN
36 |
CROOK |
LODE
CLAIM |
6 |
0520N |
0630W |
7 |
| 182 |
WY101513444 |
WMC275700 |
WMC275664 |
SUN
37 |
CROOK |
LODE
CLAIM |
6 |
0520N |
0630W |
7 |
| 183 |
WY101513445 |
WMC275701 |
WMC275664 |
SUN
38 |
CROOK |
LODE
CLAIM |
6 |
0520N |
0630W |
7 |
| 184 |
WY101513446 |
WMC275702 |
WMC275664 |
SUN
39 |
CROOK |
LODE
CLAIM |
6 |
0520N |
0630W |
7 |
| 185 |
WY101513447 |
WMC275703 |
WMC275664 |
SUN
40 |
CROOK |
LODE
CLAIM |
6 |
0520N |
0630W |
7 |
| 186 |
WY101513448 |
WMC275704 |
WMC275664 |
SUN
41 |
CROOK |
LODE
CLAIM |
6 |
0520N |
0630W |
7 |
| 187 |
WY101513449 |
WMC275716 |
WMC275664 |
SUN
53 |
CROOK |
LODE
CLAIM |
6 |
0520N |
0630W |
5 |
| 188 |
WY101513450 |
WMC275718 |
WMC275664 |
SUN
55 |
CROOK |
LODE
CLAIM |
6 |
0520N |
0630W |
5 |
| 6 |
0520N |
0630W |
8 |
| 189 |
WY101513451 |
WMC275720 |
WMC275664 |
SUN
57 |
CROOK |
LODE
CLAIM |
6 |
0520N |
0630W |
8 |
| 190 |
WY101513452 |
WMC275721 |
WMC275664 |
SUN
58 |
CROOK |
LODE
CLAIM |
6 |
0520N |
0630W |
7 |
| 6 |
0520N |
0630W |
8 |
| 191 |
WY101513453 |
WMC275722 |
WMC275664 |
SUN
59 |
CROOK |
LODE
CLAIM |
6 |
0520N |
0630W |
8 |
| 192 |
WY101513454 |
WMC275723 |
WMC275664 |
SUN
60 |
CROOK |
LODE
CLAIM |
6 |
0520N |
0630W |
7 |
| 6 |
0520N |
0630W |
8 |
| 193 |
WY101513455 |
WMC275724 |
WMC275664 |
SUN
61 |
CROOK |
LODE
CLAIM |
6 |
0520N |
0630W |
8 |
| 194 |
WY101513456 |
WMC275725 |
WMC275664 |
SUN
62 |
CROOK |
LODE
CLAIM |
6 |
0520N |
0630W |
7 |
| 6 |
0520N |
0630W |
8 |
| 195 |
WY101520752 |
WMC270117 |
WMC270117 |
DEN
1 |
CROOK |
LODE
CLAIM |
6 |
0520N |
0630W |
26 |
| 196 |
WY101520753 |
WMC270122 |
WMC270117 |
DEN
6 |
CROOK |
LODE
CLAIM |
6 |
0520N |
0630W |
26 |
| 6 |
0520N |
0630W |
35 |
| 197 |
WY101520754 |
WMC270138 |
WMC270117 |
DEN
22 |
CROOK |
LODE
CLAIM |
6 |
0510N |
0630W |
3 |
| 198 |
WY101520755 |
WMC270145 |
WMC270117 |
DEN
29 |
CROOK |
LODE
CLAIM |
6 |
0510N |
0630W |
3 |
| 199 |
WY101520756 |
WMC270152 |
WMC270117 |
DEN
36 |
CROOK |
LODE
CLAIM |
6 |
0520N |
0630W |
32 |
| 200 |
WY101520757 |
WMC270156 |
WMC270117 |
DEN
40 |
CROOK |
LODE
CLAIM |
6 |
0520N |
0630W |
33 |
| 201 |
WY101520758 |
WMC270157 |
WMC270117 |
DEN
41 |
CROOK |
LODE
CLAIM |
6 |
0520N |
0630W |
28 |
| 6 |
0520N |
0630W |
33 |
| 202 |
WY101520759 |
WMC270158 |
WMC270117 |
DEN
42 |
CROOK |
LODE
CLAIM |
6 |
0520N |
0630W |
33 |
| 203 |
WY101520760 |
WMC270159 |
WMC270117 |
DEN
43 |
CROOK |
LODE
CLAIM |
6 |
0520N |
0630W |
28 |
| 6 |
0520N |
0630W |
33 |
| 204 |
WY101520761 |
WMC270160 |
WMC270117 |
DEN
44 |
CROOK |
LODE
CLAIM |
6 |
0520N |
0630W |
33 |
| 205 |
WY101520762 |
WMC270161 |
WMC270117 |
DEN
45 |
CROOK |
LODE
CLAIM |
6 |
0520N |
0630W |
28 |
| 6 |
0520N |
0630W |
33 |
| 206 |
WY101520763 |
WMC270162 |
WMC270117 |
DEN
46 |
CROOK |
LODE
CLAIM |
6 |
0520N |
0630W |
33 |
| 207 |
WY101520764 |
WMC270163 |
WMC270117 |
DEN
47 |
CROOK |
LODE
CLAIM |
6 |
0520N |
0630W |
28 |
| 6 |
0520N |
0630W |
33 |
| 208 |
WY101521155 |
WMC268910 |
WMC268910 |
COLE
63 |
CROOK |
LODE
CLAIM |
6 |
0520N |
0630W |
22 |
| 209 |
WY101521156 |
WMC268911 |
WMC268910 |
COLE
64 |
CROOK |
LODE
CLAIM |
6 |
0520N |
0630W |
22 |
| 210 |
WY101521157 |
WMC268912 |
WMC268910 |
COLE
65 |
CROOK |
LODE
CLAIM |
6 |
0520N |
0630W |
22 |
| 211 |
WY101521158 |
WMC268913 |
WMC268910 |
COLE
66 |
CROOK |
LODE
CLAIM |
6 |
0520N |
0630W |
22 |
| 212 |
WY101521159 |
WMC268914 |
WMC268910 |
COLE
67 |
CROOK |
LODE
CLAIM |
6 |
0520N |
0630W |
22 |
| 213 |
WY101521160 |
WMC268915 |
WMC268910 |
COLE
68 |
CROOK |
LODE
CLAIM |
6 |
0520N |
0630W |
22 |
| 214 |
WY101521161 |
WMC268916 |
WMC268910 |
COLE
69 |
CROOK |
LODE
CLAIM |
6 |
0520N |
0630W |
22 |
| 215 |
WY101521162 |
WMC268917 |
WMC268910 |
COLE
70 |
CROOK |
LODE
CLAIM |
6 |
0520N |
0630W |
22 |
| | | |
| Ore Reserves Engineering | Page 3-10 | 29 February 2024 |
| No. |
Serial
Number |
Legacy
Serial Number |
Legacy
Lead File Number |
Claim
Name |
County |
Claim
Type |
Meridian |
Township |
Range |
Section |
| 216 |
WY101521163 |
WMC268918 |
WMC268910 |
COLE
71 |
CROOK |
LODE
CLAIM |
6 |
0520N |
0630W |
21 |
| 6 |
0520N |
0630W |
22 |
| 217 |
WY101521291 |
WMC270249 |
WMC270117 |
DEN
133 |
CROOK |
LODE
CLAIM |
6 |
0520N |
0630W |
30 |
| 218 |
WY101521292 |
WMC270250 |
WMC270117 |
DEN
134 |
CROOK |
LODE
CLAIM |
6 |
0520N |
0630W |
19 |
| 6 |
0520N |
0630W |
30 |
| 219 |
WY101521293 |
WMC270251 |
WMC270117 |
DEN
135 |
CROOK |
LODE
CLAIM |
6 |
0520N |
0630W |
30 |
| 220 |
WY101521294 |
WMC270252 |
WMC270117 |
DEN
136 |
CROOK |
LODE
CLAIM |
6 |
0520N |
0630W |
19 |
| 6 |
0520N |
0630W |
30 |
| 221 |
WY101521295 |
WMC270253 |
WMC270117 |
DEN
137 |
CROOK |
LODE
CLAIM |
6 |
0520N |
0630W |
30 |
| 222 |
WY101521296 |
WMC270254 |
WMC270117 |
DEN
138 |
CROOK |
LODE
CLAIM |
6 |
0520N |
0630W |
19 |
| 6 |
0520N |
0630W |
30 |
| 223 |
WY101521297 |
WMC270256 |
WMC270117 |
DEN
140 |
CROOK |
LODE
CLAIM |
6 |
0520N |
0630W |
19 |
| 6 |
0520N |
0630W |
30 |
| 224 |
WY101521298 |
WMC270259 |
WMC270117 |
DEN
143 |
CROOK |
LODE
CLAIM |
6 |
0520N |
0630W |
19 |
| 225 |
WY101521299 |
WMC270260 |
WMC270117 |
DEN
144 |
CROOK |
LODE
CLAIM |
6 |
0520N |
0630W |
19 |
| 226 |
WY101521300 |
WMC270261 |
WMC270117 |
DEN
145 |
CROOK |
LODE
CLAIM |
6 |
0520N |
0630W |
19 |
| 227 |
WY101521301 |
WMC270262 |
WMC270117 |
DEN
146 |
CROOK |
LODE
CLAIM |
6 |
0520N |
0630W |
19 |
| 228 |
WY101521302 |
WMC270263 |
WMC270117 |
DEN
147 |
CROOK |
LODE
CLAIM |
6 |
0520N |
0630W |
19 |
| 229 |
WY101521303 |
WMC270264 |
WMC270117 |
DEN
148 |
CROOK |
LODE
CLAIM |
6 |
0520N |
0630W |
19 |
| 230 |
WY101521304 |
WMC270265 |
WMC270117 |
DEN
149 |
CROOK |
LODE
CLAIM |
6 |
0520N |
0630W |
19 |
| 231 |
WY101521305 |
WMC270266 |
WMC270117 |
DEN
150 |
CROOK |
LODE
CLAIM |
6 |
0520N |
0630W |
19 |
| 232 |
WY101521306 |
WMC270267 |
WMC270117 |
DEN
151 |
CROOK |
LODE
CLAIM |
6 |
0520N |
0630W |
19 |
| 233 |
WY101521307 |
WMC270268 |
WMC270117 |
DEN
152 |
CROOK |
LODE
CLAIM |
6 |
0520N |
0630W |
19 |
| 234 |
WY101521308 |
WMC270269 |
WMC270117 |
DEN
153 |
CROOK |
LODE
CLAIM |
6 |
0520N |
0630W |
19 |
| 235 |
WY101521309 |
WMC270270 |
WMC270117 |
DEN
154 |
CROOK |
LODE
CLAIM |
6 |
0520N |
0630W |
19 |
| 236 |
WY101521310 |
WMC270273 |
WMC270117 |
DEN
157 |
CROOK |
LODE
CLAIM |
6 |
0520N |
0630W |
18 |
| 6 |
0520N |
0630W |
19 |
| 237 |
WY101521311 |
WMC270274 |
WMC270117 |
DEN
158 |
CROOK |
LODE
CLAIM |
6 |
0520N |
0630W |
18 |
| 6 |
0520N |
0630W |
19 |
| 238 |
WY101521721 |
WMC268919 |
WMC268910 |
COLE
72 |
CROOK |
LODE
CLAIM |
6 |
0520N |
0630W |
21 |
| 6 |
0520N |
0630W |
22 |
| 239 |
WY101521722 |
WMC268920 |
WMC268910 |
COLE
73 |
CROOK |
LODE
CLAIM |
6 |
0520N |
0630W |
21 |
| 240 |
WY101521723 |
WMC268921 |
WMC268910 |
COLE
74 |
CROOK |
LODE
CLAIM |
6 |
0520N |
0630W |
21 |
| 241 |
WY101521724 |
WMC268922 |
WMC268910 |
OGDEN
1 |
CROOK |
LODE
CLAIM |
6 |
0520N |
0630W |
28 |
| 242 |
WY101521725 |
WMC268923 |
WMC268910 |
OGDEN
2 |
CROOK |
LODE
CLAIM |
6 |
0520N |
0630W |
27 |
| 6 |
0520N |
0630W |
28 |
| 243 |
WY101521726 |
WMC268924 |
WMC268910 |
OGDEN
3 |
CROOK |
LODE
CLAIM |
6 |
0520N |
0630W |
27 |
| 244 |
WY101521727 |
WMC268925 |
WMC268910 |
OGDEN
4 |
CROOK |
LODE
CLAIM |
6 |
0520N |
0630W |
27 |
| 245 |
WY101521728 |
WMC268926 |
WMC268910 |
OGDEN
5 |
CROOK |
LODE
CLAIM |
6 |
0520N |
0630W |
27 |
| 246 |
WY101521729 |
WMC268927 |
WMC268910 |
OGDEN
6 |
CROOK |
LODE
CLAIM |
6 |
0520N |
0630W |
27 |
| 247 |
WY101521730 |
WMC268928 |
WMC268910 |
OGDEN
7 |
CROOK |
LODE
CLAIM |
6 |
0520N |
0630W |
28 |
| 6 |
0520N |
0630W |
33 |
| 248 |
WY101521731 |
WMC268929 |
WMC268910 |
OGDEN
8 |
CROOK |
LODE
CLAIM |
6 |
0520N |
0630W |
27 |
| 6 |
0520N |
0630W |
28 |
| 6 |
0520N |
0630W |
33 |
| 6 |
0520N |
0630W |
34 |
| 249 |
WY101521732 |
WMC268930 |
WMC268910 |
OGDEN
9 |
CROOK |
LODE
CLAIM |
6 |
0520N |
0630W |
27 |
| 6 |
0520N |
0630W |
34 |
| 250 |
WY101521733 |
WMC268931 |
WMC268910 |
OGDEN
10 |
CROOK |
LODE
CLAIM |
6 |
0520N |
0630W |
27 |
| 6 |
0520N |
0630W |
34 |
| 251 |
WY101521734 |
WMC268932 |
WMC268910 |
OGDEN
11 |
CROOK |
LODE
CLAIM |
6 |
0520N |
0630W |
27 |
| 6 |
0520N |
0630W |
34 |
| 252 |
WY101521735 |
WMC268933 |
WMC268910 |
OGDEN
12 |
CROOK |
LODE
CLAIM |
6 |
0520N |
0630W |
27 |
| 6 |
0520N |
0630W |
34 |
| 253 |
WY101521884 |
WMC270362 |
WMC270117 |
OGDEN
86 |
CROOK |
LODE
CLAIM |
6 |
0520N |
0630W |
21 |
| 6 |
0520N |
0630W |
28 |
| 254 |
WY101521885 |
WMC270363 |
WMC270117 |
OGDEN
87 |
CROOK |
LODE
CLAIM |
6 |
0520N |
0630W |
28 |
| 255 |
WY101523096 |
WMC270164 |
WMC270117 |
DEN
48 |
CROOK |
LODE
CLAIM |
6 |
0520N |
0630W |
33 |
| 256 |
WY101523097 |
WMC270165 |
WMC270117 |
DEN
49 |
CROOK |
LODE
CLAIM |
6 |
0520N |
0630W |
28 |
| 6 |
0520N |
0630W |
33 |
| | | |
| Ore Reserves Engineering | Page 3-11 | 29 February 2024 |
| No. |
Serial
Number |
Legacy
Serial Number |
Legacy
Lead File Number |
Claim
Name |
County |
Claim
Type |
Meridian |
Township |
Range |
Section |
| 257 |
WY101523098 |
WMC270166 |
WMC270117 |
DEN
50 |
CROOK |
LODE
CLAIM |
6 |
0520N |
0630W |
33 |
| 258 |
WY101523099 |
WMC270167 |
WMC270117 |
DEN
51 |
CROOK |
LODE
CLAIM |
6 |
0520N |
0630W |
28 |
| 6 |
0520N |
0630W |
33 |
| 259 |
WY101523100 |
WMC270168 |
WMC270117 |
DEN
52 |
CROOK |
LODE
CLAIM |
6 |
0520N |
0630W |
32 |
| 6 |
0520N |
0630W |
33 |
| 260 |
WY101523101 |
WMC270169 |
WMC270117 |
DEN
53 |
CROOK |
LODE
CLAIM |
6 |
0520N |
0630W |
28 |
| 6 |
0520N |
0630W |
29 |
| 6 |
0520N |
0630W |
32 |
| 6 |
0520N |
0630W |
33 |
| 261 |
WY101523102 |
WMC270170 |
WMC270117 |
DEN
54 |
CROOK |
LODE
CLAIM |
6 |
0520N |
0630W |
32 |
| 262 |
WY101523103 |
WMC270171 |
WMC270117 |
DEN
55 |
CROOK |
LODE
CLAIM |
6 |
0520N |
0630W |
29 |
| 6 |
0520N |
0630W |
32 |
| 263 |
WY101523104 |
WMC270172 |
WMC270117 |
DEN
56 |
CROOK |
LODE
CLAIM |
6 |
0520N |
0630W |
32 |
| 264 |
WY101523105 |
WMC270173 |
WMC270117 |
DEN
57 |
CROOK |
LODE
CLAIM |
6 |
0520N |
0630W |
29 |
| 6 |
0520N |
0630W |
32 |
| 265 |
WY101523106 |
WMC270174 |
WMC270117 |
DEN
58 |
CROOK |
LODE
CLAIM |
6 |
0520N |
0630W |
32 |
| 266 |
WY101523107 |
WMC270175 |
WMC270117 |
DEN
59 |
CROOK |
LODE
CLAIM |
6 |
0520N |
0630W |
32 |
| 267 |
WY101523108 |
WMC270176 |
WMC270117 |
DEN
60 |
CROOK |
LODE
CLAIM |
6 |
0520N |
0630W |
32 |
| 268 |
WY101523109 |
WMC270177 |
WMC270117 |
DEN
61 |
CROOK |
LODE
CLAIM |
6 |
0520N |
0630W |
29 |
| 6 |
0520N |
0630W |
32 |
| 269 |
WY101523110 |
WMC270178 |
WMC270117 |
DEN
62 |
CROOK |
LODE
CLAIM |
6 |
0520N |
0630W |
32 |
| 270 |
WY101523111 |
WMC270179 |
WMC270117 |
DEN
63 |
CROOK |
LODE
CLAIM |
6 |
0520N |
0630W |
29 |
| 6 |
0520N |
0630W |
32 |
| 271 |
WY101523112 |
WMC270180 |
WMC270117 |
DEN
64 |
CROOK |
LODE
CLAIM |
6 |
0520N |
0630W |
32 |
| 272 |
WY101523113 |
WMC270181 |
WMC270117 |
DEN
65 |
CROOK |
LODE
CLAIM |
6 |
0520N |
0630W |
29 |
| 6 |
0520N |
0630W |
32 |
| 273 |
WY101523114 |
WMC270182 |
WMC270117 |
DEN
66 |
CROOK |
LODE
CLAIM |
6 |
0520N |
0630W |
32 |
| 274 |
WY101523115 |
WMC270183 |
WMC270117 |
DEN
67 |
CROOK |
LODE
CLAIM |
6 |
0520N |
0630W |
29 |
| 6 |
0520N |
0630W |
32 |
| 275 |
WY101523116 |
WMC270184 |
WMC270117 |
DEN
68 |
CROOK |
LODE
CLAIM |
6 |
0520N |
0630W |
32 |
| 276 |
WY101523669 |
WMC270275 |
WMC270117 |
DEN
159 |
CROOK |
LODE
CLAIM |
6 |
0520N |
0630W |
18 |
| 6 |
0520N |
0630W |
19 |
| 277 |
WY101523670 |
WMC270276 |
WMC270117 |
DEN
160 |
CROOK |
LODE
CLAIM |
6 |
0520N |
0630W |
18 |
| 6 |
0520N |
0630W |
19 |
| 278 |
WY101523671 |
WMC270277 |
WMC270117 |
DEN
161 |
CROOK |
LODE
CLAIM |
6 |
0520N |
0630W |
18 |
| 6 |
0520N |
0630W |
19 |
| 279 |
WY101523672 |
WMC270278 |
WMC270117 |
DEN
162 |
CROOK |
LODE
CLAIM |
6 |
0520N |
0630W |
18 |
| 6 |
0520N |
0630W |
19 |
| 280 |
WY101523673 |
WMC270279 |
WMC270117 |
DEN
163 |
CROOK |
LODE
CLAIM |
6 |
0520N |
0630W |
18 |
| 6 |
0520N |
0630W |
19 |
| 281 |
WY101523674 |
WMC270280 |
WMC270117 |
DEN
164 |
CROOK |
LODE
CLAIM |
6 |
0520N |
0630W |
18 |
| 282 |
WY101523675 |
WMC270281 |
WMC270117 |
DEN
165 |
CROOK |
LODE
CLAIM |
6 |
0520N |
0630W |
18 |
| 283 |
WY101523676 |
WMC270282 |
WMC270117 |
DEN
166 |
CROOK |
LODE
CLAIM |
6 |
0520N |
0630W |
18 |
| 284 |
WY101523677 |
WMC270283 |
WMC270117 |
DEN
167 |
CROOK |
LODE
CLAIM |
6 |
0520N |
0630W |
18 |
| 285 |
WY101523678 |
WMC270284 |
WMC270117 |
DEN
168 |
CROOK |
LODE
CLAIM |
6 |
0520N |
0630W |
18 |
| 6 |
0520N |
0640W |
13 |
| 286 |
WY101523679 |
WMC270285 |
WMC270117 |
DEN
169 |
CROOK |
LODE
CLAIM |
6 |
0520N |
0630W |
18 |
| 6 |
0520N |
0640W |
13 |
| 287 |
WY101523680 |
WMC270286 |
WMC270117 |
DEN
170 |
CROOK |
LODE
CLAIM |
6 |
0520N |
0630W |
18 |
| 288 |
WY101523681 |
WMC270287 |
WMC270117 |
DEN
171 |
CROOK |
LODE
CLAIM |
6 |
0520N |
0630W |
18 |
| 289 |
WY101523682 |
WMC270288 |
WMC270117 |
DEN
172 |
CROOK |
LODE
CLAIM |
6 |
0520N |
0630W |
18 |
| 6 |
0520N |
0640W |
13 |
| 290 |
WY101523683 |
WMC270289 |
WMC270117 |
OGDEN
13 |
CROOK |
LODE
CLAIM |
6 |
0520N |
0630W |
21 |
| 291 |
WY101523684 |
WMC270290 |
WMC270117 |
OGDEN
14 |
CROOK |
LODE
CLAIM |
6 |
0520N |
0630W |
21 |
| 6 |
0520N |
0630W |
22 |
| 292 |
WY101523685 |
WMC270291 |
WMC270117 |
OGDEN
15 |
CROOK |
LODE
CLAIM |
6 |
0520N |
0630W |
22 |
| 293 |
WY101523686 |
WMC270292 |
WMC270117 |
OGDEN
16 |
CROOK |
LODE
CLAIM |
6 |
0520N |
0630W |
22 |
| 294 |
WY101523687 |
WMC270293 |
WMC270117 |
OGDEN
17 |
CROOK |
LODE
CLAIM |
6 |
0520N |
0630W |
22 |
| 295 |
WY101523688 |
WMC270294 |
WMC270117 |
OGDEN
18 |
CROOK |
LODE
CLAIM |
6 |
0520N |
0630W |
22 |
| | | |
| Ore Reserves Engineering | Page 3-12 | 29 February 2024 |
| No. |
Serial Number |
Legacy Serial Number |
Legacy Lead File Number |
Claim Name |
County |
Claim Type |
Meridian |
Township |
Range |
Section |
| 296 |
WY101523689 |
WMC270295 |
WMC270117 |
OGDEN 19 |
CROOK |
LODE CLAIM |
6 |
0520N |
0630W |
21 |
| 6 |
0520N |
0630W |
28 |
| 297 |
WY101524353 |
WMC270381 |
WMC270381 |
IVAN 1 |
CROOK |
LODE CLAIM |
6 |
0520N |
0630W |
29 |
| 298 |
WY101524354 |
WMC270382 |
WMC270381 |
IVAN 2 |
CROOK |
LODE CLAIM |
6 |
0520N |
0630W |
32 |
| 299 |
WY101524355 |
WMC270383 |
WMC270381 |
IVAN 3 |
CROOK |
LODE CLAIM |
6 |
0520N |
0630W |
32 |
| 300 |
WY101524356 |
WMC270384 |
WMC270381 |
IVAN 4 |
CROOK |
LODE CLAIM |
6 |
0520N |
0630W |
32 |
| 301 |
WY101524357 |
WMC270385 |
WMC270381 |
IVAN 5 |
CROOK |
LODE CLAIM |
6 |
0520N |
0630W |
32 |
| 302 |
WY101524358 |
WMC270386 |
WMC270381 |
IVAN 7 |
CROOK |
LODE CLAIM |
6 |
0520N |
0630W |
28 |
| 303 |
WY101525536 |
WMC270387 |
WMC270381 |
IVAN 8 |
CROOK |
LODE CLAIM |
6 |
0520N |
0630W |
33 |
| 304 |
WY101525537 |
WMC270388 |
WMC270381 |
IVAN 9 |
CROOK |
LODE CLAIM |
6 |
0520N |
0630W |
33 |
| 305 |
WY101525538 |
WMC270389 |
WMC270381 |
IVAN 10 |
CROOK |
LODE CLAIM |
6 |
0520N |
0630W |
33 |
| 306 |
WY101525539 |
WMC270390 |
WMC270381 |
IVAN 11 |
CROOK |
LODE CLAIM |
6 |
0520N |
0630W |
33 |
| 307 |
WY101525540 |
WMC270391 |
WMC270381 |
IVAN 13 |
CROOK |
LODE CLAIM |
6 |
0520N |
0630W |
28 |
| 308 |
WY101525541 |
WMC270392 |
WMC270381 |
IVAN 14 |
CROOK |
LODE CLAIM |
6 |
0520N |
0630W |
33 |
| 309 |
WY101525542 |
WMC270393 |
WMC270381 |
IVAN 15 |
CROOK |
LODE CLAIM |
6 |
0520N |
0630W |
33 |
| 310 |
WY101525543 |
WMC270394 |
WMC270381 |
IVAN 16 |
CROOK |
LODE CLAIM |
6 |
0520N |
0630W |
33 |
| 311 |
WY101525544 |
WMC270395 |
WMC270381 |
IVAN 17 |
CROOK |
LODE CLAIM |
6 |
0520N |
0630W |
33 |
| 312 |
WY101525545 |
WMC270396 |
WMC270381 |
IVAN 19 |
CROOK |
LODE CLAIM |
6 |
0520N |
0630W |
28 |
| 313 |
WY101525546 |
WMC270397 |
WMC270381 |
IVAN 20 |
CROOK |
LODE CLAIM |
6 |
0520N |
0630W |
33 |
| 314 |
WY101525547 |
WMC270398 |
WMC270381 |
IVAN 21 |
CROOK |
LODE CLAIM |
6 |
0520N |
0630W |
33 |
| 315 |
WY101525548 |
WMC270399 |
WMC270381 |
IVAN 22 |
CROOK |
LODE CLAIM |
6 |
0520N |
0630W |
33 |
| 316 |
WY101525549 |
WMC270400 |
WMC270381 |
IVAN 23 |
CROOK |
LODE CLAIM |
6 |
0520N |
0630W |
33 |
| 317 |
WY101602482 |
WMC248000 |
WMC247925 |
BL #76 |
CROOK |
LODE CLAIM |
6 |
0520N |
0630W |
17 |
| 318 |
WY101606051 |
WMC249543 |
WMC249536 |
BL 307 |
CROOK |
LODE CLAIM |
6 |
0520N |
0630W |
21 |
| 319 |
WY101628797 |
WMC303660 |
WMC303651 |
BL 34 |
CROOK |
LODE CLAIM |
6 |
0520N |
0630W |
18 |
| 320 |
WY101628798 |
WMC303661 |
WMC303651 |
BL 35 |
CROOK |
LODE CLAIM |
6 |
0520N |
0630W |
18 |
| 321 |
WY101628799 |
WMC303662 |
WMC303651 |
BL 36 |
CROOK |
LODE CLAIM |
6 |
0520N |
0630W |
18 |
| 322 |
WY101628800 |
WMC303663 |
WMC303651 |
BL 47 |
CROOK |
LODE CLAIM |
6 |
0520N |
0630W |
17 |
| 6 |
0520N |
0630W |
18 |
| 323 |
WY101628816 |
WMC303664 |
WMC303651 |
BL 48 |
CROOK |
LODE CLAIM |
6 |
0520N |
0630W |
17 |
| 6 |
0520N |
0630W |
18 |
| 324 |
WY101628817 |
WMC303665 |
WMC303651 |
BL 49 |
CROOK |
LODE CLAIM |
6 |
0520N |
0630W |
17 |
| 6 |
0520N |
0630W |
18 |
| 325 |
WY101628818 |
WMC303666 |
WMC303651 |
DEN 95 |
CROOK |
LODE CLAIM |
6 |
0520N |
0630W |
29 |
| 326 |
WY101628819 |
WMC303667 |
WMC303651 |
DEN 97A |
CROOK |
LODE CLAIM |
6 |
0520N |
0630W |
29 |
| 327 |
WY101629415 |
WMC261020 |
WMC260901 |
REU-58 |
CROOK |
LODE CLAIM |
6 |
0520N |
0630W |
33 |
| 328 |
WY101629416 |
WMC261021 |
WMC260901 |
REU-59 |
CROOK |
LODE CLAIM |
6 |
0520N |
0630W |
33 |
| 329 |
WY101629417 |
WMC261022 |
WMC260901 |
REU-60 |
CROOK |
LODE CLAIM |
6 |
0520N |
0630W |
33 |
| 330 |
WY101629418 |
WMC261023 |
WMC260901 |
REU-61 |
CROOK |
LODE CLAIM |
6 |
0520N |
0630W |
33 |
| 331 |
WY101629419 |
WMC261024 |
WMC260901 |
REU-62 |
CROOK |
LODE CLAIM |
6 |
0520N |
0630W |
33 |
| 332 |
WY101629420 |
WMC261025 |
WMC260901 |
REU-63 |
CROOK |
LODE CLAIM |
6 |
0520N |
0630W |
33 |
| 333 |
WY101629421 |
WMC261026 |
WMC260901 |
REU-64 |
CROOK |
LODE CLAIM |
6 |
0520N |
0630W |
33 |
| 334 |
WY101629422 |
WMC261027 |
WMC260901 |
REU-65 |
CROOK |
LODE CLAIM |
6 |
0520N |
0630W |
33 |
| 335 |
WY101629423 |
WMC261028 |
WMC260901 |
REU-66 |
CROOK |
LODE CLAIM |
6 |
0520N |
0630W |
33 |
| 336 |
WY101629424 |
WMC261029 |
WMC260901 |
REU-67 |
CROOK |
LODE CLAIM |
6 |
0520N |
0630W |
33 |
| 337 |
WY101629425 |
WMC261030 |
WMC260901 |
REU-68 |
CROOK |
LODE CLAIM |
6 |
0520N |
0630W |
33 |
| 338 |
WY101629426 |
WMC261031 |
WMC260901 |
REU-69 |
CROOK |
LODE CLAIM |
6 |
0520N |
0630W |
32 |
| 6 |
0520N |
0630W |
33 |
| 339 |
WY101629427 |
WMC261032 |
WMC260901 |
REU-70 |
CROOK |
LODE CLAIM |
6 |
0520N |
0630W |
32 |
| 6 |
0520N |
0630W |
33 |
| 340 |
WY101629428 |
WMC261033 |
WMC260901 |
REU-71 |
CROOK |
LODE CLAIM |
6 |
0520N |
0630W |
32 |
| 341 |
WY101629429 |
WMC261034 |
WMC260901 |
REU-72 |
CROOK |
LODE CLAIM |
6 |
0520N |
0630W |
32 |
| 342 |
WY101629430 |
WMC261035 |
WMC260901 |
REU-73 |
CROOK |
LODE CLAIM |
6 |
0520N |
0630W |
23 |
| 343 |
WY101629431 |
WMC261036 |
WMC260901 |
REU-74 |
CROOK |
LODE CLAIM |
6 |
0520N |
0630W |
32 |
| 344 |
WY101629432 |
WMC261037 |
WMC260901 |
REU-75 |
CROOK |
LODE CLAIM |
6 |
0520N |
0630W |
32 |
| 345 |
WY101629433 |
WMC261038 |
WMC260901 |
REU-76 |
CROOK |
LODE CLAIM |
6 |
0520N |
0630W |
32 |
| 346 |
WY101629434 |
WMC261039 |
WMC260901 |
REU-77 |
CROOK |
LODE CLAIM |
6 |
0520N |
0630W |
32 |
| 347 |
WY101629435 |
WMC261040 |
WMC260901 |
REU-78 |
CROOK |
LODE CLAIM |
6 |
0520N |
0630W |
32 |
| 348 |
WY101651018 |
WMC260922 |
WMC260901 |
COLE-22 |
CROOK |
LODE CLAIM |
6 |
0520N |
0630W |
23 |
| 349 |
WY101651019 |
WMC260924 |
WMC260901 |
COLE-24 |
CROOK |
LODE CLAIM |
6 |
0520N |
0630W |
23 |
| 350 |
WY101651020 |
WMC260926 |
WMC260901 |
COLE-26 |
CROOK |
LODE CLAIM |
6 |
0520N |
0630W |
23 |
| 351 |
WY101651021 |
WMC260927 |
WMC260901 |
COLE-27 |
CROOK |
LODE CLAIM |
6 |
0520N |
0630W |
22 |
| 6 |
0520N |
0630W |
23 |
| | | |
| Ore Reserves Engineering | Page 3-13 | 29 February 2024 |
| No. |
Serial Number |
Legacy Serial Number |
Legacy Lead File Number |
Claim Name |
County |
Claim Type |
Meridian |
Township |
Range |
Section |
| 352 |
WY101651022 |
WMC260928 |
WMC260901 |
COLE-28 |
CROOK |
LODE CLAIM |
6 |
0520N |
0630W |
22 |
| 6 |
0520N |
0630W |
23 |
| 353 |
WY101651023 |
WMC260929 |
WMC260901 |
COLE-29 |
CROOK |
LODE CLAIM |
6 |
0520N |
0630W |
22 |
| 354 |
WY101651024 |
WMC260930 |
WMC260901 |
COLE-30 |
CROOK |
LODE CLAIM |
6 |
0520N |
0630W |
22 |
| 355 |
WY101651025 |
WMC260931 |
WMC260901 |
COLE-31 |
CROOK |
LODE CLAIM |
6 |
0520N |
0630W |
22 |
| 356 |
WY101651026 |
WMC260932 |
WMC260901 |
COLE-32 |
CROOK |
LODE CLAIM |
6 |
0520N |
0630W |
22 |
| 357 |
WY101651027 |
WMC260933 |
WMC260901 |
COLE-32 |
CROOK |
LODE CLAIM |
6 |
0520N |
0630W |
22 |
| 358 |
WY101651028 |
WMC260934 |
WMC260901 |
COLE-34 |
CROOK |
LODE CLAIM |
6 |
0520N |
0630W |
22 |
| 359 |
WY101651029 |
WMC260935 |
WMC260901 |
COLE-35 |
CROOK |
LODE CLAIM |
6 |
0520N |
0630W |
22 |
| 360 |
WY101651030 |
WMC260936 |
WMC260901 |
COLE-36 |
CROOK |
LODE CLAIM |
6 |
0520N |
0630W |
22 |
| 361 |
WY101651031 |
WMC260937 |
WMC260901 |
COLE-37 |
CROOK |
LODE CLAIM |
6 |
0520N |
0630W |
14 |
| 6 |
0520N |
0630W |
23 |
| 362 |
WY101651032 |
WMC260938 |
WMC260901 |
COLE-38 |
CROOK |
LODE CLAIM |
6 |
0520N |
0630W |
14 |
| 363 |
WY101651033 |
WMC260939 |
WMC260901 |
COLE-39 |
CROOK |
LODE CLAIM |
6 |
0520N |
0630W |
14 |
| 6 |
0520N |
0630W |
23 |
| 364 |
WY101651034 |
WMC260940 |
WMC260901 |
COLE-40 |
CROOK |
LODE CLAIM |
6 |
0520N |
0630W |
14 |
| 365 |
WY101651035 |
WMC260941 |
WMC260901 |
COLE-41 |
CROOK |
LODE CLAIM |
6 |
0520N |
0630W |
14 |
| 6 |
0520N |
0630W |
23 |
| 366 |
WY101651036 |
WMC260942 |
WMC260901 |
COLE-42 |
CROOK |
LODE CLAIM |
6 |
0520N |
0630W |
14 |
| 367 |
WY101651037 |
WMC260943 |
WMC260901 |
COLE-43 |
CROOK |
LODE CLAIM |
6 |
0520N |
0630W |
14 |
| 6 |
0520N |
0630W |
23 |
| 368 |
WY101651038 |
WMC260944 |
WMC260901 |
COLE-44 |
CROOK |
LODE CLAIM |
6 |
0520N |
0630W |
14 |
| 369 |
WY101652015 |
WMC260945 |
WMC260901 |
COLE-45 |
CROOK |
LODE CLAIM |
6 |
0520N |
0630W |
14 |
| 6 |
0520N |
0630W |
15 |
| 6 |
0520N |
0630W |
22 |
| 6 |
0520N |
0630W |
23 |
| 370 |
WY101652016 |
WMC260946 |
WMC260901 |
COLE-46 |
CROOK |
LODE CLAIM |
6 |
0520N |
0630W |
14 |
| 6 |
0520N |
0630W |
15 |
| 371 |
WY101652017 |
WMC260947 |
WMC260901 |
COLE-47 |
CROOK |
LODE CLAIM |
6 |
0520N |
0630W |
15 |
| 6 |
0520N |
0630W |
22 |
| 372 |
WY101652018 |
WMC260948 |
WMC260901 |
COLE-48 |
CROOK |
LODE CLAIM |
6 |
0520N |
0630W |
15 |
| 373 |
WY101652019 |
WMC260949 |
WMC260901 |
COLE-49 |
CROOK |
LODE CLAIM |
6 |
0520N |
0630W |
15 |
| 6 |
0520N |
0630W |
22 |
| 374 |
WY101652020 |
WMC260950 |
WMC260901 |
COLE-50 |
CROOK |
LODE CLAIM |
6 |
0520N |
0630W |
15 |
| 375 |
WY101652021 |
WMC260951 |
WMC260901 |
COLE-51 |
CROOK |
LODE CLAIM |
6 |
0520N |
0630W |
15 |
| 6 |
0520N |
0630W |
22 |
| 376 |
WY101652022 |
WMC260952 |
WMC260901 |
COLE-52 |
CROOK |
LODE CLAIM |
6 |
0520N |
0630W |
15 |
| 377 |
WY101652023 |
WMC260953 |
WMC260901 |
COLE-53 |
CROOK |
LODE CLAIM |
6 |
0520N |
0630W |
15 |
| 378 |
WY101652024 |
WMC260954 |
WMC260901 |
COLE-54 |
CROOK |
LODE CLAIM |
6 |
0520N |
0630W |
15 |
| 6 |
0520N |
0630W |
22 |
| 379 |
WY101652025 |
WMC260955 |
WMC260901 |
COLE-55 |
CROOK |
LODE CLAIM |
6 |
0520N |
0630W |
15 |
| 6 |
0520N |
0630W |
22 |
| 380 |
WY101652026 |
WMC260956 |
WMC260901 |
COLE-56 |
CROOK |
LODE CLAIM |
6 |
0520N |
0630W |
15 |
| 381 |
WY101652027 |
WMC260957 |
WMC260901 |
COLE-57 |
CROOK |
LODE CLAIM |
6 |
0520N |
0630W |
15 |
| 6 |
0520N |
0630W |
22 |
| 382 |
WY101652028 |
WMC260958 |
WMC260901 |
COLE-58 |
CROOK |
LODE CLAIM |
6 |
0520N |
0630W |
15 |
| 383 |
WY101652029 |
WMC260959 |
WMC260901 |
COLE-59 |
CROOK |
LODE CLAIM |
6 |
0520N |
0630W |
15 |
| 6 |
0520N |
0630W |
22 |
| 384 |
WY101652030 |
WMC260960 |
WMC260901 |
COLE-60 |
CROOK |
LODE CLAIM |
6 |
0520N |
0630W |
15 |
| 385 |
WY101652031 |
WMC260963 |
WMC260901 |
REU-1 |
CROOK |
LODE CLAIM |
6 |
0510N |
0630W |
3 |
| 386 |
WY101652032 |
WMC260964 |
WMC260901 |
REU-2 |
CROOK |
LODE CLAIM |
6 |
0510N |
0630W |
3 |
| 6 |
0520N |
0630W |
34 |
| 387 |
WY101652033 |
WMC260965 |
WMC260901 |
REU-3 |
CROOK |
LODE CLAIM |
6 |
0510N |
0630W |
3 |
| 388 |
WY101652034 |
WMC260966 |
WMC260901 |
REU-4 |
CROOK |
LODE CLAIM |
6 |
0510N |
0630W |
3 |
| 6 |
0520N |
0630W |
34 |
| 389 |
WY101652035 |
WMC260967 |
WMC260901 |
REU-5 |
CROOK |
LODE CLAIM |
6 |
0510N |
0630W |
3 |
| 390 |
WY101652887 |
WMC260968 |
WMC260901 |
REU-6 |
CROOK |
LODE CLAIM |
6 |
0510N |
0630W |
3 |
| 6 |
0520N |
0630W |
34 |
| 391 |
WY101652888 |
WMC260969 |
WMC260901 |
REU-7 |
CROOK |
LODE CLAIM |
6 |
0510N |
0630W |
3 |
| | | |
| Ore Reserves Engineering | Page 3-14 | 29 February 2024 |
| No. |
Serial Number |
Legacy Serial Number |
Legacy Lead File Number |
Claim Name |
County |
Claim Type |
Meridian |
Township |
Range |
Section |
| 392 |
WY101652889 |
WMC260970 |
WMC260901 |
REU-8 |
CROOK |
LODE CLAIM |
6 |
0510N |
0630W |
3 |
| 6 |
0520N |
0630W |
34 |
| 393 |
WY101652890 |
WMC260971 |
WMC260901 |
REU-9 |
CROOK |
LODE CLAIM |
6 |
0510N |
0630W |
3 |
| 6 |
0510N |
0630W |
4 |
| 394 |
WY101652891 |
WMC260972 |
WMC260901 |
REU-10 |
CROOK |
LODE CLAIM |
6 |
0510N |
0630W |
3 |
| 6 |
0510N |
0630W |
4 |
| 6 |
0520N |
0630W |
33 |
| 6 |
0520N |
0630W |
34 |
| 395 |
WY101652892 |
WMC260973 |
WMC260901 |
REU-11 |
CROOK |
LODE CLAIM |
6 |
0510N |
0630W |
4 |
| 396 |
WY101652893 |
WMC260974 |
WMC260901 |
REU-12 |
CROOK |
LODE CLAIM |
6 |
0510N |
0630W |
4 |
| 6 |
0520N |
0630W |
33 |
| 397 |
WY101652894 |
WMC260975 |
WMC260901 |
REU-13 |
CROOK |
LODE CLAIM |
6 |
0510N |
0630W |
4 |
| 398 |
WY101652895 |
WMC260976 |
WMC260901 |
REU-14 |
CROOK |
LODE CLAIM |
6 |
0510N |
0630W |
4 |
| 6 |
0520N |
0630W |
33 |
| 399 |
WY101652896 |
WMC260977 |
WMC260901 |
REU-15 |
CROOK |
LODE CLAIM |
6 |
0510N |
0630W |
4 |
| 400 |
WY101652897 |
WMC260978 |
WMC260901 |
REU-16 |
CROOK |
LODE CLAIM |
6 |
0510N |
0630W |
4 |
| 6 |
0520N |
0630W |
33 |
| 401 |
WY101652898 |
WMC260979 |
WMC260901 |
REU-17 |
CROOK |
LODE CLAIM |
6 |
0510N |
0630W |
4 |
| 402 |
WY101652899 |
WMC260980 |
WMC260901 |
REU-18 |
CROOK |
LODE CLAIM |
6 |
0510N |
0630W |
4 |
| 6 |
0520N |
0630W |
33 |
| 403 |
WY101652900 |
WMC260981 |
WMC260901 |
REU-19 |
CROOK |
LODE CLAIM |
6 |
0510N |
0630W |
4 |
| 404 |
WY101652901 |
WMC260982 |
WMC260901 |
REU-20 |
CROOK |
LODE CLAIM |
6 |
0510N |
0630W |
4 |
| 6 |
0520N |
0630W |
33 |
| 405 |
WY101652902 |
WMC260984 |
WMC260901 |
REU-22 |
CROOK |
LODE CLAIM |
6 |
0510N |
0630W |
4 |
| 6 |
0510N |
0630W |
33 |
| 406 |
WY101652903 |
WMC260986 |
WMC260901 |
REU-24 |
CROOK |
LODE CLAIM |
6 |
0510N |
0630W |
4 |
| 6 |
0520N |
0630W |
33 |
| 407 |
WY101652904 |
WMC260988 |
WMC260901 |
REU-26 |
CROOK |
LODE CLAIM |
6 |
0510N |
0630W |
4 |
| 6 |
0520N |
0630W |
33 |
| 408 |
WY101652905 |
WMC260990 |
WMC260901 |
REU-28 |
CROOK |
LODE CLAIM |
6 |
0510N |
0630W |
4 |
| 6 |
0510N |
0630W |
5 |
| 6 |
0520N |
0630W |
32 |
| 6 |
0520N |
0630W |
33 |
| 409 |
WY101652906 |
WMC260992 |
WMC260901 |
REU-30 |
CROOK |
LODE CLAIM |
6 |
0510N |
0630W |
5 |
| 6 |
0520N |
0630W |
32 |
| 410 |
WY101652907 |
WMC260994 |
WMC260901 |
REU-32 |
CROOK |
LODE CLAIM |
6 |
0510N |
0630W |
5 |
| 6 |
0520N |
0630W |
32 |
| 411 |
WY101653308 |
WMC303651 |
WMC303651 |
AF 58 |
CROOK |
LODE CLAIM |
6 |
0520N |
0630W |
28 |
| 412 |
WY101653309 |
WMC303652 |
WMC303651 |
AF 59 |
CROOK |
LODE CLAIM |
6 |
0520N |
0630W |
28 |
| 413 |
WY101653310 |
WMC303653 |
WMC303651 |
AF 60 |
CROOK |
LODE CLAIM |
6 |
0520N |
0630W |
28 |
| 414 |
WY101653311 |
WMC303654 |
WMC303651 |
AF 61 |
CROOK |
LODE CLAIM |
6 |
0520N |
0630W |
27 |
| 6 |
0520N |
0630W |
28 |
| 415 |
WY101653312 |
WMC303655 |
WMC303651 |
AF 62 |
CROOK |
LODE CLAIM |
6 |
0520N |
0630W |
27 |
| 416 |
WY101653313 |
WMC303656 |
WMC303651 |
COLE 56A |
CROOK |
LODE CLAIM |
6 |
0520N |
0630W |
15 |
| 417 |
WY101653314 |
WMC303657 |
WMC303651 |
COLE 58A |
CROOK |
LODE CLAIM |
6 |
0520N |
0630W |
15 |
| 418 |
WY101653315 |
WMC303658 |
WMC303651 |
COLE 60A |
CROOK |
LODE CLAIM |
6 |
0520N |
0630W |
15 |
| 419 |
WY101653316 |
WMC303659 |
WMC303651 |
DEN 128A |
CROOK |
LODE CLAIM |
6 |
0520N |
0630W |
19 |
| 6 |
0520N |
0630W |
20 |
| 6 |
0520N |
0630W |
29 |
| 6 |
0520N |
0630W |
30 |
| 420 |
WY101653849 |
WMC260999 |
WMC260901 |
REU-37 |
CROOK |
LODE CLAIM |
6 |
0510N |
0630W |
3 |
| 6 |
0520N |
0630W |
34 |
| 6 |
0520N |
0630W |
35 |
| 421 |
WY101653850 |
WMC261000 |
WMC260901 |
REU-38 |
CROOK |
LODE CLAIM |
6 |
0520N |
0630W |
34 |
| 6 |
0520N |
0630W |
35 |
| 422 |
WY101653851 |
WMC261001 |
WMC260901 |
REU-39 |
CROOK |
LODE CLAIM |
6 |
0510N |
0630W |
3 |
| 6 |
0520N |
0630W |
34 |
| 423 |
WY101653852 |
WMC261002 |
WMC260901 |
REU-40 |
CROOK |
LODE CLAIM |
6 |
0520N |
0630W |
34 |
| 424 |
WY101653853 |
WMC261003 |
WMC260901 |
REU-41 |
CROOK |
LODE CLAIM |
6 |
0510N |
0630W |
3 |
| 6 |
0520N |
0630W |
34 |
| 425 |
WY101653854 |
WMC261004 |
WMC260901 |
REU-42 |
CROOK |
LODE CLAIM |
6 |
0520N |
0630W |
34 |
| | | |
| Ore Reserves Engineering | Page 3-15 | 29 February 2024 |
| No. |
Serial Number |
Legacy Serial Number |
Legacy Lead File Number |
Claim Name |
County |
Claim Type |
Meridian |
Township |
Range |
Section |
| 426 |
WY101653855 |
WMC261005 |
WMC260901 |
REU-43 |
CROOK |
LODE CLAIM |
6 |
0510N |
0630W |
3 |
| 6 |
0520N |
0630W |
34 |
| 427 |
WY101653856 |
WMC261006 |
WMC260901 |
REU-44 |
CROOK |
LODE CLAIM |
6 |
0520N |
0630W |
34 |
| 428 |
WY101653857 |
WMC261007 |
WMC260901 |
REU-45 |
CROOK |
LODE CLAIM |
6 |
0520N |
0630W |
34 |
| 429 |
WY101653858 |
WMC261008 |
WMC260901 |
REU-46 |
CROOK |
LODE CLAIM |
6 |
0520N |
0630W |
34 |
| 430 |
WY101653859 |
WMC261009 |
WMC260901 |
REU-47 |
CROOK |
LODE CLAIM |
6 |
0520N |
0630W |
3 |
| 431 |
WY101653860 |
WMC261010 |
WMC260901 |
REU-48 |
CROOK |
LODE CLAIM |
6 |
0520N |
0630W |
34 |
| 432 |
WY101653861 |
WMC261011 |
WMC260901 |
REU-49 |
CROOK |
LODE CLAIM |
6 |
0520N |
0630W |
34 |
| 433 |
WY101653862 |
WMC261012 |
WMC260901 |
REU-50 |
CROOK |
LODE CLAIM |
6 |
0520N |
0630W |
34 |
| 434 |
WY101653863 |
WMC261013 |
WMC260901 |
REU-51 |
CROOK |
LODE CLAIM |
6 |
0520N |
0630W |
34 |
| 435 |
WY101653864 |
WMC261014 |
WMC260901 |
REU-52 |
CROOK |
LODE CLAIM |
6 |
0520N |
0630W |
34 |
| 436 |
WY101653865 |
WMC261015 |
WMC260901 |
REU-53 |
CROOK |
LODE CLAIM |
6 |
0520N |
0630W |
33 |
| 6 |
0520N |
0630W |
34 |
| 437 |
WY101653866 |
WMC261016 |
WMC260901 |
REU-54 |
CROOK |
LODE CLAIM |
6 |
0520N |
0630W |
33 |
| 6 |
0520N |
0630W |
34 |
| 438 |
WY101653867 |
WMC261017 |
WMC260901 |
REU-55 |
CROOK |
LODE CLAIM |
6 |
0520N |
0630W |
33 |
| 439 |
WY101653868 |
WMC261018 |
WMC260901 |
REU-56 |
CROOK |
LODE CLAIM |
6 |
0520N |
0630W |
33 |
| 440 |
WY101653869 |
WMC261019 |
WMC260901 |
REU-57 |
CROOK |
LODE CLAIM |
6 |
0520N |
0630W |
3 |
| 441 |
WY101672470 |
WMC262061 |
WMC262061 |
BL 15 |
CROOK |
LODE CLAIM |
6 |
0520N |
0630W |
7 |
| 442 |
WY101672471 |
WMC262062 |
WMC262061 |
BL 16 |
CROOK |
LODE CLAIM |
6 |
0520N |
0630W |
7 |
| 443 |
WY101672472 |
WMC262063 |
WMC262061 |
BL 17 |
CROOK |
LODE CLAIM |
6 |
0520N |
0630W |
7 |
| 444 |
WY101672473 |
WMC262064 |
WMC262061 |
BL 18 |
CROOK |
LODE CLAIM |
6 |
0520N |
0630W |
7 |
| 6 |
0520N |
0630W |
18 |
| 445 |
WY101672474 |
WMC262065 |
WMC262061 |
BL 19 |
CROOK |
LODE CLAIM |
6 |
0520N |
0630W |
7 |
| 446 |
WY101673377 |
WMC262066 |
WMC262061 |
BL 20 |
CROOK |
LODE CLAIM |
6 |
0520N |
0630W |
18 |
| 447 |
WY101673378 |
WMC262067 |
WMC262061 |
BL 21 |
CROOK |
LODE CLAIM |
6 |
0520N |
0630W |
18 |
| 448 |
WY101673379 |
WMC262068 |
WMC262061 |
BL 22 |
CROOK |
LODE CLAIM |
6 |
0520N |
0630W |
18 |
| 449 |
WY101673380 |
WMC262069 |
WMC262061 |
BL 23 |
CROOK |
LODE CLAIM |
6 |
0520N |
0630W |
18 |
| 450 |
WY101673381 |
WMC262070 |
WMC262061 |
BL 24 |
CROOK |
LODE CLAIM |
6 |
0520N |
0630W |
18 |
| 451 |
WY101673382 |
WMC262071 |
WMC262061 |
BL 25 |
CROOK |
LODE CLAIM |
6 |
0520N |
0630W |
18 |
| 452 |
WY101673383 |
WMC262072 |
WMC262061 |
BL 26 |
CROOK |
LODE CLAIM |
6 |
0520N |
0630W |
18 |
| 453 |
WY101673384 |
WMC262073 |
WMC262061 |
BL 28 |
CROOK |
LODE CLAIM |
6 |
0520N |
0630W |
7 |
| 454 |
WY101673385 |
WMC262074 |
WMC262061 |
BL 29 |
CROOK |
LODE CLAIM |
6 |
0520N |
0630W |
7 |
| 455 |
WY101673386 |
WMC262075 |
WMC262061 |
BL 30 |
CROOK |
LODE CLAIM |
6 |
0520N |
0630W |
7 |
| 456 |
WY101673387 |
WMC262076 |
WMC262061 |
BL 31 |
CROOK |
LODE CLAIM |
6 |
0520N |
0630W |
7 |
| 6 |
0520N |
0630W |
18 |
| 457 |
WY101673388 |
WMC262077 |
WMC262061 |
BL 32 |
CROOK |
LODE CLAIM |
6 |
0520N |
0630W |
18 |
| 458 |
WY101673389 |
WMC262078 |
WMC262061 |
BL 33 |
CROOK |
LODE CLAIM |
6 |
0520N |
0630W |
18 |
| 459 |
WY101673390 |
WMC262082 |
WMC262061 |
BL 37 |
CROOK |
LODE CLAIM |
6 |
0520N |
0630W |
18 |
| 460 |
WY101673391 |
WMC262083 |
WMC262061 |
BL 38 |
CROOK |
LODE CLAIM |
6 |
0520N |
0630W |
18 |
| 461 |
WY101673392 |
WMC262084 |
WMC262061 |
BL 39 |
CROOK |
LODE CLAIM |
6 |
0520N |
0630W |
18 |
| 462 |
WY101673393 |
WMC262085 |
WMC262061 |
BL 45 |
CROOK |
LODE CLAIM |
6 |
0520N |
0630W |
17 |
| 6 |
0520N |
0630W |
18 |
| 463 |
WY101673394 |
WMC262086 |
WMC262061 |
BL 46 |
CROOK |
LODE CLAIM |
6 |
0520N |
0630W |
17 |
| 6 |
0520N |
0630W |
18 |
| 464 |
WY101673395 |
WMC262090 |
WMC262061 |
BL 50 |
CROOK |
LODE CLAIM |
6 |
0520N |
0630W |
17 |
| 6 |
0520N |
0630W |
18 |
| 465 |
WY101673396 |
WMC262091 |
WMC262061 |
BL 51 |
CROOK |
LODE CLAIM |
6 |
0520N |
0630W |
17 |
| 6 |
0520N |
0630W |
18 |
| 466 |
WY101673397 |
WMC262092 |
WMC262061 |
BL 52 |
CROOK |
LODE CLAIM |
6 |
0520N |
0630W |
17 |
| 6 |
0520N |
0630W |
18 |
| 467 |
WY101673398 |
WMC262093 |
WMC262061 |
BL 85 |
CROOK |
LODE CLAIM |
6 |
0520N |
0630W |
16 |
| 6 |
0520N |
0630W |
17 |
| 468 |
WY101674375 |
WMC262094 |
WMC262061 |
BL 86 |
CROOK |
LODE CLAIM |
6 |
0520N |
0630W |
16 |
| 6 |
0520N |
0630W |
17 |
| 469 |
WY101674376 |
WMC262095 |
WMC262061 |
BL 87 |
CROOK |
LODE CLAIM |
6 |
0520N |
0630W |
16 |
| 6 |
0520N |
0630W |
17 |
| 470 |
WY101674377 |
WMC262096 |
WMC262061 |
BL 88 |
CROOK |
LODE CLAIM |
6 |
0520N |
0630W |
16 |
| 6 |
0520N |
0630W |
17 |
| 471 |
WY101674378 |
WMC262097 |
WMC262061 |
BL 89 |
CROOK |
LODE CLAIM |
6 |
0520N |
0630W |
16 |
| 6 |
0520N |
0630W |
17 |
| 472 |
WY101674379 |
WMC262098 |
WMC262061 |
BL 90 |
CROOK |
LODE CLAIM |
6 |
0520N |
0630W |
16 |
| 6 |
0520N |
0630W |
17 |
| | | |
| Ore Reserves Engineering | Page 3-16 | 29 February 2024 |
| No. |
Serial Number |
Legacy Serial Number |
Legacy Lead File Number |
Claim Name |
County |
Claim Type |
Meridian |
Township |
Range |
Section |
| 473 |
WY101674380 |
WMC262099 |
WMC262061 |
BL 91 |
CROOK |
LODE CLAIM |
6 |
0520N |
0630W |
16 |
| 6 |
0520N |
0630W |
17 |
| 474 |
WY101674381 |
WMC262100 |
WMC262061 |
BL 300 |
CROOK |
LODE CLAIM |
6 |
0520N |
0630W |
21 |
| 475 |
WY101674382 |
WMC262101 |
WMC262061 |
BL 301 |
CROOK |
LODE CLAIM |
6 |
0520N |
0630W |
21 |
| 476 |
WY101674383 |
WMC262102 |
WMC262061 |
BL 302 |
CROOK |
LODE CLAIM |
6 |
0520N |
0630W |
21 |
| 477 |
WY101674384 |
WMC262103 |
WMC262061 |
BL 304 |
CROOK |
LODE CLAIM |
6 |
0520N |
0630W |
21 |
| 478 |
WY101674385 |
WMC262104 |
WMC262061 |
BL 310 |
CROOK |
LODE CLAIM |
6 |
0520N |
0630W |
21 |
| 479 |
WY101674386 |
WMC262105 |
WMC262061 |
BL 313 |
CROOK |
LODE CLAIM |
6 |
0520N |
0630W |
21 |
| 480 |
WY101674387 |
WMC262106 |
WMC262061 |
BL 314 |
CROOK |
LODE CLAIM |
6 |
0520N |
0630W |
21 |
| 481 |
WY101674388 |
WMC262107 |
WMC262061 |
BL 319 |
CROOK |
LODE CLAIM |
6 |
0520N |
0630W |
21 |
| 482 |
WY101680035 |
WMC260907 |
WMC260901 |
COLE-7 |
CROOK |
LODE CLAIM |
6 |
0520N |
0630W |
23 |
| 6 |
0520N |
0630W |
26 |
| 483 |
WY101680036 |
WMC260908 |
WMC260901 |
COLE-8 |
CROOK |
LODE CLAIM |
6 |
0520N |
0630W |
23 |
| 484 |
WY101680037 |
WMC260909 |
WMC260901 |
COLE-9 |
CROOK |
LODE CLAIM |
6 |
0520N |
0630W |
22 |
| 6 |
0520N |
0630W |
23 |
| 6 |
0520N |
0630W |
26 |
| 6 |
0520N |
0630W |
27 |
| 485 |
WY101680038 |
WMC260910 |
WMC260901 |
COLE-10 |
CROOK |
LODE CLAIM |
6 |
0520N |
0630W |
22 |
| 6 |
0520N |
0630W |
23 |
| 486 |
WY101680039 |
WMC260911 |
WMC260901 |
COLE-11 |
CROOK |
LODE CLAIM |
6 |
0520N |
0630W |
22 |
| 6 |
0520N |
0630W |
27 |
| 487 |
WY101680040 |
WMC260912 |
WMC260901 |
COLE-12 |
CROOK |
LODE CLAIM |
6 |
0520N |
0630W |
22 |
| 488 |
WY101680041 |
WMC260913 |
WMC260901 |
COLE-13 |
CROOK |
LODE CLAIM |
6 |
0520N |
0630W |
22 |
| 6 |
0520N |
0630W |
27 |
| 489 |
WY101680042 |
WMC260914 |
WMC260901 |
COLE-14 |
CROOK |
LODE CLAIM |
6 |
0520N |
0630W |
22 |
| 490 |
WY101680043 |
WMC260915 |
WMC260901 |
COLE-15 |
CROOK |
LODE CLAIM |
6 |
0520N |
0630W |
22 |
| 6 |
0520N |
0630W |
27 |
| 491 |
WY101680044 |
WMC260916 |
WMC260901 |
COLE-16 |
CROOK |
LODE CLAIM |
6 |
0520N |
0630W |
22 |
| 492 |
WY101680045 |
WMC260917 |
WMC260901 |
COLE-17 |
CROOK |
LODE CLAIM |
6 |
0520N |
0630W |
22 |
| 6 |
0520N |
0630W |
27 |
| 493 |
WY101680046 |
WMC260918 |
WMC260901 |
COLE-18 |
CROOK |
LODE CLAIM |
6 |
0520N |
0630W |
22 |
| 494 |
WY101680047 |
WMC260920 |
WMC260901 |
COLE-20 |
CROOK |
LODE CLAIM |
6 |
0520N |
0630W |
23 |
| 495 |
WY101732218 |
WMC247986 |
WMC247925 |
BL #62 |
CROOK |
LODE CLAIM |
6 |
0520N |
0630W |
17 |
| 496 |
WY101732220 |
WMC249541 |
WMC249536 |
BL 305 |
CROOK |
LODE CLAIM |
6 |
0520N |
0630W |
21 |
| 497 |
WY101745876 |
WMC308967 |
WMC308967 |
BL 310A |
CROOK |
LODE CLAIM |
6 |
0520N |
0630W |
21 |
| 498 |
WY101854614 |
WMC249542 |
WMC249536 |
BL 306 |
CROOK |
LODE CLAIM |
6 |
0520N |
0630W |
21 |
| 499 |
WY101855619 |
WMC247999 |
WMC247925 |
BL #75 |
CROOK |
LODE CLAIM |
6 |
0520N |
0630W |
17 |
| | | |
| Ore Reserves Engineering | Page 3-17 | 29 February 2024 |
| 4 | ACCESSIBILITY,
CLIMATE, LOCAL RESOURCES, INFRASTRUCTURE, AND PHYSIOGRAPHY |
Access to the Bear
Lodge REE Project is good, subject to winter month snowstorms which can impact travel. The project area is located 7 air miles (11 kilometers)
or 12 road miles (19 kilometers) northwest of the town of Sundance (Wyoming), which is on US Interstate Highway 90, and 22 air miles
(35 kilometers) west of the South Dakota state line.
The nearest major
airport is Gillette-Campbell County Airport (GCC/KGCC), located in Gillette, Wyoming, and is 67 miles (108 kilometers) from the center
of Sundance. Another major airport is Rapid City Regional Airport (RAP/KRAP), which is in Rapid City (South Dakota), approximately 92
miles (148 kilometers) from Sundance (Figure 4-1).

Figure 4-1. General
Access Map to the Bear Lodge REE Project (Noble & Barrero, 2024)
Primary access
to the property is from the town of Sundance, Wyoming. The project site is reached by traveling west from Sundance about one mile along
I-90, then 1.5 miles west on US Highway 14, then north on the paved Sundance-Warren Peaks Road (USFS road #838, County roads 208 and
100) for 7.4 miles to the summit of Warren Peaks, just past the fire lookout tower. The final 3.2 miles to the Bull Hill area of the
property is on well-maintained gravel roads (continuing County Road 100 or USFS #838 and then right on USFS #851) until the turnoff to
Bull Hill Road. Road access within the property is relatively extensive via several good quality dirt logging roads and four-wheel-drive
trails constructed originally during logging or exploration activities and subsequently rehabilitated. Figure 4-2 displays the
access routes to the Bear Lodge REE Project.
| | | |
| Ore Reserves Engineering | Page 4-1 | 29 February 2024 |

Figure 4-2. Detailed
Access Map to the Bear Lodge REE Project from Sundance (Noble & Barrero, 2024)
| | | |
| Ore Reserves Engineering | Page 4-2 | 29 February 2024 |
| 4.2 | Climate
and Physiography |
The Bear Lodge
Mountains have a warm and relatively dry climate during summer, followed by cold winters with variable amounts of snow. Optimal field
conditions extend from June through October.
The property lies
within the Black Hills National Forest and covers the crest of the Bear Lodge Mountains, a narrow northwest-trending range situated in
northeastern Wyoming. Physiographically, the mountains are a northwesterly extension of the Black Hills uplift of western South Dakota.
The range is characterized by rounded grass and pine-covered mountains that reach an elevation of 6,400 feet (1,951 meters) above sea
level within the property.
The mountains have
moderate slopes covered by western yellow (ponderosa) pine and aspen forest interspersed with dense thickets of brush. Narrow, grassy
meadows cover the upper reaches of seasonal drainages. The lowest point within the project area is about 5,800 feet (1,768 meters) above
sea level.
The climate of
Crook County varies with topography. The Bear Lodge Mountains and the lower-lying foothills and plains area are two major areas. Climatic
data from the National Weather Service (NWS) Cooperative Observer Program (COOP) in Sundance is considered representative of the study
area. The following summarizes the climatic data for the given period:
| · | 1991-2020:
Average annual air temperature is 45.3°F (7.4 °C). |
| · | 1893-2022:
Lowest recorded temperature is -42°F (-41.1°C). |
| · | 1893-2022:
Highest recorded temperature is 107°F (41.7°C). |
| · | 1991-2020:
Average annual precipitation is 20.5 inches (52.2 centimeters). |
| · | Lowest
annual precipitation was 11.44 inches (29.1 centimeters) in 2021. |
| · | Highest
annual precipitation was 27.42 inches (69.6 centimeters) in 1998. |
| · | 1991-2022:
Average seasonal snowfall recorded for Sundance is 71.7 inches (182.2 centimeters). |
Most of the precipitation
occurs as thunderstorms during April through July. Winds are generally from the west or northwest.
| 4.3 | Local
Resources and Infrastructure |
Motels, restaurants,
gas stations, and other services are available at Sundance, Upton, and other nearby towns, and a greater variety of accommodations are
available to the east in Spearfish, South Dakota. All necessary infrastructure, such as housing, food, fuel, etc., would be available
in these towns or further to the west in Gillette and southeast in Newcastle.
Supplies can be
trucked to the site 60 miles (100 kilometers) from Gillette, which is located on both US Interstate Highway 90 and rail lines. A Burlington
Northern rail transport line is also located at Moorcroft, 34 miles (54 kilometers) west of Sundance, and at Upton, 40 miles (64 kilometers)
south. The Powder River Basin contains multiple coal-fired power plants, and Gillette, the largest city in the basin, would be a major
logistics center for any development at the Bear Lodge REE Project.
Water rights at
the Bear Lodge REE Project are available through permitting by the Wyoming State Engineer’s Office; these water rights have not
been secured at the time of reporting. Near the Bull Hill area, a power line, which requires upgrading, runs to within a mile of the
project area. Economical electrical power would be supplied by the Powder River Energy Corporation.
| | | |
| Ore Reserves Engineering | Page 4-3 | 29 February 2024 |
The Bear Lodge
Mountains were initially prospected for gold and silver during the late nineteenth and early twentieth century, with a reportedly short-lived
mine and mill in operation (the Bock Mine in 1880). Thorium and rare earth mineralization were first discovered in the area in 1950 due
to uranium exploration activity by early prospectors. The mineralization and some carbonatite occurrences were first documented by a
USGS report in 1953 (Wilmarth & Johnson, 1953). The US Bureau of Mines (USBM) completed a limited radiometric survey and a limited
drilling program in the early 1950s to investigate the rare earth deposits on claims owned by the Telmor Engineering Company. However,
the associated exploration activity, including the excavation of numerous bulldozer trenches, was short-lived, as there was no readily
available market for these commodities at that time. Table 5-1 provides a summary of the historic exploration activities by major
companies.
Table 5-1. Historic
exploration activities by major companies
| Company |
Dates |
Exploration
Activities |
| Duval
Corporation |
1972
- 1978 |
Surface
mapping, sampling, petrography; 13 diamond drill holes, 5 reverse circulation (RC) drill
holes, and 35 short claim validation
holes; ground geophysics |
| Molycorp
Inc. |
1978
- 1980 |
Surface
mapping and sampling, petrography; 12 diamond drill holes, 165 claim validation holes, ground
geophysics (magnetics,
radiometrics, Turam, IP) |
| Duval
Corporation |
1981
- 1984 |
Rotary
drilling, gravity survey, trenching |
| Western
Nuclear Inc. |
1984
- 1985 |
Reconnaissance
sampling: 3 diamond drill holes (total 997 ft). |
| FMC
Corporation |
1982
– 1986 |
Geological
mapping, rock chip, and soil sampling, petrography; 31 RC drill holes and 57 claim validation
holes; discovered East and
West Breccia deposits |
| International
Curator Resources Ltd. |
1987
- 1988 |
Explored
East and West Breccia deposits; 6 core and 18 RC drill holes; petrography and mineralogy. |
| Newmont
Exploration Limited |
1986
– 1988 |
Soil
and rock chip sampling; RC drilling (10 holes); ground
magnetic survey. |
| Hecla
Mining Company |
1986
– 1991 |
Soil
and rock chip sampling; mapping; 12 core holes, 9 RC holes; ground geophysical surveys (magnetics,
radiometrics, VLF); re-
processed NURE geophysical
data; petrography and mineralogy |
| ACNC |
1988
– 1989 |
Soil
and rock chip sampling; 22 RC drill holes; airborne magnetic
interpretation. |
| Coca
Mines Inc. |
1990
- 1991 |
Reserve
definition on the East and West Breccia deposits; 35 RC
drill holes. |
| Phelps
Dodge |
1994
- 1996 |
Mapping;
trenching; soil and rock chip sampling; 16 RC drill holes; ground geophysics (magnetics,
radiometrics, VLF); reprocessing
and interpretation of
NURE mag and Rad data |
| | | |
| Ore Reserves Engineering | Page 5-1 | 29 February 2024 |
In 1972, Duval
Corporation acquired the exploration rights to the area based on the results of a stream sediment geochemical survey. They initiated
an exploration program focused on a Climax exploration model for disseminated “porphyry-type” molybdenum-copper (Mo-Cu) mineralization.
This program continued until the end of the 1977 field season. Duval Corporation identified locally high-grade occurrences of copper
and rare-earth metals, and low-grade gold mineralization within an altered syenite-carbonatite alkaline intrusive complex. The company
completed 13 diamond drill holes (WBD-1 to 13 for a total of 20,363 ft), 5 rotary drill holes (WBR-1 to 5 for 765 ft), and about 42 claim-validation
rotary drill holes (DUVR-1 to 42 for 2,105 ft). Duval Corporation reported an intercept of 40 feet averaging 3.5 % copper and 4.7 oz/ton
silver deep in hole WBD-5, and many drill holes encountered significant intercepts with total rare-earth abundances that ranged from
1 to 15% in association with carbonatite and carbonatite-related intrusive bodies. Duval Corporation recognized that the Bear Lodge property
had the potential to host an economically significant rare-earth-element (REE) deposit, and they brought Molycorp Inc. into the project
as an operating joint venture partner in 1978. Molycorp Inc. owned and operated the Mountain Pass rare-earth mine in California at that
time. From 1978 to 1980, Molycorp Inc. completed 12 diamond drill holes (BL-1 to 12 for a total of 13,618 ft), 165 claim-validation holes
(MOL-1 to 165 for 8,250 ft), and they conducted soil geochemical, and ground magnetic, IP/resistivity, and radiometric surveys.
The company also completed a TEM survey and had all pre-existing cores analyzed for REE abundances.
The USGS conducted
field and laboratory studies on the property between 1975 and 1979, including geological mapping, rock geochemistry, petrographic studies,
and radiometric surveys covering a large area encompassing the current Bear Lodge REE Project area. In 1983, M.H. Staatz of the USGS
documented the results in a report concluding that “the Bear Lodge disseminated deposits have one of the largest resources of both
total rare earths and thorium in the United States” (Staazt, 1983). The work conducted by the USBM was reviewed in 1990 and resulted
in an estimate of potential REE resources in the Bull Hill area (Gersic, et al., 1990).
Molycorp Inc. withdrew
from the joint venture in 1980 following its purchase by UNOCAL. Duval Corporation continued with a diminished level of exploration activity
until September 1984, completing trenching, gravity survey, and drilling of rotary holes WBR 84-1 and 2 (740 ft). With the divestiture
of Duval Corporation and the spin-off of Battle Mountain Gold Company, the property was abandoned after a recommended metallurgical feasibility
study was rejected by management.
Western Nuclear
held claims in the district from 1984 to 1985 and focused on exploring for radioactive mineral occurrences; American Copper and Nickel
Corporation (ACNC) conducted sampling, mapping, and a limited RC drilling program in the late 1980s.
In 1982, FMC Corporation
acquired ground to the north, east, and south of the Duval Corporation property and initiated exploration for gold mineralization in
the alkaline intrusive rocks. The company explored the property until 1986. They conducted geological mapping, soil geochemical surveys
(gold and arsenic), and ground magnetic and radiometric surveys, and they drilled rotary holes totaling 7,742 feet. The work discovered
and partially delineated two low-grade, gold-bearing breccia pipes.
International Curator
Resources Ltd. optioned FMC’s property in 1987 and further defined the mineralized breccia pipes with 6 diamond drill holes (3,535
ft) and 18 rotary holes (7,063 ft) by the end of 1988. The property was acquired by Coca Mines Inc. in 1990. Coca drilled an additional
35 rotary holes totaling 9,265 feet and defined an estimated geologic resource of 8.2 million tons, averaging 0.023 ounces of gold per
ton (a historical resource not compliant with Regulation S-K) in the East and West Breccia deposits in the Smith Ridge area.
| | | |
| Ore Reserves Engineering | Page 5-2 | 29 February 2024 |
Newmont Exploration
Limited acquired a small land package in the district and carried out limited gold exploration activities from 1986 until 1988. The company
drilled 10 reverse circulation holes totaling 3,115 feet (949 m).
Hecla Mining Company
acquired a land position in the district in 1986 and added to it in 1988 by optioning additional claims. Hecla Mining Company discovered
high-grade REE mineralization and concentrated on rare earth exploration until the end of the 1990 field season when rare earth prices
were falling. Hecla Mining Company then acquired Coca Mines Inc., which controlled an adjacent property that hosted a small gold discovery.
Following the Coca acquisition in 1991, Hecla Mining Company focused on the low-grade gold potential of the merged property position.
Hecla Mining Company completed 12 diamond drill holes for 13,756 feet (4,194 meters) during its REE exploration phase and defined rare
earth mineralization in several carbonatite dike sets along the southwestern flank of Bull Hill.
Phelps Dodge Corporation
acquired a large part of the area in 1994 and focused its efforts on gold exploration over the next three years. It appears that Phelps
Dodge ceased exploration due more to the downturn in gold prices than to lowered expectations for the property.
Paso Rico (USA), Inc.
(now known as Rare Element Resources, Inc. (RER)) began looking at the Bear Lodge property in 1998-99, staked some claims, and negotiated
a lease and option agreement on adjacent claims held by Phelps Dodge Corporation in March 2000. The lease was terminated and replaced
by a 2% NSR royalty in September 2002. The 2% royalty was purchased from Freeport McMoRan Corporation (formerly Phelps Dodge Corporation)
by RER in March 2009, so Phelps Dodge/Freeport has no further interests in the property.
Rare Element Resources
Ltd. was incorporated in the province of British Columbia on June 3, 1999, and acquired Paso Rico Resources Ltd. in 2003 as a wholly
owned subsidiary to explore and develop primarily the REE and gold mineralization. On June 1, 2006, Rare Element Resources Ltd.,
through its subsidiary, Paso Rico Inc., and Newmont North American Exploration Limited, a subsidiary of Newmont Mining Corporation, signed
an agreement to establish a gold exploration venture. This agreement was terminated in May 2010, with RER becoming the sole participant
in the combined gold-REE project.
| 5.2 | Historical
Resource Estimates |
There are several
historical resource estimates that are included as part of the historical record for the project; these were performed by Molycorp Inc.,
Hecla Mining Company, and USBM (Wineteer, 1991; Gersic et al., 1990). None of these estimates were prepared according to accepted reporting
standards. No Qualified Person did sufficient work on these estimates to classify them as resources, and the reliability of the estimates
is unknown. RER does not consider the historical estimates to be mineral resources and should not be relied upon.
In 2009, Rare Element
Resources Ltd., parent company to Rare Element Resources, Inc., disclosed an estimate of the total inferred resource in the Bull
Hill area consisting of 9.8 million tons (8.9 million tonnes) with an average grade of 4.1% Total Rare-Earth Oxides (TREO), using a cutoff
grade of 1.5% TREO, in a NI 43-101 compliant technical report on the Bear Lodge property (Noble, 2009).
| | | |
| Ore Reserves Engineering | Page 5-3 | 29 February 2024 |
Subsequently, in
2010, Rare Element Resources Ltd. updated the resources of the claim block on and around Bull Hill to present a preliminary economic
analysis (Scoping Study) to validate the project's potential value (John T. Boyd Company, 2010). The updated inferred resource estimate
in the Bull Hill area was 17.5 million tons (15.9 million tonnes) with an average grade of 3.46% TREO, using a cutoff grade of 1.5% TREO.
RER progressed
with the technical work at the Bear Lodge REE Project and provided a preliminary plan for the development of a REE open-pit mining operation
at Bull Hill in a technical report on the mineral reserves and development of the Bull Hill Mine (Roche-Engineering, 2012). The disclosed
mineral resources and reserves, and the associated mine plan were estimated in compliance with NI 43-101 and SEC’s Industry Guide
7. The proven and probable mineral reserves consisted of a diluted 6.3 million tons (5.7 million tonnes) averaging 3.6% rare-earth oxide
(TREO), plus 1.6 million tons (1.45 million tonnes) of lower grade stockwork material averaging 1.1% TREO. The mineral reserve was derived
from a measured and indicated (M&I) mineral resource of 6.8 million tons (6.2 million tonnes), averaging 3.75% TREO. The report included
4.5 million tons (4.1 million tonnes) of high-grade oxide inferred mineral resource within the pit, and an additional 12 million tons
(10.9 million tonnes) of near-surface inferred resources outside the pit.
Later, in 2014,
RER. updated the technical studies at the Bear Lodge REE Project in an NI 43-101 compliant Pre-Feasibility Study Report (Roche-Engineering,
2014). This study considered an open pit mining operation at Bull Hill and Whitetail Ridge, a physical upgrading plant (PUG) for mineral
pre-concentration, and a hydrometallurgical plant at Upton for further concentration of the rare earth elements into a mixed TREO concentrate.
The updated estimated measured and indicated (M&I) mineral resource was 18.0 million tons (16.3 million tonnes) with an average grade
of 3.05% TREO (using a cutoff grade of 1.5% TREO). The total proven and probable mineral reserve derived from and included as part of
the M&I resource consisted of 15.6 million tons (14.2 million tonnes), averaging 2.78% TREO using a cutoff grade of 1.5% TREO.
All the described
Rare Element Resources Ltd. and RER reports were prepared in accordance with Form 43-101F1 Technical Report and the CIM Definition
Standards for Mineral Resources and Mineral Reserves and filed into SEDAR, the CSA web-based system used by all market participants to
file, disclose, and search for information in Canada's capital markets.
| | | |
| Ore Reserves Engineering | Page 5-4 | 29 February 2024 |
| 6 | GEOLOGICAL
SETTING, MINERALIZATION, AND DEPOSIT |
Most of the information
contained in this section is based on the compiled work of J. Ray (Noble, 2009; John T. Boyd Company, 2010; Roche-Engineering, 2012;
Roche-Engineering, 2014), and M. Hutchinson (Hutchinson, et al., 2022; Hutchinson, 2016).
The Bear Lodge
Mountains of northeastern Wyoming are part of the Black Hills Uplift, a northwest-trending anticline formed during the Late Cretaceous-Tertiary
Laramide Orogeny. The uplift has a northwesterly orientation and extends from the western South Dakota – Nebraska border through
northeastern Wyoming into southeastern Montana (Figure 6-1).

Figure 6-1. Simplified
Geological Map of the Black Hills Uplift (Noble & Barrero 2024, modified from Lisenbee, 1985)
The exposed basement
consists of Precambrian schist, gneiss, and granite overlain by Paleozoic and Mesozoic clastic and carbonate sedimentary rocks eroded
from higher elevations. The Paleozoic and Mesozoic rocks were subjected to large-scale monoclinal folding that encircles the Black Hills
Uplift. Younger Oligocene, Miocene, and Pliocene sediments disconformably overlie the older sedimentary and igneous rocks at lower elevations
of the uplift.
Eocene
(Tertiary) alkaline intrusive and extrusive bodies in the northern Black Hills form an N70°-80°W
trending belt that extends from Bear Butte in South Dakota through the Bear Lodge Mountains, Devil’s Tower, and Missouri Buttes
in northeastern Wyoming. These rocks represent a group of alkalic, iron-rich, metaluminous to slightly peraluminous igneous rocks that
intruded the Archean and Proterozoic basement and its cover of Paleozoic and Mesozoic sedimentary rocks along a linear, west-northwest
trending belt in the northern Black Hills (Lisenbee & DeWitt, 1993). These alkaline igneous rocks are represented by dikes,
sills, stocks, laccoliths, diatremes, and ring complexes, generally transitioning in composition from silica-saturated to silica-undersaturated
from southeast to northwest (Snoke, 1993). These alkaline igneous rocks are associated with REE-enriched carbonatite dikes in the Bear
Lodge alkaline-igneous complex.
Alkaline intrusive
rocks' ages range from 39 to 60 Ma, with younger intrusions more common toward the western end of the belt. On a broader scale, the Bear
Lodge alkaline complex and other Black Hills alkaline igneous bodies are part of a northerly trending belt of scattered alkaline-igneous
systems from Mexico to Canada.
| | | |
| Ore Reserves Engineering | Page 6-1 | 29 February 2024 |
Surface rock exposures
in the project area are limited, so considerable information was gleaned from float samples and trenches. Bedrock outcrop exposure is
less than 5%, and extensive soil cover obscures details of the underlying rocks, structures, and alteration patterns.
The Bear Lodge
REE Project is in the Bear Lodge alkaline-igneous complex, near the western end of the northern Black Hills intrusive belt (Figure
6-1), and is represented by a northwest-trending dome with surface dimensions of approximately 2.8 by 6 miles (4.5 by 10 km), consisting
of multiple intrusions that were subjected to polyphase hydrothermal and metasomatic activity, and a variety of associated breccias and
diatremes. The igneous textures (porphyritic to aphanitic) indicate a sharp thermal gradient between the intrusions and the country rocks,
implying a shallow emplacement. The presence of minor volcanic rocks broadly contemporaneous with the intrusions suggests that the complex
was part of a more extensive volcano-plutonic system (Moore, 2014).
The Bear Lodge
dome elongates in a northwesterly orientation. It consists of a central elongated core overlain by older Paleozoic and Mesozoic sediments
in the southern half of the range and by post-intrusion Tertiary sediments in the northern half (Figure 6-2). The core consists
of the upper levels of a REE mineralized alkaline-igneous complex that intruded and domed the surrounding Paleozoic and Mesozoic sedimentary
rocks in the early Tertiary.
The Bear Lodge
alkaline-igneous complex consists predominantly of silica-undersaturated alkaline-igneous intrusive rocks, and it is the only intrusive
series in the alkaline belt where associated carbonatitic intrusions are found. REE mineralization occurs in the north-central core and
is associated with carbonatite dikes. Recognizable hydrothermal alteration includes pervasive fenitization (alkali-ferric iron metasomatism),
K-feldspar-pyrite alteration, minor silicification, localized argillic alteration, superimposed surface weathering, and oxidation.
Several large and
isolated blocks of Precambrian granitic bodies occur within the southern portion of the complex (~4,914,000N). The Precambrian units
may be roof pendants or may be anchored in the basement. Screens of quartzite, conglomerate, and minor shaly limestone from the Deadwood
Formation sediments occur along the periphery of the complex and can also host gold mineralization.
| | | |
| Ore Reserves Engineering | Page 6-2 | 29 February 2024 |
The simplified
stratigraphic column in Figure 6-3 summarizes the formations and rock units in and around the Bear Lodge REE Project area. Geological
cross-sections of the local geology are shown in Figure 6-4.

Figure 6-2. Geological
Map of the Southern Bear Lodge Mountains (Noble & Barrero 2024, modified from Staatz, 1983)
| | | |
| Ore Reserves Engineering | Page 6-3 | 29 February 2024 |
The Paleozoic sedimentary
rocks consist mainly of limestone and quartzite, with minor sandstone, shale, and siltstone. Mesozoic rocks include siltstone and shale,
with minor sandstone. Tertiary sediments (White River and Ogallala Formations) unconformably overlie all older rocks and consist of loosely
consolidated siltstone, sandstone, and conglomerate of local derivation. Quaternary deposits include alluvium, soil cover, and colluvial
deposits.
As previously mentioned,
thick soil cover and lack of outcrops hinder structural mapping and interpretation. However, geophysical surveys (magnetics, radiometric,
and IP/resistivity) confirm the limited field data that indicate a predominance of major structural trends oriented west-northwesterly,
northwesterly (parallel to the elongation of the complex), and northeast or east-northeasterly.

Figure 6-3. Stratigraphic
Column of the Southern Bear Lodge Mountains (Noble & Barrero 2024, modified from Staatz, 1983)
| | | |
| Ore Reserves Engineering | Page 6-4 | 29 February 2024 |

Figure 6-4. Geological
Vertical Cross Cections of the Southern Bear Lodge Mountains (Noble & Barrero 2024, modified from Staatz, 1983). Section locations are shown in Figure 6-2
| | | |
| Ore Reserves Engineering | Page 6-5 | 29 February 2024 |
| 6.2.1.1 | Precambrian
Granite |
The Precambrian
granite consists of alkali feldspar, biotite, and local quartz, with accessory magnetite, apatite, zircon, and monazite. This rock is
subjected to variable degrees of fenitization. It is preserved in the southern part of the complex, representing the only igneous unit
in the complex that is not directly associated with Eocene magmatism (Moore, 2014).
| 6.2.1.2 | Tertiary
Igneous Rocks |
The Tertiary Bear
Lodge alkaline-igneous complex may be grossly laccolithic in form and consists of a central intrusive body with subordinate plugs, sills,
dikes, and laccoliths. Rock compositions are mainly trachyte and phonolite porphyry, with lesser amounts of syenite, latite, nepheline
syenite, pseudo-leucite porphyry, malignite, pyroxenite, lamprophyre, and late-stage calcio carbonatite and silicocarbonatite. The alkalic
rocks penetrated Precambrian granite and gneiss and intruded into the suprajacent Paleozoic sedimentary rocks as plugs, dikes, and sills.
A variety of intrusive and diatreme breccia bodies cut through the igneous complex.
Crosscutting relationships
indicate three stages in the Tertiary magmatism (Hutchinson, et al., 2022), an initial alkaline stage with the emplacement of syenite,
microsyenite, porphyritic trachyte, and trachyte porphyry, with lesser amounts of latite, phonolite, and diatreme breccias, followed
by the emplacement of calciocarbonatite and silicocarbonatite dike swarms crosscutting the older alkaline igneous rocks (carbonatite
magmatism stage). The last phase is represented by alkaline magmatism, including phonolite intrusions, lamprophyre dikes, and volcanic
breccias.
Major igneous rock
units listed in approximate order from youngest to oldest units are summarized in Table 6-1.
Hydrothermal alteration
identified in the Bear Lodge alkaline-igneous complex is dominated by K- feldspar-pyrite alteration and/or fenitization (alkali-ferric
iron metasomatism). Carbonate alteration is common but not as widespread as potassic alteration. Minor amounts of argillization, sericitization,
and silicification are noted locally.
Carbonate is leached
from many surface exposures during the supergene oxidation of pyrite, and it is largely absent within the zone of supergene oxidation,
apparently replaced by silica and limonitic iron oxides (FeOx). Sulfides are strongly oxidized to limonite ± hematite, and biotite/phlogopite
exhibits moderate to strong oxidation. It is difficult to discriminate alteration related to the intrusion of the carbonatitic bodies.
However, stockworks of hairline calcite veinlets and patchy replacement of K-feldspar and biotite may be related to the carbonatite intrusions.
Many of the clasts are carbonate-flooded, and some exhibit pyritic reaction rims. Pyrite is essentially the only sulfide phase in the
breccia matrix and clasts, although various sulfide phases occur in the carbonatite. Near-surface carbonatite is strongly weathered and
is depleted in calcite, the RER team had termed this material as FMR.
| | | |
| Ore Reserves Engineering | Page 6-6 | 29 February 2024 |
Table 6-1. Main
igneous rock units at Bear Lodge REE Project (Roche-Engineering, 2014)
| Rock
type |
Intrusion
type |
Composition
|
| Carbonatite |
Intrusions
range from micro veinlets up to dikes approaching 120 feet in width. Drilling data indicates most commonly strike northwesterly and
dip steeply to the southwest or northeast |
Sovite:
fine to coarsely crystalline calcite, with a range of essential to accessory minerals
that may include biotite, K-feldspar, apatite, clinopyroxene, strontianite, dolomite, barite, celestite, sulfides, Fe-Ti oxides, and
REE and Th minerals.
Silicocarbonatite: calcite
with significant biotite or phlogopite and K-feldspar ± accessory aegirine, apatite, strontianite, barite, celestite, sulfides,
Fe-Ti oxides, and REE and Th minerals. Sulfide and oxide minerals: pyrite, pyrrhotite, chalcopyrite, specularite, galena, sphalerite,
and rutile.
REE mineralization:
from trace amounts to more than 20%, REE minerals tend to be less abundant in silicocarbonatite |
Heterolitic
Intrusive Breccia
|
Diatremes
(Bull Hill, Carbon Hill, and Whitetail Ridge) and as small dike-like bodies. |
Fine-grained
carbonate-K feldspar-biotite-sulfide matrix with abundant clasts of phonolite-trachyte, with subordinate syenite and lamprophyre. |
| Intrusion
breccias |
As
contact breccias along the margins of intrusive bodies |
Trachytic
or phonolitic clasts dispersed in an igneous matrix of the same composition. |
| Pseudo-leucite
porphyry |
Small
dikes that post-date trachyte/phonolite and as rare clasts within parts of some heterolithic breccias. |
Pseudo-leucite
and sanidine phenocrysts set in a dark brown to greenish grey, fine-grained groundmass of devitrified glass, nepheline, K feldspar,
biotite, sodic pyroxene, and sulfides. Andradite garnet can occur rarely as both phenocrysts and groundmass. |
| Trachyte-phonolite
porphyries |
Stocks
and sills in the core of the intrusive complex. The most abundant lithology types; associated with and can be found locally as extrusive
flows along the outer margin. |
Sparse
to abundant sanidine phenocrysts ± subordinate phenocrysts of clinopyroxene, biotite, and/or feldspathoids dispersed in a
fine-grained, aphanitic groundmass of alkali feldspar ± devitrified glass, nepheline, and/or sodalite, biotite, augite, alkali
amphibole, and/or sulfide. Common disseminated pyrite. |
| Syenite |
|
Syenite,
nepheline syenite, and microsyenite and their porphyritic equivalents. Light to medium grey and range from fine-grained (microsyenite)
to medium or coarse-grained. Composed of alkali feldspar ± subordinate nepheline, biotite, clinopyroxene, alkali amphibole,
hornblende, sphene, olivine, magnetite, and pyrite. Rare allanite, apatite, pyrrhotite, and ilmenite as accessory phases. |
| Lamprophyre |
Dikes
and in local intimate association with syenite. |
Dark
grey to black and fine-grained. Contain a variable assemblage that may include biotite, pyroxene, alkali feldspar, nepheline, and/or
sulfides (mafic mineral abundances may exceed 50 percent. Sulfides are principally pyrite, and magnetite is a common accessory. |
| | | |
| Ore Reserves Engineering | Page 6-7 | 29 February 2024 |
FMR dikes and veins
are interpreted to represent primary carbonatites that were subjected to heavy supergene oxidation and weathering. This material occurs
as stockwork veinlets, veins, and dikes throughout the oxidation zone. They consist primarily of iron, manganese oxides, amorphous silica,
and variable abundances of silicate and accessory minerals. Silicate and accessory minerals include biotite, quartz, chalcedony, K feldspar,
apatite, barite, and celestite. The FMR veins and dikes can also host significant supergene REE minerals, generally of the bastnäsite
group. Toward the bottom of the oxidation zone, the FMR veins become transitional to carbonatite and carry residual carbonate and sulfide,
along with mixed primary and supergene REE mineralogy.
Fenitization (alkali-ferric
iron metasomatism), an alteration type often associated with carbonatites, is widespread across the Bear Lodge property and may be genetically
related to carbonatite intrusion. Fenitization was identified across the Bear Lodge property in a series of studies that utilized the
cathodoluminescence petrographic method. This type of alteration is spotty in the Bull Hill deposit area, based on petrographic examination
of the drill core and K abundance measurements made at the surface with a gamma ray spectrometer. Fenitized rocks are often difficult
to recognize in the field or drill core, except in the case of altered Precambrian granitic rocks, where the absence of quartz strongly
suggests interaction with alkali-ferric iron-rich fluids. The effect of fenitization in the Bear Lodge alkaline igneous rocks is the
destruction of primary magnetite, the replacement of primary plagioclase by K- feldspar, and the substitution of Fe3+ for
Al3+ in the lattice structures of the feldspars. This alteration may be accompanied by the precipitation of LREE-enriched
apatite or the LREE enrichment of primary apatite, and by sulfide deposition. Its distribution and paragenesis are not entirely understood
in the Bear Lodge REE Project. Duval Corporation drill hole WBD-12, collared south of Carbon Hill, intersected high-grade copper-silver
mineralization in a massive fenite halo on a carbonatite dike.
The Bear Lodge
alkaline-igneous complex hosts a variety of mineralization types, including gold, lanthanides (REE, rare earth elements), base metals
(Cu, Pb, Zn, and Mo), thorium (Th), and uranium (U). The REEs are contained within carbonatite-related dikes, veins, and stockwork. Gold
is generally associated with potassic alteration that may overlap or halo strong REE mineralization. Gold may be both structurally controlled
and disseminated.
The Bear Lodge
REE Project is located in the northern lobe and near the axis of the northwest-trending elongate dome, forming the Bear Lodge Mountain
Range. REE mineralization is associated with carbonatite and silicocarbonatite dikes, veins, and stockwork that intrude diatreme, heterolithic
breccias, and their host trachyte and phonolite intrusions. The northwest alignment of the three diatreme pipes (Bull Hill, Whitetail
Ridge, and Carbon Hill) coincides with numerous north- to northwest-striking alkaline igneous dikes and mineralized zones (Figure
6-5). The calcio carbonatite and silicocarbonatite dikes and the surrounding stockworks form a swarm cutting the diatremes; the main
dikes are generally concentrated within the margins of the diatreme, with smaller dikes and veinlets extending outward into the adjacent
wall rocks along a northwest-trending corridor.
| | | |
| Ore Reserves Engineering | Page 6-8 | 29 February 2024 |

Figure 6-5. Geological
Map of the Bear Lodge REE Project (Noble & Barrero 2024, modified after J. Ray-RER 2013)
Most rock units
within the project area are affected by widespread potassic alteration and have a thick near-surface oxidized zone. Recognizable hydrothermal
alteration includes pervasive fenitization (alkali-ferric iron metasomatism), K-feldspar-pyrite alteration, minor silicification, localized
argillic alteration, superimposed oxidation, and surface weathering.
Major structural
trends are oriented west-northwest, northwest (parallel to the axis of the dome), north, and northeast or east-northeast. Data obtained
in 2011 and 2012 from surface mapping of drill pads, roads, and trenches, along with borehole televiewer data and detailed geological
cross sections, support earlier district-wide observations that indicate a predominant orthogonal set of northwest and northeast structures,
as well as subordinate north-northwest, east-northeast, and northerly trending structures. Geophysical surveys (magnetics, radiometric,
and IP/resistivity) agree with the field data.
The emplacement
of REE mineralized carbonatite and carbonatite-related dikes, veins, and stockwork is controlled primarily along the northwesterly structures,
with subordinate controls along northerly and east-northeasterly structures. Carbonatite-related REE mineralization extends along the
northwesterly trending zone for more than 1800 meters. The greatest concentration of REE-mineralized bodies occurs in NW-trending dike
swarms and stockworks in the Bull Hill deposit area. Individual dikes can reach 80 feet in width (24.4m). Based on existing drilling,
the REE mineralization is open at depth.
| | | |
| Ore Reserves Engineering | Page 6-9 | 29 February 2024 |
Changes in mineralogy
and REE concentrations with depth are due to late-stage magmatic-hydrothermal and supergene alteration or weathering, which are responsible
for the increase in the REE grade within the most weathered zones (Hutchinson, et al., 2022) and for the vertical zonation with depth.
Weathering depth is variable with an upper weathered zone represented by strongly weathered/oxidized carbonatite with no residual calcite
underlain by granular calcite-bearing oxide material representing the moderately weathered carbonatite (Hutchinson, 2016). At Bull Hill
deposit, the basal portion of the latter is referred to as the transitional zone where the carbonatite is weakly weathered.
The main ore phases
in the unoxidized dikes are ancylite-(Ce) plus lesser carbocernaite. Furthermore, the REE minerals calcioancylite, bastnäsite, parisite,
synchisite, monazite, cheralite, burbankite, and cerianite occur in the oxidized and unoxidized carbonatites. Gangue minerals include
calcite, biotite, K-feldspar, apatite, clinopyroxene, strontianite, dolomite, barite, celestite, sulfides, and Fe-Ti oxides.
| 6.3.1 | Mineralization
Zones |
As mentioned earlier,
REE mineralization at Bear Lodge REE Project exhibits a generalized vertical zonation related to the degree of supergene oxidation, weathering,
and hydrothermal alteration of the carbonatite, which generally decreases with increasing depth. The generalized vertical distribution
of REE mineralization zones (from top to bottom) is summarized in Table 1-1 and described in detail in the following subsections.
Table 6-2. Zonal
REE Mineralogy in the Bear Lodge Carbonatite and Derivative Dikes and Veins from the surface to depth.
| Zones |
Mineralized
Body |
REE
Mineralogy |
| Oxide
(Ox) |
FMR
dikes and veins; oxidized and leached carbonatite (surface to appx. 5,600 feet/ 1,707 meters elevation, ±300-500 feet (91-152
meters) thickness)
FeOx-MnOx-REEs ± Ksp, ap, Q, bi |
Bastnäsite
group minerals (bastnäsite-dominant), monazite, ± variable, but generally subordinate cerianite |
| Oxide-Carbonate
(OxCa) |
Variably
oxidized and partially leached carbonatite
(variable thickness, surface to appx 5,600 feet/1,707 meters elevation)
FeOx-MnOx-REEs-calc ± Ksp, ap, Q, bi |
Bastnäsite
group minerals (bastnäsite-dominant), ancylite, monazite, ± variable, but generally subordinate cerianite |
Transitional
(Tran) |
Partly
oxidized carbonatite
(appx. 5,600 feet/1,707 meters elevation)
Calc-REE-sulfides-FeOx-REE ± Ksp, ap, aeg, bi |
Predominantly
ancylite; minor to significant bastnäsite group minerals, ± monazite |
Unoxidized/
Sulfide
(Sulf) |
Unoxidized
carbonatite and silicocarbonatite
( < 5,600 feet/1,707 meters elevation)
Calc-REE-sulfides (py-po±cp,sl,gn,mb)-bi ± Ksp, ap, aeg |
Predominantly
ancylite; minor to significant bastnäsite group minerals; ± minor monazite, carbocernaite, and burbankite |
The oxidized zone
extends from the surface to depths of up to 600 feet (183m). Within this zone, FMR occurs as stockwork veinlets, veins, and dikes and
represents primary carbonatite subjected to intense oxidation and complete to nearly complete leaching of gangue carbonates. FMR consists
primarily of iron and manganese oxides and amorphous silica, along with variable abundances of silicate and accessory minerals, including
biotite, quartz, chalcedony, K feldspar, apatite, barite, and celestite. The FMR hosts significant hydrothermal or supergene REE minerals,
dominantly bastnäsite group minerals, with subordinate monazite and cerianite.
| | | |
| Ore Reserves Engineering | Page 6-10 | 29 February 2024 |
The FMR dikes and
veins are typically black to rusty brown in color. Many are friable, and drill recoveries are often poor. However, some FMR bodies were
subject to late silicification and may be highly competent. REE grades tend to be higher in the FMR bodies than in the corresponding
carbonatite and can reach more than 20% TREO. The FMR bodies and mineralization style persist to depths of 300 feet (91 m) or more beneath
the surface.
| 6.3.1.2 | Oxide-Carbonate
Zone (OxCa) |
The oxide-carbonate
zone generally occurs at the base of the oxidized zone but may reach the surface in places. It extends to nearly 500 feet (152m) in depth.
This zone overlies the transitional zone and extends lateral to, or beneath, the oxidized zone. It is characterized by moderately to
strongly oxidized carbonatite, with less than 10% residual sulfides. The OxCa zone is visually similar to the oxidized mineralization
in the overlying oxide zone, with fully oxidized sulfides, but it contains variable quantities of residual matrix carbonate. The REE
mineral assemblage comprises a mix of fibrous bastnäsite, stubby ancylite, and variable monazite. Hexagonal pseudomorphs are in
evidence in this zone and contain bastnäsite group minerals and/or ancylite accompanied by strontianite and barite. Bastnäsite
appears to form mainly from the partial to nearly complete replacement of ancylite. The upper boundary of this zone is irregular and
locally shallows above some of the more robust dike zones.
| 6.3.1.3 | Transitional
Zone (Tran) |
Directly overlying
the unoxidized zone is a conformable, flat-lying, thin zone, generally less than 20 feet (6 m) thick, that occurs at depths of 500 to
600 feet (152-183m) beneath the surface.
This zone is characterized
by carbonatite-style mineralization with variable sulfides and variable indications of gangue mineral leaching. Between 10% and 90% of
the sulfides are oxidized to limonite. The transitional zone grades upward rapidly into the oxide-carbonate zone.
| 6.3.1.4 | Unoxidized
– Sulfide Zone |
The upper contact
of the unoxidized, or sulfide-bearing, zone is generally relatively flat-lying and extends from depth upward to within approximately
600 feet (183 meters) of the surface, locally deeper along structural zones. The bottom of this zone has yet to be reached by drilling.
The unoxidized zone is characterized by REE mineralization accompanied by sulfides, apparently with no oxidation or leaching of minerals.
REE mineralization in the carbonatite consists primarily of ancylite and subordinate REE fluocarbonates (bastnäsite group minerals
including bastnäsite, parisite, and synchysite) and minor monazite. Ancylite forms stubby, prismatic crystals that are intimately
intergrown with strontianite and minor barite ± minor bastnäsite group REE minerals in hexagonal pseudomorphs after an earlier
REE phase. Ancylite and the bastnäsite group REE minerals may also occur as discrete phases intergranular to the gangue minerals.
The gangue mineralogy in the carbonatite is dominated by calcite, with subordinate amounts of sulfide minerals ± biotite, apatite,
sanidine, barite, and/or strontianite.
The sulfide minerals
are present in amounts from less than 5% (locally less than 1%) to more than 20% and include pyrrhotite and pyrite ± minor amounts
of chalcopyrite, galena, sphalerite, and/or molybdenite. Pyrite is commonly the most abundant sulfide phase, although it is not uncommon
for pyrrhotite to be the most abundant. Sulfides are always unoxidized in this zone. REE grades in the carbonatite can reach over 10%
TREO, although typical grades of the dikes are less than 5% TREO.
| | | |
| Ore Reserves Engineering | Page 6-11 | 29 February 2024 |
| 6.3.1.5 | Stockwork
Mineralization |
Stockwork mineralization
consists of zones of intersecting veins and veinlets that tend to occur as envelopes along and between larger FMR/carbonatite veins and
dikes. Stockwork-type mineralization is common in all the REE mineralization zones summarized in Table 1-1. Individual veinlets
can range from sub-millimeter to meter widths and exhibit either random orientation or orientation sub-parallel to the major dikes and
veins. TREO grades in the stockwork mineralization tend to be lower than in the dikes and more prominent veins, ranging between approximately
0.5% and 3% TREO, contributing significantly to the contained TREO grade. Vein densities vary widely, with higher vein densities and
abundance of contained vein material generally corresponding to higher TREO grades within a given stockwork zone.
| 6.3.1 | Bear
Lodge REE Project Deposits |
The Bear Lodge
REE Project comprises two main areas represented by the Bull Hill and Whitetail Ridge deposits, and the exploration targets of the Carbon
Hill and East Taylor deposits (Figure 6-5). All the deposits have carbonatite-related dikes and veins that range in size from
hairline fracture veinlets to dikes that may exceed 80 feet (24.4m) in width. Lower-grade stockworks of veinlets commonly surround the
higher-grade REE-bearing dikes and veins. Oxidized mineralization (FMR and OxCa) extends to depths of 500 to 600 feet (152 to 183 meters).
Oxide zone REE mineralization is dominated by REE minerals of the bastnäsite group, with variable and typically subordinate quantities
of monazite and cerianite. Oxide-carbonate mineralization contains a variable mix of bastnäsite group minerals and ancylite, with
varied and subordinate amounts of monazite and cerianite.
REE mineralization
is widespread on the property. However, data suggest that the area proximal to the Bull Hill and Whitetail diatreme bodies is the most
prospective for significant REE mineralization.
The Bull Hill deposit
area forms the bulk of the Bear Lodge REE deposit (Figure 6-5). Generally, it exhibits light REE-enrichment (generally including
cerium/Ce, lanthanum/La, neodymium/Nd, praseodymium/Pr, and samarium/Sm). The mineralized zone extends approximately 1,700 feet (518
meters) in a north-westerly direction, by 300 feet (91 meters) to more than 700 feet (213 meters) in a north-easterly direction, reflecting
the overall orientation of a relatively persistent swarm of steeply dipping, northwest-striking dikes and veins of FMR and carbonatite.
Individual dikes display strike lengths of 300 to 800 feet (91 to 244 meters), down dip extensions of 300 feet (91 meters) to more than
800 feet (91 meters), and thicknesses of less than 20 feet (6 meters) to more than 80 feet (24.4m). Individual dikes can pinch, swell,
and bifurcate along strike and down dip. These generally follow the interfingering contact between the Bull Hill diatreme and adjacent
trachyte and phonolite.
The southern two-thirds
of the dike swarm east of Whitetail Creek (the drainage that borders the west flank of Bull Hill) includes a persistent northwest-striking
zone of dikes, veins, and stockwork and contains northerly-striking splays at either end. Within this zone is a relatively continuous
dike, locally more than 80 feet (24.4m) thick, steeply dipping to vertical, and multiple subparallel dikes. The main dike zone appears
to follow the interfingering contact between diatreme breccia and the host trachyte-phonolite unit in the south.
| | | |
| Ore Reserves Engineering | Page 6-12 | 29 February 2024 |
The West Bull Hill
zone, FMR, and carbonatite dikes, veins, and stockwork are variably hosted by diatreme, trachyte, and phonolite. To the south of Bull
Hill deposit, mineralization appears to be offset along an easterly-trending fault or feathers out close to the boundary with Section 20,
which is currently withdrawn from mineral entry and drilling. In the Bull Hill area, the structure, the diatreme contact, and host rock
lithology exhibit a complex interplay of controls on the localization of mineralization.
REE mineralization
in the Bull Hill Northwest area is contained within dikes, veins, and minor stockwork of FMR and carbonatite/silicocarbonatite that intrude
trachyte and phonolite. Less well-understood, owing to decreased drilling densities compared with the Bull Hill main area, the dikes,
veins, and stockwork zones are northerly trending, steeply dipping to vertical, and relatively narrow and broadly spaced. Individual
dikes appear to display strike lengths of less than 100 feet (30 meters), down dip extensions of more than 200 feet (60 meters), and
thicknesses of 10 feet (3 meters). The oxide zone extends downward to a relatively flat-lying contact with a narrow oxide-carbonate zone
conformable with a narrow transition zone (unlike the irregular oxide-carbonate upper contact at Bull Hill that locally extends to the
surface).
Pre-existing fractures
in more competent host rock in this area may have influenced the northerly orientations and size of the dikes and veins. The size and
spacing of veins, an elevated original sulfide content, and faults or structural zones may have enhanced the leaching of gangue carbonate
during oxidation, leaving little to no oxide-carbonate zone. In the northwest Bull Hill area, the structure appears to be the dominant
control on the localization of mineralization, and there may be additional mineralized zones to the north.
| 6.3.1.2 | Whitetail
Ridge Deposit |
REE mineralization
in the Whitetail Ridge area (Figure 6-5) is contained within discontinuous dikes, veins, stockwork FMR, and carbonatite/silicocarbonatite
hosted primarily by heterolithic breccia of the Whitetail diatreme. Higher-grade mineralized zones typically contain narrow, steeply
dipping dikes and veins up to 10 feet (3 meters) in thickness. Although the strikes of these zones are still being determined with drilling,
several dikes appear to trend north-northwesterly. This area exhibits enrichment of heavy REEs relative to the Bull Hill area, with increased
variable but still subordinate quantities of monazite and cerianite accompanying the bastnäsite group minerals. In addition, the
bastnäsite group minerals exhibit variable Ce depletion and common enrichment in Nd and Y. Monazite shows significant Nd enrichment.
The oxide-to-oxide-carbonate boundaries are variable in the area, similar to zones observed in the Bull Hill area. Lithology appears
to be the dominant control on the localization of mineralization. The diatreme seems to have been relatively permeable and less brittle
than host rocks in the other areas. Mineralization is dominantly hosted within discontinuous stockwork veinlets and hairline fractures
(referred to as disseminated deposits by Staatz, 1983).
| | | |
| Ore Reserves Engineering | Page 6-13 | 29 February 2024 |
| 6.3.1.3 | Carbon
Hill and East Taylor Deposits |
In these areas,
HREE-enriched FMR veins and stockwork zones were drilled from 2010 through 2012. They are particularly enriched in europium, terbium,
dysprosium, gadolinium, and yttrium (Eu, Tb, Dy, Gd, and Y, respectively). Carbon Hill is located approximately 800 feet (244 meters)
northwest of the Whitetail Ridge area (Figure 6-5). FMR veins and stockwork here are locally silicified and hosted by phonolite,
trachyte, and syenite. The East Taylor target is located approximately 2,500 feet (760 meters) west of the main Bull Hill area, and 2,500
feet (760 meters) southwest of the Whitetail Ridge (Figure 6-5). Steeply dipping FMR veins and stockwork are hosted by trachyte
and minor Deadwood Formation and define a zone that may extend more than 700 feet (213 meters) east-west by 250 feet (76 meters) north-south.
More drilling is needed to further delineate the extent and orientation of the mineralization in these areas.
| 6.4.1 | Carbonatite-Hosted
Rare Earths |
Many of the world’s
REE deposits are associated with carbonatites and alkaline igneous complexes and their weathering products. Carbonatites are of considerable
economic interest due to their geochemical enrichment in a range of elements, such as the rare earth elements (REEs), Nb, Ba, Sr, Ta,
Th, U, V, F, P, and Zr. This enrichment may reach ore grade for certain elements in some carbonatites, and carbonatite-associated deposits
continue to be the major source of Nb and REEs (Millonic & Groat, 2013). Some examples of well-known carbonatite deposits are
Mountain Pass (LREEs, USA), Oka and St Honoré (Nb, Canada), and Jacupiranga (P, Brazil).
From the carbonatites
known worldwide, only a small proportion host REE mineralization. The ages of carbonatites range from the Archean to the Cenozoic. However,
most of the carbonatite-related REE deposits are concentrated in the Mesozoic, as is the case of Bear Lodge carbonatite. Carbonatite-related
REE deposits have magmatic and hydrothermal signatures and are mainly hosted in igneous complexes composed of alkaline rocks and carbonatites.
Carbonatite bodies are usually related to deep regional faults that act as conduits for the migration of magma (e.g., Mountain Pass,
California).
The first stages
of enrichment in carbonatite systems typically occur through fractional crystallization, resulting in late-magmatic fluids greatly enriched
in REEs. These REE-bearing fluids may precipitate REE-rich minerals and/ or redistribute REEs via hydrothermal fluids, modifying existing
carbonatite minerals. Late-magmatic and post-magmatic enrichment processes (hydrothermal alteration and supergene enrichment) can play
an important role in the economics of rare earth element (REE)-bearing carbonatite deposits (Hutchinson, et al., 2022).
Many REE deposits
also display upgrading due to in-situ weathering; this additional enrichment in REEs can occur through dissolution and remobilization
of REEs, where minerals such as REE-fluorocarbonates are broken down, releasing REEs, which are reprecipitated as rhabdophane, gorceixite,
or other minerals under meteoric conditions, and by removal of gangue materials, in which minerals such as gangue carbonates are dissolved
and removed from the rock, generating porosity and increasing the concentration of REEs in the rock.
| | | |
| Ore Reserves Engineering | Page 6-14 | 29 February 2024 |
| 6.4.2 | Bear
Lodge REE Project |
Bear Lodge REE
Project deposits are, as a whole, one of the largest REE deposits in the United States (Staatz, 1983; Hutchinson, 2016) and are carbonatite
dike-hosted REE deposits. The REE-bearing minerals are concentrated within dominantly NW-trending, steeply dipping carbonatite dikes
that cut heterolithic diatreme breccias.
The REE-bearing
carbonatite dikes are commonly oxidized and were formed late in the magmatic sequence of the alkaline igneous complex (<46 Ma). The
dikes range from a few millimeters to 24 m wide and range in composition from calcite carbonatite to silicocarbonatite with a strong
Mn, REE and Sr enrichment. The main ore phases in the unoxidized dikes are ancylite-(Ce) plus lesser carbocernaite. REE minerals calcioancylite,
bastnäsite, parisite, synchisite, monazite, cheralite, burbankite, and cerianite occur in the oxidized and unoxidized carbonatites.
Isotopic values are interpreted to indicate a dominantly asthenospheric source for the carbonatite dikes (Millonic & Groat,
2013).
Late magmatic-hydrothermal
porosity generation and in situ weathering are responsible for the supergene REE enrichment. In the least weathered carbonatite, ancylite
is the dominant REE-bearing mineral where it appears to replace magmatic burbankite, as well as in the moderately weathered intervals
of carbonatite. The least altered carbonatite displays low porosity (~7–8%) with only trace oxidation of sulfides and minor precipitation
of Fe oxides. As weathering intensity increases, carbonatite exhibits stronger sulfide oxidation, manganese oxide replacement of Mn-rich
calcite, and partial dissolution of calcite. REE concentrations increased primarily because of volume loss from carbonate mineral dissolution.
The most weathered occurrences of carbonatite lack primary igneous carbonate minerals and consist largely of Fe and Mn oxides (FMR) with
other rare earth minerals (e.g., cerianite and REE-fluorocarbonates), suggesting subaerial exposure to oxidizing, meteoric fluids (Hutchinson,
et al., 2022).
The Bear Lodge
REE deposit exhibits a pronounced zonation between LREE- and HREE-enrichment. The Bull Hill deposit is enriched in light rare earth elements
(LREE). In contrast, peripheral deposits at Whitetail Ridge, Carbon Hill, and East Taylor are characterized by relative enrichment in
heavy rare earth elements, Yttrium (HREE’s and Y), and gold.
The Bear Lodge
carbonatites occur within an alkaline intrusive complex and share similarities with the Mountain Pass (California) carbonatite-hosted
REE deposit. Historically, starting in the late 1800s, the Mountain Pass district was prospected for base metals (Cu, Pb, and Zn) and
gold with a small mining gold operation between 1939 and 1941 (Sulphide Queen Mine). Later, in the 1940s, uranium exploration led to
the deposit's discovery in 1949. Mountain Pass deposit is the second largest REE deposit in the world. It is hosted in the Sulphide Queen
Carbonatite that intrudes into the Precambrian metamorphic basement with magmatic bastnäsite as the main ore mineral. Carbonatite
rocks intruded potash-rich igneous rocks (shonkinite, syenite, and granite) of Precambrian age forming swarms of thin dykes, stocks,
and the tabular sill-like body of the Sulphide Queen Carbonatite (Olson, et al., 1954). REE mineralization is only associated with carbonatite
intrusions. Carbonatite is genetically related to ultrapotassic rocks. Alteration is primarily fenitization of the adjacent country rocks
and local hydrothermal alteration and silicification.
| | | |
| Ore Reserves Engineering | Page 6-15 | 29 February 2024 |
| 6.5 | Qualified
Persons’ Statement on Geological Setting, Mineralization, and Deposit |
In the Qualified
Persons’ opinion, the knowledge about regional, local and project geology, mineralization style, alteration, structural and geological
controls on mineralization, and deposit type is considered adequate to support mineral resource estimation.
| | | |
| Ore Reserves Engineering | Page 6-16 | 29 February 2024 |
Most of the information
contained in this section is based on the compiled work of J. Ray (Noble, 2009; John T. Boyd Company, 2010; Roche-Engineering, 2012,
and Roche-Engineering, 2014).
Several major mining
companies have explored the Bear Lodge REE Project for REEs, precious metals, and base metals over the past 40 years. These various exploration
campaigns identified some rare earth occurrences that RER believed warranted further exploration and evaluation. Initial exploration
of the property was conducted by Molycorp, Hecla Mining Company, and Duval Corporation; the historical exploration activities undertaken
by these companies are described in detail in Chapter 5.
The Bear Lodge
REE Project comprises the RER exploration activities targeting REEs in several areas of the project (Figure 7-1). Past exploration
activity for gold by Newmont Exploration Limited and RER was conducted under the auspices of the Sundance Gold Project, and this will
not be described in the present report.

Figure 7-1. Location
of exploration (REE) target areas and resource drill holes in the Bear Lodge REE Project
| | | |
| Ore Reserves Engineering | Page 7-1 | 29 February 2024 |
| 7.2 | Exploration
Target Areas |
RER’s Bear
Lodge REE Project exploration activities focus on two carbonatite-related rare earth areas, the Bull Hill and Whitetail Ridge deposits,
and two identified exploration target areas, Carbon Hill and Taylor deposits.
Several previous
exploration target areas were incorporated into the Bull Hill deposit, referred to as Bull Hill SW, Bull Hill West, Bull Hill Southwest
Extension, and the Carbonatite Plug, or deep Bull Hill West. Geological characteristics of the REE deposits and target areas have been
described in detail in the previous chapter, and locations are provided in Figure 7-1. The exploration target areas are summarized
in Table 7-1 and briefly described in the following sections.
Table 7-1. Bear
Lodge REE Project Exploration Target Areas, 2004 through 2013
| Target
Area |
Location |
Comment |
| Bull
Hill (includes Bull Hill West and Bull Hill SE extension) |
The
west flank of Bull Hill |
NW
to N trending dike swarm, drilled previously by three Hecla Mining Company holes. 144 new core holes (2004 – 2013) delineate
a system of dikes, veins, and stockwork; additional radiometric and soil surveys, trenches, and surface samples indicate mineralization. |
| Carbonatite
Plug (Deep Bull Hill West) |
Southwest
of Bull Hill, west of drainage (previously inferred West Bull Hill Fault”) |
Postulated
REE-mineralized carbonatite plug beneath stockwork carbonatite carapace, IP anomaly at depth; multiple RER, Hecla Mining Company,
and Molycorp Inc., drill holes intersect FMR/CBT stockwork and veins at shallow to moderate depths. Two deep holes (2010) intersect
dense CBT/SBT dikes, breccia, and stockwork at depth; possible down dip projection of dikes at SW Bull Hill and/or plug carapace. |
| Bull
Hill Northwest |
Approximately
1,000 feet (300 meters) north of the Bull Hill deposit |
High-grade
REE-mineralized dike or dikes first intersected by Hecla Mining Company drill hole WP-2. Approximately 18 core holes (2007-2011)
indicate the presence of northerly trending, steeply dipping narrow dikes hosted primarily by trachyte and phonolite. |
Whitetail
Ridge |
Approximately
500- 1,000 feet (150-300 meters) west of the Bull Hill NW deposit and 1500 feet (460 meters) NW of the Bull Hill deposit |
Strong
REE mineralization in FMR and Ox-Ca dikes, veins, and stockwork, with a coincident radiometric anomaly. Tested by Hecla Mining Company
drill hole WP-1 and USBM shallow holes. Approximately 62 core holes (2010-2013) indicate N to WNW trending, steeply dipping narrow
veins, and widespread disseminated stockwork zones, hosted primarily by diatreme; moderate HREE enrichment. |
| Carbon
Hill |
Approximately
800 feet (250 meters) northwest of Whitetail Ridge deposit |
Area
coincident with previous Au target areas; selected intervals from 2 RC holes (2010) contain strong REE mineralization within FMR
veins and stockwork and localized silicification; hosted in syenite breccias and phonolite; 5 core and 6 RC holes (2011-2012) confirm
strong REE mineralization and indicate HREE enrichment. |
Taylor |
Approximately
2,500 feet (700 meters) west of Bull Hill deposit |
Area
coincident with previous Au target areas: selected intervals from 1 RC hole (2010) contain strong REE mineralization within FMR dikes,
veins, and stockwork hosted in trachyte-phonolite; 7 core holes (2011) confirm strong REE mineralization and indicate HREE enrichment. |
The Bull Hill deposit
consists of an REE-mineralized carbonatite dike swarm and associated enveloping stockwork zones located within and along the western
margin of the Bull Hill diatreme. Near-surface iron oxide-manganese oxide-rare earth (FMR) and oxide-carbonate (OxCa) dikes, and veins
are interpreted to be intensely (FMR) and moderately to weakly (OxCa) oxidized and leached equivalents of the carbonatite dikes at depth.
The Bull Hill dike swarm was discovered by Hecla Mining Company and described in an unpublished Hecla Mining Company report (Wineteer,
1991).
| | | |
| Ore Reserves Engineering | Page 7-2 | 29 February 2024 |
RER conducted additional
drilling from 2004-2013 to confirm the mineralized bodies' continuity and grade. The increased drilling density shows that the southern
two-thirds of the dike swarm east of the drainage (Whitelaw Creek) includes a persistent northwest-striking zone of dikes, veins, and
stockwork that envelops a relatively continuous, steeply dipping main dike that locally reaches 80 feet (24 meters) in width and multiple
sub-parallel dikes.
Drilling from 2010
through 2013 indicates that the zone of REE-mineralized dikes, veins, and stockwork persists well to the west of the main Bull Hill dikes.
Drilling conducted during 2011 - 2013 indicates that the southeastern end of the dike swarm feathers out, terminates, and/or is offset
along an easterly trending fault that is approximately coincident with the northern boundary of Section 20 (currently Mineral Withdrawal
Land, Figure 7-1). The Bull Hill deposit remains open to the west, northwest, and north.
| 7.2.1 | Carbonatite
Plug (Deep Bull Hill West) |
The presence of
a deep carbonatite plug located beneath the Bull Hill West area (now part of the Bull Hill area) had been inferred from drilling and
geophysical surveys that include airborne magnetics, ground IP/resistivity, and reprocessed NURE geophysical data. Molycorp Inc., drill
holes BL-1, BL-8, BL-9, and BL-12, Hecla Mining Company drill holes WP-7 and WP-8, and several RER drill holes intersect significant
intercepts of weakly mineralized (1-3% total REO) FMR stockwork, sulfide-bearing carbonatite, and silicocarbonatite stockworks and breccias
in this area. The stockwork zones are interpreted to represent the brecciated carapace over a buried carbonatite plug.
During the 2010
drilling season, RES10-57 targeted the inferred carbonatite plug. It intersected extensive deep carbonatite dikes and brecciation with
grades up to 3.8% TREO, consistent with an interpretation as the apical carapace of a large, buried carbonatite body. The deep carbonatite
plug target has since been abandoned because mining of the sulfide zone is not currently part of the development plans. The overlying
area was extensively drilled to target the shallower oxide and oxide-carbonate zones in 2011 and 2012, with further discovery of FMR
and Ox-Ca dikes, veins, and stockwork.
The Bull Hill Northwest
deposit is located approximately 1,000 feet (300 meters) north of the main Bull Hill deposit. Hecla Mining Company discovered strongly
mineralized FMR and carbonatite dike bodies in this area in drill hole WP-2. Drilling in 2010 provided evidence for a narrow, steeply
dipping, northerly trending system of FMR, OxCa, and carbonatite dikes hosted predominantly by trachyte and phonolite. The RER drilling
suggests that Hecla’s drill hole WP-2 may have penetrated down-dip along a northerly-striking dike, resulting in a long high-grade
mineralization intercept. Further drilling did not confirm the WP-2 intercept. Additional controls on mineralization in the Bull Hill
NW area include widespread NE to ENE fractures and joints, and these structures may have played a role in focusing the mineralization.
Several near-surface NNE trending hematitic fracture zones (possible faults) traverse this target area and may further complicate the
dike orientation and distribution interpretation.
| | | |
| Ore Reserves Engineering | Page 7-3 | 29 February 2024 |
Soil geochemical
and radiometric anomalies within approximately 500 feet (150 meters) NNE of this area and the current distribution of significant drill
intercepts indicate that the deposit remains open to the north and provides an attractive exploration target area. Further drilling is
needed to define mineralization in this area better.
The Whitetail Ridge
deposit is located approximately 1,500 feet (460 meters) northwest of the Bull Hill deposit. The USBM explored a disseminated stockwork
REE deposit in the Whitetail Ridge area in the early 1950’s. Evaluation of the historic USBM data, along with results of detailed
geological mapping and sampling, a positive ground radiometric anomaly, and REE mineralization in nearby drill holes, confirmed this
area as a prospective target.
Historic drill
hole WP-1, drilled within the Whitetail Ridge target area by Hecla Mining Company in 1987, intersected 430 feet (131 meters) averaging.44%
TREO in a near-surface intercept from 0 to 430 feet (131 meters). Several 10-foot (3-meter) intercepts with grades ranging from 5.5 to
13.7% TREO are contained within the larger intercept. RER conducted additional detailed geological mapping and rock chip sampling in
2010 and drilled two core holes to follow up the anomaly at WP-1 (RES10-20 and RES10-21). Encouraging aspects of the drill holes include
intercepts of more than 70 feet (21 meters) at 4.1% TREO (approximate true thickness of 36 feet or 11 meters) and the presence of several
steeply dipping, higher-grade zones surrounded by lower grade stockwork. The deposit remains open, and further drilling is expected to
expand the deposit and better define the extent and continuity of the REE mineralization.
| 7.2.4 | Carbon
Hill and Taylor |
Two reverse circulation
drill holes (SUN-076 and SUN-079) completed during the 2010 Sundance gold exploration program were collared south of the Carbon Hill
diatreme and approximately 800 feet (250 meters) northwest of the Whitetail Ridge deposit. Significant moderate enrichment of HREE in
FMR vein material hosted by trachytic and syenitic intrusive rocks was identified and suggests a new REE exploration target area that
may be an extension of the Whitetail Ridge REE area. The Carbon target was tested by three (3) core holes in 2011, and by six (6) reverse
circulation (RC) and two (2) core holes in 2012. Drilling results warrant further exploration drilling on the Carbon Hill target.
The Taylor target
is located (approximately 2,500 feet (700 meters) west of Bull Hill. A reverse circulation drill hole (SUN-090), collared at Taylor and
completed during the 2010 Sundance gold exploration program, yielded significant HREE-enriched REE mineralization in FMR dikes, veins,
and stockwork in trachyte and the Deadwood Formation. In 2011, the RC hole was twinned and offset with a total of 7 core holes, confirming
the presence and nature of mineralization drilled by SUN-090. The mineralized zone has an apparent East-West trend and remains open both
to the east and west. These results and the significant HREE enrichment elevate the target to a high priority.
| | | |
| Ore Reserves Engineering | Page 7-4 | 29 February 2024 |
| 7.3 | Exploration
Activities |
| 7.3.1 | Exploration
between 2004 and 2013 |
RER began the exploration
of the Bear Lodge REE Project properties for REE in late 2004. Paso Rico (USA), the predecessor entity to RER, had conducted limited
geological and geophysical work. Exploration was initially focused on the southwest Bull Hill area identified and explored by Hecla Mining
Company from 1987 through 1991. Most of the core drill holes targeted strike and dip extensions of the carbonatite dike swarm at the
Bull Hill SW target. RER's exploration activities at the Bear Lodge REE Project between 2004 and 2013 are summarized in Table 7-2.
Table 7-2. Bear
Lodge REE Project Exploration Activities, 2004 through 2013
| Year |
Drilling |
Other |
Area |
Results |
| 2004-
2008 |
12
core holes 13,317 feet (4059m) |
|
Bull Hill |
Confirm
dike continuity, grade from historic drilling. No drilling in 2006. |
| 2009 |
20
core holes 15,388 feet (4690m) |
|
Bull Hill, Bull Hill NW |
Continued
infill, step-off drilling, 200 feet ( 60 meters) centers, Bull Hill dike swarm; confirm Bull Hill NW |
| |
Ground radiometric survey |
Bull
Hill, Bull Hill NW &W, Whitetail Ridge, Carbon Hill |
Radiometric
anomalies coincident with REE’s and structures |
| |
Mapping & rock chip sampling |
Bull
Hill drill roads |
High
REE associated with Fe-Mn Ox surface veins, stockwork |
| 2010 |
65
core holes 42,409 feet (12,926m) |
|
Bull
Hill, Bull Hill NW, Whitetail Ridge, Bull Hill W |
Continued
infill, step-off drilling, 100 to 200 feet (30 to 60 meters) centers, Bull Hill deposit |
| 3
SUN RC |
|
Carbon,
Taylor |
Selected
intervals w/FMR and significant TREO |
| |
Ground radiometric survey |
Infill,
expand prior Bull Hill to Carbon survey; Cole claims |
NE
broad anomalies cut by narrower NW zones; NS zone over Bull Hill (dike?) |
| |
Soil
survey |
Infill
Newmont survey, Bull Hill |
NITON
results comparable to lab; strong anomalies at Bull Hill, Bull Hill W |
| |
CSAMT
survey |
Bull
Hill and Au target areas (Carbon, Taylor) |
Definition
of Au and possible REE structures, dikes, and diatreme |
| |
Mapping & rock chip sampling |
Whitetail
Ridge; drill roads, drill pads |
High
REE associated with Fe-Mn Ox surface veins, stockwork; exposed E-NE veins, Bull Hill |
| 2011 |
63
core holes 48,474 feet (14,775m) |
|
Bull
Hill, Bull Hill W, Whitetail Ridge, Carbon, Taylor, Bull Hill NW |
Continued
infill, step-off drilling100 to 200 feet (30 to 60 meters) centers, Bull Hill deposit and target areas |
| |
Borehole
televiewer surveys |
Bull
Hill, Bull Hill W, Whitetail Ridge, Taylor |
5
drill holes surveyed; lithologic, mineralization, and structural data; confirm NW and NE fabric |
| |
CSAMT
survey |
Expansion
of 2010 survey, esp. Bull Hill |
Definition
of structures, contacts, possible identification of diatreme and dikes |
| |
Trenches; mapping, radiometric surveys, channel sampling |
Bull Hill, Bull Hill W |
Strong
NE jointing fabric; also cross-cutting NW dikes, veins; exposed dikes Bull Hill W |
| |
Mapping
and rock chip sampling |
Drill roads, drill pads |
High
REE associated with Fe-Mn Ox surface veins, stockwork; exposed E-NE, N veins, Bull Hill W, Taylor |
| 2012 |
82
core holes 57,419.5 feet (14,719.4m) |
|
Bull
Hill, Bull Hill W, Whitetail Ridge |
Definition
and infill of Bull Hill, expansion of Bull Hill W, definition of Whitetail Ridge, PQ bulk sample core for met tests |
| |
Geotechnical
core holes |
Bull
Hill, Bull Hill W, Whitetail Ridge |
Recommended
drilling for slope stability studies |
| 42
SUN RC holes 24,805 feet (7,563m) |
|
Pug site, Section 16, Whitetail Ridge, Taylor,
Carbon |
Core
twin study and expansion at Whitetail Ridge, Section 16 condemnation, PUG site condemnation, exploration at Taylor and Carbon. |
| 2013 |
14
core holes 11,698 feet (3566.5m) |
|
Whitetail Ridge |
Infill drilling for better definition |
| 21
core holes 10,651 feet (3,247m) |
|
Bull Hill |
Infill
drilling for better definition of high- grade dike zone |
| 6
RC holes 2,730 feet (832.1m) |
|
Bull
Hill |
Twin
select PQ core holes to determine reliability of RC methodology in FMR ore zones |
Drilling programs
in 2004, 2005, 2007, and 2008 were limited; from 2009 through 2013, RER conducted aggressive core drilling campaigns in order to expand
and upgrade the deposit at Bull Hill, as well as to test additional target areas, including Bull Hill NW, Whitetail Ridge, Bull Hill
West, Carbon Hill, and Taylor. In addition, geophysical surveys, geological mapping, and sampling were carried out to identify additional
targets and improve geological understanding of controls on mineralization. A summary of the drilling footage completed by RER is summarized
in Table 7-3, and the drilling used for resource estimation is shown in Figure 7-2.
| | | |
| Ore Reserves Engineering | Page 7-5 | 29 February 2024 |
Table 7-3. Exploration
drilling for REE performed by RER
| |
Date |
DH
Type |
Number
of Drill holes |
Total
Drilling |
Assayed
Intervals |
| |
ft |
meters |
Exploration
Drilling
(not
included in resource estimation) |
2004 |
DDH
Core |
3 |
3,248.0 |
990.0 |
36
|
| 2005 |
2 |
2,174.0 |
662.6 |
11
|
| 2007 |
3 |
3,057.0 |
931.8 |
58
|
| 2008 |
4 |
4,840.0 |
1,475.2 |
77
|
| Total
Core |
12 |
13,319.0 |
4,059.6 |
182 |
Exploration
Drilling
(included
in resource estimation) |
2009 |
DDH
Core |
22 |
16,232.5 |
4,947.7 |
1,650
|
| 2010 |
63 |
41,021.0 |
12,503.2 |
4,384
|
| 2011 |
64 |
49,363.5 |
15,046 |
5,139
|
| 2012* |
68 |
57,587.0 |
17,552.5 |
6,314
|
| 2013 |
35 |
22,350.5 |
6,812.4 |
3,004
|
| Total
Core |
252 |
186,712.5 |
56,910,0 |
20,491 |
RC
(not included
in resource estimation) |
2012 |
RC |
42 |
24,805.0 |
7,560.6 |
2,481
|
| 2013 |
6 |
2,730.0 |
832.1 |
442
|
| Total
RC |
48 |
27,535.0 |
8,392.7 |
2,923 |
| |
Total
Drilling |
312 |
227,566.5 |
69,362.3 |
23,596 |
Bulk
Sampling/Met Testing
(not included
in resource estimation) |
2010 |
DDH
Core |
40 |
3,870.0 |
1,179.6 |
|
| 2011 |
38 |
5,821.5 |
1,774.4 |
|
| 2012 |
14 |
6,853.5 |
2,088.9 |
|
| Total
Met Drilling |
92 |
16,545.0 |
5,042.9 |
|
* Includes seven
unsplit geotechnical Holes
From 2010 through
2012, 92 large-diameter (PQ) core holes totaling 16,545 feet (5,042.9 m) were drilled to provide bulk sample material for metallurgical
testing.
The 2009 exploration
program was increased from previous years, as well as additional geological mapping and geophysical surveys in the Bull Hill and Whitetail
Ridge areas. The extended 2010 through 2013 exploration and drilling programs were designed to continue expanding and upgrading existing
resources and identify and explore new targets. Geological mapping and geophysical surveys were directed towards improving the understanding
of the surface structural signatures and controls on mineralization within the deposits and project area.
| | | |
| Ore Reserves Engineering | Page 7-6 | 29 February 2024 |
Ground radiometric
and soil surveys were conducted in 2009 and 2010, and controlled source audio-magneto-telluric (CSMAT) surveys over both rare earth and
surrounding precious metal target areas in 2010 and 2011. Geological mapping, rock chip sampling, and radiometric surveys were carried
out in areas with newly created exposures of sub-crop and outcrop, including drill roads and drill pads. Trenches excavated during the
2011 field season exposed sub-crops and outcrops in the Bull Hill resource area. The trenches were a focus of detailed mapping, sampling,
and radiometric surveys.

Figure 7-2. RER
2009-2013 Exploration drilling included in the mineral resource estimate (Noble & Barrero, 2024)
In 2013, fourteen
HQ core holes were drilled at the Whitetail Ridge resource area for a total of 11,697.5 feet. The program's objective was to upgrade
the size and resource category of the Whitetail Ridge oxide resources and further delineate the HREE (Eu, Tb, Dy, and Y) enrichment in
the deposit. Borehole televiewer surveys were conducted on selected drill holes during the 2011 through 2013 drill seasons and provided
additional detailed geological and structural information.
Following the Whitetail
Ridge development drilling, 21 PQ core holes and six (6) reverse circulation (RC) drill holes were drilled along the high-grade
dike zone at Bull Hill in order to gain a better understanding of the grade distribution in the zone and to provide additional material
for ongoing pilot plant testing. The RC drill holes twinned selected PQ drill holes; however, the RC holes did not correlate well with
the PQ holes, and the RC holes are not used for resource estimation purposes.
| | | |
| Ore Reserves Engineering | Page 7-7 | 29 February 2024 |
The current spacing
between fences of drill holes within the main Bear Lodge REE Project area ranges from approximately 100 to 800 feet (30 to 250 m), with
fences 100 feet (30 m) and 200 feet (60 m) apart in the three main project areas. Drill hole spacing along the fences ranges from 100
to 200 feet (30 to 60 m)
Core drilling operations
between 2004 and 2013 were performed by several drilling contractors (AK Drilling of Butte, Montana; Godbe Drilling LLC of Montrose,
Colorado; and Layne Christensen Company; Major Drilling of Salt Lake City, Utah).
The holes were
generally drilled with HQ-sized core (77.8 mm inside diameter), reducing to NQ (60.3 mm inside diameter) with depth. In deep holes, the
diameter was reduced from HQ to NQ and then from NQ to BQ (46.1 mm diameter). From 2009 through 2012, most holes were drilled with HQ-sized
core, except for 15 holes that were reduced to NQ prior to the end of the hole. In 2013 HQ-sized core was used for the Whitetail Ridge
infill drilling and PQ (101.6 mm diameter) for the Bull Hill high-grade infill drilling.
The unoxidized
carbonatite dikes, along with FMR and OxCa veins and dikes, the near-surface oxidized equivalents of the carbonatite dikes, were the
target of most drilling completed in the Bull Hill area through 2008. From 2004 through 2008, core recovery in the friable, leached,
and weathered FMR zones was generally much lower than in the more competent OxCa and sulfide-bearing carbonatite rocks, with a range
from 0 to 100% and an average recovery of slightly better than 70 percent. The low recoveries are due primarily to the presence of the
variably leached and fractured FMR dikes, veins, and stockwork, which tend to fracture and disaggregate easily during the drilling process.
The zones may also contain void space that also reduces recoveries. The void space results from the dissolution of matrix carbonate in
the original host.
After changing
the mud formula, core recovery in the oxidized zone was improved significantly during the 2009 drilling program to better than 80%; core
recovery in the transitional and unoxidized carbonatite zones was generally ≥ 90% to 100%. In 2010, 2011, and 2012, the efforts to
improve core recoveries continued, achieving average core recoveries of FMR dikes and veins of 80% in the oxide zone and 88% in the oxide-carbonate
zone. Recoveries in transitional and sulfide zones averaged 94%. Analysis of relative recoveries in the different resource areas and
oxidation zones has been continual during the different campaigns.
The recovery issues
with FMR in HQ core suggested using PQ core for bulk sampling of FMR and oxide-carbonate material for metallurgical testing. Friable
FMR zones generally maintain integrity much better in PQ than in HQ core, owing to the larger diameter of the PQ core. The higher volume
of material in the PQ-size core appears to better absorb the bit rotation torque. Consequently, less material is lost to the “plucking”
of FMR veins and stockwork on the core surface. While this was the case for PQ core drilling conducted through 2012, recoveries were
somewhat poorer and exhibited more variation in the 2013 Bull Hill high-grade infill program. Core recoveries in this program averaged
86.8% and ranged between 77 and 92 percent.
| | | |
| Ore Reserves Engineering | Page 7-8 | 29 February 2024 |
Core recovery is
highly variable, primarily because the low strength of the FMR mineralization allows it to be easily broken and washed from the core
sample. Overall, the average core recovery is 86.6% but is lower in oxidized, high-FMR zones and higher in the wall rock and fresh carbonatite
zones. There is an inverse relationship between core recovery and FMR content; samples with FMR <30% generally have higher recovery
than samples with FMR>30% (Table 7-4).
Table
7-4. Core Recovery by Oxide Type and FMR Content (Roche-Engineering, 2014)
| Oxide
Type |
%FMR |
Footage |
Meters |
Average
Recovery (%) |
| Oxide |
<30 |
99,885 |
30,445
|
85.5 |
| Oxide |
>30 |
13,915 |
4,241
|
77.5 |
| Oxide |
0-100 |
113,800 |
34,686
|
84.5 |
| OxCa |
<30 |
35,687 |
10,877
|
89.8 |
| OxCa |
>30 |
9,184 |
2,799
|
83.6 |
| OxCa |
0-100 |
44,871 |
13,677
|
88.5 |
| Trans |
<30 |
4,461 |
1,360
|
93.9 |
| Trans |
>30 |
640 |
195
|
94.1 |
| Trans |
0-100 |
5,102 |
1,555
|
93.9 |
| Sulfide |
<30 |
11,425 |
3,482
|
96.3 |
| Sulfide |
>30 |
1,734 |
529
|
95.9 |
| Sulfide |
0-100 |
13,158 |
4,011
|
96.2 |
| Total |
<30 |
151,458 |
46,164
|
87.5 |
| Total |
>30 |
25,472 |
7,764
|
81.4 |
| Total |
0-100 |
176,930 |
53,928
|
86.6 |
(Note: For purposes
of this report, %FMR in transitional and sulfide mineralization refers to percent carbonatite).
The average core
recovery for the different oxide types is generally above 80%. Transition and sulfide samples have the highest recovery, and more than
60% of non-oxidized samples have greater than 95% core recovery. The distribution of core recovery for oxide and OxCa samples is similar,
but oxide samples are more heavily weighted towards recovery below 80% (Figure 7-3).
Local sampling
bias resulting from poor recoveries in the FMR zones is likely as well-mineralized but poorly consolidated material might be washed away
during the drilling process. There may also be void zones that lack mineralized material. In 2012, definitive void areas were not included
in assay intervals and were tabulated as voids.
| | | |
| Ore Reserves Engineering | Page 7-9 | 29 February 2024 |

Figure
7-3. Core Recovery Distribution by Oxidation Type (Roche-Engineering, 2014)
Original collar
location and down-hole survey data are available for only a few historical drill holes. However, these drill hole collar locations were
re-surveyed using a hand-held GPS, and collar elevations were obtained by registering the drill holes on the USGS digital elevation model
(DEM) for the appropriate quadrangle maps. Drill hole data prior to 2008 has not been used for resource estimates because the azimuths
and inclinations were considered insufficiently accurate for use in resource estimates.
Drill hole collar
surveys for 2008 through 2013 were surveyed by Bear Lodge Ltd., professional engineers and land surveyors based in Sundance, Wyoming.
Collars were marked and surveyed after completing each hole in the WGS84 geographic coordinates and were measured and corrected on the
fly while in the field. Geographic coordinate corrections are based on a correction factor transmitted from an accurately located base
station set up by Bear Lodge Ltd. in the vicinity of the surveyed area. Bear Lodge Ltd. has also routinely provided the data in several
coordinate systems, including NAD83 and the Wyoming State Plane System. Bear Lodge REE Project data utilized for development activities
and resource estimates is reported in NAD83 UTM Zone 13N US survey feet coordinates.
Down-hole surveys
were conducted on all core holes drilled by RER from the 2008 through 2013 drill programs. Survey point intervals were approximately
every 100 feet (30.5 m), and surveys were carried out by the drillers utilizing an electronic single-shot instrument (Reflex EZ- SHOT).
The instrument is sensitive to magnetic interference. After retrieval, measurements were read and recorded from a digital display on
the instrument at the collar and subsequently entered into the database, where azimuth measurements were corrected to true north using
appropriate magnetic declination for the drilling period, as determined by the NOAA declination calculator.
Deviations in azimuth
and dip are considered acceptable and are usually lower in the PQ holes than in the HQ holes.
| | | |
| Ore Reserves Engineering | Page 7-10 | 29 February 2024 |
| 7.3.1.5 | Density
Determination Method |
Oxidation of carbonatite
mineralization removes substantial quantities of carbonates and sulfides, leaving behind FMR mineralization that is much lighter because
of increased pore space. Thus, density highly depends on the degree of oxidation and the fraction of lighter FMR mineralization or heavier
carbonatite mineralization relative to the surrounding wall rocks.
Through the 2013
drilling seasons, 337 dry density measurements were made on drill cores to determine the density of mineralization and wall rocks from
all oxidation states (Table 7-5). Dry density was determined using a water-displacement method with vacuum sealing of the core
samples in a polymer bag. This is an acceptable and more suitable method than the conventional water-displacement method, especially
for difficult samples, such as vuggy/porous samples, weathered samples or samples with high clay content, friable samples, high FMR samples,
and samples with poor cohesiveness.
Table 7-5. Summary
of Density Measurements (Roche-Engineering, 2014)
| Rock
Type |
Count |
Min
Density |
Max
Density |
Average
Density |
Std.
Dev. Density |
Mean
Std. Error of Mean |
Average
%H2O |
| Oxide
FMR |
66 |
0.918 |
3.069 |
1.814 |
0.434 |
0.054 |
18.9 |
| OxCa
FMR |
67 |
0.878 |
2.859 |
2.158 |
0.415 |
0.051 |
11.2 |
| Transition
Carbonatite |
3 |
2.07 |
2.547 |
2.322 |
0.433 |
0.25 |
7.4 |
| Sulfide
Carbonatite |
17 |
2.116 |
3.7 |
2.909 |
0.437 |
0.106 |
0.8 |
| Siliceous
Carbonatite |
2 |
2.807 |
2.834 |
2.82 |
0.433 |
0.306 |
0.4 |
| Host
Rock Oxide |
93 |
1.692 |
2.585 |
2.261 |
0.132 |
0.014 |
3.8 |
| Host
Rock OxCa |
46 |
1.945 |
2.652 |
2.324 |
0.143 |
0.021 |
3.6 |
| Host
Rock Transition |
7 |
2.28 |
2.942 |
2.545 |
0.253 |
0.096 |
1.9 |
| Host
Rock Non-Oxide |
36 |
2.348 |
2.845 |
2.588 |
0.096 |
0.016 |
0.7 |
In August 2014,
a trenching program was undertaken on the southwest flank of Bull Hill to provide high-grade REE ore for metallurgical research (Figure
7-4). A total of approximately 1200 tons of ore were extracted and stored. The trench system exposed a prominent NW-trending FMR
zone with mineralized (nearly sheeted) veins and fractures trending from N10-15W to N50W, with predominant vertical and sub-vertical
to moderate dips from NNE to ENE.
The main mineralized
zone of the Bull Hill deposit was exposed, allowing the collection of geological information essential for evaluating dike dimensions
and continuity, assessing grade variations, documenting ore and gangue mineralogy, and collecting geotechnical data. Trench exposures
confirmed excellent continuity of the main dike along 300ft of strike with local bifurcations; dike widths vary from 8 to 20 feet (Ray,
et al., 2014).
| | | |
| Ore Reserves Engineering | Page 7-11 | 29 February 2024 |
Each bulk sample
was described during the collection process so that future batch-test results could be cross-referenced with respect to the inherent
variability of the original extracted volume. Nine 120-ton bulk samples were collected on 25-foot spacing, with 2-ton representative
sub-samples collected from each block. Nine 30-pound assay samples were collected from each sub-sample to estimate grade and grade continuity.
These assays range from 3.65% to 14.65% TREO and average 10.1% TREO. Four cross trenches were excavated and sampled (six 12-ton bulk
samples, each with a 0.5-ton sub-sample and an assay sample) to provide material to test the processing character of mid- to low-grade
stockwork material and help ascertain the trend and character of the dike and adjacent stockwork zones.
Rock samples for
various analytical and metallurgical tests were collected and described, and the location recorded under the supervision of the RER geological
staff. The Main Met and Crosscut Met Samples are stored in sealed 55-gallon drums in a secure shed.
An additional 96
geological samples were collected for further research, including combinations of various petrographic techniques and assays (QEMSCANM,
SEM, Cl, and standard thin section for mineralogical characterization). Sample preparation followed the same QAQC procedures as the drilling
samples. Sample analysis was performed by Activation Laboratories.

Figure 7-4.
View to the east of the Bull Hill Test Trench 2014 area showing the main cut parallel to the hill slope and four crosscut trenches
along a trench length of 300 feet.
Although the test
trench data has not been used for the current resource estimation, comparing the current estimation with the grade data obtained in the
exposed mineralized dikes will be important for future studies. This trench material will be used for the Demonstration Plant, which
is expected to be operational in the 3rd Quarter of 2024.
| 7.3.3 | Geotechnical
Drilling |
Geotechnical drilling
was completed as part of a field data collection program completed in 2012 by Sierra Geotechnical LLC. Seven (7) core holes totaling
4,550 feet (1387 m) were drilled to provide geotechnical information and were surveyed by a televiewer; the drill core of these holes
remains unsplit and has been sub-sampled for geotechnical laboratory testing.
| | | |
| Ore Reserves Engineering | Page 7-12 | 29 February 2024 |
| 7.3.4 | Hydrogeological
Characterization |
RER conducted an
extensive hydrologic investigation in the past to support prior permitting related to the Bear Lodge REE Project. Groundwater monitoring
wells were installed in the past, and RER continues with the data collection. However, the authors of this report have not investigated
this data.
| 7.3.5 | Qualified
Persons’ Statement on Exploration Drilling |
Collar and downhole
survey methods used by RER between 2009 and 2013 are considered to meet industry standards. Although the rock mass is not magnetic, a
nonmagnetic continuous downhole surveying tool should be considered in the future.
Diamond drilling
methods are considered adequate for resource estimation, although core recovery should be closely monitored during drilling in future
drilling programs. Core recovery is a significant issue for resource estimation since low recovery implies preferential loss of the softer,
more friable rare earth mineralization, especially in the oxide zone. RC drilling methods are not recommended in the future.
The density determination
procedure on core samples was closely monitored in the past by ORE (Roche-Engineering, 2014) and is considered adequate for resource
estimation.
Considering the
observations in section 7.3.1.2, there appears to be a significant chance that TREO grade is biased low, especially for ore-grade
mineralization. This bias was evaluated in previous reports (Roche-Engineering, 2014) by compiling footage-weighted average TREO grades
for oxide and OxCa samples grouped by %FMR above and below 30% and by core recovery above and below 95% (Table 7-6).
The 30% FMR cutoff
was chosen because it corresponds roughly to the threshold between stockwork-dominant mineralization (below 1.5% TREO) and vein-dominant
mineralization (above 1.5% TREO).
The results of
this evaluation suggest that low recovery, high-%FMR samples are biased low compared to high-recovery samples. The terminology apparent
bias is used here because it cannot be shown that the bias is an actual bias rather than an artifact of some other parameter until large
tonnages are mined and compared to drill-hole grades. In addition, even if the bias is real, it may be larger or smaller than shown in
Table 7-6 if the estimate of %FMR is also biased (Roche-Engineering, 2014).
Table 7-6. Apparent
TREO grade bias for low and high core recovery samples (Roche-Engineering, 2014)
| Grade
Range |
Oxidation
Type |
Low
Recovery (0-95%) |
High
Recovery (>95%) |
All
Samples |
Apparent
Bias Relative to Low-Recovery Samples |
| Footage |
Meters |
Average
TREO |
Footage |
Meters |
Average
TREO |
Footage |
Meters |
Average
TREO |
| <30%
FMR |
Oxide |
64,399 |
19,611 |
0.838 |
37,257 |
11,356 |
0.770 |
101,656 |
30,985 |
0.813 |
9% |
| OxCa |
23,246 |
7,085 |
0.817 |
13,455 |
4,101 |
0.695 |
36,701 |
11,186 |
0.772 |
18% |
| Ox+OxCa |
87,646 |
26,715 |
0.833 |
50,712 |
15,457 |
0.750 |
138,358 |
42,172 |
0.802 |
11% |
| >30%
FMR |
Oxide |
7,636 |
2,327 |
3.953 |
3,440 |
1,049 |
4.504 |
11,076 |
3,376 |
4.124 |
-12% |
| OxCa |
5,662 |
1,726 |
3.840 |
2,403 |
732 |
4.239 |
8,064 |
2,458 |
3.959 |
-9% |
| Ox+OxCa |
13,297 |
4,053 |
3.905 |
5,843 |
1,781 |
4.395 |
19,140 |
5,834 |
4.054 |
-11% |
| | | |
| Ore Reserves Engineering | Page 7-13 | 29 February 2024 |
The Qualified Persons
are unaware of any other factors that could materially affect the accuracy and reliability of the RER exploration drilling results between
2009 and 2013 and assume that the information was collected and processed using industry-standard practices.
Qualified Persons
have no access to the existing geotechnical data. In the Qualified Persons’ opinion, the previous design recommendations (Sierra
Geotechnical LLC., 2013) are limited, although sufficient for the current level of pit optimization. Further geotechnical investigations
are recommended to better characterize the rock mass parameters of the different oxide types and refine slope design parameters for future
studies.
In the Qualified
Persons’ opinion, hydrological characterization is beyond the scope of this report. Additional hydrological investigations should
be performed in future studies.
| | | |
| Ore Reserves Engineering | Page 7-14 | 29 February 2024 |
| 8 | SAMPLE
PREPARATION, ANALYSES, AND SECURITY |
This section has
been updated from the Technical Reports of 2012 (Roche-Engineering, 2012) and 2014 (Roche-Engineering, 2014), as no further drilling
has been performed at the Bear Lodge REE Project since 2013.
| 8.2 | Sample
Preparation Methods and Analytical Laboratories |
| 8.2.1 | Historic
Sample Preparation and Analyses |
Because of the
limited amount of information available from the Molycorp, Inc., Hecla Mining Company, and Duval Corporation data, the historical
drilling data are used only to assist in geologic interpretation and guide exploration; they are not used for resource estimation purposes.
| 8.3 | Rare
Element Resources (RER) Sample Preparation and Analyses |
A summary of the
sample preparation procedure, assay laboratory, and assay method for the different RER drilling programs is provided in Table 8-1.
RER-trained personnel, using a hydraulic splitter, split the drill core longitudinally onsite. Half of the core was retained in the core
box and stored, and the other half was bagged and shipped for sample preparation and analysis.
None of the 2004-2005
and the 2007-2008 assays are currently being used for resource estimation; the 2004-2005 and the 2007-2008 drill hole data were replaced
with more reliable information from the 2009 through 2013 drill programs. In the Qualified Persons’ opinion, the quality of sample
preparation and analytical procedures followed by RER are considered adequate and within current industry standards.
| 8.4 | Laboratory
Certifications |
ALS and Activation
Laboratories are both ISO 9001 accredited and operate to standards consistent with ISO 17025 methods. Sample preparation laboratories
do not require certification; however, RER conducted quality checks on the preparation laboratory by submitting preparation duplicates
to the analytical laboratories and evaluating the resultant data.
| | | |
| Ore Reserves Engineering | Page 8-1 | 29 February 2024 |
Table 8-1. Summary
of the sample preparation procedures and assay methods (RER drilling programs)
| |
Sample Preparation Laboratory |
Sample Preparation Procedure |
Assay Laboratory |
Assay Method |
Assayed Elements |
| 2004-2005 |
ALS Chemex (Canada) |
crushed to 70% passing -10 mesh (-2 millimeters). 250-gram split pulverized into a pulp of 85% passing -200 mesh (-75 microns) |
ALS Chemex |
|
REE, Au, Fe, Mn, U, Th, and Y. |
| 2007-2008 |
Actlabs (Canada) |
crushed to 70% -10 mesh (-2 millimeters). 250-gram split pulverized into a pulp 85% passing -200 mesh (-75 microns) |
Actlabs |
REE and multi-element geochemical with lithium metaborate fusion with ICP/MS finish (ActLabs code 4B2-STD). Au by 30-gram fire assay with a neutron activation finish (ActLabs code 1A1) |
REE (La, Ce, Pr, Nd, Sm, Eu, Gd, Tb, Dy, Ho, Er, Tm, Yb, Lu, and Y), Au, V, Cr, Co, Ni, Cu, Zn, Ga, Ge, As, Rb, Sr, Zr, Nb, Mo, Ag, In,Sn, Sb, Cs, Ba, Hf, Ta, W, Tl, Pb, Bi, Th, and U |
| 2009 |
Minerals Exploration & Environmental Geochemistry (MEG), (Reno, Nevada) |
roll crusher followed by jaw crushing to 85% -10 mesh (-2 millimeters), 250-gram split pulverized into a pulp of 85% -200 mesh (-75 microns). |
ActLabs |
REE and multi-element geochemical with lithium metaborate fusion with ICP/MS finish (ActLabs code 4B2-QUANT). Au by 30-gram fire assay with AA finish (ActLabs code 1A2). Over-limit REE assays - 4B2-STD-QUANT |
REE (La, Ce, Pr, Nd, Sm, Eu, Gd, Tb, Dy, Ho, Er, Tm, Yb, Lu, and Y), Au, V, Cr, Co, Ni, Cu, Zn, Ga,
Ge, As, Rb, Sr, Zr, Nb, Mo, Ag, In, Sn, Sb, Cs, Ba, Hf, Ta, W, Tl, Pb, Bi, Th, and U |
| 2010 |
ALS |
REE and multi-element geochemical with lithium metaborate fusion with an ICP/MS finish (ALS code ME-MS81h). Au by 30-gram fire assay with an ICP/AES finish (ALS code Au-ICP21). Over-limit REE using a lithium metaborate fusion with ICP/AES finish (ALS Code ME-OGREE). |
REE (La, Ce, Pr, Nd, Sm, Eu, Gd, Tb, Dy, Ho, Er, Tm, Yb, Lu, and Y), Sn, Ta, Tb, Th, U, W, Zr, and Au |
| 2011 |
ALS |
| 2012 |
ActLabs |
REE and multi-element geochemical with lithium metaborate fusion with ICP/MS finish (ActLabs code 8-REE). Au by 30-gram fire assay with AA finish (ActLabs code 1A2). Over-limit REE assays part of the (8-REE package) |
REE (La, Ce, Pr, Nd, Sm, Eu, Gd, Tb, Dy, Ho, Er, Tm, Yb, Lu, and Y), Au, Ag, As, Ba, Be, Bi, Co, Cr, Cs, Cu, Ga, Ge, Hf, In, Mo, Nb, Ni, Pb, Rb, Sb, Sc, Sn, Sr, Ta, Th, Tl, U, V, W, Zn, Zr and major oxides (SiO2, Al2O3, Fe2O3(T), MnO, MgO, CaO, Na2O, K2O, TiO2, P2O5, and LOI) |
| 2013 |
ActLabs |
| 8.1 | Quality
Control & Quality Assurance |
| 8.1.1 | RER´s
Internal Standards |
Eleven (11) internal
standards were developed for the QAQC of the RER drilling programs between 2009 and 2013. All the materials were collected from REE mineralization
on the Bear Lodge property. Material for Standard series RE09001X through RE09006X was collected from Bear Lodge REE Project drill rejects
of oxide, transitional, and sulfide mineralization types. The RE09007X and RE10001X – RE10004X series standards were collected
as bulk samples from mineralized outcrop exposed by roads being developed for new drill sites on the property.
| | | |
| Ore Reserves Engineering | Page 8-2 | 29 February 2024 |
MEG performed the
sample preparation for the Round-Robin certification. Participating laboratories certificated to ISO 9003 Standards were ALS Chemex (Vancouver,
Canada), Activation Laboratories (Mississauga, Ontario), SGS (Toronto, Canada), ACME Labs (Vancouver, Canada), and Genanalysis and UltraTrace
(Perth, Australia). Participating laboratories not certificated to ISO 9003 Standards were Mountain States R&D International (Vail,
Arizona), Memorial University of Newfoundland, and Hazen Labs (Golden, Colorado).
The analytical
methods used for the certification were 4-acid digestion or a lithium metaborate fusion on 0 followed by an ICP finish for Y, Ce, La,
Pr, Nd, Sm, Eu, Gd, Tb, Dy, Ho, Er, Tm, Yb and Lu. Fusion digestions show improved accuracy and precision for REE analyses over analytical
methods using 4-acids. Thus, the 4-acid data was not used for certification of the standards. Standards RE09007X and RE01001X-RE1004X
were certified using lithium metaborate fusions with ICP-OES finish. The means and standard deviations were calculated for all the analytical
data for each standard material and used to determine the certified values.
| 8.1.2 | 2009-2013
Assay Quality Control & Quality Assurance |
RER. enacted a
quality control program in 2007, concurrently with the change of analytical laboratories from ALS Chemex to Activation Laboratories.
The 2007-2008 Quality
Assurance Protocol included:
| · | Blank
samples to monitor contamination. |
| · | Assays
of internal standards provided by ActLabs. |
| · | Assays
of analytical duplicate samples. |
The 2009-2013 Quality
Assurance Protocol included:
| · | Individual
drill holes are submitted as separate jobs. |
| · | A
minimum of two (2) duplicates, two (2) lower-grade standards, two (2) higher-grade
standards, and two (2) blanks are included with each drill hole submitted for analysis. |
| · | Sample
numbers were used rather than drill hole numbers and footage to identify each sample. MEG
prepared the core samples and inserted the quality control samples into the sample stream,
which were then blinded to the analytical laboratories. |
| · | MEG
prepared crush (preparation) and pulp (analytical) duplicates from the materials submitted
for preparation. |
| · | 10%
insertion rate of quality control samples, meaning eight control samples in an analytical
batch size of eighty (80) samples (one (1) duplicate, one (1) high-grade standard,
one (1) low-grade standard, and one (1) blank every forty (40) samples). |
In 2014, at the
request of RER, Dr. Jeffrey Jaacks of Geochemical Applications International Inc. (GAII) conducted a review of the results for the
quality assurance and quality control (QA/QC) program used in rare earth element assaying for the Bear Lodge REE Project exploration
drill programs conducted during 2009 and 2012-2013 at Activation Laboratories and drill programs conducted during 2010-2011 at ALS Laboratories.
Quality control data reviewed include 2009 standards, blanks, preparation (crush), analytical (pulp) duplicate results, and the 2010-2013
check analysis program results. The results of the QAQC review are presented in the following sections.
| | | |
| Ore Reserves Engineering | Page 8-3 | 29 February 2024 |
During the 2009-2011
drill programs, the blanks were prepared by MEG from the same volcanic matrix material in a series of batches. RER used a quartz sand
sample blank for the 2012 and 2013 drilling campaigns. Both blank matrixes contained very low concentrations of the LREE. However, the
LREE concentrations exceeded the background analytical threshold of 15 times the detection limit. HREE analyses (Eu, Gd, Tb, Dy, Ho,
Er, Tm, Yb, and Lu) indicated detectable concentrations of these elements, but all were less than 15 times the lower detection limits.
The assay results
indicate no carry-over contamination for the LREE elements and that the concentrations of LREE were due to natural background rather
than contamination in the blanks. Analytical reproducibility of the LREE in these materials indicates that the blanks are excellent low-grade
standards for the LREE. It is recommended not to continue using these blank materials as quality control material to monitor contamination
in future drilling programs.
| 8.1.2.2 | RER
Internal Standards Results |
When the number
of quality control analyses for the laboratory of choice far exceeds the original number of analyses in the standard certificate, it
is acceptable practice to use statistics for the standards, which are calculated based on the current analytical method at the laboratory(ies)
used in the drill program to evaluate QA/QC results. These statistics ("historical mean and standard deviation") were used
to evaluate the standard assay results and are within 2-5% of the original values established by the qualifying Round-Robin studies.
The historical
statistics derived from analyses for the combined 2009-2013 drill programs, along with the number of assays used to generate these statistics,
are shown in Table 8-2. The "% TREO" is each standard total percent average of rare earth oxide content.
The percent RSD
or Relative Standard Deviation, the standard deviation divided by the mean, measures the standard's performance. A well-behaved standard
has an RSD value of less than 5%. Materials with RSDs of less than 15% are acceptable for use as certified reference materials. Materials
with RSDs of greater than 15% are generally not used or certified as reference materials. The percent RSD values for the assayed internal
standards are shown in Table 8-3, where the elements with RSDs of greater than 15% have been highlighted.
The internal standards
were initially certified for Y, La, Ce, Pr, Nd, and Sm analyses. The results in Table 8-3 show that the standard history analyses
have acceptable accuracy and precision for analyses of Y, La, Ce, Pr, Nd, Sm, Eu, and Gd but are not as effective for the heavier rare
earth elements (Tb, Dy, Ho, Er, Tm, Yb, and Lu), because of the difficulty that both Actlabs and ALS have in producing consistently reliable
analyses for samples with low concentrations of heavy rare earth element from year to year as the instrumental calibrations change. This
fact should not significantly impact resource calculations, as the total heavy rare earth element oxide percentage of the combined heavy
(Gd through Lu) oxides amounts to less than 1-2% of the samples' total rare earth oxide content. The RSD values for the %TREO shown in
Table 8-2 are acceptable, with values of less than 4.5.
| | | |
| Ore Reserves Engineering | Page 8-4 | 29 February 2024 |
The RSDs for %TREO
for each individual laboratory are elevated by the year-to-year calibration changes, which impact the analytical results but should have
no significant impact on resource calculations owing to the low concentrations of these elements.
Table 8-2. Standard
Statistics Generated from 2009-2013 Drill Standard Analyses (Roche-Engineering, 2014)
| Standard |
RE09001X |
RE09003X |
RE09004X |
RE09006X |
RE09007X |
RE10001X |
RE10003X |
| Count |
141 |
258 |
77 |
64 |
120 |
11 |
339 |
| Element
|
Mean
± 2SD |
Mean
± 2SD |
Mean
± 2SD |
Mean
± 2SD |
Mean
± 2SD |
Mean
± 2SD |
Mean
± 2SD |
| TREO
(%) |
1.65
± 0.13 |
1.69
± 0.15 |
4.18
± 0.24 |
4.11
± 0.30 |
1.80
± 0.08 |
0.88
± 0.05 |
3.35
± 0.54 |
| Y
(ppm) |
154
± 17 |
104
± 12 |
160
± 21 |
117
± 13 |
234
± 13 |
110
± 9 |
447
± 41 |
| La
(ppm) |
3505
± 346 |
3854
± 399 |
10672
± 765 |
10643
± 740 |
4208
± 206 |
1851
± 86 |
8552
± 728 |
| Ce
(ppm) |
5997
± 532 |
6444
± 677 |
16008
± 1070 |
16211
± 1601 |
6319
± 354 |
3132
± 208 |
12934
±1063 |
| Pr
(ppm) |
711
± 70 |
720
± 73 |
1631
± 125 |
1672
± 136 |
694
± 38 |
349
± 17 |
1349
± 119 |
| Nd
(ppm) |
2705
± 242 |
2581
± 253 |
5706
± 380 |
5328
± 405 |
2581
± 121 |
1385
± 84 |
4893
± 413 |
| Sm
(ppm) |
526
± 51 |
416
± 43 |
837
± 60 |
629
± 42 |
576
± 31 |
327
± 23 |
1066
± 100 |
| Eu
(ppm) |
123
± 13 |
86
± 8 |
163
± 11 |
114
± 8 |
154
± 8 |
80
± 6 |
292
± 22 |
| Gd
(ppm) |
292
± 64 |
195
± 57 |
373
± 69 |
299
± 213 |
401
± 41 |
183
± 8 |
768
± 126 |
| Tb
(ppm) |
22.1
± 4.2 |
13.7
± 3.8 |
22.1
± 3 |
17.8
± 13.7 |
37.4
± 4.2 |
15.8
± 1.3 |
73.9
± 9.5 |
| Dy
(ppm) |
62.3
± 9.1 |
38.6
± 6.5 |
59.6
± 10 |
40.2
± 6.9 |
105
± 9.3 |
43.2
± 3.6 |
216.8
± 26.8 |
| Ho
(ppm) |
6.5
± 1.7 |
4.1
± 1.3 |
5.8
± 2.5 |
4.1
± 1.7 |
9.7
± 0.9 |
4.2
± 0.6 |
20.5
± 3.9 |
| Er
(ppm) |
11.7
± 6.5 |
8
± 5.3 |
10.1
± 4.1 |
12.5
± 19 |
14.3
± 3.1 |
7
± 1.5 |
29.5
± 10.4 |
| Tm
(ppm) |
1.2
± 0.3 |
0.9
± 0.2 |
1.2
± 0.4 |
0.9
± 0.2 |
1.4
± 0.3 |
0.8
± 0.1 |
2.6
± 0.5 |
| Yb
(ppm) |
7.7
± 2 |
6
± 1.3 |
8.1
± 1.3 |
6.5
± 2.1 |
7.8
± 1.5 |
4.7
± 0.6 |
14.8
± 5.1 |
| Lu
(ppm) |
1
± 0.2 |
0.8
± 0.1 |
1.2
± 0.1 |
0.9
± 0.2 |
1
± 0.2 |
0.6
± 0.1 |
1.9
± 0.6 |
| | | |
| Ore Reserves Engineering | Page 8-5 | 29 February 2024 |
Table 8-3. Standard
RSDs Generated from 2009-2013 Drill Standard Analyses (Roche-Engineering, 2014)
| Standard |
RE09001X |
RE09003X |
RE09004X |
RE09006X |
RE09007X |
RE10001X |
RE10003X |
| Count |
141 |
258 |
77 |
64 |
120 |
11 |
339 |
| Element |
%
RSD |
%
RSD |
%
RSD |
%
RSD |
%
RSD |
%
RSD |
%
RSD |
| TREO
|
3.8 |
4.5 |
2.9 |
3.6 |
2.2 |
2.7 |
3.6 |
| Y |
4.5 |
4.9 |
3.3 |
3.8 |
2.8 |
4 |
4.5 |
| La |
4.9 |
5.2 |
3.6 |
3.5 |
2.4 |
2.3 |
4.3 |
| Ce |
5.3 |
4.7 |
3.5 |
3.7 |
2.8 |
3.3 |
4.1 |
| Pr |
4.9 |
5.1 |
3.6 |
3.4 |
2.7 |
2.4 |
4.4 |
| Nd |
4.9 |
5 |
3.8 |
4.1 |
2.3 |
3 |
4.2 |
| Sm |
5.7 |
5.9 |
6.5 |
5.6 |
2.7 |
3.5 |
4.7 |
| Eu |
4.4 |
5.3 |
3.3 |
4.9 |
2.5 |
3.7 |
3.8 |
| Gd |
7.3 |
8.4 |
8.3 |
8.6 |
5.1 |
2.3 |
8.2 |
| Tb |
13.5 |
15.9 |
21.4 |
20.2 |
5.6 |
4.1 |
6.4 |
| Dy |
10.9 |
14.7 |
9.3 |
35.6 |
4.4 |
4.1 |
6.2 |
| Ho |
9.6 |
14.1 |
6.7 |
38.4 |
4.9 |
7.2 |
9.4 |
| Er |
13.4 |
10.9 |
7.8 |
15.7 |
10.8 |
10.4 |
17.7 |
| Tm |
27.9 |
33.2 |
20.4 |
76 |
11.2 |
7.6 |
9.6 |
| Yb |
9.7 |
8.1 |
5.7 |
8.2 |
9.9 |
6.1 |
17.2 |
| Lu |
10.9 |
10.8 |
14.8 |
12.9 |
11.1 |
9.6 |
16.6 |
The statistics
of the quality control results for the standards are given in Table 8-4. As mentioned previously, the historical statistics compare
favorably with the original Round-Robin statistics generated for the RER internal standards. The bias between the two sets of means is
within 8.5 percent, with one exception. Analyses of the RE10001X standard are biased 27.7 percent higher than the original Round-Robin
analyses.
The RSDs are all
less than 5 when including analyses at both ALS and Actlabs. There are less than 17 samples, for any given standard, exceeding the warning
control limit of the mean ± 2 standard deviations (or well below the 5% failure limit). A limited number of samples (less than
1%) exceed the mean ± 3 standard deviations. The accuracy of the internal standards analyses is considered acceptable for resource
estimation.
| | | |
| Ore Reserves Engineering | Page 8-6 | 29 February 2024 |
Table 8-4. 2009-2013
Drill Standard Assay Results (Roche-Engineering, 2014).
| TREO
(%) |
Certificate
Mean |
Historical
Mean ± 2SD |
Count |
%
Bias |
%
RSD |
#>10% |
#
>2SD |
#
>3SD |
| RE09001X |
1.49 |
1.65
± 0.13 |
141 |
10.7 |
3.8 |
2 |
6 |
1 |
| RE09003X |
1.69 |
1.69
± 0.15 |
258 |
0 |
4.5 |
6 |
3 |
2 |
| RE09004X |
4 |
4.18
± 0.24 |
77 |
4.5 |
2.9 |
1 |
4 |
1 |
| RE09006X |
4.2 |
4.11
± 0.3 |
64 |
-2.1 |
3.6 |
1 |
2 |
0 |
| RE09007X |
1.41 |
1.80
± 0.08 |
120 |
27.7 |
2.2 |
0 |
6 |
0 |
| RE10001X |
0.88 |
0.88
± 0.05 |
11 |
0 |
2.7 |
0 |
0 |
0 |
| RE10003X |
3.24 |
3.35
± 0.54 |
339 |
3.4 |
3.6 |
6 |
17 |
5 |
The RE09003X and
RE09006X standards were used for the 2009 analytical program at Actlabs. The RE09001X, RE09003X, RE09004X, RE09006X, RE09007X, and RE10003X
standards were used for the 2010-2011 analytical program at ALS and the 2012 analytical program at Actlabs. The RE09003X, RE09007X, RE10001X,
and RE10003X standards were used for the 2013 analytical program at Actlabs.
The results of
the standard analyses for %TREO for the 2009-2013 drill programs are displayed graphically in Figure 8-1 through
Figure
8-7. Sequence numbers are presented on the X-axis and concentration on the Y-axis. The historical
mean is indicated by the solid red line, and the ± 2 standard deviation (SD) control limits are depicted by the dashed blue lines,
located above and below the red historical mean line. The dashed red lines depict the ± 3 standard deviation control limits, and
the ± 10% (of the mean) control limits are depicted by the dashed green lines.
Visual examination
of the quality control plots for %TREO reveals that the standard analyses exceeding ± 2 standard deviations exceed these control
limits, but very rarely exceed ± 3 standard deviations. None of the failures cluster, and the failures do not occur systematically
within any given analytical certificate for the rare earth elements.
For Standards RE09003X
(Figure 8-2) and RE09006X (Figure 8-4), the Actlabs assays display a better precision than the ALS analyses, but the analyses
from both laboratories show comparable accuracy. There is less than a 2 percent bias in comparable analyses between the two laboratories.
The standards statistics
and control plots indicate that rare earth element analyses from Actlabs and ALS for the 2009-2013 drill programs are of acceptable accuracy
for resource analyses.
| | | |
| Ore Reserves Engineering | Page 8-7 | 29 February 2024 |
Figure 8-1. RE09001X Standard
Analyses for % TREO (Roche-Engineering, 2014)

Figure 8-2. RE09003X Standard
Analyses for % TREO (Roche-Engineering, 2014)

Figure 8-3. RE09004X Standard
Analyses for % TREO (Roche-Engineering, 2014)
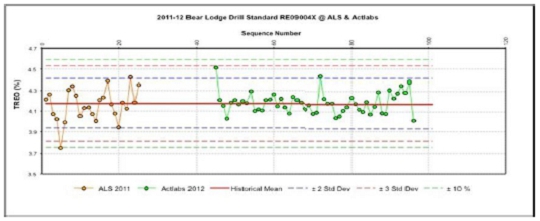
| | | |
| Ore Reserves Engineering | Page 8-8 | 29 February 2024 |
Figure 8-4. RE09006X Standard
Analyses for % TREO (Roche-Engineering, 2014)

Figure 8-5. RE09007X Standard Analyses for % TREO (Roche-Engineering,
2014)

Figure 8-6. RE01001X Standard
Analyses for % TREO (Roche-Engineering, 2014)

| | | |
| Ore Reserves Engineering | Page 8-9 | 29 February 2024 |
Figure 8-7. RE01003X Standard
Analyses for % TREO (Roche-Engineering, 2014)

| 8.1.2.3 | 2009-2013 Duplicates |
Five hundred and five (505) crush-duplicates
(preparation duplicates) were prepared from selected drill intervals to evaluate preparation reproducibility at Minerals Exploration
Geochemistry Laboratory (MEG). The %TREO statistics for the crush duplicates are tabulated in Table 8-5. The crush duplicates
show acceptable preparation precision. The correlation between the original and duplicate results is high, and the bias is low. More
than 95% of the crush-duplicate assays are within ± 20% of the original assays. The crush duplicates display acceptable preparation
precision for resource estimation.
Four hundred and seventy-six (476) pulp duplicates
(analytical duplicates) were prepared from selected drill intervals to evaluate analytical reproducibility at Actlabs and ALS laboratories.
The %TREO statistics for the crush duplicates are tabulated in Table 8-5. The pulp duplicates show acceptable analytical precision
for the %TREO assays. The correlation between the pulp duplicates and the original assays is high. Over 97% of the pulp duplicate analyses
are within ± 10% of the original analyses. The pulp duplicates display acceptable analytical precision for resource estimation.
Figure
8-8 shows the quality control plots for the duplicates. A precision envelope of ± 20% is shown in blue dashed lines
centered about the solid red 1:1 line (indicating 100 % correlation) for the crush duplicates. A precision envelope of ± 10% is
shown in the analytical duplicates. Ninety-five percent (95%) of the crush duplicate analyses are within ± 20 percent of one another
for the %TREO analyses. Ninety-seven percent (97%) of the pulp duplicate analyses are within ± 10 percent of one another for the
%TREO analyses.
| | | |
| Ore Reserves Engineering | Page 8-10 | 29 February 2024 |
Table 8-5. 2009-2013 Crush
and duplicate statistics (Roche-Engineering, 2014)
| |
TREO
% |
| Statistics |
Original
Crush |
Duplicate
Crush |
Original
Pulp |
Duplicate
Pulp |
| Count
|
505 |
505 |
476 |
476 |
| Minimum |
0.013 |
0.009 |
0.012 |
0.012 |
| Maximum |
22.83 |
24.486 |
22.813 |
24.063 |
| Mean
|
1.246 |
1.234 |
1.32 |
1.32 |
| Std
Deviation |
2.113 |
2.168 |
2.228 |
2.261 |
| Precision
|
9.3 |
6.5 |
| %
Bias |
1.0 |
0.0 |
| Correlation
|
1.0 |
1.0 |
| %
of samples within 10% of one another |
79 |
97 |
| %
of samples within 20% of one another |
95 |
99 |
Figure 8-8. 2009-2013 Crush
and duplicate control plots (Roche-Engineering, 2014)

| 8.1.2.4 | 2010-2013 Check
Analysis Programs |
Four check analysis programs were conducted with
samples from the annual drill programs. The check samples were randomly selected from the population of samples with %TREO grades exceeding
1.0% for each year. The 2010 and 2011 sets of check samples were sent to Actlabs for analysis. The 2012 and 2013 check analysis samples
were sent to ALS for analysis, as both labs use a comparable analytical method to analyze the REE elements. Standards, blanks, and pulp
duplicates were also inserted to monitor analytical accuracy and precision. These quality control samples indicated acceptable accuracy
and precision within each check program. The results of the check analysis programs are presented in Table 8-6.
| | | |
| Ore Reserves Engineering | Page 8-11 | 29 February 2024 |
Five hundred and eighteen check samples were
analyzed from 2010 to 2013 at ActLabs and ALS. All check analyses show strong correlation and acceptable precision for %TREO. Precision
varied from 5.2 to 11.8%. The bias between laboratories varied from -0.5% in 2013 to 9.0% in 2010. However, the overall bias averages
around 2.6% between the two laboratories, which is within acceptable limits. From 2010 to 2013 inclusive, more than 89% of check analyses
are within ± 10% of the original analyses (the N<10% column), and more than 96% of the check analyses are within ± 20%
(the N<20% column) of one another.
Table 8-6. 2010-2013 Check
Analysis Program Results (Roche-Engineering, 2014)
| 1°
Lab |
Check
Lab |
Year |
Number
of Samples |
Min
%TREO |
Max
%TREO |
Actlabs
Bias (%) |
Precision
(%) |
N
< 10% (%) |
N<
20% (%) |
| ALS |
Actlabs |
2010 |
75 |
0.99 |
11.3 |
5.8 |
7.6 |
92 |
97 |
| ALS |
Actlabs |
2011 |
163 |
0.93 |
24 |
1.6 |
5.2 |
96 |
99 |
| Actlabs |
ALS |
2012 |
114 |
0.91 |
5.08 |
9 |
11.8 |
72 |
96 |
| Actlabs |
ALS |
2013 |
166 |
0.99 |
24.22 |
-0.5 |
8.8 |
92 |
94 |
| |
|
2010-2013 |
518 |
0.91 |
24.2 |
2.6 |
8.7 |
89 |
96 |
Figure
8-9 shows the quality control plot for the combined 2010-2013 check analysis programs for %TREO. A precision envelope of ±
10% is shown in blue dashed lines centered about the solid red 1:1 line for the check analyses. 2010 check analyses are shown with orange
dots, 2011 check analyses with yellow dots, 2012 check analyses with green dots, and 2013 check analyses with red dots. Correlation within
any given year is excellent. It can be observed that the 2010 and 2012 groupings are more biased (closer to the 10% control limit) than
the 2011 or 2013 check analyses, which lie closer to the 1:1 red line.

Figure 8-9. Control plot for
the 2010-2013 check assay program (Roche-Engineering, 2014)
| | | |
| Ore Reserves Engineering | Page 8-12 | 29 February 2024 |
| 8.1.3 | 2009-2013 QA/QC Conclusions |
· The blanks
used in the 2009-2013 drill programs contained low concentrations of the light rare earth elements. It is recommended not to continue
using these blank materials as quality control material to monitor contamination in future drilling programs.
· The quality
control internal standards display acceptable accuracy for %TREO and the light rare earth elements (Y, La, Ce, Pr, Nd, Sm, Eu) analyses
of 2009-13 drill samples. The %TREO results show that less than 3% of the standard assays exceed the mean ± 2 standard deviation
control limits, and less than 0.1% exceed the mean ± 3 standard deviation failure limits.
· Crush
duplicates indicate acceptable precision or reproducibility for sample preparation at MEG. Ninety-five percent (95%) of the crush duplicate
analyses are within ± 20% of the original analyses. The crush duplicates display acceptable preparation precision for resource
estimation.
· Pulp
duplicates indicate acceptable precision or reproducibility for analyses at ALS and Actlabs. Ninety-seven percent (97%) of the pulp duplicate
analyses are within ± 10% of the original analyses. The pulp duplicates display acceptable analytical precision for resource estimation.
· The 2010-2013
check analyses programs validate earlier analyses by the primary laboratory. Precision and bias are within acceptable limits. More than
eighty-nine percent (89%) of check analyses are within ± 10% of the original analyses.
· The analytical
accuracy of the analyses for the heavier rare earth elements (Tb, Ho, Er, Tm, Yb, and Lu) is more variable because of the laboratories'
difficulty in producing consistently reliable analyses for samples with low concentrations of heavy rare earth elements. Year-to-year
changes in instrumental calibrations affect the accuracy of these analyses, but this should not significantly impact resource calculations,
as the total heavy rare earth element oxide percentage of the combined heavy (Tb through Lu) oxides amounts to less than 1% of the total
rare earth oxide content of the samples.
· Actlabs
and ALS use similar digestion methods and analytical finishes to analyze for rare earth elements. Data from the Round Robin procedure
and the historical quality control data indicate that the analyses from both of these laboratories have acceptable accuracy and precision
and are directly comparable (within 2.6% of one another) for the rare earth elements.
· In the
Qualified Persons’ opinion, the 2009-2013 drill program analyses/assays are of acceptable quality and are considered appropriate
for resource estimation.
During the different drilling programs completed
at the Bear Lodge REE Project, sample security was supervised by:
| · | 2004,
2005, and 2007: Dr. James Clark, a consultant to RER at that time. |
| · | 2008-2009:
RER senior geologists reporting to J. Clark. |
| · | 2010-2011:
Dr. Ellen Leavitt, CPG, consulting geologist. |
| · | 2012-2013:
John Ray, RER Chief Geologist and Richard Larsen. |
| | | |
| Ore Reserves Engineering | Page 8-13 | 29 February 2024 |
All drill core was transported from the project
site to a locked and secure storage facility each evening to the secure storage facilities at Sundance, Wyoming. No core was left unsupervised
on site. The core was logged at the storage facilities, and successive intervals were split for analysis at these locations. Split core
samples from each drill hole were shrink-wrapped and/or placed in rice bags on wooden pallets and then shipped by truck using NPT Transport
and UPS to MEG. The shipper was responsible for delivery to MEG, and RER's personnel monitored the shipment's progress via tracking number.
MEG was responsible for shipment and tracking from the sample preparation facility to the laboratory.
In 2009, RER leased the core facility in Vista
West and transferred all of its 2004 – 2008 cores from storage units at Energy Electric in Sundance to this facility. In 2010,
the Company acquired a secure storage warehouse at 2111 East Cleveland Street in Sundance and moved the drill core and splitting and
logging operations to that location. In April 2012, the Company began leasing the old Energy Electric office and warehouse building
at 2409 East Cleveland Avenue in Sundance, WY, moving most of the drill core, plus the splitting and logging operations, to that facility
and conducting core storage, splitting, and logging operations there from 2012 to now.
In order to address data security and growth
issues and merge RER and Newmont district-wide databases, project data was migrated into a unified database developed and maintained
by EDM Solutions since 2011. The web-based system links to modeling programs, including Studio and Leapfrog. Since then, GIS spatial
data has been generated directly from the database with automated updates.
Core storage facilities were inspected by the
authors of this report during a site visit performed in November 2023 (Figure 8-10) and remain locked and secured. In the
authors' collective opinion, the sample security measures followed by RER are all of excellent quality and in accordance with the industry's
standards.

Figure 8-10. RER logging facility
and storage warehouse at Sundance, Wyoming (Noble & Barrero, 2023)
| | | |
| Ore Reserves Engineering | Page 8-14 | 29 February 2024 |
| 8.3 | Qualified Persons’ Statement on Sample Preparation,
Analyses, and Security |
In the Qualified Persons’ opinion, drilling
procedures, drill core handling and storage, drilling data storage, and security procedures employed by RER during the 2009 to 2013 drilling
campaigns are considered to have been performed to industry standards. Drilling database, sample handling procedures, and storage facilities
are considered adequate and ensure sample integrity and security.
| | | |
| Ore Reserves Engineering | Page 8-15 | 29 February 2024 |
RER obtained the geological, exploration, and
drilling data package from Phelps Dodge and Newmont Corporation, covering most of the work done on the property by various companies
and claim owners through 1996. The exploration reports by Duval Corporation, Molycorp Inc., FMC, Hecla Mining Company, and others referenced
in this, and earlier technical reports exhibit relative consistency of reported rare earth values contained in carbonatites and FMR-type
veins.
Even though the authors of this report did not
review the historical data, they assume that the data and assay values are representative of the geology and mineralization in the REE-mineralized
carbonatite system. Based on operating results and historical descriptions, there is strong evidence that the sampling, sample preparation,
assaying, and security of samples were conducted according to industry-acceptable practices for the time in which the samples were collected
and processed. Owing to the limited amount of information available from these historical programs, those data were used only to assist
in geological interpretation and to guide exploration but were/are not employed in the resource estimate of the deposit.
From 2006 until spring 2010, RER conducted its
own REE drilling programs throughout the joint venture with Newmont, maintaining a separate database of REE drilling results. While RER
continued focusing on exploration for REEs, Newmont's efforts continued in gold exploration. Separation of the two exploration drilling
programs for REEs and gold, and their respective drilling data continued through the 2009 drill season. RER assumed control of the gold
exploration program and management of the gold drill database with the termination of Newmont's interest in the property in May 2010.
The exploration and development focus turned to REE at the beginning of the 2012 drilling program, and the Sundance gold exploration
effort concluded.
From 2008 through 2010, RER compiled analytical
data in Excel, Access, and Datamine for use in GIS and 3D mapping software. Between 2010 and 2011, a drill data management system was
implemented by EDM Solutions. The drill database was built on an MS SQL SERVER platform and was hosted on a secure “Cloud”
server with restricted access. Security and backup features were built into the system and were considered industry standard. The data
are currently in RER archives.
The on-site drilling programs conducted by RER
were supervised by experienced geology professionals .
On-site RER geologists and ORE personnel conducted
extensive reviews and verified data from the 2009 – 2013 drilling programs, which were used in the previous resource estimates
(Roche-Engineering, 2014) and are used in the present resource estimate.
| | | |
| Ore Reserves Engineering | Page 9-1 | 29 February 2024 |
| 9.1.2 | Collar Locations and Down-Hole Survey Data |
Drill hole data prior to 2008 has not been used
for resource estimates because the azimuths and inclinations were considered insufficiently accurate for their use in resource estimates.
Drill hole collar surveys for all 2008 through
2013 core holes were surveyed by Bear Lodge Ltd., professional engineers and land surveyors based in Sundance, Wyoming, and are considered
adequate. Bear Lodge REE Project data utilized for development activities and resource estimates is reported in NAD83 Zone 13N US survey
feet coordinates.
Down-hole surveys were conducted on all core
holes drilled by RER from the 2008 through 2013 drill programs. Even though the drill hole deviations in azimuth and dip are considered
acceptable,
No significant issues have been found on the
collar positions or downhole survey traces when projected in 3D. Both collar and downhole survey methods are considered to meet industry
standards. Although the rock mass is not magnetic, the use of a nonmagnetic continuous downhole surveying tool should be considered in
the future.
REE assays for the 2009, 2012, and 2013 programs
were conducted by Activation Laboratories of Ancaster, Ontario, and assays for the 2010 and 2011 drill programs were done by ALS Laboratories.
Both laboratories are independent of RER, both are ISO 9001 accredited, and operate to standards consistent with ISO 17025 methods.
Dr. Jeffrey Jaacks of Geochemical Applications
International Inc. (GAII) conducted a review of the results for the quality assurance and quality control (QA/QC) program used in rare
earth element assaying for the Bear Lodge exploration drill programs (2009-2013). The findings of this review are described in detail
in Chapter 8 of the present report.
In the Qualified Persons’ opinion, the
assaying methods used and QAQC procedures and protocols followed during the 2009-2013 drilling programs are considered adequate, the
sample assays display acceptable accuracy and precision and are considered adequate for resource estimation.
| 9.1.4 | Bulk Density Determination Methods |
One of the authors, A. Noble, devised the method
for density determination. Mr. Noble observed the execution of the density measurement process in 2011 and confirmed that the measurements
correctly followed the procedure. The density measurements are considered adequate for resource estimation.
The topographic model is based on the digital
elevation model (DEM) obtained from Intermap Technologies in 2011 (Roche-Engineering, 2012). The DEM data were prepared using radar imagery
(LIDAR) and were post-processed to filter out trees, buildings, etc. The elevation data are on a 3.94-meter grid and have a stated
accuracy of one meter. Data were thinned to reduce the number of points in the grid by removing points with less than 0.1-meter variability
in the topographic surface. The final topographic model contains 26% of the points of the original DEM with little difference in accuracy.
In the Qualified Persons’ opinion, the
topographic data has adequate accuracy for resource estimation.
| | | |
| Ore Reserves Engineering | Page 9-2 | 29 February 2024 |
| 9.3 | Metallurgical Test Work |
Samples
were collected from a combination of PQ core holes and bulk sampling, as described in Chapter 8. The tested samples were
representative of typical FMR and carbonatite mineralization, which represent the majority of the resource. Partially oxidized and stockwork
mineralization were not tested in this program.
| 9.4 | Qualified Persons’ Statement
on Data Verification |
The present
resource estimate only includes drill hole data of the drilling programs conducted by RER between 2009 and 2013. In the Qualified Persons’
opinion, this data is considered adequate for resource estimation.
| | | |
| Ore Reserves Engineering | Page 9-3 | 29 February 2024 |
| 10 | MINERAL PROCESSING AND METALLURGICAL
TESTING |
The following data has been provided by RER and
the contracted laboratories used to perform the test work and was reviewed by Jaye Pickarts.
Jaye
Pickarts, P.E., is a Qualified Person as defined in Regulation S-K (§229.1300). In his opinion, the data provided is reasonable
for this level of study at the time of reporting.
As of December 31, 2023, RER had filed U.S.
provisional patent applications relating to processing methods, including (1) selective recovery of REEs from mixed chloride leach
solutions using oxalic acid, and (2) separation of thorium from bulk REEs in a solvent extraction (“SX”) process. These
provisional applications provided the basis for the current patent portfolio, which includes two issued U.S. patents and one pending
U.S. divisional patent application, and fifteen issued foreign patents across thirteen foreign jurisdictions. The issued U.S. patents
have a term of 20 years measured from the filing date of the utility patent applications.
Historically, prior to 2014, metallurgical test
work was conducted on various components of the Bear Lodge REE Project to develop an effective process flowsheet.
This progression in testing is viewed as an important
series of steps in determining the amenability to extracting rare earths from the Bear Lodge REE Project. Initial samples were collected
from a combination of PQ core holes and bulk sampling. The tested samples were representative of typical FMR and carbonatite mineralization,
which represent the majority of the resource.
These initial test programs were conducted at
Mountain States Research and Development (MSRDI), Nagrom, Hazen Research, and SGS Lakefield. The results of these preliminary tests indicated
that a combination of physical separation processes (including sink-float, scrubbing and attritioning, and gravity) produced the most
technical and economical process for treating various REE mineralization types (Oxide, Transition, and Sulfide). Initial tests conducted
on the three mineralization types using drill core splits were successful in treating the Oxide mineralized samples. However, in processing
these samples, it was found that the rare earth values tended to migrate to fine-size fractions, with the minus 500-mesh fraction (-25
microns) assaying the highest TREO grades. Based on this observation, it was recommended that these tests be repeated on bulk (run-of-mine)
samples, starting with the surface oxide mineralization (FMR mineralization type). The test results on the transition and sulfide core
were unsatisfactory.
The subsequent pre-concentration tests were initiated
on a 6,000-pound (2,727 kilograms) bulk sample of well-oxidized, bulk sample, assaying about 8% TREO. Based on the mineralogical data,
it was apparent the simple scrubbing of the bulk sample ore would be sufficient to provide the required upgraded TREO values in the fine-size
fractions. In actual practice, this simple scrubbing duplicated the action in an autogenous mill or a trommel and it was quite effective
in removing the fine mineralization occurring in the coarser host rocks.
| | | |
| Ore Reserves Engineering | Page 10-1 | 29 February 2024 |
In tandem with the physical upgrading test program,
MSRDI also evaluated the subsequent hydrometallurgical treatment of the upgraded product that averaged 15 to 20% TREO. MSRDI’s
initial hydrometallurgical test program included the determination of the best leaching agent for the dissolution of all the TREO. Leaching
with hydrochloric acid (HCl) at a minimum concentration of about 14% was found to be the most effective for dissolving all the TREO values.
It achieved an average recovery of approximately 95 to 98%. Additional studies also indicated that it was technically viable to regenerate
the residual HCl from the spent solution by adding sulphuric acid and distilling the HCl off the solution to produce azeotrope HCl.
| 10.2.1 | Acid Leaching Tests |
Leaching with concentrated hydrochloric acid
gave excellent results, with virtually all the REO values dissolved into a process leach solution. Since hydrochloric acid is far more
expensive, it was appropriate to consider if the acid could be regenerated/recovered using less expensive chemicals.
Various commercial processes exist where hydrochloric
acid is recovered from pickle liquor. Research into the various methods of recovering hydrochloric acid showed that the maximum concentration
of hydrochloric acid produced by this process under atmospheric conditions is 20.2% (the hydrochloric acid–water system forms an
azeotrope at 20.2%).
As a result, additional leach tests were conducted
to see if acceptable results could be obtained using acid at the concentrations that would be obtained by atmospheric distillation. The
results showed that acid concentrations lower than 20% can be used for leaching while maintaining high percentages of dissolution. Several
distillation experiments were conducted to explore the viability of acid recovery. The results showed that acid recovery/regeneration
is indeed a reasonable process option.
Leach
tests were conducted by dissolving a pre-concentrate sample in hydrochloric acid while maintaining the temperature between 176 and 194
°F (80 to 90 °C) for six hours. The pregnant solution from the leaching step contained remaining free acid along with
iron and other impurities.
The pre-concentrate sample used for all testing
was prepared by screening and scrubbing. The composition of the head sample is presented in Table 10-1.
Table 10-1. Head Sample Composition
(Bhappu, 2011)
| SAMPLE
IDENTIFICATION |
Ce2O3
% |
La2O3
% |
Nd2O3
% |
Pr2O3
% |
Sm2O3
% |
Y2O3*
% |
TREO
% |
| Scrub
Comp Head |
7.6 |
5.35 |
2.44 |
0.76 |
0.28 |
N/A |
16.43 |
Previous testing showed that a standard time
of 6 hours gave satisfactory results in leaching. Testing also showed that elevated temperatures made leaching with relatively weak acid
possible. Three tests were conducted at 176, 194, and 212°F (80, 90, and 100°C) to determine the optimum leaching temperature.
The test results are presented in Table 10-2. Acid addition for these tests was 1.06 pounds of acid per pound of concentrate.
| | | |
| Ore Reserves Engineering | Page 10-2 | 29 February 2024 |
Table 10-2. Leach Efficiency
vs. Temperature (Bhappu, 2011)
| Temperature |
Leach
Efficiency |
| 176oF
(80oC) |
98.45% |
| 194oF
(90oC) |
98.56% |
| 212oF
(100oC) |
98.70% |
Initial
hydrochloric acid leaching tests were conducted with concentrated acid. The possibility of using regenerated acid led to testing with
concentrations less than 20%. Standard leaching conditions were proposed to be 1.35 oz. (40 milliliters) of reagent grade hydrochloric
acid, 0.7 oz. (20 grams) of concentrate and 2.0 oz. (60 milliliters) distilled water. This equates to 0.6 oz. (17.1 grams) of 100% HCl
in 3.4 oz. (100 milliliter) solution or slightly less than 17%. All leach tests performed under the conditions of 194°F (90°C),
6 hours retention time, and >15 % acid, produced extractions of over 90%. This demonstrates that the use of regenerated acid is feasible.
In test WAA # 6, the leach time was reduced to 4 hours for comparison. The hydrochloric acid leach test results are presented in Table
10-3.
Table 10-3. Leach Tests Results
(Bhappu, 2011)
| WAA
# 1 |
6-hour
leach, 90oC |
100
mL 1:1 HCl |
|
|
| Sample |
Head
% |
Grams |
Residue |
Residue |
Grams
REO |
| Weight |
TREO |
REO |
Weight |
%TREO |
Solids |
| 20 |
16.43 |
3.286 |
7.06 |
0.67 |
0.05 |
| %
Leached |
|
|
|
|
98.56 |
| Grams
HCl per gram concentrate = |
|
1.06 |
|
|
| |
|
|
|
|
|
| WAA
# 2 |
6-hour
leach, 80oC |
100
mL 1:1 HCl |
|
|
| Sample |
Head
% |
Grams |
Residue |
Residue |
Grams
REO |
| Weight |
TREO |
REO |
Weight |
%TREO |
Solids |
| 20 |
16.43 |
3.286 |
7.29 |
0.70 |
0.05 |
| %
Leached |
|
|
|
|
98.45 |
| Grams
HCl per gram concentrate = |
|
1.06 |
|
|
In all cases, 6 hours of residence time and an
acid concentration of 0.75 grams of acid per gram of concentrate or more gave extractions greater than 90%. This is equivalent to leaching
with 15% HCl, which is easily produced by recycling/regeneration.
Therefore, based on these results, the process
leach conditions would be:
| · | Leach
temperature of 194°F (90°C) |
| · | Six
hours retention time |
| · | Equivalent
of 0.7 oz. (20 grams) concentrate in 3.4 oz. (100 milliliters) of 15+ % HCl. |
| | | |
| Ore Reserves Engineering | Page 10-3 | 29 February 2024 |
A subsequent test program, including a pilot
program, was conducted at SGS Lakefield. A bench-scale metallurgical program was conducted to test a flowsheet for processing whole ore
samples originating from the Bear Lodge deposits. The findings from this work were considered in determining conditions for later pilot
plant campaigns conducted at the SGS Lakefield Site in early 2014. Two different ore samples were processed during the piloting –
known to SGS as “3.5% TREO” and “2.0% TREO”.
Both direct and counter-current leaching (CCL)
configurations were tested. Tests conducted at lower temperatures (55°C) and acid dosages resulted in excellent rare earth element
(REE) leach efficiency with significant decreases in base metal co-extraction. CCL of the 3.5% total rare earth oxide (TREO) sample yielded
3 to 4% higher main REE extractions versus the best-performing direct leaching test. Iron extraction in these same tests was lower using
the CCL configuration (25% versus 41%), leading to reductions in leach and downstream.
The best performance of CCL of the 3.5% TREO
sample was achieved using no reductant and a test temperature of 45°C. Main element extractions were 93% Dy, 98% Eu, 98% Nd, 98%
Pr, 97% Tb, and 85% Y. Iron extraction was 32%. Solids weight loss was 24%. Acid consumption was 148 kg/t.
All tests had a 4-hour retention time and were
conducted at 16% initial solids.
Within the range of acid dosages studied (between
680 and 880 kg/t hydrochloric acid), there was a negligible effect on metal extraction. Under the tested conditions (16% solids, 90°C),
REE and key base metal leaching efficiencies varied only minimally (3% for REE).
The leaching temperature was varied between 50°C,
70°C, and 90°C. Under the conditions tested (780 kg/t acid, 16% solids, 4-hour retention time), REE extraction varied minimally
(~5% between extreme in LREE), while impurity metal leaching efficiencies at 50°C were drastically lower.
Reductive reagents, sodium sulfite, and sodium
thiosulphate were added to all leaching tests during the last half hour of the tests to determine their effect on iron reduction and
barium precipitation. At comparable test conditions (90°C, 16% solids, 4-hour residence time, 100% stoichiometric dosage of reductant
to feed iron), the influence of either reductant on leach efficiency of REE and base metals was negligible. However, sodium sulfite caused
ferric reduction to be double that observed for sodium thiosulphate.
Kinetic sampling indicated that a retention time
of two hours could inhibit iron leaching and minimally impact neodymium and yttrium extraction. This was especially evident in the low-temperature
condition where iron extraction was increased from 24% at 2 hours to 41% after 4 hours.
Best conditions for straight leaching were achieved
at test conditions of 780 kg/t and 50°C. After four hours, the main element extractions were 91% Dy, 95% Eu, 95% Nd, 94% Pr, 93%
Tb, and 88% Y. Iron extraction was only 41% after four hours of leaching. Weight loss was 25%.
| 10.2.2.1 | Counter-Current
Leaching |
Counter-current leach (CCL) tests, consisting
of sets of pre-leach and leach tests, were conducted to study the effect of a reductive reagent, temperature, and ore variability on
leaching efficiency. All tests had a 4-hour retention time and were conducted at a hydrochloric acid addition of 680 kg/t and a leach
test pulp density of 16% solids. Acid dosage in CCL tests is considered kilograms of 100% acid per tonne of pre-leach feed.
| | | |
| Ore Reserves Engineering | Page 10-4 | 29 February 2024 |
Reductive reagent, sodium sulfite, was determined
to be detrimental to RE extraction in tests using “3.5% TREO” feed.
Leach temperature was varied between 45°C,
50°C, and 90°C. Under the conditions tested (using “3.5% TREO”), RE extractions were unaffected by the decrease in
temperature with the exception of cerium and yttrium (dropping 7% and 9%, respectively), while impurity metal leaching efficiencies were
drastically lower. In particular, iron extraction decreased from 95% to 32% across the temperature range tested.
Counter-current leach testing was performed on
both the “3.5% TREO” and “2.0% TREO” ore samples. Little change was observed in REE extractions between the samples.
Base metal extractions varied by sample. In particular, the “3.5% TREO” sample extracted 55% manganese, 94% magnesium, and
53% iron, while the same metal extractions in the “2.0% TREO” sample were 87%, 85%, and 61%.
The best results for CCL of the “3.5% TREO”
sample were achieved using no reductant and a test temperature of 45°C. Main element extractions were 93% Dy, 98% Eu, 98% Nd, 98%
Pr, 97% Tb, and 85% Y. Iron extraction was 32%. Weight loss was 24%. Acid consumption was 148 kg/t.
Counter-current leaching of the “2.0% TREO”
sample achieved extractions of 91% Dy, 93% Eu, 95% Nd, 94% Pr, 96% Tb, and 85% Y. Iron extraction was 25%. Weight loss was 10%. Acid
consumption was 118 kg/t.
The counter-current leaching of the “3.5%
TREO” sample yielded 3 to 4% higher main REE extractions versus the best-performing direct leaching test. Iron extraction in these
same tests was lower using the CCL configuration (25% versus 41%), leading to reductions in leach and downstream reagent costs.
| 10.2.2.2 | Oxalate
Precipitation |
Oxalate precipitation tests were conducted to
study the robustness of a set of precipitation conditions (constant temperature, dosage, retention time) to changes in feed composition.
In these tests, pregnant leach liquor (PLS) was treated with oxalic acid to selectively precipitate trivalent REE as RE oxalate.
Under the conditions tested (85-90°C, 52.6
g/L oxalate, 4-hour retention time), selective precipitation of REE over base metals was confirmed with the exception of barium, which
was higher (56%).
Feeds containing high levels of ferric iron suffered
low RE precipitation efficiency (<4% in all REE except lutetium).
Precipitation efficiencies of 82% Dy, 87% Eu,
74% Nd, 71% Pr, 85% Tb, and 61% Y were achieved. Oxalate precipitation showed good selectivity against base metals with the exception
of barium (20% to 56% precipitation).
The discharge solution from an oxalate precipitation
test was concentrated to produce an oxalate solid containing 84.6% oxalate and 0.5% REE, with the highest impurity being magnesium at
1.3%. This product may be suitable for re-introduction to the oxalate precipitation process to offset the requirement for fresh oxalic
acid.
| | | |
| Ore Reserves Engineering | Page 10-5 | 29 February 2024 |
Digesting the solids in hydrochloric acid was
advantageous overusing nitric acid on the basis of higher solids weight loss (99% compared to 89%) and higher recovery of REE (100% compared
to 91%). The liquors resulting from the HCl and HNO3 digestion tests contained 36.6 and 31.8 g/L TREO and 678 and 526 mg/L
Th, respectively.
Undigested solids from a pilot plant conducted
in January 2014 were re-digested in nitric acid to determine if further weight loss could be achieved at higher acid strengths (from
9.6% nitric acid to 12%). Digesting the solids in 12% acid was found to increase overall weight loss from 80 to 88%.
The liquors from the solid’s digestion
tests were neutralized with ammonium hydroxide to selectively precipitate thorium. Under the conditions tested (25°C, 1 hour retention
time), it was found that increasing the pH of the solution to 3.8 resulted in a 71% removal of thorium at a cost of only 1.4% REE. Conditions
for complete removal of thorium were not found.
| 10.2.2.4 | REE
Nitrate Crystallization |
A low thorium ammonium nitrate solution was concentrated
by evaporation to 86% of its original weight, at which point its boiling point was 130°C. White solids were produced that contained
49% of the REE. The REE grade of the solids was 15.7%.
In 2014, RER extracted a high-grade sample from
an excavated exploration trench within the Bull Hill deposit.
RER contracted Umwelt- und Ingenieurtechnik GmbH
Dresden, Germany (UIT) to validate (and potentially optimize) processing steps of the Bear Lodge REE Project by pilot testing UIT’s
upgraded technology concept developed in 2018, including primary processing, separation, and refining of REE. This report describes the
provisional economic assessment results based on the pilot test work performed by UIT in 2019.
In 2018, UIT demonstrated the technical feasibility
of main process steps on the basis of lab tests, however, by considering and finally implementing significant improvements of RER’s
original technological concept. In 2019, UIT tested the processing of high-grade ore with low calcium/carbonate abundance (BHOxHG) on
a pilot scale. The initial pilot-test results, together with UIT’s novel solvent-extraction (SX) process simulation model/software,
were the basis for further optimizations (in particular, regarding the REE separation and refining) that have already been pilot-tested
or subject to final validation in 2020.
The primary processing of the comminuted ore
to a TREO (Th) concentrate was piloted successfully (referred to as primary hydrometallurgical processing HYDROMET). The produced TREO-(Th)
concentrate was successfully separated by applying an optimized SX processing scheme on a pilot scale to produce pure NdPr (in oxide
form). These data showed:
| | | |
| Ore Reserves Engineering | Page 10-6 | 29 February 2024 |
| 1. | Primary
processing from ore to TREO(Th) concentrate |
| · | Counter-current
leach performance. |
| § | Excellent
leach efficiency (92.5%) |
| § | Long
living 228Ra kept in tailings (initiated precipitation of Ra in leach process) |
| · | Selective
REE precipitation |
| § | Precipitation
efficiency for NdPr 99.5% |
| § | Highly
pure TREO(Th) concentrate (≥95% REO) |
| · | Hot
filtration option for ore feed containing abundant calcareous minerals. |
| · | Calcination
tests 600/700/900°C – subject to further optimization (reduction to probably 450°C
to minimize the acid consumption in TREO(Th) digestion and subsequent processing stages) |
| § | Oxalic
acid recycle ≥65% |
| 2. | TREO(Th)
digestion and Th/Ce separation |
| · | Practically
100% of TREO digestion in HNO3 |
| · | Very
high REE concentrations in feed solution to SX_0 |
| · | 100%
extraction of tetravalent Th |
| · | >97%
extraction of Ce (potential for complete Ce separation identified, in particular, by considering
redox kinetics) |
| · | High-efficient
counter-current precipitation strip (practically 100% Th) |
| · | Highly
efficient removal of NORM (naturally occurring radioactive material) demonstrated. |
| 3. | REE
separation/refining |
| · | Optimization
based on UIT’s first principles thermodynamic extraction and separation model as basis
of a simulation software tool that can be configured for any SX setup (in particular, for
counter-current SX operation) |
| · | Steeper
extraction/scrubbing curves and improved separability between individual REE for the consequent
counter-current setup of SX sequences key to significantly improved SX performance |
| · | Reliable
simulation of feed pH to achieve the optimum equilibrium pH for maximized separability under
given solute composition (ionic strength), O/A ratio, and extractant concentration in component
O, and considering the chemical distribution effects between aqueous solute and organic extractant. |
| · | Improved
NdPr separation/refining strategy (neutralization by NH3(aq), SX sequences and combinations
in various arrangements) – to be applied to Nd and Pr as well. |
| | | |
| Ore Reserves Engineering | Page 10-7 | 29 February 2024 |
Based on the pilot test results and the novel
SX process simulation tool for systematizing the pilot test results within an optimized processing regime, a provisional economic assessment
of the processing from Bull Hill deposit ore to the pure NdPr product has been developed with a focus on the Operational Expenditures
(OPEX). This assessment is based on process flow diagrams (PFDs) that were developed for an up-scaled (industrial) processing plant setup
and mass balance schemes that were created by applying the novel SX simulation software (calibrated on the basis of pilot test results)
for fully consistent systematics.
The results from the pilot test have produced
the following table of REE yield estimates that have been used in this resource estimate; these results are summarized in Table 10-4.
Table 10-4. Pilot Test Results
(UIT, 2020)
| |
|
REE
yield compared to PP feed |
| |
|
La |
Ce |
Nd |
Pr |
Sm |
Eu |
Gd |
Dy |
Y |
HREE |
| Process |
Product |
% |
% |
% |
% |
% |
% |
% |
% |
% |
% |
| PP
Leaching |
PP
Precip. |
91.7 |
97.2 |
92.2 |
92.2 |
92.2 |
91.2 |
91.7 |
88.8 |
83.8 |
87.1 |
| PP
Precipitation |
TREO
(Th) |
90.7 |
96.1 |
91.2 |
91.2 |
91.2 |
90.2 |
90.7 |
87.7 |
82.8 |
86.1 |
| TCS
SX |
ER_0 |
90.7 |
33.6 |
89.8 |
90.2 |
91.2 |
91.3 |
92.4 |
83.5 |
78.8 |
81.6 |
| SX_A
Separation |
SR_A |
9.0 |
11.8 |
68.8 |
52.1 |
40.0 |
22.8 |
23.1 |
0.8 |
0.2 |
2.9 |
| ER_A |
81.7 |
21.8 |
20.6 |
38.1 |
0.1 |
0.0 |
0.0 |
0.0 |
0.0 |
0.0 |
| HREEOx/SEGOx |
0.0 |
0.0 |
0.4 |
0.0 |
51.0 |
68.5 |
69.3 |
82.7 |
78.5 |
80.9 |
| SX_B1
Separation |
ER_B1 |
9.0 |
11.8 |
67.9 |
52.0 |
0.4 |
0.0 |
0.0 |
0.0 |
0.0 |
0.0 |
| SEGOH |
0.0 |
0.0 |
0.9 |
0.0 |
39.6 |
22.8 |
23.1 |
0.8 |
0.3 |
0.7 |
| SX_B2-3
Separation |
LaCeOH |
90.6 |
33.5 |
0.4 |
14.3 |
0.0 |
0.0 |
0.0 |
0.0 |
0.0 |
0.0 |
| NdPRO |
0.0 |
0.2 |
88.2 |
75.8 |
0.6 |
0.0 |
0.0 |
0.0 |
0.0 |
0.0 |
| Total |
All
end-products |
90.7 |
33.6 |
89.8 |
90.2 |
91.2 |
91.3 |
92.4 |
83.5 |
78.8 |
81.6 |
| 10.4 | Demonstration
Project |
The demonstration project involves the physical
processing of this already extracted exploration sample followed by chemical processing to produce a pure TREO(Th) concentrate followed
by the separation of NdPr oxide.
The demonstration project plant is scheduled
to be in operation in 3rd Quarter of 2024 and will provide the necessary design criteria for a larger commercial-scale facility. A description
of this demonstration plant is provided in Chapter 14.
| | | |
| Ore Reserves Engineering | Page 10-8 | 29 February 2024 |
| 11 | MINERAL
RESOURCE ESTIMATES |
This Mineral Resource estimate was prepared by
Alan C. Noble, P.E. of Ore Reserves Engineering, and by Monica Barrero Bouza, EurGeol, who are independent Qualified Persons as described
in Regulation S-K (§229.1300). The effective date of the Mineral Resource estimate is 31 December 2023.
The current Mineral Resource estimate updates
the previous mineral resource estimates prepared by A. Noble (Ore Reserves Engineering) for the Bull Hill rare earth deposit (Roche-Engineering,
2014). The present Mineral Resource estimate includes an update of the Bull Hill deposit oxide zones (Ox and OxCa) for more selective
mining consistent with a 10x10x10-foot selective mining unit and a more conservative resource classification criteria. The 10x10x10-foot
selective mining unit is justified by a lower production rate and more selective mining that takes advantage of the sharp visual contrast
between higher-grade mineralization and lower-grade wall rock. The Whitetail deposit has not been updated nor included in this update.
Estimation was done using 252 core holes drilled between 2009 and 2013, including 20,491 assay intervals that totaled 186,712.5 feet
(56,910 meters) of drilling. Resource modeling and estimation were done using Datamine Studio RM software;
pit optimization was performed with Datamine Studio Maxipit and pit design with Studio OP.
| 11.2 | Block
Model Parameters |
A three-dimensional
(3D) block model using 10x10x10-foot (approximately 3x3x3-meter) blocks was created for resource estimation, which is consistent with
the estimated selective mining unit. The 10-foot blocks were not sub-celled on geological boundaries to provide better compatibility
with pit optimization software. The block model location parameters remain the same as previous models, and the coordinate system is
UTM Zone 13, geometric horizontal North American Datum of 1983 (NAD83), and North American Vertical Datum of 1988 (NAVD88) in US Survey
feet units. Size and location parameters for the block model are summarized in Table 11-1.
The horizontal
extent of the model is defined to cover the main mineralized areas of the Bull Hill deposit, plus sufficient space outside the deposit
for pit optimization.
Table
11-1. Model Size and Location Parameters (UTM Zone 13-NAD83-NADV88).
| |
Minimum
|
Maximum
|
Block
Size |
Number
of Blocks |
Model
Size |
| feet |
meters
(approx.) |
feet |
meters
(approx.) |
feet |
meters
(approx.) |
feet |
meters
(approx.) |
| Easting |
X |
1,781,500 |
543,001 |
1,786,900 |
544,647 |
10 |
3.05 |
540 |
5,400 |
1,646 |
| Northing |
Y |
16,160,700 |
4,925,781 |
16,166,000 |
4,927,397 |
10 |
3.05 |
530 |
5,300 |
1,615 |
| Elevation |
Z |
5,000 |
1,524 |
6,520 |
1,987 |
10 |
3.05 |
152 |
1,520 |
463 |
| 11.3 | Estimation
Domains and Trend Surfaces |
Estimation
domains are defined based on nine (8) bounding solids constructed from cross-sectional-view strings that enclose areas with consistent
overall grades and grade zoning; these estimation domains have not changed from the previous estimate (Roche-Engineering, 2014). Cross-sections
were spaced at 50-to-100-ft intervals and aligned roughly perpendicular to the overall mineralization trend in each domain. The description
of the estimation domains is summarized in Table 11-2, and a plan view of the location of each domain is shown in Figure 11-1.
| | | |
| Ore Reserves Engineering | Page 11-1 | 29 February 2024 |
Since the boundaries between domains are generally
indistinct and/or gradational, the domain boundaries were drawn with a slight overlap. The domain boundaries were linked to form wireframed
solids, and the solids were filled with 10x10x10-foot blocks to create the domain block model.
The overlapping boundaries between domains were
resolved for the block model by overprinting the individual models with the Studio RM ADDMOD process in the order of the priorities listed
in Table 11-2. Thus, W2 is overprinted onto NE; W2 is overprinted onto the NW+W2 result; and so on.
Drill hole composites were selected within the
entire volume of each domain for resource estimation. Thus, the domain boundaries were treated as semi-soft boundaries for composite
selection. The use of semi-soft boundaries for composite selection is justified by the indistinct/gradational nature of the domain boundaries.
Good continuity is generally indicated for the
REE-bearing veins, but continuity is not planar in either the vertical or horizontal view. Accordingly, trend surfaces were created to
define the continuity of mineralization within each estimation domain. The trend surfaces were defined using the same cross-sectional
alignment used for the interpretation of the domains.
| | | |
| Ore Reserves Engineering | Page 11-2 | 29 February 2024 |
After linking the trend strings to form wireframed
surfaces, the intersection of the trend surfaces in the plan view was checked to ensure consistency of trends, both laterally and vertically.
The intersections of the trend surfaces with the 5600-ft level are shown as dashed lines in Figure 11-1.
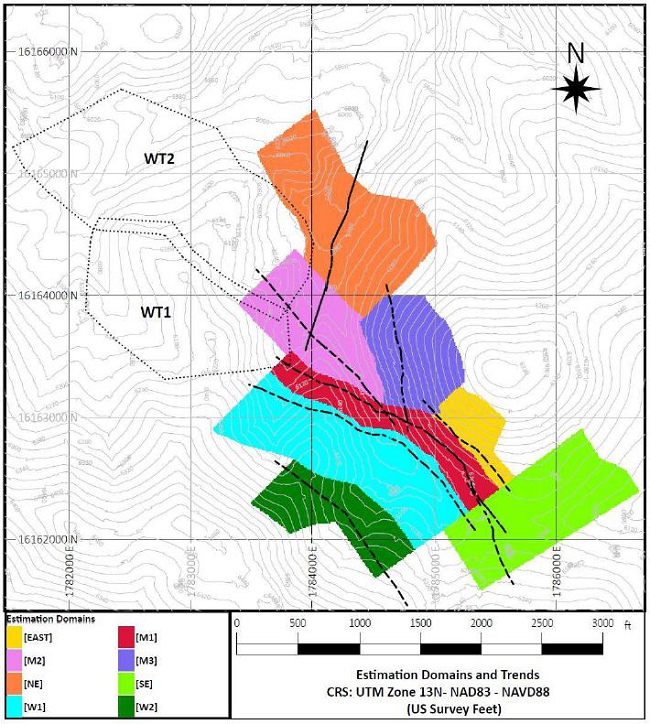
Figure 11-1. Plan view of the
estimation domains and trends (dash-lines) at 5600ft elevation; Whitetail estimation domains (WT1 and WT2) are shown for reference (after A. Noble, Roche-Engineering, 2014)
| | | |
| Ore Reserves Engineering | Page 11-3 | 29 February 2024 |
Table 11-2. Estimation Domains
Detailed Description (A. Noble, in Roche-Engineering, 2014)
| Domain
Code |
Priority |
Name |
Description |
| M1 |
7 |
Main
1 |
This
is the main mineralization domain with the best continuity, the widest veins, and the highest REE grades. It is characterized by
strong, near-vertical, high-grade veins with excellent continuity and an NW-SE trend. As it continues to the northwest, it splits
into 3 zones, of which the west-most branch is interpreted as the continuation of Main 1. The zone contains high-grade mineralization
in a vein/dike with 20 to over 100 feet widths. |
| M2 |
4 |
Main
2 |
This
is the center of the three branches off of Main 1. Mineralization is not as continuous nor high-grade as Main 1 or Main 3. The northwestern
extension of Main 2 is poorly drilled, but appears to be mostly barren, although there may be a weak connection to Whitetail to the
northwest. |
| M3 |
6 |
Main
3 |
This
is the easternmost splay off of Main 1. High-grade, near-vertical, north-south trending veins are present but are narrower and less
continuous than in Main 1 but more continuous than in Main 2. |
| East |
5 |
East |
The
East domain is located just east of Main 1 and terminates to its northwest on Main 3. The predominant mineralization is a single,
narrow vein with a strike length of over 1000 feet, sub-parallel to Main 1. |
| NE |
1 |
Northwest
Bull Hill |
Veins
in this area are much less continuous than veins in the Main, East, and West 1 domains. Veins appear to strike about N15E
and dip 65° to the NW. Continuity is poorly defined. |
| SE |
8 |
Southeast |
The
Southeast Domain terminates the Main 1, West 1, and East domains on their southeast limits. This domain is defined by a sudden decrease
in the intensity of REE mineralization across a discontinuity that dips approximately 80 degrees to the northwest and strikes approximately
N55E. The details of the discontinuity are not understood, but it may be a fault or intrusive contact. |
| W1 |
3 |
West
1 |
West
1 is immediately adjacent to and similar to Main 1. Veins in West 1 are thinner, lower grade, less continuous, and more widely spaced. |
| W2 |
2 |
West
2 |
Mineralization
in West 2 is poorly defined by only a few drill holes. It appears less continuous than West 1 and may trend more north-south than
northwest-southeast. |
The oxidation state model was prepared using
the oxidation state codes in the drill-hole database, which designate drill-hole intervals as oxidized (Ox), oxidized with calcite (OxCa),
transition (Tran), or non-oxidized (Sulf). The initial interpretation was made on cross-sections by drawing lines along the bottom of
the oxidized material, the top of the transition material, and the top of the non-oxidized material. These lines were then linked to
form three-dimensional (3D) surfaces used to create the oxidation state model.
The top of the oxidized zone was defined as ten
(10) feet below the topographic surface, leaving a 10-foot (3.05 meter) thick layer below the surface for soils, alluvium, and colluvium.
Rare-earth element grades were not estimated in the Soils-alluvium-colluvium layer, which is assumed to be waste for resource estimation
purposes.
The oxide zones have not been modified since
the last study in 2014. In the present update, grade estimation has been updated for a more selective mining unit in the Ox and OxCa
oxide zones, and no estimation has been performed in the transition and sulfide oxide zones, which are excluded from the resource. A
plan view at 5600ft elevation showing the oxidation state interpretation is shown in Figure 11-2; Figure 11-3 includes
vertical sections through the deposit.
| | | |
| Ore Reserves Engineering | Page 11-4 | 29 February 2024 |

Figure 11-2. Plan view of the
oxidation state model at 5600ft elevation (A. Noble, Roche- Engineering, 2014)
| | | |
| Ore Reserves Engineering | Page 11-5 | 29 February 2024 |

Figure
11-3. Vertical sections of the oxidation state model; the location of the sections is shown in Figure 11-2
| 11.5 | Trend-Oriented
Modeling |
Because the shape of all mineralized domains
is too irregular for the use of simple search ellipses, trend models were developed to allow interpolation to follow the shape of the
mineralized zone. The trend models are based on the general shape of the domains and on a visual interpretation of the continuity of
mineralization. The primary objective of developing the trend shapes was to provide generally reasonable shapes rather than simply connecting
high-grade samples to other high-grade ones.
The trend surfaces were used to flatten and iron-out
the wrinkles in the mineralization trends using a set of “trend-flattened” coordinates to replace the normal UTM coordinates.
The method used to create the trend-flattened
coordinates from the trend models was created by A. Noble for the previous estimate (Roche-Engineering, 2014) and is summarized below:
| | | |
| Ore Reserves Engineering | Page 11-6 | 29 February 2024 |
| 1. | The
distance between the trend surface and the block model block centroids was measured by calculating
the perpendicular distance between the block center and the nearest face in the trend surface
wireframe. The same procedure was repeated for the center point location of composites. |
| 2. | The
distance between the trend surface and the block model block centroids was measured by calculating
the perpendicular distance between the block center and the nearest face in the trend surface
wireframe. The same procedure was repeated for the center point location of composites. |
| 3. | The
final trend flattened coordinate space is roughly equivalent to viewing each domain as a
longitudinal cross-section. |
The rotation parameters used to flatten the trend
model are summarized in Table 11-3.
Table 11-3. Rotation Parameters
to Flatten the Trend Models (A. Noble in Roche-Engineering, 2014)
| Domain |
Rotation
Point (UTM-Feet) |
Rotation
Angle Around Axis (left-hand rule) |
| X |
Y |
Z |
Z-axis |
Rotated
X-axis |
| East |
1,785,264 |
16,162,820 |
5,600 |
48 |
-90 |
| Main
1 |
1,784,704 |
16,162,935 |
5,600 |
35 |
-90 |
| Main
2 |
1,784,121 |
16,163,655 |
5,600 |
48 |
-90 |
| Main
3 |
1,784,715 |
16,163,514 |
5,600 |
90 |
-90 |
| Northeast |
1,784,160 |
16,164,376 |
5,600 |
107 |
-64 |
| Southeast |
1,785,477 |
16,162,036 |
5,600 |
68 |
-90 |
| West
1 |
1,784,551 |
16,162,845 |
5,600 |
33 |
-90 |
| West
2 |
1,784,307 |
16,162,132 |
5,600 |
40 |
-90 |
Given
the highly variable orientation of drill holes with respect to the mineralization trends, a method was developed to composite drill-hole
samples into widths that approximate the horizontal true width of the veins. In addition, the composites were optimized to provide composite
intervals that were above a specified cutoff grade and longer than a specified minimum width. There were two objectives for this procedure:
| 1. | The
resulting composites should be partitioned into low-grade and high-grade populations representing
stockwork-dominant and dike-dominant mineralization. |
| 2. | The
composites should have sufficient width to provide geometric dilution for a reasonable minimum
mining width. |
True
width compositing was done using parameters specific to each estimation domain, as summarized in Table 11-4. Width and cutoff
parameters were developed heuristically to provide subpopulations of low-grade and high-grade composites as close to lognormal populations
as possible, subject to a minimum mining width of at least 10 feet.
| | | |
| Ore Reserves Engineering | Page 11-7 | 29 February 2024 |
Table
11-4. Parameters for Optimized Grade-Zone Compositing (Noble & Barrero, 2024)
| Domain |
Minimum
TRUE Width
(Feet) |
Minimum
True
Width (Meters) |
Cutoff
Grade
(%TREO) |
Generalized
Trend-Plane |
| Dip
Direction |
Dip |
| East |
10 |
3.05 |
1.5 |
48 |
90 |
| M1 |
10 |
3.05 |
1.5 |
35 |
90 |
| M2 |
10 |
3.05 |
1.4 |
48 |
90 |
| M3 |
10 |
3.05 |
1.5 |
90 |
90 |
| NE |
10 |
3.05 |
1.5 |
287 |
64 |
| SE |
10 |
3.05 |
1.5 |
68 |
90 |
| W1 |
10 |
3.05 |
1.2 |
33 |
90 |
| W2 |
10 |
3.05 |
1.2 |
40 |
90 |
The procedure for the optimized grade-zone compositing
is described below:
| 1. | The
average orientation of the drill hole was compared to the generalized trend plane orientation
to compute the drill hole length required to achieve the minimum true width perpendicular
to the trend plane. |
| 2. | The
Studio RM COMPSE process was used to compute composites with at least the minimum true width
(perpendicular to the trend plane) that were also above the cutoff grade (Table 11-4). |
| 3. | An
OreZONE Flag code was set to one (1) to identify composite intervals above the cutoff
(Table 11-4) and zero (0) below the cutoff. |
| 4. | The
drill holes were composited again, using down-hole compositing that was set for a nominal
10-foot (3.05 meter), true-width composite within OREFLAG intervals of the same type (0 or
1). In this process, composites start and stop at OREFLAG boundaries, and the composite length
is adjusted to include the entire interval defined by the OREFLAG zone while maintaining
a nominal 10-foot-wide, true-width composite length. |
| 11.6.1 | Grade-Zoned Composite
Statistics |
Basic statistics for TREO, FMR, calcium, iron,
and manganese oxides, uranium, and thorium for the Bull Hill deposit in the Oxide and OxCa are shown in Table 11-5
The statistics indicate that the grade-zoning
process partitions TREO into high-grade and low-grade populations (Figure 11-4). The TREO OreZONE partitions also subdivide the
distributions of FMR, iron oxide, manganese oxide, thorium, and uranium abundances into higher-grade and lower-grade populations (Figure
11-5). However, the process is less efficient for calcium and manganese oxide, where the ratio of grades in the high-grade OreZONE
to the low-grade OreZONE is lower than that for TREO.
| | | |
| Ore Reserves Engineering | Page 11-8 | 29 February 2024 |
Table 11-5. Basic Statistics
for Grade-Zoned Composites of Bull Hill Deposit (updated from A. Noble,
Roche-Engineering, 2014)
| Field |
OXIDE |
Low-Grade
OreZONE |
High-Grade
OreZONE |
All
Samples |
Ratio
HG:LG |
|
|
| Number
Samples |
Mean |
Coef
of Variation |
Number
Samples |
Mean |
Coef
of Variation |
Number
Samples |
Mean |
Coef
of Variation |
|
|
| |
|
| %TREO |
Ox |
4,689 |
0.612 |
0.487 |
1,221 |
3.358 |
0.831 |
5910 |
1.179 |
1.448 |
5.489 |
|
|
| OxCa |
854 |
0.684 |
0.452 |
648 |
3.452 |
0.585 |
1502 |
1.878 |
1.023 |
5.043 |
|
|
| %FMR |
Ox |
4,652 |
7.7 |
1.090 |
1,212 |
31.3 |
0.755 |
6518 |
13.0 |
1.307 |
4.062 |
|
|
| OxCa |
854 |
9.6 |
0.967 |
648 |
53.2 |
0.600 |
1597 |
28.9 |
1.065 |
5.559 |
|
|
| %CaO |
Ox |
2,966 |
0.639 |
1.820 |
779 |
0.955 |
1.860 |
3745 |
0.704 |
1.874 |
1.496 |
|
|
| OxCa |
576 |
4.019 |
0.858 |
431 |
15.005 |
0.627 |
1007 |
8.721 |
0.988 |
3.734 |
|
|
| %Fe2O3 |
Ox |
2,966 |
8.055 |
0.278 |
779 |
13.700 |
0.417 |
3745 |
9.229 |
0.434 |
1.701 |
|
|
| OxCa |
576 |
7.311 |
0.197 |
431 |
11.902 |
0.378 |
1007 |
9.276 |
0.418 |
1.628 |
|
|
| %MnO |
Ox |
2,966 |
1.238 |
0.985 |
779 |
3.351 |
1.310 |
3745 |
1.678 |
1.451 |
2.706 |
|
|
| OxCa |
576 |
1.015 |
0.455 |
431 |
2.775 |
0.800 |
1007 |
1.768 |
0.978 |
2.733 |
|
|
| ppm
Th |
Ox |
4,688 |
99 |
0.725 |
1,221 |
353 |
1.228 |
5909 |
151 |
1.529 |
3.578 |
|
|
| OxCa |
854 |
93 |
0.993 |
648 |
317 |
1.012 |
1502 |
190 |
1.311 |
3.428 |
|
|
| ppm
U |
Ox |
4,688 |
35 |
0.784 |
1,221 |
101 |
0.628 |
5909 |
48 |
0.955 |
2.907 |
|
|
| OxCa |
854 |
47 |
0.754 |
648 |
102 |
0.533 |
1502 |
71 |
0.741 |
2.186 |
|
|
The distribution of high-grade TREO is nearly
lognormal, as shown by the nearly straight line in the lognormal cumulative frequency distribution (Figure 11-4). About 75% of
the high-grade composites are above 1.5% TREO; an additional 25% are internal low-grade zones that are included to makeup the minimum
mining width. Less than 3% of the low-grade OreZONE composites are above 1.5% TREO, and those composites represent patchy higher-grade
stockwork mineralization.
| | | |
| Ore Reserves Engineering | Page 11-9 | 29 February 2024 |

Figure 11-4. Lognormal grade
cumulative frequency distributions and histograms for TREO by OreZONE-Oxides and OxCa Composites (Noble & Barrero, 2024)
| | | |
| Ore Reserves Engineering | Page 11-10 | 29 February 2024 |

Figure 11-5. Log-transformed
Histograms for TREO, FMR, Iron Oxide, Manganese Oxide, Thorium and Uranium (Noble & Barrero, 2024)
The TREO OreZONEs do not effectively partition
calcium oxide, as the oxide type is the dominant factor in the calcium oxide distribution. As shown in Figure 11-6, TREO OreZONE
codes effectively partition the OxCa zone into low and high-grade calcium oxide. However, the leaching of carbonates in the oxide zone
reduces calcium oxide grade to a similar level regardless of the TREO OreZONE code.
| | | |
| Ore Reserves Engineering | Page 11-11 | 29 February 2024 |

Figure 11-6. Log-transformed Histograms for
Calcium Oxide by OreZONE and Oxide Type (Noble & Barrero, 2024)
| 11.6.1 | Missing Grades for Iron, Manganese and Calcium Oxides |
Whole rock assays were not done for early drill
holes from 2009 and 2010, thus there are missing assays for iron, manganese, and calcium oxides in the main drill hole database. The
missing assays are estimated based on the 2014 regressions (A. Noble in Roche-Engineering, 2014) based on oxide type, and TREO grade
(Table 11-6). Because the iron, manganese, and calcium oxides are critical elements for acid consumption in the treatment process,
it is recommended that the pulps be retrieved for the intervals with missing assays and assayed for the full suite of elements used for
later drilling.
| | | |
| Ore Reserves Engineering | Page 11-12 | 29 February 2024 |
Table 11-6. Regression Formulas for the Estimation
of Missing Iron, Manganese, and Calcium Oxides
Grades for the Bull Hill Deposit (Roche-Engineering, 2014)
| 11.6.2 | TREO-Grade Adjustments for Oxidation Zones |
Statistical analysis shows that high-grade oxide
composites tend to be higher grade than composites from the high-grade zones of the OxCa type. This means that using oxide composites
to estimate grades in the OxCa would tend to overestimate grades in that oxidation type. Conversely, using OxCa composites to estimate
grades in the oxide zone would tend to underestimate grades in this zone.
Despite this fact, to provide continuity of data
for estimation it is desirable to use as much of the data as possible. Accordingly, a conservative composite selection and discounting
strategy was developed to minimize the risk of overestimating REE grades while using as many samples as possible. The composite selection
strategy followed is described below:
| 1. | Only composites from the low-grade zone
were used to estimate low-grade blocks and only composites from the high-grade zone were
used to estimate high-grade blocks. |
| 2. | The adjustment factors summarized in
Table 11-7 were used to adjust composite grades before block grade estimation. Where
the adjustment factor for a block-composite oxide type is shown with an “X” in
the table, that oxide-type pairing was not used for estimation. |
Table 11-7. Updated adjustment Factors for
Grade Estimation–Block Zone and Composite Zone
Combinations (Noble & Barrero, 2024)
| Block
OXIDE |
Composite
OXIDE |
OreZone
= 0 (Low-Grade) |
OreZone
= 1 (High-Grade) |
| TREO |
Fe2O3 |
MnO |
CaO |
TREO |
Fe2O3 |
MnO |
CaO |
| Ox |
Ox |
1.00 |
1.00 |
1.00 |
1.00 |
1.00 |
1.00 |
1.00 |
1.00 |
| OxCa |
1.00 |
1.00 |
X |
X |
1.00 |
1.00 |
X |
X |
| OxCa |
Ox |
0.96 |
0.94 |
X |
X |
0.93 |
0.92 |
X |
X |
| OxCa |
1.00 |
1.00 |
1.00 |
1.00 |
1.00 |
1.00 |
1.00 |
1.00 |
To study
the spatial continuity of the composited TREO, FMR, iron, manganese, and calcium oxides, uranium, thorium, and the OreZONE flag (0 or
1), the variograms were computed with Snowden Supervisor (Datamine) using the trend-flattened coordinate space.
| | | |
| Ore Reserves Engineering | Page 11-13 | 29 February 2024 |
In the trend-flattened coordinate space, the
XY plane in the variogram space is equivalent to a flattened longitudinal section subparallel to the ore zoning, and the Z-variogram
axis is perpendicular to the ore zoning.
Using the trend-flattened coordinate space improves
continuity evaluation by allowing the variograms to follow the irregular shape of the vein trends. The ability to follow the zoning is
particularly important for these deposits since the anisotropy perpendicular to the trend can be more than 20:1, and a slight misalignment
perpendicular to the trend introduces a large variability to the variogram.
TREO and the other grade variograms were independently
evaluated using log-transformed correlograms for each estimation domain and within the high-grade and low-grade OreZONEs using data only
from the Oxide and OxCa zones. In some cases, variogram computation was also evaluated within a certain grade range, for example, for
iron oxide.
Variograms for the OreZONE indicator variable
were computed using correlograms without any transformation of the zero/one (0,1) indicator.
Variogram models were fitted to the experimental
variograms using Supervisor and up to two nested, exponential variograms, using the practical convention for the exponential variogram
range.
The resulting variogram model parameters are
summarized in Table 11-8. Experimental variograms and models are shown for directions closest to the principal variogram axes
in Figure 11-7 through Figure 11-17.
F-function values for 10x10x10-foot blocks were
computed for each variogram for later use in validating the grade estimation. The F-function value is equal to the variance of samples
within a block of a particular size and shape. Smoothing factors, which are the variance reduction factors that would be expected when
moving from the distribution of samples to the distribution of blocks, are listed in Table 11-8.
| | | |
| Ore Reserves Engineering | Page 11-14 | 29 February 2024 |
Table 11-8. Summary of Exponential Variogram
Models (Noble & Barrero, 2024)
| Variable |
OXIDE |
OreZONE |
Domain |
Grade Range |
|
10ft3
Smoothing
Factor |
| Rotation |
Nugget |
Structure 1 |
Structure 2 |
| Sill |
Range |
Sill |
Range |
| X' |
Y' |
Z' |
X' |
Y' |
Z' |
| OreZone |
Ox |
All |
All |
All |
60 |
0.00 |
0.58 |
102 |
83 |
20 |
0.42 |
349 |
109 |
109 |
0.71 |
| TREO (%) |
Ox |
LG |
Global -M1 |
All |
50 |
0.15 |
0.38 |
112.0 |
141.0 |
115.0 |
0.47 |
1554.0 |
2000.0 |
2000.0 |
0.79 |
| M1 |
All |
-50 |
0.20 |
0.36 |
309.0 |
221.0 |
109.0 |
0.44 |
310.0 |
603.0 |
259.0 |
0.74 |
| HG |
Global -M1 |
All |
-20 |
0.10 |
0.49 |
223.0 |
31.0 |
31.0 |
0.41 |
428.0 |
232.0 |
232.0 |
0.69 |
| M1 |
All |
60 |
0.20 |
0.52 |
253.0 |
274.0 |
68.0 |
0.28 |
776.0 |
424.0 |
93.0 |
0.69 |
| FMR (%) |
Ox |
LG |
Global -M1 |
All |
70 |
0.35 |
0.65 |
888 |
888 |
558 |
- |
- |
- |
- |
0.63 |
| M1 |
All |
50 |
0.11 |
0.30 |
259 |
67 |
64 |
0.59 |
601 |
465 |
127 |
0.78 |
| HG |
Global -M1 |
All |
0 |
0.24 |
0.34 |
55 |
55 |
55 |
0.42 |
430 |
430 |
430 |
0.64 |
| M1 |
All |
0 |
0.24 |
0.36 |
479 |
271 |
79 |
0.40 |
1134 |
272 |
239 |
0.69 |
| Fe2O3 (%) |
Ox |
LG |
Global |
2<=Fe 2O3<20 |
90 |
0.08 |
0.31 |
136 |
136 |
136 |
0.61 |
1087 |
802 |
500 |
0.86 |
| HG |
Global |
5<=Fe 2O3<45 |
90 |
0.19 |
0.46 |
99 |
215 |
138 |
0.35 |
775 |
932 |
502 |
0.74 |
| MnO (%) |
Ox |
LG |
Global-M1 |
All |
70 |
0.10 |
0.36 |
155 |
143 |
70 |
0.54 |
1065 |
859 |
641 |
0.83 |
| M1 |
All |
90 |
0.10 |
0.50 |
418 |
418 |
84 |
0.40 |
419 |
419 |
161 |
0.81 |
| HG |
Global-M1 |
All |
40 |
0.10 |
0.53 |
654 |
654 |
175 |
0.37 |
789 |
789 |
467 |
0.86 |
| M1 |
All |
0 |
0.10 |
0.33 |
211 |
57 |
57 |
0.57 |
730 |
88 |
88 |
0.73 |
| OxCa |
LG |
Global |
0.2<=MnO<3 |
50 |
0.20 |
0.26 |
290 |
290 |
38 |
0.54 |
814 |
814 |
464 |
0.72 |
| HG |
All |
80 |
0.20 |
0.32 |
217 |
113 |
113 |
0.48 |
342 |
291 |
291 |
0.73 |
| CaO (%) |
Ox |
LG |
Global |
All |
-20 |
0.10 |
0.09 |
369 |
90 |
106 |
0.81 |
1027 |
314 |
419 |
0.85 |
| HG |
All |
-10 |
0.13 |
0.29 |
865 |
304 |
304 |
0.58 |
1060 |
335 |
346 |
0.83 |
| OxCa |
LG |
0.6<=CaO<18 |
30 |
0.10 |
0.40 |
611 |
44 |
44 |
0.50 |
706 |
235 |
235 |
0.75 |
| HG |
CaO>=3 |
80 |
0.20 |
0.36 |
115 |
94 |
104 |
0.44 |
625 |
625 |
188 |
0.71 |
| Th (ppm) |
Ox |
LG |
Global |
All |
50 |
0.10 |
0.46 |
113 |
158 |
278 |
0.44 |
5000 |
1900 |
297 |
0.83 |
| HG |
All |
50 |
0.12 |
0.40 |
241 |
258 |
221 |
0.48 |
5000 |
616 |
269 |
0.83 |
| U (ppm) |
Ox |
LG |
Global |
All |
60 |
0.10 |
0.36 |
305 |
551 |
167 |
0.54 |
1382 |
552 |
640 |
0.86 |
| HG |
All |
80 |
0.20 |
0.49 |
356 |
172 |
114 |
0.31 |
424 |
398 |
424 |
0.73 |
| | | |
| Ore Reserves Engineering | Page 11-15 | 29 February 2024 |

Figure 11-7. Experimental Variograms and Models
for the OreZONE Indicator (Noble & Barrero, 2024)
The OreZONE variograms in Figure 11-7 measure
the continuity of the OreZONE flag, which is a zero/one (0,1) indicator variable that is used to define Low-Grade (0) and High-Grade
(1) zones for the resource block model. Variograms are well defined, indicating a strong anisotropy along the 150 direction (+60
degrees rotation), and isotropic in the other two directions, with the longest range of 349 feet along the primary axis (X’), and
109 feet in the secondary axis (Y’) and in the tertiary axis (Z’-perpendicular to the trend).
| | | |
| Ore Reserves Engineering | Page 11-16 | 29 February 2024 |

Figure 11-8. Experimental Variograms and Models
for TREO in the Low-Grade OreZONE, domain M1 not included (Noble & Barrero, 2024)
Variograms for TREO in the low-grade zone (Figure
11-8), for all domains except M1, are isotropic in the secondary axis (Y’) and in the tertiary axis (Z’-perpendicular
to the trend) with the longest ranges of 2000ft along these directions. The shortest range of 1554 feet is found along the primary axis
(X’) in the 140 direction (+50 degrees rotation).
| | | |
| Ore Reserves Engineering | Page 11-17 | 29 February 2024 |

Figure 11-9. Experimental Variograms and Models
for TREO in the Low-Grade OreZONES in domain M1 (Noble & Barrero, 2024)
Variograms for TREO in M1 domain for the low-grade
OreZONE (Figure 11-9) indicate a strong geometric anisotropy, with better continuity along the 310/140 direction (-50 degrees
rotation), with the longest range of 603 feet along this secondary axis (Y’). A medium range of 310 feet in the primary axis (X’)
and the shortest range of 259 feet along the tertiary axis (Z’), perpendicular to the trend.
In general, in all domains except M1, continuity
is better in low-grade than high-grade zones.
| | | |
| Ore Reserves Engineering | Page 11-18 | 29 February 2024 |

Figure 11-10. Experimental Variograms and Models
for TREO in the High-Grade OreZONE, domain M1 not included (Noble & Barrero, 2024)
Variograms for TREO in the high-grade zone for
all domains except M1 (Figure 11-10), are isotropic in the YZ plane with the shortest ranges of 232ft along these directions.
The better continuity is found along the 070 direction (-20 degrees rotation), with the longest range of 428 feet along this axis (X’),
in the up-down direction of the mineralized dikes.
| | | |
| Ore Reserves Engineering | Page 11-19 | 29 February 2024 |

Figure 11-11. Experimental Variograms and Models
for TREO in the High-Grade Zone OreZONE in domain M1 (Noble & Barrero, 2024)
Variograms for TREO in the high-grade zone of
the M1 domain (Figure 11-11), show a strong geometric anisotropy with the best continuity along the 150 direction (+60 degrees
rotation) with the longest range of 776 ft in this axis (X’) and a shorter range of 424ft in the secondary axis (Y’); this
indicates that the continuity is better along the direction of the dikes than in the up-down direction of these. The shortest range of
93 feet is found along the tertiary axis (Z’), or perpendicular to the dikes.
The spatial continuity study of the TREO indicates
that the high-grade OreZONE is dominated by the orientation of the dikes, parallel to the ore zoning and that the low-grade is more continuous
and dominated by the stockwork-type mineralization.
| | | |
| Ore Reserves Engineering | Page 11-20 | 29 February 2024 |

Figure 11-12. Variogram models for FMR (%)
in the low-grade (above) and high-grade OreZONES (below), in domain 1 (left) and the other domains (right), (Noble &
Barrero, 2024)
Variogram Models for FMR are shown in Figure
11-12. FMR in domain M1 is characterized by a strong geometric anisotropy, especially in the high-grade OreZONE with a very short
range along the Z axis perpendicular to the trend, indicating also zonal anisotropy. When considering the other domains, the low-grade
shows the best continuity in the trend plane with ranges of 888ft in both X and Y axes (isotropic), with the shortest ranges and continuity
in the isotropic high–grade OreZONE.
| | | |
| Ore Reserves Engineering | Page 11-21 | 29 February 2024 |

Figure 11-13. Variogram models for calcium
oxide (%) in the Oxide (above) and OxCa (below) zones, low- grade and high-grade zones OreZONES, in all domains (Noble &
Barrero, 2024)
Calcium oxide variogram models have been studied
for all domains but separately in the Oxide and OxCa zones (Figure 11-13). In the Oxide zone, the best continuity and longest
ranges are found in the up-down direction of the trend plane with similar and much shorter ranges along the trend and perpendicular to
it. For the low-grade zone in the OxCa zone, continuity is similar to the Oxide zone with longer ranges also parallel to the up-down
direction of the trend plane; in the high-grade zone, continuity is isotropic in the trend plane (XY) with ranges of 625 ft, and a very
short range across the trend (188 ft).
| | | |
| Ore Reserves Engineering | Page 11-22 | 29 February 2024 |

Figure 11-14. Variogram models for
manganese oxide (%) in the Oxide zone, in the M1, and in the other domains for low-grade (above) and high-grade (below) OreZONES
(Noble & Barrero, 2024)
Manganese oxide variogram models have been studied
separately in the Oxide and OxCa zones (Figure 11-14). In the low-grade, oxide OreZONE, manganese oxide is almost isotropic except
for M1. There are strong anisotropies in low-grade M1 and in all high-grade OreZONES.
| | | |
| Ore Reserves Engineering | Page 11-23 | 29 February 2024 |

Figure 11-15. Variogram models for manganese
oxide (%) in the OxCa zone, for low-grade and high- grade zones OreZONEs in all domains (Noble & Barrero, 2024)
In the OxCa Zone (Figure 11-15), the continuity
of the calcium oxide is mostly isotropic within the trend plane with slightly shorter ranges perpendicular to the trend. In general,
the shortest ranges are associated with the high-grade zones.

Figure 11-16. Variogram models for iron oxide
(%) in all domains for the low-grade and high-grade OreZONEs (Noble & Barrero, 2024)
Iron oxide variogram models for all domains are
similar to those for manganese oxide (Figure 11-16), demonstrating geometric anisotropy along the strike of the trend surface
and shortest ranges perpendicular to the trend.
| | | |
| Ore Reserves Engineering | Page 11-24 | 29 February 2024 |

Figure 11-17. Variogram models for Thorium
(above) and Uranium (below) in the low-grade and high- grade zones, in all domains (Noble & Barrero, 2024)
Thorium and uranium variogram models are displayed
in Figure 11-17. Thorium shows the strongest geometric anisotropy and best continuity along the trend orientation with ranges
of 5000ft along the main axis (X’) and the shortest ranges perpendicular to the trend (Z axis). In the case of uranium, continuity
is better in the low-grade OreZONE with longer ranges along the 150 orientation (60 degrees rotation) or along the trend. In the high-grade
zone is almost isotropic.
The OreZONE block model was created using nearest-neighbor
assignment (NN) to assign the OreZONE Flag from composites to blocks without regard to oxidation type (section 11.6). The OreZONE
search ellipse radii and rotation are developed based on variogram ranges for the OreZONE flag parameter (Table 11-8), with 500
ft search dimension in X, 350 ft in Y, and 15 ft in Z, and a rotation of 60 degrees around the Z axis of the ellipse. The rotation and
the search ellipse dimensions are relative to the trend flattened coordinates. A plan map through the OreZONE block model at the 5600
ft elevation is shown in Figure 11-18.
| | | |
| Ore Reserves Engineering | Page 11-25 | 29 February 2024 |

Figure 11-18. Plan Map Showing the OreZONE
Block Model at Elevation 5600 ft; the estimation domain contours are plotted for reference (Noble & Barrero, 2024)
| | | |
| Ore Reserves Engineering | Page 11-26 | 29 February 2024 |
The estimation of individual rare-earth-element
grades and TREO, iron oxide (%Fe2O3), manganese oxide(%MnO), calcium oxide (%CaO), and uranium (ppm U) and thorium
(ppm Th) grades was done using inverse-distance-power (IDP) interpolation with nearest-neighbor (NN) estimation to provide a comparison
check for the IDP estimates and also to evaluate the degree of smoothing of the estimates. The estimation procedure was done in the trend-flattened
coordinate space using estimation parameters specific to each combination of element, OreZONE, and estimation domain.
Specific search ellipse parameters have been
defined, depending on the grade variable, globally (for all estimation domains), for M1 domain, or for all domains excluding M1. The
search-ellipse parameters for all data are summarized in Table 11-9. Search ellipses use the Datamine Studio RM search ellipse
expansion option, which increases the search radius until the desired minimum number of samples is selected, with a maximum of one composite
for the estimation from any given hole. For the first pass (no expansion), a minimum of 6 and a maximum of 9 composites are selected.
The second pass uses an expansion factor of 1.5 of the original searches and the same parameters for composite selection. An expansion
factor of 3 is used in the last pass, with a minimum of one composite and a maximum of 9 composites.
Table 11-9. Search Parameters for IDP and NN
Estimation of Grades (Noble & Barrero, 2023).
| |
|
|
|
TREO |
Fe2O3 |
MnO |
CaO |
Th |
U |
| OreZONE |
OXIDE |
Domain |
M1 |
Global
(not M1) |
Global |
M1 |
Global
(not M1) |
Global |
Global |
Global |
| Low-Grade
OreZONE |
Oxide |
Rotation |
|
40 |
0 |
90 |
0 |
70 |
-20 |
50 |
60 |
| Search
Radius |
X' |
300 |
300 |
300 |
300 |
300 |
300 |
300 |
300 |
| Y' |
225 |
300 |
225 |
300 |
45 |
90 |
115 |
176 |
| Z' |
30 |
30 |
30 |
45 |
30 |
120 |
85 |
30 |
| OxCa |
Rotation |
40 |
0 |
90 |
0 |
0 |
30 |
50 |
60 |
| Search
Radius |
X' |
300 |
300 |
300 |
300 |
300 |
300 |
300 |
300 |
| Y' |
225 |
300 |
225 |
300 |
300 |
75 |
115 |
176 |
| Z' |
30 |
30 |
30 |
100 |
100 |
60 |
85 |
30 |
| High-Grade
OreZONE |
Oxide |
Rotation |
60 |
-20 |
0 |
0 |
0 |
-10 |
50 |
80 |
| Search
Radius |
X' |
300 |
300 |
300 |
300 |
300 |
300 |
300 |
300 |
| Y' |
235 |
105 |
300 |
50 |
300 |
100 |
75 |
190 |
| Z' |
30 |
30 |
30 |
45 |
30 |
120 |
25 |
30 |
| OxCa |
Rotation |
60 |
-20 |
0 |
80 |
80 |
0 |
50 |
80 |
| Search
Radius |
X' |
300 |
300 |
300 |
300 |
300 |
300 |
300 |
300 |
| Y' |
235 |
105 |
300 |
220 |
220 |
300 |
75 |
190 |
| Z' |
30 |
30 |
30 |
30 |
30 |
30 |
25 |
30 |
| Note
– TREO parameters were used for all REE and TREO |
| | | |
| Ore Reserves Engineering | Page 11-27 | 29 February 2024 |
Grade estimation parameters are optimized for
each element/zone/OreZONE combination, and, in particular, the power is optimized to provide the desired smoothing factor for the block
variance (F-function, Table 11-8). The estimation parameters are summarized in Table 11-10.
Table 11-10. Estimation Parameters for IDP
Estimation of Grades (Noble & Barrero, 2023)
| |
|
|
|
TREO |
Fe2O3 |
MnO |
CaO |
Th |
U |
| OreZONE |
OXIDE |
Domain |
M1 |
Global (not M1) |
Global |
M1 |
Global (not M1) |
Global |
Global |
Global |
| Low-Grade OreZONE |
Oxide |
Rotation |
40 |
0 |
90 |
70 |
70 |
-20 |
50 |
60 |
| Anisotropy distances |
X' |
300 |
300 |
300 |
300 |
300 |
300 |
100 |
300 |
| Y' |
225 |
300 |
225 |
245 |
245 |
95 |
300 |
176 |
| Z' |
120 |
300 |
140 |
180 |
180 |
120 |
85 |
145 |
| Power |
4 |
4 |
4 |
4 |
4 |
4 |
3 |
4 |
| OxCa |
Rotation |
40 |
0 |
90 |
0 |
0 |
30 |
50 |
60 |
| Anisotropy distances |
X' |
300 |
300 |
300 |
300 |
300 |
300 |
100 |
300 |
| Y' |
225 |
300 |
225 |
300 |
300 |
60 |
300 |
176 |
| Z' |
120 |
300 |
140 |
150 |
150 |
60 |
85 |
145 |
| Power |
4 |
4 |
4 |
4 |
3.2 |
4 |
3.1 |
4 |
| High-Grade OreZONE |
Oxide |
Rotation |
60 |
-20 |
0 |
0 |
0 |
-10 |
50 |
80 |
| Anisotropy distances |
X' |
300 |
300 |
300 |
300 |
300 |
300 |
300 |
300 |
| Y' |
235 |
105 |
300 |
300 |
300 |
100 |
45 |
190 |
| Z' |
60 |
105 |
250 |
115 |
115 |
100 |
25 |
150 |
| Power |
3.5 |
3.6 |
4 |
4 |
4 |
4 |
3.9 |
4 |
| OxCa |
Rotation |
60 |
-20 |
0 |
80 |
80 |
0 |
50 |
80 |
| Anisotropy distances |
X' |
300 |
300 |
300 |
300 |
300 |
300 |
300 |
300 |
| Y' |
235 |
105 |
300 |
220 |
220 |
300 |
45 |
190 |
| Z' |
60 |
105 |
250 |
220 |
220 |
135 |
25 |
150 |
| Power |
3.6 |
3.5 |
4 |
4 |
3 |
3.6 |
3 |
4 |
| |
|
|
|
|
|
|
|
|
|
|
|
| Note – TREO parameters were used for all REE and TREO |
| 11.10 | Block Model Verification |
The IDP grade model was verified in comparison
with the NN grade model to ensure that the estimates were unbiased on an overall basis, and to verify that the variance of the block
estimates was similar to the variance predicted from the variogram F-Functions.
The comparison for TREO, tabulated in Table
11-11, was done using only those blocks classified as measured and indicated blocks, since the inferred blocks don’t have sufficient
reliability for this comparison. The results of NN vs. IDP comparisons show that the difference between the average IDP and NN grades
is generally better than 2% for individual zones or the average of any oxide zone/OreZONE combination. The variance reduction from NN
block estimates is also generally in the expected range.
| | | |
| Ore Reserves Engineering | Page 11-28 | 29 February 2024 |
Table 11-11. Comparison of IDP vs. NN Estimates
for TREO (Noble & Barrero, 2023)
Oxide
Type |
OreZONE |
Domain |
IDP
Estimates |
NN
Estimates |
Ratio
IDP : NN |
Target
Smoothing
Ratio |
| #Blocks |
Average
Grade |
Relative
Variance |
Average
Grade |
Relative
Variance |
Average
Grade |
Rel.
Var.
(Smoothing
Ratio) |
| Oxide
Zone |
Low-Grade |
M1 |
119,543
|
0.738 |
0.122 |
0.738 |
0.175 |
1.000 |
0.698 |
0.740 |
| Global
(not M1) |
259,070
|
0.669 |
0.125 |
0.669 |
0.171 |
1.001 |
0.727 |
0.790 |
| High-Grade
|
M1 |
46,450
|
4.227 |
0.418 |
4.239 |
0.608 |
0.997 |
0.688 |
0.690 |
| Global
(not M1) |
84,233
|
2.892 |
0.398 |
2.897 |
0.578 |
0.998 |
0.688 |
0.690 |
| OxCa
Zone |
Low-Grade
|
M1 |
60,619
|
0.804 |
0.091 |
0.801 |
0.131 |
1.005 |
0.691 |
0.740 |
| Global
(not M1) |
46,673
|
0.668 |
0.138 |
0.663 |
0.184 |
1.007 |
0.751 |
0.790 |
| High-Grade
|
M1 |
65,471
|
3.775 |
0.185 |
3.780 |
0.268 |
0.999 |
0.692 |
0.690 |
| Global
(not M1) |
24,273
|
2.840 |
0.298 |
2.844 |
0.433 |
0.999 |
0.689 |
0.690 |
IDP vs NN comparisons for Fe2O3,
CaO, MnO, thorium, and uranium are tabulated in Table 11-12 through Table 11-16 and show that those estimates are also
unbiased and that volume-variance effects are accounted for within reasonable limits.
Table 11-12. Comparison of IDP vs. NN Estimates
for Fe2O3 (Noble & Barrero, 2023)
Oxide
Type |
OreZONE |
Domain |
IDP
Estimates |
NN
Estimates |
Ratio
IDP : NN |
Target
Smoothing
Ratio |
| #Blocks |
Average
Grade |
Relative
Variance |
Average
Grade |
Relative
Variance |
Average
Grade |
Rel.
Var.
(Smoothing
Ratio) |
| Oxide
Zone |
Low-Grade |
Global |
378,613 |
8.548 |
0.036 |
8.558 |
0.050 |
0.999 |
0.718 |
0.86 |
| High-Grade |
Global |
130,683 |
13.912 |
0.107 |
13.952 |
0.148 |
0.997 |
0.723 |
0.74 |
| OxCa
Zone |
Low-Grade |
Global |
107,292 |
7.482 |
0.023 |
7.448 |
0.032 |
1.005 |
0.707 |
0.86 |
| High-Grade |
Global |
89,744 |
12.276 |
0.085 |
12.270 |
0.117 |
1.000 |
0.729 |
0.74 |
| | | |
| Ore Reserves Engineering | Page 11-29 | 29 February 2024 |
Table 11-13. Comparison of IDP vs. NN Estimates
for CaO (Noble & Barrero, 2023)
Oxide
Type |
OreZONE |
Domain |
IDP
Estimates |
NN
Estimates |
Ratio
IDP : NN |
Target
Smoothing
Ratio |
| #Blocks |
Average
Grade |
Relative
Variance |
Average
Grade |
Relative
Variance |
Average
Grade |
Rel.
Var.
(Smoothing
Ratio) |
| Oxide
Zone |
Low-Grade |
Global |
378,613 |
0.583 |
1.233 |
0.581 |
1.592 |
1.004 |
0.775 |
0.85 |
| High-Grade |
Global |
130,683 |
0.913 |
1.679 |
0.910 |
2.661 |
1.003 |
0.631 |
0.83 |
| OxCa
Zone |
Low-Grade |
Global |
107,291 |
4.122 |
0.312 |
4.151 |
0.427 |
0.993 |
0.731 |
0.75 |
| High-Grade |
Global |
89,645 |
16.574 |
0.230 |
16.538 |
0.323 |
1.002 |
0.713 |
0.71 |
Table 11-14. Comparison of IDP vs. NN Estimates
for MnO (Noble & Barrero, 2023)
Oxide
Type |
OreZONE |
Domain |
IDP
Estimates |
NN
Estimates |
Ratio
IDP : NN |
Target
Smoothing
Ratio |
| #Blocks |
Average
Grade |
Relative
Variance |
Average
Grade |
Relative
Variance |
Average
Grade |
Rel.
Var.
(Smoothing
Ratio) |
| Oxide
Zone |
Low-Grade |
M1 |
119,543 |
1.422 |
0.373 |
1.424 |
0.563 |
0.998 |
0.662 |
0.81 |
| Global
(not M1) |
259,070 |
1.351 |
0.396 |
1.348 |
0.569 |
1.002 |
0.696 |
0.83 |
| High-Grade |
M1 |
46,450 |
4.352 |
0.598 |
4.432 |
0.854 |
0.982 |
0.700 |
0.73 |
| Global
(not M1) |
84,233 |
3.157 |
0.892 |
3.101 |
1.151 |
1.018 |
0.775 |
0.86 |
| OxCa
Zone |
Low-Grade |
M1 |
60,619 |
1.108 |
0.115 |
1.105 |
0.188 |
1.003 |
0.615 |
0.72 |
| Global
(not M1) |
46,673 |
0.979 |
0.147 |
0.967 |
0.205 |
1.012 |
0.718 |
0.72 |
| High-Grade |
M1 |
65,471 |
3.223 |
0.326 |
3.229 |
0.493 |
0.998 |
0.661 |
0.73 |
| Global
(not M1) |
24,174 |
2.342 |
0.248 |
2.337 |
0.338 |
1.002 |
0.734 |
0.73 |
Table 11-15. Comparison of IDP vs. NN Estimates
for thorium (Noble & Barrero, 2023).
Oxide
Type |
OreZONE |
Domain |
IDP
Estimates |
NN
Estimates |
Ratio
IDP : NN |
Target
Smoothing
Ratio |
| #Blocks |
Average
Grade |
Relative
Variance |
Average
Grade |
Relative
Variance |
Average
Grade |
Rel.
Var.
(Smoothing
Ratio) |
| Oxide
Zone |
Low-Grade |
Global |
378,613 |
94.401 |
0.298 |
94.094 |
0.386 |
1.003 |
0.772 |
0.77 |
| High-Grade |
Global |
130,683 |
329.639 |
1.122 |
328.905 |
1.433 |
1.002 |
0.783 |
0.78 |
| OxCa
Zone |
Low-Grade |
Global |
107,292 |
77.307 |
0.170 |
77.005 |
0.221 |
1.004 |
0.770 |
0.77 |
| High-Grade |
Global |
89,744 |
288.034 |
0.569 |
285.621 |
0.728 |
1.008 |
0.782 |
0.78 |
Table 11-16. Comparison of IDP vs. NN Estimates
for uranium (Noble & Barrero, 2023)
| | | |
| Ore Reserves Engineering | Page 11-30 | 29 February 2024 |
Oxide
Type |
OreZONE |
Domain |
IDP
Estimates |
NN
Estimates |
Ratio
IDP : NN |
Target
Smoothing
Ratio |
| #Blocks |
Average
Grade |
Relative
Variance |
Average
Grade |
Relative
Variance |
Average
Grade |
Rel.
Var.
(Smoothing
Ratio) |
| Oxide
Zone |
Low-Grade |
Global |
378,613
|
39.037 |
0.253 |
38.777 |
0.339 |
1.007 |
0.745 |
0.86 |
| High-Grade
|
Global |
130,683
|
99.087 |
0.307 |
99.873 |
0.433 |
0.992 |
0.709 |
0.73 |
| OxCa
Zone |
Low-Grade
|
Global |
107,292
|
52.169 |
0.356 |
51.736 |
0.454 |
1.008 |
0.783 |
0.86 |
| High-Grade
|
Global |
89,744
|
112.346 |
0.238 |
112.806 |
0.337 |
0.996 |
0.706 |
0.73 |
| 11.11 | Block Model Density Estimation |
Densities were estimated for each block based
on the fraction of FMR/carbonatite mineralization using IDP estimation and the same procedure used for estimating the TREO and REE grades.
The formulae used for the block model density estimates are summarized in Table 11-17.REminIDP is the IDP estimate of the percentage
of FMR and Carbonatite. Default density is assigned to blocks with no REminIDP estimate using a value of zero (0.00) for REminIDP. Metric
densities are divided by 32.036927 to convert from t/m3 to short tons/ft3.
Table 11-17. Formulae for Block Density Estimation
(A. Noble, in Roche-Engineering, 2014)
| Oxidation
Type |
Default
Density
(t/m3) |
Density
Formula |
| Overburden &
Clay |
1.8 |
|
| Oxide |
2.26 |
DENSITY=0.01*
(REminIDP*1.81+(100 - REminIDP)*2.26) |
| OxCa |
2.32 |
DENSITY=0.01*
(REminIDP*2.16+(100 - REminIDP)*2.32) |
| Tran |
2.55 |
|
| Sulf |
2.59 |
|
Dilution is introduced to the resource estimate
in three ways:
First, the sampling interval for assaying is
generally a consistent 10-foot interval. Accordingly, an assay interval may consist of a mixture of two or more types of mineralization.
For example, an interval may consist of 9 feet of high-grade FMR and 1 foot of wall rock, resulting in 10% dilution. Alternatively, an
interval may have 1 foot of high-grade FMR and 9 feet of wall rock, resulting in 90% dilution. It is impossible to quantify the amount
of dilution introduced by the 10-foot sampling interval, but it would be significant in those areas with narrow veins and less so in
parts of the Bull Hill Main dike, which can exceed 50-feet in width.
The second source of dilution is compositing
into true-width composites with a nominal length of 10 feet. Because the nearly vertical ore zones are intersected by drill holes with
an average angle of 60 degrees, a 10-foot ore intersection on the drill hole will only result in a true-width intersection of 5-feet.
When the 5-foot true-width intervals are combined to make an ore-zone composite of at least 10-feet, there is inevitable dilution and
loss of higher-grade mineralization, as summarized in Table 11-18. At the resource cutoff of 2.18% TREO, compositing dilution
adds 13.9% to the composite length, with a corresponding reduction in TREO grade.
| | | |
| Ore Reserves Engineering | Page 11-31 | 29 February 2024 |
Table 11-18. Compositing Dilution Summary (Noble,
2023)
Cutoff
%
TREO |
Drill
Holes |
Composites |
%
Difference |
Total
Length |
Total
True
Length |
True
Length*
%TREO |
Average
% TREO |
Total
Length |
Total
True
Length |
True
Length*
% TREO |
Average
%TREO |
True
Length |
Contained
%TREO |
%
TREO
Grade |
| 1 |
48,101 |
25,424 |
74,469 |
2.929 |
50,489 |
26,476 |
72,959 |
2.756 |
4.1% |
-2.0% |
-5.9% |
| 2 |
21,210 |
11,093 |
54,757 |
4.936 |
24,551 |
12,738 |
54,194 |
4.255 |
14.8% |
-1.0% |
-13.8% |
| 2.18 |
19,497 |
10,185 |
52,861 |
5.190 |
22,423 |
11,601 |
51,821 |
4.467 |
13.9% |
-2.0% |
-13.9% |
| 2.5 |
16,947 |
8,763 |
49,538 |
5.653 |
18,801 |
9,714 |
47,403 |
4.880 |
10.9% |
-4.3% |
-13.7% |
| 3 |
13,854 |
7,143 |
45,085 |
6.312 |
14,805 |
7,603 |
41,600 |
5.472 |
6.4% |
-7.7% |
-13.3% |
| 3.5 |
11,590 |
5,947 |
41,215 |
6.930 |
11,381 |
5,856 |
35,935 |
6.137 |
-1.5% |
-12.8% |
-11.4% |
| 3 |
13,854 |
7,143 |
45,085 |
6.312 |
14,805 |
7,603 |
41,600 |
5.472 |
6.4% |
-7.7% |
-13.3% |
(length in US Survey ft)
The third source of dilution is introduced by
the averaging effects of the IDP grade estimation method. Because data from several drill holes is used for estimation, the grade of
the estimates will tend to be lower than the highest-grade drill holes and higher than the lowest-grade drill holes. This is referred
to as the smoothing effect and can be quantified by comparing the tonnage and grade of NN and IDP estimates at different cutoffs, as
shown in Table 11-19. At the resource cutoff of 2.18 TREO, 13.4% tonnage is added, and grade is reduced by 8.6%.
Table 11-19. Dilution from Inverse-Distance-Power
Estimation (Noble, 2023)
| Cutoff%
TREO |
Nearest
Neighbour |
Inverse
Distance |
%
Difference |
| Short
Tons Resource (1000's) |
Short
Tons TREO (1000's) |
Average
% TREO |
Short
Tons Resource (1000's) |
Short
Tons TREO (1000's) |
Average
% TREO |
Short Tons Resource
(1000's) |
Contained
TREO |
%
TREO Grade |
| 1 |
32,790 |
846 |
2.58 |
29,583 |
807 |
2.73 |
-9.8% |
-4.6% |
5.7% |
| 2 |
14,809 |
602 |
4.07 |
16,891 |
630 |
3.73 |
14.1% |
4.5% |
-8.4% |
| 2.18 |
13,336 |
572 |
4.29 |
15,128 |
593 |
3.92 |
13.4% |
3.7% |
-8.6% |
| 2.5 |
10,917 |
515 |
4.72 |
12,289 |
527 |
4.28 |
12.6% |
2.3% |
-9.1% |
| 3 |
8,273 |
442 |
5.35 |
9,035 |
438 |
4.84 |
9.2% |
-1.1% |
-9.4% |
While it is believed this level of dilution can
be reasonably achieved with selective mining practices, the authors emphasize that intense grade-control procedures must be used, or
excessive dilution will result.
| 11.13 | Resource Classification |
Classification of mineral resources into measured,
indicated, and inferred resource classes is based on drill-hole spacing and the number of drill holes selected for estimation.
| | | |
| Ore Reserves Engineering | Page 11-32 | 29 February 2024 |
Drill-hole spacing is measured in the trend-flattened
coordinate space using the variance from the kriging of a flag variable. A zero-nugget, linear variogram is used for the kriging runs,
resulting in a kriging variance directly proportional to the drill-hole spacing. In addition, limits were placed on the estimation expansion
volume to ensure that measured and indicated blocks were defined by at least 6 drill holes within search volumes 1 and 2. The parameters
for resource classification are summarized in Table 11-20.
The variable RCLASS is used to identify
the resource class in each block. RCLASS= 1 is assigned to blocks in the measured category, and RCLASS=2 is assigned to blocks in the
indicated category. RCLASS=3 is assigned to blocks in the inferred category, unless the drill-hole spacing is greater than 300 feet,
in which case the block is unclassified.
Table 11-20. Parameters for Resource Classification
in the Ox and OxCa zones (Noble & Barrero, 2023)
| |
Grid
Spacing (feet) |
Search
Volume |
| Resource
Class |
Measured |
Indicated |
Inferred |
Measured |
Indicated |
Inferred |
| RCLASS |
1 |
2 |
3 |
1 |
2 |
3 |
| East |
- |
≤200
|
>
200 and ≤ 300 |
- |
2 |
3 |
| Main
1 |
≤
125 |
>125
and ≤250 |
>
250 and ≤300 |
1 |
2 |
3 |
| Main
2 |
- |
- |
≤
300 |
- |
- |
- |
| Main
3 |
- |
≤200
|
>
200 and ≤ 300 |
- |
2 |
3 |
| Northeast |
- |
- |
≤
300 |
- |
- |
- |
| Southeast |
- |
- |
≤
300 |
- |
- |
- |
| West
1 |
- |
≤200
|
>
200 and ≤ 300 |
- |
2 |
3 |
| West
2 |
- |
- |
≤
300 |
- |
- |
- |
The overburden, clay, transition, and sulfide
oxidation zones are all unclassified, which means that no resources are assigned in these zones.
The Bull Hill Mineral Resource estimate was first
summarized using a Lerchs-Grossmann (LG) pit shell computed using Datamine Studio Maxipit software that was run using all resources,
including inferred resources. Pit optimization was constrained to the south by the limit of Section 20, which is Mineral Withdrawal
Land.
Based on the resulting optimized pit shell, a
preliminary pit design was performed to further delineate the resource. Pit design was done using Datamine Studio OP software and was
constrained to the south by a 50ft buffer from Section 20.
At the time of reporting, the Mineral Resource
summarized by the resulting preliminary pit design is considered to have reasonable prospects for eventual economic extraction by open
pit methods. Mineral resources are estimated from the current topography and are dated 31 December 2023.
| | | |
| Ore Reserves Engineering | Page 11-33 | 29 February 2024 |
| 11.14.1 | Key Assumptions and Parameters for Pit Optimization |
The Lerchs-Grossmann (LG) algorithm was used
to analyze economic pit limits based on metallurgical recoveries and other parameters. Considered key assumptions and parameters are
described below:
| 1. | Rock
Types: A model of the Bull Hill deposit rock types was created as a three-dimensional (3D)
block model using Datamine Studio RM software with a block size of 10x10x10-foot. This rock-type
block model is necessary to provide slope, mining, and processing cost parameters to the
ores (Oxide and OxCa) and the non-ore-bearing geologic units (Overburden, Clay, Transition,
and Sulfide). |
| 2. | Density:
Default densities were assigned to the rock type model based on the average density of the
different rock types; these densities are summarized in Table 11-17. |
| 3. | Overall
Slope Angles (OSAs): Based on the historical geotechnical investigations (Sierra Geotechnical
LLC., 2013), an OSA of 30° was used for the entire upper 150ft below the ground surface
where weak rock mass conditions are anticipated, and 35° below this upper section. The
OSAs were used to control the LG shell wall projections. A minimum width of 40ft was set
for the bottom of the pit shell. |
| 4. | Mine
and Plant Operating Costs: These are factored costs estimated based on 2019 cost data and
contractor-estimated costs; RER provided all costs. In the Qualified Persons’ opinion,
these costs are considered reasonable for establishing the prospects of economic extraction
for mineral resources at the time of reporting. Both mining and processing operating costs
are summarized in Table 11-21. |
Table 11-21. Estimated Operating Costs; prices
in US Dollars (provided by RER, 2023)
| Description |
2019
Cost
Estimate |
2023
Cost Estimate, w/assumptions |
| Ore |
Waste |
Comments |
| Cost
Mining/Mined Ton of Ore/waste |
$3.00 |
$6.40 |
$4.00 |
Contract
Mining cost from Wood Plc |
| Cost
CrushScreen/Ore Ton of Ore |
$4.75 |
$4.00 |
|
Contract
Crush cost from Wood Plc |
| Cost
HwyTransport/Hydromet Feed Ton of Ore |
$11.26 |
$13.39 |
|
* |
|
| Cost
TSF Ops/Hydromet Feed Ton of Ore |
$6.00 |
$7.14 |
|
|
|
| Cost
G&A/Hydromet Feed Ton of Ore |
$25.19 |
$29.98 |
|
* |
|
| Cost
Hydromet_SepRef/Hydromet Feed Ton of Ore |
$253.00 |
$301.07 |
|
* |
|
| |
|
|
|
* |
CPI
Inflation Calculator |
| Total
Crush-Screen+Transport +Plant costs + G&A per Ton of Ore |
$356 |
|
|
$1
in 2019 = $1.19 in 2023 |
| |
|
|
|
US
Bureau of Labor Statistics 28/08/2023 |
| |
|
|
|
|
28/08/2023 |
| 5. | Metallurgical
Recoveries, Pay Factors, and Commodity Prices: Updated metallurgical plant recoveries for
the different elements have been provided RER (see Chapter 10), and these are presented
in Table 11-22. Only La, Nd, Pr, Dy, and HREE (Yb+Tm+Tb+Er+Ho+Lu) are considered payable
for pit optimization purposes. The rare-earth oxide prices by element used are Q3 2023 actual
prices in US $ per Kg, provided by RER (Wood Mackenzie, 2023). In the Qualified Persons’
opinion, the metallurgical recoveries, pay factors, and selected commodity prices provide
an adequate basis to establish reasonable prospects for economic extraction of the Bull Hill
Mineral Mineral Resource. |
| | | |
| Ore Reserves Engineering | Page 11-34 | 29 February 2024 |
Table 11-22. Pay Factors, Hydromet Plant Recoveries,
and Rare-Earth Elements Prices (provided by RER, 2023)
| Element |
Pay
Factor |
Hydromet
Plant
Recoveries |
Prices
(US $ /Kg) |
| La |
1 |
0.907 |
0.93 |
| Nd |
1 |
0.898 |
77.25 |
| Pr |
1 |
0.902 |
76.48 |
| Dy |
0.75 |
0.835 |
320 |
| HREE |
0.5 |
0.816 |
1200 |
| Ce |
0 |
0.336 |
0 |
| Sm |
0 |
0.912 |
0 |
| Eu |
0 |
0.913 |
0 |
| Gd |
0 |
0.924 |
0 |
| Y |
0 |
0.788 |
0 |
| 6. | Dilution
and Ore Loss: No additional provisions outside of the block model have been made for mining
dilution and ore loss. A discussion on composite and block model dilution is included in
Section 11.12. |
| 7. | Geometrical
constraints: Pit optimization was constrained by the Section 20 limit to the south and
by a 100ft buffer around the sulfide zone. |
| 11.14.2 | Preliminary Pit design |
Based on the resulting LG economic shell, a preliminary
pit design was completed in Datamine Studio OP. The open pit design parameters used are based on historical geotechnical investigations
(Sierra Geotechnical, 2013) and were assigned to three-dimensional (3D) slope regions. Road width was set to 40ft for one-way traffic
roads and 70ft for two-way traffic, with a maximum road gradient of 10%. The pit design parameters are summarized in Table 11-23,
and a plan view of the location of the three-dimensional (3D) slope regions is shown in Figure 11-19.
| | | |
| Ore Reserves Engineering | Page 11-35 | 29 February 2024 |
Table 11-23. Pit design parameters (Sierra
Geotechnical LLC., 2013)
| Slope
Region |
Bench
Face Angle
(degrees) |
Berm
Width (ft) |
Bench
Height (ft) |
| 1 |
64° |
19 |
20 |
| 2 |
75° |
19 |
20 |
| 3 |
75° |
19 |
20 |
| 4 |
64° |
19 |
20 |
| 5 |
64° |
19 |
20 |
| 10
(upper 150ft) |
52° |
19 |
20 |
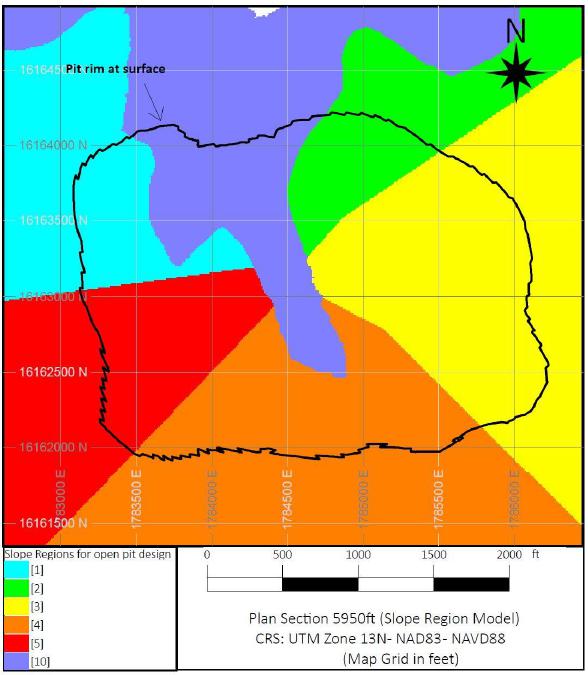
Figure 11-19. Plan View Showing the Slope Region
Model (Noble & Barrero, 2024)
| | | |
| Ore Reserves Engineering | Page 11-36 | 29 February 2024 |
A plan view of
the Bull Hill preliminary pit design used to summarize the mineral resource is shown in Figure 11-20. Pit design bottoms are located
at 5570 and 5590 ft; additionally, a 40ft width catch-berm was designed in the south slope at 5970ft elevation to reduce the inter-ramp
height. Figure 11-21 shows a plan view of the grade model and the design pit rim at 5800 ft elevation; a typical vertical cross-section
perpendicular to the mineralized zones is included in Figure 11-22.
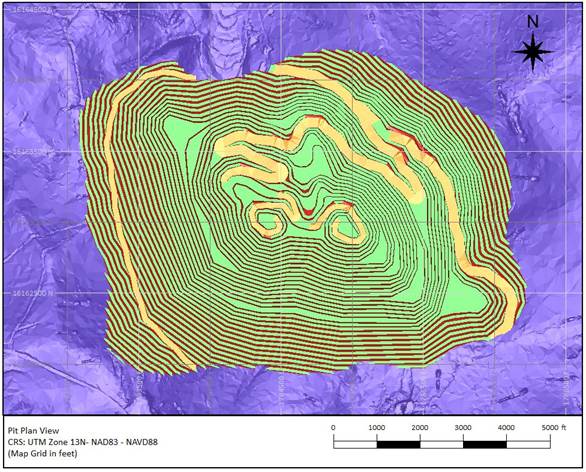
Figure 11-20.
Plan view of the Preliminary Pit Design Used to Summarize the Bull Hill Mineral Resource (Noble & Barrero, 2024)
| | | |
| Ore Reserves Engineering | Page 11-37 | 29 February 2024 |
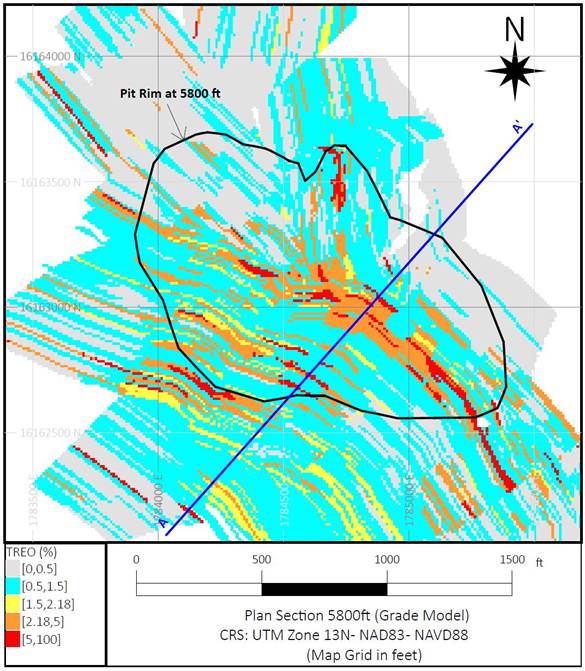
Figure 11-21.
Plan View at 5800ft Elevation with the TREO Grade Model (Noble & Barrero, 2024)
| | | |
| Ore Reserves Engineering | Page 11-38 | 29 February 2024 |
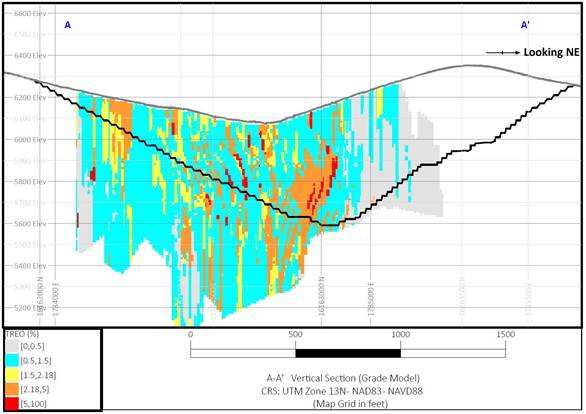
Figure 11-22.
Vertical Section (A-A’) Showing the Grade Model and the Preliminary Pit Design. Section Location is shown in Figure 11-21 (Noble & Barrero, 2024)
| 11.14.3 | Mineral Resource Summary |
This Mineral Resource
estimate is reported in accordance with the Regulation S-K (Title 17 Part 229 Item 601(b)(96) and 1300-1305).
Bull Hill deposit
estimated measured, indicated, and inferred mineral resources contained in the preliminary open pit design, using a base-case cutoff
grade for resource reporting of 2.18% TREO., are summarized in Table 11-24. The effective date of the Mineral Resource Estimate
is 31 December 2023.
A cutoff grade
of 2.18 % TREO was selected as the base case cutoff to summarize the Bull Hill mineral resource; this is roughly equivalent to using
an economic cut-off grade of US $ 356 (see Table 11-21).
| | | |
| Ore Reserves Engineering | Page 11-39 | 29 February 2024 |
Table 11-24.
Bull Hill TREO Mineral Resource Summary by Oxide Type, 31 December 2023 (Noble &
Barrero,2023)
Resource
Class |
OxideType |
Cutoff
%TREO |
Short
Tons |
Metric
Tonnes |
%
TREO |
Contained
TREO
Metric
Tonnes |
Recovered
TREO
Metric
Tonnes |
Recovered
NdPr
Metric
Tonnes |
| (millions) |
(millions) |
(1000’s) |
(1000’s) |
(1000’s) |
| Measured |
Oxide |
2.18 |
1.13 |
1.03 |
4.80 |
49.3 |
32.4 |
9.5 |
| Oxide+Calcite |
2.18 |
1.12 |
1.02 |
4.25 |
43.2 |
28.3 |
8.9 |
| TotalOxide |
2.18 |
2.25 |
2.04 |
4.53 |
92.4 |
60.6 |
18.4 |
| Indicated |
Oxide |
2.18 |
3.12 |
2.83 |
3.90 |
110.4 |
72.1 |
22.5 |
| Oxide+Calcite |
2.18 |
1.26 |
1.15 |
3.72 |
42.7 |
27.8 |
8.8 |
| TotalOxide |
2.18 |
4.38 |
3.98 |
3.85 |
153.1 |
99.9 |
31.3 |
Measured &
Indicated
(MI) |
Oxide |
2.18 |
4.25 |
3.86 |
4.14 |
159.7 |
104.4 |
32.0 |
| Oxide+Calcite |
2.18 |
2.38 |
2.16 |
3.97 |
85.8 |
56.1 |
17.7 |
| TotalOxide |
2.18 |
6.63 |
6.02 |
4.08 |
245.5 |
160.5 |
49.7 |
| Inferred |
Oxide |
2.18 |
1.79 |
1.62 |
3.65 |
59.3 |
38.9 |
12.4 |
| Oxide+Calcite |
2.18 |
0.30 |
0.28 |
3.36 |
9.3 |
6.0 |
2.0 |
| TotalOxide |
2.18 |
2.09 |
1.90 |
3.61 |
68.5 |
44.9 |
14.4 |
| Mineral
Resources do not have demonstrated economic viability. There is no guarantee that any part of the mineral resource will be converted
to mineral reserves in the future. |
| All
figures are rounded to reflect the accuracy of the grades and tonnage estimates. |
| | | |
| Ore Reserves Engineering | Page 11-40 | 29 February 2024 |
| 11.15 | Mineral Resource Uncertainty
Discussion |
Mineral Resource
classification is based on the level of geological uncertainty that may or may not allow the application of relevant economic and technical
factors to support the prospects for economic extraction.
Mineral Resource
estimates may be materially affected by the quality of geological data, continuity of the mineralization, and the level of accuracy of
the assumptions supporting the prospects for economic extraction, including estimation strategy, geotechnical parameters, metallurgical
recovery, commodity prices, and mining and processing costs.
The highest level
of geological certainty is associated with resources in the domain Main 1 because the resource is high-grade ore, has excellent geological
and grade continuity, and is locally drilled with closely spaced drilling supporting the mineral resource measured category.
In domains Main
3, East, and West 1, the level of geological certainty is lower than in Main 1. Mineral resources in these domains are classified into
indicated and inferred. For an indicated resource, the geological evidence is adequate to assume geological and grade continuity, but
these need to be confirmed with additional drilling.
All resources are
inferred in Main 2, Northeast, Southeast, and West 2 domains. The highest level of geological uncertainty is associated with these domains
where drilling is widely spaced, and the geological and grade continuity must be verified with further drilling.
In the Qualified
Persons’ opinion, the uncertainty associated with the resource estimation and resource classification strategy is low, and it is
unlikely that this will materially affect this Mineral Resource estimate.
In the Qualified
Persons’ opinion, the highest level of uncertainty is associated with the assumptions regarding metallurgical recoveries, associated
processing costs, and commodity prices, which could have a material impact on the prospects for economic extraction. Metallurgical recoveries
and detailed processing costs should be confirmed in future technical studies. Commodity prices and pay factors for all products need
to be refined.
The current level
of geotechnical and hydrogeological knowledge is considered sufficient to support the estimation of Mineral Resources at Bull Hill. However,
further geotechnical and hydrological investigations are recommended to reduce the uncertainty associated with slope stability.
No environmental,
permitting, legal, titles, taxation, socio-economic, marketing, political, or other factors that would detrimentally affect this Mineral
Resource estimate have been recognized at the time of reporting.
In the Qualified
Persons’ opinion, this Mineral Resource estimate might be materially impacted by any future changes in the cutoff grade resulting
from unanticipated changes in metallurgical recoveries, commodity prices, or changes in mining and processing costs.
| | | |
| Ore Reserves Engineering | Page 11-41 | 29 February 2024 |
| 12 | MINERAL
RESERVE ESTIMATES |
This section does
not apply to this TRS.
(The
remainder of this page is intentionally left blank)
| | | |
| Ore Reserves Engineering | Page 12-1 | 29 February 2024 |
This section does not apply to this TRS.
(The
remainder of this page is intentionally left blank)
| | | |
| Ore Reserves Engineering | Page 13-1 | 29 February 2024 |
| 14 | PROCESSING
AND RECOVERY METHODS |
The mineral processing
of RER ores related to this updated mineral resource estimate has not been defined. However, in 2014, RER extracted a bulk exploration
sample (see Chapter 7), averaging 10.1% total rare earth oxide (TREO), from the Bull Hill deposit to support the Rare Earth Element
(REE) separation and processing demonstration project.
The demonstration
project plant (See Chapter 10) involves the physical processing of this extracted exploration sample, followed by chemical processing
to produce a pure TREO(Th) concentrate, followed by the separation of NdPr oxide.
The demonstration
project plant is scheduled to be in operation in 3rd Quarter of 2024 and will provide the necessary design criteria for a larger commercial-scale
facility.
The demonstration
project plant consists of four main process stages, as shown in Figure 14-1. These include:
| (1) | Physical
upgrading (PUG) or comminution of the extracted exploration sample containing minor
amounts of Naturally Occurring Radioactive Materials (NORM). |
| (2) | Primary
hydrometallurgical processing (PP) of the comminuted exploration sample to produce
a highly pure TREO(Th) concentrate (the precursor), which separates out a significant portion
of the natural radioactivity contained in the exploration sample. It is based on: |
| a. | State-of-the-art
techniques optimized to suppress radioactive constituents (most critically, the Ra isotopes)
as well as other contaminants such as earth alkali metals, metals, and others. |
| b. | State-of-the-art
recycling technologies to recover acids and water for reuse. |
| (3) | Thorium/Cerium
Separation (TCS) of radioactivity, mainly due to Th and progenies, together with Ce,
which is not currently considered to be a marketable REO product. An innovative technology
allows the complete removal of the NORM. It allows for a high recycling rate of process streams
and reduces the production of waste significantly. |
| (4) | Neodymium/Praseodymium
Separation (NPS) and refining of REE groups, including high purity NdPr oxide (the
primary product), lanthanum and cerium (LaCe) concentrate, samarium, europium, and gadolinium
(SEG) concentrate, and a heavy rare earth element (HREE) concentrate. The innovative technology
applies multi-functional separators in a network for the recycling of valuable product streams
to optimize product quality and yield. The network is controlled by proprietary software
combining real-time monitoring data of critical process streams with a unique process simulation
software. |
| | | |
| Ore Reserves Engineering | Page 14-1 | 29 February 2024 |
The process will
produce these main products and byproducts and implement extensive materials recycling to reduce waste as much as possible. Data collected
during the operation will be used to develop design criteria for a future commercial facility.

Figure 14-1.
Demonstration Project Process Flowsheet (RER, 2022)
| | | |
| Ore Reserves Engineering | Page 14-2 | 29 February 2024 |
Infrastructure
requirements have not been defined.
(The
remainder of this page is intentionally left blank)
| | | |
| Ore Reserves Engineering | Page 15-1 | 29 February 2024 |
The
University of Wyoming’s Center for Business and Economic Analysis (CBEA) in the College of Business was contracted
by RER to provide an independent analysis of REE markets, including supply and demand forecasts. Led by David Aadland, the resulting
market analysis report and projections were used to create this chapter.
As of December 2022,
China accounts for 63% of the world’s rare earth elements (REE) mining, 85% of REE processing/separation, and 92% of REE magnet
production. REEs are the most critical component of high-strength permanent magnets (neodymium iron boron magnets, or NdFeB)– essential
to the defense, electric vehicle (EV), and offshore wind turbine markets.
In 2022, the US
Secretary of Commerce and the US Department of Homeland Security found that NdFeB magnet imports threaten national security. However,
there are 17 rare earth elements (REE), four of them make up ~90% of all REE value: Neodymium (Nd), Praseodymium (Pr), Dysprosium (Dy)
and Terbium (Tb). For the US to have a secure supply of high-temperature permanent magnets (NdFeB with Dy/Tb ± holmium [Ho] doping),
every step of the supply chain must be domestic.
The global rare
earth elements (REE) market demand in 2023 was estimated to be ~179,000 tons of TREO across all end-product categories, of which magnet
applications account for 46%. In 2023, North America only accounted for 14% of total TREO global demand or roughly 25,000 tons of TREO.
The end-products that use REEs can be broken down into 10 categories: Batteries, Catalysts, Ceramics, Glass, Magnets, Metallurgical,
Phosphors, Polishing Powders, Pigments, and Others. Figure 16-1 shows the global REE market demand for selected years by end-product
category, as well as the relative global magnet demand and the relative total TREO North American demand.
The global demand
for TREO is forecasted to increase by 89% by 2050 to ~339,000 tons of TREO. Likewise, the relative global REE magnet demand will also
continue to increase, from 46% in 2023 to 57% by 2050. The North American total demand is predicted to increase and then stay relatively
constant: going from 24,700 tons in 2023 – to 33,200 tons in 2030 – and ultimately to 35,400 tons & 35,700 tons
in 2040 and 2050, respectively.
China uses its
production quota system to “flood” the market with TREO and lower the overall price of all TREOs to what it calls “rational
prices.” China does this because the REE price rally over the early 2020s was preventing their industries, particularly China’s
growing EV industry, from accessing raw materials at reasonable costs. Additionally, low REE prices hurt the interests of Western governments
and producers, who require higher (and stable) prices to begin developing domestic REE supply chains. In the past, China has used its
quota system to affect the market in the opposite direction; by restricting the export of REEs, the market saw extraordinary price increases
from July 2010 through August 2011.
| | | |
| Ore Reserves Engineering | Page 16-1 | 29 February 2024 |
The price projections
of the key magnet TREOs are shown in Table 16-1.

Figure 16-1.
Global TREO Demand broken down by 10 end-product categories + Relative Global Magnet Demand + Relative total North American Demand (CBEA, 2024).
Table 16-1. Historical
and forecasted TREO prices in 2023 US Dollars (CBEA, unpublished data,2024)
| Forecasted &
Historical Rare Earth Oxide Prices in 2023 (US Dollars) |
| |
2010 |
2020 |
2023 |
2030 |
2040 |
2050 |
| Pr |
Praseodymium
Oxide (99.5-99.9%) |
$63 |
$54 |
$76 |
$93 |
$110 |
$130 |
| Nd |
Neodymium
Oxide (99.5-99.9%) |
$67 |
$57 |
$80 |
$94 |
$113 |
$130 |
| NdPr |
Praseodymium-Neodymium
Oxide (min.99%) |
$60 |
$52 |
$77 |
$90 |
$108 |
$120 |
| Tb |
Terbium
Oxide (min99.99%) |
$750 |
$792 |
$1,320 |
$1,200 |
$1,000 |
$900 |
| Dy |
Dysprosium
Oxide (min99.5%) |
$318 |
$307 |
$330 |
$360 |
$320 |
$290 |
| Ho |
Holmium
Oxide (min99.5%) |
- |
$45 |
$90 |
$90 |
$75 |
$55 |
RER
is engaged in multiple discussions with potential strategic alliance partners for off-take agreements and has
not consummated contracts for the sale of TREO or other products.
RER’s Bear
Lodge REE Project, located in northeast Wyoming, is a world-class mining district (confirmed by more than 500 drill holes resulting in
over 285,000 feet of core-defining mineralized material), giving it the ability to be a dependable, long-term, domestic source of REEs.
| | | |
| Ore Reserves Engineering | Page 16-2 | 29 February 2024 |
RER’s proprietary
processing/separation process has been advanced by General Atomics (GA), whose affiliate is a majority shareholder of RER and its technology
partners, and has successfully separated TREO into saleable products, including ≥99.0% pure NdPr oxide. RER’s process is expected
to result in greater efficiency and lower environmental impact than current industry methods. These factors combine to give RER and its
Bear Lodge REE Project the opportunity to be a leading domestic source of the REEs essential to advanced technologies, from mine to separated
NdPr oxide. RER has used an NdPr production rate of 2,000 metric tons per year to meet some of the demands mentioned in this chapter.
This can be adjusted according to market demands.
Once in production,
the Bear Lodge REE Project has the potential to produce decades' worth of 100% of the US Department of Defense’s (DOD) annual NdPr
oxide needs for its critical NdFeB magnet demand.
| | | |
| Ore Reserves Engineering | Page 16-3 | 29 February 2024 |
| 17 | ENVIRONMENTAL
STUDIES, PERMITTING, AND PLANS, NEGOTIATIONS, OR AGREEMENTS WITH LOCAL INDIVIDUALS OR GROUPS |
RER will be required
to obtain permits and licenses to further develop the Bear Lodge REE Project from the USFS, the WDEQ-LQD, and other federal and state
agencies. In accordance with RER’s Environmental, Health, and Safety Policy, RER will comply with applicable federal and state
environmental statutes, standards, regulations, and guidelines in permitting of Bear Lodge REE Project.
The issuance of
a permit to mine on USFS land will be a major federal action that will significantly affect the quality of the human environment in the
Bear Lodge REE Project area. The permitting process will trigger the preparation of an environmental impact statement (EIS) under the
NEPA, Council of Environmental Quality (CEQ) guidelines, and USFS NEPA procedures.
| 17.2 | Historical Permitting |
A Plan of Operations
was submitted by RER in May 2013 (and later updated in February 2014) for the construction and operation of the Project on
USFS Lands. The Plan of Operations triggered the need for the DEIS (Draft Environmental Impact Statement) to satisfy the NEPA requirements
to properly evaluate the Project. Concurrently, a license application to possess source material incidental to the processing of rare
earth elements was submitted to the NRC, and a Permit to Mine application was submitted to the WDEQ-LQD.
The Bearlodge Ranger
District of the Black Hills USFS prepared a DEIS in January 2016 for the Bear Lodge REE Project. The DEIS analyzes the no-action
alternative (Alternative A) and six action alternatives (Alternatives C, D, E, F, G, and H). Alternative H was the preferred alternative
at the time. Shortly after the DEIS was prepared and the notice posted in the federal register for review and comment, EIS number 20160008
was withdrawn by the USFS, on behalf of the applicant, and the Project has been on hold since that time. The NRC source material license
and Permit to Mine applications were also suspended by the Company.
Historical technical
and design reports related to the Project, and more specifically, the following documents were submitted:
| · | Permit
to Mine document submitted to the WDEQ LQD on June 3, 2015. The application was suspended
in 2016. A baseline data supplemental report was submitted to the WDEQ LQD in January 2019.
A second baseline data supplemental report dated February 2023 was also submitted to
the WDEQ LQD to continue to supplement the original permit application data. |
| · | Draft
Plan of Operations for Mining Activities on National Forest System Lands (Plan of Operations)
prepared in February 2014. The Plan is not currently approved. |
| · | DEIS
was prepared by the Bearlodge Ranger District in January 2016. The DEIS has not been
finalized or approved yet. |
| · | NRC
license application for the possession of source material incidental to the processing of
rare earth elements submitted to the NRC in May 2015. The NRC license has not been approved. |
| | | |
| Ore Reserves Engineering | Page 17-1 | 29 February 2024 |
Closure planning
was conducted in April 2012. Closure and reclamation plans were also developed as part of the previous Plan of Operations on federal
lands in 2014. A May 2015 Reclamation Plan was also submitted as part of the Permit to Mine submittal to the WDEQ. Updated closure
and closure and reclamation plans will be included in the revised Plan of Operations and will also need the Reclamation Plan to be updated
with the WDEQ.
| 17.3 | Planned Regulatory Requirements |
A good working
relationship has been established with the agencies, and RER continues to keep the WDEQ-LQD updated on the additional baseline work that
has been occurring since the DEIS was placed on hold.
A January 2019
baseline Data Supplement Report was submitted to the WDEQ-LQD in support of the previously submitted permit to mine application. This
included updates to climatology (conducted in 2018), hydrology (surface water and groundwater, conducted in 2018), vegetation (conducted
in 2018), and wildlife (conducted in 2014, 2015, and 2018). Most recently, a February 2023 baseline data supplement report was submitted
to the WDEQ LQD that included hydrology and climatological updates only but acknowledges that vegetation and wildlife assessments need
to occur prior to resuming the permitting action.
The Plan of Operations
will need to be updated to reflect the current Bear Lodge REE Project schedule as well as other changes that have occurred. The sections
in the Plan of Operations where updates are anticipated are as follows:
| · | General
Information and Principals, |
| · | Changes
to Access or Mine Facilities (as applicable), |
| · | Utilities
(as applicable), |
| · | Environmental
Protection Measures, |
| · | Reclamation
and Closure, and |
Fifteen appendices
were included as part of the Plan of Operations, and roughly half would require updates as well.
The NEPA review
will restart once the Plan of Operations is approved for technical completeness by the USFS. The Project DEIS will require updates, and
potentially, a new Memorandum of Understanding (MOU) with the USFS will be required once the permitting process resumes. The MOU will
define the roles of the USFS and RER in the preparation of updates for the DEIS. This will also require a professional services agreement
between RER and a third-party EIS contractor, a disclosure statement of no conflicts of interest from the EIS contractor, and a schedule
for the completion of the DEIS. Following other federal agencies and public review and comment, the culmination of the DEIS process will
result in a Record of Decision and subsequent approval of the Plan of Operations by the USFS.
| | | |
| Ore Reserves Engineering | Page 17-2 | 29 February 2024 |
The NRC source
material possession license application may require more minor updates to reflect the future Bear Lodge REE Project schedule as well
as other changes. The sections in the license application where updates are anticipated are as follows:
| · | Site
Characterization (specifically Transportation and Population Distribution as well as inclusion
of new data from updated baseline studies), |
| · | Responsible
Individuals, |
| · | Facilities
and Equipment (as applicable), |
| · | And
the following Appendices: Decommissioning Funding Plan and Detailed Process Flow Diagrams
(as applicable) |
The Environmental
Report associated with the NRC license application may also require updates for consistency with updated baseline studies.
While some applications
have been prepared and advanced, the following applications will be prepared/submitted for the Project: WDEQ Air Quality Permit, WDEQ
Wyoming Pollutant Discharge Elimination System (WYPDES) permit, and WDEQ Industrial Siting; Wyoming State Engineers Office Water Rights
and Dam Safety. Additionally, local county permits are anticipated to be required. Two permits, the DEIS and the Plan of Operations,
were previously prepared but would require updates as permitting efforts resume.
| | | |
| Ore Reserves Engineering | Page 17-3 | 29 February 2024 |
| 18 | CAPITAL
AND OPERATING COSTS |
This section does
not apply to this TRS.
(The
remainder of this page is intentionally left blank)
| | | |
| Ore Reserves Engineering | Page 18-1 | 29 February 2024 |
This section does
not apply to this TRS.
(The
remainder of this page is intentionally left blank)
| | | |
| Ore Reserves Engineering | Page 19-1 | 29 February 2024 |
RER’s Bear
Lodge REE Project property consists of 15 contiguous square miles (24 kilometers) and includes all known significant rare earth occurrences
in the Bear Lodge Mountains. The property hosts deposits of rare earths and minor gold deposits. There are no other known significant
occurrences of rare earths in the region surrounding the Bear Lodge Mountains.
| | | |
| Ore Reserves Engineering | Page 20-1 | 29 February 2024 |
| 21 | OTHER
RELEVANT DATA AND INFORMATION |
| 21.1 | Potential By-Products |
The Bull Hill resource
contains minor amounts of other minerals that could be potentially recovered. As discussed in Chapter 14, the processing methods
include a combination of gravity/screening unit operations and acid leaching to recover rare earth minerals. The potential economically
recoverable ore minerals include minor amounts of gold, uranium, iron, and manganese.
An economic recovery
method has not been investigated for any of these by-products. The potential extraction of any of these minerals would be a distraction
from RER’s core business.
| | | |
| Ore Reserves Engineering | Page 21-1 | 29 February 2024 |
| 22 | INTERPRETATION
AND CONCLUSIONS |
The present Mineral
Resource estimate includes an update of previous studies of the Bull Hill deposit oxide zones (Ox and OxCa) for more selective mining
and a more conservative resource classification criteria.
Based on the available
data and the analysis presented in this TRS, the resource block model has been validated using accepted industry methods. At the time
of reporting, the Mineral Resource summarized by the resulting preliminary pit design is considered to have reasonable prospects for
eventual economic extraction by open pit methods. Mineral resources are estimated from the current topography and are dated 31 December 2023.
The Qualified Persons
have drawn the conclusions presented in this section.
Mineral Resource
estimates are sensitive to commodity prices, operating and processing costs, and metallurgical recoveries, which directly affect the
cutoff grade.
Economic evaluations
for the resource estimate include inferred mineralization, which is not allowed for reserves. If the inferred resource within the resource
pit is not converted to measured and indicated, project life and economics will be reduced.
The Lerchs-Grossmann
(LG) analysis of economic pit limits and the subsequent pit design summarizing the mineral resource are sensitive to the slope pit design
parameters used.
Additional opportunities
exist from the potential to convert current inferred mineral resources into indicated and measured resources within the present pit limits.
The limits of the
REE-mineralized system on the Bear Lodge property have yet to be determined. The development of existing deposits outside of the Bull
Hill mine area, identifying areas peripheral to the Bull Hill deposit that carry significant enrichment in HREE, and excellent potential
for discovering new REE exploration target areas all add significant upside potential to the project.
There is significant
REE mineralization at Whitetail, and important REE mineralization has been identified in the sulfide zone, both of which may be economical
but are not examined in this TRS.
Higher commodity
prices could increase mineral resources through both lower cutoff grades and potentially larger pit limits. Lower processing costs and
improved metallurgical performance could potentially increase mineral resources.
| | | |
| Ore Reserves Engineering | Page 22-1 | 29 February 2024 |
The Demonstration
Plant, which is expected to be operational in the 3rd Quarter of 2024, has received the required permits and licenses to construct and
operate the plant. If the operation of the plant is unsuccessful or experiences technical problems, this would have a material adverse
effect on RER economics, funding, and future development plans.
The Demonstration
Plant will provide the necessary design criteria for a larger commercial-scale facility. The results of this project are uncertain and
may adversely impact the project's future development.
Demonstration Plant
results have the potential to reduce costs and improve metallurgical performance and product quality, positively affecting the project
economics.
| 22.3 | Markets and Commodity Prices |
Changes in demand
for, and the market price of, REE products could significantly affect RER’s ability to develop or finance the Bear Lodge REE Project.
REE product prices
may fluctuate and are affected by numerous factors beyond RER’s control, such as interest rates, exchange rates, inflation or deflation,
fluctuation in the relative value of the U.S. dollar against foreign currencies on the world market, global and regional supply, demand
for REE products, and the political and economic conditions of countries that produce and use REEs.
Demand for REE
products is impacted by demand for downstream products incorporating rare earths, including hybrid and electric vehicles, wind power
equipment, military equipment, and other clean technology products, as well as demand in the general automotive and electronics industries.
Lack of growth in these markets or the introduction of substitute products could adversely affect the demand for REE products, which
would adversely affect the development of the Bear Lodge Project.
The future creation
of new markets associated with emerging technologies and the successful commercialization of REE products in existing and emerging markets
may positively affect REE product prices.
| 22.4 | Permitting & Environmental |
It is uncertain
if RER will be able to complete future licensing or permitting necessary for the development of the Bear Lodge REE Project in a timely
and cost-effective manner.
| | | |
| Ore Reserves Engineering | Page 22-2 | 29 February 2024 |
Future changes
in environmental laws and regulations may require significant capital outlays and may cause material changes or delays in future activities.
Regulations and
pending legislation governing climate change issues could result in increased operating costs, adversely affecting RER's development
plans.
The potential opposition
from non-governmental organizations, environmental, indigenous, or local groups, or inhabitants may delay or prevent development activities
on the Bear Lodge REE Project.
The rare earth
metals are priority minerals for development in the US, which may ease permitting issues. The Bear Lodge REE Project will allow RER to
enhance the existing infrastructure in northeast Wyoming, specifically Crook and Weston Counties. The project adds to the effort of economic
diversification of Wyoming’s mostly mineral-based economy, which is strongly supported by the Wyoming government and business community.
Instead of shipping the mineral resources out to other states/countries, the Bear Lodge REE Project sets an example for producing value-added
products in Wyoming, thus significantly changing the US rare earth industry, which is characterized by a lack of rare-earth supply chain
at each of the following stages: mining, extraction, separation, refining oxides into metal, manufacturing magnets/catalysts, and other
device components.
| | | |
| Ore Reserves Engineering | Page 22-3 | 29 February 2024 |
The authors recommend
that Rare Element Resources Inc. (RER) continue with the development and engineering of the Bear Lodge REE Project, which will lead to
a definitive feasibility study. This preparation program should include additional investigations within the mining, the PUG, hydromet,
and environmental areas.
| 1) | Renew and
obtain a drilling permit for site development that will include Infill drilling to upgrade
the inferred material inside the pit to at least the indicated category (US $ 3,500,000). |
| 2) | Test and
evaluate the use of a downhole probe during infill drilling for grade control applications
(US $ 25,000-30,000) |
| 3) | Further
geotechnical investigations to better characterize the rock mass parameters, refine slope
design parameters, and review pit slope stability. (US $ 55,000). |
| 1) | Physical
upgrading (PUG) (US $ 25,000): |
| · | Additional
testing is needed to define screening parameters in the 1-3% TREO range. |
| · | Screen
tests should be conducted on all samples before proceeding to other tests. |
| 2) | Test ore
sorting (US $ 5,000). |
| 3) | Investigations
included in the demonstration plant project (costs are already included in the Demonstration
Project budget): |
| · | Confirm
Ox and OxCa processing costs and recoveries. |
| · | Confirm
impact on throughput as it relates to tonnage, TREO content, and a combination of both. |
| · | Define
the proportionality of feed tonnage, TREO content, or a combination of both. |
| · | Confirm
processing costs for different REE elements as desired. |
| · | Evaluate
the separation of other REE elements. |
| · | Evaluate
Uranium and Thorium segregation and waste reduction. |
| · | Evaluate
chemical and energy efficiencies. |
| 23.3 | Government and Industrial
Relations |
RER has invested
more than US $ 140M into the Bear Lodge REE Project to develop, permit, test, and characterize the mineral resource and advance its proprietary
metallurgical processing/separation technology, making it one of the most advanced Rare Earth Mining Projects in development in North
America. The company should focus on the next steps required to bring it forward through final feasibility, financing, and then development
and operations.
| | | |
| Ore Reserves Engineering | Page 23-1 | 29 February 2024 |
| 23.3.1 | Relationships with Downstream
Domestic and Allied REE Industry |
RER has further
progressed the Bear Lodge REE Project and developed relationships with domestic rare earth alloy and magnet manufacturers. RER has entered
into conversations and received letters of support that commit to evaluating and testing RER’s product and to considering off-take
agreements to meet future requirements. These relationships include General Atomics Electromagnetics Systems, Advanced Magnet Lab, Inc.,
and Arnold Magnetic Technologies.
These product tests
and relationships will be the first steps toward signing future off-take agreements of RER’s final REE products.
In the past, the
Bear Lodge REE Project received widespread support from government officials. In the future, RER should continue pursuing support from
various government agencies.
A significant future
step is the completion of the Bear Lodge REE Project Feasibility Study. This will render the project financially and technically robust
enough to warrant investment and construction. Once operational, the project will establish a fully domestic upstream REE supply chain,
leading to the manufacturing of high-strength permanent magnets, outside of Chinese influence, critical to the defense, EV, and renewable
energy industries.
The Feasibility
Study is divided into five distinct deliverables. The estimated cost to complete these deliverables is US $ 15M.
| (1) | Mineral
Resource Study & Technical Report – A phased technical study and report
that meets SEC’s Regulation SK 1300 for a concise and accurate summary of the Bear
Lodge REE Project’s mineral resource. |
| (2) | Processing/Separation
Plant Siting Study – A report evaluating historical data and a fatal flaws analysis
for the proposed hydrometallurgical plant and waste management. Prospective locations will
be evaluated using a ranking system based on key evaluation criteria and weighting factors
to identify any fatal flaws for the proposed site location. |
| (3) | Basic
Engineering Study & Technical Report – A phased engineering study and
report that contains but is not limited to: 1) The mineral reserve and resource model; 2)
Geotechnical evaluation for facilities; 3) A detailed mine plan; 4) An environmental summary;
5) A detailed description of mineral concentration and hydrometallurgical processing and
separation; and 6) An economic analysis of the rare earth project. |
| | | |
| Ore Reserves Engineering | Page 23-2 | 29 February 2024 |
| (4) | Environmental
Studies – Including: 1) Establishment of a pre-mining baseline from which to monitor
environmental impacts during and following operations; 2) Identification of environmental
risks related to mining through standardized approaches; 3) Formulation of best environmental
practices and controls; 4) Cultural resource studies; 5) Social and economic evaluation;
6) Formulation of an environmental closure and decommissioning plan; and 7) Sustainable design
alternatives analysis for commercial operations. |
| (5) | Definitive
Engineering Study & Technical Report – A study and report that confirms:
1) Mine design and production rate; 2) Supportive metallurgical test work and flow sheet;
3) Quotes for major equipment procurement; 4) Revenue and financing sources; and 5) Key environmental
applications. |
| | | |
| Ore Reserves Engineering | Page 23-3 | 29 February 2024 |
Bhappu,
R. (2011). Pre-Concentration and Leaching of Bear Lodge Oxide Ores.
Gersic,
J., Peterson, E., & Schreiner, R. (1990). Appraisal of selected mineral resources of the Black Hills National Forest, South
Dakota and Wyoming. USBM, Mineral Land Use Assessment Open File Report 5-90.
Hutchinson,
M. (2016). REE enrichment in weathered carbonatite, Bull Hill: Bear Lodge Mountains, Wyoming. Golde, Colorado: Unpublished M.
Sc. Thesis, Colorado School of Mines.
Hutchinson,
M., Slezak, P., Wendlant, R., & Hitzman, M. (2022). Eare Earth Element Enrichment in the Weathering Profile of the Bull Hill
Carbonatite at Bear Lodge, Wyoming, USA. Economic Geology, 117(4), 813-831.
John
T. Boyd Company. (2010). Technical Report: Preliminary Economic Assessment (Scoping Study) of the Bear Lodge Rare-Earths Project -
A National Instrument 43-101 Report.
Lisenbee,
A. (1985). Tectonic map of the Black Hills uplift, Montana, Wyoming, and South Dakota. Geological Survey of Wyoming Map Series 13,
scale 1:250,000.
Lisenbee,
A., & DeWitt, E. (1993). Laramide evolution of the Black Hills uplift. En G. Glass, Geology of Wyoming: Geological Survey
of Wyoming Memoir No. 5. Laramie, Wyoming: A.W. Snoke, J.R. Steidtmann & S.M. Roberts, eds.
Lujan,
M. (1980). Bear Lodge Progress Report. Louviers: Molycorp, Inc., unpulished report.
Millonic,
L., & Groat, L. (2013). Carbonatites in Western North America-Occurrences and Metallogeny. Society of Economic Geologists
Special Publication, 17.
Moore,
M. (2014). Carbonatite-Related Rare-Earth Mineralization in the Bear Lodge Alkaline Complex, Wyoming: Paragenesis, Geochemical and
Isotopic Characteristics. Master of Science Thesis, University of Manitoba.
Noble,
A. (2009). Technical Report On the Mineral Resources of the Bear Lodge Rare-Earths Project (Ore Reserves Engineering, ORE).
Olson,
J., Shawe, D., Pray, L., & Sharp, W. (1954). Rare-Earth Mineral Deposits of the Mountain Pass District, San Bernardino County,
California. USGS Professional Paper 261.
Rare
Element Resources Inc. (2021). Form 8-K.
Ray,
J., Felsman, J., Van Rythoven, A., Monks, J., Buck, S., & Lenerville, H. (2014). Geology of the Test Trench 2014. Rare
Element Resources Unpublished Report.
Roche-Engineering.
(2012). Technical Report on the Mineral Reserves and Development of the Bull Hill Mine.
Roche-Engineering.
(2014). Bear Lodge Project Canadian NI 43-101 Pre-Feasibility Study Report On the Reserves and Development of the Bull Hill Mine,
Wyoming.
| | | |
| Ore Reserves Engineering | Page 24-1 | 29 February 2024 |
Sierra
Geotechnical LLC. (2013). Bear Lodge Pit Slope Stability FEasibility Study Summary. Sierra Geotechnical LLC.
Snoke,
A. (1993). Geologic history of Wyoming within the tectonic framework of the North American Cordillera. En G. Glass, Geology of Wyoming:
Geological Survey of Wyoming Memoir No. 5. A.W. Snoke, J.R. Steidtmann & S.M. Roberts, eds.
Staatz,
M. (1983). Geology and Description of Thorium and Rare-Earth Deposits in the Southern Bear Lodge Mountains, Northeastern Wyoming.
USGS Professional Paper 1049-D.
Staazt,
M. (1983). Geology and Description of Thorium and Rare Earth Deposits in the Southern Bear. USGS Professional Paper 1049D.
U.
S. Department of Energy (DOE). (2023). Critical Materials Assessment.
Wang,
Z., Fan, H., Yang, K., & She, H. (2020). Carbonatite-related REE Deposits: An Overview. Minerals, 10 (11)(965).
Wilmarth,
V., & Johnson, D. (1953). Preliminary reconnaissance survey for thorium, uranium, and rare-earth oxides, Bear Lodge Mountains,
Crook County, Wyoming. USGS, Trace Elements Investigations 172.
Wineteer,
C. (1991). Exploration Summary, Bear Lodge Project, Bear Lodge Mountains Alkalic Complex, Crook County, Wyoming. Coeur d’Alene:
Hecla Mining Company, unpublished report.
Wood
Mackenzie. (2023). Rare Earth Markets Sto August-2023.
| | | |
| Ore Reserves Engineering | Page 24-2 | 29 February 2024 |
| 25 | RELIANCE
ON INFORMATION PROVIDED BY THE REGISTRANT |
In the preparation
of this TRS, the Qualified Persons relied on information provided by RER (the registrant) for the following:
Information
related to historical exploration studies and historical drilling contained in Chapter 5 and Chapter 7 was obtained from
the registrant.
| 2) | Technical
studies provided by third-party consultants. |
Information
realted to drilling QAQC contained in Chapter 8 was obtained from the registrant. This information supports the assessment of
reasonable prospects for economic extraction of the mineral resource estimates in Chapter 11.
Information
related to geotechnical work associated with slope design parameters (Sierra Geotechnical LLC., 2013) contained in Chapter 11 (Table
11-23) was obtained from the registrant. This information supports the assessment of reasonable prospects for economic extraction
of the mineral resource estimates in Chapter 11.
Information
related to metallurgical recoveries, pay factors and comodity prices (Wood Mackenzie, 2023) contained in Chapter 11 (Table
11-22) was obtained from the registrant. This information supports the assessment of reasonable prospects for economic extraction
of the mineral resource estimates in Chapter 11.
Information
relating to pay factors contained in Chapter 11 (Table 11-22) was obtained from the registrant. This information supports
the assessment of reasonable prospects for economic extraction of the mineral resource estimates in Chapter 11.
The
information relating to product prices contained in Chapter 11 (Table 11-22) was obtained from the registrant. This information
supports the assessment of reasonable prospects for economic extraction of the mineral resource estimates in Chapter 11.
The
information relating to market studies contained in Chapter 16 was obtained from the registrant.
Information
relating to the ownership, the mineral tenure (concessions, payments to retain property rights), surface rights, water rights, royalties,
permitting requirements, and the ability to maintain and renew permits was obtained from the registrant.
This
information is used in support of the property description and ownership information in Chapter 3 and the permitting descriptions
in Chapter 17. It supports the reasonable prospects of economic extraction for the mineral resource estimates in Chapter 11.
| | | |
| Ore Reserves Engineering | Page 25-1 | 29 February 2024 |
The
information on the 499 RER active mining claims was confirmed by independently reviewing and downloading the digital record listed in
the Mineral & Records System of the Bureau of Land Management Website (https://reports.blm.gov/reports/MLRS/). This information
is relied upon in Chapter 3.
Information
relating to baseline and supporting studies for environmental permitting and monitoring requirements was obtained from the registrant.
This
information is used in the permitting discussions in Chapter 17. It supports the reasonable prospects of economic extraction for
the mineral resource estimates in Chapter 11.
In the Qualified
Persons’ opinion, the information provided by the registrant is reliable for its use in this TRS for the following reasons:
| · | The
registrant has employed industry professionals with expertise in the areas listed above. |
| · | The
registrant has considerable experience in each of the areas listed above. |
| | | |
| Ore Reserves Engineering | Page 25-2 | 29 February 2024 |
Exhibit 99.1
 |
NEWS RELEASE |
| RARE ELEMENT
RESOURCES LTD. |
| |
| OTCQB: REEMF |
| March 4, 2024 |
| Ref: 04-2024 |
Rare Element
Resources Announces Updated Mineral Resource for the Bear Lodge Project Focused on Key Magnet Materials
March 4, 2024 – Littleton, Colorado – Rare Element
Resources Ltd. (the “Company” or “RER”) (OTCQB: REEMF) is pleased to announce that it has completed a new
mineral resource estimate based on maximizing the recovery of the key magnet materials of neodymium (Nd), praseodymium (Pr), terbium (Tb)
and dysprosium (Dy), as well as other critical rare earths such as lanthanum (La). The estimate is focused on the Bull Hill deposit at
the Bear Lodge Project, located in northeastern Wyoming, with long-term upside existing in the Carbon, Whitetail, and Taylor deposits
located within the Company’s mineral claims.
The mineral resource was estimated using data from 252 core holes drilled
between 2009 and 2013, including 20,491 assay intervals that totaled 186,712.5 feet (56,910 meters) of drilling from the Company’s
drill hole database. The full database includes approximately 500 drill holes, totaling over 285,000 feet (86,868 meters) of core. Additionally,
it incorporates recovery data generated from the 2021 pilot plant testing of the Company’s proprietary recovery and separation technology,
which is now being utilized in the demonstration plant project being constructed by RER in Upton, Wyoming. The mineral resource estimate,
utilizing a cut-off grade of 2.18% total rare earth oxide (“TREO”), focuses on the oxide and oxide-carbonate zones, which
are considered the optimum feed yielding the best recoveries and costs from the Company’s proprietary recovery and separation technology.
Bull Hill
TREO Mineral Resource Summary for the Total Oxide @ 2.18% TREO Cutoff
| Resource Class | |
Metric
Tonnes | | |
%TREO | | |
Contained TREO
Metric Tonnes | | |
Recovered NdPr
Metric Tonnes | |
| | |
| (millions) | | |
| | | |
| (1000’s) | | |
| (1000’s) | |
| Measured | |
| 2.04 | | |
| 4.53 | | |
| 92.4 | | |
| 18.4 | |
| Indicated | |
| 3.98 | | |
| 3.85 | | |
| 153.1 | | |
| 31.3 | |
| Measured & Indicated (M&I) | |
| 6.02 | | |
| 4.08 | | |
| 245.5 | | |
| 49.7 | |
| Inferred | |
| 1.90 | | |
| 3.61 | | |
| 68.5 | | |
| 14.4 | |
Resource Notes:
| (1) | Mineral resources do not have demonstrated economic viability. There is no guarantee that any part of the mineral resource will
be converted to mineral reserves in the future. All figures are rounded to reflect the accuracy of the grade and tonnage estimates. |
| (2) | This mineral resource estimate is reported in accordance with Regulation S-K (CFR Title 17 Part 229 Items 1300-1305) at a
cut-off grade of 2.18% TREO. |
| (3) | Only certain rare earth elements (La, Nd, Pr, Dy, and a heavy rare earth element mixed oxide including Yb, Tm, Tb, Er, Ho, Lu)
are considered payable for pit optimization purposes. Commodity price assumptions used in the preparation of the mineral resource estimate
are set forth in the TRS. |
| (4) | The estimated overall NdPr process recovery is 90%. |
“With demand for magnet materials expected to grow exponentially
over the next 30 years, driven primarily by their use in defense and green technologies, it makes sense to focus our efforts on those
key magnet materials in this resource model. This will ensure that over the longer term, we are aligned with the national security interests
and decarbonization goals of the United States,” stated Brent Berg, President and CEO of the Company. “Our proprietary rare
earth recovery and separation technology enabled us to look at the body of geological data we have generated through a different lens.
That work allows us to focus on a higher grade and smaller pit design. I believe this strategy provides the greatest opportunity for the
Company to capitalize on the projected rare earth demand growth and most clearly aligns with our innovative technology while allowing
us to preserve the long-term, upside potential of the Bear Lodge Project.”
The Company is preparing a Technical Report Summary (“TRS”)
in accordance with Regulation S-K (CFR Title 17 Part 229 Items 601(b)(96) and 1300-1305), as well as an updated technical report
compliant with Canadian National Instrument NI 43-101 – Standards of Disclosure for Mineral Projects (“NI 43-101”).
The TRS will be filed on the date of this release on a current report on Form 8-K and will be available at www.sec.gov. The NI 43-101-compliant
report will be filed on the Company’s SEDAR profile at www.sedarplus.ca within 45 days of the date of this press release. The mineral
resource work and technical reports are being undertaken by Alan C. Noble, P.E., principal engineer of Ore Reserves Engineering (ORE),
based on his modeling work developed on the Bear Lodge Project over the past decade. The full list of economic assumptions and cut-off
grade sensitivity for the evaluation will be fully discussed in both the TRS and the NI 43-101 compliant technical reports.
Mineral resources are not mineral reserves and do not have demonstrated
economic viability. Mineral resource estimates do not account for all modifying factors. These mineral resource estimates include measured,
indicated, and inferred mineral resource categories. Inferred mineral resources have a high degree of geological uncertainty and cannot
be included in mineral reserves. There is also no certainty that the inferred mineral resources will be converted to measured and indicated
(M&I) mineral resource categories through further drilling and exploration.
Rare Element Resources Ltd. is a publicly traded, strategic
materials company focused on delivering rare earth products for technology, energy, and defense applications by advancing the Bear Lodge
REE Project in northeast Wyoming. Bear Lodge is a significant mineralized district containing many of the less common, more valuable,
critical rare earths that are essential for high-strength permanent magnets, electronics, fiber optics, laser systems for medical technology
and defense, as well as technologies like electric vehicles, solar panels, and wind turbines.
Contact
For inquiries, please contact Wayne Rich,
Chief Financial Officer, at +1-720-278-2460 or wrich@rareelementresources.com.
Technical Information
The technical contents of this press release have been reviewed and
approved by Alan Noble of Ore Reserves Engineering, a Qualified Person pursuant to Regulation S-K (CFR Title 17 Part 229 Items 1300-1305)
and NI 43-101.
Forward-Looking Statements
This news release contains forward-looking statements within the meaning
of securities legislation in the United States and forward-looking information within the meaning of securities legislation in Canada
(collectively, “forward-looking statements”). Except for statements of historical fact, certain information contained herein
constitutes forward-looking statements. Forward-looking statements are usually identified by our use of certain terminology, including
“will,” “believes,” “may,” “expects,” “should,” “seeks,” “anticipates,”
“plans,” “has potential to,” or “intends” (including negative and grammatical variations thereof),
or by discussions of strategy or intentions. Such forward-looking statements include statements regarding future demand for magnet materials,
the national security interests and the decarbonization goals of the United States, projected rare earth demand growth, the upside potential
of the Bear Lodge Project (including in the identified Carbon, Whitetail, and Taylor deposits) and the Company’s ability to preserve
long-term upside, measured and indicated mineral resource estimates, and the timing for the preparation, completion, and filing of the
TRS and the NI 43-101-compliant technical report. Factors that could cause actual results to differ materially include, but are not limited
to, the prevailing market conditions for rare earth products and mining industry cost inputs, changes in interpretations of geological,
metallurgical, mining or processing information, environmental and regulatory risks, the ability of the Company to raise sufficient capital
in the previously announced and ongoing rights offering to fund the operation of the demonstration plant, successful further permitting
activities for the Bear Lodge REE Project, the availability of sufficient capital for the future development and operations of the Company,
and other matters discussed under the caption “Risk Factors” in our Annual Report on Form 10-K for the fiscal year ended
December 31, 2022, the prospectus for the rights offering, and our other periodic and current reports filed with the SEC and available
on www.sec.gov and with the Canadian securities commissions available on www.sedarplus.ca. There can be no assurance that future developments
affecting the Company will be those anticipated by management. Please refer to the discussion of these and other uncertainties and risk
factors set out in our filings made from time to time with the SEC and the Canadian regulators, including, without limitation, our reports
on Form 10-K and Form 10-Q. Any forward-looking statement made by us in this news release is based only on information currently
available to us and speaks only as of the date on which it is made. While we may elect to update our forward-looking statements at any
time, we undertake no obligation to publicly update any forward-looking statement, whether written or oral, that may be made from time
to time, whether as a result of new information, future developments or otherwise.
v3.24.0.1
| X |
- DefinitionBoolean flag that is true when the XBRL content amends previously-filed or accepted submission.
| Name: |
dei_AmendmentFlag |
| Namespace Prefix: |
dei_ |
| Data Type: |
xbrli:booleanItemType |
| Balance Type: |
na |
| Period Type: |
duration |
|
| X |
- DefinitionFor the EDGAR submission types of Form 8-K: the date of the report, the date of the earliest event reported; for the EDGAR submission types of Form N-1A: the filing date; for all other submission types: the end of the reporting or transition period. The format of the date is YYYY-MM-DD.
| Name: |
dei_DocumentPeriodEndDate |
| Namespace Prefix: |
dei_ |
| Data Type: |
xbrli:dateItemType |
| Balance Type: |
na |
| Period Type: |
duration |
|
| X |
- DefinitionThe type of document being provided (such as 10-K, 10-Q, 485BPOS, etc). The document type is limited to the same value as the supporting SEC submission type, or the word 'Other'.
| Name: |
dei_DocumentType |
| Namespace Prefix: |
dei_ |
| Data Type: |
dei:submissionTypeItemType |
| Balance Type: |
na |
| Period Type: |
duration |
|
| X |
- DefinitionAddress Line 1 such as Attn, Building Name, Street Name
| Name: |
dei_EntityAddressAddressLine1 |
| Namespace Prefix: |
dei_ |
| Data Type: |
xbrli:normalizedStringItemType |
| Balance Type: |
na |
| Period Type: |
duration |
|
| X |
- Definition
+ References
+ Details
| Name: |
dei_EntityAddressCityOrTown |
| Namespace Prefix: |
dei_ |
| Data Type: |
xbrli:normalizedStringItemType |
| Balance Type: |
na |
| Period Type: |
duration |
|
| X |
- DefinitionCode for the postal or zip code
| Name: |
dei_EntityAddressPostalZipCode |
| Namespace Prefix: |
dei_ |
| Data Type: |
xbrli:normalizedStringItemType |
| Balance Type: |
na |
| Period Type: |
duration |
|
| X |
- DefinitionName of the state or province.
| Name: |
dei_EntityAddressStateOrProvince |
| Namespace Prefix: |
dei_ |
| Data Type: |
dei:stateOrProvinceItemType |
| Balance Type: |
na |
| Period Type: |
duration |
|
| X |
- DefinitionA unique 10-digit SEC-issued value to identify entities that have filed disclosures with the SEC. It is commonly abbreviated as CIK. Reference 1: http://www.xbrl.org/2003/role/presentationRef
-Publisher SEC
-Name Exchange Act
-Number 240
-Section 12
-Subsection b-2
| Name: |
dei_EntityCentralIndexKey |
| Namespace Prefix: |
dei_ |
| Data Type: |
dei:centralIndexKeyItemType |
| Balance Type: |
na |
| Period Type: |
duration |
|
| X |
- DefinitionIndicate if registrant meets the emerging growth company criteria. Reference 1: http://www.xbrl.org/2003/role/presentationRef
-Publisher SEC
-Name Exchange Act
-Number 240
-Section 12
-Subsection b-2
| Name: |
dei_EntityEmergingGrowthCompany |
| Namespace Prefix: |
dei_ |
| Data Type: |
xbrli:booleanItemType |
| Balance Type: |
na |
| Period Type: |
duration |
|
| X |
- DefinitionCommission file number. The field allows up to 17 characters. The prefix may contain 1-3 digits, the sequence number may contain 1-8 digits, the optional suffix may contain 1-4 characters, and the fields are separated with a hyphen.
| Name: |
dei_EntityFileNumber |
| Namespace Prefix: |
dei_ |
| Data Type: |
dei:fileNumberItemType |
| Balance Type: |
na |
| Period Type: |
duration |
|
| X |
- DefinitionTwo-character EDGAR code representing the state or country of incorporation.
| Name: |
dei_EntityIncorporationStateCountryCode |
| Namespace Prefix: |
dei_ |
| Data Type: |
dei:edgarStateCountryItemType |
| Balance Type: |
na |
| Period Type: |
duration |
|
| X |
- DefinitionThe exact name of the entity filing the report as specified in its charter, which is required by forms filed with the SEC. Reference 1: http://www.xbrl.org/2003/role/presentationRef
-Publisher SEC
-Name Exchange Act
-Number 240
-Section 12
-Subsection b-2
| Name: |
dei_EntityRegistrantName |
| Namespace Prefix: |
dei_ |
| Data Type: |
xbrli:normalizedStringItemType |
| Balance Type: |
na |
| Period Type: |
duration |
|
| X |
- DefinitionThe Tax Identification Number (TIN), also known as an Employer Identification Number (EIN), is a unique 9-digit value assigned by the IRS. Reference 1: http://www.xbrl.org/2003/role/presentationRef
-Publisher SEC
-Name Exchange Act
-Number 240
-Section 12
-Subsection b-2
| Name: |
dei_EntityTaxIdentificationNumber |
| Namespace Prefix: |
dei_ |
| Data Type: |
dei:employerIdItemType |
| Balance Type: |
na |
| Period Type: |
duration |
|
| X |
- DefinitionLocal phone number for entity.
| Name: |
dei_LocalPhoneNumber |
| Namespace Prefix: |
dei_ |
| Data Type: |
xbrli:normalizedStringItemType |
| Balance Type: |
na |
| Period Type: |
duration |
|
| X |
- DefinitionBoolean flag that is true when the Form 8-K filing is intended to satisfy the filing obligation of the registrant as pre-commencement communications pursuant to Rule 13e-4(c) under the Exchange Act. Reference 1: http://www.xbrl.org/2003/role/presentationRef
-Publisher SEC
-Name Exchange Act
-Number 240
-Section 13e
-Subsection 4c
| Name: |
dei_PreCommencementIssuerTenderOffer |
| Namespace Prefix: |
dei_ |
| Data Type: |
xbrli:booleanItemType |
| Balance Type: |
na |
| Period Type: |
duration |
|
| X |
- DefinitionBoolean flag that is true when the Form 8-K filing is intended to satisfy the filing obligation of the registrant as pre-commencement communications pursuant to Rule 14d-2(b) under the Exchange Act. Reference 1: http://www.xbrl.org/2003/role/presentationRef
-Publisher SEC
-Name Exchange Act
-Number 240
-Section 14d
-Subsection 2b
| Name: |
dei_PreCommencementTenderOffer |
| Namespace Prefix: |
dei_ |
| Data Type: |
xbrli:booleanItemType |
| Balance Type: |
na |
| Period Type: |
duration |
|
| X |
- DefinitionBoolean flag that is true when the Form 8-K filing is intended to satisfy the filing obligation of the registrant as soliciting material pursuant to Rule 14a-12 under the Exchange Act. Reference 1: http://www.xbrl.org/2003/role/presentationRef
-Publisher SEC
-Name Exchange Act
-Section 14a
-Number 240
-Subsection 12
| Name: |
dei_SolicitingMaterial |
| Namespace Prefix: |
dei_ |
| Data Type: |
xbrli:booleanItemType |
| Balance Type: |
na |
| Period Type: |
duration |
|
| X |
- DefinitionBoolean flag that is true when the Form 8-K filing is intended to satisfy the filing obligation of the registrant as written communications pursuant to Rule 425 under the Securities Act. Reference 1: http://www.xbrl.org/2003/role/presentationRef
-Publisher SEC
-Name Securities Act
-Number 230
-Section 425
| Name: |
dei_WrittenCommunications |
| Namespace Prefix: |
dei_ |
| Data Type: |
xbrli:booleanItemType |
| Balance Type: |
na |
| Period Type: |
duration |
|
Rare Element Resources (QB) (USOTC:REEMF)
Historical Stock Chart
From Mar 2024 to Apr 2024
 Charts.")
Rare Element Resources (QB) (USOTC:REEMF)
Historical Stock Chart
From Apr 2023 to Apr 2024
 Charts.")