false
0000039368
DEF 14A
00000393682022-11-272023-12-02
thunderdome:item
000003936842022-11-272023-12-02
000003936832022-11-272023-12-02
000003936822022-11-272023-12-02
000003936812022-11-272023-12-02
iso4217:USD
0000039368ful:NEOEqualsAverageTotalEquityAwardAdjustmentsMember2020-11-292021-11-28
0000039368ful:NEOAddAverageValueOfDividendsOrOtherEarningsPaidOnStockOrOptionAwardsNotOtherwiseReflectedInFairValueMember2020-11-292021-11-28
0000039368ful:NEODeductAverageFairValueAtTheEndOfThePriorYearOfEquityAwardsThatFailedToMeetVestingConditionsInTheYearMember2020-11-292021-11-28
0000039368ful:NEOAddAverageChangeInFairValueFromPriorYearEndOfEquityAwardsGrantedInPriorYearsThatVestedInTheYearMember2020-11-292021-11-28
0000039368ful:NEOAddAverageFairValueAsOfVestingDateOfEquityAwardsGrantedAndVestedInTheYearMember2020-11-292021-11-28
0000039368ful:NEOAddAverageYearOverYearChangeInFairValueOfOutstandingAndUnvestedEquityAwardsGrantedInPriorYearsMember2020-11-292021-11-28
0000039368ful:NEOAddAverageYearEndFairValueOfOutstandingAndUnvestedEquityAwardsGrantedInTheYearMember2020-11-292021-11-28
0000039368ful:NEOEqualsAverageTotalEquityAwardAdjustmentsMember2021-11-292022-12-03
0000039368ful:NEOAddAverageValueOfDividendsOrOtherEarningsPaidOnStockOrOptionAwardsNotOtherwiseReflectedInFairValueMember2021-11-292022-12-03
0000039368ful:NEODeductAverageFairValueAtTheEndOfThePriorYearOfEquityAwardsThatFailedToMeetVestingConditionsInTheYearMember2021-11-292022-12-03
0000039368ful:NEOAddAverageChangeInFairValueFromPriorYearEndOfEquityAwardsGrantedInPriorYearsThatVestedInTheYearMember2021-11-292022-12-03
0000039368ful:NEOAddAverageFairValueAsOfVestingDateOfEquityAwardsGrantedAndVestedInTheYearMember2021-11-292022-12-03
0000039368ful:NEOAddAverageYearOverYearChangeInFairValueOfOutstandingAndUnvestedEquityAwardsGrantedInPriorYearsMember2021-11-292022-12-03
0000039368ful:NEOAddAverageYearEndFairValueOfOutstandingAndUnvestedEquityAwardsGrantedInTheYearMember2021-11-292022-12-03
0000039368ful:NEOEqualsAverageTotalEquityAwardAdjustmentsMember2022-11-272023-12-02
0000039368ful:NEOAddAverageValueOfDividendsOrOtherEarningsPaidOnStockOrOptionAwardsNotOtherwiseReflectedInFairValueMember2022-11-272023-12-02
0000039368ful:NEODeductAverageFairValueAtTheEndOfThePriorYearOfEquityAwardsThatFailedToMeetVestingConditionsInTheYearMember2022-11-272023-12-02
0000039368ful:NEOAddAverageChangeInFairValueFromPriorYearEndOfEquityAwardsGrantedInPriorYearsThatVestedInTheYearMember2022-11-272023-12-02
0000039368ful:NEOAddAverageFairValueAsOfVestingDateOfEquityAwardsGrantedAndVestedInTheYearMember2022-11-272023-12-02
0000039368ful:NEOAddAverageYearOverYearChangeInFairValueOfOutstandingAndUnvestedEquityAwardsGrantedInPriorYearsMember2022-11-272023-12-02
0000039368ful:NEOAddAverageYearEndFairValueOfOutstandingAndUnvestedEquityAwardsGrantedInTheYearMember2022-11-272023-12-02
00000393682020-11-292021-11-28
0000039368ful:NEOAddAveragePensionBenefitAdjustmentsMember2020-11-292021-11-28
0000039368ful:NEODeductAverageChangeInActuarialPresentValueOfPensionBenefitsMember2020-11-292021-11-28
0000039368ful:NEOAddAverageEquityAwardAdjustmentsMember2020-11-292021-11-28
0000039368ful:NEODeductAverageReportedValueOfEquityAwardsMember2020-11-292021-11-28
00000393682021-11-292022-12-03
0000039368ful:NEOAddAveragePensionBenefitAdjustmentsMember2021-11-292022-12-03
0000039368ful:NEODeductAverageChangeInActuarialPresentValueOfPensionBenefitsMember2021-11-292022-12-03
0000039368ful:NEOAddAverageEquityAwardAdjustmentsMember2021-11-292022-12-03
0000039368ful:NEODeductAverageReportedValueOfEquityAwardsMember2021-11-292022-12-03
0000039368ful:NEOAddAveragePensionBenefitAdjustmentsMember2022-11-272023-12-02
0000039368ful:NEODeductAverageChangeInActuarialPresentValueOfPensionBenefitsMember2022-11-272023-12-02
0000039368ful:NEOAddAverageEquityAwardAdjustmentsMember2022-11-272023-12-02
0000039368ful:NEODeductAverageReportedValueOfEquityAwardsMember2022-11-272023-12-02
0000039368ful:PEOEqualsTotalEquityAwardAdjustmentsMember2020-11-292021-11-28
0000039368ful:PEOAddValueOfDividendsOrOtherEarningsPaidOnStockOrOptionAwardsNotOtherwiseReflectedInFairValueMember2020-11-292021-11-28
0000039368ful:PEODeductFairValueAtTheEndOfThePriorYearOfEquityAwardsThatFailedToMeetVestingConditionsInTheYearMember2020-11-292021-11-28
0000039368ful:PEOAddChangeInFairValueFromPriorYearEndOfEquityAwardsGrantedInPriorYearsThatVestedInTheYearMember2020-11-292021-11-28
0000039368ful:PEOAddFairValueAsOfVestingDateOfEquityAwardsGrantedAndVestedInTheYearMember2020-11-292021-11-28
0000039368ful:PEOAddYearOverYearChangeInFairValueOfOutstandingAndUnvestedEquityAwardsGrantedInPriorYearsMember2020-11-292021-11-28
0000039368ful:PEOAddYearEndFairValueOfOutstandingAndUnvestedEquityAwardsGrantedInTheYearMember2020-11-292021-11-28
0000039368ful:PEOEqualsTotalEquityAwardAdjustmentsMember2021-11-292022-12-03
0000039368ful:PEOAddValueOfDividendsOrOtherEarningsPaidOnStockOrOptionAwardsNotOtherwiseReflectedInFairValueMember2021-11-292022-12-03
0000039368ful:PEODeductFairValueAtTheEndOfThePriorYearOfEquityAwardsThatFailedToMeetVestingConditionsInTheYearMember2021-11-292022-12-03
0000039368ful:PEOAddChangeInFairValueFromPriorYearEndOfEquityAwardsGrantedInPriorYearsThatVestedInTheYearMember2021-11-292022-12-03
0000039368ful:PEOAddFairValueAsOfVestingDateOfEquityAwardsGrantedAndVestedInTheYearMember2021-11-292022-12-03
0000039368ful:PEOAddYearOverYearChangeInFairValueOfOutstandingAndUnvestedEquityAwardsGrantedInPriorYearsMember2021-11-292022-12-03
0000039368ful:PEOAddYearEndFairValueOfOutstandingAndUnvestedEquityAwardsGrantedInTheYearMember2021-11-292022-12-03
0000039368ful:PEOEqualsTotalEquityAwardAdjustmentsMember2022-11-272023-12-02
0000039368ful:PEOAddValueOfDividendsOrOtherEarningsPaidOnStockOrOptionAwardsNotOtherwiseReflectedInFairValueMember2022-11-272023-12-02
0000039368ful:PEODeductFairValueAtTheEndOfThePriorYearOfEquityAwardsThatFailedToMeetVestingConditionsInTheYearMember2022-11-272023-12-02
0000039368ful:PEOAddChangeInFairValueFromPriorYearEndOfEquityAwardsGrantedInPriorYearsThatVestedInTheYearMember2022-11-272023-12-02
0000039368ful:PEOAddFairValueAsOfVestingDateOfEquityAwardsGrantedAndVestedInTheYearMember2022-11-272023-12-02
0000039368ful:PEOAddYearOverYearChangeInFairValueOfOutstandingAndUnvestedEquityAwardsGrantedInPriorYearsMember2022-11-272023-12-02
0000039368ful:PEOAddYearEndFairValueOfOutstandingAndUnvestedEquityAwardsGrantedInTheYearMember2022-11-272023-12-02
0000039368ful:PEOAddPensionBenefitAdjustmentsMember2020-11-292021-11-28
0000039368ful:PEODeductChangeInActuarialPresentValueOfPensionBenefitsMember2020-11-292021-11-28
0000039368ful:PEOAddEquityAwardAdjustmentsMember2020-11-292021-11-28
0000039368ful:PEODeductReportedValueOfEquityAwardsMember2020-11-292021-11-28
0000039368ful:PEOAddPensionBenefitAdjustmentsMember2021-11-292022-12-03
0000039368ful:PEODeductChangeInActuarialPresentValueOfPensionBenefitsMember2021-11-292022-12-03
0000039368ful:PEOAddEquityAwardAdjustmentsMember2021-11-292022-12-03
0000039368ful:PEODeductReportedValueOfEquityAwardsMember2021-11-292022-12-03
0000039368ful:PEOAddPensionBenefitAdjustmentsMember2022-11-272023-12-02
0000039368ful:PEODeductChangeInActuarialPresentValueOfPensionBenefitsMember2022-11-272023-12-02
0000039368ful:PEOAddEquityAwardAdjustmentsMember2022-11-272023-12-02
0000039368ful:PEODeductReportedValueOfEquityAwardsMember2022-11-272023-12-02
xbrli:pure
Table of Contents
UNITED STATES
SECURITIES AND EXCHANGE COMMISSION
Washington, D.C. 20549
SCHEDULE 14A
Proxy Statement Pursuant to Section 14(a) of the Securities
Exchange Act of 1934 (Amendment No. )
Filed by the Registrant ☒
Filed by a Party other than the Registrant ☐
Check the appropriate box:
☐ Preliminary Proxy Statement
☐ Confidential, for Use of the Commission Only (as permitted by Rule 14a-6(e)(2))
☒ Definitive Proxy Statement
☐ Definitive Additional Materials
☐ Soliciting Material Pursuant to §240.14a-12
H.B. Fuller Company
(Name of Registrant as Specified In Its Charter)
(Name of Person(s) Filing Proxy Statement, if other than the Registrant)
Payment of Filing Fee (Check the appropriate box):
☒ No fee required.
☐ Fee paid previously with preliminary materials.
☐ Fee computed on table in exhibit required by Item 25(b) per Exchange Act Rules 14a-6(i)(1) and 0-11.
| 2024 |
Notice of Annual Meeting
and Proxy Statement
|
ANNUAL MEETING TO BE HELD APRIL 11, 2024
|
Office:
|
1200 Willow Lake Boulevard
|
| |
St. Paul, Minnesota 55110-5101
|
|
Mail:
|
P.O. Box 64683
|
| |
St. Paul, Minnesota 55164-0683
|
|
Phone:
|
(651) 236-5060
|
Dear Shareholder:
Our 2024 Annual Meeting of Shareholders will be held on Thursday, April 11, 2024. This year’s Annual Meeting will once again be a completely virtual meeting, which will be conducted via live webcast. A virtual meeting provides expanded access from any location around the world, improved communication and cost savings for our shareholders and the Company.
You can attend the meeting via the Internet at www.virtualshareholdermeeting.com/FUL2024, where you will be able to vote and submit questions electronically prior to and during the meeting. Specific instructions for accessing the meeting are provided in the attached Notice of Annual Meeting of Shareholders. The virtual meeting will begin promptly at 10:00 a.m. Central Time. The Notice of Annual Meeting of Shareholders and the Proxy Statement describe the business to be conducted at the meeting.
Your vote on the proposals is important. Whether or not you plan on attending the virtual meeting, we encourage you to vote your shares to make certain that you are represented at the meeting. You may vote via the Internet or by telephone or, if you received a printed copy of the proxy materials, by Internet, telephone or by mailing a proxy or voting instruction card.
| |
Sincerely,
|
| |
|
| |
Celeste B. Mastin
|
| |
President and Chief Executive Officer
|
February 28, 2024
|
Office:
|
1200 Willow Lake Boulevard
|
| |
St. Paul, Minnesota 55110-5101
|
|
Mail:
|
P.O. Box 64683
|
| |
St. Paul, Minnesota 55164-0683
|
|
Phone:
|
(651) 236-5060
|
NOTICE OF ANNUAL MEETING OF SHAREHOLDERS
|
Date and Time:
|
Thursday, April 11, 2024 at 10:00 a.m. Central Time. You may attend the virtual meeting, submit questions, and vote your shares electronically during the meeting via the Internet by visiting www.virtualshareholdermeeting.com/FUL2024. You will need your 16-digit control number to enter the Annual Meeting. You can find your control number in the Notice Regarding the Availability of Proxy Materials, proxy card, instruction form, or email you received relating to the meeting. In the Notice, proxy card and voting information form, the control number is in the box marked by the arrow. We recommend that you log in at least 15 minutes before the meeting to ensure that you are logged in when the meeting starts.
|
| |
|
|
Items of Business:
|
1. The election of three directors named in the attached Proxy Statement. Three directors will serve for a three-year term until the 2027 Annual Meeting of Shareholders and until their successors are duly elected and qualified or until their earlier resignation or removal.
|
| |
|
| |
2. The ratification of the appointment of Ernst & Young LLP as H.B. Fuller’s independent registered public accounting firm for the fiscal year ending November 30, 2024.
|
| |
|
| |
3. A non-binding advisory vote to approve the compensation of our named executive officers as disclosed in the attached Proxy Statement.
|
| |
|
| |
4. Any other business that may properly be considered at the meeting or any adjournment thereof.
|
| |
|
|
Record Date:
|
You are entitled to vote on the above items of business if you were a shareholder of record at the close of business on February 14, 2024.
|
| |
|
|
Voting by Proxy:
|
It is important that your shares be represented and voted at the meeting. Whether or not you plan to attend the meeting, we encourage you to submit your proxy as soon as possible. For specific instructions on how to vote your shares, please refer to the instructions in the materials you received, the section entitled “Questions and Answers about the Meeting” beginning on page 63 of the attached Proxy Statement, or if you received printed proxy materials, the enclosed proxy or voting instruction card. You can revoke a proxy at any time prior to its exercise at the meeting by following the instructions in the attached Proxy Statement.
|
| |
By Order of the Board of Directors
|
| |
|
| |
|
| |
Gregory O. Ogunsanya
|
| |
Senior Vice President, General Counsel and
Corporate Secretary
|
February 28, 2024
TABLE OF CONTENTS
H. B. FULLER | 2024 Proxy Statement
GLOSSARY OF FREQUENTLY USED TERMS
|
2020 Incentive Plan
|
the H.B. Fuller Company 2020 Master Incentive Plan, which was amended and restated on April 8, 2021 and on April 6, 2023 and which is our currently effective stock plan
|
|
401(k) Plan
|
the H.B. Fuller Company 401(k) and Retirement Plan
|
|
Adjusted EBITDA
|
Adjusted Earnings Before Interest, Taxes, Depreciation and Amortization as defined on page 38
|
| Adjusted EPS |
Adjusted earnings per share |
|
Adjusted Net Revenue
|
Defined on page 38
|
|
Board
|
Board of Directors of H.B. Fuller Company
|
|
CAO
|
Chief Administrative Officer
|
| CAP |
Compensation Actually Paid |
|
CEO
|
Chief Executive Officer
|
|
CFO
|
Chief Financial Officer
|
|
Company, H.B. Fuller, we, our
|
H.B. Fuller Company
|
|
COO
|
Chief Operating Officer
|
|
DC Restoration Plan
|
the H.B. Fuller Defined Contribution Restoration Plan
|
|
DDCP
|
the H.B. Fuller Directors’ Deferred Compensation Plan
|
|
EPS
|
Earnings per share
|
|
ESG
|
Environmental, Social and Governance
|
|
Exchange Act
|
Securities Exchange Act of 1934, as amended
|
|
EY
|
Ernst & Young LLP
|
|
GAAP
|
Generally Accepted Accounting Principles in the United States
|
|
KEDCP
|
Key Employee Deferred Compensation Plan
|
|
LTIP
|
Long-term incentive plan
|
|
NEOs
|
Named executive officers of H.B. Fuller Company
|
|
Non-GAAP
|
Financial measures reconciled to, but not in accordance with, Generally Accepted Accounting Principles
|
|
NQSO
|
Non-qualified stock option
|
|
NYSE
|
New York Stock Exchange
|
|
PSU
|
Performance-based stock unit
|
|
ROIC
|
Return on invested capital as defined on page 39
|
|
RSU
|
Restricted stock unit
|
|
SEC
|
the Securities and Exchange Commission
|
|
TSR
|
Total shareholder return
|
|
H. B. FULLER | 2024 Proxy Statement 2
|
PROXY STATEMENT
ANNUAL MEETING OF SHAREHOLDERS
APRIL 11, 2024
The Board of Directors of H.B. Fuller Company is soliciting proxies to be used at the Annual Meeting of Shareholders to be held on April 11, 2024, and at any adjournment and reconvening of the meeting. We first made this Proxy Statement and the 2023 Annual Report to Shareholders available to our shareholders on or about February 28, 2024.
PROXY SUMMARY
Provided below are highlights of some of the information contained in this Proxy Statement. These highlights are only a summary. Please review the complete Proxy Statement and 2023 Annual Report to Shareholders before you vote.
Annual Meeting of Shareholders
|
|
|
|
|
|
|
DATE AND TIME:
|
|
PLACE:
|
|
VOTING:
|
|
Thursday, April 11, 2024
at 10:00 a.m. Central Time
RECORD DATE:
Wednesday, February 14, 2024
|
|
Via the Internet. You may attend the virtual meeting by visiting
www.virtualshareholdermeeting.com/FUL2024.
If you encounter any difficulties accessing the virtual meeting during the check-in or meeting time, please call the technical support number that will be posted on the Virtual Shareholder Meeting log in page.
|
|
You may vote by proxy or at the
virtual meeting if you were a
shareholder of record at the close
of business on February 14, 2024
(see pages 63-67) for more
information on voting).
|
H. B. FULLER | 2024 Proxy Statement 3
PROXY SUMMARY
Proposals Requiring Your Vote
Your vote is important. Whether or not you plan to attend the virtual meeting, we encourage you to vote your shares to make certain that you are represented at the meeting.
|
Proposal
|
Board
Recommendation
|
Page
|
|
|
PROPOSAL 1 –
Election of Directors
|
FOR
|
10
|
|
| |
|
|
|
|
In selecting director nominees, our Board carefully considers the qualifications of each candidate and the overall composition of the Board. The following table provides summary information about each of the director nominees:
|
|
|
|
|
|
|
|
|
THOMAS W. HANDLEY
|
|
RUTH S. KIMMELSHUE
|
|
SRILATA A. ZAHEER
|
|
(Class I)
|
|
(Class I)
|
|
(Class I)
|
|
Director Since: 2010
|
|
Director Since: 2017
|
|
Director Since: 2022
|
|
Roles on the Board: Audit Committee (Chair) and Corporate Governance and Nominating Committee
|
|
Roles on the Board: Audit Committee and Compensation Committee (Chair)
|
|
Roles on the Board: Audit Committee and Compensation Committee
|
| |
|
|
|
|
|
Independent?
|
|
Independent?
|
|
Independent?
|
|
Yes
|
|
Yes
|
|
Yes
|
|
Other Public Company Boards:
|
|
Other Public Company Boards:
|
|
Other Public Company Boards:
|
|
Republic Services, Inc.
|
|
No |
|
No
|
| |
|
|
|
|
|
If elected, Mr. Handley, Ms. Kimmelshue and Ms. Zaheer would serve as Class I directors for a three-year term until the 2027 Annual Meeting and until their successors are duly elected and qualified or until their earlier resignation or removal.
|
H. B. FULLER | 2024 Proxy Statement 4
PROXY SUMMARY
|
Proposal
|
Board
Recommendation
|
Page
|
|
|
PROPOSAL 2 –
Ratification of Appointment of Independent Registered Public Accounting Firm
|
FOR
|
28
|
|
| |
|
|
|
|
The Audit Committee has approved the appointment of Ernst & Young LLP as the Company’s independent auditor for fiscal year 2024. Shareholders are asked to ratify this appointment.
|
|
| |
|
|
PROPOSAL 3 –
Non-Binding Advisory Vote on Executive Compensation
|
FOR
|
62
|
|
| |
|
|
|
|
In fiscal year 2023, shareholders showed their support for our executive compensation program with 94% of the votes cast for approval of the annual advisory vote on executive compensation, compared to 82% from the prior year. While shareholders have endorsed the Company’s executive compensation program, the Compensation Committee continually evaluates the program to ensure that it is designed to provide a competitive compensation package that rewards executive officers for sustained financial and operating performance that creates long-term value for our shareholders.
|
|
| |
|
| |
|
H. B. FULLER | 2024 Proxy Statement 5
PROXY SUMMARY
2023 Performance Highlights
We demonstrated resilience and determination in executing our winning strategy in the face of significant headwinds, including continued raw material cost inflation, a challenging macroeconomic climate, and higher interest rates. Throughout the year, we experienced unprecedented customer inventory de-stocking actions, increasing interest rates, and headwinds from foreign currency translation.
We are proud of the financial results we delivered in fiscal 2023, compared to fiscal 2022:
|
●
|
Net revenue of $3.51 billion, down 6.4%;
|
| |
|
|
●
|
Net income of $145 million, down 19.6%;
|
| |
|
|
●
|
EPS of $2.59, with Adjusted EPS of $3.87;
|
| |
|
|
●
|
Adjusted EBITDA of $581 million, up 10%;
|
| |
|
|
●
|
Operating cash flow of $378 million, up 48%; and
|
| |
|
|
●
|
For the 54th consecutive year, we implemented an increase in the amount of quarterly cash dividends paid to shareholders, with an 8% increase this year.
|
Despite the challenges described above, we delivered double-digit growth in adjusted EBITDA and operating cash flow in fiscal year 2023, driven by management of changing price and raw material dynamics, decisive restructuring measures, and strong execution. We achieved a fiscal year record high adjusted EBITDA margin of 16.5%.
Adjusted EPS and Adjusted EBITDA are non-GAAP financial metrics that are reconciled with the most directly comparable GAAP financial metrics in Annex A.
Executive Compensation Program (For More Information, see pages 29 - 43)
Our program emphasizes pay for performance using short- and long-term incentive awards as a significant percentage of total direct compensation. The graphs below show each element of total direct compensation (base salary, short-term incentive, and long-term incentive) as a percentage of total direct compensation for fiscal year 2023 for the CEO and on average for the other NEOs listed in the “Summary Compensation Table.”
Short-term incentive awards are performance-based cash awards granted pursuant to the STIP. Actual results on all STIP metrics are set forth in a table on page 37 of this Proxy Statement. STIP payments can range from 0% to 200% of target. In fiscal year 2023, the achievement of our financial metrics resulted in short-term cash incentive payouts for our CEO, CFO, and CAO of 50% of target and ranged from 49% to 87% of target for our other NEOs, based in part on the performance of the operating segments that they lead.
H. B. FULLER | 2024 Proxy Statement 6
PROXY SUMMARY
All short-term incentive awards earned for fiscal year 2023 are also shown in the “Non-Equity Incentive Plan Compensation” column of the “Summary Compensation Table” later in this Proxy Statement.
Long-term incentive awards are equity awards granted pursuant to the LTIP. The awards are composed of NQSOs, RSUs and PSUs. All equity awards granted in fiscal year 2023 are shown in the “Grants of Plan-Based Awards During Fiscal 2023” table later in this Proxy Statement.
See further discussion and detail in the “Compensation Discussion and Analysis” section of this Proxy Statement.
OTHER HIGHLIGHTS OF OUR EXECUTIVE COMPENSATION PROGRAM
|
●
|
25% of NEO equity awards are PSUs that cliff vest at the end of a three-year performance period;
|
| |
|
|
●
|
A policy regarding “clawbacks” of executive and key manager incentive compensation if there is a restatement of the Company’s financial statements or if there is misconduct by an executive or key manager;
|
| |
|
|
●
|
A prohibition on hedging, pledging and certain other transactions in the Company's securities by directors and executive officers;
|
| |
|
|
●
|
Policies for responsible share usage and governance of our equity compensation plans, including a prohibition on re-pricing of stock options;
|
| |
|
|
●
|
A double-trigger is required for accelerated equity vesting upon a change-in-control for equity grants to NEOs, beginning in mid-fiscal year 2018;
|
| |
|
|
●
|
Removal of tax gross-up provisions from change-in-control agreements entered into beginning in mid-fiscal year 2018; and
|
| |
|
|
●
|
Stock ownership goals of five times base salary for our CEO, three times base salary for our CFO, and two times base salary for our other executive officers.
|
Fiscal 2024 Changes to our Executive Compensation Program
Effective for STIP awards related to the Company’s 2024 fiscal year and thereafter, Adjusted EBITDA margin will be included as a fourth metric along with Adjusted EBITDA, Adjusted EPS, and Adjusted Net Revenue for purposes of calculating STIP awards. Each of the metrics will be weighted at 25% for our executive officers with the exception of our SVP, International Growth Markets, whose STIP metrics will be weighted at 35% for Adjusted EPS, 25% for International Growth Markets Adjusted EBITDA margin, 20% for International Growth Markets Adjusted EBITDA, and 20% for International Growth Markets Adjusted Net Revenue. These changes were made to better align the STIP metrics with the Company’s portfolio management approach.
Board Composition and Diversity
The Board believes that its membership should reflect a diversity of experience, skills, geography, gender, and ethnicity that can enrich its deliberations. The following pie charts provide information about certain aspects of our Board’s diversity as of January 31, 2024.
|
|
|
|
| 89% Independent |
44% Women |
11% Diverse (Ethnic or Racial) |
| 11% Other |
56% Men |
89% Other |
H. B. FULLER | 2024 Proxy Statement 7
PROXY SUMMARY
| |
AVERAGE BOARD TENURE:
|
|
| |
7.2 YEARS |
|
| |
|
|
|
|
|
|
Additional information on our policies regarding Board composition and Board diversity may be found under “Proposal 1 – Election of Directors – How can a shareholder suggest a candidate for election to the Board?”
Shareholder Engagement
We regularly engage with our investor base to obtain their input on our governance, sustainability, and compensation programs. We have generally received positive feedback and have planned our programs based in part on such feedback when appropriate.
H. B. FULLER | 2024 Proxy Statement 8
PROXY SUMMARY
H.B. FULLER COMPANY’S SUSTAINABILITY
EFFORTS, HUMAN RIGHTS POLICY,
CORPORATE GIVING AND EMPLOYEE
VOLUNTEERISM
At H.B. Fuller, we are committed to creating positive change for all our stakeholders, including customers, employees, shareholders, and communities. We know that our company is best positioned for success when we win the right way, by creating sustainable solutions, taking care of our communities, and planning for the future. Social responsibility is fundamental to who we are as a company and also is a source of competitive advantage. We continually strive to minimize the environmental impact of our operations, while holding safety as a Company value and providing a dynamic and supportive workplace for our employees. We are also committed to basic human rights in our business and across our supply chain, as stated in the H.B. Fuller Human Rights Policy, which can be found in the “Sustainability” section of our corporate website (www.hbfuller.com). We are committed to minimize our ecological footprint and set targets for four key sustainability metrics: energy intensity, greenhouse gas emissions intensity, waste intensity and water withdrawal intensity. We report annually on our sustainability targets, volunteerism and philanthropy in our Annual Sustainability Report, which may be downloaded from our “Sustainability” section of our corporate website (www.hbfuller.com). This report, our Human Rights Policy and our website are not incorporated by reference in, and are not part of, this Proxy Statement.
H. B. FULLER | 2024 Proxy Statement 9
PROPOSAL 1—ELECTION OF DIRECTORS
PROPOSAL
The Board of Directors is composed of nine directors divided into three classes. Generally, each year one class of directors stands for election for a three-year term. The term of office for Class I directors, consisting of Thomas W. Handley, Ruth S. Kimmelshue, and Srilata A. Zaheer will expire at the Annual Meeting. Mr. Handley, Ms. Kimmelshue, and Ms. Zaheer are being nominated to serve an additional three-year term of office until the 2027 Annual Meeting and until their successors are duly elected and qualified or until their earlier resignation or removal and each has agreed to serve as a director if elected. Mr. Handley and Ms. Kimmelshue were elected to the Board of Directors by the shareholders. Ms. Zaheer was recommended by both Mr. Mitau and Mr. Owens (the Company’s former CEO) and appointed by the Board of Directors in November 2021, effective April 2022. For information on how a shareholder may suggest a person to be a nominee to the Board, see “How can a shareholder suggest a candidate for election to the Board?”
Unless earlier terminated due to retirement or resignation, the term of office for Class II directors, consisting of Michael J. Happe, Charles T. Lauber, and Celeste B. Mastin will expire at the Annual Meeting in 2025, and the term of office for Class III directors, consisting of Daniel L. Florness, Lee R. Mitau, and Teresa J. Rasmussen will expire at the Annual Meeting in 2026.
Two new members joined the Board during fiscal year 2023. Effective December 4, 2022, Ms. Mastin was appointed as CEO and a member of the Board, succeeding James Owens. Mr. Lauber was appointed to the Board effective January 23, 2023.
If, for any reason, any nominee becomes unable to serve before the election, the persons designated as proxies will vote your shares for a substitute nominee selected by the Board of Directors. Alternatively, the Board, at its option, may reduce the number of directors constituting Class III directors.
| |
|
THE BOARD OF DIRECTORS RECOMMENDS A VOTE FOR ELECTION OF EACH OF THE NOMINEES.
|
H. B. FULLER | 2024 Proxy Statement 10
PROPOSAL 1—ELECTION OF DIRECTORS
WHO ARE THE NOMINEES?
The following directors are standing for re-election for a three-year term until the 2027 Annual Meeting of Shareholders and until the successors are duly elected and qualified or until their earlier resignation or removal.
Class I (Term Ending in 2024)
Age 69
Independent
Director since 2010
Committees:
Audit (Chair) and
Corporate Governance
and Nominating
Other Public Company
Boards: Republic
Services, Inc.
|
Senior Advisor and former Chief Operating Officer (August 2019-April 2023) of Cascade Asset Management Company which manages the financial assets of William H. Gates III and the Bill and Melinda Gates Foundation Trust. Previously, Mr. Handley served in various senior executive positions for Ecolab, Inc., a global company providing businesses with solutions for clean water, safe food, abundant energy, and healthy environments, including President and Chief Operating Officer (2012-April 2019). He also held various management positions (1981-2003) with The Procter & Gamble Company, including serving as Vice President and General Manager for P&G’s paper products businesses in Japan and Korea and as a Vice President for Strategic Planning and Marketing of the Global Feminine Care business; Mr. Handley also managed various businesses in Mexico and Latin America for P&G.
Qualifications
Mr. Handley brings to our Board a valuable operating perspective due to his broad experience in a variety of markets, businesses, and investments both domestically and internationally while at Cascade, Ecolab, and P&G. He also has experiences with increasing Ecolab’s presence in new markets and in the specialty chemical industry, which are critical to H.B. Fuller’s growth strategy. In addition, Mr. Handley has governance experience in a variety of settings, from a management perspective at Ecolab, as a member on another public company board, and as a current and former board member of several non-profit organizations, foundations, and privately held companies.
The Board of Directors has determined that Mr. Handley is an audit committee financial expert as that term is defined under the rules of the SEC.
|
|

Age 61
Independent
Director since 2017
Committees:
Audit and Compensation
(Chair)
|
Ruth S. Kimmelshue
Biography
Corporate Senior Vice President, Animal Nutrition and Health Global Enterprise (April 2021-present) of Cargill, Incorporated, a global company providing food, agriculture, financial and industrial products, and services globally. Ms. Kimmelshue previously served as head of Operations and Supply Chain (2015-2021) and as the company’s first-ever Chief Sustainability Officer (2017-2021), a Corporate Leader (2015) for Cargill’s Animal Protein and Salt businesses; Business Unit President (2013-2015) for Cargill Turkey & Cooked Meats; several positions (1999-2013) including Business Unit President of Cargill Salt, and Vice President, Commercial Manager of Cargill AgHorizons, and leader of Cargill Supply Chain Solutions. She also held various positions (1986-1999), at Continental Grain, including roles in grain and oilseed merchandising and trading, facility and general management, economic analysis, and marketing and sales in the U.S. and Europe.
Qualifications
Ms. Kimmelshue brings to our Board, a depth of experience in leading successful global businesses at Cargill and Continental Grain. She has extensive experience in operations and supply chain, which is extremely valuable to the Board and our management team.
|
H. B. FULLER | 2024 Proxy Statement 11
PROPOSAL 1—ELECTION OF DIRECTORS
|
Age 69
Independent
Director since 2022
Committees:
Audit and Compensation
|
Biography
Former Dean of the Carlson School of Management of the University of Minnesota (2011-2023) where she holds the Elmer L. Andersen Chair in Global Corporate Social Responsibility. She has served as a director of the Federal Reserve Bank of Minneapolis since 2017 and as Chair of the Board of the Federal Reserve Bank of Minneapolis (2020-2023). Dr. Zaheer has worked in India, China, Nigeria, Poland, and Brazil.
Qualifications
Dr. Zaheer brings to the Board deep experience in international business strategy and strong networks in China and India, both important growth markets for our Company. She also has a deep understanding of developing robust corporate social responsibility strategies and programs that will complement our ESG efforts. Dr. Zaheer is a strong leader with deep understanding of global business strategy, including building strong partnerships to diversify and scale service offerings, implementing end-to-end digital transformation to drive performance, and developing strong, global talent pipelines. She has a background in multinational, corporate financial management, and she will bring to the Company insights that will further strengthen our strategy and growth trajectory.
|
HOW CAN A SHAREHOLDER SUGGEST A CANDIDATE FOR ELECTION TO THE BOARD?
The Corporate Governance and Nominating Committee of the Board reviews and recommends candidates for election to the Board. Generally, current directors or third-party search firms engaged by the Corporate Governance and Nominating Committee identify candidates for consideration by the Committee. No third-party search firm was engaged during fiscal year 2023. The Corporate Governance and Nominating Committee reviews candidates and reports their recommendations to the Board of Directors, including an assessment of a candidate’s judgment, experience, independence, and such other factors as the Corporate Governance and Nominating Committee concludes are pertinent considering the Board’s needs. The Board of Directors believes that its membership should reflect a diversity of experience, skills, geography, gender, and ethnicity that can enrich its deliberations. The Board invites each candidate to self-identify diversity characteristics, which may include but are not limited to gender, racial or ethnic background, as well as diverse work experiences, military service, or socio-economic or demographic characteristics. It considers diversity when evaluating director candidates and setting priorities for director searches.
The Committee considers candidates recommended by any shareholder using the same criteria set forth above. Recommendations may be sent to the Corporate Governance and Nominating Committee in care of the Corporate Secretary of H.B. Fuller. No shareholder recommended any candidate during fiscal year 2023. For the Board to consider a candidate for nomination at the 2025 Annual Meeting, shareholders must submit the required information to the Corporate Secretary by the close of business on October 31, 2024.
WHO ARE THE REMAINING DIRECTORS?
The following directors are not standing for re-election at the Annual Meeting and their service will continue until the end of their respective terms.
H. B. FULLER | 2024 Proxy Statement 12
PROPOSAL 1—ELECTION OF DIRECTORS
Class II (Term Ending in 2025)
|
Age 52
Independent
Director since 2021
Committees:
Compensation and
Corporate Governance
and Nominating
Other Public Company
Boards: Winnebago
Industries, Inc.
|
Biography
President and Chief Executive Officer (2016-present), Winnebago Industries, Inc., leading North American manufacturer of outdoor lifestyle products that are used primarily in leisure travel and outdoor recreation activities. Prior to joining Winnebago, Mr. Happe served as Executive Officer and Group Vice President at The Toro Company. During his 19 years at Toro, he held a series of senior leadership positions across a variety of domestic and international positions.
Qualifications
Mr. Happe brings to the Board a strong business acumen in leading domestic and international businesses at Winnebago and Toro, both public companies. He is a proven leader with experience at building strong organization structures and driving global sales growth and profitability. His extensive experience as an executive leader of significant manufacturing companies is a great benefit to the Company and the Board.
|
|

Age 61
Independent Director since 2023
Committees: Audit and Compensation
|
Charles T. Lauber
Biography
Executive Vice President and Chief Financial Officer (2019-present), A. O. Smith Corporation, global leader in water heating solutions. From 1999 to 2019, Mr. Lauber held several roles at A. O. Smith, having served in financial leadership, operations strategy and corporate development roles. Before joining A. O. Smith, he held a number of auditing and management positions with Ernst & Young (1984-1999).
Qualifications
Mr. Lauber brings to the Board deep experience in public company financial functions, including treasury, controllership, cash management and investor relations. He also is actively involved in modernizing A. O. Smith’s operational capabilities and ESG (environmental, social and governance) strategy and has experience driving company growth through M&A and was vital to A. O. Smith’s successful expansion in the global water markets, including China and India. As CFO, he led the increase in profit margins and enhanced investor confidence, resulting in record earnings. He also serves on the Board of Directors for the National Association of Manufacturers.
The Board of Directors has determined that Mr. Lauber is an audit committee financial expert as that term is defined under the rules of the SEC.
|
H. B. FULLER | 2024 Proxy Statement 13
PROPOSAL 1—ELECTION OF DIRECTORS
|

Age 55
Director since 2022
Other Public Company
Boards: Granite
Construction, Inc.
|
Biography
President and Chief Executive Officer (2022-present), and Executive Vice President and Chief Operating Officer (2022), H.B. Fuller Company. Previously, Ms. Mastin served as CEO of PetroChoice Lubrication Solutions (2018-2022), the largest distributor of petroleum lubrication solutions in the United States. Prior to that, she held CEO roles at Distribution International, Inc., a distributor of thermal and acoustical insulation and related supplies for maintenance and repair operations, and MMI Products, Inc. (a division of Oldcastle), a manufacturer of chain link and ornamental iron fence products and concrete reinforcing welded wire mesh and accessories. She served in executive leadership roles at Ferro Corporation and Bostik Adhesives, now owned by Arkema.
Qualifications
Ms. Mastin brings to the Board her 30 years’ experience in manufacturing and distribution with a successful track record of guiding companies’ growth through innovation, service improvement, global expansion, and acquisition. Ms. Mastin also brings experience as an exceptional commercial leader with a proven track record of success in highly complex, international businesses. She has a wealth of global, executive leadership experience and an understanding of the adhesives industry that will provide accelerated growth and performance for the Company.
|
Class III (Term Ending in 2026)
|

Age 60
Independent
Director since 2018
Committees:
Audit and Corporate
Governance and
Nominating
Other Public Company
Boards: Fastenal
Company
|
Biography
President and Chief Executive Officer (2016-present) of Fastenal Company, which provides fasteners, tools, and supplies to companies to manufacture products, build structures, protect personnel, and maintain facilities and equipment. Previously, Mr. Florness served as Executive Vice President and Chief Financial Officer (2002-2015) and Chief Financial Officer (1996-2002) of Fastenal, and as a Senior Manager (1986-1996) of KPMG LLP.
Qualifications
Mr. Florness brings to the Board a broad range of financial and management experience, CEO experience, and public company Board experience. Prior to becoming CEO at Fastenal, his responsibilities included finance, leadership of a portion of a manufacturing division, product development and procurement, and Fastenal’s national accounts business. He also brings deep knowledge and understanding of corporate strategy, and experience growing a business from a $250 million business with operations in two countries to a $7.3 billion global entity with a direct presence in 26 countries.
The Board of Directors has determined that Mr. Florness is an audit committee financial expert as that term is defined under the rules of the SEC.
|
H. B. FULLER | 2024 Proxy Statement 14
PROPOSAL 1—ELECTION OF DIRECTORS
|

Age 75
Independent
Director since 1996, Independent Chairman of
the Board since 2007
Committees:
Compensation and
Corporate Governance
and Nominating (Chair)
Other Public Company
Boards: Chairman of the
Board of Graco Inc.
|
Biography
Chairman of the Board (2002-2006 and 2007-present) of Graco Inc. Previously, Mr. Mitau served as Executive Vice President and General Counsel (1995-2013) of U.S. Bancorp.
Qualifications
Mr. Mitau brings to the Board extensive public company legal and governance expertise. He is widely recognized as an expert in the area of corporate governance. He also has expertise in the areas of corporate governance, corporate finance, and mergers and acquisitions through his career as chief legal officer of one of the largest banks in the U.S and as a practicing attorney with Dorsey & Whitney LLP, a global law firm, where he headed the firm’s corporate and securities practice. Since 1990, he has also served on the board of Graco. During his 27 years of service on the Board, Mr. Mitau has developed an in-depth knowledge of our Company and its businesses. Mr. Mitau’s unique combination of experiences makes him particularly well-qualified to serve as our Chairman.
|
| |
|
|

Age 67
Independent
Director since
2020
Committees:
Audit and Corporate
Governance and
Nominating
|
Biography
President and Chief Executive Officer (2018-present) of Thrivent Financial for Lutherans, a tax exempt financial services organization. Previously, Ms. Rasmussen served as President of Thrivent’s Life Insurance business (2015-2018) and Senior Vice President, General Counsel and Secretary (2005-2015) of Thrivent. Ms. Rasmussen served in a variety of executive roles, including Vice President, Chief Legal Officer and Senior Lawyer with American Express/Ameriprise as well as in legal roles at Northeast Securities Corporation, Oppenheimer Wolff & Donnelly LLP, and the U.S. Department of Justice.
Qualifications
Ms. Rasmussen brings to the Board unique strengths given her extensive financial and legal experience, in addition to her executive and leadership roles at Thrivent. She contributes greatly to ongoing strategic growth initiatives. She has a deep understanding of how to address changing market trends, build and sustain strong organizational cultures, and deliver quality and service commitments to customers and clients. Ms. Rasmussen serves on the Board of Directors of Thrivent.
|
H. B. FULLER | 2024 Proxy Statement 15
CORPORATE GOVERNANCE
CORPORATE GOVERNANCE GUIDELINES
The Board, upon recommendation of the Corporate Governance and Nominating Committee, has adopted Corporate Governance Guidelines, which summarize many of the corporate governance principles that the Board follows in governing H.B. Fuller. The guidelines are available for review on our website (www.hbfuller.com) in the “Governance” section of the Investor Relations page.
DIRECTOR INDEPENDENCE
Pursuant to our Corporate Governance Guidelines and the listing standards of the New York Stock Exchange (“NYSE”), the Board has determined that all Board members, other than Ms. Mastin, are independent. No director is considered independent unless the Board affirmatively determines that such director has no material relationship with H.B. Fuller. In assessing the materiality of any person’s relationship with H.B. Fuller, the Board considers all relevant facts and circumstances, including not only direct relationships between H.B. Fuller and each director but also any relationships between H.B. Fuller and any of a director's immediate family members and any entity with which a director is affiliated.
The Board reviewed certain transactions between H.B. Fuller and our directors and entities with which they are affiliated and determined that they were made or established in the ordinary course of business and that the directors had no direct or indirect material interest in the transactions. These directors recused themselves from this review and determination as it related to the entities with which they are affiliated. The Board considered customer-supplier transactions between: (i) the Company and Fastenal Company, of which Mr. Florness is the President and Chief Executive Officer, (ii) the Company and Cargill, Incorporated, of which Ms. Kimmelshue is Corporate Senior Vice President, Business Operations & Supply Chain, (iii) the Company and Winnebago Industries, Inc., of which Mr. Happe is the Chief Executive Officer, and (iv) the Company and A.O. Smith Corporation, of which Mr. Lauber is the Executive Vice President and Chief Financial Officer. The Board also reviewed H.B. Fuller’s charitable contributions to, and services provided by, the University of Minnesota and its Carlson School of Management, Dr. Zaheer’s employer. The dollar amounts involved in the transactions fall below the thresholds set by the NYSE for director independence.
MEETINGS OF THE BOARD AND THE BOARD’S COMMITTEES
Directors are expected to attend the Annual Meeting of Shareholders and all meetings (including virtual meetings) of the Board and each committee on which they serve. During the 2023 fiscal year, the Board held five meetings. Each of the directors attended greater than 75% of the meetings of the Board and Board committees on which the directors served during the 2023 fiscal year. In addition, all the directors attended our Annual Meeting of Shareholders held on April 6, 2023.
WHAT ARE THE ROLES OF THE BOARD’S COMMITTEES?
The Board of Directors is responsible for the overall affairs of H.B. Fuller. The Board conducts its business through meetings of the Board and three standing committees: Audit, Compensation, and Corporate Governance and Nominating. The Board has adopted a written charter for each committee. The charters for each of these committees are available for review on our website (www.hbfuller.com) in the “Governance” section of the Investor Relations page. Information regarding the three standing committees is set forth below. When necessary, the Board may also establish ad hoc committees to address specific issues. The members of the committees as of January 31, 2024 are as follows:
|
Audit Committee
|
Compensation Committee
|
Corporate Governance and Nominating
Committee
|
|
Thomas W. Handley (Chair)
|
Ruth S. Kimmelshue (Chair)
|
Lee R. Mitau (Chair)
|
|
Daniel L. Florness
|
Michael J. Happe
|
Daniel L. Florness
|
|
Ruth S. Kimmelshue
|
Charles T. Lauber
|
Thomas W. Handley
|
|
Charles T. Lauber
|
Lee R. Mitau
|
Michael J. Happe
|
|
Teresa J. Rasmussen
|
Srilata A. Zaheer
|
Teresa J. Rasmussen
|
|
Srilata A. Zaheer
|
|
|
H. B. FULLER | 2024 Proxy Statement 16
CORPORATE GOVERNANCE
AUDIT COMMITTEE
Number of Meetings in fiscal year 2023: Nine
Functions: The Audit Committee reviews the Company's financial information and disclosures, appoints the independent registered public accounting firm to audit our consolidated financial statements, oversees the audit and the independence and performance of our independent registered public accounting firm, determines and pre-approves the type and scope of all audit, audit-related and non-audit services provided by our independent registered public accounting firm, oversees our internal audit function, reviews the performance of our retirement plans and reviews our annual audited consolidated financial statements, accounting principles and practices, and the adequacy of internal controls. In addition, the Audit Committee reviews the Company’s risk management policies, procedures, and controls to assess their adequacy and appropriateness in the context of the Company’s business and operating environment, and review steps that management takes to monitor and mitigate risk exposures. The Committee reviews, on an annual basis, the overall enterprise risk management approach and management’s assessment and mitigation of significant risk factors impacting the Company’s business and operating environment. The Committee also monitors cybersecurity, compliance with legal and regulatory requirements, our Code of Business Conduct, and our Policy and Procedures Regarding Transactions with Related Persons.
All the members of the Audit Committee are considered independent as that term is defined by our Corporate Governance Guidelines, the listing standards of the NYSE, and the applicable rules and regulations of the SEC. The Board of Directors has also determined that Daniel L. Florness, Thomas W. Handley, and Charles T. Lauber satisfy the requirements of an audit committee financial expert as such term is defined under the rules and regulations of the SEC. The Audit Committee Report for fiscal year 2023 is included in this Proxy Statement.
COMPENSATION COMMITTEE
Number of Meetings in fiscal year 2023: Five
Functions: The Compensation Committee establishes overall compensation programs and practices for executives and reviews and approves compensation, including salary, incentive programs, stock-based awards, retirement plans, perquisites and other supplemental benefits, employment agreements, severance agreements, change in control provisions, and other executive compensation items for our executive officers. The Compensation Committee monitors the competitiveness, fairness, and equity of our retirement plans and administers our stock-based compensation plans and individual awards. It also administers the compensation recovery policy.
The Compensation Committee annually reviews and approves compensation for our non-employee directors including retainers, equity awards, and other compensation and expense items.
The Compensation Committee may delegate its authority to the Chair of the Compensation Committee to accelerate vesting of outstanding awards. The Committee intends this delegation of authority to be for situations of retirement or termination, and where it is impractical to obtain participation by all Committee members.
All the members of the Compensation Committee are considered independent as that term is defined by our Corporate Governance Guidelines, the listing standards of the NYSE and the applicable rules and regulations of the SEC. The Compensation Committee Report for fiscal year 2023 is included in this Proxy Statement.
CORPORATE GOVERNANCE AND NOMINATING COMMITTEE
Number of Meetings in fiscal year 2023: Four
Functions: The Corporate Governance and Nominating Committee reviews matters of corporate governance, including our organizational structure and succession planning. This Committee evaluates and recommends new director nominees and evaluates each current director prior to nominating such person for re-election. The Corporate Governance and Nominating Committee reviews a director’s continued service if a director’s occupation changes during his or her term. This Committee also evaluates the performance of the Chairman of the Board, the President and Chief Executive Officer, and the directors, and makes recommendations to the Board regarding any shareholder proposals.
The Committee is also responsible for reviewing and assessing the Company’s policies and practices relating to significant issues of corporate social and public concern including environmental, social and governance (ESG) matters and may delegate to other Board committees responsibilities related to certain ESG matters as the Committee deems appropriate. The Committee oversees the Company’s engagement with and disclosures concerning ESG matters.
H. B. FULLER | 2024 Proxy Statement 17
CORPORATE GOVERNANCE
The Corporate Governance and Nominating Committee considers shareholder recommendations for potential director nominees. See “How can a shareholder suggest a candidate for election to the Board?”
All the members of the Corporate Governance and Nominating Committee are considered independent as that term is defined by our Corporate Governance Guidelines and the listing standards of the NYSE.
BOARD’S ROLE IN OVERSIGHT OF RISK
In General
The Board believes that effective enterprise risk management must be an integral part of Board and Committee deliberations and activities throughout the year. As part of the enterprise risk management, the Board engages in the following activities throughout the fiscal year:
|
●
|
The full Board of Directors annually reviews the Company’s enterprise risk management process and a comprehensive assessment of key financial, operational, strategy and compliance/regulatory risks identified by management, as well as mitigating practices.
|
|
●
|
The Audit Committee also reviews the Company’s risk assessment and risk management policies, procedures, and controls to assess their adequacy and appropriateness in the context of the Company’s business and operating environment, and reviews steps that management takes to monitor and mitigate risk exposures.
|
|
●
|
The Company’s strategy is also reviewed with the Board at least annually and management considers input from the Board in setting and adjusting the Company’s strategy. The full Board of Directors discusses risks related to the Company’s annual financial plan and budget each fiscal year and risks related to the Company’s strategy and compliance and regulatory risks at meetings where these items are presented and reviewed.
|
|
●
|
The Board of Directors also encourages management to promote a corporate culture that integrates risk management into the Company’s strategy and day-to-day business operations in a way that is consistent with the Company’s targeted risk profile.
|
|
●
|
Each committee conducts its own risk assessment and management activities throughout the year (some of which are highlighted in the section on Board committees above) and reports its conclusions to the Board.
|
Through these processes, the Board continuously oversees a system to identify, assess, and address material risks to the Company on a timely basis. During fiscal year 2023, the Board conducted a comprehensive risk assessment process and specifically reviewed the top risks identified during that process. This review included a review of risk mitigation strategies and included the steps taken since the prior year review to enable the mitigation strategies.
In addition, the Board’s leadership structure, as described below in the section titled “Board Leadership Structure” supports its role in risk oversight. The Company has a separate Chairman of the Board and Chief Executive Officer and has had these roles separated since 2007. If these positions are combined, we will have an independent Presiding Director. We have strong independent directors chairing each of our Board Committees, all of which are involved in risk oversight, and there is open communication between management and the non-employee directors.
Risk Assessment of Compensation Programs
Management conducted a risk assessment of the Company’s policies and programs relating to the compensation of employees, including those that apply to our executive officers. Management discussed the findings of the risk assessment with the Compensation Committee. Based on the assessment, the Company believes that its compensation policies and practices create an appropriate balance between our base salary compensation, short-term incentive compensation, and long-term incentive compensation, thereby reducing the possibility of imprudent risk-taking and that its compensation policies and practices do not create risks that are reasonably likely to have a material adverse effect on the Company.
BOARD LEADERSHIP STRUCTURE
Our Corporate Governance Guidelines provide that the Board of Directors does not require the separation of the offices of Chairman and Chief Executive Officer. Separation of these offices is an issue that is to be addressed as part of the Company’s succession planning. When the Chairman and Chief Executive Officer are separate offices, the Chairman will serve as the Presiding Director. However, when the Chief Executive Officer also holds the position of Chairman, a Presiding Director will be appointed by the Board to further the achievement of a strong, independent Board with an appropriate balance between the Board and the Chief Executive Officer. In such cases, the Chair of the Corporate Governance and Nominating Committee shall serve as the Presiding Director.
H. B. FULLER | 2024 Proxy Statement 18
CORPORATE GOVERNANCE
Mr. Mitau has served as our independent Chairman of the Board since December 2006 and, in this capacity, has acted as the Presiding Director at Board of Director meetings and during executive sessions of the non-management directors. Our Board has separated the roles of Chairman of the Board and Chief Executive Officer since 2007, because it promotes independent Board oversight of management, capitalizes on existing Board expertise, and it is an effective allocation of duties as between the Chairman and the CEO. Mr. Mitau serves as the Chairman of the Board of Graco Inc. and has significant public company experience. The Chief Executive Officer, in consultation with the Chairman, establishes the agenda for each Board meeting. At the beginning of each fiscal year, the Chairman also publishes a schedule of topics to be discussed.
DIRECTOR ELECTIONS
With respect to the election of directors, our Board has adopted a so-called “plurality-plus” standard. A plurality voting standard means that the three nominees receiving the most votes will be elected. In accordance with procedures set forth in our Corporate Governance Guidelines, at any shareholder meeting at which directors are subject to an uncontested election (i.e., an election where the only nominees are those recommended by the Board), any nominee for director who receives a greater number of votes “withheld” from his or her election than votes “for” such election must submit to the Board a letter of resignation for consideration by the Corporate Governance and Nominating Committee. The Corporate Governance and Nominating Committee will promptly consider the resignation offer and recommend to the full Board whether to accept it. In considering whether to accept or reject the resignation offer, the Corporate Governance and Nominating Committee will consider all factors deemed relevant by members of the Corporate Governance and Nominating Committee, including, without limitation, (i) the perceived reasons why shareholders withheld votes “for” election from the director, (ii) the length of service and qualifications of the director, (iii) the director’s contributions to the Company, (iv) compliance with listing standards, (v) the purpose and provisions of the Corporate Governance Guidelines, and (vi) the best interests of the Company and its shareholders. To the extent that one or more directors’ resignation is accepted by the Board, the Corporate Governance and Nominating Committee will recommend to the Board whether to fill such vacancy or vacancies or to reduce the size of the Board. Any director who tenders his or her offer to resign from the Board pursuant to this provision shall not participate in the Corporate Governance and Nominating Committee or Board deliberations regarding whether to accept the offer of resignation. The Board will act on the Corporate Governance and Nominating Committee’s recommendation within 90 days following the certification of the shareholder vote by the Inspector of Elections, which action may include, without limitation, acceptance of the offer of resignation, adoption of measures intended to address the perceived issues underlying the vote, or rejection of the resignation offer. Thereafter, the Board will publicly disclose its decision whether to accept the director’s resignation offer.
In accordance with our Corporate Governance Guidelines, the Board waived the mandatory retirement restriction for Mr. Mitau in 2023 until the expiration of his current term because his continued service would be beneficial to the Company.
In 2023, Mr. Handley transitioned from Chief Operating Officer to Senior Advisor of Cascade Asset Management Company and submitted his resignation for consideration in accordance with our Corporate Governance Guidelines. The Board considered Mr. Handley’s resignation and the recommendation of the Corporate Governance and Nominating Committee and determined not to accept Mr. Handley’s resignation because his continued service would be beneficial to the Company.
BOARD PERFORMANCE EVALUATION
The Board of Directors has a practice of annually reviewing its performance, and the performance of its committees and individual directors. Extensive input is received from each director during these annual performance reviews, as well as during the year, through written evaluation forms and other informal means of communication with the Chairman and other members of the Board.
CODE OF BUSINESS CONDUCT
We have a Code of Business Conduct applicable to all our directors and employees, including our principal executive officer, principal financial officer, and principal accounting officer. A copy of this Code of Business Conduct is available for review on our website (www.hbfuller.com) in the “Governance” section of the Investor Relations page.
COMMUNICATIONS WITH DIRECTORS
Interested parties may contact the Board, any Board committee, the Chairman, or any independent director, by communicating through the Corporate Secretary, whose contact information may be found on page 67. The Corporate Secretary reviews all communications, and after ascertaining whether such communications are appropriate to the duties and responsibilities of the Board, will forward such correspondence to the directors for their information and consideration. The Board has requested that the Corporate Secretary not forward the following types of communications to the Board: general solicitations for business or products; job applications or resumes; advertisements, junk mail, and surveys; and any other communication that does not relate to the responsibilities of the Board.
H. B. FULLER | 2024 Proxy Statement 19
CERTAIN RELATIONSHIPS AND RELATED
TRANSACTIONS
The Board of Directors has a written policy and procedures for the review, approval, or ratification of transactions with executive officers, directors and nominees for director, any person who is a security holder known to us to be the beneficial owner of more than five percent of any class of our stock, and immediate family members of these parties. In general, the policy provides that certain transactions with these related persons are subject to the review and prior approval of the disinterested members of the Audit Committee. If a transaction with a related party is entered into without the pre-approval of the Audit Committee, it shall not be deemed to be invalid or unenforceable, so long as the transaction is brought to the Audit Committee for ratification as promptly as reasonably practical after it is entered into or brought to the Company’s attention. Management shall make all reasonable efforts to cancel or annul the transactions that are not pre-approved or ratified.
All executive officers and directors of H.B. Fuller are informed in writing on an annual basis of these policies and procedures. The Audit Committee may use any process and review any information that it determines is reasonable to determine if a transaction is fair and reasonable and on terms no less favorable to H.B. Fuller than could be obtained in a comparable arm’s length transaction with a third party unrelated to H.B. Fuller.
In addition, on an annual basis, each of our directors and executive officers completes a questionnaire and discloses information regarding entities with which they and their immediate family members are affiliated. Any person nominated for election as a director must complete a questionnaire no later than the date he or she becomes a member of the Board of Directors. Any person who becomes an executive officer must complete a questionnaire as soon as reasonably practicable thereafter.
Our Audit Committee annually reviews all transactions and relationships including any disclosed in the director and officer questionnaires and approves or ratifies, as applicable, any transactions with related persons. The Board of Directors makes a formal determination regarding each director’s independence.
During fiscal year 2023, we had transactions, arrangements, and relationships with entities with which some of our related persons, specifically certain of our directors, are affiliated. See the description of these transactions under "Director Independence." However, in accordance with the procedures in the Company’s policy, the Audit Committee determined that those related persons had no direct or indirect material interest in those transactions, arrangements, and relationships.
H. B. FULLER | 2024 Proxy Statement 20
DIRECTOR COMPENSATION
The form and amount of compensation for each non-employee director is typically determined and reviewed annually by the Compensation Committee. Such compensation reflects the practices of boards in our peer group and is comprised of cash and Common Stock (or its equivalents). It is our practice to generally align to the market median/50th percentile among our peer companies.
2023 REVIEW OF DIRECTOR COMPENSATION
The Compensation Committee uses an independent compensation consultant to provide ongoing advice and information regarding design and implementation of the Company’s non-employee director compensation programs as requested by the Compensation Committee. See further discussion regarding the Compensation Committee’s independent consultant under the heading “Independent Compensation Consultant” in the “Compensation Discussion and Analysis” section in this Proxy Statement. The Compensation Committee periodically conducts an in-depth market review, including board retainers, committee chair retainers, and annual stock-based awards.
After review of market data during fiscal 2023, the Committee approved an increase in the value of the annual equity award from $135,000 to $150,000 and also approved increasing the Compensation Committee Chair retainer from $15,000 to $17,500.
CASH FEES
The retainers paid to our non-employee directors are set forth in the table below. Non-employee directors may elect to defer their retainers into deferred phantom stock units or other deferred investments. If the director elects to defer their cash retainers into phantom stock units, the number of phantom stock units received equals the cash retainer divided by the closing price of a share of the Company common stock on the payment date, plus the Company’s 10% matching contribution as described below under “Directors’ Deferred Compensation Plan.” Our President and Chief Executive Officer does not receive separate compensation for serving as a director or for attendance at any Board meeting.
|
Annual Cash Retainers
|
|
|
|
|
|
Board Member
|
|
$ |
100,000 |
|
|
Non-Executive Chairman
|
|
$ |
100,000 |
|
|
Audit Committee Chair
|
|
$ |
20,000 |
|
|
Compensation Committee Chair
|
|
$ |
17,500 |
|
|
Corporate Governance and Nominating Committee Chair
|
|
$ |
15,000 |
|
EQUITY AWARDS
In addition to the board and chair retainers described above, the Board believes it is important that each director have an economic stake in our common stock. As a result, the Compensation Committee typically makes an annual grant of deferred phantom stock units to each non-employee director, which pays out in shares of common stock under the terms of the DDCP, and pursuant to elections made by each director. This plan is described below.
On July 5, 2023, the Compensation Committee made an award in the amount of $150,000 to each non-employee director. This amount was divided by the fair market value of the common stock on the date of grant to determine the number of deferred phantom stock units awarded under the DDCP. These deferred phantom stock units are not subject to forfeiture.
H. B. FULLER | 2024 Proxy Statement 21
DIRECTOR COMPENSATION
In addition, each non-employee director typically receives a one-time grant of restricted stock units upon his or her initial election to the Board. These RSU awards are granted under our 2020 Incentive Plan, which is described below. In general, these awards vest three years from the date of grant subject to continued service during that period. These RSU awards vest in full upon death or disability and forfeit upon resignation prior to a vesting date.
|
Equity Awards
|
|
|
Discretionary Annual Award of Deferred Phantom Stock Units
|
Valued at $150,000
|
|
One-time Initial Award of Restricted Stock Units
|
1,300 units
|
DIRECTORS’ DEFERRED COMPENSATION PLAN
Under the DDCP, non-employee directors may elect to defer all or a percentage of their Board and chair retainers into several investments. Deferred amounts are credited with gains and losses based on the performance of certain mutual funds or the common stock as elected by the director prior to deferring any retainers. Non-employee directors who elect to defer their retainers into phantom stock units will eventually be paid out in shares of common stock. Phantom stock units are credited with dividend equivalents equal to the number of dividends, if any, paid on an equal number of shares of the common stock. The dividend equivalents are converted into additional phantom stock units based on the fair market value of common stock on the dividend payment date. If a participant elects to defer retainers into the common stock account in this plan, we make a 10% matching contribution of additional phantom stock units to the amount invested in common stock by the non-employee director. The phantom stock units credited to the non-employee directors’ accounts do not have voting rights. In addition, the Compensation Committee may make discretionary contributions to a participant’s H.B. Fuller common stock account under this plan. As described above, during fiscal year 2023, the Compensation Committee exercised this discretion and awarded each non-employee director 2,197.48 deferred phantom stock units having a grant date fair value of $150,000 under this plan.
Any amounts deferred under this plan are paid in shares of common stock or cash (depending on the election made by the non-employee director) at the earliest to occur of:
|
●
|
the later of the date of the non-employee director’s retirement (that is, the date of resignation or removal from the Board or the end of the non-employee director’s elected term) or such other date as elected and specified by the non-employee director, which is subject to approval by the Compensation Committee and is made only at the time of the non-employee director’s initial elections and is irrevocable;
|
|
●
|
the date of a change in control of H.B. Fuller; or
|
|
●
|
the date of termination of the plan.
|
2020 INCENTIVE PLAN
Under the 2020 Incentive Plan, we may issue to non-employee directors restricted stock, restricted stock units, options, stock appreciation rights, performance awards, or other stock-based awards. In addition, shares of H.B. Fuller common stock are issued under this plan to satisfy any requirements under the DDCP.
PHYSICAL EXAMINATIONS
Non-employee directors are reimbursed for a preventative/diagnostic annual physical examination and local travel expenses. These amounts are shown in the “All Other Compensation” column of the “Director Compensation Table” in this Proxy Statement.
MATCHING GIFTS TO EDUCATIONAL, ARTS AND CULTURAL ORGANIZATIONS
Under this program, we match a non-employee director’s contribution (up to $1,000) to eligible educational, arts and cultural institutions. These amounts are shown in the “All Other Compensation” column of the “Director Compensation Table” in this Proxy Statement.
H. B. FULLER | 2024 Proxy Statement 22
DIRECTOR COMPENSATION
DIRECTOR COMPENSATION TABLE – FISCAL YEAR 2023
| |
Fees Earned
|
|
|
|
| |
or Paid in
|
Stock
|
All Other
|
|
| |
Cash
|
Awards
|
Compensation
|
Total
|
|
Name
|
($)1
|
($)2
|
($)3
|
($)
|
|
Daniel L. Florness
|
100,000 |
158,000 |
168 |
258,168 |
|
Thomas W. Handley
|
120,000 |
162,000 |
168 |
282,168 |
|
Michael J. Happe
|
100,000 |
150,431 |
1,242 |
251,673 |
|
Ruth S. Kimmelshue
|
115,625 |
161,563 |
168 |
277,356 |
|
Charles T. Lauber4
|
100,000 |
238,621 |
1,220 |
339,841 |
|
Lee R. Mitau
|
215,000 |
171,500 |
168 |
386,668 |
|
Teresa J. Rasmussen
|
100,000 |
159,570 |
1,242 |
260,812 |
|
Srilata Zaheer
|
100,000 |
150,000 |
4,098 |
254,098 |
| (1) |
The amounts included in this column include retainers deferred into deferred phantom stock units at the election of the director. Elections are made on a calendar year basis. For calendar year 2023: Mr. Lauber and Ms. Zaheer elected to receive their retainers in cash; Mr. Happe elected to receive his retainer in cash with the exception of a pro-rated deferral in the first quarter into deferred phantom stock units; Mr. Florness elected to receive 20% of his retainer in cash and 80% in deferred phantom stock units; Mr. Handley, Ms. Kimmelshue, and Mr. Mitau elected to receive 100% of their retainers in deferred phantom stock units; and Ms. Rasmussen elected to defer 100% of her retainer into deferred phantom stock units with the exception of a prorated deferral in the first quarter into an investment in the DDCP. |
|
(2)
|
The amounts in this column are calculated based on the fair market value of the common stock on the date the award was made in accordance with Financial Accounting Standards Board Accounting Standards Codification Topic 718 (“FASB ASC Topic 718”). Each non-employee director received an award of 2,197.48 deferred phantom stock units on July 5, 2023 with a grant date fair value of $150,000. For Mr. Lauber, the amount also includes an award of 1,300 RSUs granted in connection with his initial election to the Board. For those directors who elect to defer all or a portion of their retainers into deferred phantom stock units, the Company makes a 10% matching contribution of additional phantom stock units. These amounts are also included in this column. This column does not include any dividend equivalents.
|
The aggregate number of deferred phantom stock units and restricted stock units held by each non-employee director as of December 2, 2023 were as follows:
| |
Deferred
|
| |
Phantom
|
| |
Stock Units and
|
| |
Restricted Stock Units
|
|
Name
|
(#)
|
|
Daniel L. Florness
|
21,516 |
|
Thomas W. Handley
|
66,324 |
|
Michael J. Happe
|
7,431 |
|
Ruth S. Kimmelshue
|
23,655 |
|
Charles T. Lauber
|
2,210 |
|
Lee R. Mitau
|
202,096 |
|
Teresa J. Rasmussen
|
9,659 |
|
Srilata A. Zaheer
|
4,492 |
No non-employee director held any stock options as of December 2, 2023. Mr. Happe, Mr. Lauber, and Ms. Zaheer held RSUs as of fiscal 2023 year end. As of December 2, 2023, Mr. Happe held 1,343 RSUs, Mr. Lauber held 1,315 RSUs and Ms. Zaheer held 1,326 RSUs.
|
(3)
|
These amounts represent the following: for Mr. Florness, a gift in the amount of $106 and $62 for accident/travel insurance; for Mr. Handley, a gift in the amount of $106 and $62 for accident/travel insurance; for Mr. Happe, dividends paid on unvested restricted stock units in the amount of $1,074, a gift in the amount of $106, and $62 for accident/travel insurance; for Ms. Kimmelshue, a gift in the amount of $106 and $62 for accident/travel insurance; for Mr. Lauber, dividends paid on unvested restricted stock units in the amount of $1,052, a gift in the amount of $106, and $62 for accident/travel insurance; for Mr. Mitau, a gift in the amount of $106 and $62 for accident/travel insurance; for Ms. Rasmussen, dividends paid on unvested restricted stock units in the amount of $1,074, a gift in the amount of $106, and $62 for accident/travel insurance; and for Ms. Zaheer, dividends paid on unvested restricted stock units in the amount of $1,061, a physical in the amount of $2,869, a gift in the amount of $106, and $62 for accident/travel insurance.
|
|
(4)
|
Mr. Lauber was initially elected to the Board effective January 23, 2023.
|
STOCK OWNERSHIP GUIDELINES
We have goals for stock ownership for all non-employee directors. Our goal for non-employee director stock ownership is five times the annual Board retainer within five years of becoming a director. A review of director stock ownership was conducted using June 30, 2023 stock values. At the time of this review, all non-employee directors have met or exceeded this goal or are on track to meet this goal within five years of being elected as a director.
H. B. FULLER | 2024 Proxy Statement 23
SECURITY OWNERSHIP OF CERTAIN
BENEFICIAL OWNERS AND MANAGEMENT
The following table shows how many shares of common stock each director and NEO beneficially owned as of January 29, 2024. The table also shows the beneficial ownership of common stock by all directors and executive officers of H.B. Fuller as a group. In general, “beneficial ownership” includes those shares of common stock which a director or executive officer has the power to vote or invest, as well as stock options that are exercisable currently or within 60 days and common stock underlying phantom stock units, RSUs and PSUs that may be acquired, in certain circumstances, within 60 days. The detail of beneficial ownership is set forth in the following table. In addition, the table shows all shareholders known to us to be the beneficial owners of more than 5% of the outstanding shares of common stock.
Unless otherwise noted, the shareholders listed in the table have sole voting and investment power with respect to the shares of common stock owned by them, and the shares beneficially owned by our directors and executive officers are not subject to any pledge.
| |
|
Amount and
|
|
|
|
| |
|
Nature of
|
|
|
Percent of
|
| |
|
Beneficial
|
|
|
Common Stock
|
|
Name of Beneficial Owner
|
|
Ownership
|
|
|
Outstanding
|
|
BlackRock, Inc.
|
|
8,429,2171
|
|
|
15.53%
|
| The Vanguard Group, Inc. |
|
6,532,5042 |
|
|
12.04% |
|
State Street Corporation
|
|
3,002,7723
|
|
|
5.53%
|
| |
|
|
|
|
|
|
Daniel L. Florness
|
|
22,5984
|
|
|
*
|
|
Thomas W. Handley
|
|
22,6904
|
|
|
*
|
|
Michael J. Happe
|
|
8,6814
|
|
|
*
|
|
Ruth S. Kimmelshue
|
|
8,1694
|
|
|
*
|
|
Charles T. Lauber
|
|
2,1834
|
|
|
*
|
|
Lee R. Mitau
|
|
105,9294,5
|
|
|
*
|
|
Teresa J. Rasmussen
|
|
3,2974
|
|
|
*
|
|
Srilata A. Zaheer
|
|
4,4364
|
|
|
*
|
|
Celeste B. Mastin
|
|
36,0816
|
|
|
*
|
|
John J. Corkrean
|
|
259,1627
|
|
|
*
|
|
Zhiwei Cai
|
|
175,3268
|
|
|
*
|
|
James J. East
|
|
41,0089
|
|
|
*
|
|
Traci L. Jensen
|
|
163,80410
|
|
|
*
|
|
All directors and executive officers as a group (17 people)
|
|
1,080,64711
|
|
|
1.96%
|
|
*
|
Indicates less than 1%.
|
|
(1)
|
This information is based on a Schedule 13G/A filed with the SEC on January 22, 2024 reporting beneficial ownership as of December 31, 2023. BlackRock, Inc., a parent holding company, reported that it has sole voting power over 8,335,617 shares and sole dispositive power 8,429,217 shares. The holder’s address is 50 Hudson Yards, New York, New York 10001. As disclosed in the Schedule 13G/A, BlackRock’s position includes shares held on behalf of iShares Core S&P Small-Cap ETF, constituting more than five percent of our total outstanding common stock.
|
|
(2)
|
This information is based on a Schedule 13G/A filed with the SEC on February 13, 2024 reporting beneficial ownership as of December 31, 2023. The Vanguard Group, Inc., an investment adviser, reported that it has shared voting power over 93,304 shares, sole dispositive power over 6,381,719 shares and shared dispositive power over 150,715 shares. The holder’s address is 100 Vanguard Blvd., Malvern, Pennsylvania 19355.
|
|
(3)
|
This information is based on a Schedule 13G/A filed with the SEC on January 24, 2024 reporting beneficial ownership as of December 31, 2023. State Street Corporation, a holding company, reported that it has shared voting power over 2,794,360 shares and shared dispositive power over 3,002,772 shares. The holder’s address is State Street Financial Center, 1 Congress Street, Suite 1, Boston, Massachusetts 02114-2016.
|
H. B. FULLER | 2024 Proxy Statement 24
SECURITY OWNERSHIP OF CERTAIN BENEFICIAL OWNERS AND MANAGEMENT
|
(4)
|
Includes shares of common stock subject to phantom stock units credited to the accounts of non-employee directors who participate in the DDCP, described under the heading “Director Compensation,” that may be acquired, in certain circumstances, within 60 days. The number of units credited to each director participating in this plan that may be acquired within 60 days is as follows:
|
|
Daniel L. Florness
|
21,247 |
Charles T. Lauber
|
2,183 |
|
Thomas W. Handley
|
21,343 |
Lee R. Mitau
|
63,258 |
|
Michael J. Happe
|
7,338 |
Teresa J. Rasmussen
|
954 |
|
Ruth S. Kimmelshue
|
6,818 |
Srilata A. Zaheer
|
4,436 |
Excludes shares of common stock subject to phantom stock units credited to the accounts of directors who participate in the DDCP, described under the heading “Director Compensation” that may not be acquired within 60 days. The number of units credited to each director participating in this plan that are excluded from the table is as follows:
|
Daniel L. Florness
|
269 |
Charles T. Lauber
|
27 |
|
Thomas W. Handley
|
44,981 |
Lee R. Mitau
|
138,838 |
|
Michael J. Happe
|
93 |
Teresa J. Rasmussen
|
8,705 |
|
Ruth S. Kimmelshue
|
16,837 |
Srilata A. Zaheer
|
56 |
| |
None of the phantom stock units are entitled to vote at the meeting.
|
|
(5)
|
Includes 42,671 shares held by a grantor retained annuity trust.
|
|
(6)
|
Includes 32,316 shares that could be purchased pursuant to stock options within 60 days from January 29, 2024, including, in the case of retirement-eligible officers, options vesting upon retirement from the Company.
|
|
(7)
|
Includes 211,975 shares that could be purchased pursuant to stock options within 60 days from January 29, 2024, including, in the case of retirement-eligible officers, options vesting upon retirement from the Company.
|
|
(8)
|
Includes 140,018 shares that could be purchased pursuant to stock options within 60 days from January 29, 2024, including, in the case of retirement-eligible officers, options vesting upon retirement from the Company.
|
|
(9)
|
Includes 103 shares held in trust under the 401(k) Plan and 31,597 shares that could be purchased pursuant to stock options within 60 days from January 29, 2024, including, in the case of retirement-eligible officers, options vesting upon retirement from the Company.
|
| (10) |
Includes 150,751 shares that could be purchased pursuant to stock options within 60 days from January 29, 2024, including, in the case of retirement-eligible officers, options vesting upon retirement from the Company. |
|
(11)
|
Includes 103 shares held in trust under the 401(k) Plan, 756,110 shares that could be purchased pursuant to stock options within 60 days from January 29, 2024, including, in the case of retirement-eligible officers, options vesting upon retirement from the Company and 127,577 phantom stock units credited to directors’ individual H.B. Fuller common stock accounts under the Directors’ Deferred Plan that may be acquired, in certain circumstances, within 60 days.
|
H. B. FULLER | 2024 Proxy Statement 25
DELINQUENT SECTION 16(a) REPORTS
Section 16(a) of the Exchange Act requires the Company’s directors, executive officers and any beneficial owners of more than ten percent of our common stock to file initial reports of ownership and reports of changes in ownership of H.B. Fuller’s securities with the SEC. These reports are available for review on our website (www.hbfuller.com) in the “Financials” section of the Investor Relations page. We review these reports on the SEC’s website. Based solely on a review of these reports and written representations from the directors and executive officers, we believe that all directors and executive officers complied with all Section 16(a) filing requirements on a timely basis, except that James J. East had one delinquent filing covering one transaction due to administrative oversight.
AUDIT COMMITTEE REPORT
Pursuant to its charter, the Audit Committee of the Board of Directors is responsible for the appointment, compensation, and oversight of the work of our independent registered public accounting firm. In the exercise of that authority, we, the members of the Audit Committee, determined to engage Ernst & Young LLP to serve as H.B. Fuller’s independent registered public accounting firm for the year ended December 2, 2023.
Management is responsible for the financial reporting process, accounting principles, and internal controls and procedures designed to assure compliance with accounting standards and applicable law and regulation. Management represented to us that H.B. Fuller’s consolidated financial statements were prepared in accordance with accounting principles generally accepted in the United States of America.
Ernst & Young LLP, as H.B. Fuller’s independent registered public accounting firm for fiscal year 2023, was responsible for performing an independent audit of the consolidated financial statements and the company’s internal control over financial reporting in accordance with the standards of the Public Company Accounting Oversight Board (United States) and issuing reports.
We have reviewed and discussed the audited consolidated financial statements with management and Ernst & Young LLP. We have also discussed with Ernst & Young LLP the matters required to be discussed pursuant to applicable requirements of the Public Company Accounting Oversight Board and the SEC, and they have discussed with us their independence and provided to us the written disclosures and the letter required by applicable requirements of the Public Company Accounting Oversight Board regarding the independent accountant’s communications with the Audit Committee concerning independence.
Based upon our review and discussions referred to above, we recommended to the Board of Directors that the audited consolidated financial statements be included in H.B. Fuller’s Annual Report on Form 10-K for the fiscal year ended December 2, 2023 filed with the SEC.
Audit Committee of the Board of Directors of H.B. Fuller Company
|
Thomas W. Handley (Chair)
|
Charles T. Lauber
|
|
Daniel L. Florness
|
Teresa J. Rasmussen
|
|
Ruth S. Kimmelshue
|
Srilata A. Zaheer
|
H. B. FULLER | 2024 Proxy Statement 26
FEES PAID TO INDEPENDENT REGISTERED
PUBLIC ACCOUNTING FIRM
The following table presents fees for professional services provided by Ernst & Young LLP for fiscal year 2023 and fiscal year 2022 for the audit, audit-related, and tax services rendered to us and our affiliates.
| |
|
2023
|
|
|
2022
|
|
|
Audit Fees
|
|
$ |
3,913,165 |
|
|
$ |
3,193,604 |
|
|
Audit-Related Fees
|
|
|
- |
|
|
|
- |
|
|
Tax Fees
|
|
|
1,360,954 |
|
|
|
2,094,333 |
|
Audit Fees: Audit fees includes fees and expenses billed and to be billed for (i) the audit of the consolidated financial statements included in our annual report on Form 10-K, (ii) the audit of the effectiveness of our internal control over financial reporting, (iii) reviews of the interim consolidated financial information included in our quarterly reports on Form 10-Q, (iv) statutory audits of certain international subsidiaries, and (v) consultations concerning financial accounting and reporting. Audit fees also include fees for reviews of documents filed with the SEC.
Audit-Related Fees: Audit-related fees include fees and expenses for services related to registration statements.
Tax Fees: Tax Fees includes fees and expenses for U.S. federal, state and international tax planning and tax compliance services.
The Audit Committee is responsible for appointing, setting compensation for, and overseeing our independent registered public accounting firm’s work. The Audit Committee has established a policy requiring its pre-approval of all audit and permissible non-audit services provided by our independent registered public accounting firm, and it pre-approved all audit, audit-related, and tax services provided to us that are described above. The policy provides for the general pre-approval of specific types of services, gives detailed guidance to management as to the specific services that are eligible for general pre-approval, and establishes requirements for annual pre-approval levels and subsequent specific pre-approval requests. The policy requires specific pre-approval of all other permitted services. For both types of pre-approval, the Audit Committee considers whether such services are consistent with the rules of the SEC on auditor independence. The Audit Committee’s charter delegates to its chair the authority to address any requests for pre-approval of services between Audit Committee meetings, and the chair must report any pre-approval decisions to the Audit Committee at its next scheduled meeting. The policy prohibits the Audit Committee from delegating to management the Audit Committee’s responsibility to pre-approve any permitted services.
Requests for pre-approval for services that are eligible for general pre-approval must be submitted to our Vice President, Controller and Principal Accounting Officer and be detailed as to the services to be provided and the estimated total cost. The Vice President, Controller and Principal Accounting Officer then determines whether the services requested fall within the detailed guidance of the Audit Committee in the policy as to the services eligible for general pre-approval. Our independent registered public accounting firm and management must report to the Audit Committee on a timely basis regarding the services provided by the independent public accounting firm in accordance with general pre-approval.
We have a policy of avoiding the engagement of our independent registered public accounting firm except for audit, audit-related and tax planning, and compliance services. All the services provided by our independent registered public accounting firm in fiscal years 2023 and 2022 were pre-approved by the Audit Committee under its pre-approval procedures.
H. B. FULLER | 2024 Proxy Statement 27
PROPOSAL 2—RATIFICATION OF
APPOINTMENT OF INDEPENDENT
REGISTERED PUBLIC ACCOUNTING FIRM
The Audit Committee has appointed Ernst & Young LLP as our independent registered public accounting firm for the fiscal year ending November 30, 2024. While we are not required to do so, H.B. Fuller is submitting the appointment of Ernst & Young LLP for ratification to ascertain the views of our shareholders. If shareholders do not ratify the Audit Committee’s appointment of Ernst & Young LLP as our independent registered public accounting firm, the Audit Committee intends to reconsider that appointment. However, the Audit Committee retains sole responsibility for appointing or terminating our independent registered public accounting firm.
Representatives of EY will be present at the Annual Meeting and will have the opportunity to make a statement if they desire to do so and to respond to appropriate questions from shareholders.
| |
|
The Board of Directors recommends a vote FOR ratification of the appointment of Ernst & Young LLP.
|
H. B. FULLER | 2024 Proxy Statement 28
EXECUTIVE COMPENSATION
COMPENSATION DISCUSSION AND ANALYSIS
Executive Summary
This Compensation Discussion and Analysis describes our executive compensation program, including its underlying philosophy, policies, and practices; significant executive compensation developments during the fiscal year; and the determinations made on material elements of compensation awarded to each of our NEOs for fiscal year 2023:
|
|
Celeste B. Mastin
President and CEO
|
|
John J. Corkrean
EVP and CFO
|
|
Traci L. Jensen
EVP and CAO
|
| |
|
|
|
|
|
| |
|
Zhiwei Cai
EVP, Engineering Adhesives
|
|
James J. East
EVP, Hygiene, Health and
Consumable Adhesives
|
This discussion and analysis focuses on fiscal 2023 compensation actions disclosed in the following compensation tables and accompanying footnotes and narrative. We discuss compensation actions taken during other fiscal years to the extent they enhance the understanding of our executive compensation program for fiscal year 2023.
Elements of Executive Compensation. We use base salary, a short-term incentive plan with cash awards (“STIP”) and a long-term incentive plan with equity grants (“LTIP”), as well as benefits, to attract and motivate our executive officers to achieve results that increase shareholder value. We generally align with the market median for base salary, short-term incentive target values, and long-term incentive target values, which comprise total direct compensation, and we review these elements each year. The emphasis on short-term and long-term incentive compensation reflects our pay-for-performance philosophy. See "Key Elements of Executive Compensation Program" on page 34.
Fiscal Year 2023 Business Results.
We demonstrated resilience and determination in executing our winning strategy in the face of significant headwinds, including continued raw material cost inflation, a challenging macroeconomic climate, and higher interest rates. Throughout the year, we experienced unprecedented customer inventory de-stocking actions, increasing interest rates, and headwinds from foreign currency translation.
We are proud of the financial results we delivered in fiscal 2023, compared to fiscal 2022:
|
●
|
Net revenue of $3.51 billion, down 6.4%;
|
|
●
|
Net income of $145 million, down 19.6%;
|
|
●
|
EPS of $2.59, with Adjusted EPS of $3.87;
|
|
●
|
Adjusted EBITDA of $581 million, up 10%;
|
|
●
|
Operating cash flow of $378 million, up 48%; and
|
for the 54th consecutive year, we implemented an increase in the amount of quarterly cash dividends paid to shareholders, with an 8% increase this year.
Despite the challenges described above, we delivered double-digit growth in adjusted EBITDA and operating cash flow in fiscal year 2023, driven by management of changing price and raw material dynamics, decisive restructuring measures, and strong execution. We achieved a fiscal year record high adjusted EBITDA margin of 16.5%.
Highlights of our business performance by segment include the following:
|
●
|
Within our Hygiene, Health and Consumable Adhesives segment, which accounted for 45% of our net revenue, segment revenue totaled $1,601 million, a decrease of 6%, and segment Adjusted EBITDA totaled $276 million, an increase of 23%.
|
|
●
|
Within our Engineering Adhesives segment, which accounted for 41% of our net revenue, segment revenue totaled $1,429 million, a decrease of 7%, and segment Adjusted EBITDA totaled $256 million, an increase of 8%. |
|
●
|
Within our Construction Adhesives segment, which accounted for 14% of our net revenue, segment revenue totaled $481 million, a decrease of 8%, and segment Adjusted EBITDA totaled $56 million, a decrease of 25%.
|
H. B. FULLER | 2024 Proxy Statement 29
EXECUTIVE COMPENSATION
Adjusted EPS and Adjusted EBITDA are defined in "Fiscal 2023 Short-Term Incentive Compensation." These metrics are non-GAAP financial metrics that are reconciled with the most directly comparable GAAP financial metrics in Annex A.
STIP Performance Metrics. For our short-term incentive plan, we measure our success primarily by the Company-wide financial metrics which are aligned with our long-term strategic plan. These metrics consist of Adjusted Net Revenue, Adjusted EBITDA, and Adjusted EPS. Adjusted Net Revenue is a measure of global sales generation, Adjusted EBITDA is a measure of operational effectiveness and profitability, and Adjusted EPS is an overall measurement of profitability and the effectiveness of the following growth strategies:
|
●
|
organic growth led by innovation and the sale of specialized adhesives solutions to specific market segments where we possess competitive strengths;
|
|
●
|
margin enhancement driven by effective pricing strategies for our products and expense management;
|
|
●
|
continuous improvement through projects that optimize our operational agility, cost structure and overall effectiveness; and
|
|
●
|
efficient deployment of cash generated by operations to repay debt balances and return additional value to shareholders.
|
The STIP targets for Adjusted EPS, Adjusted Net Revenue and Adjusted EBITDA are consistent with the Company’s strategic financial targets.
STIP Performance and Compensation Outcomes.
|
●
|
Company-wide STIP financial metrics were Adjusted Net Revenue, Adjusted EBITDA and Adjusted EPS, consistent with the Company's strategic financial targets, and they factored into short-term incentives for all our NEOs. We exceeded the threshold level for Adjusted EBITDA and Adjusted EPS and fell below the threshold level for Adjusted Net Revenue.
|
|
●
|
Operating segment STIP financial metrics were operating segment measures of Adjusted Net Revenue and Adjusted EBITDA and they factored into short-term incentives for our NEOs who led operating segments, meaning NEOs other than our CEO, CFO, and CAO. We exceeded the threshold level for Engineering Adhesives Adjusted EBITDA and fell below the threshold level for Engineering Adhesives Adjusted Net Revenue, and we exceeded the target level for Hygiene, Health and Consumable Adhesives Adjusted EBITDA and exceeded the threshold level for Hygiene, Health and Consumable Adhesives Adjusted Net Revenue.
|
|
●
|
Actual results on all STIP metrics are set forth in a table on page 37 of this Proxy Statement. STIP payments can range from 0% to 200% of target. In fiscal year 2023, the achievement of our financial metrics resulted in short-term cash incentive payouts for our CEO, CFO, and CAO of 50% of target and ranged from 49% to 87% of target for our other NEOs.
|
|
●
|
All short-term incentive awards earned for fiscal year 2023 are shown in the “Non-Equity Incentive Plan Compensation” column of the “Summary Compensation Table” later in this Proxy Statement.
|
Adjusted EPS, Adjusted Net Revenue, and Adjusted EBITDA are non-GAAP financial metrics that are defined in "Fiscal 2023 Short-Term Incentive Compensation" and reconciled with the most directly comparable GAAP financial metrics in Annex A.
LTIP Performance and Compensation Outcomes.
Long-term incentive awards are equity awards granted pursuant to the LTIP. The awards are comprised of NQSOs, RSUs, and PSUs.
|
●
|
25% of NEO equity awards are RSUs vesting in three annual installments (33%, 33%, and 34%).
|
|
●
|
50% of NEO equity awards are NQSOs vesting in three annual installments (33%, 33%, and 34%).
|
|
●
|
25% of NEO equity awards are PSUs cliff vesting at the end of a three year performance period. Performance-based payouts can range from 0% to 200% of target. The ROIC metric has a three-year target. Cliff vesting aligns with our focus on overall ROIC performance during the three-year performance period of the award, incentivizes long-term strategic thinking and behavior, and enhances the retention value of the award.
|
|
●
|
In fiscal year 2021, we established a three-year ROIC target of 8.2%. Actual ROIC for the three-year period of fiscal years 2021-2023 was 9.0%. Therefore, the grant vested at 120% of target based on the performance during the three-year period.
|
H. B. FULLER | 2024 Proxy Statement 30
EXECUTIVE COMPENSATION
|
●
|
All equity awards granted in fiscal year 2023 are shown in the “Grants of Plan-Based Awards During Fiscal 2023” table later in this Proxy Statement.
|
ROIC is a non-GAAP financial metric that is reconciled with the most directly comparable GAAP financial metric in Annex A.
Executive Compensation Highlights. The Company’s compensation program features the following:
|
●
|
25% of NEO equity awards are PSUs cliff vesting at the end of a three-year performance period;
|
|
●
|
A policy regarding “clawbacks” of executive and key manager incentive compensation if there is a restatement of the Company’s financial statements or if there is misconduct by an executive or key manager;
|
|
●
|
A prohibition on hedging, pledging, and certain other transactions in Company securities by directors and executive officers;
|
|
●
|
Policies for responsible share usage and governance of our equity compensation plans, including a prohibition on re-pricing of stock options;
|
|
●
|
A double trigger is required for accelerated equity vesting upon a change-in-control for equity grants to NEOs, beginning in mid-fiscal year 2018;
|
|
●
|
Removal of tax gross-up provisions from change-in-control agreements entered into beginning in mid-fiscal year 2018; and
|
|
●
|
Stock ownership goals of five times base salary for our CEO, three times base salary for our CFO, and two times base salary for our other executive officers. These goals are reviewed annually.
|
Philosophy
The philosophy of our executive compensation program is to provide a competitive compensation package that rewards executive officers for sustained financial and operating performance that creates long-term value for our shareholders. We have designed and implemented our compensation programs for our executive officers to meet three principal goals:
|
●
|
Attract and retain qualified executive officers;
|
|
●
|
Motivate these individuals to achieve short-term and long-term corporate goals, without undue risk-taking; and
|
|
●
|
Promote internally equitable treatment of our executive officers, while considering external competitiveness and differences in job responsibilities.
|
To meet these goals, the Company has established the following guidelines:
|
●
|
Pay compensation that is competitive with the practices of companies in a broad number of industries, including comparable companies in the chemical industry, with revenues comparable to our revenues;
|
|
●
|
Pay for performance by setting challenging performance goals for our executive officers and providing a short-term incentive plan that is based upon achievement of these goals; and
|
|
●
|
Provide long-term incentives in the form of stock options, restricted stock units, and performance stock units that are designed to increase long-term shareholder value by aligning the interests of our executive officers with those of our shareholders.
|
We consider the market median/50th percentile as a reference point when determining appropriate target total direct compensation for each NEO, while allowing deviations from the market median/50th percentile based on role, tenure and other individual-specific considerations.
H. B. FULLER | 2024 Proxy Statement 31
EXECUTIVE COMPENSATION
Use of Competitive Market Data
The Compensation Committee uses several surveys and peer group data points when it reviews executive compensation as described below. With respect to Peer Group Data, during fiscal 2023, the Compensation Committee reviewed the peer group below and did not make any changes for fiscal 2023. This year, we reviewed peer proxy data for 19 companies with a revenue range of $1.437 billion - $12.44 billion based on our fiscal year 2022 revenue and expectations for fiscal year 2023 revenue.
Use of Market Data in Fiscal 2023. When analyzing compensation paid to our NEOs, the Compensation Committee uses specific data that matches revenue and job responsibilities from the published sources discussed below, based on availability, by position. For fiscal year 2023, the data used by the Compensation Committee to review total compensation (base salary, STIP, LTIP, and high-level review of benefits and perquisites) for our executive officers showed that our total compensation was generally in line with the market data matched according to revenue and job responsibilities.
In addition, for the NEOs, management and the Compensation Committee supplements the data sources below with peer group data, as a reference point for compensation design considerations. This data is derived from the most recent Proxy Statement available for each peer company.
The Compensation Committee uses this data because it is considered reliable market information. When we refer to competitive market data in the rest of this Compensation Discussion and Analysis, unless otherwise noted, we are referring to the “General Survey Data” and the “Peer Group Data” discussed below.
General Survey Data. The Compensation Committee used published survey data from the following sources to analyze the appropriate level of compensation for our U.S.-based NEOs:
|
●
|
AON Radford ($1.50 - 4.99 billion revenue categories for corporate positions (excluding the CEO) and relevant revenue categories for non-corporate positions (other U.S.-based NEOs))
|
|
●
|
Willis Towers Watson ($1.00 - 6.00 billion revenue category for corporate positions (CEO, CFO, and CAO) and relevant revenue categories for non-corporate positions (other U.S.-based NEOs))
|
The Company participates in both surveys. The AON Radford database includes 4,661 companies and is titled "2023 AON Global Compensation Database.” This database is a global database and covers non-executive jobs as well. The Willis Towers Watson survey includes 797 companies and is titled "Willis Towers Watson 2022 General Industry Executive Survey Report – Compensation Data U.S.” and only includes executive jobs.
Peer Group Data. Our peer group used to inform fiscal 2023 target compensation consisted of comparable, publicly-traded companies with revenues between $1.437 - 12.44 billion (for the most recent fiscal year):
| |
Albemarle Corporation
|
Graco Inc.
|
|
| |
Aptar Group Inc.
|
Hexcel Corporation
|
|
| |
Ashland Global Holdings Inc.
|
International Flavors & Fragrances Inc.
|
|
| |
Avery Dennison Corporation
|
Nordson Corporation
|
|
| |
Avient Corporation
|
Olin Corporation
|
|
| |
Axalta Coating Systems Ltd.
|
RPM International Inc.
|
|
| |
Cabot Corporation
|
Sensient Technologies Corporation
|
|
| |
Celanese Corporation
|
The Chemours Company
|
|
| |
Donaldson Company, Inc.
|
Trinseo Plc
|
|
| |
FMC Corporation
|
|
|
Compensation Process
The Compensation Committee reviews and approves all elements of compensation for our CEO, considering the Board of Directors’ review and assessment of the performance of the CEO as well as competitive market data and information from our human resources personnel and the Compensation Committee’s independent compensation consultant. The Compensation Committee also reviews and approves all elements of compensation for our other executive officers using the sources noted above and considering the recommendations of the CEO.
H. B. FULLER | 2024 Proxy Statement 32
EXECUTIVE COMPENSATION
In determining the elements of the executive compensation program, the Compensation Committee selects performance measures that will motivate executives to enhance our performance, such as our earnings and revenue growth, and operating segment specific operational and financial performance. Other considerations include furthering our business objectives, fulfilling corporate responsibilities (including equity among executive officer positions and affordability), maintaining competitive practices and trends, and observing legal requirements. In deciding on the type and amount of compensation for each executive officer, the Compensation Committee focuses on both the current pay and the opportunity for future increases in pay and combines the compensation elements for each executive officer in a manner that optimizes the executive officer’s incentive to contribute to the Company's success.
The Compensation Committee on occasion meets with the CEO and/or certain other executive officers to obtain recommendations with respect to our compensation program, practices and packages for executive officers and directors. The Compensation Committee considers, but is not bound to and does not always accept, management’s recommendations with respect to executive compensation. The CEO typically attends the Compensation Committee’s meetings, except when their compensation package is discussed. In addition, the Compensation Committee also holds executive sessions not attended by any members of management, including the CEO.
Independent Compensation Consultant
The Compensation Committee may use outside compensation consultants to provide compensation advice, competitive survey data and other reference market information related to trends and competitive practices in executive compensation. The Compensation Committee engages Willis Towers Watson US LLC (“WTW”) to provide ongoing advice and information regarding design and implementation of the Company’s executive compensation programs as requested by the Compensation Committee. In addition, from time to time, management receives information from the independent compensation consultant in preparation for Compensation Committee meetings.
In fiscal year 2023, the Company paid WTW for services as noted below.
|
Services
|
|
Fees
|
|
|
Executive and Board Compensation Support
|
|
$237,577 |
|
|
North America Benefits Consulting, Administration and Actuarial Valuations
|
|
$584,673 |
|
|
EIMEA Retirement Plan Investment Advisory Services and Surveys
|
|
$169,654 |
|
WTW also provided broker services in fiscal year 2023 for insurance in Brazil but received no direct payment from the Company for those services.
All non-executive and board related services performed by WTW, along with their affiliated companies, were approved by management and performed at the direction of management in the ordinary course of business. In assessing the independence of WTW, the Compensation Committee considered the factors contained in the applicable SEC and NYSE rules, including the amount and nature of the additional consulting work provided to the Company by WTW and concluded that no conflict of interest exists that would prevent WTW from independently advising the Committee.
A representative of the independent compensation consultant generally attends Compensation Committee meetings to serve as a resource for the Compensation Committee. To encourage independent review and discussion of executive compensation matters, the Compensation Committee and its chair may request meetings with the independent compensation consultant in executive session without management present.
The Role of Shareholder Say on Pay Votes. The Company provides its shareholders with the opportunity to cast an annual advisory vote to approve the compensation of our named executive officers as disclosed in this Proxy Statement (a “Say on Pay Proposal”). At the Company’s Annual Meeting of Shareholders held in April 2023, 94% of the votes cast on the Say on Pay Proposal were voted in favor of the proposal. While shareholders have endorsed the Company’s executive compensation program, the Compensation Committee continually evaluates the program to ensure that it is designed to provide a competitive compensation package that rewards executive officers for sustained financial and operating performance that creates long-term value for our shareholders. The Compensation Committee will continue to consider the outcome of the Company’s Say on Pay Proposal votes in connection with its evaluation of the Company’s executive compensation program. The Compensation Committee will also continue to consider feedback received through the Company's regular engagement with investors, which has generally been positive, in connection with its evaluation of the Company's executive compensation program.
H. B. FULLER | 2024 Proxy Statement 33
EXECUTIVE COMPENSATION
Key Elements of the Executive Compensation Program
|
Element and Purpose
|
|
Features and Market Positioning
|
|
Base salary
|
|
|
| |
|
|
|
Attract and retain high caliber executive talent with competitive fixed compensation.
|
|
Each NEO’s job is positioned in a salary grade based upon market data and an analysis of the related job responsibilities. Salary ranges are established to generally reflect competitiveness at the market median/50th percentile. Within these salary ranges, base salaries are set considering the experience and skills each NEO brings to the position. Salary increases are determined considering individual performance and market conditions.
|
| |
|
|
|
Short-term incentive (cash)
|
|
|
| |
|
|
|
Aligns executive performance with achievement of annual company-wide financial goals and objectives, as well as operating segment goals and objectives. Payouts are dependent on achievement of predetermined annual financial performance goals.
|
|
Short-term incentive awards are set for each executive officer so that the expected payout at target performance levels would result in competitive market levels of such compensation. Payments under the STIP can range from no payment to a payment no higher than 200% of the target, based upon actual results.
The annual STIP is designed to achieve several goals, including emphasizing the Company’s commitment to competitive compensation practices, driving a high-performance culture, and ensuring accountability. The STIP places emphasis on achievement of financial metrics and focuses attention on business results. It also reinforces the importance of measurable and aligned goals and objectives.
|
|
Long-term incentive (equity awards)
|
|
|
| |
|
|
|
NQSOs, PSUs, and RSUs attract, retain, and reward high caliber executive talent; reward performance and promote ownership of common stock, and encourage long-term strategic decision making that is aligned with shareholder interests.
|
|
Our LTIP ties a significant portion of our executive officers’ total direct compensation to shareholder value creation, as measured by share price performance. The combination of NQSOs, PSUs, and RSUs provides performance-based rewards, strong alignment with our shareholders, and retention value. Appreciation of common stock increases value of equity awards. PSUs can pay out between 0% and 200% of target.
|
| |
|
|
|
Other Benefits (includes supplemental retirement and deferred compensation plans, severance, change-in-control, and other perquisites)
|
|
|
| |
|
|
|
Attract and retain high caliber executive talent. These benefits are not performance-based.
|
|
We provide NEOs market competitive perquisite and other benefit programs. Some of these benefits assist our executive officers so that they may efficiently use their time on our business. Our U.S.-based NEOs participate in the same health and welfare programs as all other U.S.-based Company employees.
|
Fiscal 2023 Base Salaries
In General. In January of each year, the Compensation Committee reviews and considers the annual performance of the CEO and the other NEOs. The effective date of annual merit increases is February 1st. In the fourth quarter of fiscal 2023, with the assistance of the compensation consultant, the Compensation Committee reviewed the total compensation (base salary, STIP, LTIP, and high-level review of benefits and perquisites) of all the executive officers for market competitiveness.
H. B. FULLER | 2024 Proxy Statement 34
EXECUTIVE COMPENSATION
The amount of annual base salary and year-over-year increase for each of the NEOs in fiscal year 2023 are set forth in the following table.
| |
|
|
|
|
|
|
|
|
|
Percent Increase
|
|
| |
|
Base Salary as of
|
|
|
Base Salary as of
|
|
|
from
|
|
| |
|
12/3/2022
|
|
|
12/2/2023
|
|
|
12/3/2022 to 12/2/2023
|
|
|
Named Executive Officer
|
|
($)
|
|
|
($)
|
|
|
(%)
|
|
| |
|
|
|
|
|
|
|
|
|
|
|
|
|
Celeste B. Mastin1
|
|
|
585,000 |
|
|
|
950,000 |
|
|
|
62.39 |
|
|
President and Chief
|
|
|
|
|
|
|
|
|
|
|
|
|
|
Executive Officer
|
|
|
|
|
|
|
|
|
|
|
|
|
| |
|
|
|
|
|
|
|
|
|
|
|
|
| |
|
|
|
|
|
|
|
|
|
|
|
|
|
John J. Corkrean
|
|
|
580,000 |
|
|
|
600,000 |
|
|
|
3.45 |
|
|
Executive Vice President
|
|
|
|
|
|
|
|
|
|
|
|
|
|
and Chief Financial Officer
|
|
|
|
|
|
|
|
|
|
|
|
|
| |
|
|
|
|
|
|
|
|
|
|
|
|
| |
|
|
|
|
|
|
|
|
|
|
|
|
|
Zhiwei Cai
|
|
|
560,000 |
|
|
|
576,800 |
|
|
|
3.0 |
|
|
Executive Vice President,
|
|
|
|
|
|
|
|
|
|
|
|
|
|
Engineering Adhesives
|
|
|
|
|
|
|
|
|
|
|
|
|
| |
|
|
|
|
|
|
|
|
|
|
|
|
| |
|
|
|
|
|
|
|
|
|
|
|
|
|
James J. East2
|
|
|
450,000 |
|
|
|
500,000 |
|
|
|
11.11 |
|
|
Executive Vice President,
|
|
|
|
|
|
|
|
|
|
|
|
|
|
Hygiene, Health and Consumable Adhesives
|
|
|
|
|
|
|
|
|
|
|
|
|
| |
|
|
|
|
|
|
|
|
|
|
|
|
| |
|
|
|
|
|
|
|
|
|
|
|
|
|
Traci L. Jensen3
|
|
|
390,000 |
|
|
|
500,000 |
|
|
|
28.21 |
|
|
Executive Vice President
|
|
|
|
|
|
|
|
|
|
|
|
|
|
and Chief Administrative Officer
|
|
|
|
|
|
|
|
|
|
|
|
|
| |
|
|
|
|
|
|
|
|
|
|
|
|
| |
(1)
|
Ms. Mastin was promoted to President and CEO effective December 4, 2022. Ms. Mastin previously served as Executive Vice President and Chief Operating Officer from March 7, 2022 through December 3, 2022. See discussion below under "Analysis of Fiscal 2023 Base Salaries and Incentive Targets."
|
| |
(2)
|
Mr. East was promoted to Executive Vice President, Hygiene, Health and Consumable Adhesives effective December 4, 2022. Mr. East previously served as Senior Vice President, Hygiene, Health and Consumable Adhesives through December 3, 2022. See discussion below under “Analysis of Fiscal 2023 Base Salaries, Retention Awards, and Incentive Targets.”
|
| |
(3)
|
Ms. Jensen was promoted to Executive Vice President and CAO effective December 4, 2022. Ms. Jensen previously served as Vice President, Global Business Process Improvement through December 3, 2022. See discussion below under “Analysis of Fiscal 2023 Base Salaries, Retention Awards, and Incentive Targets.” |
Analysis of Fiscal 2023 Base Salaries, Retention Awards, and Incentive Targets.
Ms. Mastin’s short-term incentive target is 120% of base salary and her long-term incentive target is 375% of base salary. Ms. Mastin was promoted to President and Chief Executive Officer on December 4, 2022 and received a salary of $950,000 as part of that promotion. Ms. Mastin did not receive an additional merit increase on February 1, 2023 due to her recent promotion.
Mr. Corkrean’s short-term incentive target increased from 75% to 80% of base salary based on a review of market data. His long-term incentive target remained at $1,000,000. Mr. Corkrean received a merit increase of 3.45% after a review of market data and his overall contributions to the Company. Mr. Corkrean’s base salary is in the third quartile of the salary range for his position.
Ms. Jensen was promoted to Executive Vice President and CAO on December 4, 2022 and received a salary of $500,000 as part of that promotion. Ms. Jensen did not receive an additional merit increase on February 1, 2023 due to her recent promotion. Ms. Jensen’s short-term incentive target is 70% of base salary and her long-term incentive target is $650,000. Ms. Jensen’s base salary is in the second quartile of the salary range for her position.
Due to a transition in CEO leadership during fiscal 2022, our Compensation Committee determined that a cash retention award for Ms. Jensen was appropriate to ensure stability and continuity in a key executive role throughout this transition and to position the Company for continued success in fiscal 2023. Therefore, Ms. Jensen received a $500,000 cash retention award payable within 60 days of December 4, 2024 conditional on Ms. Jensen being employed by the Company on such date. The retention award is shown in "Grants of Plan-Based Awards During Fiscal Year 2023."
Mr. Cai’s short-term incentive target increased from 65% to 70% of base salary based on a review of market data. His long-term incentive target is $650,000. Mr. Cai received a merit increase of 3.0% after a review of market data and his overall contributions to the Company. Mr. Cai’s base salary is in the fourth quartile of the salary range for his position.
Effective January 24, 2023, the Compensation Committee approved a one-time grant of time-based restricted stock units with an approximate grant date fair market value of $500,000 to Mr. Cai. Due to a transition in CEO leadership during fiscal 2022, our Compensation Committee determined that a retention stock award for Mr. Cai was appropriate to ensure stability and continuity in a key executive role throughout this transition and to position the Company for continued success in fiscal 2023. The time-based restricted stock units will cliff-vest on January 24, 2025 subject to Mr. Cai remaining employed by H.B. Fuller Company until the vesting date. There are no provisions for accelerated vesting of the units upon an earlier retirement. The retention award is shown in "Grants of Plan-Based Awards During Fiscal Year 2023."
H. B. FULLER | 2024 Proxy Statement 35
EXECUTIVE COMPENSATION
Mr. East was promoted to Executive Vice President, Hygiene, Health and Consumable Adhesives on December 4, 2022 and received a salary of $500,000 as part of that promotion. Mr. East did not receive an additional merit increase on February 1, 2023 due to his recent promotion. Mr. East’s short-term incentive target is 70% of base salary and his long-term incentive target is $650,000. Mr. East’s base salary is in the second quartile of the salary range for his position.
For fiscal year 2023, all merit increases for the NEOs who were eligible for merit increases fell within the Company’s general merit increase guidelines for our general employee population. The range of merit increases provided to NEOs who did not receive promotions at the beginning of fiscal 2023 was 3% to 3.45%.
Fiscal 2023 Short-Term Incentive Compensation
In General. Each year, the Compensation Committee establishes the annual cash incentive target opportunities as a percentage of base salary. Under the STIP, the Compensation Committee may also consider extraordinary circumstances that may positively or negatively impact the achievement of the performance objectives.
For fiscal year 2023, based on market data, the annual cash incentive target opportunity for our executive officers ranged from 70% to 120% of base salary at a target level of performance. Potential payouts range from 0% to 200% of the target award based on attainment of segment operating and/or Company-wide financial goals. The threshold level of performance for the annual cash incentive was set at 80% of each financial target, except the Adjusted Net Revenue metrics had a threshold level of 90% of target, meaning that financial performance must meet or exceed these thresholds for executive officers to earn at least 50% of the target incentive. Higher payouts are possible if performance is above target levels. For example, at the superior level of performance (110% of target for Adjusted Net Revenue and 120% of target for all other metrics), payout is 200% of target.
The Compensation Committee, in its discretion, has the right at any time to enhance, diminish or terminate all or any portion of any compensation plan or program, on a collective or individual basis for the NEOs.
Analysis of Fiscal 2023 Short-Term Incentive Awards. The Compensation Committee approved the STIP metrics because they were representative of our financial results and were key financial measures that are linked to our long-term strategic plan. In establishing the goals for these metrics for fiscal year 2023, we considered our prior year results, economic conditions, and expected business opportunities. At the beginning of fiscal year 2023, we believed the targets were challenging but achievable.
For fiscal year 2023, the goals for threshold, target, and superior level of performance, the weighting of the metrics, and the actual performance were as set forth below. These amounts are shown on a non-GAAP basis due to adjustments which are allowed under the STIP as set forth in a footnote in the table below. Actual amounts paid to each NEO are set forth in the “Summary Compensation Table’’ later in this Proxy Statement.
|
Metric
|
Weighting (%)
|
|
|
Threshold (50% Payout) ($)1
|
|
|
Target (100% Payout) ($)1 |
|
|
Superior (200% payout) ($)1 |
|
|
Actual Result ($)
|
|
|
% of Target
|
|
|
Payout Percentage
|
|
|
Adjusted EPS3
|
30
|
|
|
3.48 |
|
|
4.35 |
|
|
5.22 |
|
|
3.87 |
|
|
89.0 |
|
|
72.4 |
|
|
Adjusted Net Revenue4
|
35 |
|
|
3,380,487 |
|
|
3,756,097 |
|
|
4,131,707 |
|
|
3,350,734 |
|
|
89.2 |
|
|
0.0 |
|
|
Adjusted EBITDA5
|
35
|
|
|
480,000 |
|
|
600,000 |
|
|
720,000 |
|
|
555,626 |
|
|
92.6 |
|
|
81.5 |
|
H. B. FULLER | 2024 Proxy Statement 36
EXECUTIVE COMPENSATION
|
Named Executive Officer
|
|
Target Cash Incentive ($)
|
|
|
Target (%)
|
|
|
Actual Payout ($)2
|
|
|
Payout as a percent of Target (%)
|
|
|
Celeste B. Mastin
|
|
1,134,477 |
|
|
120 |
|
|
570,018 |
|
|
50.25 |
|
| |
|
|
|
|
|
|
|
|
|
|
|
|
|
John J. Corkrean
|
|
477,282 |
|
|
80 |
|
|
239,810 |
|
|
50.24 |
|
| |
|
|
|
|
|
|
|
|
|
|
|
|
|
Traci L. Jensen
|
|
348,726 |
|
|
70 |
|
|
175,217 |
|
|
50.25 |
|
|
Metric
|
Weighting (%)
|
|
|
Threshold (50% Payout) ($)1
|
|
|
Target (100% Payout) ($)1
|
|
|
Superior (200% payout) ($)1
|
|
|
Actual Result ($)
|
|
|
% of Target
|
|
|
Payout Percentage
|
|
|
Adjusted EPS3
|
30
|
|
|
3.48 |
|
|
4.35 |
|
|
5.22 |
|
|
3.87 |
|
|
89.0 |
|
|
72.4 |
|
| |
|
|
|
|
|
|
|
|
|
|
|
|
|
|
|
|
|
|
|
|
|
Engineering Adhesives Adjusted Net Revenue4
|
35
|
|
|
1,395,677 |
|
|
1,550,752 |
|
|
1,705,827 |
|
|
1,385,835 |
|
|
89.4 |
|
|
0.0 |
|
| |
|
|
|
|
|
|
|
|
|
|
|
|
|
|
|
|
|
|
|
|
|
Engineering Adhesives Adjusted EBITDA5
|
35
|
|
|
219,043 |
|
|
273,804 |
|
|
328,565 |
|
|
248,832 |
|
|
90.9 |
|
|
77.2 |
|
|
Named Executive Officer
|
|
Target Cash Incentive ($)
|
|
|
Target (%)
|
|
|
Actual Payout ($)2
|
|
|
Payout as a percent of Target (%)
|
|
|
Zhiwei Cai
|
|
401,762 |
|
|
70 |
|
|
195,819 |
|
|
48.7 |
|
|
Metric
|
Weighting (%)
|
|
|
Threshold (50% Payout) ($)1
|
|
|
Target (100% Payout) ($)1
|
|
|
Superior (200% payout) ($)1
|
|
|
Actual Result ($)
|
|
|
% of Target
|
|
|
Payout Percentage
|
|
|
Adjusted EPS3
|
30
|
|
|
3.48 |
|
|
4.35 |
|
|
5.22 |
|
|
3.87 |
|
|
89.0 |
|
|
72.4 |
|
| |
|
|
|
|
|
|
|
|
|
|
|
|
|
|
|
|
|
|
|
|
|
Hygiene, Health and Consumable Adhesives Adjusted Net Revenue4
|
35
|
|
|
1,498,856 |
|
|
1,665,395 |
|
|
1,831,935 |
|
|
1,505,774 |
|
|
90.4 |
|
|
52.1 |
|
| |
|
|
|
|
|
|
|
|
|
|
|
|
|
|
|
|
|
|
|
|
|
Hygiene, Health and Consumable Adhesives Adjusted EBITDA5
|
35
|
|
|
194,872 |
|
|
243,590 |
|
|
292,308 |
|
|
260,392 |
|
|
106.9 |
|
|
134.5 |
|
|
Named Executive Officer
|
|
Target Cash Incentive ($)
|
|
|
Target (%)
|
|
|
Actual Payout ($)2
|
|
|
Payout as a percent of Target (%)
|
|
|
James J. East
|
|
349,342 |
|
|
70 |
|
|
304,033 |
|
|
87.0 |
|
H. B. FULLER | 2024 Proxy Statement 37
EXECUTIVE COMPENSATION
|
(1)
|
All values in this column are in thousands except for Adjusted EPS. |
|
(2)
|
The actual cash incentive paid is also found in the “Non-Equity Incentive Plan Compensation” column of the “Summary Compensation Table” in this Proxy Statement. The short-term incentive award payment opportunity at each level of performance for our NEOs for fiscal year 2023 is shown in the “Grants of Plan-Based Awards During Fiscal Year 2023” table in this Proxy Statement.
|
|
(3)
|
Adjusted EPS is a non-GAAP financial measure which is defined as earnings per share adjusted to exclude unusual items referenced in Annex A. Management believes that these adjustments improve the comparability of period-to-period results and are consistent with how it evaluates the Company’s operating performance. Adjusted EPS is reconciled with the most directly comparable GAAP measure in Annex A.
|
|
(4)
|
Adjusted Net Revenue is a non-GAAP measure which is defined as net revenue as disclosed in the Company’s Annual Report on Form 10-K, adjusted to confirm with budgeted exchange rates as the basis of targets is U.S. dollars. Unbudgeted acquisitions and divestitures are excluded from the calculation. Management believes that these adjustments improve the comparability of period-to-period results and are consistent with how it evaluates the Company’s operating performance. Adjusted Net Revenue is reconciled with the most directly comparable GAAP measure in Annex A.
|
|
(5)
|
Adjusted EBITDA is a non-GAAP financial measure which is defined as adjusted net income plus adjusted income tax expense plus interest expense, net, plus depreciation expense plus amortization expense. Segment EBITDA is defined as segment operating income plus depreciation expense plus amortization expense, plus non-operating pension expense or income, plus reported Sekisui-Fuller joint venture equity earnings as reported on the consolidated Company P&L (if applicable), as reported in the Company’s earnings release. Basis of targets is U.S. dollars. Actual results are adjusted to conform with budgeted exchange rates. Unbudgeted acquisitions and divestitures are excluded from the calculation. Management believes that these adjustments improve the comparability of period-to-period results and are consistent with how it evaluates the Company’s operating performance. Adjusted EBITDA is reconciled to the most directly comparable GAAP measure in Annex A.
|
The following chart shows the percentage increase in fiscal year 2023 performance targets over fiscal year 2022 actual results for each metric used to determine the short-term incentive payouts:
| |
|
FY 2023 Target to FY
|
| |
|
2022 Actual Increase/Decrease
|
|
Adjusted EPS
|
|
8.75%
|
|
Company Adjusted Net Revenue
|
|
(3.04)%(1)
|
|
Company Adjusted EBITDA
|
|
12.51%
|
|
Engineering Adhesives Segment Adjusted Net Revenue
|
|
(3.53)%(1)
|
|
Engineering Adhesives Segment Adjusted EBITDA
|
|
11.96%
|
|
Hygiene, Health and Consumable Adhesives Adjusted Net Revenue
|
|
(7.16)%(1)
|
|
Hygiene, Health and Consumable Adhesives Adjusted EBITDA
|
|
3.8%
|
|
(1)
|
Fiscal year 2023 target is lower than fiscal year 2022 actual results due to expected negative foreign currency exchange effects.
|
Fiscal 2023 Long-Term Incentive Compensation
In General. For all NEOs, the fiscal year 2023 LTIP design included a mix of equity grants consisting of 50% NQSOs, 25% RSUs, and 25% PSUs issued under the 2020 Incentive Plan.
Stock Options. The NQSOs are focused on aligning shareholder value creation with executive rewards and enhancing employee retention, with vesting typically in three installments of 33%, 33%, and 34% on each anniversary date of the grant date if the optionee continues to be employed by the Company. Vested stock options provide a benefit to an executive officer only if the market value of the stock increases over the term of the option and if the executive officer remains employed with the Company, or once the executive officer becomes retirement eligible. Retirement eligibility is defined as 55 years of age and 10 years of service. If an NEO is retirement eligible, stock options immediately vest upon retirement. However, if an NEO does not remain employed for 180 days from the grant date, the award is forfeited regardless of retirement eligibility. Stock options are granted for a 10-year term. Stock options are granted with an exercise price equal to the fair market value of our common stock on the date of grant.
Stock Units. Stock units provide a benefit to an employee only if the employee remains employed until the award vests or once the employee becomes retirement eligible. Dividends are accrued on stock units during the period prior to vesting and are subject to the same vesting requirements, with payment in the form of additional shares once vesting has occurred. Stock units do not have voting rights. In addition, if the market value of the stock increases over the grant date price of the award, the employee further benefits from that appreciation in value. We grant two kinds of stock units.
|
●
|
PSUs. For all NEOs, 25% of their equity awards are PSUs vesting only if the Company achieves at least a threshold level of ROIC performance. PSUs cliff vest three years from the grant date depending on ROIC performance against a metric that is a three-year year target. Cliff vesting better aligns with our focus on overall ROIC performance during the three-year performance period of the award, incentivizes long-term strategic thinking and behavior, and enhances the retention value of the award.
|
|
●
|
RSUs. For all NEOs, 25% of their equity awards are RSUs vesting based on continued employment over time. RSUs typically vest in three annual installments (33%, 33%, and 34%) from the grant date, which enhances retention.
|
H. B. FULLER | 2024 Proxy Statement 38
EXECUTIVE COMPENSATION
If an NEO is retirement eligible, RSUs and PSUs continue to vest pursuant to the terms of the award. However, if an NEO does not remain employed for 180 days from the grant date, the award is forfeited regardless of retirement eligibility.
Fiscal 2023 Long-Term Incentive Awards. The value of an individual’s target award is established with consideration of the market median/50th percentile for the applicable position and grade level as well as the contributions and potential of the individual. The CEO recommends to the Compensation Committee the value of stock options, RSUs, and PSUs to be granted to each executive officer. The Compensation Committee retains full authority to accept, modify, or reject these recommendations and to increase or decrease the value of the award. The Compensation Committee also reviews total Company performance and the CEO’s individual performance to determine the award for the CEO. The number of options is determined based on a Black-Scholes valuation, and a 30-day share price average is applied. To determine the number of stock units to be awarded, a 30-day share price average is applied.
The Compensation Committee reviews and approves long-term incentives for our CEO and the other executive officers in January of each year. This long-term incentive grant date in January aligns with the annual individual performance review process and allows the grants to occur during the open trading period (after our fiscal year-end annual earnings release) for our common stock as provided under Company policy. We do not allow backdating of options, nor do we have a program, plan, or practice to time stock option grants to executive officers in coordination with the release of material non-public information.
The approximate values for each NEO’s fiscal year 2023 long-term incentive award are set forth in the table below.
| |
|
Approximate
|
| |
|
Value of
|
| |
|
Long-Term
|
| |
|
Incentive
|
| |
|
for FY 2023
|
|
Named Executive Officer
|
|
($)
|
|
Celeste B. Mastin
|
|
3,562,500
|
|
John J. Corkrean
|
|
1,100,000
|
|
Zhiwei Cai
|
|
650,0001
|
|
James J. East
|
|
650,000
|
|
Traci L. Jensen
|
|
650,000
|
| |
(1) This does not include the January 2023 one-time grant of RSUs to Mr. Cai described in "Analysis of Fiscal 2023 Base Salaries, Retention Awards, and Incentive Targets."
|
Analysis of Fiscal 2021-2023 Long-Term Incentive Award. PSUs granted in fiscal year 2021 and later have a three-year ROIC goal. Fiscal years 2021-2023 ROIC performance and related vesting of PSUs are set forth below.
Fiscal years 2021-2023 ROIC1 Performance Goals and Achievement
| |
|
2021 PSU Grant
|
|
| |
|
(2021-2023 Performance Period)
|
|
|
Superior
|
|
|
12.2 |
% |
|
Target
|
|
|
8.2 |
% |
|
Threshold
|
|
|
6.2 |
% |
|
Actual
|
|
|
9.0 |
% |
|
Payout Percent
|
|
|
120.0 |
% |
NOPAT (Net operating profit after tax)
(Short-Term Debt + Long-Term Debt + Total Equity - Cash)
At time of grant, we believed the targets were challenging but achievable. We consider the related target for the ROIC metric to be confidential commercial information the disclosure of which would result in competitive harm to us.
If performance during the three-year performance period is less than threshold (target ROIC less 2%), no PSUs vest. If the threshold level is achieved, the PSUs vest at 50%. If the target level is achieved, the PSUs vest at 100%. If the superior level (target ROIC plus 4%) is achieved, the PSUs vest at 200%. Performance between threshold and target and target and superior is calculated on a straight-line basis.
ROIC is a non-GAAP financial metric that is reconciled with the most directly comparable GAAP financial metric in Annex A.
Fiscal year 2023 RSU and PSU awards are set forth in the “Grants of Plan-Based Awards During Fiscal Year 2023” table in this Proxy Statement.
H. B. FULLER | 2024 Proxy Statement 39
EXECUTIVE COMPENSATION
Other Executive Benefits and Perquisites
In General. We provide the following perquisites and benefits to our executive officers:
|
Perquisites and Benefits
|
|
|
|
Description
|
| |
|
|
|
|
|
DC Restoration Plan
|
|
● |
Non-qualified retirement plan, consisting of the following four components:
|
| |
|
|
► |
1% non-elective (retirement) contribution restoration for compensation in excess of IRS limits for eligible U.S. employees, |
| |
|
|
► |
An opportunity for a discretionary contribution of 0% to 3% of eligible pay in excess of IRS limits, based on EPS performance1, |
| |
|
|
► |
4% 401(k) match restoration for compensation match in excess of IRS limits, and |
| |
|
|
► |
Additional credit equal to 7% of eligible earnings. |
| |
|
|
|
|
|
KEDCP
|
|
● |
Allows deferral of a portion of annual base salary and/or any annual incentive payment. If an executive defers a portion of his or her salary or incentive payment into the Company stock account, the Company credits units of deferred phantom stock units and matches 10% of the amount credited with phantom stock units. Mr. Corkrean, Mr. Cai and Mr. East participated in this plan during fiscal year 2023.
|
| |
|
|
|
|
|
Financial Counseling
|
|
● |
Up to $7,500 annually in financial planning and tax preparation.
|
| |
|
|
|
|
|
Executive Health Exams
|
|
● |
Annual preventive/diagnostic physical examination and local travel-related expenses.
|
| |
|
|
|
|
|
Excess Liability Insurance
|
|
● |
Group personal excess liability insurance policy provides individual coverage up to $5,000,000 and $1,000,000 in uninsured/underinsured motorist liability coverage. The Company pays the policy premium and the premium is included in the NEO’s income and is grossed up to pay the tax withholding (except where such payments are not taxable).
|
| |
|
|
|
|
|
Relocation Expense
|
|
● |
Assistance with relocation, sale and purchase of home, temporary living assistance, and movement of property, including a tax gross-up for certain assistance that is taxable.
|
| |
|
|
|
|
|
Long-Term Disability Insurance
|
|
● |
Executives may elect to purchase long-term disability insurance coverage of 50% of their salary up to $20,000 per month. The premiums are paid on an after-tax basis by the employee and then reimbursed by the Company.
|
|
(1)
|
Information regarding calculation of the fiscal year 2023 contribution is found in the “All Other Compensation” column and related footnotes to the “Summary Compensation Table” on page 44.
|
H. B. FULLER | 2024 Proxy Statement 40
EXECUTIVE COMPENSATION
Analysis of Fiscal 2023 Executive Benefits and Perquisites. We provide perquisites to our executive officers to generally reflect competitiveness at the market median/50th percentile.
In conjunction with the annual review of the executive compensation program, the Compensation Committee typically reviews executive officer benefits and perquisites for market prevalence. In fiscal year 2022, the Compensation Committee decided to review benefits and perquisites on an “every other year” basis since the market data does not typically change materially on an annual basis. The Compensation Committee conducted a detailed review and made no changes in fiscal 2023 to the types and amounts of benefits and perquisites offered to executive officers.
All benefits and perquisites paid to our NEOs are disclosed in the “Summary Compensation Table” under the “Other Compensation” column and the footnotes thereto.
Severance, Change-In-Control and Other Employment-Related Agreements
In General. H.B. Fuller does not have employment agreements with any of the NEOs that provide for a specified term of employment. The Company has executive severance agreements discussed under the heading “Severance” and change in control agreements discussed under the heading “Change-in-Control Agreements.”
Severance. The executive severance agreements provide for payment of the following severance benefits if the eligible executive officer’s employment is terminated involuntarily by the Company without cause (as defined in the agreement) or voluntarily by the executive officer for good reason (as defined in the agreement):
|
●
|
Severance pay equal to one time (two times for the CEO) base salary plus target annual bonus, payable over the 12 months (24 months for the CEO) following termination;
|
|
●
|
Continued group medical and dental insurance over 12 months (18 months for the CEO); and
|
|
●
|
Outplacement services with a value of up to $20,000.
|
Except as indicated above with respect to the CEO, the same form of agreement was provided to all NEOs.
Change-in-Control Agreements. All NEOs have entered into change-in-control agreements with H.B. Fuller. The change-in-control agreement is intended to ensure the executive officer remains focused on activities related to a change-in-control that could be in the best interest of the Company and its shareholders, and that the executive officer is not distracted by compensation implications because of a change-in-control. Additionally, change-in-control agreements assist in the retention of executive officers at a time when their departure might be detrimental to the Company and shareholders. The agreements are a critical and effective tool to attract and retain executives and provide for payments under certain circumstances following a change-in-control of the Company. Another purpose of providing change-in-control agreements is to provide financial security to the executive officer in the event the executive officer’s employment is terminated in connection with a change-in-control.
The change-in-control agreements contain a “double trigger” for receipt of change-in-control payments. This means that there must be a change in control of the Company and a termination of employment (or a material change to the NEO's terms of employment, such as demotion, reduction in compensation or required relocation) during the covered period for the provisions to apply and benefits to be paid. The Compensation Committee believes that a “double trigger” is more appropriate than a “single trigger,” because a double trigger prevents the unnecessary payment of benefits to an executive officer if the change in control does not result in the executive officer’s termination of employment or a material change in the terms of the executive officer’s employment.
For change-in-control agreements entered into prior to mid-fiscal year 2018 (for Mr. Corkrean, Mr. Cai, and Ms. Jensen), the arrangements were structured to ensure that executives receive the full intended benefits of these arrangements if a transaction should take place. Our approach was to provide our executives with arrangements that include a modified tax gross-up. These arrangements eliminated de minimis or inefficient gross-up payments, only providing tax gross-up in cases of significant imbalance. For change-in-control agreements entered into starting in mid-fiscal year 2018 (for Ms. Mastin and Mr. East), the Company does not include a tax gross-up provision. The Company instead references a best of net provision whereby the individual is responsible for any excise tax, or the benefit is reduced to not trigger an excise tax. The Company would calculate both scenario estimates and the individual would receive the provision with the highest after-tax benefit estimate.
H. B. FULLER | 2024 Proxy Statement 41
EXECUTIVE COMPENSATION
An explanation of any payments to be made under the change-in-control agreements is found under the heading “Involuntary (Not for Cause) Termination or Good Reason Termination after a Change-in-Control” in the section of this Proxy Statement titled “Potential Payments Upon Termination or Change-In-Control.”
Executive Compensation Policies
Stock Ownership. Goals and levels of executive stock ownership are reviewed annually by the Compensation Committee. An executive officer’s stock ownership includes common stock directly held by the executive officer and common stock held in our 401(k) Plan, RSUs, and phantom stock units held in the Key Employee Deferred Compensation Plan. NQSOs and unvested/unearned PSUs are not counted toward stock ownership goals.
The guideline for the CEO is ownership of at least five times their base salary in common stock, and the guideline for the CFO is ownership of at least three times their base salary. For the other NEOs, the guideline is two times their base salary. The guideline provides that an executive should strive to reach and then maintain the applicable stock ownership goal within five years of becoming subject to that goal. For the fiscal year 2023 review of stock ownership, all NEOs who had been subject to the same stock ownership goal for at least five years had met that goal except for Ms. Jensen, who had met her ownership goal prior to her promotion to CAO and related increase in base salary. If after five years at a particular stock ownership target, an NEO has not met the stock ownership goal, the NEO must retain 100% of all after-tax profit shares from any exercise, vesting, or payout of equity awards until the stock ownership guideline is met, unless a hardship exception is granted.
Tax Considerations. Section 162(m) of the U.S. Internal Revenue Code ("Section 162(m)") imposes a $1,000,000 annual deduction limit on compensation payable to certain current and former NEOs. The Compensation Committee intends to pay competitive compensation consistent with our philosophy to attract, retain, and motivate executive officers to manage our business in the best interests of the Company and our shareholders. The Compensation Committee, therefore, may choose to provide non-deductible compensation to our executive officers if it deems such compensation to be in the best interests of H.B. Fuller and our shareholders.
Various programs, including our benefit plans that provide for deferrals of compensation are subject to Section 409A of the Internal Revenue Code. We have reviewed such plans for compliance with Section 409A and believe that they comply.
Prohibition on Hedging and Pledging. Our insider trading policy prohibits hedging transactions in Company securities by all officers and directors. Hedging transactions include, for example, prepaid variable contracts, equity swaps, “costless collars,” and other transactions that are designed to hedge or offset any decrease in the market value of Company securities. Additionally, our insider trading policy prohibits pledging transactions by directors and executive officers.
Clawbacks. Our compensation recovery policy generally requires the Compensation Committee to recoup incentive-based compensation from any current or former executive officer or key manager if the payment was predicated on achieving certain financial results that were subsequently the subject of a restatement of Company financial statements due to the material non-compliance with any financial reporting requirements. In such a case, the Compensation Committee will require the executive officer or key manager to reimburse the Company for all incentive-based compensation paid within the three-year period prior to the date that the Company is required to prepare the restatement to the extent that incentive-based compensation received exceeds the amount of incentive-based compensation that otherwise would have been received had it been determined based on the restated amounts. Under our compensation recovery policy, the Compensation Committee may also recoup incentive-based compensation from any current or former executive officer or key manager if the Compensation Committee determines that the executive officer or key manager engaged in intentional misconduct in performing his or her duties. In such a case, the Compensation Committee may require the executive officer or key manager to reimburse the Company for all or a portion of any incentive-based compensation paid within any fiscal year during which the executive officer's or key manager's intentional misconduct occurred.
Non-GAAP Financial Measures
The "Compensation Discussion and Analysis" section of this Proxy Statement contains non-GAAP financial measures, including Adjusted EPS, Adjusted Net Revenue, Adjusted EBITDA, Adjusted EBITDA Margin, and ROIC measured on a company-wide basis and certain financial measures for individual operating segments. See "Reconciliation of Non-GAAP Financial Information" in Annex A to this Proxy Statement for a reconciliation of these non-GAAP financial measures to the most directly comparable GAAP financial measure.
H. B. FULLER | 2024 Proxy Statement 42
EXECUTIVE COMPENSATION
COMPENSATION COMMITTEE REPORT
The Compensation Committee of the Board of Directors has reviewed and discussed with H.B. Fuller management the Compensation Discussion and Analysis. Based on this review and discussion with management, the Compensation Committee recommended to the Board of Directors that the Compensation Discussion and Analysis be included in this Proxy Statement and in the Annual Report on Form 10-K for the year ended December 2, 2023.
Compensation Committee of the Board of Directors of H.B. Fuller Company
|
Ruth S. Kimmelshue, Chair
|
Lee R. Mitau
|
|
Michael J. Happe
|
Srilata A. Zaheer
|
|
Charles T. Lauber
|
|
H. B. FULLER | 2024 Proxy Statement 43
EXECUTIVE COMPENSATION
SUMMARY COMPENSATION TABLE
The following table shows the cash and non-cash compensation for the last three fiscal years awarded to or earned by our NEOs, which include individuals who served as Chief Executive Officer and Chief Financial Officer during fiscal year 2023 and three other most highly compensated executive officers who either were serving as executive officers at the end of fiscal year 2023 or served as an executive officer during fiscal year 2023.
|
Name and Principal Position
|
|
Year
|
|
Salary ($)1
|
|
Bonus ($)2
|
|
Stock Awards ($)3
|
|
Option Awards ($)4
|
|
Non-Equity Incentive Plan Compensation ($)1,5
|
|
Change in Pension Value and Non- qualified Deferred Compensation Earnings ($)6
|
|
All Other Compensation ($)7
|
|
Total ($)
|
| |
|
|
|
|
|
|
|
|
|
|
|
|
|
|
|
|
|
|
|
CELESTE B. MASTIN8
|
|
2023
|
|
950,000
|
|
|
|
1,624,832
|
|
1,615,756
|
|
570,018
|
|
-
|
|
290,296
|
|
5,050,902
|
|
President and
|
|
2022
|
|
438,750
|
|
1,700,000
|
|
502,842
|
|
525,814
|
|
364,920
|
|
-
|
|
444,347
|
|
3,976,673
|
|
Chief Executive Officer
|
|
2021
|
|
|
|
|
|
|
|
|
|
|
|
|
|
|
|
|
| |
|
|
|
|
|
|
|
|
|
|
|
|
|
|
|
|
|
|
| |
|
|
|
|
|
|
|
|
|
|
|
|
|
|
|
|
|
|
|
JOHN J. CORKREAN
|
|
2023
|
|
596,769
|
|
|
|
523,710
|
|
498,896
|
|
239,810
|
|
17,781
|
|
140,572
|
|
2,017,538
|
|
Executive Vice President &
|
|
2022
|
|
587,615
|
|
|
|
490,494
|
|
460,969
|
|
488,044
|
|
4,447
|
|
195,156
|
|
2,226,725
|
|
Chief Financial Officer
|
|
2021
|
|
558,404
|
|
|
|
527,346
|
|
501,728
|
|
575,000
|
|
3,407
|
|
171,373
|
|
2,337,258
|
| |
|
|
|
|
|
|
|
|
|
|
|
|
|
|
|
|
|
|
| |
|
|
|
|
|
|
|
|
|
|
|
|
|
|
|
|
|
|
| ZHIWEI CAI |
|
2023 |
|
610,685 |
|
|
|
755,063 |
|
294,794 |
|
195,819 |
|
16,153 |
|
113,332 |
|
1,985,846 |
|
Executive Vice President,
|
|
2022
|
|
595,437
|
|
|
|
329,309
|
|
322,680
|
|
368,609
|
|
4,247
|
|
131,482
|
|
1,751,764
|
|
Engineering Adhesives
|
|
2021
|
|
533,270
|
|
|
|
341,517
|
|
334,315
|
|
540,000
|
|
3,542
|
|
91,740
|
|
1,844,384
|
| |
|
|
|
|
|
|
|
|
|
|
|
|
|
|
|
|
|
|
| |
|
|
|
|
|
|
|
|
|
|
|
|
|
|
|
|
|
|
|
JAMES J. EAST9
|
|
2023
|
|
500,000
|
|
|
|
298,166
|
|
294,794
|
|
304,033
|
|
6,817
|
|
118,992
|
|
1,522,802
|
|
Executive Vice President,
|
|
|
|
|
|
|
|
|
|
|
|
|
|
|
|
|
|
|
|
Hygiene, Health and Consumable Adhesives
|
|
|
|
|
|
|
|
|
|
|
|
|
|
|
|
|
|
|
| |
|
|
|
|
|
|
|
|
|
|
|
|
|
|
|
|
|
|
| |
|
|
|
|
|
|
|
|
|
|
|
|
|
|
|
|
|
|
|
TRACI L. JENSEN10
|
|
2023
|
|
500,000
|
|
|
|
296,471
|
|
294,794
|
|
175,217
|
|
31,807
|
|
109,620
|
|
1,407,909
|
|
Executive Vice President &
|
|
|
|
|
|
|
|
|
|
|
|
|
|
|
|
|
|
|
|
Chief Administrative Officer
|
|
|
|
|
|
|
|
|
|
|
|
|
|
|
|
|
|
|
|
(1)
|
Includes cash compensation deferred at the election of the executive under the 401(k) Plan and/or the KEDCP. During fiscal year 2023, Mr. Corkrean, Mr. Cai, and Mr. East contributed to H.B. Fuller “stock fund” in the KEDCP. Mr. Corkrean contributed $148,523 of his salary and $71,943 of his STIP payment into phantom units in the KEDCP and received a 10% match from the Company on those contributions. Mr. Cai contributed $12,917 of his salary and $11,749 of his STIP payment into phantom units in the KEDCP and received a 10% match from the Company on those contributions. Mr. East contributed $10,558 of his salary and $6,385 of his STIP payment into phantom units in the KEDCP and received a 10% match from the Company on those contributions. These amounts are included in the applicable “Salary” and “Bonus” columns of this table (as applicable) and the value of the match is included in the “Stock Awards” column of this table. Their contributions are also shown in the “Non-Qualified Deferred Compensation” table and in the “Grants of Plan-Based Awards” table. For accounting and U.S. payroll purposes, fiscal year 2022 contained 53 weeks and fiscal years 2021 and 2023 contained 52 weeks.
|
|
(2)
|
The amount in this column for Ms. Mastin represents the payment of a one-time hiring bonus in fiscal year 2022. This hiring bonus compensated Ms. Mastin for lost bonus compensation at her previous employer.
|
H. B. FULLER | 2024 Proxy Statement 44
EXECUTIVE COMPENSATION
|
(3)
|
The amounts in this column represent the grant date fair value of (a) the 10% Company match of phantom units deferred under the KEDCP, as described in footnote 1, (b) RSU and PSU grants made under the LTIP, and (c) for fiscal year 2023, an RSU retention award to Mr. Cai described in the section entitled "Analysis of Fiscal 2023 Base Salaries, Retention Awards, and Incentive Targets" in the "Compensation Discussion and Analysis" section of this Proxy Statement. The grant date fair value is calculated in accordance with FASB ASC Topic 715 for phantom units and FASB ASC Topic 718 for RSUs and PSUs based on the closing price of our common stock on the date of grant and, for fiscal year 2023 grants, based on assumptions set forth in Note 9 to the audited financial statements included in our Annual Report on Form 10-K for the fiscal year ended December 2, 2023, except that the assumption related to forfeitures is not included in the calculations for these purposes. See the "Grant of Plan-Based Awards Table During 2023" table in this Proxy Statement for additional information on the fiscal year 2023 grants. The values included in this column for PSU grants made in fiscal year 2023 assume target performance. Assuming maximum performance (200% of target), the values are: for Ms. Mastin, $1,624,764 (amount reported in the column is $812,382); for Mr. Corkrean, $501,595 (amount reported in this column is $250,797); for Mr. Cai, $296,403 (amount reported in this column is $148,202); for Mr. East, $296,403 (amount reported in this column is $148,202); and for Ms. Jensen, $296,403 (amount reported in this column is $148,202).
|
|
(4)
|
The amounts in this column represent the grant date fair values of stock option awards made under the LTIP. In accordance with FASB ASC Topic 718, the grant date fair value of these awards has been determined using the Black-Scholes method and based on the assumptions set forth in Note 9 to the audited financial statements included in our Annual Report on Form 10-K for the fiscal year ended December 2, 2023, except that the assumption related to forfeitures is not included in the calculations for these purposes.
|
|
(5)
|
As described in the “Compensation Discussion and Analysis” section of this Proxy Statement, the amounts in this column represent cash incentives earned under our STIP. See footnote 1 above.
|
|
(6)
|
Amounts reported in this column include the amount of interest accrued during the applicable fiscal year on the officer’s account in the DC Restoration Plan that exceeded 120% of the applicable federal long-term monthly rate in fiscal year 2023. No NEOs participate in the H.B. Fuller Legacy Pension Plan.
|
|
(7)
|
The table below shows the components of this column for fiscal year 2023, which include Company matching contributions to H.B. Fuller’s defined contribution plans, dividends on RSUs and PSUs, and perquisites paid by the Company for the benefit of the executive officers.
|
H. B. FULLER | 2024 Proxy Statement 45
EXECUTIVE COMPENSATION
|
All Other Compensation -- Fiscal Year 2023
|
|
| |
|
|
|
|
|
|
|
|
|
|
|
|
|
|
|
|
|
|
|
|
| |
|
Defined
|
|
|
Defined
|
|
|
|
|
|
|
|
|
|
|
|
|
|
| |
|
Contribution Plan
|
|
|
Contribution
|
|
|
|
|
|
|
|
|
|
|
|
|
|
| |
|
Company Match
|
|
|
Restoration
|
|
|
Dividends on
|
|
|
|
|
|
|
|
|
|
| |
|
&
|
|
|
Plan
|
|
|
Unvested
|
|
|
Perquisites and |
|
|
|
|
|
| |
|
Contributions
|
|
|
Contributions
|
|
|
RSUs and PSUs
|
|
|
Other Payments
|
|
|
Total
|
|
|
Name
|
|
($)a
|
|
|
($)a
|
|
|
($)b
|
|
|
($)c
|
|
|
($)
|
|
|
Celeste B. Mastin
|
|
|
16,396 |
|
|
|
137,010 |
|
|
|
24,578 |
|
|
|
112,312 |
|
|
|
290,296 |
|
|
John J. Corkrean
|
|
|
16,396 |
|
|
|
100,255 |
|
|
|
15,702 |
|
|
|
8,219 |
|
|
|
140,572 |
|
|
Zhiwei Cai
|
|
|
16,396 |
|
|
|
73,372 |
|
|
|
15,572 |
|
|
|
7,992 |
|
|
|
113,332 |
|
|
James J. East
|
|
|
16,396 |
|
|
|
78,865 |
|
|
|
6,676 |
|
|
|
17,055 |
|
|
|
118,992 |
|
|
Traci L. Jensen
|
|
|
16,396 |
|
|
|
68,790 |
|
|
|
6,836 |
|
|
|
17,598 |
|
|
|
109,620 |
|
|
(a)
|
For the contributions related to the discretionary contribution of 0% to 3% of eligible earnings in excess of IRS limits, based on Adjusted EPS performance of $3.87, no contribution was made as the threshold of $4.13 was not met. Target level was $4.35, and the superior level was $4.79. Straight line interpolation is used for performance above $4.13 up to $4.79. See further discussion in the section titled “Other Executive Benefits and Perquisites” in the “Compensation Discussion and Analysis” section of this Proxy Statement on page 40.
|
|
(b)
|
Dividends accrued on unvested RSUs and PSUs are not paid unless the RSUs or PSUs vest.
|
|
(c)
|
The perquisite and other payments amounts are valued at the amount paid by, or the incremental cost to, the Company as follows: for Ms. Mastin, $4,815 for insurance premiums (including a related tax gross-up of $724), $7,251 for a health exam, $7,500 for financial counseling, moving expenses and moving allowance of $57,495 (including a tax gross-up of $18,118), $4,735 for a tax gross-up for spousal travel to a Board meeting, $1,151 for a gift related to a Board meeting (including a related tax gross-up of $446), and $29,365 for charitable matching contributions and donations; for Mr. Corkrean, $3,240 for insurance premiums (including a related tax gross-up of $991), a tax gross-up of $116 for a gift related to a Board meeting, and $4,863 for charitable matching contributions and donations; for Mr. Cai, $5,279 for insurance premiums (including a related tax gross-up of $1,188), $850 for financial counseling, a tax gross-up of $118 for a gift related to a Board meeting, and $1,745 for a health exam; for Mr. East, $5,023 for insurance premiums (including a related tax gross-up of $932), $7,500 for financial counseling, $4,161 for a health exam, and $371 for a gift related to a Board meeting (including a related tax gross-up of $109); and for Ms. Jensen, $4,999 for insurance premiums (including a related tax gross-up of $907), $5,755 for a health exam, $6,475 for charitable matching contributions and donations, and $369 for a gift related to a Board meeting (including a related tax gross-up of $107).
|
| |
Insurance amounts include premiums for personal excess liability insurance paid on a tax-protected basis and related tax gross-ups. Insurance amounts also include reimbursement for long-term disability insurance premiums in the amount of $1,843 for Ms. Mastin, Mr. Cai, Mr. East, and Ms. Jensen.
Amounts for charitable matching contributions and donations by the Company are given under a broad-based plan for all U.S. employees to match charitable contributions between $50 and $1,000 made to qualifying 501(c)(3) nonprofit organizations and a 50% match on all donations by NEOs to the United Way. Also includes amounts under the Company’s Executive Charitable Board Support program under which key managers (including all the NEOs in this Proxy Statement) are eligible to direct H.B. Fuller Company Foundation charitable contributions to qualifying 501(c)(3) nonprofit organizations where they are serving as board members.
|
|
(8)
|
Ms. Mastin was hired as EVP and COO effective March 7, 2022. She became President and CEO of the Company and a director of the Company effective December 4, 2022.
|
|
(9)
|
Mr. East was promoted to his current role effective December 4, 2022.
|
|
(10)
|
Ms. Jensen was promoted to her current role effective December 4, 2022.
|
H. B. FULLER | 2024 Proxy Statement 46
EXECUTIVE COMPENSATION
GRANTS OF PLAN-BASED AWARDS DURING FISCAL 2023
The following table summarizes the grants of plan-based awards in fiscal year 2023 for each of the NEOs in the “Summary Compensation Table.” For more information on the terms of these awards, see “Fiscal 2023 Short-Term Incentive Compensation” and “Fiscal 2023 Long-Term Incentive Compensation” in the “Compensation Discussion and Analysis.”
| |
|
|
Estimated Future Payouts Under Non-
Equity Incentive Plan Awards1
|
|
|
Estimated Future Payouts Under
Equity Incentive Plan Awards2
|
|
|
All Other
Stock
Awards:
Number of
Shares of
Stock
|
|
|
|
|
|
|
Option
Awards:
Number of
Securities
Underlying
|
|
|
Exercise
or Base
Price of
Option
|
|
|
Grant Date
Fair Value
of Stock
and
Options
|
|
|
Name and Award Type
|
Grant
Date
|
|
Threshold
($)
|
|
|
Target
($)
|
|
|
Maximum
($)
|
|
|
Threshold
(#)
|
|
|
Target
(#)
|
|
|
Maximum
(#)
|
|
|
or Units
(#)
|
|
|
|
|
|
|
Options
(#)3
|
|
|
Awards
($/Sh)
|
|
|
Awards
($)4
|
|
|
CELESTE B. MASTIN
|
|
|
|
|
|
|
|
|
|
|
|
|
|
|
|
|
|
|
|
|
|
|
|
|
|
|
|
|
|
|
|
|
|
|
|
|
|
|
|
|
|
|
|
|
|
|
STIP Award
|
|
|
|
170,172
|
|
|
|
1,134,477
|
|
|
|
2,268,953
|
|
|
|
|
|
|
|
|
|
|
|
|
|
|
|
|
|
|
|
|
|
|
|
|
|
|
|
|
|
|
|
|
|
|
LTIP Award - PSUs
|
1/24/2023
|
|
|
|
|
|
|
|
|
|
|
|
|
|
|
5,959 |
|
|
|
11,917 |
|
|
|
23,834 |
|
|
|
|
|
|
|
|
|
|
|
|
|
|
|
|
|
|
|
812,382 |
|
|
LTIP Award - RSUs
|
1/24/2023
|
|
|
|
|
|
|
|
|
|
|
|
|
|
|
|
|
|
|
|
|
|
|
|
|
|
|
11,918 |
|
|
|
5 |
|
|
|
|
|
|
|
|
|
|
|
812,450 |
|
|
LTIP Award - NQSOs
|
1/24/2023
|
|
|
|
|
|
|
|
|
|
|
|
|
|
|
|
|
|
|
|
|
|
|
|
|
|
|
|
|
|
|
|
|
|
|
72,261 |
|
|
|
68.17 |
|
|
|
1,615,756 |
|
| |
|
|
|
|
|
|
|
|
|
|
|
|
|
|
|
|
|
|
|
|
|
|
|
|
|
|
|
|
|
|
|
|
|
|
|
|
|
|
|
|
|
|
|
|
|
|
JOHN J. CORKREAN
|
|
|
|
|
|
|
|
|
|
|
|
|
|
|
|
|
|
|
|
|
|
|
|
|
|
|
|
|
|
|
|
|
|
|
|
|
|
|
|
|
|
|
|
|
|
|
STIP Award
|
|
|
|
71,592
|
|
|
|
477,282
|
|
|
|
954,564
|
|
|
|
|
|
|
|
|
|
|
|
|
|
|
|
|
|
|
|
|
|
|
|
|
|
|
|
|
|
|
|
|
|
|
LTIP Award - PSUs
|
1/24/2023
|
|
|
|
|
|
|
|
|
|
|
|
|
|
|
1,840 |
|
|
|
3,679 |
|
|
|
7,358 |
|
|
|
|
|
|
|
|
|
|
|
|
|
|
|
|
|
|
|
250,797 |
|
|
LTIP Award - RSUs
|
1/24/2023
|
|
|
|
|
|
|
|
|
|
|
|
|
|
|
|
|
|
|
|
|
|
|
|
|
|
|
3,680 |
|
|
|
5 |
|
|
|
|
|
|
|
|
|
|
|
250,866 |
|
|
LTIP Award - NQSOs
|
1/24/2023
|
|
|
|
|
|
|
|
|
|
|
|
|
|
|
|
|
|
|
|
|
|
|
|
|
|
|
|
|
|
|
|
|
|
|
22,312 |
|
|
|
68.17 |
|
|
|
498,896 |
|
|
KEDCP
|
|
|
|
|
|
|
|
|
|
|
|
|
|
|
|
|
|
|
|
|
|
|
|
|
|
|
3,410 |
|
|
|
6 |
|
|
|
|
|
|
|
|
|
|
|
243,516 |
|
| |
|
|
|
|
|
|
|
|
|
|
|
|
|
|
|
|
|
|
|
|
|
|
|
|
|
|
|
|
|
|
|
|
|
|
|
|
|
|
|
|
|
|
|
|
|
|
ZHIWEI CAI
|
|
|
|
|
|
|
|
|
|
|
|
|
|
|
|
|
|
|
|
|
|
|
|
|
|
|
|
|
|
|
|
|
|
|
|
|
|
|
|
|
|
|
|
|
|
|
STIP Award
|
|
|
|
60,264
|
|
|
|
401,762
|
|
|
|
803,525
|
|
|
|
|
|
|
|
|
|
|
|
|
|
|
|
|
|
|
|
|
|
|
|
|
|
|
|
|
|
|
|
|
|
|
LTIP Award - PSUs
|
1/24/2023
|
|
|
|
|
|
|
|
|
|
|
|
|
|
|
1,087 |
|
|
|
2,174 |
|
|
|
4,348 |
|
|
|
|
|
|
|
|
|
|
|
|
|
|
|
|
|
|
|
148,202 |
|
|
LTIP Award - RSUs
|
1/24/2023
|
|
|
|
|
|
|
|
|
|
|
|
|
|
|
|
|
|
|
|
|
|
|
|
|
|
|
2,175 |
|
|
|
5 |
|
|
|
|
|
|
|
|
|
|
|
148,270 |
|
|
Retention Award - RSUs
|
1/24/2023
|
|
|
|
|
|
|
|
|
|
|
|
|
|
|
|
|
|
|
|
|
|
|
|
|
|
|
6,691 |
|
|
|
5 |
|
|
|
|
|
|
|
|
|
|
|
456,125 |
|
|
LTIP Award - NQSOS
|
1/24/2023
|
|
|
|
|
|
|
|
|
|
|
|
|
|
|
|
|
|
|
|
|
|
|
|
|
|
|
|
|
|
|
|
|
|
|
13,184 |
|
|
|
68.17 |
|
|
|
294,794 |
|
|
KEDCP
|
|
|
|
|
|
|
|
|
|
|
|
|
|
|
|
|
|
|
|
|
|
|
|
|
|
|
376 |
|
|
|
6 |
|
|
|
|
|
|
|
|
|
|
|
27,230 |
|
| |
|
|
|
|
|
|
|
|
|
|
|
|
|
|
|
|
|
|
|
|
|
|
|
|
|
|
|
|
|
|
|
|
|
|
|
|
|
|
|
|
|
|
|
|
|
|
JAMES J. EAST
|
|
|
|
|
|
|
|
|
|
|
|
|
|
|
|
|
|
|
|
|
|
|
|
|
|
|
|
|
|
|
|
|
|
|
|
|
|
|
|
|
|
|
|
|
|
|
STIP Award
|
|
|
|
52,401
|
|
|
|
349,342
|
|
|
|
698,685
|
|
|
|
|
|
|
|
|
|
|
|
|
|
|
|
|
|
|
|
|
|
|
|
|
|
|
|
|
|
|
|
|
|
|
LTIP Award - PSUs
|
1/24/2023
|
|
|
|
|
|
|
|
|
|
|
|
|
|
|
1,087 |
|
|
|
2,174 |
|
|
|
4,348 |
|
|
|
|
|
|
|
|
|
|
|
|
|
|
|
|
|
|
|
148,202 |
|
|
LTIP Award - RSUs
|
1/24/2023
|
|
|
|
|
|
|
|
|
|
|
|
|
|
|
|
|
|
|
|
|
|
|
|
|
|
|
2,175 |
|
|
|
5 |
|
|
|
|
|
|
|
|
|
|
|
148,270 |
|
|
LTIP Award - NQSOs
|
1/24/2023
|
|
|
|
|
|
|
|
|
|
|
|
|
|
|
|
|
|
|
|
|
|
|
|
|
|
|
|
|
|
|
|
|
|
|
13,184 |
|
|
|
68.17 |
|
|
|
294,794 |
|
|
KEDCP
|
|
|
|
|
|
|
|
|
|
|
|
|
|
|
|
|
|
|
|
|
|
|
|
|
|
|
261 |
|
|
|
6 |
|
|
|
|
|
|
|
|
|
|
|
18,734 |
|
| |
|
|
|
|
|
|
|
|
|
|
|
|
|
|
|
|
|
|
|
|
|
|
|
|
|
|
|
|
|
|
|
|
|
|
|
|
|
|
|
|
|
|
|
|
|
|
TRACI L. JENSEN
|
|
|
|
|
|
|
|
|
|
|
|
|
|
|
|
|
|
|
|
|
|
|
|
|
|
|
|
|
|
|
|
|
|
|
|
|
|
|
|
|
|
|
|
|
|
|
STIP Award
|
|
|
|
52,309
|
|
|
|
348,726
|
|
|
|
697,452
|
|
|
|
|
|
|
|
|
|
|
|
|
|
|
|
|
|
|
|
|
|
|
|
|
|
|
|
|
|
|
|
|
|
|
Retention Award
|
1/24/2023
|
|
|
|
|
|
|
500,000 |
7 |
|
|
|
|
|
|
|
|
|
|
|
|
|
|
|
|
|
|
|
|
|
|
|
|
|
|
|
|
|
|
|
|
|
|
|
|
|
LTIP Award - PSUs
|
1/24/2023
|
|
|
|
|
|
|
|
|
|
|
|
|
|
|
1,087 |
|
|
|
2,174 |
|
|
|
4,348 |
|
|
|
|
|
|
|
|
|
|
|
|
|
|
|
|
|
|
|
148,202 |
|
|
LTIP Award - RSUs
|
1/24/2023
|
|
|
|
|
|
|
|
|
|
|
|
|
|
|
|
|
|
|
|
|
|
|
|
|
|
|
2,175 |
|
|
|
5 |
|
|
|
|
|
|
|
|
|
|
|
148,270 |
|
|
LTIP Award - NQSOs
|
1/24/2023
|
|
|
|
|
|
|
|
|
|
|
|
|
|
|
|
|
|
|
|
|
|
|
|
|
|
|
|
|
|
|
|
|
|
|
13,184 |
|
|
|
68.17 |
|
|
|
294,794 |
|
| |
|
|
|
|
|
|
|
|
|
|
|
|
|
|
|
|
|
|
|
|
|
|
|
|
|
|
|
|
|
|
|
|
|
|
|
|
|
|
|
|
|
|
|
|
|
H. B. FULLER | 2024 Proxy Statement 47
EXECUTIVE COMPENSATION
|
(1)
|
The amounts shown in these columns represent the opportunity under our STIP for fiscal year 2023 performance discussed under the heading “Fiscal 2023 Short-Term Incentive Compensation” in this Proxy Statement. The amount in the threshold column represents the potential payout if the threshold level is met for Adjusted EPS (50% of target) and there is no payment for any other metrics for the applicable NEO. The amount in the target column represents the potential payout if the target level is met for all STIP metrics for the applicable NEO (100% of target). The amount in the maximum column represents the potential payout if the maximum level is met for all STIP metrics for the applicable NEO (200% of target). The short-term incentive award may be $0 if the threshold metric is not met for all the metrics for an NEO. The actual amount paid out in January 2024 under the STIP is set forth in the “Summary Compensation Table.”
|
|
(2)
|
For all NEOs, the PSU awards were granted under the 2020 Incentive Plan and cliff vest in three years from the date of grant based upon ROIC performance. For all grants, if performance is less than threshold (target ROIC less 2%), the PSUs will vest with a value of $0, i.e., no shares will be earned. If the threshold level is achieved, the PSUs will vest at 50%. If the target level is achieved, the PSUs will vest at 100%. Performance between threshold and target and target and superior will be calculated on a pro rata basis. If the superior level (target ROIC plus 4%) is achieved, the PSUs will vest at 200%. Under the 2020 Incentive Plan, dividends on PSUs are accrued by H.B. Fuller at the same rate as payable to all H.B. Fuller shareholders and are paid in shares when the PSUs vest. The PSUs immediately vest at target in the event of death or disability. The value of accrued dividends is included in the “Summary Compensation Table” in the “All Other Compensation” column.
|
|
(3)
|
The NQSOs are granted under the 2020 Master Incentive Plan and become exercisable at the rate of 33%, 33%, and 34% each year beginning on the first anniversary of the grant date and expire 10 years from the grant date. These options become immediately exercisable upon retirement (age 55 and 10 years of service), death, or disability.
|
|
(4)
|
The grant date fair value of RSU and PSU awards is calculated by multiplying the number of units for RSUs, and the target number of units for PSUs, by the closing price of our common stock on the date of grant. The Black-Scholes option pricing method was used to estimate the grant date fair value of the options in this column. The assumptions used to develop the grant date valuations for the options are as follows: risk free rate of return of 3.6%; dividend rate of .817%; volatility rate of 35.127%; quarterly reinvestment of dividends; and an average term of 5 years. No adjustments have been made for non-transferability or risk of forfeiture. The real value of the stock options in this table will depend on the actual performance of our common stock during the applicable period and the fair market value of our common stock on the date the options are exercised.
|
|
(5)
|
The LTIP Award - RSUs were granted under the 2020 Incentive Plan. The RSUs vest in three annual installments (33%, 33%, and 34%) beginning on the first anniversary date of the grant. Under the 2020 Incentive Plan, dividends on RSUs are accrued by H.B. Fuller at the same rate as payable to all H.B. Fuller shareholders and are paid in shares when the RSUs vest. The RSUs become immediately vested in the event of death or disability. The fair value of the RSUs is calculated by multiplying the number of units of RSUs by the closing price of our common stock on the date of grant. The value of accrued dividends is included in the “Summary Compensation Table” in the “All Other Compensation” column.
For Mr. Cai, the retention award is a one-time grant of RSUs that will cliff-vest on January 24, 2025 subject to Mr. Cai remaining employed by the Company until the vesting date. There are no provisions for accelerated vesting of the units upon an earlier retirement. See "Analysis of Fiscal 2023 Base Salaries, Retention Awards, and Incentive Targets."
|
|
(6)
|
The KEDCP allows NEOs to defer of a portion of their annual base salary and/or any annual short-term incentive payment. If an NEO defers a portion of their salary or short-term incentive payment into the Company stock account in the KEDCP, the Company credits units of deferred phantom stock units and matches 10% of the amount credited with phantom stock units. Mr. Corkrean, Mr. Cai, and Mr. East deferred a portion of their salary into phantom stock units during fiscal year 2023. Mr. Corkrean, Mr. Cai, and Mr. East also deferred a portion of their STIP related to fiscal year 2023 into phantom stock units. The amounts were deferred on various dates throughout the fiscal year and the total amount deferred, plus the 10% match, is shown here.
|
|
(7)
|
This retention award is payable within 60 days of December 4, 2024 conditioned on Ms. Jensen being employed by the Company on such date. See "Analysis of Fiscal 2023 Base Salaries, Retention Awards, and Incentive Targets."
|
H. B. FULLER | 2024 Proxy Statement 48
EXECUTIVE COMPENSATION
OUTSTANDING EQUITY AWARDS AT FISCAL 2023 YEAR-END
The following table summarizes the outstanding equity awards as of December 2, 2023 for each of the named executive officers in the “Summary Compensation Table.”
| |
|
|
|
Option Awards
|
|
|
|
|
|
|
|
|
|
Name
|
|
Grant Date
|
|
Number of Securities Underlying Unexercised Options (#) Exercisable1
|
|
Number of Securities Underlying Unexercised Options (#) Unexercisable1
|
|
Equity Incentive Plan Awards: Number of Securities Underlying Unexercised Unearned Options (#)
|
|
Option Exercise Price ($)
|
|
Option Expiration Date
|
|
Number of Shares or Units of Stock That Have Not Vested (#)2
|
|
Market Value of Shares or Units of Stock That Have Not Vested ($)3
|
|
Equity incentive plan awards: number of unearned shares, units or other rights that have not vested (#)4
|
|
Equity incentive plan awards: market or payout value of unearned shares, units or other rights that have not vested ($)3
|
|
CELESTE B. MASTIN
|
|
4/7/2022
|
|
8,470
|
|
17,197
|
|
|
|
67.55
|
|
4/7/2032
|
|
|
|
|
|
|
|
|
| |
|
1/24/2023
|
|
—
|
|
72,261
|
|
|
|
68.17
|
|
1/24/2033
|
|
|
|
|
|
|
|
|
| |
|
4/7/2022
|
|
|
|
|
|
|
|
|
|
|
|
2,546
|
|
195,762
|
|
|
|
|
| |
|
4/7/2022
|
|
|
|
|
|
|
|
|
|
|
|
|
|
|
|
7,598
|
|
584,210
|
| |
|
1/24/2023
|
|
|
|
|
|
|
|
|
|
|
|
12,059
|
|
927,217
|
|
|
|
|
| |
|
1/24/2023
|
|
|
|
|
|
|
|
|
|
|
|
|
|
|
|
24,116
|
|
1,854,279
|
| |
|
|
|
|
|
|
|
|
|
|
|
|
|
|
|
|
|
|
|
|
| |
|
|
|
|
|
|
|
|
|
|
|
|
|
|
|
|
|
|
|
|
|
JOHN J. CORKREAN
|
|
5/17/2016
|
|
16,672
|
|
—
|
|
|
|
43.48
|
|
5/17/2026
|
|
|
|
|
|
|
|
|
| |
|
1/26/2017
|
|
23,696
|
|
—
|
|
|
|
50.10
|
|
1/26/2027
|
|
|
|
|
|
|
|
|
| |
|
1/25/2018
|
|
21,834
|
|
—
|
|
|
|
53.57
|
|
1/25/2028
|
|
|
|
|
|
|
|
|
| |
|
1/24/2019
|
|
41,208
|
|
—
|
|
|
|
45.05
|
|
1/24/2029
|
|
|
|
|
|
|
|
|
| |
|
1/24/2020
|
|
48,309
|
|
—
|
|
|
|
48.35
|
|
1/24/2030
|
|
|
|
|
|
|
|
|
| |
|
1/27/2021
|
|
25,328
|
|
13,048
|
|
|
|
51.89
|
|
1/27/2031
|
|
|
|
|
|
|
|
|
| |
|
1/24/2022
|
|
7,259
|
|
14,738
|
|
|
|
72.94
|
|
1/24/2032
|
|
|
|
|
|
|
|
|
| |
|
1/24/2023 |
|
— |
|
22,312 |
|
|
|
68.17 |
|
1/24/2033 |
|
|
|
|
|
|
|
|
| |
|
1/27/2021
|
|
|
|
|
|
|
|
|
|
|
|
1,714
|
|
131,789
|
|
|
|
|
| |
|
1/27/2021
|
|
|
|
|
|
|
|
|
|
|
|
|
|
|
|
6,044
|
|
464,723
|
| |
|
1/24/2022
|
|
|
|
|
|
|
|
|
|
|
|
2,188
|
|
168,235
|
|
|
|
|
| |
|
1/24/2022
|
|
|
|
|
|
|
|
|
|
|
|
|
|
|
|
6,528
|
|
501,938
|
| |
|
1/24/2023
|
|
|
|
|
|
|
|
|
|
|
|
3,724
|
|
286,338
|
|
|
|
|
| |
|
1/24/2023
|
|
|
|
|
|
|
|
|
|
|
|
|
|
|
|
7,446
|
|
572,523
|
| |
|
|
|
|
|
|
|
|
|
|
|
|
|
|
|
|
|
|
|
|
| |
|
|
|
|
|
|
|
|
|
|
|
|
|
|
|
|
|
|
|
|
|
ZHIWEI CAI
|
|
1/26/2017
|
|
13,033
|
|
—
|
|
|
|
50.10
|
|
1/26/2027
|
|
|
|
|
|
|
|
|
| |
|
1/25/2018
|
|
16,375
|
|
—
|
|
|
|
53.57
|
|
1/25/2028
|
|
|
|
|
|
|
|
|
| |
|
1/24/2019
|
|
27,472
|
|
—
|
|
|
|
45.05
|
|
1/24/2029
|
|
|
|
|
|
|
|
|
| |
|
1/24/2020
|
|
28,985
|
|
—
|
|
|
|
48.35
|
|
1/24/2030
|
|
|
|
|
|
|
|
|
| |
|
1/27/2021
|
|
16,876
|
|
8,695
|
|
|
|
51.89
|
|
1/27/2031
|
|
|
|
|
|
|
|
|
| |
|
1/24/2022
|
|
5,081
|
|
10,317
|
|
|
|
72.94
|
|
1/24/2032
|
|
|
|
|
|
|
|
|
| |
|
1/24/2023
|
|
—
|
|
13,184
|
|
|
|
68.17
|
|
1/24/2033
|
|
|
|
|
|
|
|
|
| |
|
1/27/2021
|
|
|
|
|
|
|
|
|
|
|
|
1,142
|
|
87,808
|
|
|
|
|
| |
|
1/27/2021
|
|
|
|
|
|
|
|
|
|
|
|
|
|
|
|
4,028
|
|
309,713
|
| |
|
1/24/2022
|
|
|
|
|
|
|
|
|
|
|
|
1,532
|
|
117,795
|
|
|
|
|
| |
|
1/24/2022
|
|
|
|
|
|
|
|
|
|
|
|
|
|
|
|
4,568
|
|
351,234
|
| |
|
1/24/2023
|
|
|
|
|
|
|
|
|
|
|
|
6,770
|
|
520,545
|
|
|
|
|
| |
|
1/24/2023 |
|
|
|
|
|
|
|
|
|
|
|
|
|
|
|
4,400 |
|
338,316 |
| |
|
1/24/2023 |
|
|
|
|
|
|
|
|
|
|
|
2,201 |
|
169,235 |
|
|
|
|
| |
|
|
|
|
|
|
|
|
|
|
|
|
|
|
|
|
|
|
|
|
| |
|
|
|
|
|
|
|
|
|
|
|
|
|
|
|
|
|
|
|
|
|
JAMES J. EAST
|
|
1/24/2020
|
|
7,935
|
|
—
|
|
|
|
48.35
|
|
1/24/2030
|
|
|
|
|
|
|
|
|
| |
|
1/27/2021
|
|
4,018
|
|
2,070
|
|
|
|
51.89
|
|
1/27/2031
|
|
|
|
|
|
|
|
|
| |
|
1/24/2022
|
|
3,839
|
|
7,797
|
|
|
|
72.94
|
|
1/24/2032
|
|
|
|
|
|
|
|
|
| |
|
1/24/2023
|
|
—
|
|
13,184
|
|
|
|
68.17
|
|
1/24/2033
|
|
|
|
|
|
|
|
|
| |
|
1/27/2021
|
|
|
|
|
|
|
|
|
|
|
|
272
|
|
20,914
|
|
|
|
|
| |
|
1/27/2021
|
|
|
|
|
|
|
|
|
|
|
|
|
|
|
|
958
|
|
73,661
|
| |
|
1/24/2022
|
|
|
|
|
|
|
|
|
|
|
|
1,157
|
|
88,962
|
|
|
|
|
| |
|
1/24/2022
|
|
|
|
|
|
|
|
|
|
|
|
|
|
|
|
3,452
|
|
265,424
|
| |
|
1/24/2023
|
|
|
|
|
|
|
|
|
|
|
|
2,201
|
|
169,235
|
|
|
|
|
| |
|
1/24/2023
|
|
|
|
|
|
|
|
|
|
|
|
|
|
|
|
4,400
|
|
338,316
|
| |
|
|
|
|
|
|
|
|
|
|
|
|
|
|
|
|
|
|
|
|
| |
|
|
|
|
|
|
|
|
|
|
|
|
|
|
|
|
|
|
|
|
|
TRACI L. JENSEN
|
|
1/19/2016
|
|
29,832
|
|
—
|
|
|
|
33.38
|
|
1/19/2026
|
|
|
|
|
|
|
|
|
| |
|
1/26/2017
|
|
23,696
|
|
—
|
|
|
|
50.10
|
|
1/26/2027
|
|
|
|
|
|
|
|
|
| |
|
1/25/2018
|
|
21,834
|
|
—
|
|
|
|
53.57
|
|
1/25/2028
|
|
|
|
|
|
|
|
|
| |
|
1/24/2019
|
|
27,472
|
|
—
|
|
|
|
45.05
|
|
1/24/2029
|
|
|
|
|
|
|
|
|
| |
|
1/24/2020
|
|
14,492
|
|
—
|
|
|
|
48.35
|
|
1/24/2030
|
|
|
|
|
|
|
|
|
| |
|
1/27/2021
|
|
7,914
|
|
4,078
|
|
|
|
51.89
|
|
1/27/2031
|
|
|
|
|
|
|
|
|
| |
|
1/24/2022
|
|
2,722
|
|
5,527
|
|
|
|
72.94
|
|
1/24/2032
|
|
|
|
|
|
|
|
|
| |
|
1/24/2023
|
|
—
|
|
13,184
|
|
|
|
68.17
|
|
1/24/2033
|
|
|
|
|
|
|
|
|
| |
|
1/27/2021
|
|
|
|
|
|
|
|
|
|
|
|
535
|
|
41,136
|
|
|
|
|
| |
|
1/27/2021
|
|
|
|
|
|
|
|
|
|
|
|
|
|
|
|
1,888
|
|
145,168
|
| |
|
1/24/2022
|
|
|
|
|
|
|
|
|
|
|
|
821
|
|
63,127
|
|
|
|
|
| |
|
1/24/2022
|
|
|
|
|
|
|
|
|
|
|
|
|
|
|
|
2,448
|
|
188,227
|
| |
|
1/24/2023
|
|
|
|
|
|
|
|
|
|
|
|
2,201
|
|
169,235
|
|
|
|
|
| |
|
1/24/2023
|
|
|
|
|
|
|
|
|
|
|
|
|
|
|
|
4,400
|
|
338,316
|
| |
|
|
|
|
|
|
|
|
|
|
|
|
|
|
|
|
|
|
|
|
H. B. FULLER | 2024 Proxy Statement 49
EXECUTIVE COMPENSATION
|
(1)
|
NQSOs generally vest in three annual installments (33%, 33%, and 34%) beginning on the first anniversary of the grant date. Options become immediately exercisable upon retirement (age 55 and 10 years of service), death, disability, or change-in-control. A double trigger is required for vesting after a change-in-control after mid-fiscal 2018.
|
|
(2)
|
RSUs generally vest in three annual installments (33%, 33%, and 34%) beginning on the first anniversary of the grant date. The RSUs become immediately vested in the event of death, disability, and change-in-control. A double trigger is required for vesting after a change-in-control after mid-fiscal 2018. For Mr. Cai, the retention award of 6,770 RSUs, which includes accrued dividends since the grant date, is a one-time grant that will cliff-vest on January 24, 2025 subject to Mr. Cai remaining employed by the Company until the vesting date. There are no provisions for accelerated vesting of the units upon an earlier retirement. See "Analysis of Fiscal 2023 Base Salaries, Retention Awards, and Incentive Targets."
|
|
(3)
|
The market value is based on the closing price on December 1, 2023 (the last business day of the fiscal year) of $76.89.
|
|
(4)
|
Awards of stock units to NEOs are generally 50% RSUs and 50% PSUs. 50% of the stock unit grant is subject to a three-year ROIC target and cliff vests on the third anniversary of the grant date. For the awards granted in fiscal year 2021, the number of shares and payout value is based on the average fiscal year 2021-2023 ROIC performance and the number of shares and payout value presented in the table are based on actual performance. Performance for this period was above target but below superior and the shares paid out at 120.0% of target. For the awards granted in fiscal 2022 and 2023, the number of shares and payout value presented in the table assume superior performance.
|
OPTION EXERCISES AND STOCK VESTED—FISCAL YEAR 2023
The following table summarizes the number of options exercised and shares of restricted stock vested during fiscal year 2023 for each of the NEOs in the “Summary Compensation Table.”
| |
|
Option Awards
|
|
|
Stock Awards
|
|
|
Name
|
|
Number of Shares Acquired on Exercise (#)
|
|
|
Value Realized on Exercise ($)1
|
|
|
Number of Shares Acquired on Vesting (#)
|
|
|
Value Realized on Vesting ($)2
|
|
|
Celeste B. Mastin
|
|
|
— |
|
|
|
— |
|
|
|
1,241 |
|
|
|
79,548 |
|
|
John J. Corkrean
|
|
|
— |
|
|
|
— |
|
|
|
5,541 |
|
|
|
378,009 |
|
|
Zhiwei Cai
|
|
|
— |
|
|
|
— |
|
|
|
3,540 |
|
|
|
241,508 |
|
|
James J. East
|
|
|
— |
|
|
|
— |
|
|
|
1,289 |
|
|
|
87,916 |
|
|
Traci L. Jensen
|
|
|
22,789 |
|
|
|
694,347 |
|
|
|
1,762 |
|
|
|
120,203 |
|
|
(1)
|
The value realized on the exercise of options is the market price of a share of H.B. Fuller common stock at the time of exercise less the exercise price, multiplied by the number of shares exercised.
|
|
(2)
|
The value realized on the vesting of stock awards is the closing market price of a share of H.B. Fuller common stock on the date of vesting(s) multiplied by the number of vested shares.
|
H. B. FULLER | 2024 Proxy Statement 50
EXECUTIVE COMPENSATION
NONQUALIFIED DEFERRED COMPENSATION—FISCAL YEAR 2023
The following table summarizes information with respect to the participation of the NEOs in our nonqualified deferred compensation plans – the KEDCP and DC Restoration Plan. The Company makes a 1% non-discretionary contribution to the DC Restoration Plan and there is an opportunity for a discretionary contribution of 0% to 3% of eligible earnings in excess of IRS limits, based on EPS performance. For fiscal year 2023, no discretionary contribution was made based on Adjusted EPS of $3.87. The Company also makes a 4% matching contribution to the DC Restoration Plan in excess of IRS limits and a contribution of 7% of eligible earnings. Participation in the KEDCP is voluntary.
|
Name
|
Plan Name
|
|
Executive Contributions in Last FY ($)1
|
|
|
Registrant Contributions in Last FY ($)2
|
|
|
Aggregate Earnings in Last FY ($)
|
|
|
Aggregate Withdrawals /Distributions ($)
|
|
|
Aggregate Balance at Last FYE ($)3
|
|
|
Celeste B. Mastin
|
DC Restoration Plan
|
|
|
- |
|
|
|
137,010 |
|
|
|
- |
|
|
|
- |
|
|
|
137,010 |
|
|
John J. Corkrean
|
KEDCP
|
|
|
269,673 |
|
|
|
26,967 |
|
|
|
9,279 |
|
|
|
- |
|
|
|
1,360,359 |
|
| |
DC Restoration Plan
|
|
|
- |
|
|
|
100,255 |
|
|
|
42,527 |
|
|
|
- |
|
|
|
691,552 |
|
|
Zhiwei Cai
|
KEDCP
|
|
|
466,919 |
|
|
|
3,502 |
|
|
|
346,248 |
|
|
|
- |
|
|
|
4,049,941 |
|
| |
DC Restoration Plan
|
|
|
- |
|
|
|
73,372 |
|
|
|
38,365 |
|
|
|
- |
|
|
|
606,379 |
|
|
James J. East
|
KEDCP
|
|
|
141,003 |
|
|
|
4,230 |
|
|
|
29,951 |
|
|
|
(3,499 |
) |
|
|
657,083 |
|
| |
DC Restoration Plan
|
|
|
- |
|
|
|
78,865 |
|
|
|
16,800 |
|
|
|
- |
|
|
|
308,766 |
|
|
Traci L. Jensen
|
DC Restoration Plan
|
|
|
- |
|
|
|
68,790 |
|
|
|
77,941 |
|
|
|
- |
|
|
|
1,089,750 |
|
|
(1)
|
Only Mr. Corkrean, Mr. Cai, and Mr. East made contributions to the KEDCP during fiscal year 2023. The amount in this column: (i) for Mr. Corkrean is a deferral of fiscal year 2023 salary in the amount of $147,662 and short-term incentive related to fiscal year 2022 in the amount of $122,011; (ii) for Mr. Cai is a deferral of fiscal year 2023 salary in the amount of $172,032 and short-term incentive related to fiscal year 2022 in the amount of $294,887; and (iii) for Mr. East is a deferral of fiscal year 2023 salary in the amount of $35,231 and short-term incentive related to fiscal year 2022 in the amount of $105,772. The fiscal year 2023 salary deferrals for Mr. Corkrean, Mr. Cai, and Mr. East and which are deferred into phantom stock units are included in the “Salary” column of the “Summary Compensation Table.” Mr. Corkrean, Mr. Cai, and Mr. East also deferred amounts from their fiscal year 2023 short-term incentive awards and those amounts are included in the “Non-Equity Incentive Plan Compensation” column of the “Summary Compensation Table.” Participants are not allowed to make contributions to the DC Restoration Plan.
|
|
(2)
|
The amount in this column related to the KEDCP is also included in the “Stock Awards” column of the “Summary Compensation Table” and includes the Company’s 10% match under the KEDCP for any amounts deferred into the Company stock account. The Company contributions under the DC Restoration Plan are also included in the “All Other Compensation” column of the “Summary Compensation Table.”
|
|
(3)
|
Of the totals in this column, the table below sets forth amounts that were previously reported as compensation to the relevant NEOs in our “Summary Compensation Table” for previous years for the KEDCP and for the DC Restoration Plan.
|
|
Name
|
Plan Name
|
|
Amount previously reported as compensation to the named executive officer in our Summary Compensation Table for previous years(a)
|
|
|
Celeste B. Mastin
|
DC Restoration Plan
|
|
|
- |
|
|
John J. Corkrean
|
KEDCP
|
|
|
860,316 |
|
| |
DC Restoration Plan
|
|
|
548,770 |
|
|
Zhiwei Cai
|
KEDCP
|
|
|
1,772,342 |
|
| |
DC Restoration Plan
|
|
|
334,350 |
|
|
James J. East
|
KEDCP
|
|
|
- |
|
| |
DC Restoration Plan
|
|
|
- |
|
|
Traci L. Jensen
|
DC Restoration Plan
|
|
|
575,725 |
|
|
(a)
|
Amounts for the DC Restoration Plan also include earnings from previous fiscal years, which are not reported in the “Summary Compensation Table” in previous years.
|
Key Employee Deferred Compensation Plan. The KEDCP is a nonqualified deferred compensation plan that allows deferral of salary or short-term incentive awards on a pre-tax basis. Executive officers may defer up to 80% of their base salary or up to 100% of their short-term incentive award. The plan is unfunded and does not protect the executive from insolvency of the Company.
H. B. FULLER | 2024 Proxy Statement 51
EXECUTIVE COMPENSATION
Amounts deferred under the KEDCP are credited with earnings and investment gains and losses by assuming that deferred amounts were invested in one or more hypothetical investment options selected by the executive. Executive officers can change their investment elections at any time, except for investments in the Company stock fund, which can be changed annually. The one-year rates of return for such investments for fiscal 2023 are as follows:
| |
BNY Mellon Stock Index
|
|
16.12%
|
|
Janus Aspen Overseas Portfolio
|
|
6.50%
|
| |
BNY Mellon Variable Investment, Appreciation
|
|
15.22%
|
|
Janus Forty Portfolio
|
|
30.46%
|
| |
Fidelity VIP Equity-Income
|
|
2.16%
|
|
LVIP Baron Growth Opportunities Fund
|
|
5.79%
|
| |
Fidelity VIP Growth
|
|
25.72%
|
|
Morgan Stanley VIF U.S. Real Estate Portfolio
|
|
1.14%
|
| |
Fidelity VIP II Contrafund
|
|
24.16%
|
|
PIMCO VIT Real Return Portfolio
|
|
1.77%
|
| |
Fidelity VIP III Midcap SC
|
|
3.27%
|
|
PIMCO VIT Total Return Fund
|
|
2.48%
|
| |
Goldman Sachs VIT Mic Cap Value
|
|
0.52%
|
|
Royce Capital Fund Royce Micro-Cap
|
|
4.47%
|
| |
H.B. Fuller Company Stock
|
|
-4.76%
|
|
T Rowe Price Equity Income Portfolio II
|
|
0.12%
|
| |
Invesco V.I. Capital Appreciation Fund
|
|
24.61%
|
|
T Rowe Price Mid-Cap Growth Portfolio II
|
|
8.29%
|
| |
Invesco V.I. Global Fund
|
|
25.14%
|
|
|
|
|
Participants who invest in the Company stock fund are eligible to receive a 10% match in Company stock. The value of the matching contributions received, if any, is disclosed in the “Summary Compensation Table” in this Proxy Statement. During fiscal year 2023, only Mr. Corkrean, Mr. Cai, and Mr. East made contributions to this plan. In addition, the Compensation Committee may make discretionary contributions to a participant’s Company stock account under this plan. For fiscal year 2023, no discretionary contributions were made to any of the NEOs. Balances in the plan reflect amounts that have accumulated over time.
Executive officers are always 100% vested in their KEDCP account and are entitled to receive a distribution from their account under the following circumstances: separation from service, death, disability, age 65, date elected, or unforeseeable emergency that results in severe financial hardship that is consistent with the meaning of that term under section 409A of the Internal Revenue Code. Distributions are made in either a lump sum or, if previously elected by the executive officer, up to 11 annual installments. Distributions from the Company stock account will be in the form of stock and all other amounts will be distributed in cash.
Defined Contribution Restoration Plan. The DC Restoration Plan is a non-qualified unfunded retirement plan that is intended to provide for retirement benefits above amounts available under H.B. Fuller’s tax-qualified retirement plans. Participants in this plan receive annual credits in a bookkeeping account that is hypothetical in nature. Following are the four component accounts in the plan:
|
●
|
4% restoration plan match credit provides a contribution of 4% of eligible pay in excess of the IRS annual compensation limit if the participant defers the maximum allowed contribution under the H.B. Fuller Company 401(k) & Retirement Plan. Participants are immediately 100% vested in the value of the match restoration contribution.
|
|
●
|
1% “restoration non-elective” credit provides a contribution of 1% of eligible pay in excess of the IRS annual compensation limit.
|
|
●
|
The potential for 0-3% of eligible pay in excess of the IRS annual compensation limit based on EPS performance. Participants become vested after 3 years of service with the Company.
|
|
●
|
7% credit on all eligible earnings. Participants become vested after 3 years of participation in the DC Restoration Plan.
|
Interest on contributions is based on the daily Wall Street Journal prime rate when credited. Upon termination, the vested balance is paid in a lump sum approximately 90 days after the end of the sixth month after termination. Upon death or disability, the vested balance is paid in a lump sum approximately 90 days after date of death or after becoming totally disabled as defined by the plan.
Contributions made on behalf of NEOs under the DC Restoration Plan are disclosed in the “Summary Compensation Table” in this Proxy Statement.
POTENTIAL PAYMENTS UPON TERMINATION OR CHANGE-IN-CONTROL
In General
The Company has certain arrangements, policies, and practices covering the NEOs in this Proxy Statement that require it to provide compensation in the event of certain types of terminations, including certain terminations due to a change-in-control of the Company.
The information set forth below describes amounts that the Company would pay or provide to an NEO or their beneficiaries in each of the following situations: voluntary termination, involuntary for cause termination, involuntary not for cause termination or good reason termination, involuntary (not for cause) or good reason termination after a change-in-control, death, disability, and retirement. The estimated amounts payable are calculated as if the termination occurred on the last business day of the fiscal year, December 2, 2023, using the closing share price from the last business day of the fiscal year.
H. B. FULLER | 2024 Proxy Statement 52
EXECUTIVE COMPENSATION
We have not included payments or benefits that are fully disclosed in the “Nonqualified Deferred Compensation Table” in this Proxy Statement, unless such payment is enhanced or its vesting or other provisions are accelerated. We have also not included information or payments related to contracts, agreements, plans, or arrangements to the extent that they do not discriminate in scope, term, or operation in favor of the NEOs and that are available generally to all salaried employees. We call these benefits “general benefits” and they include:
|
●
|
401(k) Plan (or similar applicable plan)
|
|
●
|
Health and Welfare Benefits
|
|
●
|
Life Insurance Proceeds
|
Voluntary Termination
In the event of a voluntary termination as of the last business day of the fiscal year, the Company is not obligated to provide any enhanced benefits or accelerate vesting of any existing benefits of an NEO unless the NEO is retirement eligible. For all long-term incentive awards, retirement eligibility is defined as 55 years of age and 10 years of service. If an NEO is retirement eligible, stock options immediately vest upon retirement and RSUs and PSUs continue to vest pursuant to the terms of the award. However, if an NEO does not remain employed for 180 days from the grant date, the award is forfeited regardless of retirement eligibility.
Retirement
In the event of a retirement as of the last business day of the fiscal year, stock options immediately vest and RSUs and PSUs continue to vest pursuant to the terms of the award. Retirement eligibility is defined as 55 years of age and 10 years of service. If an NEO does not remain employed for 180 days from the grant date, the award is forfeited regardless of retirement eligibility.
Involuntary For Cause Termination
In the event of an involuntary for cause termination as of the last business day of the fiscal year, the Company is not obligated to provide any enhanced benefits or accelerate vesting of any existing benefits of an NEO. Under our long-term incentive award agreements, “cause” means any act by the NEO that is materially inimical to the best interests of the Company and that constitutes common law fraud, a felony, or other gross malfeasance of duty on the part of the Participant. In such a termination, all stock awards are forfeited.
Involuntary Not For Cause Termination or Good Reason Termination
In the event of an involuntary not for cause termination or a good reason termination as of the last business day of the fiscal year, an NEO’s compensation would be affected as follows.
We have a severance arrangement with each of the NEOs. If the NEO’s employment with the Company is involuntarily terminated at the initiative of the Company for any reason other than cause or disability or at the initiative of the executive for good reason and such termination does not occur during the protected period of a change-in-control, then the executive officer is entitled to receive certain severance benefits. Good reason means a material reduction of the executive officer’s base salary, material diminution in the executive officer’s authority and duties, or a required change of the executive officer’s principal work location of 50 miles or more. Protected period means the 24-month period immediately following each change-in-control. To receive severance, the executive officer must sign a release of claims in favor of the Company and be in compliance with the terms of the executive severance agreement, including, where permitted by local law, that the executive officer must agree not to compete with the Company or solicit customers or employees of the Company for two years after termination of employment. The severance benefit consists of the following:
|
●
|
A severance payment equal to one time (two times for the CEO) base salary plus target bonus, payable over the 12 months (24 months for the CEO) following termination. Any amount of this severance payment over the lesser of (a) $580,000 (for Ms. Mastin and Mr. East) or $490,000 (for Mr. Corkrean, Mr. Cai, and Ms. Jensen) or (b) two times the executive’s annualized compensation based upon the annual rate of pay for services to the Company for the calendar year prior to the calendar year in which the date of termination occurs, shall be paid out in a lump sum at the earliest of the executive’s death or six months after the date of termination.
|
H. B. FULLER | 2024 Proxy Statement 53
|
●
|
The executive is entitled to medical and dental insurance over 12 months (18 months for the CEO).
|
|
●
|
Outplacement services with a value up to $20,000.
|
Benefits under the DC Restoration Plan are not accelerated or automatically vested upon involuntary not for cause termination or good reason termination.
Involuntary (Not for Cause) Termination or Good Reason Termination after a Change-in-Control
We have entered into a change-in-control agreement with each of the NEOs. The initial three-year term of these agreements automatically extends for an additional year on each subsequent anniversary of the agreement unless our Board of Directors gives notice of non-renewal prior to an anniversary date. A protected period of 24 months follows each change-in-control of H.B. Fuller under the terms of these agreements. If during this protected period, the executive officer is terminated by the Company for any reason other than cause or disability, or the executive officer terminates his or her employment for good reason (including demotion, pay cut or certain relocations), the executive officer is entitled to receive a lump sum payment from us. The payment consists of the following:
|
●
|
The executive will receive a target STIP payment prorated to the date of the termination without application of any denial provisions based on unsatisfactory personal performance or any other reason.
|
|
●
|
A severance payment equal to three times the sum of: (a) the executive’s highest base salary, on an annualized basis, established by us during the period commencing three months prior to the occurrence of the change-in-control and ending on the date of the executive’s termination of employment; plus (b) the executive’s target annual incentive in effect immediately prior to the change-in-control.
|
|
●
|
A payment for outplacement services of up to $25,000.
|
|
●
|
In addition, the executive is entitled to medical and dental benefits for a three-year period following the termination of employment.
|
The Company does not include a tax gross-up provision for change-in-control agreements entered into starting in mid-fiscal year 2018 (for Ms. Mastin and Mr. East). The Company instead references a best of net provision whereby the individual is responsible for any excise tax, or the benefit is reduced to not trigger an excise tax. The Company would calculate both scenario estimates and the individual would receive the provision with the highest after-tax benefit estimate. For Mr. Corkrean, Mr. Cai, and Ms. Jensen, who entered into change-in-control agreements before fiscal year 2018, in the event severance payments are made to NEOs due to a change-in-control and if they are subject to an excise tax imposed by Section 280G of the Internal Revenue Code, where the 280G parachute value does not exceed 330% of the executive’s base amount, we will reduce the payments and benefits. Under these circumstances, the payments and benefits will be reduced so that the amount of the payments equals 299% of the base amount, which is the maximum amount that can be paid without imposition of an excise tax. If the payments and benefits are subject to an excise tax, where the 280G parachute value exceeds 330% of the executive’s base amount, we have agreed to reimburse the executive for the excise tax and for any taxes imposed upon the reimbursement. This is typically called a “gross-up.” The effects of the Internal Revenue Code are unpredictable and executive officers may have very different and unexpected effects based on their own compensation history. Therefore, these payments are intended to place an executive officer in the same position that they would have been in had they received the payments for reasons other than a change-in-control. The payments are not meant to pay regular income tax payments for an executive officer.
We have other compensatory arrangements with our NEOs that will be affected by a change-in-control. The DC Restoration Plan provides that if within two years after a change-in-control, we terminate an NEO’s employment without cause or the NEO terminates his or her employment for good reason (as defined in this plan), then three years shall be added to the participant’s years of credited service for purposes of determining benefits under the plan.
In addition, in the event of a change-in-control, all RSUs and any unvested stock options outstanding under our stock incentive plans immediately vest in full. For PSU grants, if termination under a change-in-control occurs during the performance period, the participant is entitled to vesting based on, and assuming that, performance would have been achieved at the target level. For any executive equity grant agreements beginning mid-fiscal year 2018, a double trigger will be required prior to accelerated equity vesting. This means that there must be a change-in-control of the Company and a termination of employment (or a material change to the NEO’s terms of employment (such as demotion, reduction in compensation, or required relocation)) for vesting to accelerate.
H. B. FULLER | 2024 Proxy Statement 54
EXECUTIVE COMPENSATION
Payments upon Death or Disability
In the event of a death or disability as of the last business day of the fiscal year, an NEO’s compensation would be affected as follows:
|
●
|
Stock options and RSUs would vest at death and at disability. For PSU grants, if death or disability occurs during the performance period, the participant is entitled to vesting based on, and assuming that, performance would have been achieved at the target level.
|
|
●
|
Benefits under the DC Restoration Plan would vest at death or disability.
|
H. B. FULLER | 2024 Proxy Statement 55
EXECUTIVE COMPENSATION
EXECUTIVE BENEFIT AND PAYMENTS UPON TERMINATION—FISCAL YEAR 2023
The following table shows potential estimated payments to the NEOs in this Proxy Statement upon (1) voluntary termination or retirement, (2) involuntary (not for cause) or good reason termination, (3) involuntary (not for cause) or good reason termination after a change-in-control, and (4) death or disability. The table assumes that the termination was effective on the last business day of the fiscal year and contains estimates of amounts that would be paid to the NEOs upon termination in addition to the base salary and short-term incentive earned by the executives during the fiscal year. Actual amounts payable to any NEO would only be determined after an actual event of termination.
|
Name
|
|
Voluntary Termination or Retirement ($)
|
|
|
Involuntary Not For Cause or Good Reason ($)
|
|
|
Payments upon Involuntary (not for cause) or Good Reason Termination after a Change- in-Control ($)
|
|
|
Death or Disability ($)
|
|
|
Celeste B. Mastin
|
|
|
- |
|
|
|
4,235,769 |
|
|
|
9,598,555 |
|
|
|
3,232,017 |
|
| |
|
|
|
|
|
|
|
|
|
|
|
|
|
|
|
|
|
John J. Corkrean
|
|
|
- |
|
|
|
1,123,846 |
|
|
|
7,554,467 |
|
|
|
2,089,872 |
|
| |
|
|
|
|
|
|
|
|
|
|
|
|
|
|
|
|
|
Zhiwei Cai
|
|
|
373,092 |
|
|
|
1,024,406 |
|
|
|
6,992,547 |
|
|
|
1,871,444 |
|
| |
|
|
|
|
|
|
|
|
|
|
|
|
|
|
|
|
|
James J. East
|
|
|
197,513 |
|
|
|
893,846 |
|
|
|
3,486,449 |
|
|
|
839,911 |
|
| |
|
|
|
|
|
|
|
|
|
|
|
|
|
|
|
|
|
Traci L. Jensen
|
|
|
238,746 |
|
|
|
883,821 |
|
|
|
3,356,797 |
|
|
|
896,526 |
|
H. B. FULLER | 2024 Proxy Statement 56
CEO PAY RATIO DISCLOSURE
As required by SEC rules and regulations, we are providing the following information regarding the ratio of the median annual total compensation of our employees and the annual total compensation of our CEO. For fiscal year 2023:
|
●
|
The median of the annual total compensation of all employees of our company, except for the CEO, was reasonably estimated to be $60,417.
|
|
●
|
The annual total compensation of our CEO, Ms. Mastin was $5,050,902.
|
|
●
|
Based on this information, the ratio of the annual total compensation of our CEO to the median of the annual total compensation of all other employees is estimated to be 84 to 1.
|
We are using a median employee that we identified for our analysis for fiscal year 2021. To identify our median employee, we began by considering everyone employed by us globally on September 3, 2021, which included approximately 6,522 employees. We then calculated total cash compensation for each employee including both current base salary and target cash incentive, and we annualized this amount for employees who commenced employment during the 2021 fiscal year. To calculate total cash compensation for any employee that we paid in currency other than U.S. Dollars, we converted to U.S. Dollars using the same exchange rate used for financial reporting purposes. We then analyzed the compensation amounts for all our employees to determine our median employee. As permitted by SEC rules and regulations, we excluded leased employees and independent contractors.
In our analysis for fiscal year 2022, we omitted approximately 328 employees who became employees as a result of acquisitions we completed during fiscal year 2022.These employees were included in fiscal year 2023 when determining whether or not a significant change occurred which would necessitate choosing a new median employee. In our analysis for fiscal year 2023, we omitted approximately 350 employees who became employees as a result of acquisitions we completed during fiscal year 2023. Based on our analysis for fiscal year 2023, we concluded that there were no changes in our employee population or employee compensation arrangements that the Company believes would result in a significant change to the pay ratio disclosure. The employees whom we omitted this year joined the Company in connection with the following acquisitions completed during fiscal year 2023: Lemtapes Oy; certain assets of Aspen Research Corporation; Beardow Adams Holdings Ltd.; XChem International LLC; Adhezion Biomedical, LLC; and certain assets of Sanglier Ltd.
For purposes of the calculation, we added together all the elements of the median employee’s compensation for fiscal year 2023 in the same way that we calculate the annual total compensation of our NEOs (including the CEO) in the “Summary Compensation Table.” To calculate our ratio, we divided Ms. Mastin's annual total compensation, as reported in the “Summary Compensation Table,” by the median employee’s annual total compensation.
H. B. FULLER | 2024 Proxy Statement 57
Pay Versus Performance
As required by Section 953(a) of the Dodd-Frank Wall Street Reform and Consumer Protection Act, and Item 402(v) of Regulation S-K, we are providing the following information about the relationship between executive "compensation actually paid" (CAP, as computed in accordance with SEC rules) and certain financial performance metrics of the Company. For further information concerning the Company’s pay for performance philosophy and how the Company aligns executive compensation with the Company’s performance, refer to “Compensation Discussion and Analysis.”
Pay Versus Performance Table
| |
|
|
|
|
|
|
|
|
|
|
|
|
|
|
|
|
|
Value of Initial Fixed $100 Investment Based On: |
|
|
|
|
|
|
|
|
|
|
Year
|
|
Summary Compensation Table Total for PEO ($)(1) |
|
|
“Compensation Actually Paid” to PEO ($)(2) |
|
|
Average Summary Compensation Table Total for Non-PEO NEOs ($)(3) |
|
|
Average “Compensation Actually Paid” to Non-PEO NEOs ($)(4) |
|
|
Total Shareholder Return ($)(5) |
|
|
Peer Group Total Shareholder Return ($)(6) |
|
|
Net Income
(millions)($)(7) |
|
|
Adjusted
EBITDA
(millions) ($)(8)
|
|
| |
|
|
|
|
|
|
|
|
|
|
|
|
|
|
|
|
|
|
|
|
|
|
|
|
|
|
|
|
|
|
|
|
|
2023
|
|
|
5,050,902 |
|
|
|
5,348,935 |
|
|
|
1,733,524 |
|
|
|
1,541,646 |
|
|
|
147.95 |
|
|
|
105.03 |
|
|
|
145 |
|
|
|
556 |
|
| |
|
|
|
|
|
|
|
|
|
|
|
|
|
|
|
|
|
|
|
|
|
|
|
|
|
|
|
|
|
|
|
|
| |
|
|
|
|
|
|
|
|
|
|
|
|
|
|
|
|
|
|
|
|
|
|
|
|
|
|
|
|
|
|
|
|
|
2022
|
|
|
9,625,758 |
|
|
|
12,914,989 |
|
|
|
2,365,901 |
|
|
|
2,675,267 |
|
|
|
152.83 |
|
|
|
120.59 |
|
|
|
180 |
|
|
|
533 |
|
| |
|
|
|
|
|
|
|
|
|
|
|
|
|
|
|
|
|
|
|
|
|
|
|
|
|
|
|
|
|
|
|
|
| |
|
|
|
|
|
|
|
|
|
|
|
|
|
|
|
|
|
|
|
|
|
|
|
|
|
|
|
|
|
|
|
|
|
2021
|
|
|
11,799,233 |
|
|
|
21,770,541 |
|
|
|
1,837,302 |
|
|
|
2,381,444 |
|
|
|
139.05 |
|
|
|
121.21 |
|
|
|
161 |
|
|
|
459 |
|
| |
|
|
|
|
|
|
|
|
|
|
|
|
|
|
|
|
|
|
|
|
|
|
|
|
|
|
|
|
|
|
|
|
|
(1)
|
Our Principal Executive Officer (PEO) for fiscal 2021 and 2022 was James J. Owens and for fiscal 2023 was Celeste B. Mastin. The dollar amounts reported are the amounts of total compensation reported in our "Summary Compensation Table."
|
|
(2)
|
The dollar amounts reported represent the amount of CAP. The dollar amounts do not reflect the actual amount of compensation earned or realized by or paid to an NEO during the applicable year. In accordance with SEC rules, the following adjustments were made to the PEO's total compensation, as reported in the "Summary Compensation Table," to determine the PEO's CAP:
|
|
Year
|
|
Reported Summary Compensation Table Total for PEO ($) |
|
|
Deduct: Reported Value of Equity Awards ($)(a) |
|
|
Add: Equity
Award
Adjustments ($)(b)
|
|
|
Deduct: Change in Actuarial Present Value of Pension Benefits ($)(c) |
|
|
Add: Pension
Benefit
Adjustments ($)(c)
|
|
|
Equals: “Compensation Actually Paid” to PEO ($) |
|
| |
|
|
|
|
|
|
|
|
|
|
|
|
|
|
|
|
|
|
|
|
|
|
|
|
|
2023
|
|
|
5,050,902 |
|
|
|
3,240,588 |
|
|
|
3,538,621 |
|
|
|
- |
|
|
|
- |
|
|
|
5,348,935 |
|
| |
|
|
|
|
|
|
|
|
|
|
|
|
|
|
|
|
|
|
|
|
|
|
|
|
| |
|
|
|
|
|
|
|
|
|
|
|
|
|
|
|
|
|
|
|
|
|
|
|
|
|
2022
|
|
|
9,625,758 |
|
|
|
5,118,606 |
|
|
|
8,407,837 |
|
|
|
- |
|
|
|
- |
|
|
|
12,914,989 |
|
| |
|
|
|
|
|
|
|
|
|
|
|
|
|
|
|
|
|
|
|
|
|
|
|
|
| |
|
|
|
|
|
|
|
|
|
|
|
|
|
|
|
|
|
|
|
|
|
|
|
|
|
2021
|
|
|
11,799,233 |
|
|
|
7,852,124 |
|
|
|
17,823,432 |
|
|
|
- |
|
|
|
- |
|
|
|
21,770,541 |
|
| |
|
|
|
|
|
|
|
|
|
|
|
|
|
|
|
|
|
|
|
|
|
|
|
|
|
(a)
|
The grant date fair value of equity awards represents the total of the amounts reported in the “Stock Awards” and “Option Awards” columns in the "Summary Compensation Table" for the applicable year.
|
|
(b)
|
The amounts (deducted) or added in calculating the equity award adjustments are set forth in the following table. The valuation assumptions used to calculate fair values did not materially differ from those disclosed at the time of grant.
|
|
(c)
|
No NEOs participate in the H.B. Fuller Legacy Pension Plan. |
H. B. FULLER | 2024 Proxy Statement 58
|
Year
|
|
Add: Year End Fair Value of Outstanding and Unvested Equity Awards Granted in the Year ($)
|
|
|
Add: Year over Year Change in Fair Value of Outstanding and Unvested Equity Awards Granted in Prior Years ($)
|
|
|
Add: Fair Value as of Vesting Date of Equity Awards Granted and Vested in the Year ($)
|
|
|
Add: Change in Fair Value from Prior Year End of Equity Awards Granted in Prior Years that Vested in the Year ($)
|
|
|
Deduct: Fair Value at the End of the Prior Year of Equity Awards that Failed to Meet Vesting Conditions in the Year ($)
|
|
|
Add: Value of Dividends or other Earnings Paid on Stock or Option Awards not Otherwise Reflected in Fair Value ($) |
|
|
Equals: Total Equity Award Adjustments ($)
|
|
| |
|
|
|
|
|
|
|
|
|
|
|
|
|
|
|
|
|
|
|
|
|
|
|
|
|
|
|
|
|
2023
|
|
|
3,754,816 |
|
|
|
(99,113 |
) |
|
|
- |
|
|
|
(117,081 |
) |
|
|
- |
|
|
|
- |
|
|
|
3,538,621 |
|
| |
|
|
|
|
|
|
|
|
|
|
|
|
|
|
|
|
|
|
|
|
|
|
|
|
|
|
|
|
| |
|
|
|
|
|
|
|
|
|
|
|
|
|
|
|
|
|
|
|
|
|
|
|
|
|
|
|
|
|
2022
|
|
|
6,101,567 |
|
|
|
2,659,513 |
|
|
|
- |
|
|
|
(353,243 |
) |
|
|
- |
|
|
|
- |
|
|
|
8,407,837 |
|
| |
|
|
|
|
|
|
|
|
|
|
|
|
|
|
|
|
|
|
|
|
|
|
|
|
|
|
|
|
| |
|
|
|
|
|
|
|
|
|
|
|
|
|
|
|
|
|
|
|
|
|
|
|
|
|
|
|
|
|
2021
|
|
|
14,246,777 |
|
|
|
3,854,019 |
|
|
|
- |
|
|
|
(277,364 |
) |
|
|
- |
|
|
|
- |
|
|
|
17,823,432 |
|
| |
|
|
|
|
|
|
|
|
|
|
|
|
|
|
|
|
|
|
|
|
|
|
|
|
|
|
|
|
|
(3)
|
The dollar amounts reported represent the average of the amounts reported for the Company’s named executive officers (NEOs) as a group (excluding our President and CEO) in the “Total” column of the "Summary Compensation Table" in each applicable year. These NEOs included for purposes of calculating the average amounts in each applicable year are as follows: (i) for fiscal 2023, Mr. Cai, Mr. Corkrean, Mr. East, and Ms. Jensen; (ii) for fiscal 2022, Mr. Cai, Heather Campe, our Senior Vice President, International Growth, Mr. Corkrean, and Ms. Mastin; and (iii) for fiscal 2021, Mr. Cai, Theodore M. Clark, our former Executive Vice President and Chief Operating Officer, Mr. Corkrean, M. Shahbaz Malik, our Senior Vice President, Construction Adhesives, and Andrew E. Tometich, our former Executive Vice President, Hygiene, Health and Consumable Adhesives.
|
|
(4)
|
The dollar amounts reported represent the average amount of CAP to the NEOs as a group (excluding our President and CEO). The dollar amounts do not reflect the actual average amount of compensation earned by or paid to these NEOs as a group during the applicable year. In accordance with the SEC rules, the following adjustments were made to average total compensation, as reported in the "Summary Compensation Table," for these NEOs to determine their average CAP, using the same methodology described above in Note 2:
|
|
Year
|
|
Average Reported Summary Compensation Table Total for Non-PEO NEOs ($)
|
|
|
Deduct: Average
Reported Value of
Equity Awards($)(a)
|
|
|
Add: Average Equity Award Adjustments($)(b)
|
|
|
Deduct: Average Change in Actuarial Present Value of
Pension Benefits ($)(c)
|
|
|
Add: Average
Pension Benefit
Adjustments ($)(c)
|
|
|
Equals: Average “Compensation Actually Paid” to Non-PEO NEOs ($)
|
|
| |
|
|
|
|
|
|
|
|
|
|
|
|
|
|
|
|
|
|
|
|
|
|
|
|
|
2023
|
|
|
1,733,524 |
|
|
|
814,172 |
|
|
|
622,294 |
|
|
|
- |
|
|
|
- |
|
|
|
1,541,646 |
|
| |
|
|
|
|
|
|
|
|
|
|
|
|
|
|
|
|
|
|
|
|
|
|
|
|
| |
|
|
|
|
|
|
|
|
|
|
|
|
|
|
|
|
|
|
|
|
|
|
|
|
|
2022
|
|
|
2,365,901 |
|
|
|
781,698 |
|
|
|
1,091,064 |
|
|
|
- |
|
|
|
- |
|
|
|
2,675,267 |
|
| |
|
|
|
|
|
|
|
|
|
|
|
|
|
|
|
|
|
|
|
|
|
|
|
|
| |
|
|
|
|
|
|
|
|
|
|
|
|
|
|
|
|
|
|
|
|
|
|
|
|
|
2021
|
|
|
1,837,302 |
|
|
|
810,273 |
|
|
|
1,354,415 |
|
|
|
- |
|
|
|
- |
|
|
|
2,381,444 |
|
| |
|
|
|
|
|
|
|
|
|
|
|
|
|
|
|
|
|
|
|
|
|
|
|
|
|
(a)
|
The grant date fair value of equity awards represents the total of the amounts reported in the “Stock Awards” and “Option Awards” columns in the "Summary Compensation Table" for the applicable year.
|
|
(b)
|
The amounts deducted or added in calculating the equity award adjustments are set forth in the following table. The valuation assumptions used to calculate fair values did not materially differ from those disclosed at the time of grant.
|
|
(c)
|
No NEOs participate in the H.B. Fuller Legacy Pension Plan. |
|
Year
|
|
Add: Average Year End Fair Value of Outstanding and Unvested Equity Awards Granted in the Year ($)
|
|
|
Add: Average Year over Year Change in Fair Value of Outstanding and Unvested Equity Awards Granted in Prior Years ($)
|
|
|
Add: Average Fair Value as of Vesting Date of Equity Awards Granted and Vested in the Year ($)
|
|
|
Add: Average Change in Fair Value from Prior Year End of Equity Awards Granted in Prior Years that Vested in the Year ($)
|
|
|
Deduct: Average Fair Value at the End of the Prior Year of Equity Awards that Failed to Meet Vesting Conditions in the Year ($)
|
|
|
Add: Average Value of Dividends or other Earnings Paid on Stock or Option Awards not Otherwise Reflected in Fair Value ($)
|
|
|
Equals: Average Total Equity Award Adjustments ($)
|
|
| |
|
|
|
|
|
|
|
|
|
|
|
|
|
|
|
|
|
|
|
|
|
|
|
|
|
|
|
|
|
2023
|
|
|
932,268 |
|
|
|
(87,160 |
) |
|
|
6,552 |
|
|
|
(229,366 |
) |
|
|
- |
|
|
|
- |
|
|
|
622,294 |
|
| |
|
|
|
|
|
|
|
|
|
|
|
|
|
|
|
|
|
|
|
|
|
|
|
|
|
|
|
|
| |
|
|
|
|
|
|
|
|
|
|
|
|
|
|
|
|
|
|
|
|
|
|
|
|
|
|
|
|
|
2022
|
|
|
952,615 |
|
|
|
188,553 |
|
|
|
8,304 |
|
|
|
(39,896 |
) |
|
|
(18,512 |
) |
|
|
- |
|
|
|
1,091,064 |
|
| |
|
|
|
|
|
|
|
|
|
|
|
|
|
|
|
|
|
|
|
|
|
|
|
|
|
|
|
|
| |
|
|
|
|
|
|
|
|
|
|
|
|
|
|
|
|
|
|
|
|
|
|
|
|
|
|
|
|
|
2021
|
|
|
1,115,084 |
|
|
|
394,490 |
|
|
|
5,412 |
|
|
|
(25,366 |
) |
|
|
(135,205 |
) |
|
|
- |
|
|
|
1,354,415 |
|
| |
|
|
|
|
|
|
|
|
|
|
|
|
|
|
|
|
|
|
|
|
|
|
|
|
|
|
|
|
|
(5)
|
Cumulative TSR is based on a fixed investment of $100 in the Company's common stock measured from the beginning of the measurement period (November 27, 2020) through and including the end of each applicable fiscal year. Return includes (a) the cumulative amount of dividends for the measurement period, assuming dividend reinvestment, and (b) the difference between the Company's share price at the end of each applicable year and the beginning of the measurement period.
|
|
(6)
|
Represents the peer group cumulative TSR, weighted according to the respective companies’ stock market capitalization at the beginning of each measurement period for which a return is indicated. The peer group used for this purpose is the Dow Jones U.S. Specialty Chemicals Index.
|
H. B. FULLER | 2024 Proxy Statement 59
|
(7)
|
The dollar amounts reported represent the amount of net income reflected in the Company’s audited financial statements for the applicable year.
|
|
(8)
|
The Compensation Committee has selected Adjusted EBITDA as the Company-Selected Measure representing the most important financial measure used to link CAP to the NEOs in fiscal 2023 to Company performance. Adjusted EBITDA is, along with Adjusted Net Revenue, the most heavily-weighted metric of our STIP metrics, and under our pay-for-performance approach the STIP represents a significant portion of the NEOs’ compensation. Adjusted EBITDA is a non-U.S. GAAP financial measure defined in "Fiscal 2023 Short-Term Incentive Compensation." See “Annex A” for information concerning this measure including a reconciliation to the most comparable U.S. GAAP financial measure.
|
Description of Certain Relationships
The graphs below compare the CAP to our President and CEO and the average of the CAP to our other NEOs, with (i) our cumulative TSR, (ii) our net income, and (iii) our Adjusted EBITDA, in each case for our 2021, 2022, and 2023 fiscal years. The graphs below also compare our cumulative TSR and our peer group cumulative TSR for our 2021, 2022, and 2023 fiscal years. TSR amounts assume $100 invested on November 27, 2020 and reinvestment of dividends.
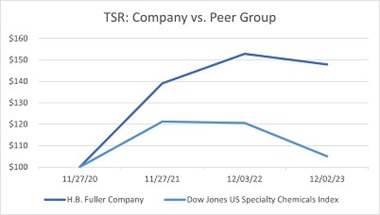
H. B. FULLER | 2024 Proxy Statement 60
Financial Performance Measures
The most important financial performance measures used by the Company to link CAP to the Company’s NEOs in fiscal 2023 to the Company’s performance are listed below. These metrics are further described in “Key Elements of Executive Compensation Program.”
| |
● |
Adjusted EBITDA
|
| |
● |
Adjusted EPS
|
| |
● |
Adjusted Net Revenue
|
| |
● |
ROIC
|
H. B. FULLER | 2024 Proxy Statement 61
PROPOSAL 3—NON-BINDING ADVISORY
VOTE ON EXECUTIVE COMPENSATION
Pursuant to Section 14A of the Exchange Act, the Company is providing shareholders with an advisory (non-binding) vote on the compensation of our NEOs as disclosed in the “Compensation Discussion and Analysis” section, the tabular disclosure regarding such compensation and the accompanying narrative disclosure contained in this Proxy Statement.
The Company is asking shareholders to indicate their support for the compensation of our NEOs described in this Proxy Statement. The Company has designed its executive compensation program to attract, motivate, reward, and retain the executive talent required to achieve our corporate growth objectives and increase shareholder value. We believe that our compensation policies and procedures are centered on a pay-for-performance philosophy and are strongly aligned with the long-term interests of our shareholders.
In deciding how to vote on this proposal, the Board urges you to consider the following factors:
|
●
|
The Compensation Committee has designed our executive compensation program to be competitive with the compensation offered by those peers with whom we compete for management talent.
|
|
●
|
The Compensation Committee believes the Company’s executive compensation programs have been effective at providing our executive officers with incentive to achieve short-term financial performance goals and to engage long-term decision making that is in the best interests of our shareholders.
|
|
●
|
Effective for LTIP awards granted in fiscal year 2021 and thereafter, PSUs moved from three-year ratable vesting to three-year cliff vesting. The ROIC metric for these PSUs did not change. However, the metric now has a three-year target. Cliff vesting better aligns with our focus on overall ROIC performance over the three-year performance period of the award, incentivizes long-term strategic thinking and behavior, and enhances the retention value of the award.
|
|
●
|
Company best practices include:
|
| |
•
|
A policy regarding “clawbacks” of executive and key manager incentive compensation if there is a restatement of the Company’s financial statements or if there is misconduct by an executive or key manager;
|
| |
•
|
A prohibition on hedging, pledging, and certain other transactions in the Company's securities by directors and executive officers;
|
| |
•
|
Policies for responsible share usage and governance of our equity compensation plans, including a prohibition on re-pricing of stock options;
|
| |
•
|
For equity grants to NEOs, beginning in mid-fiscal year 2018, a double trigger for accelerated equity vesting upon a change-in-control;
|
| |
•
|
Removal of tax gross-up provisions from change-in-control agreements entered into beginning in mid-fiscal year 2018; and
|
| |
•
|
Stock ownership goals of five times base salary for our CEO, three times base salary for our CFO, and two times base salary for our other executive officers, which goals are reviewed annually.
|
Accordingly, the Company is asking shareholders to vote FOR the following resolution at the Annual Meeting:
“RESOLVED, that the shareholders approve, on an advisory basis, the compensation of the H.B. Fuller Company named executive officers, as disclosed in the “Compensation Discussion and Analysis” section, the tabular disclosure regarding such compensation, and the accompanying narrative disclosure, set forth in this Proxy Statement.”
This advisory vote on executive compensation is not binding on the Board. However, the Board will consider the result of the vote when determining future executive compensation arrangements. The Company currently conducts annual advisory votes on executive compensation.
| |
|
The Board of Directors recommends a vote FOR adoption of the resolution approving the compensation of the Company’s named executive officers, as described in the “Compensation Discussion and Analysis” section and the related tabular and narrative disclosure set forth in this Proxy Statement.
|
H. B. FULLER | 2024 Proxy Statement 62
QUESTIONS AND ANSWERS ABOUT THE MEETING
QUESTIONS AND ANSWERS
ABOUT THE MEETING
What is the purpose of the meeting?
At our Annual Meeting, shareholders will act upon the matters disclosed in the Notice of Annual Meeting of Shareholders that accompanies this Proxy Statement. These matters include the election of three directors, the ratification of the appointment of our independent registered public accounting firm, and a non-binding advisory vote to approve the compensation of our named executive officers as disclosed in this Proxy Statement (the “Say on Pay Proposal”).
How can I attend the virtual meeting and vote my shares during the meeting?
If you are a shareholder of record, you may attend the meeting and vote your shares electronically during the virtual meeting by visiting www.virtualshareholdermeeting.com/FUL2024. You will need the 16-digit control number that is printed in the box marked by the arrow on your Notice Regarding the Availability of Proxy Materials to enter the Annual Meeting. We recommend that you log in at least 15 minutes before the meeting to ensure that you are logged in when the meeting starts. However, even if you currently plan to attend the virtual meeting, we recommend that you submit your proxy ahead of time so that your vote will be counted if, for whatever reason, you later decide to not attend the virtual meeting.
If you encounter any difficulties accessing the virtual meeting during the check-in or meeting time, please call the technical support number that will be posted on the Virtual Shareholder Meeting log in page. The virtual meeting website will also present an option for you to attend the Annual Meeting as a guest without logging in, but guests will not be able to vote during the Annual Meeting.
If you are a participant in the 401(k) Plan, you may submit a proxy vote as described above, but you may not vote your 401(k) Plan shares during the virtual meeting.
How will management respond to questions during the virtual meeting?
The Company has held its Annual Meeting of Shareholders as a virtual meeting webcast via the Internet since 2016. While our Annual Meeting is just one of the forums where we engage with shareholders, it is an important one. The Board believes that holding the Annual Meeting in a virtual format provides the opportunity for participation by a broader group of shareholders, while reducing the costs and environmental impact associated with planning, holding, and arranging logistics for an in-person meeting. We welcome your suggestions on how we can improve our virtual meeting and make it more effective and efficient.
Management will respond to questions from shareholders in the same way as it would if the Company held an in-person meeting. Shareholders who wish to submit a question to the Company for the meeting may do so in advance at www.proxyvote.com and live during the meeting at www.virtualshareholdermeeting.com/FUL2024. You will need the 16-digit control number that is printed in the box marked by the arrow on your Notice Regarding the Availability of Proxy Materials to enter the Annual Meeting. We recommend that you log in at least 15 minutes before the meeting to ensure that you are logged in when the meeting starts.
We intend that the virtual meeting format provide shareholders a level of participation and transparency as close as possible to the traditional in-person meeting format, and we take the following steps to ensure such an experience:
|
●
|
providing shareholders with the ability to submit appropriate questions in advance of the meeting to ensure thoughtful responses from management and the Board;
|
|
●
|
providing shareholders with the ability to submit appropriate questions real-time, limiting questions to one per shareholder unless time otherwise permits;
|
H. B. FULLER | 2024 Proxy Statement 63
QUESTIONS AND ANSWERS ABOUT THE MEETING
|
●
|
answering as many questions as possible in the time allotted for the meeting (the question-and-answer session will be limited to 15 minutes), without discrimination, if the questions are submitted in accordance with the meeting rules of conduct (for example, the Company does not intend to answer questions that are irrelevant to the business of the Company or to the business of the Annual Meeting);
|
|
●
|
if there are appropriate questions that we cannot answer during the meeting, we will post the questions and answers thereto on www.hbfuller.com in the Investor Relations area of our website; and
|
|
●
|
offering separate engagement opportunities with shareholders on appropriate matters of governance or other relevant topics as outlined under the “Communications with Directors” section on page 19 in this Proxy Statement.
|
How does the Board recommend that I vote?
The Board of Directors recommends a vote “FOR” each of the nominees for director, “FOR” the ratification of the appointment of Ernst & Young LLP as our independent registered public accounting firm for the fiscal year ending November 30, 2024, and “FOR” the Say on Pay Proposal.
Who is entitled to vote at the meeting?
If you were a shareholder of record at the close of business on February 14, 2024, you are entitled to vote at the meeting.
As of the record date, 54,435,548 shares of common stock of the Company were outstanding and eligible to vote.
What is the difference between a shareholder of record and a street name holder?
If your shares are registered directly in your name, you are considered the “shareholder of record” with respect to those shares.
If your shares are held in a stock brokerage account or by a bank or other nominee, you are considered the beneficial owner of those shares, and your shares are held in street name.
What are the voting rights of the shareholders?
Holders of common stock are entitled to one vote per share. Therefore, a total of 54,435,548 votes are entitled to be cast at the meeting. There is no cumulative voting for the election of directors.
How many shares must be present to hold the meeting?
A quorum is necessary to hold the meeting and conduct business. The presence of shareholders who can direct the voting of at least a majority of the outstanding shares of Common Stock as of the record date is considered a quorum. A shareholder is counted as present at the meeting if the shareholder logs in to the virtual meeting and votes at the meeting or if the shareholder has properly submitted a proxy by mail, telephone, or Internet.
How do I vote my shares?
You may give a proxy to be voted at the meeting either:
|
●
|
by Internet or telephone, by following the instructions provided in the Notice of Internet Availability of Proxy Materials, or proxy card; or
|
|
●
|
if you received printed proxy materials, you may also vote by Internet, mail, or telephone as instructed on the proxy card, or if you hold shares beneficially in street name, the voting instruction card provided to you by your broker, bank, trustee, or nominee.
|
The telephone and Internet voting procedures have been set up for your convenience. The procedures have been designed to authenticate your identity, to allow you to give voting instructions, and to confirm that those instructions have been recorded properly. You may also vote at the virtual meeting as described in “How can I attend the virtual meeting and vote my shares during the meeting?” above.
H. B. FULLER | 2024 Proxy Statement 64
QUESTIONS AND ANSWERS ABOUT THE MEETING
If you hold any shares of common stock in the 401(k) Plan, you are being provided access to the same proxy materials as any other shareholder of record. However, your proxy vote will serve as voting instructions to the plan trustee. The shares held in the 401(k) Plan will be voted by the applicable plan trustee.
What does it mean if I receive more than one Notice of Internet Availability of Proxy Materials, proxy card or voting instruction card?
It means you hold shares of common stock in more than one account. To ensure that all your shares are voted, sign and return each proxy card or voting instruction card or, if you vote by telephone or via the Internet, vote once for each proxy card, voting instruction card, or Notice of Internet Availability of Proxy Materials you receive.
What vote is required for the proposals to be approved?
Each director is elected by a plurality of the votes cast, meaning that the three nominees receiving the most votes will be elected. However, in an uncontested election, if a nominee for director receives a greater number of votes “WITHHELD" from his or her election than votes “FOR” such election, the director shall submit to the Board a letter of resignation for consideration. See the heading “Director Elections” in the “Corporate Governance” section of this Proxy Statement for more information. With respect to the ratification of the appointment of Ernst & Young LLP as our independent registered public accounting firm and the Say On Pay Proposal, the affirmative vote of a majority of the shares of common stock represented and entitled to vote on each proposal is required, provided that the total number of shares of common stock that vote in favor of the proposal represents more than 25% of the shares outstanding on the record date.
How are votes counted?
Shareholders may either vote “FOR” or “WITHHOLD” authority to vote for each nominee for election to the Board. Shareholders may vote “FOR,” “AGAINST,” or “ABSTAIN” on the ratification of the appointment of Ernst & Young LLP and the Say on Pay Proposal.
If you vote "ABSTAIN" or "WITHHOLD," your shares will be counted as present at the meeting for the purposes of determining a quorum. If you "ABSTAIN" from voting on any proposal, your abstention has the same effect as a vote against that proposal. If you "WITHHOLD" authority to vote for one or more of the nominees for director, this withholding of authority to vote will have no effect on the election of any director from whom votes are withheld, unless the director receives a greater number of votes “WITHHELD” from his or her election than votes “FOR” such election, in which case the director shall submit to the Board a letter of resignation for consideration. See the heading “Director Elections” in the “Corporate Governance” section of this Proxy Statement for more information.
If you hold your shares in street name and do not provide voting instructions to your broker or nominee, your shares will be considered to be “broker non-votes” and will not be voted on any proposal on which your broker or nominee does not have discretionary authority to vote under the rules of the NYSE. Shares that constitute broker non-votes will be present at the meeting for the purpose of determining a quorum but are not considered entitled to vote on the proposal in question. Your broker or nominee has discretionary authority to vote your shares on the ratification of Ernst & Young as our independent registered public accounting firm even if your broker or nominee does not receive voting instructions from you. Your broker or nominee may not vote your shares on the election of directors or the Say on Pay Proposal unless it receives voting instructions from you. Broker non-votes will generally have no effect in determining whether any proposals to be voted on at the meeting are approved.
What if I do not specify how I want my shares voted?
If you do not specify on your returned proxy card or voting instruction card (or when giving your proxy by telephone or via the Internet) how you want to vote your shares, we will vote them:
|
●
|
FOR all the nominees for director;
|
|
●
|
FOR the ratification of the appointment of Ernst & Young as our independent registered public accounting firm for fiscal year ending November 30, 2024;
|
|
●
|
FOR the Say on Pay Proposal; and
|
|
●
|
with respect to such other matters that may properly come before the meeting, in accordance with the judgment of the persons named as proxies.
|
H. B. FULLER | 2024 Proxy Statement 65
QUESTIONS AND ANSWERS ABOUT THE MEETING
Can I change my vote?
Yes. If you are a shareholder of record, you may change your vote and revoke your proxy at any time before it is voted at the virtual meeting in any of the following ways:
|
●
|
by sending a written notice of revocation to our Corporate Secretary;
|
|
●
|
by submitting another properly signed proxy card later to our Corporate Secretary;
|
|
●
|
by submitting another proxy by telephone or via the Internet later; or
|
|
●
|
by voting electronically at the virtual meeting.
|
If you are a street name holder, please consult your broker, bank, trustee, or nominee for instructions on how to change your vote.
Who pays for the cost of proxy preparation and solicitation?
We pay for the cost of proxy preparation and solicitation, including the charges and expenses of brokerage firms or other nominees for forwarding proxy materials to beneficial owners of shares held in street name. We have engaged Alliance Advisors, LLC to assist in the solicitation of proxies and to provide related advice and informational support, for a services fee and the reimbursement of customary disbursements which are not expected to exceed $26,000 in total.
We are soliciting proxies primarily by mail. In addition, proxies may be solicited by telephone or facsimile, or personally by our directors, officers, and regular employees. These individuals will receive no compensation (other than their regular salaries) for these services.
Why did I receive a notice in the mail regarding the Internet availability of proxy materials instead of a full set of paper copies?
In accordance with rules adopted by the SEC, we may furnish proxy materials to our shareholders by providing access to these documents on the Internet instead of mailing printed copies. In general, you will not receive printed copies of the materials unless you request them. Instead, we mailed you the Notice of Internet Availability of Proxy Materials (unless you have previously consented to electronic delivery or already requested to receive paper copies), which instructs you as to how you may access and review all the proxy materials on the Internet. The Notice of Internet Availability of Proxy Materials explains how to submit your proxy over the Internet or by telephone. If you would like to receive a paper copy or e-mail copy of the proxy materials, please follow the instructions provided in the Notice of Internet Availability of Proxy Materials.
Are the proxy and related materials available electronically?
Yes. Our Proxy Statement and 2023 Annual Report, including our Annual Report on Form 10-K, are available at www.proxyvote.com.
Will any other business be considered at the meeting?
Our Bylaws provide that a shareholder may present a proposal at the Annual Meeting that is not included in this Proxy Statement only if proper written notice was received by us. No shareholder has given the timely notice required by our Bylaws to present a proposal at the Annual Meeting. The Board does not intend to present any other matters for a vote at the Annual Meeting. If you wish to present a proposal at the 2025 Annual Meeting, please see “How can a shareholder present a proposal at the 2025 Annual Meeting?” As of the date of this Proxy Statement, we do not know of any other business to be presented for consideration at the Annual Meeting.
How can a shareholder present a proposal at the 2025 Annual Meeting?
For a shareholder proposal to be considered for inclusion in our Proxy Statement for the 2025 Annual Meeting, the written proposal must be received at our principal executive offices by the close of business on October 31, 2024. The proposal must comply with SEC rules regarding the inclusion of shareholder proposals in company-sponsored proxy materials.
H. B. FULLER | 2024 Proxy Statement 66
QUESTIONS AND ANSWERS ABOUT THE MEETING
If a shareholder wishes to present a proposal or to nominate a director at the 2025 Annual Meeting that would not be included in our Proxy Statement for such meeting, the shareholder must provide notice to us no later than the close of business on January 13, 2025 and no earlier than the close of business on December 12, 2024. The proposal or nomination must comply with the requirements set forth in our Bylaws. In addition, notice of a nomination must comply with the additional requirements of Rule 14a-19(b) of the Exchange Act. Please contact the Corporate Secretary for a description of the steps to be taken to present such a proposal or to nominate a director.
How can a shareholder get a copy of the Company’s 2023 Annual Report on Form 10-K?
If you receive a printed copy of the proxy materials in the mail, our 2023 Annual Report, including our Annual Report on Form 10-K for the year ended December 2, 2023, accompanies this Proxy Statement. The 2023 Annual Report, including our Annual Report on Form 10-K, is also available via the internet in the “Financials” section of our Investor Relations page of our website (www.hbfuller.com). If requested, we will provide you a paper copy of the 2023 Annual Report, including our Annual Report on Form 10-K without charge. We will also provide you with copies of any exhibits to the Form 10-K, upon written request and upon payment of a fee covering our reasonable expenses in furnishing the exhibits. You can request a paper copy of the 2023 Annual Report, or paper copies of exhibits to the Form 10-K by writing to the Corporate Secretary, H.B. Fuller Company, P.O. Box 64683, St. Paul, Minnesota 55164-0683.
How do I contact the Corporate Secretary?
The Corporate Secretary is Gregory O. Ogunsanya. The mailing address is the Office of the Corporate Secretary, P.O. Box 64683, St. Paul, Minnesota 55164-0683.
H. B. FULLER | 2024 Proxy Statement 67
“HOUSEHOLDING” OF PROXY MATERIALS
The SEC rules allow a single copy of the Proxy Statement, Annual Report and Notice of Internet Availability of Proxy Materials to be delivered to multiple shareholders sharing the same address and last name, or who we reasonably believe are members of the same family, and who consent to receive a single copy of these materials in a manner provided by these rules. This practice is referred to as “householding” and can result in significant savings of paper and mailing costs. Although we do not household for our registered shareholders, some brokers household H.B. Fuller proxy statements and annual reports, delivering a single copy of each to multiple shareholders sharing an address unless contrary instructions have been received from the affected shareholders. Once you have received notice from your broker that they will be householding materials to your address, householding will continue until you are notified otherwise or until you revoke your consent. If, at any time, you no longer wish to participate in householding and would prefer to receive a separate copy of our Proxy Statement, Annual Report, or Notice of Internet Availability of Proxy Materials, or if you are receiving multiple copies of either document and you wish to receive only one, please notify your broker. The Company will deliver promptly upon written or oral request a separate copy of our Proxy Statement, Annual Report, and/or Notice of Internet Availability of Proxy Materials to a shareholder at a shared address to which a single copy of either document was delivered. For copies of either or both documents, shareholders should contact the Corporate Secretary, H.B. Fuller Company, at P.O. Box 64683, St. Paul, Minnesota 55164-0683, or call (651) 236-5825.
H. B. FULLER | 2023 Proxy Statement 68
ANNEX A
RECONCILIATION OF NON-GAAP FINANCIAL INFORMATION
Certain financial information presented in this proxy statement does not conform to generally accepted accounting principles (GAAP) and should not be construed as an alternative to the reported financial results of the Company determined in accordance with GAAP. We have included this non-GAAP information to assist in understanding the operating performance of the Company as well as the comparability of results. Such non-GAAP information provided may not be consistent with methodologies used by other companies. The non-GAAP information is reconciled with the most directly comparable GAAP results in the tables below. All information is in thousands (except per share amounts) and is unaudited.
ADJUSTED DILUTED EARNINGS PER SHARE – NON-GAAP RECONCILIATION
| |
|
For the Fiscal Year
Ended December 2, 2023
|
|
|
For the Fiscal Year
Ended December 3, 2022
|
|
|
Fiscal Year 2022 to Fiscal Year 2023 Increase (Decrease)
|
|
|
Net income attributable to H.B. Fuller (GAAP)
|
|
$ |
144,906 |
|
|
$ |
180,313 |
|
|
|
(20 |
%) |
|
Acquisition project costs
|
|
|
16,874 |
|
|
|
10,830 |
|
|
|
|
|
|
Organizational realignment
|
|
|
29,900 |
|
|
|
6,386 |
|
|
|
|
|
|
Royal restructuring and integration
|
|
|
0 |
|
|
|
2,474 |
|
|
|
|
|
|
Project One
|
|
|
9,815 |
|
|
|
9,885 |
|
|
|
|
|
|
Other
|
|
|
(611 |
) |
|
|
12,791 |
|
|
|
|
|
|
Discrete tax items
|
|
|
26,085 |
|
|
|
9,308 |
|
|
|
|
|
|
Income tax effect on adjustments
|
|
|
(10,604 |
) |
|
|
(10,699 |
) |
|
|
|
|
|
Adjusted net income attributable to H.B. Fuller (non-GAAP)
|
|
$ |
216,365 |
|
|
$ |
221,288 |
|
|
|
|
|
|
Diluted shares
|
|
|
55,958 |
|
|
|
55,269 |
|
|
|
|
|
|
Diluted earnings per share (GAAP)
|
|
$ |
2.59 |
|
|
$ |
3.26 |
|
|
|
(21 |
%) |
|
Adjusted diluted earnings per share (Adjusted EPS) (non-GAAP)1
|
|
$ |
3.87 |
|
|
$ |
4.00 |
|
|
|
(3 |
%) |
| |
(1)
|
Adjusted EPS is a non-GAAP financial measure and excludes the after-tax items shown on the reconciliation table above, including costs related to accounting for acquisitions, costs associated with organizational realignment to support the Company’s strategic plan; costs associated with the integration and restructuring of the acquired Royal business; Project ONE development costs; and other costs.
|
In calculating results used for our STIP, additional adjustments are made to non-GAAP business results used for financial reporting purposes to eliminate the impact of acquisitions (for Adjusted EBITDA and Adjusted Net Revenue, but not for Adjusted EPS) and other items to ensure that actual results used for our STIP are comparable to targets.
NET REVENUE - GAAP AMOUNT TO ADJUSTED NET REVENUE
AMOUNT USED FOR THE STIP
Fiscal Year Ended December 2, 2023
|
Net Revenue (GAAP)
|
|
$ |
3,510,934 |
|
|
Adjustments for acquisitions
|
|
$ |
(94,277 |
) |
|
Foreign Exchange Adjustment to Budget Rates
|
|
|
(65,923 |
) |
|
Adjusted Net Revenue – STIP (non-GAAP)
|
|
$ |
3,350,734 |
|
H. B. FULLER | 2024 Proxy Statement A-1
ANNEX A
NET INCOME - GAAP AMOUNT TO ADJUSTED EBITDA USED FOR THE STIP
Fiscal Year Ended December 2, 2023
| |
|
For the Fiscal Year
Ended December 2, 2023
|
|
|
For the Fiscal Year
Ended December 3, 2022
|
|
|
Fiscal Year 2022 to Fiscal Year 2023 Increase (Decrease)
|
|
|
Net Income attributable to H.B. Fuller (GAAP)
|
|
$ |
144,906 |
|
|
$ |
180,313 |
|
|
|
|
|
|
Adjustments
|
|
|
|
|
|
|
|
|
|
|
|
|
|
Acquisition project costs
|
|
|
16,874 |
|
|
|
10,830 |
|
|
|
|
|
|
Organizational realignment
|
|
|
29,900 |
|
|
|
6,386 |
|
|
|
|
|
|
Royal restructuring and integration
|
|
|
0 |
|
|
|
2,474 |
|
|
|
|
|
|
Project One
|
|
|
9,815 |
|
|
|
9,885 |
|
|
|
|
|
|
Other
|
|
|
(611 |
) |
|
|
12,791 |
|
|
|
|
|
|
Discrete tax items
|
|
|
26,085 |
|
|
|
9,308 |
|
|
|
|
|
|
Income tax effect on adjustments
|
|
|
(10,604 |
) |
|
|
(10,699 |
) |
|
|
|
|
|
Adjusted Net Income
|
|
$ |
216,365 |
|
|
$ |
221,288 |
|
|
|
|
|
|
Add:
|
|
|
|
|
|
|
|
|
|
|
|
|
|
Interest expense
|
|
|
131,913 |
|
|
|
91,547 |
|
|
|
|
|
|
Interest income
|
|
|
(3,943 |
) |
|
|
(7,790 |
) |
|
|
|
|
|
Income taxes
|
|
|
78,047 |
|
|
|
78,576 |
|
|
|
|
|
|
Depreciation and Amortization expense
|
|
|
158,456 |
|
|
|
146,394 |
|
|
|
|
|
|
Adjusted EBITDA (non-GAAP)
|
|
|
580,838 |
|
|
|
530,015 |
|
|
|
10
|
% |
|
Net revenue
|
|
|
3,510,934 |
|
|
|
3,749,183 |
|
|
|
|
|
|
Adjusted EBITDA margin (non-GAAP)
|
|
|
17 |
% |
|
|
14 |
% |
|
|
|
|
|
Adjustments for acquisitions
|
|
|
(13,582 |
) |
|
|
(15,361 |
) |
|
|
|
|
|
Foreign Exchange Adjustment to Budget Rates
|
|
|
(11,630 |
) |
|
|
18,623 |
|
|
|
|
|
|
Adjusted EBITDA – STIP (non-GAAP)
|
|
$ |
555,626 |
|
|
$ |
533,277 |
|
|
|
|
|
H. B. FULLER | 2024 Proxy Statement A-2
ANNEX A
ENGINEERING ADHESIVES (“EA”) SEGMENT NET REVENUE - GAAP AMOUNT
TO ADJUSTED NET REVENUE USED FOR THE STIP
Fiscal Year Ended December 2, 2023
| |
|
Fiscal Year Ended
December 2, 2023
|
|
|
Fiscal Year Ended
December 3, 2022
|
|
|
Fiscal Year 2022 to
Fiscal Year 2023
Increase (Decrease)
|
|
|
EA Segment Revenue (GAAP)
|
|
$ |
1,428,744 |
|
|
$ |
1,532,639 |
|
|
|
(7 |
%) |
|
Adjustments for acquisitions
|
|
$ |
(5,189 |
) |
|
$ |
(7,421 |
) |
|
|
|
|
|
Foreign Exchange Adjustment to Budget Rates
|
|
|
(37,720 |
) |
|
|
82,196 |
|
|
|
|
|
|
EA Segment Net Revenue - STIP (non-GAAP)
|
|
$ |
1,385,835 |
|
|
$ |
1,607,414 |
|
|
|
(14 |
%) |
EA SEGMENT ADJUSTED NET INCOME - GAAP AMOUNT
TO ADJUSTED EBITDA USED FOR THE STIP
Fiscal Year Ended December 2, 2023
| |
|
Fiscal Year Ended
December 2, 2023
|
|
|
Fiscal Year Ended
December 3, 2022
|
|
|
Fiscal Year 2022 to
Fiscal Year 2023
Increase (Decrease)
|
|
|
EA Adhesives Segment Net Income (GAAP)
|
|
$ |
187,346 |
|
|
$ |
168,873 |
|
|
|
|
|
|
Add: Depreciation and Amortization
|
|
|
63,143 |
|
|
|
58,307 |
|
|
|
|
|
|
Add: Non-Operating Pension Expense or Income
|
|
|
5,289 |
|
|
|
8,768 |
|
|
|
|
|
|
Adjusted EBITDA (non-GAAP)
|
|
|
255,778 |
|
|
|
235,948 |
|
|
|
8 |
% |
|
Adjustments for acquisitions
|
|
|
280 |
|
|
|
(1,245 |
) |
|
|
|
|
|
Foreign Exchange Adjustment to Budget Rates
|
|
|
(7,226 |
) |
|
|
9,853 |
|
|
|
|
|
|
EA Adhesives Segment Adjusted EBITDA – STIP (non-GAAP)
|
|
$ |
248,832 |
|
|
$ |
244,556 |
|
|
|
2 |
% |
H. B. FULLER | 2024 Proxy Statement A-3
ANNEX A
CONSTRUCTION ADHESIVES (“CA”) SEGMENT
NET REVENUE - GAAP AMOUNT TO ADJUSTED NET REVENUE USED FOR THE STIP
Fiscal Year Ended December 2, 2023
| |
|
Fiscal Year Ended
December 2, 2023
|
|
|
Fiscal Year Ended
December 3, 2022
|
|
|
Fiscal Year 2022 to
Fiscal Year 2023
Increase (Decrease)
|
|
|
CA Segment Revenue (GAAP)
|
|
$ |
480,703 |
|
|
$ |
520,610 |
|
|
|
(8 |
%) |
|
Adjustments for acquisitions
|
|
|
(15,838 |
) |
|
|
(53,716 |
) |
|
|
|
|
|
Foreign Exchange Adjustment to Budget Rates
|
|
|
(6,022 |
) |
|
|
5,685 |
|
|
|
|
|
|
CA Segment Adjusted Net Revenue – STIP (non-GAAP)
|
|
$ |
458,843 |
|
|
$ |
472,579 |
|
|
|
(3 |
%) |
CA SEGMENT NET INCOME - GAAP AMOUNT TO ADJUSTED EBITDA USED FOR THE STIP
Fiscal Year Ended December 2, 2023
| |
|
Fiscal Year Ended
December 2, 2023
|
|
|
Fiscal Year Ended
December 3, 2022
|
|
|
Fiscal Year 2022 to
Fiscal Year 2023
Increase (Decrease)
|
|
|
CA Segment Net Income (GAAP)
|
|
$ |
5,961 |
|
|
$ |
22,989 |
|
|
|
|
|
|
Add: Depreciation and Amortization
|
|
$ |
41,915 |
|
|
$ |
41,713 |
|
|
|
|
|
|
Add: Non-Operating Pension Expense or Income
|
|
|
7,641 |
|
|
|
9,485 |
|
|
|
|
|
|
Adjusted EBITDA (non-GAAP)
|
|
|
55,517 |
|
|
|
74,187 |
|
|
|
(25 |
%) |
|
Adjustments for acquisitions
|
|
|
(2,099 |
) |
|
|
(12,414 |
) |
|
|
|
|
|
Foreign Exchange Adjustment to Budget Rates
|
|
|
(939 |
) |
|
|
20 |
|
|
|
|
|
|
CA Segment Adjusted EBITDA – STIP (non-GAAP)
|
|
$ |
52,479 |
|
|
$ |
61,793 |
|
|
|
(15 |
%) |
H. B. FULLER | 2024 Proxy Statement A-4
ANNEX A
HYGIENE, HEALTH AND CONSUMABLE (“HHC”) ADHESIVES SEGMENT
NET REVENUE - GAAP AMOUNT TO ADJUSTED NET REVENUE USED FOR THE STIP
Fiscal Year Ended December 2, 2023
| |
|
Fiscal Year Ended
December 2, 2023
|
|
|
Fiscal Year Ended
December 3, 2022
|
|
|
Fiscal Year 2022 to
Fiscal Year 2023
Increase (Decrease)
|
|
|
HHC Adhesives Segment Revenue (GAAP)
|
|
$ |
1,601,487 |
|
|
$ |
1,695,934 |
|
|
|
(6 |
%) |
|
Adjustments for acquisitions
|
|
$ |
(73,250 |
) |
|
$ |
(3,467 |
) |
|
|
|
|
|
Foreign Exchange Adjustment to Budget Rates
|
|
|
(22,463 |
) |
|
|
101,370 |
|
|
|
|
|
|
HHC Adhesives Segment Adjusted Net Revenue – STIP (non-GAAP)
|
|
$ |
1,505,774 |
|
|
$ |
1,793,837 |
|
|
|
(16 |
%) |
HHC ADHESIVES SEGMENT NET INCOME - GAAP AMOUNT
TO ADJUSTED EBITDA USED FOR THE STIP
Fiscal Year Ended December 2, 2023
| |
|
Fiscal Year Ended
December 2, 2023
|
|
|
Fiscal Year Ended
December 3, 2022
|
|
|
Fiscal Year 2022 to
Fiscal Year 2023
Increase (Decrease)
|
|
|
HHC Adhesives Segment Net Income (GAAP)
|
|
$ |
215,088 |
|
|
$ |
165,786 |
|
|
|
|
|
|
Add: Depreciation and Amortization
|
|
$ |
53,398 |
|
|
$ |
46,374 |
|
|
|
|
|
|
Add: Non-Operating Pension Expense or Income
|
|
|
7,316 |
|
|
|
11,828 |
|
|
|
|
|
|
Adjusted EBITDA (non-GAAP)
|
|
|
275,802 |
|
|
|
223,988 |
|
|
|
23 |
% |
|
Adjustments for acquisitions
|
|
|
(11,764 |
) |
|
|
(1,701 |
) |
|
|
|
|
|
Foreign Exchange Adjustment to Budget Rates
|
|
|
(3,646 |
) |
|
|
12,392 |
|
|
|
|
|
|
HHC Adhesives Segment Adjusted EBITDA – STIP (non-GAAP)
|
|
$ |
260,392 |
|
|
$ |
234,679 |
|
|
|
11 |
% |
H. B. FULLER | 2023 Proxy Statement A-5
ANNEX A
OPERATING INCOME – GAAP AMOUNT TO ROIC USED FOR THE LTIP
Fiscal Year ended December 2, 2023
| |
|
Fiscal Year Ended December 2, 2023
|
|
|
Fiscal Year Ended December 3, 2022
|
|
|
Fiscal Year Ended November 27, 2021
|
|
|
Operating Income (GAAP)
|
|
|
355,137 |
|
|
|
322,718 |
|
|
|
252,622 |
|
|
Other income (expense), net1
|
|
|
20,246 |
|
|
|
30,081 |
|
|
|
32,070 |
|
|
Adjustments for Acquisitions
|
|
|
(557 |
) |
|
|
(7,952 |
) |
|
|
2,848 |
|
|
Adjustments2
|
|
|
53,260 |
|
|
|
34,936 |
|
|
|
35,814 |
|
|
Adjusted Operating Income
|
|
|
428,086 |
|
|
|
379,783 |
|
|
|
323,354 |
|
| |
|
|
|
|
|
|
|
|
|
|
|
|
|
Tax Expense
|
|
|
(115,200 |
) |
|
|
(101,402 |
) |
|
|
(87,952 |
) |
|
Income from equity method investments
|
|
|
4,357 |
|
|
|
5,665 |
|
|
|
7,657 |
|
|
Net operating profit after taxa
|
|
|
317,244 |
|
|
|
284,046 |
|
|
|
243,059 |
|
| |
|
|
|
|
|
|
|
|
|
|
|
|
| |
|
|
|
|
|
|
|
|
|
|
|
|
|
Invested Capitalb
|
|
|
3,187,199 |
|
|
|
3,045,437 |
|
|
|
3,167,972 |
|
| |
|
|
|
|
|
|
|
|
|
|
|
|
|
ROIC (a/b) (non-GAAP)
|
|
|
10.0 |
% |
|
|
9.3 |
% |
|
|
7.7 |
% |
|
ROIC Average
|
|
|
9.0 |
% |
|
|
|
|
|
|
|
|
|
(1)
|
All components of net periodic pension (cost) benefit and net periodic retirement postretirement benefit (cost) other than service (cost) benefit.
|
|
(2)
|
Adjustments include the following pre-tax items: costs related to integrating and accounting for acquisitions; costs associated with organizational realignment to support the Company’s strategic plan; costs associated with the integration and restructuring of the acquired Royal Adhesives business; transactional tax expense associated with an audit settlement; Project ONE development; and other costs.
|
|
Acquisition project costs
|
|
|
16,997 |
|
|
|
10,830 |
|
|
|
5,621 |
|
|
Organizational realignment
|
|
|
29,820 |
|
|
|
7,601 |
|
|
|
12,089 |
|
|
Royal Restructuring and Integration
|
|
|
|
|
|
|
2,500 |
|
|
|
4,278 |
|
|
Project One
|
|
|
9,815 |
|
|
|
9,885 |
|
|
|
9,426 |
|
|
Other
|
|
|
(3,352 |
) |
|
|
4,120 |
|
|
|
4,400 |
|
|
Total Adjustments
|
|
|
53,260 |
|
|
|
34,936 |
|
|
|
35,814 |
|
H. B. FULLER | 2024 Proxy Statement A-6
v3.24.0.1
| X |
- DefinitionBoolean flag that is true when the XBRL content amends previously-filed or accepted submission.
| Name: |
dei_AmendmentFlag |
| Namespace Prefix: |
dei_ |
| Data Type: |
xbrli:booleanItemType |
| Balance Type: |
na |
| Period Type: |
duration |
|
| X |
- DefinitionThe type of document being provided (such as 10-K, 10-Q, 485BPOS, etc). The document type is limited to the same value as the supporting SEC submission type, or the word 'Other'.
| Name: |
dei_DocumentType |
| Namespace Prefix: |
dei_ |
| Data Type: |
dei:submissionTypeItemType |
| Balance Type: |
na |
| Period Type: |
duration |
|
| X |
- DefinitionA unique 10-digit SEC-issued value to identify entities that have filed disclosures with the SEC. It is commonly abbreviated as CIK. Reference 1: http://www.xbrl.org/2003/role/presentationRef
-Publisher SEC
-Name Exchange Act
-Number 240
-Section 12
-Subsection b-2
| Name: |
dei_EntityCentralIndexKey |
| Namespace Prefix: |
dei_ |
| Data Type: |
dei:centralIndexKeyItemType |
| Balance Type: |
na |
| Period Type: |
duration |
|
| X |
- DefinitionThe exact name of the entity filing the report as specified in its charter, which is required by forms filed with the SEC. Reference 1: http://www.xbrl.org/2003/role/presentationRef
-Publisher SEC
-Name Exchange Act
-Number 240
-Section 12
-Subsection b-2
| Name: |
dei_EntityRegistrantName |
| Namespace Prefix: |
dei_ |
| Data Type: |
xbrli:normalizedStringItemType |
| Balance Type: |
na |
| Period Type: |
duration |
|
v3.24.0.1
Pay vs Performance Disclosure
Pure in Millions |
12 Months Ended |
|
Dec. 02, 2023
USD ($)
|
Dec. 03, 2022
USD ($)
|
Nov. 28, 2021
USD ($)
|
| Pay vs Performance Disclosure |
|
|
|
| Pay vs Performance Disclosure, Table |
Pay Versus Performance
As required by Section 953(a) of the Dodd-Frank Wall Street Reform and Consumer Protection Act, and Item 402(v) of Regulation S-K, we are providing the following information about the relationship between executive "compensation actually paid" (CAP, as computed in accordance with SEC rules) and certain financial performance metrics of the Company. For further information concerning the Company’s pay for performance philosophy and how the Company aligns executive compensation with the Company’s performance, refer to “Compensation Discussion and Analysis.”
Pay Versus Performance Table
| |
|
|
|
|
|
|
|
|
|
|
|
|
|
|
|
|
|
Value of Initial Fixed $100 Investment Based On: |
|
|
|
|
|
|
|
|
|
|
Year
|
|
Summary Compensation Table Total for PEO ($)(1) |
|
|
“Compensation Actually Paid” to PEO ($)(2) |
|
|
Average Summary Compensation Table Total for Non-PEO NEOs ($)(3) |
|
|
Average “Compensation Actually Paid” to Non-PEO NEOs ($)(4) |
|
|
Total Shareholder Return ($)(5) |
|
|
Peer Group Total Shareholder Return ($)(6) |
|
|
Net Income
(millions)($)(7) |
|
|
Adjusted
EBITDA
(millions) ($)(8)
|
|
| |
|
|
|
|
|
|
|
|
|
|
|
|
|
|
|
|
|
|
|
|
|
|
|
|
|
|
|
|
|
|
|
|
|
2023
|
|
|
5,050,902 |
|
|
|
5,348,935 |
|
|
|
1,733,524 |
|
|
|
1,541,646 |
|
|
|
147.95 |
|
|
|
105.03 |
|
|
|
145 |
|
|
|
556 |
|
| |
|
|
|
|
|
|
|
|
|
|
|
|
|
|
|
|
|
|
|
|
|
|
|
|
|
|
|
|
|
|
|
|
| |
|
|
|
|
|
|
|
|
|
|
|
|
|
|
|
|
|
|
|
|
|
|
|
|
|
|
|
|
|
|
|
|
|
2022
|
|
|
9,625,758 |
|
|
|
12,914,989 |
|
|
|
2,365,901 |
|
|
|
2,675,267 |
|
|
|
152.83 |
|
|
|
120.59 |
|
|
|
180 |
|
|
|
533 |
|
| |
|
|
|
|
|
|
|
|
|
|
|
|
|
|
|
|
|
|
|
|
|
|
|
|
|
|
|
|
|
|
|
|
| |
|
|
|
|
|
|
|
|
|
|
|
|
|
|
|
|
|
|
|
|
|
|
|
|
|
|
|
|
|
|
|
|
|
2021
|
|
|
11,799,233 |
|
|
|
21,770,541 |
|
|
|
1,837,302 |
|
|
|
2,381,444 |
|
|
|
139.05 |
|
|
|
121.21 |
|
|
|
161 |
|
|
|
459 |
|
| |
|
|
|
|
|
|
|
|
|
|
|
|
|
|
|
|
|
|
|
|
|
|
|
|
|
|
|
|
|
|
|
|
|
(1)
|
Our Principal Executive Officer (PEO) for fiscal 2021 and 2022 was James J. Owens and for fiscal 2023 was Celeste B. Mastin. The dollar amounts reported are the amounts of total compensation reported in our "Summary Compensation Table."
|
|
(2)
|
The dollar amounts reported represent the amount of CAP. The dollar amounts do not reflect the actual amount of compensation earned or realized by or paid to an NEO during the applicable year. In accordance with SEC rules, the following adjustments were made to the PEO's total compensation, as reported in the "Summary Compensation Table," to determine the PEO's CAP:
|
|
|
|
| PEO Total Compensation Amount |
$ 5,050,902
|
$ 9,625,758
|
$ 11,799,233
|
| PEO Actually Paid Compensation Amount |
$ 5,348,935
|
12,914,989
|
21,770,541
|
| Adjustment To PEO Compensation, Footnote |
|
Year
|
|
Reported Summary Compensation Table Total for PEO ($) |
|
|
Deduct: Reported Value of Equity Awards ($)(a) |
|
|
Add: Equity
Award
Adjustments ($)(b)
|
|
|
Deduct: Change in Actuarial Present Value of Pension Benefits ($)(c) |
|
|
Add: Pension
Benefit
Adjustments ($)(c)
|
|
|
Equals: “Compensation Actually Paid” to PEO ($) |
|
| |
|
|
|
|
|
|
|
|
|
|
|
|
|
|
|
|
|
|
|
|
|
|
|
|
|
2023
|
|
|
5,050,902 |
|
|
|
3,240,588 |
|
|
|
3,538,621 |
|
|
|
- |
|
|
|
- |
|
|
|
5,348,935 |
|
| |
|
|
|
|
|
|
|
|
|
|
|
|
|
|
|
|
|
|
|
|
|
|
|
|
| |
|
|
|
|
|
|
|
|
|
|
|
|
|
|
|
|
|
|
|
|
|
|
|
|
|
2022
|
|
|
9,625,758 |
|
|
|
5,118,606 |
|
|
|
8,407,837 |
|
|
|
- |
|
|
|
- |
|
|
|
12,914,989 |
|
| |
|
|
|
|
|
|
|
|
|
|
|
|
|
|
|
|
|
|
|
|
|
|
|
|
| |
|
|
|
|
|
|
|
|
|
|
|
|
|
|
|
|
|
|
|
|
|
|
|
|
|
2021
|
|
|
11,799,233 |
|
|
|
7,852,124 |
|
|
|
17,823,432 |
|
|
|
- |
|
|
|
- |
|
|
|
21,770,541 |
|
| |
|
|
|
|
|
|
|
|
|
|
|
|
|
|
|
|
|
|
|
|
|
|
|
|
|
(a)
|
The grant date fair value of equity awards represents the total of the amounts reported in the “Stock Awards” and “Option Awards” columns in the "Summary Compensation Table" for the applicable year.
|
|
(b)
|
The amounts (deducted) or added in calculating the equity award adjustments are set forth in the following table. The valuation assumptions used to calculate fair values did not materially differ from those disclosed at the time of grant.
|
|
(c)
|
No NEOs participate in the H.B. Fuller Legacy Pension Plan. |
H. B. FULLER | 2024 Proxy Statement 58
|
Year
|
|
Add: Year End Fair Value of Outstanding and Unvested Equity Awards Granted in the Year ($)
|
|
|
Add: Year over Year Change in Fair Value of Outstanding and Unvested Equity Awards Granted in Prior Years ($)
|
|
|
Add: Fair Value as of Vesting Date of Equity Awards Granted and Vested in the Year ($)
|
|
|
Add: Change in Fair Value from Prior Year End of Equity Awards Granted in Prior Years that Vested in the Year ($)
|
|
|
Deduct: Fair Value at the End of the Prior Year of Equity Awards that Failed to Meet Vesting Conditions in the Year ($)
|
|
|
Add: Value of Dividends or other Earnings Paid on Stock or Option Awards not Otherwise Reflected in Fair Value ($) |
|
|
Equals: Total Equity Award Adjustments ($)
|
|
| |
|
|
|
|
|
|
|
|
|
|
|
|
|
|
|
|
|
|
|
|
|
|
|
|
|
|
|
|
|
2023
|
|
|
3,754,816 |
|
|
|
(99,113 |
) |
|
|
- |
|
|
|
(117,081 |
) |
|
|
- |
|
|
|
- |
|
|
|
3,538,621 |
|
| |
|
|
|
|
|
|
|
|
|
|
|
|
|
|
|
|
|
|
|
|
|
|
|
|
|
|
|
|
| |
|
|
|
|
|
|
|
|
|
|
|
|
|
|
|
|
|
|
|
|
|
|
|
|
|
|
|
|
|
2022
|
|
|
6,101,567 |
|
|
|
2,659,513 |
|
|
|
- |
|
|
|
(353,243 |
) |
|
|
- |
|
|
|
- |
|
|
|
8,407,837 |
|
| |
|
|
|
|
|
|
|
|
|
|
|
|
|
|
|
|
|
|
|
|
|
|
|
|
|
|
|
|
| |
|
|
|
|
|
|
|
|
|
|
|
|
|
|
|
|
|
|
|
|
|
|
|
|
|
|
|
|
|
2021
|
|
|
14,246,777 |
|
|
|
3,854,019 |
|
|
|
- |
|
|
|
(277,364 |
) |
|
|
- |
|
|
|
- |
|
|
|
17,823,432 |
|
| |
|
|
|
|
|
|
|
|
|
|
|
|
|
|
|
|
|
|
|
|
|
|
|
|
|
|
|
|
|
(3)
|
The dollar amounts reported represent the average of the amounts reported for the Company’s named executive officers (NEOs) as a group (excluding our President and CEO) in the “Total” column of the "Summary Compensation Table" in each applicable year. These NEOs included for purposes of calculating the average amounts in each applicable year are as follows: (i) for fiscal 2023, Mr. Cai, Mr. Corkrean, Mr. East, and Ms. Jensen; (ii) for fiscal 2022, Mr. Cai, Heather Campe, our Senior Vice President, International Growth, Mr. Corkrean, and Ms. Mastin; and (iii) for fiscal 2021, Mr. Cai, Theodore M. Clark, our former Executive Vice President and Chief Operating Officer, Mr. Corkrean, M. Shahbaz Malik, our Senior Vice President, Construction Adhesives, and Andrew E. Tometich, our former Executive Vice President, Hygiene, Health and Consumable Adhesives.
|
|
(4)
|
The dollar amounts reported represent the average amount of CAP to the NEOs as a group (excluding our President and CEO). The dollar amounts do not reflect the actual average amount of compensation earned by or paid to these NEOs as a group during the applicable year. In accordance with the SEC rules, the following adjustments were made to average total compensation, as reported in the "Summary Compensation Table," for these NEOs to determine their average CAP, using the same methodology described above in Note 2:
|
|
|
|
| Non-PEO NEO Average Total Compensation Amount |
$ 1,733,524
|
2,365,901
|
1,837,302
|
| Non-PEO NEO Average Compensation Actually Paid Amount |
$ 1,541,646
|
2,675,267
|
2,381,444
|
| Adjustment to Non-PEO NEO Compensation Footnote |
|
Year
|
|
Average Reported Summary Compensation Table Total for Non-PEO NEOs ($)
|
|
|
Deduct: Average
Reported Value of
Equity Awards($)(a)
|
|
|
Add: Average Equity Award Adjustments($)(b)
|
|
|
Deduct: Average Change in Actuarial Present Value of
Pension Benefits ($)(c)
|
|
|
Add: Average
Pension Benefit
Adjustments ($)(c)
|
|
|
Equals: Average “Compensation Actually Paid” to Non-PEO NEOs ($)
|
|
| |
|
|
|
|
|
|
|
|
|
|
|
|
|
|
|
|
|
|
|
|
|
|
|
|
|
2023
|
|
|
1,733,524 |
|
|
|
814,172 |
|
|
|
622,294 |
|
|
|
- |
|
|
|
- |
|
|
|
1,541,646 |
|
| |
|
|
|
|
|
|
|
|
|
|
|
|
|
|
|
|
|
|
|
|
|
|
|
|
| |
|
|
|
|
|
|
|
|
|
|
|
|
|
|
|
|
|
|
|
|
|
|
|
|
|
2022
|
|
|
2,365,901 |
|
|
|
781,698 |
|
|
|
1,091,064 |
|
|
|
- |
|
|
|
- |
|
|
|
2,675,267 |
|
| |
|
|
|
|
|
|
|
|
|
|
|
|
|
|
|
|
|
|
|
|
|
|
|
|
| |
|
|
|
|
|
|
|
|
|
|
|
|
|
|
|
|
|
|
|
|
|
|
|
|
|
2021
|
|
|
1,837,302 |
|
|
|
810,273 |
|
|
|
1,354,415 |
|
|
|
- |
|
|
|
- |
|
|
|
2,381,444 |
|
| |
|
|
|
|
|
|
|
|
|
|
|
|
|
|
|
|
|
|
|
|
|
|
|
|
|
(a)
|
The grant date fair value of equity awards represents the total of the amounts reported in the “Stock Awards” and “Option Awards” columns in the "Summary Compensation Table" for the applicable year.
|
|
(b)
|
The amounts deducted or added in calculating the equity award adjustments are set forth in the following table. The valuation assumptions used to calculate fair values did not materially differ from those disclosed at the time of grant.
|
|
(c)
|
No NEOs participate in the H.B. Fuller Legacy Pension Plan. |
|
Year
|
|
Add: Average Year End Fair Value of Outstanding and Unvested Equity Awards Granted in the Year ($)
|
|
|
Add: Average Year over Year Change in Fair Value of Outstanding and Unvested Equity Awards Granted in Prior Years ($)
|
|
|
Add: Average Fair Value as of Vesting Date of Equity Awards Granted and Vested in the Year ($)
|
|
|
Add: Average Change in Fair Value from Prior Year End of Equity Awards Granted in Prior Years that Vested in the Year ($)
|
|
|
Deduct: Average Fair Value at the End of the Prior Year of Equity Awards that Failed to Meet Vesting Conditions in the Year ($)
|
|
|
Add: Average Value of Dividends or other Earnings Paid on Stock or Option Awards not Otherwise Reflected in Fair Value ($)
|
|
|
Equals: Average Total Equity Award Adjustments ($)
|
|
| |
|
|
|
|
|
|
|
|
|
|
|
|
|
|
|
|
|
|
|
|
|
|
|
|
|
|
|
|
|
2023
|
|
|
932,268 |
|
|
|
(87,160 |
) |
|
|
6,552 |
|
|
|
(229,366 |
) |
|
|
- |
|
|
|
- |
|
|
|
622,294 |
|
| |
|
|
|
|
|
|
|
|
|
|
|
|
|
|
|
|
|
|
|
|
|
|
|
|
|
|
|
|
| |
|
|
|
|
|
|
|
|
|
|
|
|
|
|
|
|
|
|
|
|
|
|
|
|
|
|
|
|
|
2022
|
|
|
952,615 |
|
|
|
188,553 |
|
|
|
8,304 |
|
|
|
(39,896 |
) |
|
|
(18,512 |
) |
|
|
- |
|
|
|
1,091,064 |
|
| |
|
|
|
|
|
|
|
|
|
|
|
|
|
|
|
|
|
|
|
|
|
|
|
|
|
|
|
|
| |
|
|
|
|
|
|
|
|
|
|
|
|
|
|
|
|
|
|
|
|
|
|
|
|
|
|
|
|
|
2021
|
|
|
1,115,084 |
|
|
|
394,490 |
|
|
|
5,412 |
|
|
|
(25,366 |
) |
|
|
(135,205 |
) |
|
|
- |
|
|
|
1,354,415 |
|
| |
|
|
|
|
|
|
|
|
|
|
|
|
|
|
|
|
|
|
|
|
|
|
|
|
|
|
|
|
|
(5)
|
Cumulative TSR is based on a fixed investment of $100 in the Company's common stock measured from the beginning of the measurement period (November 27, 2020) through and including the end of each applicable fiscal year. Return includes (a) the cumulative amount of dividends for the measurement period, assuming dividend reinvestment, and (b) the difference between the Company's share price at the end of each applicable year and the beginning of the measurement period.
|
|
(6)
|
Represents the peer group cumulative TSR, weighted according to the respective companies’ stock market capitalization at the beginning of each measurement period for which a return is indicated. The peer group used for this purpose is the Dow Jones U.S. Specialty Chemicals Index.
|
H. B. FULLER | 2024 Proxy Statement 59
|
(7)
|
The dollar amounts reported represent the amount of net income reflected in the Company’s audited financial statements for the applicable year.
|
|
(8)
|
The Compensation Committee has selected Adjusted EBITDA as the Company-Selected Measure representing the most important financial measure used to link CAP to the NEOs in fiscal 2023 to Company performance. Adjusted EBITDA is, along with Adjusted Net Revenue, the most heavily-weighted metric of our STIP metrics, and under our pay-for-performance approach the STIP represents a significant portion of the NEOs’ compensation. Adjusted EBITDA is a non-U.S. GAAP financial measure defined in "Fiscal 2023 Short-Term Incentive Compensation." See “Annex A” for information concerning this measure including a reconciliation to the most comparable U.S. GAAP financial measure.
|
|
|
|
| Compensation Actually Paid vs. Total Shareholder Return |
|
|
|
| Compensation Actually Paid vs. Net Income |
|
|
|
| Compensation Actually Paid vs. Company Selected Measure |
|
|
|
| Total Shareholder Return Vs Peer Group |
Description of Certain Relationships
The graphs below compare the CAP to our President and CEO and the average of the CAP to our other NEOs, with (i) our cumulative TSR, (ii) our net income, and (iii) our Adjusted EBITDA, in each case for our 2021, 2022, and 2023 fiscal years. The graphs below also compare our cumulative TSR and our peer group cumulative TSR for our 2021, 2022, and 2023 fiscal years. TSR amounts assume $100 invested on November 27, 2020 and reinvestment of dividends.
|
|
|
| Tabular List, Table |
Financial Performance Measures
The most important financial performance measures used by the Company to link CAP to the Company’s NEOs in fiscal 2023 to the Company’s performance are listed below. These metrics are further described in “Key Elements of Executive Compensation Program.”
| |
● |
Adjusted EBITDA
|
| |
● |
Adjusted EPS
|
| |
● |
Adjusted Net Revenue
|
| |
● |
ROIC
|
H. B. FULLER | 2024 Proxy Statement 61
|
|
|
| Total Shareholder Return Amount |
$ 147.95
|
152.83
|
139.05
|
| Peer Group Total Shareholder Return Amount |
105.03
|
120.59
|
121.21
|
| Net Income (Loss) |
$ 145,000,000
|
$ 180,000,000
|
$ 161,000,000
|
| Company Selected Measure Amount |
556
|
533
|
459
|
| Measure:: 1 |
|
|
|
| Pay vs Performance Disclosure |
|
|
|
| Name |
Adjusted EBITDA
|
|
|
| Measure:: 2 |
|
|
|
| Pay vs Performance Disclosure |
|
|
|
| Name |
Adjusted EPS
|
|
|
| Measure:: 3 |
|
|
|
| Pay vs Performance Disclosure |
|
|
|
| Name |
Adjusted Net Revenue
|
|
|
| Measure:: 4 |
|
|
|
| Pay vs Performance Disclosure |
|
|
|
| Name |
ROIC
|
|
|
| PEO Deduct: Reported Value of Equity Awards [Member] |
|
|
|
| Pay vs Performance Disclosure |
|
|
|
| Adjustment to Compensation, Amount |
$ 3,240,588
|
$ 5,118,606
|
$ 7,852,124
|
| PEO Add: Equity Award Adjustments [Member] |
|
|
|
| Pay vs Performance Disclosure |
|
|
|
| Adjustment to Compensation, Amount |
3,538,621
|
8,407,837
|
17,823,432
|
| PEO Deduct: Change In Actuarial Present Value of Pension Benefits [Member] |
|
|
|
| Pay vs Performance Disclosure |
|
|
|
| Adjustment to Compensation, Amount |
0
|
0
|
0
|
| PEO Add: Pension Benefit Adjustments [Member] |
|
|
|
| Pay vs Performance Disclosure |
|
|
|
| Adjustment to Compensation, Amount |
0
|
0
|
0
|
| PEO Add: Year End Fair Value of Outstanding and Unvested Equity Awards Granted In The Year [Member] |
|
|
|
| Pay vs Performance Disclosure |
|
|
|
| Adjustment to Compensation, Amount |
3,754,816
|
6,101,567
|
14,246,777
|
| PEO Add: Year Over Year Change In Fair Value of Outstanding And Unvested Equity Awards Granted In Prior Years [Member] |
|
|
|
| Pay vs Performance Disclosure |
|
|
|
| Adjustment to Compensation, Amount |
(99,113)
|
2,659,513
|
3,854,019
|
| PEO Add: Fair Value As of Vesting Date of Equity Awards Granted And Vested In The Year [Member] |
|
|
|
| Pay vs Performance Disclosure |
|
|
|
| Adjustment to Compensation, Amount |
0
|
0
|
0
|
| PEO Add: Change In Fair Value from Prior Year End of Equity Awards Granted In Prior Years That Vested In The Year [Member] |
|
|
|
| Pay vs Performance Disclosure |
|
|
|
| Adjustment to Compensation, Amount |
(117,081)
|
(353,243)
|
(277,364)
|
| PEO Deduct: Fair Value at The End of the Prior Year of Equity Awards That Failed To Meet Vesting Conditions In The Year [Member] |
|
|
|
| Pay vs Performance Disclosure |
|
|
|
| Adjustment to Compensation, Amount |
0
|
0
|
0
|
| PEO Add: Value of Dividends or other Earnings Paid on Stock or Option Awards Not Otherwise Reflected In Fair Value [Member] |
|
|
|
| Pay vs Performance Disclosure |
|
|
|
| Adjustment to Compensation, Amount |
0
|
0
|
0
|
| PEO Equals: Total Equity Award Adjustments [Member] |
|
|
|
| Pay vs Performance Disclosure |
|
|
|
| Adjustment to Compensation, Amount |
3,538,621
|
8,407,837
|
17,823,432
|
| NEO Deduct: Average Reported Value of Equity Awards [Member] |
|
|
|
| Pay vs Performance Disclosure |
|
|
|
| Adjustment to Compensation, Amount |
814,172
|
781,698
|
810,273
|
| NEO Add: Average Equity Award Adjustments [Member] |
|
|
|
| Pay vs Performance Disclosure |
|
|
|
| Adjustment to Compensation, Amount |
622,294
|
1,091,064
|
1,354,415
|
| NEO Deduct: Average Change In Actuarial Present Value of Pension Benefits [Member] |
|
|
|
| Pay vs Performance Disclosure |
|
|
|
| Adjustment to Compensation, Amount |
0
|
0
|
0
|
| NEO Add: Average Pension Benefit Adjustments [Member] |
|
|
|
| Pay vs Performance Disclosure |
|
|
|
| Adjustment to Compensation, Amount |
0
|
0
|
0
|
| NEO Add: Average Year End Fair Value of Outstanding And Unvested Equity Awards Granted In The Year [Member] |
|
|
|
| Pay vs Performance Disclosure |
|
|
|
| Adjustment to Compensation, Amount |
932,268
|
952,615
|
1,115,084
|
| NEO Add: Average Year over Year Change In Fair Value of Outstanding And Unvested Equity Awards Granted In Prior Years [Member] |
|
|
|
| Pay vs Performance Disclosure |
|
|
|
| Adjustment to Compensation, Amount |
(87,160)
|
188,553
|
394,490
|
| NEO Add: Average Fair Value As of Vesting Date of Equity Awards Granted and Vested In The Year [Member] |
|
|
|
| Pay vs Performance Disclosure |
|
|
|
| Adjustment to Compensation, Amount |
6,552
|
8,304
|
5,412
|
| NEO Add: Average Change In Fair Value from Prior Year End of Equity Awards Granted In Prior Years That Vested In The Year [Member] |
|
|
|
| Pay vs Performance Disclosure |
|
|
|
| Adjustment to Compensation, Amount |
(229,366)
|
(39,896)
|
(25,366)
|
| NEO Deduct: Average Fair Value at The End of the Prior Year of Equity Awards That Failed To Meet Vesting Conditions In The Year [Member] |
|
|
|
| Pay vs Performance Disclosure |
|
|
|
| Adjustment to Compensation, Amount |
0
|
(18,512)
|
(135,205)
|
| NEO Add: Average Value of Dividends or Other Earnings Paid on Stock or Option Awards Not Otherwise Reflected In Fair Value [Member] |
|
|
|
| Pay vs Performance Disclosure |
|
|
|
| Adjustment to Compensation, Amount |
0
|
0
|
0
|
| NEO Equals: Average Total Equity Award Adjustments [Member] |
|
|
|
| Pay vs Performance Disclosure |
|
|
|
| Adjustment to Compensation, Amount |
$ 622,294
|
$ 1,091,064
|
$ 1,354,415
|
| X |
- ReferencesReference 1: http://www.xbrl.org/2003/role/presentationRef
-Publisher SEC
-Name Regulation S-K
-Number 229
-Section 402
-Subsection v
-Paragraph 3
| Name: |
ecd_AdjToCompAmt |
| Namespace Prefix: |
ecd_ |
| Data Type: |
xbrli:monetaryItemType |
| Balance Type: |
na |
| Period Type: |
duration |
|
| X |
- ReferencesReference 1: http://www.xbrl.org/2003/role/presentationRef
-Publisher SEC
-Name Regulation S-K
-Number 229
-Section 402
-Subsection v
-Paragraph 3
| Name: |
ecd_AdjToNonPeoNeoCompFnTextBlock |
| Namespace Prefix: |
ecd_ |
| Data Type: |
dtr-types:textBlockItemType |
| Balance Type: |
na |
| Period Type: |
duration |
|
| X |
- ReferencesReference 1: http://www.xbrl.org/2003/role/presentationRef
-Publisher SEC
-Name Regulation S-K
-Number 229
-Section 402
-Subsection v
-Paragraph 3
| Name: |
ecd_AdjToPeoCompFnTextBlock |
| Namespace Prefix: |
ecd_ |
| Data Type: |
dtr-types:textBlockItemType |
| Balance Type: |
na |
| Period Type: |
duration |
|
| X |
- ReferencesReference 1: http://www.xbrl.org/2003/role/presentationRef
-Publisher SEC
-Name Regulation S-K
-Number 229
-Section 402
-Subsection v
-Paragraph 2
-Subparagraph vi
| Name: |
ecd_CoSelectedMeasureAmt |
| Namespace Prefix: |
ecd_ |
| Data Type: |
xbrli:decimalItemType |
| Balance Type: |
na |
| Period Type: |
duration |
|
| X |
- ReferencesReference 1: http://www.xbrl.org/2003/role/presentationRef
-Publisher SEC
-Name Regulation S-K
-Number 229
-Section 402
-Subsection v
-Paragraph 5
-Subparagraph iii
| Name: |
ecd_CompActuallyPaidVsCoSelectedMeasureTextBlock |
| Namespace Prefix: |
ecd_ |
| Data Type: |
dtr-types:textBlockItemType |
| Balance Type: |
na |
| Period Type: |
duration |
|
| X |
- ReferencesReference 1: http://www.xbrl.org/2003/role/presentationRef
-Publisher SEC
-Name Regulation S-K
-Number 229
-Section 402
-Subsection v
-Paragraph 5
-Subparagraph ii
| Name: |
ecd_CompActuallyPaidVsNetIncomeTextBlock |
| Namespace Prefix: |
ecd_ |
| Data Type: |
dtr-types:textBlockItemType |
| Balance Type: |
na |
| Period Type: |
duration |
|
| X |
- ReferencesReference 1: http://www.xbrl.org/2003/role/presentationRef
-Publisher SEC
-Name Regulation S-K
-Number 229
-Section 402
-Subsection v
-Paragraph 5
-Subparagraph i
| Name: |
ecd_CompActuallyPaidVsTotalShareholderRtnTextBlock |
| Namespace Prefix: |
ecd_ |
| Data Type: |
dtr-types:textBlockItemType |
| Balance Type: |
na |
| Period Type: |
duration |
|
| X |
- ReferencesReference 1: http://www.xbrl.org/2003/role/presentationRef
-Publisher SEC
-Name Regulation S-K
-Number 229
-Section 402
-Subsection v
-Paragraph 2
-Subparagraph vi
| Name: |
ecd_MeasureName |
| Namespace Prefix: |
ecd_ |
| Data Type: |
xbrli:normalizedStringItemType |
| Balance Type: |
na |
| Period Type: |
duration |
|
| X |
- ReferencesReference 1: http://www.xbrl.org/2003/role/presentationRef
-Publisher SEC
-Name Regulation S-K
-Number 229
-Section 402
-Subsection v
-Paragraph 2
-Subparagraph iii
| Name: |
ecd_NonPeoNeoAvgCompActuallyPaidAmt |
| Namespace Prefix: |
ecd_ |
| Data Type: |
xbrli:monetaryItemType |
| Balance Type: |
na |
| Period Type: |
duration |
|
| X |
- ReferencesReference 1: http://www.xbrl.org/2003/role/presentationRef
-Publisher SEC
-Name Regulation S-K
-Number 229
-Section 402
-Subsection v
-Paragraph 2
-Subparagraph ii
| Name: |
ecd_NonPeoNeoAvgTotalCompAmt |
| Namespace Prefix: |
ecd_ |
| Data Type: |
xbrli:monetaryItemType |
| Balance Type: |
na |
| Period Type: |
duration |
|
| X |
- ReferencesReference 1: http://www.xbrl.org/2003/role/presentationRef
-Publisher SEC
-Name Regulation S-K
-Number 229
-Section 402
-Subsection v
-Paragraph 2
-Subparagraph iv
| Name: |
ecd_PeerGroupTotalShareholderRtnAmt |
| Namespace Prefix: |
ecd_ |
| Data Type: |
xbrli:monetaryItemType |
| Balance Type: |
na |
| Period Type: |
duration |
|
| X |
- ReferencesReference 1: http://www.xbrl.org/2003/role/presentationRef
-Publisher SEC
-Name Regulation S-K
-Number 229
-Section 402
-Subsection v
-Paragraph 2
-Subparagraph iii
| Name: |
ecd_PeoActuallyPaidCompAmt |
| Namespace Prefix: |
ecd_ |
| Data Type: |
xbrli:monetaryItemType |
| Balance Type: |
na |
| Period Type: |
duration |
|
| X |
- ReferencesReference 1: http://www.xbrl.org/2003/role/presentationRef
-Publisher SEC
-Name Regulation S-K
-Number 229
-Section 402
-Subsection v
-Paragraph 2
-Subparagraph ii
| Name: |
ecd_PeoTotalCompAmt |
| Namespace Prefix: |
ecd_ |
| Data Type: |
xbrli:monetaryItemType |
| Balance Type: |
na |
| Period Type: |
duration |
|
| X |
- ReferencesReference 1: http://www.xbrl.org/2003/role/presentationRef
-Publisher SEC
-Name Regulation S-K
-Number 229
-Section 402
-Subsection v
-Paragraph 1
| Name: |
ecd_PvpTable |
| Namespace Prefix: |
ecd_ |
| Data Type: |
xbrli:stringItemType |
| Balance Type: |
na |
| Period Type: |
duration |
|
| X |
- ReferencesReference 1: http://www.xbrl.org/2003/role/presentationRef
-Publisher SEC
-Name Regulation S-K
-Number 229
-Section 402
-Subsection v
-Paragraph 1
| Name: |
ecd_PvpTableTextBlock |
| Namespace Prefix: |
ecd_ |
| Data Type: |
dtr-types:textBlockItemType |
| Balance Type: |
na |
| Period Type: |
duration |
|
| X |
- ReferencesReference 1: http://www.xbrl.org/2003/role/presentationRef
-Publisher SEC
-Name Regulation S-K
-Number 229
-Section 402
-Subsection v
-Paragraph 6
| Name: |
ecd_TabularListTableTextBlock |
| Namespace Prefix: |
ecd_ |
| Data Type: |
dtr-types:textBlockItemType |
| Balance Type: |
na |
| Period Type: |
duration |
|
| X |
- ReferencesReference 1: http://www.xbrl.org/2003/role/presentationRef
-Publisher SEC
-Name Regulation S-K
-Number 229
-Section 402
-Subsection v
-Paragraph 2
-Subparagraph iv
| Name: |
ecd_TotalShareholderRtnAmt |
| Namespace Prefix: |
ecd_ |
| Data Type: |
xbrli:monetaryItemType |
| Balance Type: |
na |
| Period Type: |
duration |
|
| X |
- ReferencesReference 1: http://www.xbrl.org/2003/role/presentationRef
-Publisher SEC
-Name Regulation S-K
-Number 229
-Section 402
-Subsection v
-Paragraph 5
-Subparagraph iv
| Name: |
ecd_TotalShareholderRtnVsPeerGroupTextBlock |
| Namespace Prefix: |
ecd_ |
| Data Type: |
dtr-types:textBlockItemType |
| Balance Type: |
na |
| Period Type: |
duration |
|
| X |
- DefinitionThe portion of profit or loss for the period, net of income taxes, which is attributable to the parent. Reference 1: http://www.xbrl.org/2003/role/disclosureRef
-Topic 235
-SubTopic 10
-Name Accounting Standards Codification
-Section S99
-Paragraph 1
-Subparagraph (SX 210.4-08(g)(1)(ii))
-Publisher FASB
-URI https://asc.fasb.org//1943274/2147480678/235-10-S99-1
Reference 2: http://www.xbrl.org/2003/role/disclosureRef
-Topic 323
-SubTopic 10
-Name Accounting Standards Codification
-Section 50
-Paragraph 3
-Subparagraph (c)
-Publisher FASB
-URI https://asc.fasb.org//1943274/2147481687/323-10-50-3
Reference 3: http://www.xbrl.org/2003/role/disclosureRef
-Topic 825
-SubTopic 10
-Name Accounting Standards Codification
-Section 50
-Paragraph 28
-Subparagraph (f)
-Publisher FASB
-URI https://asc.fasb.org//1943274/2147482907/825-10-50-28
Reference 4: http://www.xbrl.org/2003/role/disclosureRef
-Topic 220
-SubTopic 10
-Name Accounting Standards Codification
-Section 50
-Paragraph 6
-Publisher FASB
-URI https://asc.fasb.org//1943274/2147482765/220-10-50-6
Reference 5: http://www.xbrl.org/2003/role/disclosureRef
-Topic 250
-SubTopic 10
-Name Accounting Standards Codification
-Section 50
-Paragraph 3
-Publisher FASB
-URI https://asc.fasb.org//1943274/2147483443/250-10-50-3
Reference 6: http://www.xbrl.org/2003/role/disclosureRef
-Topic 250
-SubTopic 10
-Name Accounting Standards Codification
-Section 50
-Paragraph 1
-Subparagraph (b)(2)
-Publisher FASB
-URI https://asc.fasb.org//1943274/2147483443/250-10-50-1
Reference 7: http://www.xbrl.org/2003/role/disclosureRef
-Topic 815
-SubTopic 40
-Name Accounting Standards Codification
-Section 65
-Paragraph 1
-Subparagraph (f)
-Publisher FASB
-URI https://asc.fasb.org//1943274/2147480175/815-40-65-1
Reference 8: http://www.xbrl.org/2003/role/disclosureRef
-Topic 250
-SubTopic 10
-Name Accounting Standards Codification
-Section 50
-Paragraph 8
-Publisher FASB
-URI https://asc.fasb.org//1943274/2147483443/250-10-50-8
Reference 9: http://www.xbrl.org/2003/role/disclosureRef
-Topic 250
-SubTopic 10
-Name Accounting Standards Codification
-Section 50
-Paragraph 9
-Publisher FASB
-URI https://asc.fasb.org//1943274/2147483443/250-10-50-9
Reference 10: http://www.xbrl.org/2003/role/disclosureRef
-Topic 250
-SubTopic 10
-Name Accounting Standards Codification
-Section 50
-Paragraph 11
-Subparagraph (a)
-Publisher FASB
-URI https://asc.fasb.org//1943274/2147483443/250-10-50-11
Reference 11: http://www.xbrl.org/2003/role/disclosureRef
-Topic 250
-SubTopic 10
-Name Accounting Standards Codification
-Section 50
-Paragraph 11
-Subparagraph (b)
-Publisher FASB
-URI https://asc.fasb.org//1943274/2147483443/250-10-50-11
Reference 12: http://www.xbrl.org/2003/role/disclosureRef
-Topic 250
-SubTopic 10
-Name Accounting Standards Codification
-Section 50
-Paragraph 4
-Publisher FASB
-URI https://asc.fasb.org//1943274/2147483443/250-10-50-4
Reference 13: http://www.xbrl.org/2003/role/exampleRef
-Topic 946
-SubTopic 830
-Name Accounting Standards Codification
-Section 55
-Paragraph 10
-Publisher FASB
-URI https://asc.fasb.org//1943274/2147480167/946-830-55-10
Reference 14: http://www.xbrl.org/2003/role/disclosureRef
-Topic 946
-SubTopic 220
-Name Accounting Standards Codification
-Section 45
-Paragraph 7
-Publisher FASB
-URI https://asc.fasb.org//1943274/2147483581/946-220-45-7
Reference 15: http://www.xbrl.org/2003/role/disclosureRef
-Topic 944
-SubTopic 220
-Name Accounting Standards Codification
-Section S99
-Paragraph 1
-Subparagraph (SX 210.7-04(18))
-Publisher FASB
-URI https://asc.fasb.org//1943274/2147483586/944-220-S99-1
Reference 16: http://www.xbrl.org/2003/role/disclosureRef
-Topic 280
-SubTopic 10
-Name Accounting Standards Codification
-Section 50
-Paragraph 22
-Publisher FASB
-URI https://asc.fasb.org//1943274/2147482810/280-10-50-22
Reference 17: http://www.xbrl.org/2003/role/disclosureRef
-Topic 946
-SubTopic 220
-Name Accounting Standards Codification
-Section S99
-Paragraph 1
-Subparagraph (SX 210.6-07(9))
-Publisher FASB
-URI https://asc.fasb.org//1943274/2147483575/946-220-S99-1
Reference 18: http://www.xbrl.org/2003/role/disclosureRef
-Topic 946
-SubTopic 220
-Name Accounting Standards Codification
-Section S99
-Paragraph 3
-Subparagraph (SX 210.6-09(1)(d))
-Publisher FASB
-URI https://asc.fasb.org//1943274/2147483575/946-220-S99-3
Reference 19: http://www.xbrl.org/2003/role/disclosureRef
-Topic 470
-SubTopic 10
-Name Accounting Standards Codification
-Section S99
-Paragraph 1A
-Subparagraph (SX 210.13-01(a)(4)(i))
-Publisher FASB
-URI https://asc.fasb.org//1943274/2147480097/470-10-S99-1A
Reference 20: http://www.xbrl.org/2009/role/commonPracticeRef
-Topic 470
-SubTopic 10
-Name Accounting Standards Codification
-Section S99
-Paragraph 1A
-Subparagraph (SX 210.13-01(a)(4)(ii))
-Publisher FASB
-URI https://asc.fasb.org//1943274/2147480097/470-10-S99-1A
Reference 21: http://www.xbrl.org/2003/role/disclosureRef
-Topic 470
-SubTopic 10
-Name Accounting Standards Codification
-Section S99
-Paragraph 1A
-Subparagraph (SX 210.13-01(a)(4)(iii)(A))
-Publisher FASB
-URI https://asc.fasb.org//1943274/2147480097/470-10-S99-1A
Reference 22: http://www.xbrl.org/2003/role/disclosureRef
-Topic 470
-SubTopic 10
-Name Accounting Standards Codification
-Section S99
-Paragraph 1A
-Subparagraph (SX 210.13-01(a)(4)(iv))
-Publisher FASB
-URI https://asc.fasb.org//1943274/2147480097/470-10-S99-1A
Reference 23: http://www.xbrl.org/2003/role/disclosureRef
-Topic 470
-SubTopic 10
-Name Accounting Standards Codification
-Section S99
-Paragraph 1A
-Subparagraph (SX 210.13-01(a)(5))
-Publisher FASB
-URI https://asc.fasb.org//1943274/2147480097/470-10-S99-1A
Reference 24: http://www.xbrl.org/2003/role/disclosureRef
-Topic 470
-SubTopic 10
-Name Accounting Standards Codification
-Section S99
-Paragraph 1B
-Subparagraph (SX 210.13-02(a)(4)(i))
-Publisher FASB
-URI https://asc.fasb.org//1943274/2147480097/470-10-S99-1B
Reference 25: http://www.xbrl.org/2003/role/disclosureRef
-Topic 470
-SubTopic 10
-Name Accounting Standards Codification
-Section S99
-Paragraph 1B
-Subparagraph (SX 210.13-02(a)(4)(iii)(A))
-Publisher FASB
-URI https://asc.fasb.org//1943274/2147480097/470-10-S99-1B
Reference 26: http://www.xbrl.org/2003/role/disclosureRef
-Topic 470
-SubTopic 10
-Name Accounting Standards Codification
-Section S99
-Paragraph 1B
-Subparagraph (SX 210.13-02(a)(4)(iii)(B))
-Publisher FASB
-URI https://asc.fasb.org//1943274/2147480097/470-10-S99-1B
Reference 27: http://www.xbrl.org/2003/role/disclosureRef
-Topic 470
-SubTopic 10
-Name Accounting Standards Codification
-Section S99
-Paragraph 1B
-Subparagraph (SX 210.13-02(a)(4)(iv))
-Publisher FASB
-URI https://asc.fasb.org//1943274/2147480097/470-10-S99-1B
Reference 28: http://www.xbrl.org/2003/role/disclosureRef
-Topic 470
-SubTopic 10
-Name Accounting Standards Codification
-Section S99
-Paragraph 1B
-Subparagraph (SX 210.13-02(a)(5))
-Publisher FASB
-URI https://asc.fasb.org//1943274/2147480097/470-10-S99-1B
Reference 29: http://www.xbrl.org/2003/role/disclosureRef
-Topic 280
-SubTopic 10
-Name Accounting Standards Codification
-Section 50
-Paragraph 30
-Subparagraph (b)
-Publisher FASB
-URI https://asc.fasb.org//1943274/2147482810/280-10-50-30
Reference 30: http://www.xbrl.org/2003/role/disclosureRef
-Topic 280
-SubTopic 10
-Name Accounting Standards Codification
-Section 50
-Paragraph 32
-Subparagraph (f)
-Publisher FASB
-URI https://asc.fasb.org//1943274/2147482810/280-10-50-32
Reference 31: http://www.xbrl.org/2003/role/disclosureRef
-Topic 260
-SubTopic 10
-Name Accounting Standards Codification
-Section 45
-Paragraph 60B
-Subparagraph (a)
-Publisher FASB
-URI https://asc.fasb.org//1943274/2147482689/260-10-45-60B
Reference 32: http://www.xbrl.org/2003/role/exampleRef
-Topic 280
-SubTopic 10
-Name Accounting Standards Codification
-Section 50
-Paragraph 31
-Publisher FASB
-URI https://asc.fasb.org//1943274/2147482810/280-10-50-31
Reference 33: http://www.xbrl.org/2003/role/disclosureRef
-Topic 280
-SubTopic 10
-Name Accounting Standards Codification
-Section 50
-Paragraph 32
-Subparagraph (c)
-Publisher FASB
-URI https://asc.fasb.org//1943274/2147482810/280-10-50-32
Reference 34: http://www.xbrl.org/2003/role/disclosureRef
-Topic 205
-SubTopic 20
-Name Accounting Standards Codification
-Section 50
-Paragraph 7
-Publisher FASB
-URI https://asc.fasb.org//1943274/2147483499/205-20-50-7
Reference 35: http://fasb.org/us-gaap/role/ref/legacyRef
-Topic 230
-SubTopic 10
-Name Accounting Standards Codification
-Section 45
-Paragraph 28
-Publisher FASB
-URI https://asc.fasb.org//1943274/2147482740/230-10-45-28
Reference 36: http://www.xbrl.org/2003/role/disclosureRef
-Topic 220
-SubTopic 10
-Name Accounting Standards Codification
-Section 45
-Paragraph 1A
-Subparagraph (a)
-Publisher FASB
-URI https://asc.fasb.org//1943274/2147482790/220-10-45-1A
Reference 37: http://www.xbrl.org/2003/role/disclosureRef
-Topic 220
-SubTopic 10
-Name Accounting Standards Codification
-Section 45
-Paragraph 1B
-Subparagraph (a)
-Publisher FASB
-URI https://asc.fasb.org//1943274/2147482790/220-10-45-1B
Reference 38: http://fasb.org/us-gaap/role/ref/legacyRef
-Topic 220
-SubTopic 10
-Name Accounting Standards Codification
-Section S99
-Paragraph 2
-Subparagraph (SX 210.5-03(20))
-Publisher FASB
-URI https://asc.fasb.org//1943274/2147483621/220-10-S99-2
Reference 39: http://fasb.org/us-gaap/role/ref/legacyRef
-Topic 942
-SubTopic 220
-Name Accounting Standards Codification
-Section S99
-Paragraph 1
-Subparagraph (SX 210.9-04(22))
-Publisher FASB
-URI https://asc.fasb.org//1943274/2147483589/942-220-S99-1
| Name: |
us-gaap_NetIncomeLoss |
| Namespace Prefix: |
us-gaap_ |
| Data Type: |
xbrli:monetaryItemType |
| Balance Type: |
credit |
| Period Type: |
duration |
|
| X |
- Details
| Name: |
ecd_MeasureAxis=1 |
| Namespace Prefix: |
|
| Data Type: |
na |
| Balance Type: |
|
| Period Type: |
|
|
| X |
- Details
| Name: |
ecd_MeasureAxis=2 |
| Namespace Prefix: |
|
| Data Type: |
na |
| Balance Type: |
|
| Period Type: |
|
|
| X |
- Details
| Name: |
ecd_MeasureAxis=3 |
| Namespace Prefix: |
|
| Data Type: |
na |
| Balance Type: |
|
| Period Type: |
|
|
| X |
- Details
| Name: |
ecd_MeasureAxis=4 |
| Namespace Prefix: |
|
| Data Type: |
na |
| Balance Type: |
|
| Period Type: |
|
|
| X |
- Details
| Name: |
ecd_AdjToCompAxis=ful_PEODeductReportedValueOfEquityAwardsMember |
| Namespace Prefix: |
|
| Data Type: |
na |
| Balance Type: |
|
| Period Type: |
|
|
| X |
- Details
| Name: |
ecd_AdjToCompAxis=ful_PEOAddEquityAwardAdjustmentsMember |
| Namespace Prefix: |
|
| Data Type: |
na |
| Balance Type: |
|
| Period Type: |
|
|
| X |
- Details
| Name: |
ecd_AdjToCompAxis=ful_PEODeductChangeInActuarialPresentValueOfPensionBenefitsMember |
| Namespace Prefix: |
|
| Data Type: |
na |
| Balance Type: |
|
| Period Type: |
|
|
| X |
- Details
| Name: |
ecd_AdjToCompAxis=ful_PEOAddPensionBenefitAdjustmentsMember |
| Namespace Prefix: |
|
| Data Type: |
na |
| Balance Type: |
|
| Period Type: |
|
|
| X |
- Details
| Name: |
ecd_AdjToCompAxis=ful_PEOAddYearEndFairValueOfOutstandingAndUnvestedEquityAwardsGrantedInTheYearMember |
| Namespace Prefix: |
|
| Data Type: |
na |
| Balance Type: |
|
| Period Type: |
|
|
| X |
- Details
| Name: |
ecd_AdjToCompAxis=ful_PEOAddYearOverYearChangeInFairValueOfOutstandingAndUnvestedEquityAwardsGrantedInPriorYearsMember |
| Namespace Prefix: |
|
| Data Type: |
na |
| Balance Type: |
|
| Period Type: |
|
|
| X |
- Details
| Name: |
ecd_AdjToCompAxis=ful_PEOAddFairValueAsOfVestingDateOfEquityAwardsGrantedAndVestedInTheYearMember |
| Namespace Prefix: |
|
| Data Type: |
na |
| Balance Type: |
|
| Period Type: |
|
|
| X |
- Details
| Name: |
ecd_AdjToCompAxis=ful_PEOAddChangeInFairValueFromPriorYearEndOfEquityAwardsGrantedInPriorYearsThatVestedInTheYearMember |
| Namespace Prefix: |
|
| Data Type: |
na |
| Balance Type: |
|
| Period Type: |
|
|
| X |
- Details
| Name: |
ecd_AdjToCompAxis=ful_PEODeductFairValueAtTheEndOfThePriorYearOfEquityAwardsThatFailedToMeetVestingConditionsInTheYearMember |
| Namespace Prefix: |
|
| Data Type: |
na |
| Balance Type: |
|
| Period Type: |
|
|
| X |
- Details
| Name: |
ecd_AdjToCompAxis=ful_PEOAddValueOfDividendsOrOtherEarningsPaidOnStockOrOptionAwardsNotOtherwiseReflectedInFairValueMember |
| Namespace Prefix: |
|
| Data Type: |
na |
| Balance Type: |
|
| Period Type: |
|
|
| X |
- Details
| Name: |
ecd_AdjToCompAxis=ful_PEOEqualsTotalEquityAwardAdjustmentsMember |
| Namespace Prefix: |
|
| Data Type: |
na |
| Balance Type: |
|
| Period Type: |
|
|
| X |
- Details
| Name: |
ecd_AdjToCompAxis=ful_NEODeductAverageReportedValueOfEquityAwardsMember |
| Namespace Prefix: |
|
| Data Type: |
na |
| Balance Type: |
|
| Period Type: |
|
|
| X |
- Details
| Name: |
ecd_AdjToCompAxis=ful_NEOAddAverageEquityAwardAdjustmentsMember |
| Namespace Prefix: |
|
| Data Type: |
na |
| Balance Type: |
|
| Period Type: |
|
|
| X |
- Details
| Name: |
ecd_AdjToCompAxis=ful_NEODeductAverageChangeInActuarialPresentValueOfPensionBenefitsMember |
| Namespace Prefix: |
|
| Data Type: |
na |
| Balance Type: |
|
| Period Type: |
|
|
| X |
- Details
| Name: |
ecd_AdjToCompAxis=ful_NEOAddAveragePensionBenefitAdjustmentsMember |
| Namespace Prefix: |
|
| Data Type: |
na |
| Balance Type: |
|
| Period Type: |
|
|
| X |
- Details
| Name: |
ecd_AdjToCompAxis=ful_NEOAddAverageYearEndFairValueOfOutstandingAndUnvestedEquityAwardsGrantedInTheYearMember |
| Namespace Prefix: |
|
| Data Type: |
na |
| Balance Type: |
|
| Period Type: |
|
|
| X |
- Details
| Name: |
ecd_AdjToCompAxis=ful_NEOAddAverageYearOverYearChangeInFairValueOfOutstandingAndUnvestedEquityAwardsGrantedInPriorYearsMember |
| Namespace Prefix: |
|
| Data Type: |
na |
| Balance Type: |
|
| Period Type: |
|
|
| X |
- Details
| Name: |
ecd_AdjToCompAxis=ful_NEOAddAverageFairValueAsOfVestingDateOfEquityAwardsGrantedAndVestedInTheYearMember |
| Namespace Prefix: |
|
| Data Type: |
na |
| Balance Type: |
|
| Period Type: |
|
|
| X |
- Details
| Name: |
ecd_AdjToCompAxis=ful_NEOAddAverageChangeInFairValueFromPriorYearEndOfEquityAwardsGrantedInPriorYearsThatVestedInTheYearMember |
| Namespace Prefix: |
|
| Data Type: |
na |
| Balance Type: |
|
| Period Type: |
|
|
| X |
- Details
| Name: |
ecd_AdjToCompAxis=ful_NEODeductAverageFairValueAtTheEndOfThePriorYearOfEquityAwardsThatFailedToMeetVestingConditionsInTheYearMember |
| Namespace Prefix: |
|
| Data Type: |
na |
| Balance Type: |
|
| Period Type: |
|
|
| X |
- Details
| Name: |
ecd_AdjToCompAxis=ful_NEOAddAverageValueOfDividendsOrOtherEarningsPaidOnStockOrOptionAwardsNotOtherwiseReflectedInFairValueMember |
| Namespace Prefix: |
|
| Data Type: |
na |
| Balance Type: |
|
| Period Type: |
|
|
| X |
- Details
| Name: |
ecd_AdjToCompAxis=ful_NEOEqualsAverageTotalEquityAwardAdjustmentsMember |
| Namespace Prefix: |
|
| Data Type: |
na |
| Balance Type: |
|
| Period Type: |
|
|
H B Fuller (NYSE:FUL)
Historical Stock Chart
From Apr 2024 to May 2024

H B Fuller (NYSE:FUL)
Historical Stock Chart
From May 2023 to May 2024
