UNITED STATES

SECURITIES AND EXCHANGE COMMISSION

Washington, D.C. 20549


FORM 6-K


REPORT OF FOREIGN PRIVATE ISSUER

Pursuant to Rule 13a-16 or 15d-16

under the Securities Exchange Act of 1934


For the Month of February 2024


Commission File Number: 001-37668


FERROGLOBE PLC

(Name of Registrant)

13 Chesterfield Street,

London W1J 5JN, United Kingdom

(Address of Principal Executive Office)

Indicate by check mark whether the registrant files or will file annual reports under cover of Form 20-F or Form 40-F.


Form 20-F 

Form 40-F 


This Form 6-K consists of the following materials, which appear immediately following this page:

Press release dated February 21, 2024 announcing results for the quarter and year ended December 31, 2023
Fourth quarter and full year 2023 earnings call presentation

This Form 6-K is being furnished for the purpose of incorporating by reference the information in this Form 6-K into (a) Registration Statement No. 333-208911 on Form S-8, (b) Registration Statement No. 333-259445 on Form F-3, (c) Registration Statement No. 333-258254 on Form F-3 and (d) Registration Statement No. 333-255973 on Form F-3 and related prospectuses, as such registration statements and prospectuses may be amended from time to time.


SIGNATURES

Pursuant to the requirements of the Securities Exchange Act of 1934, the registrant has duly caused this report to be signed on its behalf by the undersigned, thereunto duly authorized.


Date: February 21, 2024


FERROGLOBE PLC


by

/s/ Marco Levi


Name: Marco Levi


Title: Chief Executive Officer (Principal Executive Officer)


Ferroglobe Reports Solid Fourth Quarter and Full Year 2023 Financial Results

LONDON, February 21, 2024 (GLOBE NEWSWIRE) – Ferroglobe PLC (NASDAQ: GSM) (“Ferroglobe”, the “Company”, or the “Parent”), a leading producer globally of silicon metal, silicon-based and manganese-based specialty alloys, today announced financial results for the fourth quarter and full year 2023.

Introducing 2024 adjusted EBITDA guidance of $100 million to $170 million

FINANCIAL HIGHLIGHTS

2023 revenue of $1.7 billion, down 36% Y/Y
2023 adjusted EBITDA of $315 million, down 63% Y/Y
Q4 adjusted EBITDA declined to $60 million, down 42% from Q3 and down 54% from Q4-22
Q4 adjusted EBITDA margins were at 16% versus 25% in the prior quarter and 29% in Q4-22
Q4 adjusted EPS was $0.09 versus $0.27 in Q3 and $0.39 in Q4-22
Net debt increased to $101 million, up from $71 million in Q3 and down from $127 million in Q4-22
Total cash decreased to $138 million, down from $166 million in Q3 and $323 million in Q4-22

BUSINESS HIGHLIGHTS

Posted solid financial and operational performance for the quarter and the full year despite softening demand and weak pricing
Adjusted gross debt remained flat in Q4; declining to less than $100 million in February as a result of a $148 million redemption on February 16, 2024
Initiated a quarterly cash dividend of $0.013 per share, payable on March 28, 2024 to shareholders of record as of the close of business on March 22, 2024
Expecting to request the board of directors and shareholders to approve a share repurchase program
Optimized French energy contract to drive strong results in 2023, received majority of related cash in 2024
Signed a term sheet for a partnership with a leading battery materials company in Europe and a memorandum of understanding with an advanced silicon-rich EV battery technology company in the US

Dr. Marco Levi, Ferroglobe’s Chief Executive Officer, commented, “2023 was a successful year for Ferroglobe with strong financial, operating and strategic performance as we significantly reduced our debt, acquired a strategic quartz mine and entered into two EV battery agreements while operating our plants at high efficiency levels. This strong performance enabled us to announce a capital return policy today, with the board declaring a quarterly dividend of $0.013 per share and we expect to announce a share repurchase program in the coming months.    

“Despite the current softness in our end markets, we are very bullish about the company’s long-term prospects as we expect strong secular growth in the solar and EV battery markets to boost the demand for silicon metal in the coming years. We have positioned Ferroglobe to fully participate in these growth opportunities as the leading western producer of silicon metal.

“We are introducing 2024 adjusted EBITDA guidance of $100 million to $170 million. Demand remains soft in early 2024, and while the recent increases in index prices are positive, we believe they have been partially driven by supply chain disruptions. We anticipate an improving demand picture in the second half of the year,” concluded Dr. Levi.


Fourth Quarter and Full Year 2023 Financial Highlights


Quarter Ended


Quarter Ended

Quarter Ended

%

%

Twelve Months Ended

Twelve Months Ended

%

$,000 (unaudited)

December 31, 2023

September 30, 2023

December 31, 2022

Q/Q

Y/Y

December 31, 2023

December 31, 2022

Y/Y

Sales

$

375,951

$

416,810

$

448,625

(10%)

(16%)

$

1,650,034

$

2,597,916

(36%)

Raw materials and energy consumption for production

$

(199,911)

$

(195,600)

$

(289,572)

2%

(31%)

$

(879,625)

$

(1,285,086)

(32%)

Energy consumption for production (PPA impact)

339

—    

339

Operating profit (loss)

$

14,224

$

75,419

$

29,696

(81%)

(52%)

$

196,940

$

660,547

(70%)

Operating margin

3.8%

18.1%

6.6%

11.9%

25.4%

Adjusted net income
attributable to the parent

$

16,300

$

53,722

$

75,896

(70%)

(79%)

$

134,943

$

572,630

(76%)

Adjusted diluted EPS

$

0.09

$

0.27

$

0.39

$

0.71

$

3.04

Adjusted EBITDA

$

60,262

$

104,496

$

130,442

(42%)

(54%)

$

315,198

$

860,006

(63%)

Adjusted EBITDA margin

16.0%

25.1%

29.1%

19.1%

33.1%

Operating cash flow

$

25,139

$

(8,727)

$

114,111

388%

(78%)

$

174,768

$

410,016

(57%)

Free cash flow1

$

1,888

$

(27,357)

$

99,559

107%

(98%)

$

92,962

$

358,242

(74%)

Working Capital

$

510,709

$

510,064

$

700,898

0%

(27%)

$

510,709

$

700,898

(27%)

Cash and Restricted Cash

$

137,649

$

165,973

$

322,943

(17%)

(57%)

$

137,649

$

322,943

(57%)

Adjusted Gross Debt2

$

238,506

$

237,056

$

449,711

1%

(47%)

$

238,506

$

449,711

(47%)

Equity

$

874,597

$

859,723

$

756,813

2%

16%

$

874,597

$

756,813

16%

(1)

Free cash flow is calculated as operating cash flow plus investing cash flow

(2)

Adjusted gross debt excludes bank borrowings on factoring program and impact of leasing standard IFRS16 at December 31, 2023 September 30, 2023 & December 31, 2022

Sales

In the fourth quarter of 2023, Ferroglobe reported net sales of $376 million, a decrease of 10% over the prior quarter and a decrease of 16% over the year-ago period. For the full year 2023, sales were $1.7 billion versus $2.6 billion in the prior year, a decrease of 36%. The decrease in our fourth quarter results is primarily attributable to lower volumes across our product portfolio and lower pricing of our main products. The $41 million decrease in sales over the prior quarter was primarily driven by silicon metal, which accounted for $31 million of the decrease, and silicon-based alloys, which accounted for $8 million. These decreases were partially offset by manganese-based alloys, which increased by $1 million. The decrease in sales for the full year 2023 was mainly driven by a significant decrease in prices and volumes across all the products.

Raw materials and energy consumption for production

Raw materials and energy consumption for production was $200 million in the fourth quarter of 2023 versus $196 million in the prior quarter, an increase of 2%. As a percentage of sales, raw materials and energy consumption for production was 53% in the fourth quarter of 2023 versus 47% in the prior quarter. This variance was mainly due to lower energy compensation in France.  For the full-year 2023, raw materials and energy consumption for production were $880 million, or 53% of sales, versus $1,285 million, or 49% of sales in 2022. The increase in these costs as a percent of sales was driven by lower pricing.

Net Income (Loss) Attributable to the Parent

In the fourth quarter of 2023, net loss attributable to the parent was $6 million, or ($0.03) per diluted share, compared to a net profit attributable to the parent of $41 million, or $0.21 per diluted share in the third quarter.  For the full year 2023, net profit attributable to the parent was $87 million, or $0.46 per diluted share, compared to $440 million, or $2.32 per diluted share.

Adjusted EBITDA

In the fourth quarter of 2023, adjusted EBITDA was $60 million, or 16% of sales, a decrease of 42% compared to adjusted EBITDA of $104 million, or 25% of sales in the third quarter of 2023. The decrease in the fourth quarter of 2023 adjusted EBITDA as a percentage of sales is primarily attributable to a decrease in sales volumes and prices.


For the full year 2023, adjusted EBITDA was $315 million, or 19% of sales, compared to adjusted EBITDA of $860 million, or 33% of sales, for the full year 2022.

Total Cash

The total cash balance was $138 million as of December 31, 2023, down $28 million from $166 million as of September 30, 2023. During the year, the total cash balance declined by $185 million, mainly due to the partial redemption of senior secured notes in July 2023.

During the fourth quarter of 2023, we generated positive operating cash flow of $25 million, had negative cash flow from investing activities of $23 million, and $30 million in negative cash flow from financing activities. For the full year 2023, we generated positive operating cash flow of $175 million, had negative cash flow from investing activities of $82 million and $279 million in negative cash flow from financing activities.

Total Working Capital

Total working capital was $511 million as of December 31, 2023, a slight increase from $510 million on September 30, 2023.  The increase in working capital during the quarter was primarily due to an increase in trade and other receivables of $17 million and an increase in inventories by $1 million, partially offset by a $17 million increase in trade and other payables.

Beatriz García-Cos, Ferroglobe’s Chief Financial Officer, commented, “After reducing our working capital by $154 million in 2023, achieving a positive net cash position at the end of January this year was a significant milestone for Ferroglobe. Our strong cash generation allowed us to redeem the remaining Senior Secured Notes last week, enabling us to initiate a capital return policy. Our hybrid program includes a declaration of a quarterly dividend of $0.013 per share, while we expect to initiate a discretionary share repurchase plan in the coming months.  

“After generating $93 million of free cash flow in 2023, we anticipate generating positive free cash in 2024, despite the soft demand we are currently facing. Our balance sheet is the strongest it has been in the Company’s history, and we have right-sized our capital structure systematically over the past year and a half,” concluded Mrs. García-Cos.

Product Category Highlights

Silicon Metal


Quarter Ended


Quarter Ended


Quarter Ended

Twelve Months Ended

Twelve Months Ended

December 31,2023

September 30,2023

% Q/Q

December 31, 2022

% Y/Y

December 31, 2023

December 31, 2022

% Y/Y

Shipments in metric tons:

49,761

57,031

(12.7)%

39,459

26.1%

194,385

209,342

(7.1)%

Average selling price ($/MT):

3,371

3,481

(3.2)%

4,655

(27.6)%

3,715

5,332

(30.3)%

Silicon Metal Revenue ($,000)

167,744

198,525

(15.5)%

183,682

(8.7)%

722,140

1,116,212

(35.3)%

Silicon Metal Adj.EBITDA ($,000)

22,188

80,823

(72.5)%

89,064

(75.1)%

216,534

529,355

(59.1)%

Silicon Metal Adj.EBITDA Mgns

13.2%

40.7%

48.5%

30.0%

47.4%


Silicon metal revenue in the fourth quarter was $168 million, a decrease of 15.5% over the prior quarter.  The average realized selling price decreased by 3.2% in the fourth quarter as prices remained under pressure. Total shipments decreased due to weak demand in chemicals and aluminum in Europe. Adjusted EBITDA for silicon metal decreased to $22 million during the fourth quarter compared to $81 million in the prior quarter. Adjusted EBITDA margin in the quarter decreased mainly due to lower energy compensation in France..

Silicon-Based Alloys


Quarter Ended


Quarter Ended


Quarter Ended

Twelve Months Ended

Twelve Months Ended

December 31,2023

September 30,2023

% Q/Q

December 31, 2022

% Y/Y

December 31, 2023

December 31, 2022

% Y/Y

Shipments in metric tons:

46,446

46,427

0.0%

39,847

16.6%

191,431

204,076

(6.2)%

Average selling price ($/MT):

2,300

2,475

(7.1)%

3,182

(27.7)%

2,562

3,694

(30.6)%

Silicon-based Alloys Revenue ($,000)

106,826

114,907

(7.0)%

126,793

(15.7)%

490,446

753,857

(34.9)%

Silicon-based Alloys Adj.EBITDA ($,000)

34,973

25,402

37.7%

37,102

(5.7)%

114,111

257,144

(55.6)%

Silicon-based Alloys Adj.EBITDA Mgns

32.7%

22.1%

29.3%

23.3%

34.1%

Silicon-based alloy revenue in the fourth quarter was $107 million, a decrease of 7.0% over the prior quarter. The average realized selling price decreased by 7.1%, due to lower demand for ferrosilicon linked to general industry declines in the steel sector. Total shipments of silicon-based alloys were flat relative to the prior quarter. Adjusted EBITDA for the silicon-based alloys portfolio increased to $35 million in the fourth quarter of 2023 compared to $25 million for the prior quarter. Adjusted EBITDA margin increased in the quarter mainly due to improved costs.

Manganese-Based Alloys


Quarter Ended


Quarter Ended


Quarter Ended

Twelve Months Ended

Twelve Months Ended

December 31,2023

September 30,2023

% Q/Q

December 31, 2022

% Y/Y

December 31, 2023

December 31, 2022

% Y/Y

Shipments in metric tons:

61,404

56,399

8.9%

61,917

(0.8)%

227,243

295,589

(23.1)%

Average selling price ($/MT):

985

1,046

(5.8)%

1,466

(32.8)%

1,141

1,778

(35.8)%

Manganese-based Alloys Revenue ($,000)

60,483

58,993

2.5%

90,770

(33.4)%

259,284

525,557

(50.7)%

Manganese-based Alloys Adj.EBITDA ($,000)

23,886

11,000

117.1%

19,696

21.3%

37,994

69,966

(45.7)%

Manganese-based Alloys Adj.EBITDA Mgns

39.5%

18.6%

21.7%

14.7%

13.3%

Manganese-based alloy revenue in the fourth quarter was $60 million, an increase of 2.5% over the prior quarter. The average realized selling price decreased by 5.8% and total shipments increased 8.9%. Adjusted EBITDA for the manganese-based


alloys portfolio increased to $24 million in the fourth quarter of 2023, an increase of 117.1% compared with $11 million in the prior quarter. Adjusted EBITDA margin in the quarter improved mainly driven by the increase in the volume sold.

Implemented a Capital Return Policy

The board of directors declared a quarterly cash dividend of $0.013 per share, payable on March 28, 2024 to shareholders of record as of the close of business on March 22, 2024. We intend to make this a recurring quarterly dividend, subject to board approval, and may be adjusted depending on market conditions and other factors. In addition, we are planning to request our board of directors to approve the initiation of a share repurchase program, which requires a shareholder vote as a UK company listed on Nasdaq.    

Conference Call

Ferroglobe invites all interested persons to participate on its conference call at 8:30 AM, Eastern Time on February 22, 2024. Please dial-in at least five minutes prior to the call to register. The call may also be accessed via an audio webcast.

To join via phone:
Conference call participants should pre-register using this link:
https://register.vevent.com/register/BI99f4883faa1f4b43bdf1ff571a916e5b

Once registered, you will receive the dial-in numbers and a personal PIN, which are required to access the conference call.

To join via webcast:             
A simultaneous audio webcast, and replay will be accessible here:
https://edge.media-server.com/mmc/p/weyyqhs6

About Ferroglobe

Ferroglobe is a leading global producer of silicon metal, silicon-based and manganese-based ferroalloys serving a customer base across the globe in dynamic and fast-growing end markets, such as solar, automotive, consumer products, construction and energy. The Company is based in London. For more information, visit https://investor.ferroglobe.com

Forward-Looking Statements

This release contains “forward-looking statements” within the meaning of U.S. securities laws. Forward-looking statements are not historical facts but are based on certain assumptions of management and describe the Company’s future plans, strategies and expectations. Forward-looking statements often use forward-looking terminology, including words such as “anticipate”, “believe”, “could”, “estimate”, “expect”, “forecast”, “guidance”, “intends”, “likely”, “may”, “plan”, “potential”, “predicts”, “seek”, “target”, “will” and words of similar meaning or the negative thereof.

Forward-looking statements contained in this press release are based on information currently available to the Company and assumptions that management believe to be reasonable, but are inherently uncertain. As a result, Ferroglobe’s actual results, performance or achievements may differ materially from those expressed or implied by these forward-looking statements, which are not guarantees of future performance and involve known and unknown risks, uncertainties and other factors that are, in some cases, beyond the Company’s control.

Forward-looking financial information and other metrics presented herein represent the Company’s goals and are not intended as guidance or projections for the periods referenced herein or any future periods.

All information in this press release is as of the date of its release. Ferroglobe does not undertake any obligation to update publicly any of the forward-looking statements contained herein to reflect new information, events or circumstances arising after the date of this press release. You should not place undue reliance on any forward-looking statements, which are made only as of the date of this press release.


Non-IFRS Measures

This document may contain summarized, non-audited or non-GAAP financial information. The information contained herein should therefore be considered as a whole and in conjunction with all the public information regarding the Company available, including any other documents released by the Company that may contain more detailed information. Adjusted EBITDA, adjusted EBITDA as a percentage of sales, working capital as a percentage of sales, adjusted EBITDA margin, adjusted net profit, adjusted profit per share, working capital, adjusted gross debt and net debt, are non-IFRS financial metrics that management uses in its decision making. Ferroglobe has included these financial metrics to provide supplemental measures of its performance. The Company believes these metrics are important and useful to investors because they eliminate items that have less bearing on the Company’s current and future operating performance and highlight trends in its core business that may not otherwise be apparent when relying solely on IFRS financial measures.


INVESTOR CONTACT:

Alex Rotonen, CFA

Vice President, Investor Relations

Email: investor.relations@ferroglobe.com

MEDIA CONTACT:

Cristina Feliu Roig

Executive Director, Communications & Public Affairs

Email:   corporate.comms@ferroglobe.com


Ferroglobe PLC and Subsidiaries

Unaudited Condensed Consolidated Income Statement

(in thousands of U.S. dollars, except per share amounts)

Quarter Ended

Quarter Ended


Quarter Ended


Twelve Months Ended

Twelve Months Ended


December 31, 2023


September 30, 2023

December 31, 2022

December 31, 2023

December 31, 2022

Sales


$

375,951


$

416,810

$

448,625

$

1,650,034

$

2,597,916

Raw materials and energy consumption for production


(199,911)


(195,600)

(289,572)

(879,625)

(1,285,086)

Energy consumption for production (PPA impact)

339

339

Other operating income


34,944


23,546

78,414

100,992

147,356

Staff costs


(79,761)


(83,582)

(76,431)

(305,859)

(314,810)

Other operating expense


(73,071)


(65,708)

(54,129)

(270,090)

(346,252)

Depreciation and amortization charges


(20,090)


(19,000)

(20,547)

(73,532)

(81,559)

Impairment (loss) gain

(23,614)

(1,035)

(56,999)

(25,290)

(56,999)

Other gain (loss)

(563)

(12)

335

(29)

(19)

Operating profit

14,224

75,419

29,696

196,940

660,547

Net finance income (expense)


(7,681)


(9,165)

(16,830)

(28,722)

(58,741)

Exchange differences


(4,897)


1,258

4,051

(7,551)

(9,995)

Profit before tax


1,646


67,512

16,917

160,667

591,811

Income tax (loss)


(4,160)


(23,399)

(7,775)

(57,540)

(147,983)

Profit for the period

(2,514)

44,113

9,142

103,127

443,828

Profit (loss) attributable to non-controlling interest


(3,954)


(3,229)

(2,943)

(15,816)

(3,514)

Profit attributable to the parent


$

(6,468)


$

40,884

$

6,199

$

87,311

$

440,314


EBITDA

$

34,314

$

94,419

$

50,243

$

270,472

$

742,106

Adjusted EBITDA

$

60,262

$

104,496

$

130,442

$

315,198

$

860,006

Weighted average shares outstanding

Basic

187,872

187,872

187,523

187,872

187,816

Diluted

190,801

190,531

188,949

190,290

189,625

Profit (loss) per ordinary share

Basic

$

(0.03)

$

0.22

$

0.03

$

0.46

$

2.34

Diluted

$

(0.03)

$

0.21

$

0.03

$

0.46

$

2.32


Ferroglobe PLC and Subsidiaries

Unaudited Condensed Consolidated Statement of Financial Position

(in thousands of U.S. dollars)

December 31,

September 30,

December 31,


2023


2023


2022

ASSETS

Non-current assets

Goodwill

$

29,702

$

29,702

$

29,702

Other intangible assets

138,345

120,602

111,797

Property, plant and equipment

501,396

494,912

486,247

Other non-current financial assets

19,792

15,591

14,186

Deferred tax assets

8,760

7,169

7,136

Non-current receivables from related parties

1,658

1,589

1,600

Other non-current assets

22,156

19,410

18,218

Non-current restricted cash and cash equivalents

2,119

2,133

Total non-current assets

721,809

691,094

671,019

Current assets

Inventories

383,841

383,452

500,080

Trade and other receivables

310,243

293,234

420,484

Current receivables from related parties

2,772

2,657

2,675

Current income tax assets

15,977

12,500

6,104

Other current financial assets

2

359

3

Other current assets

186,477

155,767

30,608

Assets and disposal groups classified as held for sale

0

795

1,067

Current restricted cash and cash equivalents

1,179

2,406

2,875

Cash and cash equivalents

136,470

161,448

317,935

Total current assets

1,036,961

1,012,618

1,281,831

Total assets

$

1,758,770

$

1,703,712

$

1,952,850

EQUITY AND LIABILITIES

Equity

$

874,597

$

859,723

$

756,813

Non-current liabilities

Deferred income

26,980

49,467

3,842

Provisions

49,775

52,515

47,670

Bank borrowings

14,913

15,073

15,774

Lease liabilities

20,304

11,570

12,942

Debt instruments

149,015

150,167

330,655

Other financial liabilities

65,231

64,592

38,279

Other Obligations

31,170

30,363

37,502

Other non-current liabilities

199

166

12

Deferred tax liabilities

32,582

35,449

35,854

Total non-current liabilities

390,169

409,362

522,530

Current liabilities

Provisions

122,926

84,308

145,507

Bank borrowings

31,635

52,071

57,069

Lease liabilities

8,083

7,058

8,929

Debt instruments

5,765

2,321

12,787

Other financial liabilities

16,052

13,538

60,382

Payables to related parties

2,429

3,065

1,790

Trade and other payables

183,375

166,622

219,666

Current income tax liabilities

8,351

11,901

53,234

Other Obligations

14,183

11,780

9,580

Other current liabilities

101,205

81,963

104,563

Total current liabilities

494,004

434,627

673,507

Total equity and liabilities

$

1,758,770

$

1,703,712

$

1,952,850


Ferroglobe PLC and Subsidiaries

Unaudited Condensed Consolidated Statement of Cash Flows

Quarter Ended


Quarter Ended


Quarter Ended

Twelve Months Ended

Twelve Months Ended


December 31, 2023

September 30, 2023

December 31, 2022

December 31, 2023

December 31, 2022

Cash flows from operating activities:

Profit for the period

$

(2,514)

$

44,113

$

9,142

$

103,127

$

443,828

Adjustments to reconcile net (loss) profit
to net cash used by operating activities:

Income tax (benefit) expense

4,160

23,399

7,775

57,540

147,983

Depreciation and amortization charges

20,090

19,000

20,547

73,532

81,559

Net finance expense

7,681

9,165

16,830

28,722

58,741

Exchange differences

4,897

(1,258)

(4,051)

7,551

9,995

Impairment losses

23,614

1,035

56,999

25,290

56,999

Net loss (gain) due to changes in the value of asset

504

4

(209)

139

(349)

Gain on disposal of non-current assets

(120)

(116)

459

Share-based compensation

683

2,773

1,941

7,402

5,836

Other adjustments

58

8

(6)

6

(91)

Changes in operating assets and liabilities

(Increase) decrease in inventories

(1,746)

(12,482)

41,566

102,179

(220,823)

(Increase) decrease in trade receivables

(5,399)

(16,183)

10,570

126,458

(67,560)

Increase (decrease) in trade payables

2,879

(22,361)

(130)

(74,177)

30,640

Other

(17,067)

(46,796)

(10,288)

(169,577)

(56,677)

Income taxes paid

(12,701)

(9,144)

(36,455)

(113,308)

(80,524)

Net cash provided (used) by operating activities

25,139

(8,727)

114,111

174,768

410,016

Cash flows from investing activities:

Interest and finance income received

1,349

739

257

3,725

1,520

Payments due to investments:

Other intangible assets

(1,331)

(516)

(918)

(2,787)

(1,147)

Property, plant and equipment

(24,204)

(18,853)

(13,891)

(83,679)

(52,153)

Other

6

Disposals:

Other non-current assets

935

935

Net cash (used) provided by investing activities

(23,251)

(18,630)

(14,552)

(81,806)

(51,774)

Cash flows from financing activities:

Payment for debt and equity issuance costs

(60)

(853)

Repayment of debt instruments

(1,050)

(150,000)

(179,075)

(84,823)

Increase/(decrease) in bank borrowings:

Borrowings

39,239

131,063

140,832

432,274

838,710

Payments

(58,052)

(129,714)

(146,507)

(456,506)

(865,054)

Amounts paid due to leases

(3,309)

(2,956)

(4,383)

(11,363)

(11,590)

Proceeds from other financing liabilities

38,298

Other amounts received/(paid) due to financing activities

(4,289)

(21,666)

678

Interest paid

(2,923)

(19,371)

(3,569)

(42,207)

(60,822)

Net cash (used) provided by financing activities

(30,384)

(170,978)

(13,687)

(278,543)

(145,456)

Total net cash flows for the period

(28,496)

(198,335)

85,872

(185,581)

212,786

Beginning balance of cash and cash equivalents

165,973

363,181

236,789

322,943

116,663

Exchange differences on cash and
cash equivalents in foreign currencies

172

1,127

282

287

(6,506)

Ending balance of cash and cash equivalents

$

137,649

$

165,973

$

322,943

$

137,649

$

322,943

Cash from continuing operations

136,470

161,448

317,935

136,470

317,935

Current/Non-current restricted cash and cash equivalents

1,179

4,525

5,008

1,179

5,008

Cash and restricted cash in the statement of financial position

$

137,649

$

165,973

$

322,943

$

137,649

$

322,943


Adjusted EBITDA ($,000):

Quarter Ended


Quarter Ended


Quarter Ended

Twelve Months Ended

Twelve Months Ended


December 31, 2023

September 30, 2023

December 31, 2022

December 31, 2023

December 31, 2022

Profit attributable to the parent

$

(6,468)

$

40,884

$

6,199

$

87,311

$

440,314

Profit (loss) attributable to non-controlling interest

3,954

3,229

2,943

15,816

3,514

Income tax expense

4,160

23,399

7,775

57,540

147,983

Net finance expense

7,681

9,165

16,830

28,722

58,741

Exchange differences

4,897

(1,258)

(4,051)

7,551

9,995

Depreciation and amortization charges

20,090

19,000

20,547

73,532

81,559

EBITDA

34,314

94,419

50,243

270,472

742,106

Impairment

23,614

1,035

56,999

25,290

56,999

Restructuring and termination costs

5,535

5,535

9,315

New strategy implementation

(1,000)

4,442

973

29,032

Subactivity

2,995

3,507

5,653

12,589

9,449

PPA Energy

339

339

Prior periods (loss)

13,105

13,105

Adjusted EBITDA

$

60,262

$

104,496

$

130,442

$

315,198

$

860,006

Adjusted profit attributable to Ferroglobe ($,000):

Quarter Ended


Quarter Ended


Quarter Ended

Twelve Months Ended

Twelve Months Ended


December 31, 2023

September 30, 2023

December 31, 2022

December 31, 2023

December 31, 2022

Profit attributable to the parent

$

(6,468)

$

40,884

$

6,199

$

87,311

$

440,314

Tax rate adjustment

3,722

5,441

4,591

14,803

36,604

Impairment

17,333

760

46,272

18,563

46,272

Restructuring and termination costs

4,063

4,063

7,562

New strategy implementation

(734)

3,606

714

23,568

Subactivity

2,198

2,574

4,589

9,240

7,671

PPA Energy

249

249

Prior periods (loss)

10,639

10,639

Adjusted profit attributable to the parent

$

16,300

$

53,722

$

75,896

$

134,943

$

572,630

Adjusted diluted profit per share:

Quarter Ended


Quarter Ended


Quarter Ended

Twelve Months Ended

Twelve Months Ended


December 31, 2023

September 30, 2023

December 31, 2022

December 31, 2023

December 31, 2022

Diluted profit per ordinary share

$

(0.03)

$

0.21

$

0.03

$

0.46

$

2.32

Tax rate adjustment

0.02

0.03

0.02

0.08

0.19

Impairment

0.09

0.00

0.24

0.10

0.26

Restructuring and termination costs

0.02

0.02

0.04

New strategy implementation

(0.00)

0.02

0.00

0.13

Subactivity

0.01

0.01

0.02

0.05

0.04

PPA Energy

0.00

0.00

Prior periods (loss)

0.06

0.06

Adjusted diluted profit per ordinary share

$

0.09

$

0.27

$

0.39

$

0.71

$

3.04


GRAPHIC

Advancing Materials Innovation NASDAQ: GSM Fourth Quarter and Full Year 2023 Results February 22, 2024

GRAPHIC

Forward-Looking Statements and non-IFRS Financial Metrics 2 This presentation contains forward-looking statements within the meaning of Section 27A of the United States Securities Act of 1933, as amended, and Section 21E of the United States Securities Exchange Act of 1934, as amended. Forward-looking statements are not historical facts but are based on certain assumptions of management and describe our future plans, strategies and expectations. Forward-looking statements can generally be identified by the use of forward-looking terminology, including, but not limited to, "may," “could,” “seek,” “guidance,” “predict,” “potential,” “likely,” "believe," "will," "expect," "anticipate," "estimate," "plan," "intend," "forecast," “aim,” “target,” or variations of these terms and similar expressions, or the negative of these terms or similar expressions. Forward-looking statements contained in this presentation are based on information presently available to Ferroglobe PLC (“we,” “us,” “Ferroglobe,” the “Company” or the “Parent”) and assumptions that we believe to be reasonable, but are inherently uncertain. As a result, our actual results, performance or achievements may differ materially from those expressed or implied by these forward-looking statements, which are not guarantees of future performance and involve known and unknown risks, uncertainties and other factors that are, in some cases, beyond our control. You are cautioned that all such statements involve risks and uncertainties, including without limitation, risks that Ferroglobe will not successfully integrate the businesses of Globe Specialty Metals, Inc. and Grupo FerroAtlántica SAU, that we will not realize estimated cost savings, value of certain tax assets, synergies and growth, and/or that such benefits may take longer to realize than expected. Important factors that may cause actual results to differ include, but are not limited to: (i) risks relating to unanticipated costs of integration, including operating costs, customer loss and business disruption being greater than expected; (ii) our organizational and governance structure; (iii) the ability to hire and retain key personnel; (iv) regional, national or global political, economic, business, competitive, market and regulatory conditions including, among others, changes in metals prices; (v) increases in the cost of energy and other raw materials; (vi) competition in the metals and foundry industries; (vii) environmental and regulatory risks; (viii) ability to identify liabilities associated with acquired properties prior to their acquisition; (ix) ability to manage operational risks including industrial accidents and natural disasters; (x) ability to manage a global footprint; (xi) changes in technology; (xii) ability to acquire or renew permits and approvals; (xiii) changes in legislation or governmental regulations affecting Ferroglobe; (xiv) conditions in the credit markets; (xv) risks associated with assumptions made in connection with critical accounting estimates and legal proceedings; (xvi) Ferroglobe's international operations, which are subject to the risks of currency fluctuations and foreign exchange controls; and (xvii) the potential of international unrest, economic downturn or effects of currencies, tax assessments, tax adjustments, anticipated tax rates, raw material costs or availability or other regulatory compliance costs. The foregoing list is not exhaustive. You should carefully consider the foregoing factors and the other risks and uncertainties that affect our business, including those described in the “Risk Factors” section of our, Annual Reports on Form 20-F, Current Reports on Form 6-K and other documents we file from time to time with the United States Securities and Exchange Commission. We do not give any assurance (1) that we will achieve our expectations or (2) concerning any result or the timing thereof, in each case, with respect to any regulatory action, administrative proceedings, government investigations, litigation, warning letters, consent decree, cost reductions, business strategies, earnings or revenue trends or future financial results. Forward- looking financial information and other metrics presented herein represent our key goals and are not intended as guidance or projections for the periods presented herein or any future periods. We do not undertake or assume any obligation to update publicly any of the forward-looking statements in this presentation to reflect actual results, new information or future events, changes in assumptions or changes in other factors affecting forward-looking statements. If we update one or more forward-looking statements, no inference should be drawn that we will make additional updates with respect to those or other forward-looking statements. We caution you not to place undue reliance on any forward-looking statements, which are made only as of the date of this presentation. Adjusted EBITDA, adjusted EBITDA margin, adjusted net profit, adjusted profit per share, working capital, adjusted gross debt and net debt, are non-IFRS financial metrics that, we believe, are pertinent measures of Ferroglobe’s success. The Company has included these financial metrics to provide supplemental measures of its performance. We believe these metrics are important because they eliminate items that have less bearing on the Company’s current and future operating performance and highlight trends in its core business that may not otherwise be apparent when relying solely on IFRS financial measures. For additional information, including a reconciliation of the differences between such non-IFRS financial measures and the comparable IFRS financial measures, refer to the press release dated February 21, 2024 accompanying this presentation, which is incorporated by reference herein.

GRAPHIC

Q4 and Full Year 2023 Business Review

GRAPHIC

$1.65B – SALES, down 36% Y/Y $315M – ADJ EBITDA, down 63% Y/Y 729kt – Shipments, down 13% Y/Y STRENGTHENED BALANCE SHEET THROUGH STRONG OPERATING CASH FLOWS • Redeemed remaining $148M of Senior Secured Notes in February 2024 • Net cash positive post-redemption of Senior Secured Notes POSITIONING THE COMPANY FOR LONG TERM SUCCESS • Acquired high-quality quartz mine to ensure continued access to quartz • Signed two agreements with leading EV companies in Europe and the US • Optimized French energy contract, contributed $186M to adj. EBITDA in ‘23 • Signed LT silicon supply agreement with LONGi, the world leader in solar OPENING REMARKS 4 OPERATIONAL AND FINANCIAL ACCOMPLISHMENTS $376M SALES 10% decrease Q/Q 36% decrease Y/Y $60M ADJ. EBITDA 42% decrease Q/Q 63% decrease Y/Y 16% ADJ. EBITDA MARGIN 9% decrease Q/Q 14% decrease Y/Y $2.5M NET LOSS $(0.03) EPS 116% decrease Q/Q 80% decrease Y/Y $239M GROSS DEBT 1% increase Q/Q 47% decrease Y/Y Q4 AND FULL YEAR FINANCIAL HIGHLIGHTS $138M CASH EQUIV 12/31/23 17% decrease Q/Q 57% decrease Y/Y INTRODUCING 2024 ADJUSTED EBITDA GUIDANCE $100 – $170 MILLION CURRENT MARKET ENVIRONMENT • Index prices are up from trough levels in the second half of 2023 • Restocking, supply issues and production curtailments are helping recovery • Expanding shipments to Asia, the global leader in solar production IMPLEMENTED CAPITAL ALLOCATION POLICY • Initiating quarterly cash dividend of 1.3 cents per share • Expect to request approval for a discretionary share buyback program

GRAPHIC

5 Sequential quarters Adj. EBITDA evolution ($m) Index pricing trends ($/mt) Volume trends PRODUCT CATEGORY SNAPSHOT Silicon Metal • Silicon metal generated $22 million of adjusted EBITDA, down from $81 million in the third quarter • Volumes declined by 13% due to slow demand • Prices remained under pressure during the quarter, realized price fell by 3% • Costs negatively impacted by lower energy and CO2 compensation, and lower production in France • Outlook: Demand remains muted, while prices are benefitting from supply disruptions and production curtailments

GRAPHIC

PRODUCT CATEGORY SNAPSHOT Silicon-Based Alloys 6 • Silicon-based alloys generated $35 million of adjusted EBITDA, up from $25 million in the third quarter • Volumes remained flat in the fourth quarter • Realized prices remained under pressure during the quarter, falling by 7% • Cost positively impacted by higher energy and CO2 compensation in France and earn-out from a previous divestment • Outlook: Demand recovery due to restocking and start-up of few blast furnaces, we expect improvement in the second half of 2024 Sequential quarters Adj. EBITDA evolution ($m) Index pricing trends ($/mt) Volume trends

GRAPHIC

PRODUCT CATEGORY SNAPSHOT Manganese-Based Alloys 7 • Manganese-based alloys generated $24 million adjusted EBITDA, up from $11 million in the third quarter • Volumes increased by 9% due to lower imports from Asia • Realized prices remained under pressure during the quarter, falling by 6% • Cost positively impacted by lower energy and raw material prices • Outlook: Some blast furnaces in Europe restarting, market showing moderate price recovery Sequential quarters Adj. EBITDA evolution ($m) Index pricing trends ($/mt) Volume trends

GRAPHIC

Q4 & FY 2023 Financial Review

GRAPHIC

INCOME STATEMENT SUMMARY Q4-23 VS. Q3-23 FY 2023 VS. FY 2022 9 
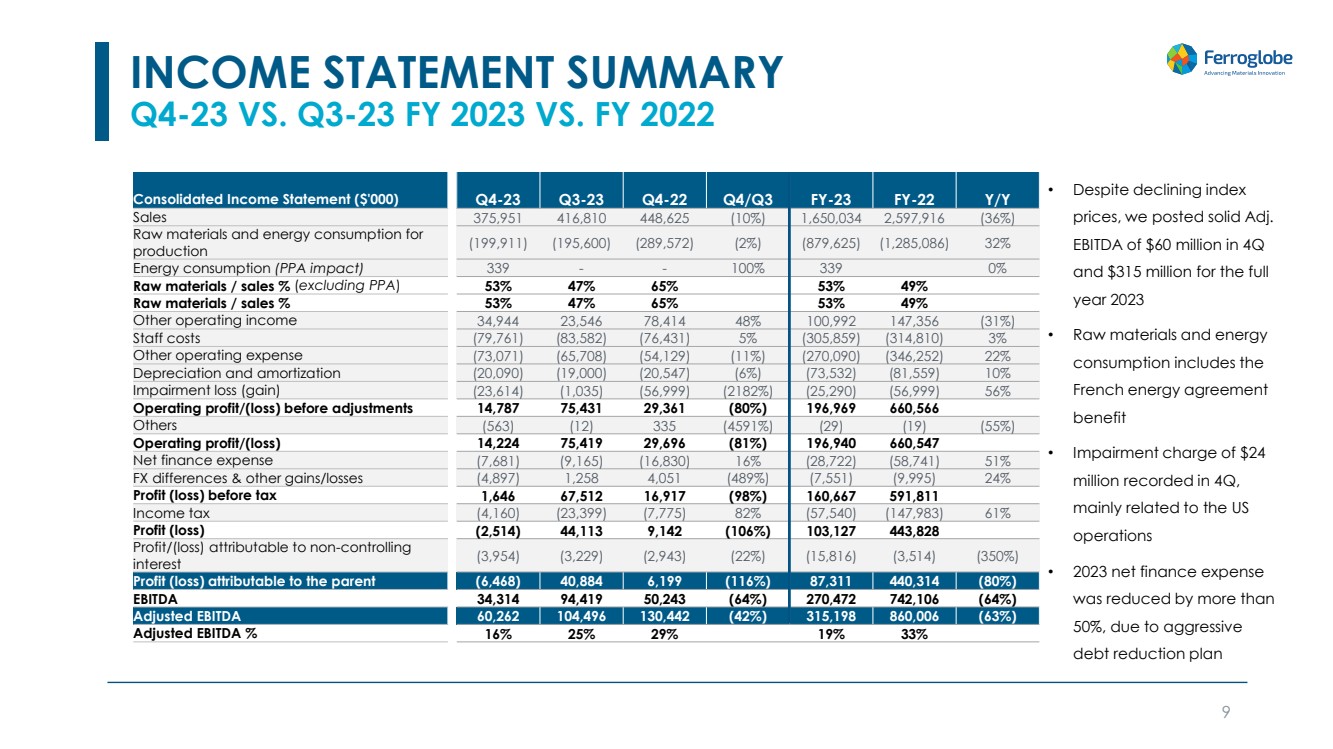
• Despite declining index prices, we posted solid Adj. EBITDA of $60 million in 4Q and $315 million for the full year 2023 • Raw materials and energy consumption includes the French energy agreement benefit • Impairment charge of $24 million recorded in 4Q, mainly related to the US operations • 2023 net finance expense was reduced by more than 50%, due to aggressive debt reduction plan Consolidated Income Statement ($'000) Q4-23 Q3-23 Q4-22 Q4/Q3 FY-23 FY-22 Y/Y Sales 375,951 416,810 448,625 (10%) 1,650,034 2,597,916 (36%) Raw materials and energy consumption for production (199,911) (195,600) (289,572) (2%) (879,625) (1,285,086) 32% Energy consumption (PPA impact) 339 - - 100% 339 0% Raw materials / sales % (excluding PPA) 53% 47% 65% 53% 49% Raw materials / sales % 53% 47% 65% 53% 49% Other operating income 34,944 23,546 78,414 48% 100,992 147,356 (31%) Staff costs (79,761) (83,582) (76,431) 5% (305,859) (314,810) 3% Other operating expense (73,071) (65,708) (54,129) (11%) (270,090) (346,252) 22% Depreciation and amortization (20,090) (19,000) (20,547) (6%) (73,532) (81,559) 10% Impairment loss (gain) (23,614) (1,035) (56,999) (2182%) (25,290) (56,999) 56% Operating profit/(loss) before adjustments 14,787 75,431 29,361 (80%) 196,969 660,566 Others (563) (12) 335 (4591%) (29) (19) (55%) Operating profit/(loss) 14,224 75,419 29,696 (81%) 196,940 660,547 Net finance expense (7,681) (9,165) (16,830) 16% (28,722) (58,741) 51% FX differences & other gains/losses (4,897) 1,258 4,051 (489%) (7,551) (9,995) 24% Profit (loss) before tax 1,646 67,512 16,917 (98%) 160,667 591,811 Income tax (4,160) (23,399) (7,775) 82% (57,540) (147,983) 61% Profit (loss) (2,514) 44,113 9,142 (106%) 103,127 443,828 Profit/(loss) attributable to non-controlling interest (3,954) (3,229) (2,943) (22%) (15,816) (3,514) (350%) Profit (loss) attributable to the parent (6,468) 40,884 6,199 (116%) 87,311 440,314 (80%) EBITDA 34,314 94,419 50,243 (64%) 270,472 742,106 (64%) Adjusted EBITDA 60,262 104,496 130,442 (42%) 315,198 860,006 (63%) Adjusted EBITDA % 16% 25% 29% 19% 33%

GRAPHIC

ADJUSTED EBITDA BRIDGE Q4-23 VS. Q3-23 ($m) 10 • Average selling prices across core products decreased 8.8%: Silicon metal -3.2%, silicon-based alloys -7.1% and Mn-based alloys -5.8% • Total volume decreased 1.4% : Silicon metal -12.7%, silicon-based alloys 0.0% and Mn-based alloys +8.9% • Costs remained flat with general improvement of raw material prices, offsetting lower energy compensation in France (¹) (¹) (¹) (¹) Includes Silica Fume and by-products (not shown in product bridges)

GRAPHIC

ADJUSTED EBITDA Bridge FY 2023 VS. FY 2022 ($m) 11 • Average selling prices across core products decreased 28.9%: Silicon Metal -30.3%, Silicon-based alloys -30.6%, and Mn-based alloys -35.8% • Total volumes decreased 13.5%: Silicon Metal -7.1%, Silicon-based alloys -6.2%, and Mn-based alloys -23.1% • Cost improved due to the positive impact from our French energy agreement and CO2 compensation (¹) Includes Silica Fume and by-products (not shown in product bridges) (¹) (¹) (¹)

GRAPHIC

450 400 400 237 239 127 55 37 71 101 Q4-22 Q1-23 Q2-23 Q3-23 Q4-23 Adj. Gross Debt Net Debt 323 344 363 166 138 Q4-22 Q1-23 Q2-23 Q3-23 Q4-23 Cash trends ($m) Adjusted gross and net debt ($m) CASH AND DEBT EVOLUTION 12 • Cash balance of $138 million as of Dec. 31, 2023: ― Bolstered by an early, partial receipt of French energy rebate of $56 million ― Received the remaining rebate payment of $154 million in January 2024 • Adj. Gross debt includes $148 million of Senior Secured Notes, subsequently fully redeemed in February 2024 $150 m of Sr. Notes redeemed in July 2023 Pro Forma Gross Debt ~$91M Post-redemption1 (¹) As of February 16, 2024 (defined as year-end 2023 adjusted gross debt of $239 million less $148 million redemption on February 16, 2024)

GRAPHIC

13 • Generated $93 million of free cash flow in 2023 ― Includes $56 million early partial payment from French energy agreement • Released $154 million of working capital in 2023 • 2023 non-cash items include the benefit from the French energy agreement Key cash flow highlights (1) Free cash flow is calculated as operating cash flow plus investing cash flow (2) EBITDA excludes the PPA Fair Value in Q2 2023 ($’000) FY2023 Q4-23 Q3-23 Q2-23 Q1-23 Q4-22 EBITDA (2) 270,814 34,653 94,419 102,491 39,251 50,243 Non-cash items (140,813) 7,966 (44,571) (66,224) (37,984) 20,815 Changes in Working Capital 154,460 (4,266) (51,026) 78,627 131,125 52,006 CO2 and Others 3,615 (513) 1,595 (16,156) 18,689 27,502 Less Cash Tax Payments (113,308) (12,701) (9,144) (75,165) (16,298) (36,455) Operating cash flow 174,768 25,139 (8,727) 23,573 134,783 114,111 Cash-flow from Investing Activities (81,806) (23,251) (18,630) (22,633) (17,292) (14,552) Cash-flow from Financing Activities (278,542) (30,383) (170,978) 19,056 (96,237) (13,687) Net cash flow (185,581) (28,496) (198,335) 19,996 21,254 85,872 Total cash * (Beginning Bal.) 322,943 165,972 363,181 344,197 322,943 236,789 FX differences 287 173 1,127 (1,011) - 282 Total cash * (Ending Bal.) 137,649 137,649 165,972 363,181 344,197 322,943 Free cash flow (1) 92,962 1,888 (27,357) 940 117,491 99,559 CASH FLOW SUMMARY

GRAPHIC

Corporate Updateb

GRAPHIC

15 Net cash positive for first time in Company's history after receipt of payment from French Energy Agreement ― Net cash positive after the $148 million redemption of remaining Senior Secured Notes in February ― Full redemption of the Senior Secured Notes reduces annual interest expense by $32 million ― Pro forma adjusted gross debt at ~$91million after redemption 3 2 1 Initiated new capital allocation policy ― Initiating quarterly cash dividend of $1.3 cents per share ― Expect to request board and shareholders' approval to implement a discretionary share buyback program Developing partnerships and alliances to advance silicon in EV batteries ― Signed a term sheet to enter a JV with a leading battery materials company in Europe ― Signed a Memorandum of Understanding to pursue silicon-rich EV battery technology in the US 4 Optimistic about long-term secular trends in solar and EV battery markets ― Strong demand growth expectations in the West, with overall silicon metal forecast to grow by 263,000 tons through 2028 (1) ― Global demand for silicon metal for solar/electronics markets predicted to grow by nearly 1.2 million ton by 2028 (1) ― Signed a long-term silicon supply agreement with LONGi, the world leader in solar KEY TAKEAWAYS (1) Source: CRU

GRAPHIC

Q&A

GRAPHIC

Appendix ─ Supplemental Information

GRAPHIC

QUARTERLY SALES AND ADJUSTED EBITDA 18 241 303 185 130 45 106 104 60 Q1-22 Q2-22 Q3-22 Q4-22 Q1-23 Q2-23 Q3-23 Q4-23 Adjusted EBITDA Quarterly Sales $ millions Q1 2022 Q2 2022 Q3 2022 Q4 2022 Q1 2023 Q2 2023 Q3 2023 Q4 2023 Silicon Metal 313 356 264 184 161 195 198 168 Silicon Alloys 212 236 179 127 137 133 115 107 Mn Alloys 144 193 97 97 62 78 59 60 Other Business 46 56 53 40 41 50 45 32 Total Revenue 715 841 593 449 401 456 417 376

GRAPHIC

Adjusted gross debt Dec-23 19 Notes: 1. Operating leases are excluded for comparison purposes and to align to the balance sheet prior to IFRS16 adoption 2. LBP excluded for comparison purposes 3. NMTC program is a federal tax credit to help economically distressed communities attract private capital. 4. Other bank loans relates to COVID-19 relief loan received in France guaranteed by the French Government 5. SEPI loans are part of the SEPI fund intended to provide assistance to non-financial companies operating in strategically important sectors within Spain in the wake of the COVID-19 pandemic 6. Other government loans include primarily COVID-19 relief loan received in Canada from the Government for $5.0 million ($´000) Current Non-current Total balance sheet Less operating leases1 Less Factoring2 NMTC3 PPA Energy Adjusted Gross debt Bank borrowings 31,635 14,913 46,548 - (30,683) (9,909) - 5,956 Lease liabilities 8,083 20,304 28,387 (28,060) - - - 327 Debt instruments 5,765 149,015 154,780 - - - 154,780 Other financial liabilities 16,052 65,231 81,283 - - - (3,841) 77,442 Total 61,535 249,463 310,998 (28,060) (30,683) (9,909) (3,841) 238,506 ($´000) Adj. Gross debt Bank borrowings: PGE (3) 2,635 NMTC (6) 3,321 5,956 Finance leases: Other finance leases 327 327 Debt instruments: Reinstated Senior Notes 150,015 Repurchase Bond (995) Accrued coupon interest Repurchase Bond (33) Accrued coupon interest 5,794 154,780 Other financial liabilities: Reindus loan 32,127 SEPI (5) 41,240 Canada and other loans (4) 4,075 77,442 Total 238,506

GRAPHIC

THANK YOU www.ferroglobe.com 20


Ferroglobe (NASDAQ:GSM)
Historical Stock Chart
From Mar 2024 to Apr 2024 Click Here for more Ferroglobe Charts.
Ferroglobe (NASDAQ:GSM)
Historical Stock Chart
From Apr 2023 to Apr 2024 Click Here for more Ferroglobe Charts.