UNITED STATES
SECURITIES AND EXCHANGE COMMISSION
Washington, D.C. 20549
FORM 6-K
REPORT OF FOREIGN
PRIVATE ISSUER PURSUANT TO RULE 13a-16
OR 15d-16 UNDER THE SECURITIES EXCHANGE ACT OF 1934
For the month of November, 2023
Commission File Number: 001-35129
Arcos Dorados Holdings Inc.
(Exact name of registrant as specified in its
charter)
Río Negro
1338, First Floor,
11100 Montevideo,
Uruguay
(Address of principal
executive office)
Indicate by check mark whether the registrant files
or will file annual reports under cover of Form 20-F or Form 40-F:
ARCOS DORADOS HOLDINGS INC.
TABLE OF CONTENTS
| ITEM |
|
| 1. |
Press Release dated November 16, 2023 titled “Arcos Dorados Reports Third Quarter
2023 Financial Results”
|
SIGNATURE
Pursuant to the requirements of the Securities
Exchange Act of 1934, the registrant has duly caused this report to be signed on its behalf by the undersigned, thereunto duly authorized.
| |
|
Arcos Dorados Holdings Inc. |
| |
|
|
| |
|
|
| |
|
|
By: |
/s/ Juan David Bastidas |
| |
|
|
|
Name: |
Juan David Bastidas |
| |
|
|
|
Title: |
Chief Legal Counsel |
Date: November 16, 2023
Item 1
ARCO
3Q 2023
Results
November
16, 2023

| FOR IMMEDIATE RELEASE |
 |
ARCOS DORADOS REPORTS THIRD QUARTER
2023 FINANCIAL RESULTS

| • | Systemwide comparable sales¹ grew 37.3% year-over-year,
supported by strong sales volume across all divisions |
| • | Total revenues reached $1.1 billion in the quarter,
up 22.1% in US dollars and 42.9% in constant currency, versus the prior year period |
| • | Digital channel sales (Delivery, Mobile App and Self-order
Kiosks) contributed 50% of systemwide sales, reaching $731.5 million |
| • | Consolidated Adjusted EBITDA¹ was $129.1 million,
up 25.8% in US dollars and 43.9% in constant currency |
| • | Net Income reached $59.7 million, or $0.28 per share,
up from $0.22 per share in the prior year quarter |
Montevideo, Uruguay,
November 16, 2023 – Arcos Dorados Holdings, Inc. (NYSE: ARCO) (“Arcos Dorados” or the “Company”), Latin
America’s largest restaurant chain and the world’s largest independent McDonald’s franchisee, today reported unaudited
results for the three and nine months ended September 30, 2023.
Third Quarter 2023 Highlights

| • | Systemwide comparable
sales¹ grew 37.3% versus the prior year quarter, rising 1.4 times the period’s blended inflation rate. |
| • | Consolidated revenues reached $1.1 billion, rising 22.1% in
US dollars and 42.9% in constant currency versus the prior year period. |
| • | Disciplined execution of a long-term growth strategy is driving
strong performance across all sales channels and geographies with an increasingly modernized restaurant portfolio. |
| • | Consolidated Adjusted EBITDA¹ of $129.1 million rose
25.8% in US dollars versus the prior year result, and 43.9% in constant currency. |
| • | Consolidated Adjusted EBITDA margin reached 11.5% in the quarter,
expanding by 40 basis points versus the prior year period. |
| • | Basic net income per share was $0.28 in the quarter, compared
to net income per share of $0.22 in the prior year quarter. |
| • | The Company opened 27 restaurants in the quarter, including
25 free-standing locations. |
1
For definitions, please refer to page 16 of this document.
| Message from Marcelo Rabach, Chief Executive Officer |
 |
The
broad-based momentum we captured in the first half of 2023 continued in the third quarter. McDonald’s Brand strength, structural
competitive advantages and consistent execution continued driving sales growth and market share gains across the Arcos Dorados footprint,
with the strongest performance in markets such as Brazil, Chile, Costa Rica and Mexico.
Our
strategy is clear: drive sustainable sales growth, supported by both guest volume and average check growth, to generate operating leverage
and long-term profitability growth. To achieve this objective, we are leaning on Value, which has always been a cornerstone of the McDonald’s
business. Value includes quality, service, convenience and optionality, in addition to price. This is where our Three D’s strategy
of Digital, Delivery and Drive-thru are leveraging Latin America’s largest free-standing restaurant portfolio and most robust digital
platform to offer Value to our guests and to the communities we serve.
Systemwide
comparable sales grew well above inflation again in the third quarter, with strong guest volume growth in all main markets. Even as consumption
moderated in some countries, sales growth remained strong and helped generate operating leverage to improve profitability. This performance,
which has been improving consistently over the last several years, allows us to continuously reinvest in the expansion, modernization
and digitalization of the business. In turn, these investments bring significant economic benefit to local economies and create new,
long-term career opportunities for young people.
Importantly,
we continue to be recognized by Great Place to Work® as one of the best, if not the best, employers for young people, with the latest
certifications coming in Brazil, Argentina, Chile and Uruguay. Youth Opportunity is one of the pillars of our Recipe for the Future ESG
Platform, together with Diversity and Inclusion, Commitment to Families, Climate Change, Circular Economy and Sustainable Sourcing. During
the quarter we made progress in and received recognition for our efforts across all these pillars. This includes the opening of our flagship
sustainable restaurant in Brazil, with multiple ESG (Environmental, Social and Governance) initiatives, twenty of which have already
been implemented in all of the country’s restaurants. ESG is truly in our DNA!
Arcos Dorados’
results for the third quarter 2023, and so far in the fourth quarter, demonstrate the importance of a consistent, long-term, strategic
approach to delivering value and convenience to restaurant customers. This includes the effective management of our balance sheet, by
maintaining a healthy cash balance and controlling both currency and interest rate risks on our long-term debt.
By consistently
executing our strategy, we are capturing our opportunities and tackling our challenges from a position of strength. Brand strength and
reputation are at an all-time high and our structural competitive advantages are widening as we open even more free-standing restaurants,
modernize even more existing restaurants and develop even more digital capabilities. We are also working hard to normalize operations
among markets to improve consolidated results. For these reasons, we are confident in our ability to sustain strong operating results
and shareholder value generation for the foreseeable future.
Thank you
for your ongoing support of Arcos Dorados.

Consolidated
Results
| Consolidated Results |
|
Figure
1. AD Holdings Inc Consolidated: Key Financial Results
 (In
millions of U.S. dollars, except as noted)
(In
millions of U.S. dollars, except as noted)
| |
3Q22
(a) |
Currency
Translation
(b)
|
Constant
Currency
Growth
(c) |
3Q23
(a+b+c) |
%
As Reported |
%
Constant Currency |
| Total
Restaurants (Units) |
2,297 |
|
|
2,339 |
|
|
| |
|
|
|
|
|
|
| Sales by Company-operated
Restaurants |
881.6 |
(186.9) |
380.6 |
1,075.3 |
22.0% |
43.2% |
| Revenues from
franchised restaurants |
40.1 |
(5.1) |
14.8 |
49.8 |
24.1% |
36.9% |
| Total
Revenues |
921.7 |
(192.0) |
395.4 |
1,125.1 |
22.1% |
42.9% |
| Systemwide
Comparable Sales |
|
|
|
|
|
37.3% |
| Adjusted
EBITDA |
102.6 |
(18.6) |
45.1 |
129.1 |
25.8% |
43.9% |
| Adjusted
EBITDA Margin |
11.1% |
|
|
11.5% |
0.4
p.p. |
|
| Net
income attributable to AD |
46.9 |
(30.4) |
43.3 |
59.7 |
27.4% |
92.4% |
| No. of shares
outstanding (thousands) |
210,595 |
|
|
210,655 |
|
|
| EPS
(US$/Share) |
0.22 |
|
|
0.28 |
|
|
Arcos
Dorados’ total revenues reached $1.1 billion, up 22.1% in US dollars and 42.9% in constant currency versus the prior year quarter.
Systemwide comparable sales grew 37.3% in the third quarter, or about 1.4 times blended inflation,
with all three divisions growing above inflation, including 4.0x blended inflation in NOLAD and 2.3x inflation in Brazil.
Guest
traffic and sales growth continue to benefit from the strong consumer preference for the McDonald’s Brand, with more than
double the market share of the nearest competitor across all main markets.
Front
counter sales, which include self-order kiosks, grew 41% in constant currency versus the prior year and generated 58% of systemwide sales.
Third quarter results were also supported by continued outstanding performance in Delivery, which grew 48% in constant currency versus
the prior year. Drive-thru sales grew 17% in constant currency, complementing the strong growth of front counter sales.
Digital channel
sales reached $731.5 million and accounted for 50% of systemwide sales in the third quarter. As of the end of September, the Company’s
Mobile App had over 107 million accumulated downloads, with about 17 million average monthly active users, and identified sales representing
20% of consolidated sales in the quarter.
The Company’s
Customer Relationship Management (CRM) platform had almost 75 million unique registered users by the end of September 2023, which allows
it to more efficiently invest its marketing spend to increase guest frequency and engagement.
| Adjusted EBITDA |
|
3Q23
Adjusted EBITDA Bridge
($ million)
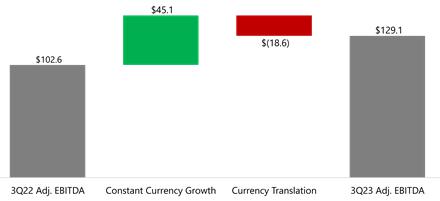
Third quarter consolidated Adjusted EBITDA reached
$129.1 million, up 25.8% in US dollars and 43.9% in constant currency over the prior year quarter, with continued strong US dollar growth
contribution from NOLAD and Brazil. Consolidated Adjusted EBITDA margin reached 11.5%, expanding 40 basis points versus the prior year.
Margin performance was highlighted by lower Food and
Paper (F&P) costs as a percentage of revenue in all divisions compared with the prior year, coupled with an improvement in G&A
and a slight improvement in Payroll expenses as a percentage of revenue. These more than offset moderately higher other operating expenses
and the impact of the final step up of the Company’s royalty rate, which became effective as of August 3, 2022.
Notable items in the Adjusted
EBITDA reconciliation

Included in Adjusted EBITDA:
There were no notable items included in Adjusted EBITDA in either the third quarter of 2023 or the third quarter of 2022.
Excluded from Adjusted EBITDA:
There were no notable items excluded from Adjusted EBITDA in either the third quarter of 2023 or the third quarter of 2022.
| Non-operating Results |
|
Arcos Dorados’ non-operating
results for the third quarter included a $2.2 million gain from non-cash foreign exchange and derivative instruments.
Net interest expense and other financing results totaled
$5.0 million in the quarter versus $7.9 million in the same period last year. The Company recorded an income tax expense of $28.1 million
in the quarter, compared to an income tax expense of $32.6 million in the prior-year period.
Third quarter net income attributable to the Company
totaled $59.7 million, compared to net income of $46.9 million in the same period of 2022. Earnings per share were $0.28 in the third
quarter of 2023, compared to $0.22 per share in the corresponding 2022 period.
Total weighted average shares for the third quarter
of 2023 amounted to 210,654,969 compared to 210,594,545 in the prior-year quarter.
For reference:
Figure 2. AD Holdings Inc Consolidated
- Excluding Venezuela: Key Financial Results
(In millions of U.S. dollars, except as
noted)
| |
3Q22
(a) |
Currency
Translation
(b)
|
Constant
Currency
Growth
(c) |
3Q23
(a+b+c) |
%
As Reported |
%
Constant Currency |
| Total
Restaurants (Units) |
2,197 |
|
|
2,251 |
|
|
| |
|
|
|
|
|
|
| Sales by Company-operated
Restaurants |
876.8 |
(153.9) |
343.7 |
1,066.5 |
21.6% |
39.2% |
| Revenues from
franchised restaurants |
39.5 |
(2.2) |
11.7 |
49.0 |
23.9% |
29.6% |
| Total
Revenues |
916.3 |
(156.2) |
355.4 |
1,115.5 |
21.7% |
38.8% |
| Systemwide
Comparable Sales |
|
|
|
|
|
32.6% |
| Adjusted
EBITDA |
103.0 |
(18.5) |
45.2 |
129.8 |
26.0% |
43.9% |
| Adjusted
EBITDA Margin |
11.2% |
|
|
11.6% |
0.4
p.p. |
|
| Net
income attributable to AD |
47.7 |
(30.2) |
45.1 |
62.6 |
31.3% |
94.7% |
| No. of shares
outstanding (thousands) |
210,595 |
|
|
210,655 |
|
|
| EPS
(US$/Share) |
0.23 |
|
|
0.30 |
|
|

Divisional
Results
| Brazil Division |
|
Figure
3. Brazil Division: Key Financial Results
(In
millions of U.S. dollars, except as noted)
| |
3Q22
(a) |
Currency
Translation
(b)
|
Constant
Currency
Growth
(c) |
3Q23
(a+b+c) |
%
As Reported |
%
Constant Currency |
| Total
Restaurants (Units) |
1,077 |
|
|
1,113 |
|
|
| |
|
|
|
|
|
|
| Total
Revenues |
352.8 |
30.5 |
55.9 |
439.2 |
24.5% |
15.9% |
| Systemwide
Comparable Sales |
|
|
|
|
|
10.8% |
| Adjusted
EBITDA |
62.4 |
5.6 |
9.9 |
77.8 |
24.8% |
15.8% |
| Adjusted
EBITDA Margin |
17.7% |
|
|
17.7% |
0.0
p.p. |
|
Brazil’s revenues
reached $439.2 million, increasing 24.5% year-over-year. On a constant currency basis, revenues grew 15.9% and systemwide
comparable sales rose 10.8% year-over-year, or 2.3x inflation in the period. The McDonald’s brand fortified its leadership
in the country with strong market share gains in the quarter within a consolidating restaurant industry.
Delivery sales increased 32% in constant currency versus
the prior year and strongly contributed to sales and traffic growth in the quarter, representing 19% of systemwide sales in the period.
Digital channel sales were up 43% versus the prior year and generated 61% of systemwide sales in Brazil, including 25% identified sales
in the quarter.
Marketing initiatives in the quarter included strong
brand experience campaigns. The highlight was the sponsorship of “The Town”, the biggest music festival in Brazil this year.
In addition to building the largest McDonald’s restaurant in Latin America on festival grounds, the Company launched a limited edition
of the “McMelt The Town” sandwich in all restaurants to bring a taste of the festival to the entire country. Maintaining its
strong connection with sports, the Company also sponsored the FIFA Women’s World Cup online broadcast on “Cazé TV”,
Brazil’s biggest streaming channel. Finally, the launches of “McFlurry Ovomaltine Mesclado” and “McFlurry Kit
Kat” boosted traffic by bringing innovation to the dessert category.
As reported Adjusted EBITDA in the division reached
$77.8 million in the quarter, rising 24.8% versus the prior year in US dollars. Adjusted EBITDA margin was 17.7%, in line with the prior
year quarter. Better F&P costs as a percentage of revenue and operating leverage in both G&A and Payroll were offset by higher
Occupancy & Other Operating expenses and a slightly higher effective royalty rate.
Following the end of the
third quarter, on October 23, 2023, the Company launched its Loyalty Program “Meu Méqui” nationwide in Brazil. As part
of the Company’s successful Digital strategy, the program boosts the power of the Mobile App
by driving visit frequency while increasing the percentage of identified sales to provide a more personalized guest experience.
| North Latin American Division (NOLAD) |
|
Figure
4. NOLAD Division: Key Financial Results
(In
millions of U.S. dollars, except as noted)
| |
3Q22
(a) |
Currency
Translation
(b)
|
Constant
Currency
Growth
(c) |
3Q23
(a+b+c) |
%
As Reported |
%
Constant Currency |
| Total
Restaurants (Units) |
631 |
|
|
638 |
|
|
| |
|
|
|
|
|
|
| Total
Revenues |
232.9 |
27.7 |
35.1 |
295.6 |
27.0% |
15.1% |
| Systemwide
Comparable Sales |
|
|
|
|
|
11.5% |
| Adjusted
EBITDA |
22.7 |
3.3 |
6.2 |
32.3 |
42.0% |
27.4% |
| Adjusted
EBITDA Margin |
9.8% |
|
|
10.9% |
1.1
p.p. |
|
As reported revenues totaled $295.6 million, up 27.0%
in US dollars and 15.1% in constant currency versus the prior year quarter. Systemwide comparable sales rose 11.5% year-over-year, or
4.0x the division’s blended inflation in the period, with comparable sales increasing above inflation in all markets. Sales growth
was supported by higher guest traffic across all markets as well, with particularly strong volume growth in Mexico, Costa Rica and the
French West Indies markets.
The NOLAD division reached some of its highest ever
market share levels, backed by positive brand attribute trends. Marketing activities featured menu innovations across the region, including
the launch of “GRANDS” sandwiches, an indulgent and tasty platform. In Mexico, the #McDonaldsMéxicoMeEncanta brand
campaign was endorsed by Sergio “Checo” Pérez, the popular Mexican Formula 1 driver, and included the “Menú
Checo” famous order campaign. In Puerto Rico, the Company launched the “Saca tu Encanto” brand-building campaign partnered
with Tommy Torres, a popular local musical artist.
NOLAD’s digital penetration is improving consistently
as investments in both technology and restaurant modernizations bring the division closer to the Company average. As it closes this gap,
NOLAD is already benefiting from improving digital trends. For example, the McDonald’s Mobile
App is, by far, the leader in monthly active users among quick service restaurant operators in Mexico, where the sales growth rate remains
one of the strongest in the Company’s footprint.
As reported Adjusted EBITDA reached $32.3 million in
the third quarter compared with $22.7 million in the prior year quarter, representing a year-over-year increase of 42.0% versus the prior
year in US dollars. Adjusted EBITDA margin expanded by 110 basis points versus the prior year period driven by better F&P costs and
Occupancy & Other Operating expenses as a percentage of revenue that more than offset slightly higher Payroll and G&A expenses
as well as the higher royalty rate.
| South Latin American Division (SLAD) |
|
Figure
5. SLAD Division: Key Financial Results
(In
millions of U.S. dollars, except as noted)
| |
3Q22
(a) |
Currency
Translation
(b)
|
Constant
Currency
Growth
(c) |
3Q23
(a+b+c) |
%
As Reported |
%
Constant Currency |
| Total
Restaurants (Units) |
589 |
|
|
588 |
|
|
| |
|
|
|
|
|
|
| Total
Revenues |
336.1 |
(250.2) |
304.4 |
390.3 |
16.1% |
90.6% |
| Systemwide
Comparable Sales |
|
|
|
|
|
93.8% |
| Adjusted
EBITDA |
39.7 |
(39.6) |
41.7 |
41.8 |
5.3% |
105.0% |
| Adjusted
EBITDA Margin |
11.8% |
|
|
10.7% |
-1.1
p.p. |
|
Revenues in SLAD reached
$390.3 million, rising 16.1% in US dollars. Systemwide comparable sales rose 93.8%, or 1.3x SLAD’s blended inflation rate.
Chile, Ecuador and Uruguay delivered the strongest growth, more than double inflation in the quarter. Systemwide comparable sales growth
also reflects the impact of Argentina and Venezuela’s high inflation rates.
SLAD’s markets captured additional market share
in the quarter, with improved scores in brand attributes, reinforcing McDonald´s brand preference across the division. To continue
strengthening its leadership in the beef segment, the Company launched the “Bacon Cheddar McMelt” sandwich and the “Pileta
de Cheddar” in Argentina, Chile, Colombia and Ecuador with strong sales results in all four countries. The Company also continued
the roll out of Best Burger, extending the platform to Aruba, Curaçao and Trinidad. The dessert platform produced excellent results
with the launch of McFlurry products with locally relevant brands, including: Sahne-nuss in Chile, Nucita in Colombia, Chips Ahoy in Perú
and Serenata de Amor in Uruguay.
Digital sales in SLAD continued to grow, supported by
increased penetration of Mobile Order and Pay and Delivery functionalities in the Mobile App. The Company
also continued the development of its own Delivery platform in SLAD markets.
As reported Adjusted EBITDA in the division totaled
$41.8 million in the third quarter. The division generated restaurant level margin expansion, driven by lower F&P costs as well as
better Payroll and Occupancy & Other Operating expenses as a percentage of revenue. These were offset by higher other operating expenses
and a moderate increase in G&A as a percentage of revenue.
For reference:
Figure
6. SLAD Division – Excluding Venezuela: Key Financial Results
(In
millions of U.S. dollars, except as noted)
| |
3Q22
(a) |
Currency
Translation
(b)
|
Constant
Currency
Growth
(c) |
3Q23
(a+b+c) |
%
As Reported |
%
Constant Currency |
| Total
Restaurants (Units) |
489 |
|
|
500 |
|
|
| |
|
|
|
|
|
|
| Total Revenues |
330.7 |
(214.4) |
264.4 |
380.7 |
15.1% |
79.9% |
| Systemwide Comparable Sales |
|
|
|
|
|
79.9% |
| Adjusted EBITDA |
40.0 |
(39.5) |
41.8 |
42.4 |
6.0% |
104.5% |
| Adjusted
EBITDA Margin |
12.1% |
|
|
11.1% |
-1.0
p.p. |
|
| New Unit Development |
|
Figure
7. Total Restaurants (eop)*
| |
September
2023 |
June
2023 |
March
2023 |
December
2022 |
September
2022 |
| Brazil |
1,113 |
1,098 |
1,091 |
1,084 |
1,077 |
| NOLAD |
638 |
639 |
639 |
638 |
631 |
| SLAD |
588 |
580 |
582 |
590 |
589 |
| TOTAL |
2,339 |
2,317 |
2,312 |
2,312 |
2,297 |
*Considers
Company-operated and franchised restaurants at period-end
Figure
8. Footprint as of September 30, 2023
| |
Store
Type* |
Total
Restaurants |
Ownership |
McCafes |
Dessert
Centers |
| |
FS |
IS |
MS
& FC |
Company-
Operated |
Franchised |
|
|
| Brazil |
564 |
92 |
457 |
1,113 |
674 |
439 |
137 |
1,993 |
| NOLAD |
392 |
51 |
195 |
638 |
484 |
154 |
13 |
519 |
| SLAD |
237 |
128 |
223 |
588 |
500 |
88 |
166 |
710 |
| TOTAL |
1,193 |
271 |
875 |
2,339 |
1,658 |
681 |
316 |
3,222 |
*FS:
Free-Standing; IS: In-Store; MS: Mall Store; FC: Food Court.
Arcos Dorados opened 27 restaurants during the third
quarter of 2023, including 25 free-standing units. In Brazil, the Company opened 14 free-standing units in the quarter. For the first
nine months of 2023, the Company opened 45 restaurants, 41 of which were free-standing restaurants. This included 32 restaurant openings
in Brazil, with 29 free-standing units opened in the country in the period.
More than half the Company’s footprint is made
up of free-standing locations, making it the region’s largest free-standing restaurant portfolio. As of the end of September, there
were 1,214 Experience of the Future restaurants, composing 52% of the Company’s total restaurant base and offering guests the most
modernized experience in the region’s quick service restaurant industry.
The restaurant development plan remains on track and
the Company expects to meet its full year guidance of 75 to 80 restaurant openings.
| Balance Sheet & Cash Flow Highlights |
|
Figure
9. Consolidated Debt and Financial Ratios
(In
thousands of U.S. dollars, except ratios)
| |
September
30, |
December
31, |
| |
2023 |
2022 |
| Total Cash & Cash equivalents (i) |
251,149 |
304,396 |
| Total Financial Debt (ii) |
709,335 |
674,401 |
| Net Financial Debt (iii) |
458,186 |
370,005 |
| LTM Adjusted EBITDA |
453,735 |
386,564 |
| Total Financial Debt / LTM Adjusted EBITDA ratio |
1.6 |
1.7 |
| Net Financial Debt / LTM Adjusted EBITDA ratio |
1.0 |
1.0 |
| (i) Total
cash & cash equivalents include short-term investment. |
| (ii) Total
financial debt includes short-term debt, long-term debt, accrued interest payable and derivative instruments (including the asset
portion of derivatives amounting to $50.3 million and $92.9 million as a reduction of financial debt as of September 30, 2023, and
December 31, 2022, respectively). |
| (iii) Net financial debt equals total financial debt
less total cash & cash equivalents. |
On September 27, 2023, the Company paid off the outstanding
$18.2 million balance of its 2023 Notes. As of September 30, 2023, total cash and cash equivalents were $251.1 million and total financial
debt (including the net derivative instrument position) was $709.3 million.
Net debt (total financial debt minus total cash and
cash equivalents) was $458.2 million, up from $370.0 million at the end of 2022, due to the lower cash balance and lower fair value of
the derivative instruments. The net debt to Adjusted EBITDA leverage ratio ended the quarter at a healthy 1.0x, unchanged from year-end
2022.
Net cash generated from operating activities for the
nine months ended September 30, totaled $232.3 million, compared with the $235.4 million cash from operations generated during the same
period last year. Capital expenditures totaled $227.8 million in the first nine months of 2023. Net cash used in financing activities
was $32.1 million, which included $31.6 million corresponding to the first three installments of the 2023 dividend.
Supplemental
Information
| Third Quarter 2023 Earnings Webcast |
|
A
webcast to discuss the information contained in this press release will be held today, November 16, 2023, at 10:00 a.m. ET. In order
to access the webcast, members of the investment community should follow this link: Arcos
Dorados Third Quarter 2023 Results Webcast.
A
replay of the webcast will be available later today in the investor section of the Company’s website: www.arcosdorados.com/ir.
|
Investor Relations Contact
Dan Schleiniger
VP of Investor Relations
Arcos Dorados
daniel.schleiniger@mcd.com.uy
|
Media Contact
David Grinberg
VP of Corporate Communications
Arcos Dorados
david.grinberg@mcd.com.uy
|
| Follow us on: |
|
 |
| Definitions |
|
Systemwide comparable sales growth:
refers to the change, measured in constant currency, in our Company-operated and franchised restaurant sales in one period from a comparable
period for restaurants that have been open for thirteen months or longer (year-over-year basis). While sales by our franchisees are not
recorded as revenues by us, we believe the information is important in understanding our financial performance because these sales are
the basis on which we calculate and record franchised revenues and are indicative of the financial health of our franchisee base.
Constant currency basis: refers
to amounts calculated using the same exchange rate over the periods under comparison to remove the effects of currency fluctuations from
this trend analysis. To better discern underlying business trends, this release uses non-GAAP financial measures that segregate year-over-year
growth into two categories: (i) currency translation, (ii) constant currency growth. (i) Currency translation reflects the impact on growth
of the appreciation or depreciation of the local currencies in which we conduct our business against the US dollar (the currency in which
our financial statements are prepared). (ii) Constant currency growth reflects the underlying growth of the business excluding the effect
from currency translation.
Adjusted
EBITDA: In addition to financial measures prepared in accordance with the general accepted accounting principles (GAAP), within this
press release and the accompanying tables, we use a non-GAAP financial measure titled ‘Adjusted
EBITDA’. We use Adjusted EBITDA to facilitate operating performance
comparisons from period to period.
Adjusted EBITDA is defined as our operating
income plus depreciation and amortization plus/minus the following losses/gains included within other operating income (expenses), net,
and within general and administrative expenses in our statement of income: gains from sale, or insurance recovery of property and equipment,
write-offs of property and equipment, and impairment of long-lived assets.
We
believe Adjusted EBITDA facilitates company-to-company operating performance comparisons by backing out potential differences caused by
variations such as capital structures (affecting net interest expense and other financing results), taxation (affecting income tax expense)
and the age and book depreciation of facilities and equipment (affecting relative depreciation expense), which may vary for different
companies for reasons unrelated to operating performance. Figure 10 of this earnings release includes a reconciliation for Adjusted EBITDA.
For more information, please see Adjusted EBITDA reconciliation in Note 9 – Segment
and geographic information – of our financial statements (6-K Form)
filed today with the S.E.C.
| About Arcos Dorados |
|
Arcos Dorados is the world’s largest independent
McDonald’s franchisee, operating the largest quick service restaurant chain in Latin America and the Caribbean. It has the exclusive
right to own, operate and grant franchises of McDonald’s restaurants in 20 Latin American and Caribbean countries and territories
with more than 2,300 restaurants, operated by the Company or by its sub-franchisees, that together employ over 95 thousand people (as
of 09/30/2023). The Company is also committed to the development of the communities in which it operates, to providing young people their
first formal job opportunities and to utilize its Recipe for the Future
to achieve a positive environmental impact. Arcos Dorados is listed for trading on the New York Stock Exchange (NYSE: ARCO). To learn
more about the Company, please visit the Investors section of our website: www.arcosdorados.com/ir.
Cautionary Statement on Forward-Looking
Statements

This press release contains forward-looking statements.
The forward-looking statements contained herein include statements about the Company’s business prospects, its ability to attract
customers, its affordable platform, its expectation for revenue generation and its outlook and guidance for growth and investments in
2023. These statements are subject to the general risks inherent in Arcos Dorados’ business. These expectations may or may not be realized.
Some of these expectations may be based upon assumptions or judgments that prove to be incorrect. In addition, Arcos Dorados' business
and operations involve numerous risks and uncertainties, many of which are beyond the control of Arcos Dorados, which could result in
Arcos Dorados' expectations not being realized or otherwise materially affect the financial condition, results of operations and cash
flows of Arcos Dorados. Additional information relating to the uncertainties affecting Arcos Dorados' business is contained in its filings
with the Securities and Exchange Commission. The forward-looking statements are made only as of the date hereof, and Arcos Dorados does
not undertake any obligation to (and expressly disclaims any obligation to) update any forward-looking statements to reflect events or
circumstances after the date such statements were made, or to reflect the occurrence of unanticipated events.
| Third Quarter 2023 Consolidated Results |
|
Figure
10. Third Quarter 2023 Consolidated Results
(In
thousands of U.S. dollars, except per share data)
| |
For
Three-Months ended |
|
For
Nine-Months ended |
| |
September
30, |
|
September
30, |
| |
2023 |
2022 |
|
2023 |
2022 |
| REVENUES |
|
|
|
|
|
| Sales by Company-operated restaurants |
1,075,328 |
881,586 |
|
3,016,212 |
2,485,230 |
| Revenues from franchised restaurants |
49,782 |
40,117 |
|
140,211 |
115,049 |
| Total
Revenues |
1,125,110 |
921,703 |
|
3,156,423 |
2,600,279 |
| OPERATING COSTS
AND EXPENSES |
|
|
|
|
|
| Company-operated restaurant expenses: |
|
|
|
|
|
| Food and paper |
(376,023) |
(316,368) |
|
(1,061,634) |
(880,804) |
| Payroll and employee benefits |
(200,904) |
(165,362) |
|
(580,286) |
(487,031) |
| Occupancy and other operating expenses |
(300,456) |
(243,208) |
|
(843,176) |
(708,082) |
| Royalty fees |
(65,058) |
(51,076) |
|
(180,317) |
(133,753) |
| Franchised restaurants - occupancy expenses |
(21,424) |
(17,181) |
|
(60,053) |
(50,044) |
| General and administrative expenses |
(67,806) |
(58,638) |
|
(202,924) |
(169,172) |
| Other operating (expenses)
/ income, net |
(2,364) |
4,044 |
|
4,219 |
11,514 |
| Total
operating costs and expenses |
(1,034,035) |
(847,789) |
|
(2,924,171) |
(2,417,372) |
| Operating
income |
91,075 |
73,914 |
|
232,252 |
182,907 |
| Net interest
expense and other financing results |
(4,973) |
(7,920) |
|
(26,960) |
(42,740) |
| Gain / (loss) from
derivative instruments |
900 |
7,578 |
|
(13,220) |
(5,258) |
| Foreign currency
exchange results |
1,286 |
6,016 |
|
22,231 |
16,798 |
| Other non-operating (expenses)
/ income, net |
(106) |
59 |
|
(100) |
(49) |
| Income
before income taxes |
88,182 |
79,647 |
|
214,203 |
151,658 |
| Income
tax expense |
(28,072) |
(32,604) |
|
(87,922) |
(65,411) |
| Net
income |
60,110 |
47,043 |
|
126,281 |
86,247 |
| Net
income attributable to non-controlling interests |
(389) |
(176) |
|
(785) |
(396) |
| Net
income attributable to Arcos Dorados Holdings Inc. |
59,721 |
46,867 |
|
125,496 |
85,851 |
| Earnings
per share information ($ per share): |
|
|
|
|
|
| Basic net income per common share |
$ 0.28 |
$ 0.22 |
|
$ 0.60 |
$ 0.41 |
| Weighted-average number of
common shares outstanding-Basic |
210,654,969 |
210,594,545 |
|
210,625,346 |
210,537,894 |
| Adjusted
EBITDA Reconciliation |
|
|
|
|
|
| Operating income |
91,075 |
73,914 |
|
232,252 |
182,907 |
| Depreciation and amortization |
37,286 |
28,294 |
|
105,806 |
88,934 |
| Operating charges excluded
from EBITDA computation |
759 |
441 |
|
1,622 |
668 |
| Adjusted
EBITDA |
129,120 |
102,649 |
|
339,680 |
272,509 |
| Adjusted
EBITDA Margin as % of total revenues |
11.5
% |
11.1
% |
|
10.8
% |
10.5
% |
| Third Quarter 2023 Results by Division |
|
Figure
11. Third Quarter Consolidated Results by Division
(In
thousands of U.S. dollars)
| |
For
Three-Months ended |
as |
Constant |
|
For
Nine-Months ended |
as |
Constant |
| |
September
30, |
reported |
Currency |
|
September
30, |
reported |
Currency |
| |
2023 |
2022 |
Incr/(Decr)% |
Incr/(Decr)% |
|
2023 |
2022 |
Incr/(Decr)% |
Incr/(Decr)% |
| Revenues |
|
|
|
|
|
|
|
|
|
| Brazil |
439,213 |
352,798 |
24.5
% |
15.9% |
|
1,218,610 |
1,022,846 |
19.1% |
16.2% |
| NOLAD |
295,641 |
232,852 |
27.0
% |
15.1% |
|
832,497 |
659,430 |
26.2% |
17.1% |
| SLAD |
390,256 |
336,053 |
16.1
% |
90.6% |
|
1,105,316 |
918,003 |
20.4% |
85.5% |
| SLAD - Excl. Venezuela |
380,657 |
330,688 |
15.1
% |
79.9% |
|
1,084,298 |
905,241 |
19.8% |
76.6% |
| TOTAL |
1,125,110 |
921,703 |
22.1
% |
42.9% |
|
3,156,423 |
2,600,279 |
21.4% |
40.9% |
| TOTAL - Excl. Venezuela |
1,115,511 |
916,338 |
21.7
% |
38.8
% |
|
3,135,405 |
2,587,517 |
21.2% |
37.6% |
| |
|
|
|
|
|
|
|
|
|
| Operating Income
(loss) |
|
|
|
|
|
|
|
|
|
| Brazil |
59,374 |
49,498 |
20.0
% |
11.1% |
|
156,376 |
119,543 |
30.8% |
27.1% |
| NOLAD |
21,779 |
14,619 |
49.0
% |
32.9% |
|
54,136 |
42,706 |
26.8% |
16.4% |
| SLAD |
34,187 |
33,470 |
2.1
% |
125.4% |
|
97,101 |
84,141 |
15.4% |
112.2% |
| SLAD - Excl. Venezuela |
35,142 |
34,121 |
3.0
% |
123.3% |
|
101,364 |
87,543 |
15.8% |
116.4% |
| Corporate and Other |
(24,265) |
(23,673) |
-2.5% |
-55.4% |
|
(75,361) |
(63,483) |
-18.7% |
-63.8% |
| TOTAL |
91,075 |
73,914 |
23.2
% |
53.0% |
|
232,252 |
182,907 |
27.0% |
51.0% |
| TOTAL - Excl. Venezuela |
92,030 |
74,565 |
23.4
% |
52.6% |
|
236,515 |
186,309 |
26.9% |
54.1% |
| |
|
|
|
|
|
|
|
|
|
| Adjusted EBITDA |
|
|
|
|
|
|
|
|
|
| Brazil |
77,848 |
62,364 |
24.8
% |
15.8% |
|
206,450 |
161,108 |
28.1% |
24.6% |
| NOLAD |
32,308 |
22,748 |
42.0
% |
27.4% |
|
84,218 |
67,408 |
24.9% |
15.3% |
| SLAD |
41,780 |
39,683 |
5.3
% |
105.0% |
|
119,370 |
102,936 |
16.0% |
92.7% |
| SLAD - Excl. Venezuela |
42,428 |
40,045 |
6.0
% |
104.5% |
|
122,655 |
105,466 |
16.3% |
97.3% |
| Corporate and Other |
(22,816) |
(22,146) |
-3.0% |
-57.3% |
|
(70,358) |
(58,943) |
-19.4% |
-65.3% |
| TOTAL |
129,120 |
102,649 |
25.8
% |
43.9% |
|
339,680 |
272,509 |
24.6% |
39.2% |
| TOTAL -
Excl. Venezuela |
129,768 |
103,011 |
26.0
% |
43.9% |
|
342,965 |
275,039 |
24.7% |
41.5% |
Figure
12. Average Exchange Rate per Quarter*
| |
Brazil |
Mexico |
Argentina |
| 3Q23 |
4.88 |
17.07 |
312.54 |
| 3Q22 |
5.24 |
20.22 |
135.61 |
| *
Local $ per 1 US$ |
|
|
|
| Summarized Consolidated Balance
Sheets |
|
Figure
13. Summarized Consolidated Balance Sheets
(In
thousands of U.S. dollars)
| |
|
September
30, |
December
31, |
| |
|
2023 |
2022 |
| ASSETS |
|
| Current assets |
|
|
|
| Cash and cash equivalents |
|
166,307 |
266,937 |
| Short-term investment |
|
84,842 |
37,459 |
| Accounts and notes receivable, net |
|
136,519 |
124,273 |
| Other current assets (1) |
|
220,475 |
196,873 |
| Derivative instruments |
|
— |
58,821 |
| Total current assets |
|
608,143 |
684,363 |
| Non-current assets |
|
|
|
| Property and equipment, net |
|
1,022,274 |
856,085 |
| Net intangible assets and goodwill |
|
59,106 |
54,569 |
| Deferred income taxes |
|
83,876 |
87,972 |
| Derivative instruments |
|
50,267 |
34,088 |
| Equity method investments |
|
17,709 |
14,708 |
| Leases right of use assets, net |
|
903,816 |
820,683 |
| Other non-current assets (2) |
|
101,142 |
84,162 |
| Total
non-current assets |
|
2,238,190 |
1,952,267 |
| Total
assets |
|
2,846,333 |
2,636,630 |
| LIABILITIES AND EQUITY |
|
|
|
| Current liabilities |
|
|
|
| Accounts payable |
|
324,453 |
353,468 |
| Taxes payable (3) |
|
178,355 |
146,682 |
| Accrued payroll and other liabilities |
|
146,775 |
115,327 |
| Royalties payable to McDonald’s Corporation |
|
14,453 |
21,280 |
| Provision for contingencies |
|
2,194 |
2,272 |
| Interest payable |
|
18,133 |
7,906 |
| Financial debt (4) |
|
10,697 |
29,566 |
| Operating lease liabilities |
|
89,737 |
82,911 |
| Total
current liabilities |
|
784,797 |
759,412 |
| Non-current liabilities |
|
|
|
| Accrued payroll and other liabilities |
|
23,675 |
28,781 |
| Provision for contingencies |
|
48,382 |
42,567 |
| Financial debt (5) |
|
730,772 |
729,838 |
| Deferred income taxes |
|
5,057 |
3,931 |
| Operating lease liabilities |
|
810,969 |
747,674 |
| Total
non-current liabilities |
|
1,618,855 |
1,552,791 |
| Total
liabilities |
|
2,403,652 |
2,312,203 |
| Equity |
|
|
|
| Class A shares of common stock |
|
389,907 |
389,393 |
| Class B shares of common stock |
|
132,915 |
132,915 |
| Additional paid-in capital |
|
8,719 |
9,206 |
| Retained earnings |
|
510,410 |
424,936 |
| Accumulated other comprehensive losses |
|
(580,821) |
(613,460) |
| Common stock in treasury |
|
(19,367) |
(19,367) |
| Total
Arcos Dorados Holdings Inc shareholders’ equity |
|
441,763 |
323,623 |
| Non-controlling
interest in subsidiaries |
|
918 |
804 |
| Total
equity |
|
442,681 |
324,427 |
| Total
liabilities and equity |
|
2,846,333 |
2,636,630 |
| (1) | Includes “Other receivables”, “Inventories”
and “Prepaid expenses and other current assets”. |
| (2) | Includes
“Miscellaneous” and “Collateral deposits”. |
| (3) | Includes
“Income taxes payable” and “Other taxes payable”. |
| (4) | Includes
“Short-term debt”, “Current portion of long-term debt” and “Derivative instruments”. |
| (5) | Includes
“Long-term debt, excluding current portion” and “Derivative instruments”. |
Thank
you! |
 |

Arcos Dorados (NYSE:ARCO)
Historical Stock Chart
From Mar 2024 to Apr 2024

Arcos Dorados (NYSE:ARCO)
Historical Stock Chart
From Apr 2023 to Apr 2024
