UNITED STATES
SECURITIES AND EXCHANGE COMMISSION
Washington, D.C. 20549
FORM 6-K
REPORT OF FOREIGN
PRIVATE ISSUER PURSUANT TO RULE 13a-16
OR 15d-16 UNDER THE SECURITIES EXCHANGE ACT OF 1934
For the month of August, 2023
Commission File Number: 001-35129
Arcos Dorados Holdings Inc.
(Exact name of registrant as specified in its
charter)
Dr. Luis Bonavita
1294, Office 501
Montevideo, Uruguay,
11300 WTC Free Zone
(Address of principal
executive office)
Indicate by check mark whether the registrant files
or will file annual reports under cover of Form 20-F or Form 40-F:
Indicate by check mark if the registrant is submitting
the Form 6-K in paper as permitted by Regulation S-T Rule 101(b)(1):
Indicate by check mark if the registrant is submitting
the Form 6-K in paper as permitted by Regulation S-T Rule 101(b)(7):
ARCOS DORADOS HOLDINGS INC.
TABLE OF CONTENTS
| ITEM |
|
| 1. |
Press Release dated August 17, 2023 titled “Arcos Dorados Reports Second Quarter 2023 Financial Results” |
SIGNATURE
Pursuant to the requirements of the Securities
Exchange Act of 1934, the registrant has duly caused this report to be signed on its behalf by the undersigned, thereunto duly authorized.
| |
|
Arcos Dorados Holdings Inc. |
| |
|
|
| |
|
|
| |
|
|
By: |
/s/ Juan David Bastidas |
| |
|
|
|
Name: |
Juan David Bastidas |
| |
|
|
|
Title: |
Chief Legal Counsel |
Date: August 17, 2023
Item 1
ARCO
2Q 2023
Results
August
17, 2023

| FOR IMMEDIATE RELEASE |
 |
ARCOS
DORADOS REPORTS SECOND QUARTER 2023 FINANCIAL RESULTS
| • | Systemwide comparable sales¹ grew 31.5% year-over-year,
with strong sales and market share performance in all divisions |
| • | Total revenues reached $1.04 billion in the quarter, up
17.2% in US dollars and 36.2% in constant currency, versus the prior year period |
| • | Digital channel sales (Delivery, Mobile App and Self-order
Kiosks), reached $665.9 million, representing 49% of systemwide sales in the second quarter |
| • | Consolidated Adjusted EBITDA¹ was $110.1 million,
up 20.5% in US dollars and 31.0% in constant currency |
| • | Net Income in the quarter grew to $28.4 million, or $0.13
per share, almost doubling the prior year result |
Montevideo,
Uruguay, August 17, 2023 – Arcos Dorados Holdings, Inc. (NYSE: ARCO) (“Arcos Dorados” or the “Company”),
Latin America’s largest restaurant chain and the world’s largest independent McDonald’s franchisee, today reported
unaudited results for the three and six months ended June 30, 2023.
Second
Quarter 2023 Highlights
| • | Systemwide comparable
sales¹ increased 31.5%, rising 1.3 times blended inflation. |
| • | Consolidated revenues reached $1.04 billion, growing 17.2% in
US dollars and 36.2% in constant currency, versus the prior year period. |
| • | Consolidated Adjusted EBITDA¹ of $110.1 million rose 20.5%
in US dollars versus the prior year result, and 31.0% in constant currency. |
| • | Consolidated Adjusted EBITDA margin reached 10.6% in the quarter,
expanding by 30 basis points versus the prior year period. |
| • | Basic net income per share was $0.13 in the quarter, almost
double the net income per share of $0.07 in the prior year quarter. |
| • | The Company opened 10 restaurants in the period, including 8
free-standing units. |
| • | Surpassed 100 million cumulative downloads of the Company’s
Mobile App. |
¹ For definitions, please refer to page 16 of
this document.
| Message from Marcelo Rabach, Chief Executive Officer |
 |
For
the last several years, Arcos Dorados has made the most of its unique position in the Latin American QSR industry. We are operating the
industry’s favorite Brand and leveraging structural competitive advantages to capture the McDonald’s Brand’s full growth
potential.
Our
“Three D’s” strategy, of Digital, Delivery and Drive-thru, provides the framework and tools for strong, sustainable
sales growth. Restaurant level execution has also been a key success factor. By offering guests an unmatched experience through a combination
of value, quality and service, we are generating consistent transaction volume growth on a comparable basis.
This
approach to building topline has led to sales growth well above inflation that, in turn, generates fixed cost leverage and improved profitability.
Importantly, the strong performance has been consistent across all three divisions. The geographic diversification we envisioned when
Arcos Dorados was formed sixteen years ago has been an important success factor in recent years.
There
have been a series of actions and initiatives across the organization within a long-term, strategic framework that are driving these
results. From restaurant operations to digital capabilities and investment decisions, we are working hard to generate value for all stakeholders.
We
understand the importance of efficient capital allocation, which is why we have focused our investments on modernizing existing restaurants
and opening primarily free-standing locations to capitalize on the flexibility and adaptability of this restaurant format. Fortunately,
the investments of the last three years have delivered above average returns on openings, modernizations and digital capabilities, among
others.
These
investments provide more than just financial returns. They also make us the largest generators of first-time jobs for young people in
the region. In addition to restaurant training, we offer personal and professional development opportunities that will serve them for
the rest of their lives. In fact, more than 110 thousand people have enrolled for free certificate courses on a broad range of topics
through Hamburger University’s MCampus online education platform.
I
hope we can inspire even more young people to join the Arcos Dorados family and build a better future for their families, communities
and the planet.
Consolidated
Results
| Consolidated Results |
|
Figure
1. AD Holdings Inc Consolidated: Key Financial Results
(In
millions of U.S. dollars, except as noted)
| |
2Q22
(a) |
Currency Translation
(b) |
Constant
Currency
Growth
(c) |
2Q23
(a+b+c) |
% As Reported |
% Constant Currency |
| Total Restaurants (Units) |
2,286 |
|
|
2,317 |
|
|
| |
|
|
|
|
|
|
| Sales by Company-operated Restaurants |
848.4 |
(163.4) |
309.6 |
994.5 |
17.2% |
36.5% |
| Revenues from franchised restaurants |
39.5 |
(5.6) |
12.0 |
46.0 |
16.3% |
30.3% |
| Total Revenues |
887.9 |
(169.0) |
321.6 |
1,040.5 |
17.2% |
36.2% |
| Systemwide Comparable Sales |
|
|
|
|
|
31.5% |
| Adjusted EBITDA |
91.4 |
(9.6) |
28.3 |
110.1 |
20.5% |
31.0% |
| Adjusted EBITDA Margin |
10.3% |
|
|
10.6% |
0.3 p.p. |
|
| Net income (loss) attributable to AD |
14.5 |
(4.3) |
18.2 |
28.4 |
95.9% |
125.7% |
| No. of shares outstanding (thousands) |
210,540 |
|
|
210,626 |
|
|
| EPS (US$/Share) |
0.07 |
|
|
0.13 |
|
|
Arcos
Dorados’ total revenues reached $ 1.04 billion, up 17.2% in US dollars and 36.2% in constant currency versus the prior year quarter.
Guest traffic and sales growth were driven mainly by a strong performance in front counter, dessert center and Delivery sales together
with further Digital sales penetration. Systemwide comparable sales in the second quarter grew 31.5%, or about 1.3 times blended inflation,
including 2.5x in Brazil and 2.8x in NOLAD.
Second
quarter 2023 front counter sales, which includes self-order kiosks, grew 37% in constant currency versus the prior year and generated
57% of systemwide sales. Delivery sales also grew strongly, up 41% in constant currency on top of robust growth in the prior year, reflecting
industry-leading operational execution and significant brand preference. Drive-thru sales grew 12% in constant currency, despite the
continued normalization of front counter sales.
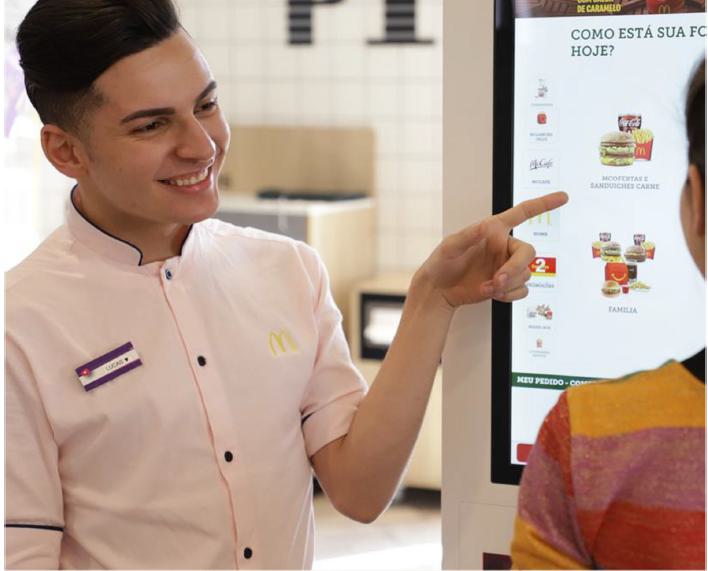
Digital channel
sales, which includes Delivery, Mobile App and Self-order kiosks, grew 41% versus the prior year and reached $665.9 million, representing
49% of systemwide sales in the second quarter. The Company’s Mobile App surpassed 100 million cumulative downloads, with more than
16 million average monthly active users, and the Company’s customer relationship management (CRM) platform had over 70 million
unique registered users at the end of June 2023.
The Mobile
App leverages guest data and increases visit frequency, especially when the sale is identified to an individual guest. During the second
quarter, identified sales represented about 20% of consolidated sales and 25% of total sales in Brazil.
| Notable items in the Adjusted EBITDA reconciliation |
|
Included
in Adjusted EBITDA: The positive variation in other operating income / (expense) is mainly explained by a $4.0 million gain
from the sale of restaurants to a sub-franchisee in Chile in the second quarter of 2023.
Excluded
from Adjusted EBITDA: There were no notable items excluded from Adjusted EBITDA in either the second quarter of 2023 or the second
quarter of 2022.
Adjusted
EBITDA
2Q23
Adjusted EBITDA Bridge
($ million)
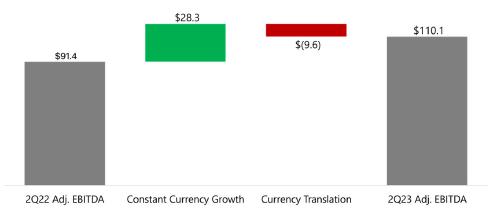
Second quarter
consolidated Adjusted EBITDA reached $110.1 million, up 20.5% in US dollars and 31.0% in constant currency over the prior year quarter,
with continued US dollar growth in all divisions. Consolidated Adjusted EBITDA margin reached 10.6%, expanding 30 basis points versus
the prior year, but down 10 basis points when adjusted for the $4.0 million gain from the sale of restaurants to a sub-franchisee in
Chile.
Margin performance
was highlighted by significant operating leverage in both Payroll and Occupancy & Other Operating expenses due to strong sales growth
across all divisions. Food and Paper (F&P) costs also declined as a percentage of revenue compared with the prior year due to a better
gross margin in NOLAD and SLAD. These more than offset moderately higher G&A expenses and the impact of the final step up of the
Company’s royalty rate, which became effective as of August 3, 2022.
| Non-operating Results |
|
Arcos
Dorados’ non-operating results for the second quarter included a $4.5 million gain from non-cash foreign exchange and derivative
instruments.
Net interest
expense and other financing results totaled $12.1 million in the quarter versus $24.2 million in the same period last year. The second
quarter 2022 result included $10.6 million in expenses related to the liability management transaction executed during that quarter when
the Company issued its 2029 Senior Notes, the first Sustainability Linked Bond (SLB) in the QSR industry.
In the second
quarter, the Company recorded an income tax expense of $38.8 million, compared to an income tax expense of $15.6 million in the prior-year
period.
Second quarter
net income attributable to the Company totaled $28.4 million, compared to net income of $14.5 million in the same period of 2022. Earnings
per share were $0.13 in the second quarter of 2023, versus $0.07 per share generated in the prior year quarter.
Total
weighted average shares for the second quarter of 2023 were 210,625,859 compared to 210,539,537 in the second quarter of 2022.
For
reference:
Figure
2. AD Holdings Inc Consolidated - Excluding Venezuela: Key Financial Results
(In
millions of U.S. dollars, except as noted)
| |
2Q22
(a) |
Currency Translation
(b) |
Constant
Currency
Growth
(c) |
2Q23
(a+b+c) |
% As Reported |
% Constant Currency |
| Total Restaurants (Units) |
2,186 |
|
|
2,227 |
|
|
| |
|
|
|
|
|
|
| Sales by Company-operated Restaurants |
844.8 |
(139.3) |
283.4 |
989.0 |
17.1% |
33.6% |
| Revenues from franchised restaurants |
39.1 |
(3.2) |
9.6 |
45.5 |
16.3% |
24.5% |
| Total Revenues |
883.9 |
(142.5) |
293.0 |
1,034.4 |
17.0% |
33.2% |
| Systemwide Comparable Sales |
|
|
|
|
|
27.7% |
| Adjusted EBITDA |
92.4 |
(15.2) |
34.4 |
111.6 |
20.8% |
37.2% |
| Adjusted EBITDA Margin |
10.5% |
|
|
10.8% |
0.3 p.p. |
|
| Net income (loss) attributable to AD |
15.6 |
(10.3) |
24.7 |
29.9 |
92.1% |
158.4% |
| No. of shares outstanding (thousands) |
210,540 |
|
|
210,626 |
|
|
| EPS (US$/Share) |
0.07 |
|
|
0.14 |
|
|

Divisional
Results
| Brazil Division |
|
Figure
3. Brazil Division: Key Financial Results
(In
millions of U.S. dollars, except as noted)
| |
2Q22
(a) |
Currency Translation
(b) |
Constant
Currency
Growth
(c) |
2Q23
(a+b+c) |
% As Reported |
% Constant Currency |
| Total Restaurants (Units) |
1,070 |
|
|
1,098 |
|
|
| |
|
|
|
|
|
|
| Total Revenues |
358.1 |
(2.7) |
49.9 |
405.2 |
13.2% |
13.9% |
| Systemwide Comparable Sales |
|
|
|
|
|
9.6% |
| Adjusted EBITDA |
52.7 |
(0.3) |
16.7 |
69.1 |
31.2% |
31.7% |
| Adjusted EBITDA Margin |
14.7% |
|
|
17.1% |
2.3 p.p. |
|
Brazil’s
revenues increased 13.2% year-over-year, reaching $405.2 million. Systemwide comparable sales rose 9.6% year-over-year, or 2.5x inflation
in the period, with visit share more than double the market’s nearest competitor.
Digital
channel sales were up 30% versus the prior year, boosted by the “Méqui Fest” campaign, with a "festival”
of offers designed to generate mobile app downloads and usage. Total digital sales generated 61% of systemwide sales in Brazil, including
25% identified sales in the quarter. Delivery demonstrated its continued popularity among guests and the Company consolidated
its market leadership in this channel. Delivery sales rose 25% in constant currency versus the prior year
period, representing 19% of systemwide sales in the quarter.
The
quarter also included a new menu item in the premium beef segment with the introduction of the “Big Tasty Bacon Barbecue”,
while a campaign to celebrate the 40th anniversary of Chicken McNuggets strengthened the strategically important chicken category.
As reported
Adjusted EBITDA in the division reached $69.1 million in the quarter, rising 31.2% versus the prior year in US dollars. Adjusted EBITDA
margin was 17.1%, or 230 basis points higher than the prior year quarter. Sales growth above inflation and significant operating leverage
more than offset moderately higher F&P costs as a percentage of revenue.
| North Latin American Division (NOLAD) |
|
Figure
4. NOLAD Division: Key Financial Results
(In
millions of U.S. dollars, except as noted)
| |
2Q22
(a) |
Currency Translation
(b) |
Constant
Currency
Growth
(c) |
2Q23
(a+b+c) |
% As Reported |
% Constant Currency |
| Total Restaurants (Units) |
628 |
|
|
639 |
|
|
| |
|
|
|
|
|
|
| Total Revenues |
222.7 |
20.8 |
34.1 |
277.6 |
24.6% |
15.3% |
| Systemwide Comparable Sales |
|
|
|
|
|
10.4% |
| Adjusted EBITDA |
23.3 |
2.2 |
2.7 |
28.2 |
21.3% |
11.7% |
| Adjusted EBITDA Margin |
10.4% |
|
|
10.2% |
-0.2 p.p. |
|
As reported
revenues totaled $277.6 million, up 24.6% in US dollars and 15.3% in constant currency versus the prior year quarter. Systemwide comparable
sales rose 10.4% year-over-year, or 2.8x the division’s blended inflation in the period, with sales increasing above inflation
in most markets and particularly strong volume growth in Mexico.
NOLAD’s
markets captured additional market share in the quarter with consistent, positive momentum in brand attributes across the division. In
April, the Company continued the roll out of Best Burger, extending the platform to Puerto Rico, where sales responded strongly in May
and June. New menu items included the launch of the McCrispy CBO sauce in Mexico, strengthening the chicken portfolio in the country.
The 40th Anniversary of the Chicken McNuggets was also celebrated in most countries, highlighting this core menu favorite among guests.
As reported
Adjusted EBITDA in the division reached $28.2 million in the quarter, rising 21.3% versus the prior year in US dollars. Adjusted EBITDA
margin declined by 20 basis points versus the prior year period, primarily due to the impact of the final step-up in the Company’s
royalty rate as well as higher Payroll and G&A expenses as a percentage of revenue. These were almost entirely offset by lower F&P
costs as a percentage of revenue and operating leverage in other cost and expense line items.
Notably,
NOLAD generates its results in hard or relatively stable currencies: US dollar, euro, Mexican peso and Costa Rican colón.
| South Latin American Division (SLAD) |
|
Figure
5. SLAD Division: Key Financial Results
(In
millions of U.S. dollars, except as noted)
| |
2Q22
(a) |
Currency Translation
(b) |
Constant
Currency
Growth
(c) |
2Q23
(a+b+c) |
% As Reported |
% Constant Currency |
| Total Restaurants (Units) |
588 |
|
|
580 |
|
|
| |
|
|
|
|
|
|
| Total Revenues |
307.1 |
(187.0) |
237.6 |
357.7 |
16.5% |
77.4% |
| Systemwide Comparable Sales |
|
|
|
|
|
82.4% |
| Adjusted EBITDA |
32.9 |
(17.3) |
21.2 |
36.9 |
12.0% |
64.4% |
| Adjusted EBITDA Margin |
10.7% |
|
|
10.3% |
-0.4 p.p. |
|
Revenues
in SLAD reached $357.7 million, rising 16.5% in US dollars, driven by an 82.4% increase in systemwide comparable sales versus the prior
year, or 1.2x the division’s blended inflation rate, with Argentina, Colombia and Chile driving topline growth.
SLAD reached
some of its highest ever market share levels, backed by positive brand attribute trends. Menu innovations across the region, included
the launch of flavorful and abundant products in the beef and chicken categories such as the “Signature Tasty Turbo Bacon”
in Chile, “Bacon Cheddar McMelt” in Argentina and “McCrispy BLT” in Colombia with localized campaigns that contributed
to improved scores in quality attributes and brand preference in these markets. Digital channel and identified sales penetration rose
to record levels in the division, including strong growth in the Mobile Order and Pay functionality on the mobile app.
As reported
Adjusted EBITDA in the division totaled $36.9 million in the second quarter and Adjusted EBITDA margin contracted 40 basis points versus
the prior year quarter. Adjusted EBITDA margin in the quarter benefited from a $4.0 million gain from the sale of restaurants in Chile.
Excluding this effect, the margin declined by 150 basis points versus the prior year.
The division’s
Adjusted EBITDA was primarily impacted by the final step-up in the Company’s royalty rate, as well as a moderate increase in G&A
and payroll expenses as a percentage of revenue. These were partially offset by lower F&P costs as a percentage of revenue generated
by a favorable sales mix and strong sales growth.
For
reference:
Figure
6. SLAD Division – Excluding Venezuela: Key Financial Results
(In
millions of U.S. dollars, except as noted)
| |
2Q22
(a) |
Currency Translation
(b) |
Constant
Currency
Growth
(c) |
2Q23
(a+b+c) |
% As Reported |
% Constant Currency |
| Total Restaurants (Units) |
488 |
|
|
490 |
|
|
| |
|
|
|
|
|
|
| Total Revenues |
303.1 |
(160.5) |
209.0 |
351.6 |
16.0% |
69.0% |
| Systemwide Comparable Sales |
|
|
|
|
|
70.8% |
| Adjusted EBITDA |
34.0 |
(22.9) |
27.3 |
38.4 |
13.1% |
80.4% |
| Adjusted EBITDA Margin |
11.2% |
|
|
10.9% |
-0.3 p.p. |
|
| New Unit Development |
|
Figure
7. Total Restaurants (eop)*
| |
June
2023 |
March
2023 |
December
2022 |
September
2022 |
June
2022 |
| Brazil |
1,098 |
1,091 |
1,084 |
1,077 |
1,070 |
| NOLAD |
639 |
639 |
638 |
631 |
628 |
| SLAD |
580 |
582 |
590 |
589 |
588 |
| TOTAL |
2,317 |
2,312 |
2,312 |
2,297 |
2,286 |
*Considers
Company-operated and franchised restaurants at period-end
Figure
8. Footprint as of June 30, 2023
| |
Store Type* |
Total |
Ownership |
McCafes |
Dessert Centers |
| |
FS |
IS |
MS & FC |
Restaurants |
Company Operated |
Franchised |
|
|
| Brazil |
550 |
91 |
457 |
1,098 |
662 |
436 |
137 |
1,975 |
| NOLAD |
392 |
51 |
196 |
639 |
484 |
155 |
13 |
519 |
| SLAD |
229 |
128 |
223 |
580 |
494 |
86 |
166 |
704 |
| TOTAL |
1,171 |
270 |
876 |
2,317 |
1,640 |
677 |
316 |
3,198 |
FS:
Free-Standing; IS: In-Store; MS: Mall Store; FC: Food Court.
During the
second quarter of 2023, the Company opened 10 restaurants, including 9 restaurants in Brazil and 8 free-standing units. More than half
the Company’s footprint is made up of free-standing units, the region’s largest free-standing portfolio, which provides a
structural competitive advantage given the versatility of this format.
As of the
end of June, there were 1,128 Experience of the Future restaurants, the most modern format in the global McDonald’s system, making
up 49% of the Company’s total footprint.
The Company’s
restaurant development plan remains on track, with a strong pipeline of restaurant openings and modernizations underway in the second
semester of 2023. All ground breaks on new restaurant construction for 2023 have been made and the Company expects to meet its full year
openings guidance of 75 to 80 restaurants and about 250 modernizations.
| Balance Sheet & Cash Flow Highlights |
|
Figure
9. Consolidated Debt and Financial Ratios
(In
thousands of U.S. dollars, except ratios)
| |
June 30, |
December 31, |
| |
2023 |
2022 |
| Total Cash & cash equivalents (i) |
223,953 |
304,396 |
| Total Financial Debt (ii) |
695,494 |
674,401 |
| Net Financial Debt (iii) |
471,541 |
370,005 |
| LTM Adjusted EBITDA |
427,264 |
386,564 |
| Total Financial Debt / LTM Adjusted EBITDA ratio |
1.6 |
1.7 |
| Net Financial Debt / LTM Adjusted EBITDA ratio |
1.1 |
1.0 |
| (i) | Total cash & cash equivalents include short-term investment. |
| (ii) | Total financial debt includes short-term debt, long-term
debt, accrued interest payable and derivative instruments (including the asset portion of derivatives amounting to $72.0 million and
$92.9 million as a reduction of financial debt as of June 30, 2023 and December 31, 2022, respectively). |
| (iii) | Net financial debt equals total financial debt less total
cash & cash equivalents. |
As of June
30, 2023, total cash and cash equivalents were $224.0 million and total financial debt (including the net derivative instrument position)
was $695.5 million. Net debt (total financial debt minus total cash and cash equivalents) was $471.5 million, up from $370.0 million
at the end of 2022, due to lower cash balances and lower net value of the Brazilian-real linked derivative instruments used to hedge
the US dollar debt.
The net debt
to Adjusted EBITDA leverage ratio ended the quarter at a healthy 1.1x.
Net cash
generated from operating activities for the six months ended June 30, totaled $84.3 million versus $121.9 million in the same period
last year. Cash used in net investing activities totaled $109.0 million, with capital expenditures of $123.1 million. Net cash used in
financing activities was $27.9 million, which included $21.1 million corresponding to the first two installments of the 2023 dividend.
Supplemental
Information
| Second Quarter 2023 Earnings Webcast |
|
A
webcast to discuss the information contained in this press release will be held today, August 17, 2023, at 10:00 a.m. ET. In order to
access the webcast, members of the investment community should follow this link: Arcos
Dorados Second Quarter 2023 Results Webcast.
A
replay of the webcast will be available later today in the investor section of the Company’s website: www.arcosdorados.com/ir.
|
Investor Relations Contact
Dan Schleiniger
VP of Investor Relations
Arcos Dorados
daniel.schleiniger@mcd.com.uy
|
Media Contact
David Grinberg
VP of Corporate Communications
Arcos Dorados
david.grinberg@mcd.com.uy
|
| Follow us on: |
 |
| Definitions |
|
Systemwide
comparable sales growth: refers to the change, measured in constant currency, in our Company-operated and franchised restaurant sales
in one period from a comparable period for restaurants that have been open for thirteen months or longer (year-over-year basis). While
sales by our franchisees are not recorded as revenues by us, we believe the information is important in understanding our financial performance
because these sales are the basis on which we calculate and record franchised revenues and are indicative of the financial health of
our franchisee base.
Constant
currency basis: refers to amounts calculated using the same exchange rate over the periods under comparison to remove the effects
of currency fluctuations from this trend analysis. To better discern underlying business trends, this release uses non-GAAP financial
measures that segregate year-over-year growth into two categories: (i) currency translation, (ii) constant currency growth. (i) Currency
translation reflects the impact on growth of the appreciation or depreciation of the local currencies in which we conduct our business
against the US dollar (the currency in which our financial statements are prepared). (ii) Constant currency growth reflects the underlying
growth of the business excluding the effect from currency translation.
Adjusted
EBITDA: In addition to financial measures prepared in accordance with the general accepted accounting principles (GAAP), within this
press release and the accompanying tables, we use a non-GAAP financial measure titled ‘Adjusted
EBITDA’. We use Adjusted EBITDA to facilitate operating performance
comparisons from period to period.
Adjusted
EBITDA is defined as our operating income plus depreciation and amortization plus/minus the following losses/gains included within other
operating income (expenses), net, and within general and administrative expenses in our statement of income: gains from sale, equity
method investments, or insurance recovery of property and equipment; write-offs of property and equipment; impairment of long-lived assets;
and reorganization and optimization plan expenses.
We
believe Adjusted EBITDA facilitates company-to-company operating performance comparisons by backing out potential differences caused
by variations such as capital structures (affecting net interest expense and other financing results), taxation (affecting income tax
expense) and the age and book depreciation of facilities and equipment (affecting relative depreciation expense), which may vary for
different companies for reasons unrelated to operating performance. Figure 10 of this earnings release include a reconciliation for Adjusted
EBITDA. For more information, please see Adjusted EBITDA reconciliation in Note 9 – Segment
and geographic information – of our financial statements (6-K Form)
filed today with the S.E.C.
| About Arcos Dorados |
|
Arcos Dorados
is the world’s largest independent McDonald’s franchisee, operating the largest quick service restaurant chain in Latin America
and the Caribbean. It has the exclusive right to own, operate and grant franchises of McDonald’s restaurants in 20 Latin American
and Caribbean countries and territories with more than 2,300 restaurants, operated by the Company or by its sub-franchisees, that together
employ over 95 thousand people (as of 06/30/2023). The Company is also committed to the development of the communities in which it operates,
to providing young people their first formal job opportunities and to utilize its Recipe
for the Future to achieve a positive environmental impact. Arcos Dorados is listed for trading on the New York Stock Exchange
(NYSE: ARCO). To learn more about the Company, please visit the Investors section of our website: www.arcosdorados.com/ir.
Cautionary
Statement on Forward-Looking Statements
This press
release contains forward-looking statements. The forward-looking statements contained herein include statements about the Company’s
business prospects, its ability to attract customers, its affordable platform, its expectation for revenue generation and its outlook
and guidance for growth and investments in 2023. These statements are subject to the general risks inherent in Arcos Dorados' business.
These expectations may or may not be realized. Some of these expectations may be based upon assumptions or judgments that prove to be
incorrect. In addition, Arcos Dorados' business and operations involve numerous risks and uncertainties, many of which are beyond the
control of Arcos Dorados, which could result in Arcos Dorados' expectations not being realized or otherwise materially affect the financial
condition, results of operations and cash flows of Arcos Dorados. Additional information relating to the uncertainties affecting Arcos
Dorados' business is contained in its filings with the Securities and Exchange Commission. The forward-looking statements are made only
as of the date hereof, and Arcos Dorados does not undertake any obligation to (and expressly disclaims any obligation to) update any
forward-looking statements to reflect events or circumstances after the date such statements were made, or to reflect the occurrence
of unanticipated events.
| Second Quarter 2023 Consolidated Results |
|
Figure
10. Second Quarter 2023 Consolidated Results
(In
thousands of U.S. dollars, except per share data)
| |
For Three-Months ended |
|
For Six-Months ended |
| |
June 30, |
|
June 30, |
| |
2023 |
2022 |
|
2023 |
2022 |
| REVENUES |
|
|
|
|
|
| Sales by Company-operated restaurants |
994,530 |
848,350 |
|
1,940,884 |
1,603,644 |
| Revenues from franchised restaurants |
45,991 |
39,545 |
|
90,429 |
74,932 |
| Total Revenues |
1,040,521 |
887,895 |
|
2,031,313 |
1,678,576 |
| OPERATING COSTS AND EXPENSES |
|
|
|
|
|
| Company-operated restaurant expenses: |
|
|
|
|
|
| Food and paper |
(351,745) |
(301,028) |
|
(685,611) |
(564,436) |
| Payroll and employee benefits |
(194,065) |
(169,441) |
|
(379,382) |
(321,669) |
| Occupancy and other operating expenses |
(278,997) |
(244,747) |
|
(542,720) |
(464,874) |
| Royalty fees |
(58,520) |
(44,061) |
|
(115,259) |
(82,677) |
| Franchised restaurants - occupancy expenses |
(20,420) |
(16,855) |
|
(38,629) |
(32,863) |
| General and administrative expenses |
(69,526) |
(54,996) |
|
(135,118) |
(110,534) |
| Other operating income, net |
7,644 |
3,879 |
|
6,583 |
7,470 |
| Total operating costs and expenses |
(965,629) |
(827,249) |
|
(1,890,136) |
(1,569,583) |
| Operating income |
74,892 |
60,646 |
|
141,177 |
108,993 |
| Net interest expense and other financing results |
(12,128) |
(24,161) |
|
(21,987) |
(34,820) |
| Loss from derivative instruments |
(9,191) |
(1,144) |
|
(14,120) |
(12,836) |
| Foreign currency exchange results |
13,662 |
(5,045) |
|
20,945 |
10,782 |
| Other non-operating income / (expenses), net |
116 |
(83) |
|
6 |
(108) |
| Income before income taxes |
67,351 |
30,213 |
|
126,021 |
72,011 |
| Income tax expense |
(38,824) |
(15,638) |
|
(59,850) |
(32,807) |
| Net income |
28,527 |
14,575 |
|
66,171 |
39,204 |
| Net income attributable to non-controlling interests |
(159) |
(94) |
|
(396) |
(220) |
| Net income attributable to Arcos Dorados Holdings Inc. |
28,368 |
14,481 |
|
65,775 |
38,984 |
| Earnings per share information ($ per share): |
|
|
|
|
|
| Basic net income per common share |
$
0.13 |
$
0.07 |
|
$
0.31 |
$
0.19 |
| Weighted-average number of common shares outstanding-Basic |
210,625,859 |
210,539,537 |
|
210,610,288 |
210,509,099 |
| Adjusted EBITDA Reconciliation |
|
|
|
|
|
| Operating income |
74,892 |
60,646 |
|
141,177 |
108,993 |
| Depreciation and amortization |
35,000 |
30,504 |
|
68,520 |
60,640 |
| Operating charges excluded from EBITDA computation |
164 |
212 |
|
863 |
227 |
| Adjusted EBITDA |
110,056 |
91,362 |
|
210,560 |
169,860 |
| Adjusted EBITDA Margin as % of total revenues |
10.6 % |
10.3 % |
|
10.4 % |
10.1 % |
| Second Quarter 2023 Results by Division |
|
Figure
11. Second Quarter Consolidated Results by Division
(In
thousands of U.S. dollars)
| |
For Three-Months ended |
as |
Constant |
|
For Six-Months ended |
as |
Constant |
| |
June 30, |
reported |
Currency |
|
June 30, |
reported |
Currency |
| |
2023 |
2022 |
Incr/(Decr)% |
Incr/(Decr)% |
|
2023 |
2022 |
Incr/(Decr)% |
Incr/(Decr)% |
| Revenues |
|
|
|
|
|
|
|
|
|
| Brazil |
405,199 |
358,069 |
13.2 % |
13.9% |
|
779,397 |
670,048 |
16.3% |
16.4% |
| NOLAD |
277,590 |
222,726 |
24.6 % |
15.3% |
|
536,856 |
426,578 |
25.9% |
18.2% |
| SLAD |
357,732 |
307,100 |
16.5 % |
77.4% |
|
715,060 |
581,950 |
22.9% |
82.6% |
| SLAD - Excl. Venezuela |
351,615 |
303,083 |
16.0 % |
69.0% |
|
703,641 |
574,553 |
22.5% |
74.6% |
| TOTAL |
1,040,521 |
887,895 |
17.2 % |
36.2% |
|
2,031,313 |
1,678,576 |
21.0% |
39.8% |
| TOTAL - Excl. Venezuela |
1,034,404 |
883,878 |
17.0 % |
33.2 % |
|
2,019,894 |
1,671,179 |
20.9% |
36.9% |
| |
|
|
|
|
|
|
|
|
|
| Operating Income (loss) |
|
|
|
|
|
|
|
|
|
| Brazil |
52,912 |
38,024 |
39.2 % |
39.5% |
|
97,002 |
70,045 |
38.5% |
38.4% |
| NOLAD |
18,410 |
14,854 |
23.9 % |
13.6% |
|
32,357 |
28,087 |
15.2% |
7.9% |
| SLAD |
29,452 |
26,845 |
9.7 % |
75.4% |
|
62,914 |
50,671 |
24.2% |
103.5% |
| SLAD - Excl. Venezuela |
31,345 |
28,185 |
11.2 % |
95.1% |
|
66,222 |
53,422 |
24.0% |
112.0% |
| Corporate and Other |
(25,882) |
(19,077) |
-35.7% |
-68.3% |
|
(51,096) |
(39,810) |
-28.3% |
-68.8% |
| TOTAL |
74,892 |
60,646 |
23.5 % |
40.0% |
|
141,177 |
108,993 |
29.5% |
49.7% |
| TOTAL - Excl. Venezuela |
76,785 |
61,986 |
23.9 % |
49.7% |
|
144,485 |
111,744 |
29.3% |
55.0% |
| |
|
|
|
|
|
|
|
|
|
| Adjusted EBITDA |
|
|
|
|
|
|
|
|
|
| Brazil |
69,129 |
52,706 |
31.2 % |
31.7% |
|
128,602 |
98,744 |
30.2% |
30.2% |
| NOLAD |
28,210 |
23,258 |
21.3 % |
11.7% |
|
51,910 |
44,660 |
16.2% |
9.1% |
| SLAD |
36,874 |
32,937 |
12.0 % |
64.4% |
|
77,590 |
63,253 |
22.7% |
85.0% |
| SLAD - Excl. Venezuela |
38,402 |
33,961 |
13.1 % |
80.4% |
|
80,227 |
65,421 |
22.6% |
92.9% |
| Corporate and Other |
(24,157) |
(17,539) |
-37.7% |
-70.1% |
|
(47,542) |
(36,797) |
-29.2% |
-70.1% |
| TOTAL |
110,056 |
91,362 |
20.5 % |
31.0% |
|
210,560 |
169,860 |
24.0% |
36.4% |
| TOTAL - Excl. Venezuela |
111,584 |
92,386 |
20.8 % |
37.2% |
|
213,197 |
172,028 |
23.9% |
40.0% |
Figure
12. Average Exchange Rate per Quarter*
| |
Brazil |
Mexico |
Argentina |
| 2Q23 |
4.95 |
17.68 |
231.76 |
| 2Q22 |
4.92 |
20.02 |
117.88 |
| * Local $ per 1 US$ |
|
|
|
| Summarized Consolidated Balance Sheets |
|
Figure
13. Summarized Consolidated Balance Sheets
(In
thousands of U.S. dollars)
| |
June 30, |
December 31, |
| |
2023 |
2022 |
| ASSETS |
|
| Current assets |
|
|
| Cash and cash equivalents |
201,492 |
266,937 |
| Short-term investment |
22,461 |
37,459 |
| Accounts and notes receivable, net |
127,856 |
124,273 |
| Other current assets (1) |
213,667 |
196,873 |
| Derivative instruments |
49,211 |
58,821 |
| Total current assets |
614,687 |
684,363 |
| Non-current assets |
|
|
| Property and equipment, net |
981,051 |
856,085 |
| Net intangible assets and goodwill |
65,706 |
54,569 |
| Deferred income taxes |
92,234 |
87,972 |
| Derivative instruments |
22,806 |
34,088 |
| Equity method investments |
17,566 |
14,708 |
| Leases right of use assets, net |
907,323 |
820,683 |
| Other non-current assets (2) |
101,351 |
84,162 |
| Total non-current assets |
2,188,037 |
1,952,267 |
| Total assets |
2,802,724 |
2,636,630 |
| LIABILITIES AND EQUITY |
|
|
| Current liabilities |
|
|
| Accounts payable |
307,995 |
353,468 |
| Taxes payable (3) |
172,070 |
146,682 |
| Accrued payroll and other liabilities |
147,928 |
115,327 |
| Royalties payable to McDonald´s Corporation |
15,981 |
21,280 |
| Provision for contingencies |
2,299 |
2,272 |
| Interest payable |
7,788 |
7,906 |
| Financial debt (4) |
32,085 |
29,566 |
| Operating lease liabilities |
89,626 |
82,911 |
| Total current liabilities |
775,772 |
759,412 |
| Non-current liabilities |
|
|
| Accrued payroll and other liabilities |
23,291 |
28,781 |
| Provision for contingencies |
49,685 |
42,567 |
| Financial debt (5) |
727,638 |
729,838 |
| Deferred income taxes |
5,824 |
3,931 |
| Operating lease liabilities |
816,165 |
747,674 |
| Total non-current liabilities |
1,622,603 |
1,552,791 |
| Total liabilities |
2,398,375 |
2,312,203 |
| Equity |
|
|
| Class A shares of common stock |
389,907 |
389,393 |
| Class B shares of common stock |
132,915 |
132,915 |
| Additional paid-in capital |
8,719 |
9,206 |
| Retained earnings |
450,689 |
424,936 |
| Accumulated other comprehensive loss |
(559,229) |
(613,460) |
| Common stock in treasury |
(19,367) |
(19,367) |
| Total Arcos Dorados Holdings Inc shareholders’ equity |
403,634 |
323,623 |
| Non-controlling interest in subsidiaries |
715 |
804 |
| Total equity |
404,349 |
324,427 |
| Total liabilities and equity |
2,802,724 |
2,636,630 |
| (1) | Includes "Other receivables", "Inventories"
and "Prepaid expenses and other current assets”. |
| (2) | Includes
"Miscellaneous", "Collateral deposits", and "McDonald’s Corporation indemnification for contingencies". |
| (3) | Includes
"Income taxes payable" and "Other taxes payable". |
| (4) | Includes
"Short-term debt”, “Current portion of long-term debt" and "Derivative instruments”. |
| (5) | Includes
"Long-term debt, excluding current portion" and "Derivative instruments". |
Thank
you! |
 |

Arcos Dorados (NYSE:ARCO)
Historical Stock Chart
From Mar 2024 to Apr 2024

Arcos Dorados (NYSE:ARCO)
Historical Stock Chart
From Apr 2023 to Apr 2024
