0001464790
false
0001464790
2023-08-09
2023-08-09
0001464790
RILY:CommonStockParValue0.0001PerShareMember
2023-08-09
2023-08-09
0001464790
RILY:DepositarySharesEachRepresenting11000thInterestIn6.875SeriesCumulativePerpetualPreferredShareParValue0.0001PerShareMember
2023-08-09
2023-08-09
0001464790
RILY:DepositarySharesEachRepresenting11000thInterestIn7.375SeriesBCumulativePerpetualPreferredShareParValue0.0001PerShareMember
2023-08-09
2023-08-09
0001464790
RILY:Sec6.75SeniorNotesDue2024Member
2023-08-09
2023-08-09
0001464790
RILY:Sec6.375SeniorNotesDue2025Member
2023-08-09
2023-08-09
0001464790
RILY:Sec5.00SeniorNotesDue2026Member
2023-08-09
2023-08-09
0001464790
RILY:Sec5.50SeniorNotesDue2026Member
2023-08-09
2023-08-09
0001464790
RILY:Sec6.50SeniorNotesDue2026Member
2023-08-09
2023-08-09
0001464790
RILY:Sec5.25SeniorNotesDue2028Member
2023-08-09
2023-08-09
0001464790
RILY:Sec6.00SeniorNotesDue2028Member
2023-08-09
2023-08-09
iso4217:USD
xbrli:shares
iso4217:USD
xbrli:shares
UNITED
STATES
SECURITIES AND EXCHANGE COMMISSION
WASHINGTON, D.C. 20549
FORM 8-K
CURRENT
REPORT
Pursuant
to Section 13 OR 15(d) of The Securities Exchange Act of 1934
Date
of Report (Date of earliest event reported): August 9, 2023
B.
RILEY FINANCIAL, INC.
(Exact
name of registrant as specified in its charter)
| Delaware |
|
001-37503 |
|
27-0223495 |
(State
or Other Jurisdiction
of
Incorporation) |
|
(Commission
File Number) |
|
(IRS Employer
Identification No.) |
11100
Santa Monica Boulevard, Suite 800
Los Angeles, California 90025
(310)
966-1444
(Address,
Including Zip Code, and Telephone Number, Including Area Code, of Registrant’s Principal Executive Offices)
Securities
registered pursuant to Section 12(b) of the Act:
| Title
of each class |
|
Trading
Symbol(s) |
|
Name
of each exchange on which registered |
| Common
Stock, par value $0.0001 per share |
|
RILY |
|
Nasdaq
Global Market |
| Depositary
Shares (each representing a 1/1000th interest in a 6.875% Series A Cumulative Perpetual Preferred Share, par value $0.0001 per share) |
|
RILYP |
|
Nasdaq
Global Market |
| Depositary
Shares (each representing a 1/1000th interest in a 7.375% Series B Cumulative Perpetual Preferred Share, par value $0.0001 per share) |
|
RILYL |
|
Nasdaq
Global Market |
| 6.75%
Senior Notes due 2024 |
|
RILYO
|
|
Nasdaq
Global Market |
| 6.375%
Senior Notes due 2025 |
|
RILYM
|
|
Nasdaq
Global Market |
| 5.00%
Senior Notes due 2026 |
|
RILYG |
|
Nasdaq
Global Market |
| 5.50%
Senior Notes due 2026 |
|
RILYK |
|
Nasdaq
Global Market |
| 6.50%
Senior Notes due 2026 |
|
RILYN |
|
Nasdaq
Global Market |
| 5.25%
Senior Notes due 2028 |
|
RILYZ |
|
Nasdaq
Global Market |
| 6.00%
Senior Notes due 2028 |
|
RILYT |
|
Nasdaq
Global Market |
Not
Applicable
(Former
name or former address, if changed since last report)
Check
the appropriate box below if the Form 8-K filing is intended to simultaneously satisfy the filing obligation of the registrant under
any of the following provisions:
| ☐ |
Written
communications pursuant to Rule 425 under the Securities Act (17 CFR 230.425) |
| |
|
| ☐ |
Soliciting
material pursuant to Rule 14a-12 under the Exchange Act (17 CFR 240.14a-12) |
| |
|
| ☐ |
Pre-commencement
communications pursuant to Rule 14d-2(b) under the Exchange Act (17 CFR 240.14d-2(b)) |
| |
|
| ☐ |
Pre-commencement
communications pursuant to Rule 13e-4(c) under the Exchange Act (17 CFR 240.13e-4(c)) |
Indicate
by check mark whether the registrant is an emerging growth company as defined in Rule 405 of the Securities Act of 1933 (§230.405
of this chapter) or Rule 12b-2 of the Securities Exchange Act of 1934 (§240.12b-2 of this chapter).
Emerging
growth company ☐
If
an emerging growth company, indicate by check mark if the registrant has elected not to use the extended transition period for complying
with any new or revised financial accounting standards provided pursuant to Section 13(a) of the Exchange Act ☐
Item
2.02. Results of Operations and Financial Condition.
On
August 9, 2023, B. Riley Financial, Inc. (the “Company”) issued a press release reporting its financial results for the fiscal
quarter ended June 30, 2023. A copy of the press release is attached hereto as Exhibit 99.1.
Item
7.01. Regulation FD Disclosure.
Additionally,
on August 9, 2023, in conjunction with the press release described above, the Company posted to its website at https://ir.brileyfin.com/events-and-presentations,
supplemental financial information for the fiscal quarter ended June 30, 2023 and certain prior periods. A copy of the information is
attached hereto as Exhibit 99.2.
The
information set forth in this Current Report, including Exhibits 99.1 and 99.2 attached hereto, is being furnished and shall not be deemed
“filed” for purposes of Section 18 of the Securities Exchange Act of 1934, as amended (the “Exchange Act”), or
otherwise subject to the liabilities of such section. The information in this Current Report, including Exhibits 99.1 and 99.2 attached
hereto, shall not be incorporated by reference into any filing under the Securities Act of 1933, as amended, or the Exchange Act, except
as expressly set forth by specific reference in such a filing to this Current Report.
Item
9.01. Financial Statements and Exhibits.
(d)
Exhibits
SIGNATURES
Pursuant
to the requirements of the Securities Exchange Act of 1934, the registrant has duly caused this report to be signed on its behalf by
the undersigned hereunto duly authorized.
| August
9, 2023 |
B.
RILEY FINANCIAL, INC. |
| |
|
| |
By:
|
/s/
Phillip J. Ahn |
| |
Name: |
Phillip
J. Ahn |
| |
Title: |
Chief
Financial Officer and
Chief Operating Officer |
2
Exhibit 99.1

B. Riley Financial Reports Second Quarter 2023
Results;
Quarterly Dividend of $1.00 per share Payable August 21, 2023
Reaffirms Q3 2023 Guidance for Operating Adjusted
EBITDA of at least $105 million
LOS ANGELES, August 9, 2023 – B.
Riley Financial, Inc. (NASDAQ: RILY) (“B. Riley” or the “Company”), a diversified financial services platform,
today released results for the three-month and six-month period ending June 30, 2023. The Company has also reaffirmed its guidance for
operating adjusted EBITDA(3) of at least $105 million for the third quarter of 2023.
Highlights for the Three Months Ended June
30, 2023
| ● | Total revenues increased 191% to $406.3 million
vs. $139.6 million in prior year quarter |
| ● | Net income attributable to the Company of $46.4
million |
| ● | Net income available to common shareholders of
$44.4 million, or $1.55 diluted earnings per share (EPS) |
| ● | Operating Revenues(2) of $363.9 million |
| ● | Operating Adjusted EBITDA(3) of $80.2
million |
| ● | Total Adjusted EBITDA(1) of $139.9
million |
Highlights for the Six Months Ended June 30,
2023
| ● | Total revenues increased 117% to $838.4 million
vs. $386.5 million in prior year six-month period |
| ● | Net income attributable to the Company of $63.5
million |
| ● | Net income available to common shareholders of
$59.5 million, or $2.05 diluted EPS |
| ● | Operating Revenues(2) of $744.4 million,
up from $523.5 million in prior six-month period |
| ● | Operating Adjusted EBITDA(3) of $160.3
million |
| ● | Total Adjusted EBITDA(1) of $234.7
million |
Reaffirmed Q3 2023 Guidance
| ● | Expects Operating Adjusted EBITDA(3)
of at least $105 million for the third quarter of 2023 |
Bryant Riley, Chairman and Co-Chief Executive
Officer of B. Riley Financial, commented: “On a consolidated basis, our platform delivered solid results for the second quarter
despite another challenging capital markets period with nominal contribution from investment banking. We expect a strong third quarter
based on a meaningful increase of client activity across capital markets, retail liquidation, consulting, and appraisal. Our overall business
is at a near-term inflection, and we are encouraged by our current momentum and the opportunities we see ahead.”
Tom Kelleher, Co-Chief Executive Officer of
B. Riley Financial, added: “Market dynamics have created a favorable environment for us to recruit talent to provide incremental
value to our clients and existing team. During the quarter, we expanded our consumer and TMT industry vertical coverage through the addition
of multiple senior investment bankers and strategic hires in our equity research division. In addition, we recently acquired two practices
to extend our core restructuring and forensic litigation advisory services in new markets, including Charlotte and Detroit. We will continue
to invest in our people and platform to meet growing client demand and to capitalize on our momentum.”
| www.brileyfin.com | NASDAQ: RILY | 1 |

Financial Summary
| | |
Three
Months Ended
June
30, | | |
Six
Months Ended
June
30, | |
| (Dollars in thousands, except
for share data) | |
2023 | | |
2022 | | |
2023 | | |
2022 | |
| | |
| | |
| | |
| | |
| |
| Net income (loss) available to common shareholders | |
$ | 44,366 | | |
$ | (142,161 | ) | |
$ | 59,509 | | |
$ | (154,225 | ) |
| | |
| | | |
| | | |
| | | |
| | |
| Basic income (loss) per common share | |
$ | 1.57 | | |
$ | (5.07 | ) | |
$ | 2.09 | | |
$ | (5.52 | ) |
| Diluted income (loss) per common share | |
$ | 1.55 | | |
$ | (5.07 | ) | |
$ | 2.05 | | |
$ | (5.52 | ) |
| | |
Three
Months Ended
June
30, | | |
Six
Months Ended
June
30, | |
| (Dollars in thousands) | |
2023 | | |
2022 | | |
2023 | | |
2022 | |
| | |
| | |
| | |
| | |
| |
| Operating Revenues (2) | |
$ | 363,913 | | |
$ | 257,384 | | |
$ | 744,435 | | |
$ | 523,502 | |
| Investment Gains (Loss)
(4) | |
| 42,365 | | |
| (117,763 | ) | |
| 93,933 | | |
| (137,041 | ) |
| Total
Revenues | |
$ | 406,278 | | |
$ | 139,621 | | |
$ | 838,368 | | |
$ | 386,461 | |
| | |
| | | |
| | | |
| | | |
| | |
| Operating Adjusted EBITDA (3) | |
$ | 80,216 | | |
$ | 74,220 | | |
$ | 160,342 | | |
$ | 158,407 | |
| Investment Adjusted EBITDA
(5) | |
| 59,677 | | |
| (209,997 | ) | |
| 74,382 | | |
| (253,522 | ) |
| Total Adjusted EBITDA (1) | |
$ | 139,893 | | |
$ | (135,777 | ) | |
$ | 234,724 | | |
$ | (95,115 | ) |
Certain of the information set forth herein, including
Adjusted EBITDA(1), Operating Revenues(2), and Operating Adjusted EBITDA(3), may be considered non-GAAP
financial measures. Information about B. Riley Financial’s use of non-GAAP financial measures is provided below under “Use
of Non-GAAP Financial Measures.”
For the three months ended June 30, 2023:
| ● | Net income attributable to B. Riley Financial
was $46.4 million for the second quarter of 2023. |
| ● | Net income applicable to common shareholders
was $44.4 million, or $1.55 diluted EPS. |
| ● | Total revenues increased 191% to $406.3 million,
up from $139.6 million in the prior year quarter. |
| ● | Total adjusted EBITDA(1) of $139.9
million compared to ($135.8 million) in the prior year quarter. |
| ● | Operating revenues(2) increased 41%
to $363.9 million, up from $257.4 million in the prior year quarter. |
| ● | Operating adjusted EBITDA(3) increased
8% to $80.2 million, up from $74.2 million in the prior year quarter. |
For the six months ended June 30, 2023:
| ● | Net income attributable to B. Riley Financial
was $63.5 million for the six-month period ended June 30, 2023. |
| ● | Net income applicable to common shareholders
was $59.5 million, or $2.05 diluted EPS. |
| ● | Total revenues increased 117% to $838.4 million,
up from $386.5 million during the first half of 2022. |
| ● | Total adjusted EBITDA(1) of $234.7
million for the first half of 2023 compared to ($95.1 million) in the first six months of 2022. |
| ● | Operating revenues(2) were $744.4
million for the first half of 2023, up from $523.5 million for the same prior year period. |
| ● | Operating adjusted EBITDA(3) of $160.3
million for the first half of 2023, up from $158.4 million in the same prior year period. |
| www.brileyfin.com | NASDAQ: RILY | 2 |
Increased revenues for the three- and six-month periods ended June
30, 2023 were primarily driven by investment gains(4); the recent acquisitions of Targus, Lingo and BullsEye Telecom during
2022; increased revenues from retail liquidation, financial consulting and appraisal; in addition to an increase in interest income from
loans and securities lending. Investment gains(4) were $42.4 million for the quarter, and $93.9 million for the first six
months of 2023, which reflected both realized and unrealized gains and losses on strategic investments held by the Company.
Segment Financial Summary
| | |
Segment Revenues | | |
Segment Income (Loss) | |
| | |
Three Months Ended
June 30, | | |
Three Months Ended
June 30, | |
| (Dollars in thousands) | |
2023 | | |
2022 | | |
2023 | | |
2022 | |
| Capital Markets | |
$ | 162,052 | | |
$ | 1,291 | | |
$ | 77,676 | | |
$ | (61,322 | ) |
| Wealth Management | |
| 47,716 | | |
| 62,389 | | |
| (1,358 | ) | |
| (7,313 | ) |
| Auction and Liquidation | |
| 10,561 | | |
| 3,924 | | |
| 4,188 | | |
| 451 | |
| Financial Consulting | |
| 31,212 | | |
| 24,310 | | |
| 8,318 | | |
| 4,284 | |
| Communications | |
| 84,956 | | |
| 41,922 | | |
| 9,982 | | |
| 7,708 | |
| Consumer | |
| 60,112 | | |
| 5,174 | | |
| 2,086 | | |
| 3,773 | |
| | |
Segment Revenues | | |
Segment Income (Loss) | |
| (Dollars in thousands) | |
Three Months Ended
June 30, | | |
Three Months Ended
June 30, | |
| Capital Markets | |
2023 | | |
2022 | | |
2023 | | |
2022 | |
| Operating | |
$ | 120,160 | | |
$ | 120,583 | | |
$ | 37,315 | (7) | |
$ | 44,040 | |
| Investment | |
| 41,892 | | |
| (119,292 | ) | |
| 40,361 | | |
| (105,362 | ) |
| Total | |
$ | 162,052 | | |
$ | 1,291 | | |
$ | 77,676 | | |
$ | (61,322 | ) |
For the three months ended June 30, 2023:
| ● | Capital Markets segment revenues
increased to $162.1 million, up from $1.3 million in the same prior year period. Segment income increased to $77.7 million compared to
a segment loss of ($61.3 million) in the prior year quarter. Excluding investment gains(4) of $41.9 million, Capital Markets
segment operating revenues(2) were $120.2 million. Segment operating income(7) was $37.3 million for the second
quarter of 2023. |
| ● | Wealth Management segment revenues
decreased to $47.7 million from $62.4 million in the prior year quarter, reflecting the strategic realignment of this business throughout
2022. B. Riley Wealth had over $24 billion of client assets under management as of June 30, 2023. |
| ● | Auction and Liquidation segment
revenues increased to $10.6 million, up from $3.9 million in the same prior year period primarily due to an increase in the size of retail
fee liquidation engagements. Segment income was $4.2 million compared to $0.5 million in the prior year quarter. Results for this segment
vary from quarter-to-quarter and year-to-year due to the episodic impact of large retail liquidation engagements. |
| ● | Financial Consulting segment revenues
increased 28% to $31.2 million, up from $24.3 million in the prior year quarter. Segment income increased 94% to $8.3 million, up from
$4.3 million in the same prior year period. Increased bankruptcy restructuring and litigation consulting and appraisal activity contributed
to another record performance for this segment during the second quarter of 2023. |
| ● | Communications segment revenues
increased to $85.0 million, up from $41.9 million in the prior year quarter, primarily driven by the acquisitions of Lingo and BullsEye
Telecom in May and August of 2022, respectively. On a combined basis, communications businesses – magicJack, United Online, Marconi
Wireless, Lingo and BullsEye Telecom— generated segment income of $10.0 million for the second quarter of 2023. |
| ● | Consumer segment revenues increased
to $60.1 million, up from $5.2 million in the prior year quarter. The significant increase in segment revenues was primarily related to
the acquisition of Targus, which was completed in the fourth quarter of 2022. |
| www.brileyfin.com | NASDAQ: RILY | 3 |
For the six months ended June 30, 2023:
| | |
Segment Revenues | | |
Segment Income (Loss) | |
| | |
Six Months Ended
June 30, | | |
Six Months Ended
June 30, | |
| (Dollars in thousands) | |
2023 | | |
2022 | | |
2023 | | |
2022 | |
| Capital Markets | |
$ | 347,463 | | |
$ | 104,140 | | |
$ | 163,696 | | |
$ | (6,249 | ) |
| Wealth Management | |
| 97,530 | | |
| 139,868 | | |
| 15 | | |
| (17,409 | ) |
| Auction and Liquidation | |
| 16,221 | | |
| 7,279 | | |
| 4,388 | | |
| (349 | ) |
| Financial Consulting | |
| 56,222 | | |
| 50,246 | | |
| 12,101 | | |
| 9,196 | |
| Communications | |
| 171,875 | | |
| 73,887 | | |
| 20,765 | | |
| 16,677 | |
| Consumer | |
| 130,115 | | |
| 9,731 | | |
| 3,732 | | |
| 6,991 | |
| | |
Segment Revenues | | |
Segment Income (Loss) | |
| (Dollars in thousands) | |
Six Months Ended
June 30, | | |
Six Months Ended
June 30, | |
| Capital Markets | |
2023 | | |
2022 | | |
2023 | | |
2022 | |
| Operating | |
$ | 255,275 | | |
$ | 243,231 | | |
$ | 81,460 | (7) | |
$ | 94,047 | (7) |
| Investment | |
| 92,188 | | |
| (139,091 | ) | |
| 82,236 | | |
| (100,296 | ) |
| Total | |
$ | 347,463 | | |
$ | 104,140 | | |
$ | 163,696 | | |
$ | (6,249 | ) |
Common Dividend
On July 25, 2023, the Company announced its regular
dividend of $1.00 per share will be paid on or about August 21, 2023 to stockholders of record as of August 11, 2023.
Balance Sheet Summary
At June 30, 2023, cash and investments(6)
totaled $1.92 billion including cash and cash equivalents of $108 million; $1.07 billion in net securities and other investments owned;
and $684 million of loans receivable, at fair value. Total debt, net of cash and investments(6), was $406 million at quarter-end.
Earnings Call Details
B. Riley Financial will host an investor call
to discuss its second quarter financial results today, Wednesday August 9, 2023 at 4:30 PM ET (1:30 PM PT). Investors may access the live
audio webcast and archived recording at https://ir.brileyfin.com/events-and-presentations. A web recording will be made available for
replay until August 23, 2023.
Supplemental Financial Data
Additional details related to operating results
and investment performance can be found in the Second Quarter 2023 Financial Supplement on B. Riley Financial’s investor relations
website.
| www.brileyfin.com | NASDAQ: RILY | 4 |
About B. Riley Financial
B. Riley Financial is a diversified financial
services platform that delivers tailored solutions to meet the strategic, operational, and capital needs of its clients and partners.
B. Riley leverages cross-platform expertise to provide clients with full service, collaborative solutions at every stage of the business
life cycle. Through its affiliated subsidiaries, B. Riley provides end-to-end financial services across investment banking, institutional
brokerage, private wealth and investment management, financial consulting, corporate restructuring, operations management, risk and compliance,
due diligence, forensic accounting, litigation support, appraisal and valuation, auction, and liquidation services. B. Riley opportunistically
invests to benefit its shareholders, and certain affiliates originate and underwrite senior secured loans for asset-rich companies. B.
Riley refers to B. Riley Financial, Inc. and/or one or more of its subsidiaries or affiliates. For more information, please visit www.brileyfin.com.
Footnotes (See “Note Regarding Use
of Non-GAAP Financial Measures” for further discussion of these non-GAAP terms. For a reconciliation of Adjusted EBITDA, Operating
Revenue, Operating Adjusted EBITDA, and Investment Adjusted EBITDA to the comparable GAAP financial measures, please see the Appendix
hereto.)
| (1) | Adjusted EBITDA includes earnings before interest, taxes, depreciation,
amortization, restructuring charge, share-based payments, gain on extinguishment of loans, impairment of tradenames, and transaction
related and other costs. |
| (2) | Operating Revenues is defined as the sum of revenues from (i)
Service and Fees, (ii) Interest Income - Loans and Securities Lending and (iii) Sales of Goods. |
| (3) | Operating Adjusted EBITDA is defined as Adjusted EBITDA excluding
(i) Trading Income (Loss) and Fair Value Adjustments on Loans, (ii) Realized and Unrealized Gains (Losses) on Investments, and (iii)
other investment related expenses. |
| (4) | Investment Gains (Loss) is defined as Trading Income (Loss)
and Fair Value Adjustments on Loans. |
| (5) | Investment Adjusted EBITDA is defined as the sum of (i) Trading
Income (Loss) and Fair Value Adjustments on Loans and (ii) Realized and Unrealized Gains (Losses) on Investments, less other investment
related expenses. |
| (6) | Total cash and investments is defined as the sum of cash and
cash equivalents, restricted cash, due from clearing brokers net of due to clearing brokers, securities and other investments owned,
at fair value net of (i) securities sold not yet purchased and (ii) noncontrolling interest related to investments, advances against
customer contracts, loans receivable, at fair value net of loan participations sold, and other investments reported in prepaid and other
assets. |
| (7) | Segment Operating Income (Loss) is defined as segment income
(loss) excluding trading income (loss) and fair value adjustments on loans and other investment related operating expenses. |
Note Regarding Use of Non-GAAP Financial Measures
Certain of the information set forth herein, including
operating revenues, adjusted EBITDA, operating adjusted EBITDA, and investment adjusted EBITDA, may be considered non-GAAP financial measures.
B. Riley Financial believes this information is useful to investors because it provides a basis for measuring the Company's available
capital resources, the operating performance of its business and its revenues and cash flow, (i) excluding in the case of operating revenues,
trading income (losses) and fair value adjustments on loans, (ii) excluding in the case of adjusted EBITDA, net interest expense, provisions
for or benefit from income taxes, depreciation, amortization, fair value adjustment, restructuring charge, gain on extinguishment of loans,
impairment of trade names, stock-based compensation and transaction and other expenses, (iii) excluding in the case of operating adjusted
EBITDA, the aforementioned adjustments for adjusted EBITDA as well as trading income (losses) and fair value adjustments on loans, and
other investment related expenses, (iv) including in the case of investment adjusted EBITDA, trading income (losses) and fair value adjustments
on loans, net of other investment related expenses, and (v) including in the case of total cash and investments, cash and cash equivalents,
restricted cash, due from clearing brokers net of due to clearing brokers, securities and other investments owned, at fair value net of
(a) securities sold not yet purchased and (b) noncontrolling interest related to investments, advances against customer contracts, loans
receivable, at fair value net of loan participations sold, and other investments reported in prepaid and other assets, that would normally
be included in the most directly comparable measures calculated and presented in accordance with Generally Accepted Accounting Principles
(“GAAP”). In addition, the Company's management uses these non-GAAP financial measures along with the most directly comparable
GAAP financial measures in evaluating the Company's operating performance, management compensation, capital resources, and cash flow.
Non-GAAP financial measures should not be considered in isolation from, or as a substitute for, financial information presented in compliance
with GAAP, and non-financial measures as reported by the Company may not be comparable to similarly titled amounts reported by other companies.
Forward-Looking Statements
Statements in this press release that are not
descriptions of historical facts are forward-looking statements that are based on management's current expectations and assumptions and
are subject to risks and uncertainties. If such risks or uncertainties materialize or such assumptions prove incorrect, our business,
operating results, financial condition, and stock price could be materially negatively affected. You should not place undue reliance on
such forward-looking statements, which are based on the information currently available to us and speak only as of the date of this press
release. Such forward-looking statements include, but are not limited to, statements regarding our excitement and the expected growth
of our business segments. Factors that could cause such actual results to differ materially from those contemplated or implied by such
forward-looking statements include, without limitation, the risks described from time to time in B. Riley Financial, Inc.'s periodic filings
with the SEC, including, without limitation, the risks described in B. Riley Financial, Inc.’s 2022 Annual Report on Form 10-K under
the captions “Risk Factors” and “Management's Discussion and Analysis of Financial Condition and Results of Operations”
(as applicable). Additional information will be set forth in our Quarterly Report on Form 10-Q for the quarter ended June 30, 2023. These
factors should be considered carefully, and readers are cautioned not to place undue reliance on such forward-looking statements. All
information is current as of the date this press release is issued, and B. Riley Financial undertakes no duty to update this information.
| www.brileyfin.com | NASDAQ: RILY | 6 |
B. RILEY FINANCIAL, INC.
Condensed Consolidated Balance Sheets
(Dollars in thousands, except par value)
| | |
June 30, | | |
December 31, | |
| | |
2023 | | |
2022 | |
| | |
(Unaudited) | | |
| |
| Assets | |
| | |
| |
| Assets: | |
| | |
| |
| Cash and cash equivalents | |
$ | 107,581 | | |
$ | 268,618 | |
| Restricted cash | |
| 2,321 | | |
| 2,308 | |
| Due from clearing brokers | |
| 22,289 | | |
| 48,737 | |
| Securities and other investments owned, at fair value | |
| 1,072,444 | | |
| 1,129,268 | |
| Securities borrowed | |
| 2,938,521 | | |
| 2,343,327 | |
| Accounts receivable, net | |
| 118,927 | | |
| 149,110 | |
| Due from related parties | |
| 669 | | |
| 1,081 | |
| Loans receivable, at fair value (includes $130,024 and $98,729 from related parties as of June 30, 2023 and December 31, 2022, respectively) | |
| 683,827 | | |
| 701,652 | |
| Prepaid expenses and other assets | |
| 309,083 | | |
| 460,696 | |
| Operating lease right-of-use assets | |
| 85,207 | | |
| 88,593 | |
| Property and equipment, net | |
| 28,443 | | |
| 27,141 | |
| Goodwill | |
| 526,827 | | |
| 512,595 | |
| Other intangible assets, net | |
| 354,328 | | |
| 374,098 | |
| Deferred income taxes | |
| 2,845 | | |
| 3,978 | |
| Total assets | |
$ | 6,253,312 | | |
$ | 6,111,202 | |
| Liabilities and Equity | |
| | | |
| | |
| Liabilities: | |
| | | |
| | |
| Accounts payable | |
$ | 60,264 | | |
$ | 81,384 | |
| Accrued expenses and other liabilities | |
| 251,260 | | |
| 322,974 | |
| Deferred revenue | |
| 77,089 | | |
| 85,441 | |
| Deferred income taxes | |
| 46,624 | | |
| 29,548 | |
| Due to related parties and partners | |
| 289 | | |
| 2,210 | |
| Due to clearing brokers | |
| — | | |
| 19,307 | |
| Securities sold not yet purchased | |
| 2,686 | | |
| 5,897 | |
| Securities loaned | |
| 2,929,265 | | |
| 2,334,031 | |
| Operating lease liabilities | |
| 96,473 | | |
| 99,124 | |
| Notes payable | |
| 21,298 | | |
| 25,263 | |
| Revolving credit facility | |
| 110,875 | | |
| 127,678 | |
| Term loans, net | |
| 529,242 | | |
| 572,079 | |
| Senior notes payable, net | |
| 1,666,009 | | |
| 1,721,751 | |
| Total liabilities | |
| 5,791,374 | | |
| 5,426,687 | |
| | |
| | | |
| | |
| Redeemable noncontrolling interests in equity of subsidiaries | |
| — | | |
| 178,622 | |
| | |
| | | |
| | |
| Total B. Riley Financial, Inc. stockholders' equity | |
| 402,520 | | |
| 446,514 | |
| Noncontrolling interests | |
| 59,418 | | |
| 59,379 | |
| Total equity | |
| 461,938 | | |
| 505,893 | |
| Total liabilities and equity | |
$ | 6,253,312 | | |
$ | 6,111,202 | |
| www.brileyfin.com | NASDAQ: RILY | 7 |
B. RILEY FINANCIAL, INC.
Condensed Consolidated Statements of Operations
(Unaudited)
(Dollars in thousands, except share data)
| | |
Three Months Ended
June 30, | | |
Six Months Ended
June 30, | |
| | |
2023 | | |
2022 | | |
2023 | | |
2022 | |
| Revenues: | |
| | |
As Restated | | |
| | |
As Restated | |
| Services and fees | |
$ | 230,327 | | |
$ | 191,662 | | |
$ | 465,886 | | |
$ | 394,476 | |
| Trading income (loss) and fair value adjustments on loans | |
| 42,365 | | |
| (117,763 | ) | |
| 93,933 | | |
| (137,041 | ) |
| Interest income - Loans and securities lending | |
| 75,199 | | |
| 63,835 | | |
| 152,385 | | |
| 125,261 | |
| Sale of goods | |
| 58,387 | | |
| 1,887 | | |
| 126,164 | | |
| 3,765 | |
| Total revenues | |
| 406,278 | | |
| 139,621 | | |
| 838,368 | | |
| 386,461 | |
| Operating expenses: | |
| | | |
| | | |
| | | |
| | |
| Direct cost of services | |
| 55,941 | | |
| 17,785 | | |
| 110,338 | | |
| 29,436 | |
| Cost of goods sold | |
| 40,317 | | |
| 1,994 | | |
| 87,943 | | |
| 4,245 | |
| Selling, general and administrative expenses | |
| 188,885 | | |
| 167,136 | | |
| 401,512 | | |
| 342,335 | |
| Restructuring charge | |
| 628 | | |
| — | | |
| 721 | | |
| — | |
| Impairment of tradenames | |
| 1,733 | | |
| — | | |
| 1,733 | | |
| — | |
| Interest expense - Securities lending and loan participations sold | |
| 35,780 | | |
| 14,544 | | |
| 68,204 | | |
| 26,310 | |
| Total operating expenses | |
| 323,284 | | |
| 201,459 | | |
| 670,451 | | |
| 402,326 | |
| Operating income (loss) | |
| 82,994 | | |
| (61,838 | ) | |
| 167,917 | | |
| (15,865 | ) |
| Other income (expense): | |
| | | |
| | | |
| | | |
| | |
| Interest income | |
| 701 | | |
| 500 | | |
| 3,275 | | |
| 567 | |
| Dividend income | |
| 9,555 | | |
| 9,243 | | |
| 22,759 | | |
| 17,104 | |
| Realized and unrealized gains (losses) on investments | |
| 18,843 | | |
| (106,164 | ) | |
| (9,599 | ) | |
| (155,276 | ) |
| Change in fair value of financial instruments and other | |
| 381 | | |
| 4,321 | | |
| 172 | | |
| 10,302 | |
| Income (loss) from equity investments | |
| 143 | | |
| (3,399 | ) | |
| 133 | | |
| 3,376 | |
| Interest expense | |
| (47,332 | ) | |
| (31,764 | ) | |
| (94,893 | ) | |
| (62,200 | ) |
| Income (loss) before income taxes | |
| 65,285 | | |
| (189,101 | ) | |
| 89,764 | | |
| (201,992 | ) |
| (Provision for) benefit from income taxes | |
| (21,504 | ) | |
| 52,513 | | |
| (29,423 | ) | |
| 56,208 | |
| Net income (loss) | |
| 43,781 | | |
| (136,588 | ) | |
| 60,341 | | |
| (145,784 | ) |
| Net (loss) income attributable to noncontrolling interests | |
| | | |
| | | |
| | | |
| | |
| and redeemable noncontrolling interests | |
| (2,600 | ) | |
| 3,571 | | |
| (3,195 | ) | |
| 4,437 | |
| Net income (loss) attributable to B. Riley Financial, Inc. | |
| 46,381 | | |
| (140,159 | ) | |
| 63,536 | | |
| (150,221 | ) |
| Preferred stock dividends | |
| 2,015 | | |
| 2,002 | | |
| 4,027 | | |
| 4,004 | |
| Net income (loss) available to common shareholders | |
$ | 44,366 | | |
$ | (142,161 | ) | |
$ | 59,509 | | |
$ | (154,225 | ) |
| | |
| | | |
| | | |
| | | |
| | |
| Basic income (loss) per common share | |
$ | 1.57 | | |
$ | (5.07 | ) | |
$ | 2.09 | | |
$ | (5.52 | ) |
| Diluted income (loss) per common share | |
$ | 1.55 | | |
$ | (5.07 | ) | |
$ | 2.05 | | |
$ | (5.52 | ) |
| | |
| | | |
| | | |
| | | |
| | |
| Weighted average basic common shares outstanding | |
| 28,239,116 | | |
| 28,051,570 | | |
| 28,411,270 | | |
| 27,953,845 | |
| Weighted average diluted common shares outstanding | |
| 28,654,246 | | |
| 28,051,570 | | |
| 29,082,885 | | |
| 27,953,845 | |
Note: Certain results for the three and
six-month periods ended June 30, 2022 reflect amounts as restated in our 2022 Annual Report on Form 10-K for the year ended December 31,
2022.
| www.brileyfin.com | NASDAQ: RILY | 8 |
B. RILEY FINANCIAL, INC.
Adjusted EBITDA and Operating Adjusted EBITDA
Reconciliation
(Unaudited)
(Dollars in thousands)
| | |
Three Months Ended
June 30, | | |
Six Months Ended
June 30, | |
| | |
2023 | | |
2022 | | |
2023 | | |
2022 | |
| Net income (loss) attributable to B. Riley Financial, Inc. | |
$ | 46,381 | | |
$ | (140,159 | ) | |
$ | 63,536 | | |
$ | (150,221 | ) |
| Adjustments: | |
| | | |
| | | |
| | | |
| | |
| Provision for (benefit from) income taxes | |
| 21,504 | | |
| (52,513 | ) | |
| 29,423 | | |
| (56,208 | ) |
| Interest expense | |
| 47,332 | | |
| 31,764 | | |
| 94,893 | | |
| 62,200 | |
| Interest income | |
| (701 | ) | |
| (500 | ) | |
| (3,275 | ) | |
| (567 | ) |
| Share based payments | |
| 10,492 | | |
| 14,202 | | |
| 24,238 | | |
| 31,215 | |
| Depreciation and amortization | |
| 12,534 | | |
| 7,961 | | |
| 25,611 | | |
| 15,809 | |
| Restructuring charge | |
| 628 | | |
| — | | |
| 721 | | |
| — | |
| Gain on extinguishment of loans | |
| — | | |
| — | | |
| — | | |
| (1,102 | ) |
| Impairment of tradenames | |
| 1,733 | | |
| — | | |
| 1,733 | | |
| — | |
| Transactions related costs and other | |
| (10 | ) | |
| 3,468 | | |
| (2,156 | ) | |
| 3,759 | |
| Total EBITDA adjustments | |
| 93,512 | | |
| 4,382 | | |
| 171,188 | | |
| 55,106 | |
| Adjusted EBITDA | |
$ | 139,893 | | |
$ | (135,777 | ) | |
$ | 234,724 | | |
$ | (95,115 | ) |
| | |
| | | |
| | | |
| | | |
| | |
| Operating EBITDA Adjustments: | |
| | | |
| | | |
| | | |
| | |
| Trading (income) loss and fair value adjustments on loans | |
| (42,365 | ) | |
| 117,763 | | |
| (93,933 | ) | |
| 137,041 | |
| Realized and unrealized (gains) losses on investments | |
| (18,843 | ) | |
| 106,164 | | |
| 9,599 | | |
| 155,276 | |
| Other investment related expenses | |
| 1,531 | | |
| (13,930 | ) | |
| 9,952 | | |
| (38,795 | ) |
| Total Operating EBITDA Adjustments | |
| (59,677 | ) | |
| 209,997 | | |
| (74,382 | ) | |
| 253,522 | |
| Operating Adjusted EBITDA | |
$ | 80,216 | | |
$ | 74,220 | | |
$ | 160,342 | | |
$ | 158,407 | |
# # #
| Contacts |
|
| |
|
| Investors |
Media |
| Mike Frank |
Jo Anne McCusker |
| ir@brileyfin.com |
jmccusker@brileyfin.com |
| (212) 409-2424 |
(646) 885-5425 |
| |
|
| Source: B. Riley Financial, Inc. |
|
| www.brileyfin.com | NASDAQ: RILY |
9 |
Exhibit 99.2

1 August 9, 2023 NASDAQ: RILY Second Quarter 2023 Supplemental Financial Data
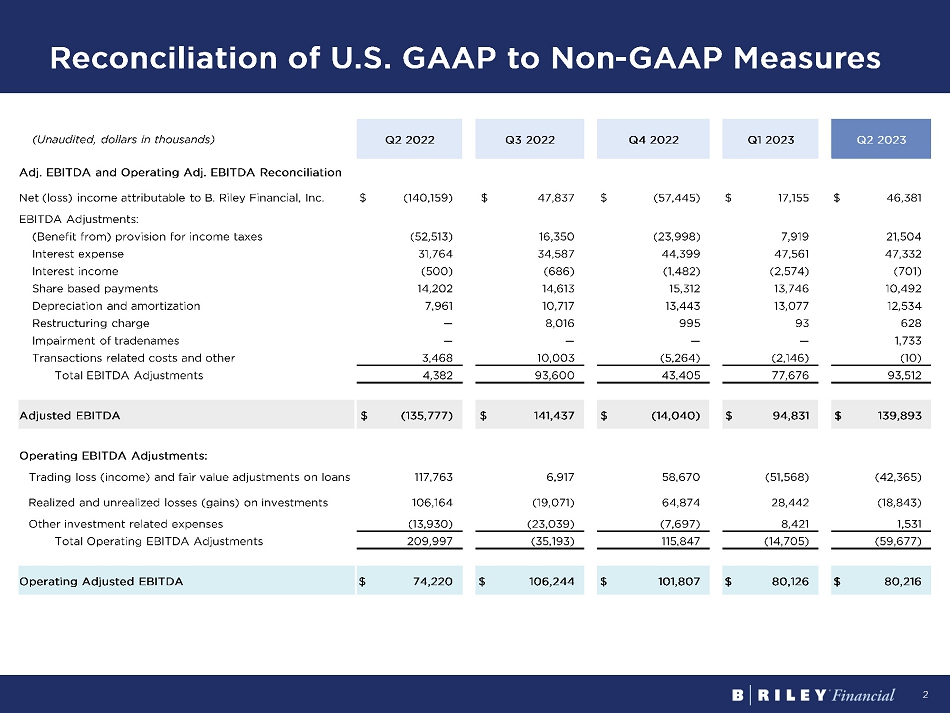
2 Reconciliation of U.S. GAAP to Non - GAAP Measures (Unaudited, dollars in thousands) Q2 2022 Q3 2022 Q4 2022 Q1 2023 Q2 2023 Adj. EBITDA and Operating Adj. EBITDA Reconciliation Net (loss) income attributable to B. Riley Financial, Inc. $ (140,159) $ 47,837 $ (57,445) $ 17,155 $ 46,381 EBITDA Adjustments: (Benefit from) provision for income taxes (52,513) 16,350 (23,998) 7,919 21,504 Interest expense 31,764 34,587 44,399 47,561 47,332 Interest income (500) (686) (1,482) (2,574) (701) Share based payments 14,202 14,613 15,312 13,746 10,492 Depreciation and amortization 7,961 10,717 13,443 13,077 12,534 Restructuring charge — 8,016 995 93 628 Impairment of tradenames — — — — 1,733 Transactions related costs and other 3,468 10,003 (5,264) (2,146) (10) Total EBITDA Adjustments 4,382 93,600 43,405 77,676 93,512 Adjusted EBITDA $ (135,777) $ 141,437 $ (14,040) $ 94,831 $ 139,893 Operating EBITDA Adjustments: Trading loss (income) and fair value adjustments on loans 117,763 6,917 58,670 (51,568) (42,365) Realized and unrealized losses (gains) on investments 106,164 (19,071) 64,874 28,442 (18,843) Other investment related expenses (13,930) (23,039) (7,697) 8,421 1,531 Total Operating EBITDA Adjustments 209,997 (35,193) 115,847 (14,705) (59,677) Operating Adjusted EBITDA $ 74,220 $ 106,244 $ 101,807 $ 80,126 $ 80,216
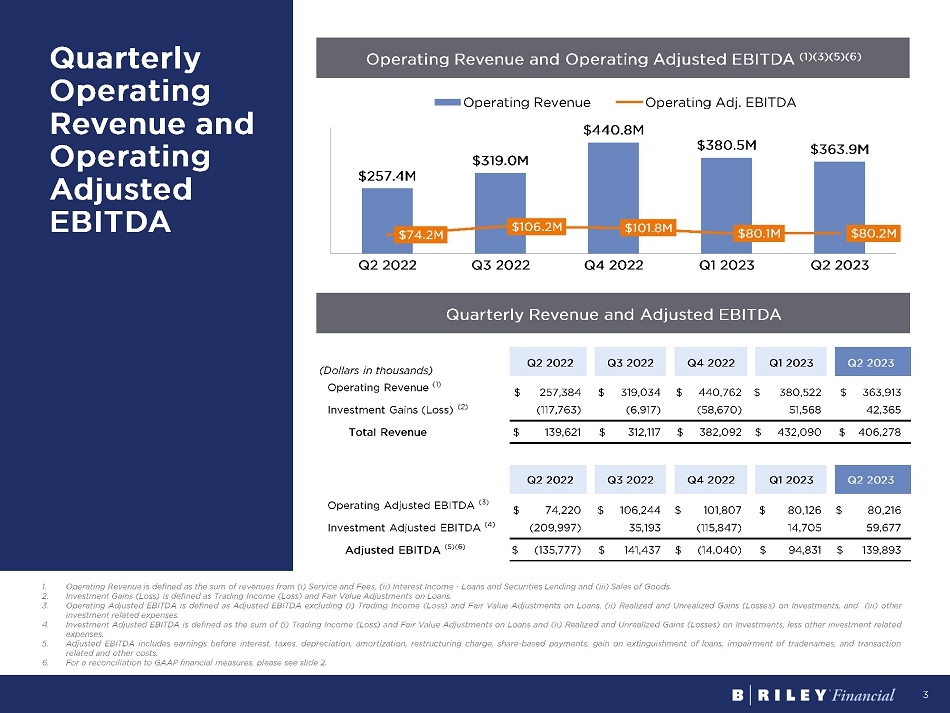
3 Quarterly Operating Revenue and Operating Adjusted EBITDA Operating Revenue and Operating Adjusted EBITDA (1)(3)(5)(6) (Dollars in thousands) Q2 2022 Q3 2022 Q4 2022 Q1 2023 Q2 2023 Operating Revenue (1) $ 257,384 $ 319,034 $ 440,762 $ 380,522 $ 363,913 Investment Gains (Loss) (2) (117,763) (6,917) (58,670) 51,568 42,365 Total Revenue $ 139,621 $ 312,117 $ 382,092 $ 432,090 $ 406,278 Q2 2022 Q3 2022 Q4 2022 Q1 2023 Q2 2023 Operating Adjusted EBITDA (3) $ 74,220 $ 106,244 $ 101,807 $ 80,126 $ 80,216 Investment Adjusted EBITDA (4) (209,997) 35,193 (115,847) 14,705 59,677 Adjusted EBITDA (5)(6) $ (135,777) $ 141,437 $ (14,040) $ 94,831 $ 139,893 Quarterly Revenue and Adjusted EBITDA 1. Operating Revenue is defined as the sum of revenues from ( i ) Service and Fees, (ii) Interest Income - Loans and Securities Lending and (iii) Sales of Goods . 2. Investment Gains (Loss) is defined as Trading Income (Loss) and Fair Value Adjustments on Loans . 3. Operating Adjusted EBITDA is defined as Adjusted EBITDA excluding ( i ) Trading Income (Loss) and Fair Value Adjustments on Loans, (ii) Realized and Unrealized Gains (Losses) on Investments, and (iii) other investment related expenses . 4. Investment Adjusted EBITDA is defined as the sum of ( i ) Trading Income (Loss) and Fair Value Adjustments on Loans and (ii) Realized and Unrealized Gains (Losses) on Investments, less other investment related expenses . 5. Adjusted EBITDA includes earnings before interest, taxes, depreciation, amortization, restructuring charge, share - based payments, gain on extinguishment of loans, impairment of tradenames, and transaction related and other costs . 6. For a reconciliation to GAAP financial measures, please see slide 2 . $257.4M $319.0M $440.8M $380.5M $363.9M $74.2M $106.2M $101.8M $80.1M $80.2M Q2 2022 Q3 2022 Q4 2022 Q1 2023 Q2 2023 Operating Revenue Operating Adj. EBITDA
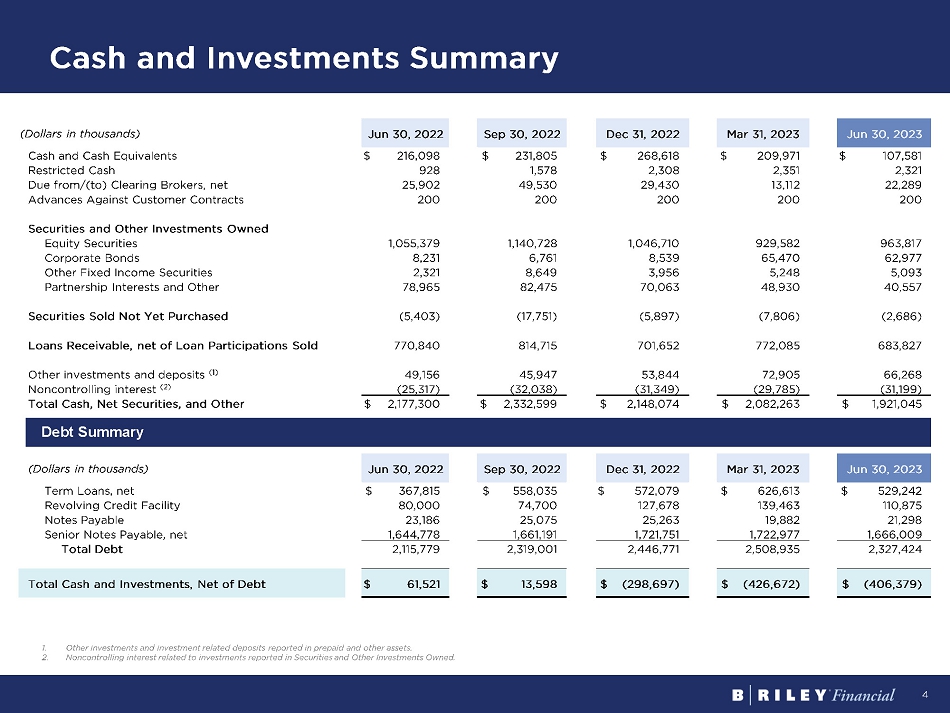
4 Cash and Investments Summary 1. Other investments and investment related deposits reported in prepaid and other assets. 2. Noncontrolling interest related to investments reported in Securities and Other Investments Owned. (Dollars in thousands) Jun 30, 2022 Sep 30, 2022 Dec 31, 2022 Mar 31, 2023 Jun 30, 2023 Cash and Cash Equivalents $ 216,098 $ 231,805 $ 268,618 $ 209,971 $ 107,581 Restricted Cash 928 1,578 2,308 2,351 2,321 Due from/(to) Clearing Brokers, net 25,902 49,530 29,430 13,112 22,289 Advances Against Customer Contracts 200 200 200 200 200 Securities and Other Investments Owned Equity Securities 1,055,379 1,140,728 1,046,710 929,582 963,817 Corporate Bonds 8,231 6,761 8,539 65,470 62,977 Other Fixed Income Securities 2,321 8,649 3,956 5,248 5,093 Partnership Interests and Other 78,965 82,475 70,063 48,930 40,557 Securities Sold Not Yet Purchased (5,403) (17,751) (5,897) (7,806) (2,686) Loans Receivable, net of Loan Participations Sold 770,840 814,715 701,652 772,085 683,827 Other investments and deposits (1) 49,156 45,947 53 , 844 72,905 66,268 Noncontrolling interest (2) (25,317) (32,038) (31,349) (29,785) (31,199) Total Cash, Net Securities, and Other $ 2,177,300 $ 2,332,599 $ 2,1 48 , 074 $ 2,082,263 $ 1,921,045 (Dollars in thousands) Jun 30, 2022 Sep 30, 2022 Dec 31, 2022 Mar 31, 2023 Jun 30, 2023 Term Loans, net $ 367,815 $ 558,035 $ 572,079 $ 626,613 $ 529,242 Revolving Credit Facility 80,000 74,700 127,678 139,463 110,875 Notes Payable 23,186 25,075 25,263 19,882 21,298 Senior Notes Payable, net 1,644,778 1,661,191 1,721,751 1,722,977 1,666,009 Total Debt 2,115,779 2,319,001 2,446,771 2,508,935 2,327,424 Total Cash and Investments, Net of Debt $ 61,521 $ 13,598 $ ( 298 , 697 ) $ (426,672) $ (406,379) Debt Summary
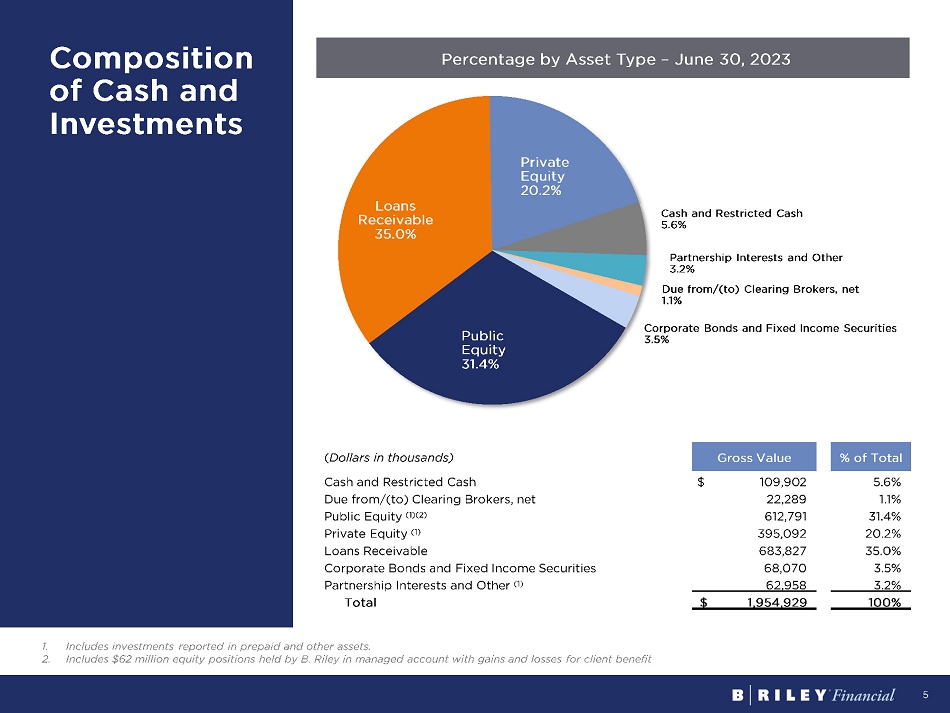
5 Public Equity 31.4% Loans Receivable 35.0% Private Equity 20.2% Cash and Restricted Cash … Partnership Interests and Other 3.2% Due from/(to) Clearing Brokers, net 1.1% Corporate Bonds and Fixed Income Securities … Composition of Cash and Investments Percentage by Asset Type – June 30, 2023 ( Dollars in thousands) Gross Value % of Total Cash and Restricted Cash $ 109,90 2 5.6% Due from/(to) Clearing Brokers, net 22,289 1.1% Public Equity (1)(2) 612,791 31.4% Private Equity (1) 39 5 ,092 20.2% Loans Receivable 683,827 35.0% Corporate Bonds and Fixed Income Securities 68,070 3 .5% Partnership Interests and Other (1) 62,958 3.2% Total $ 1,954,929 100% 1. Includes investments reported in prepaid and other assets. 2. Includes $62 million equity positions held by B. Riley in managed account with gains and losses for client benefit
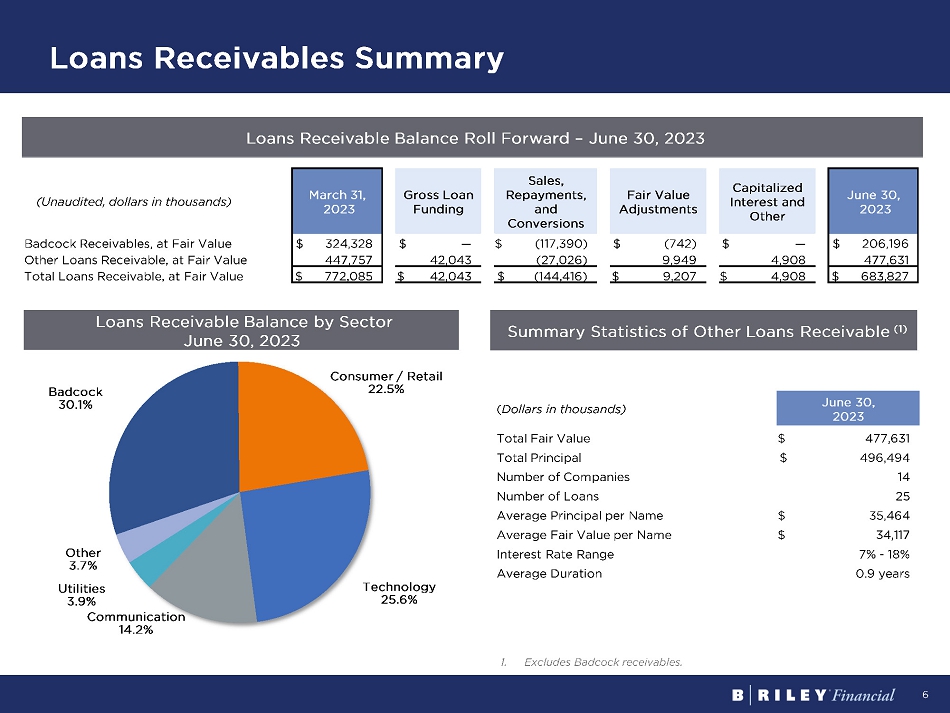
6 Loans Receivables Summary Loans Receivable Balance Roll Forward – June 30, 2023 1. Excludes Badcock receivables. Loans Receivable Balance by Sector June 30, 2023 (Unaudited, dollars in thousands) March 31, 2023 Gross Loan Funding Sales , Repayment s, and Conversion s Fair Value Adjustments Capitalized Interest and Other June 30, 2023 Badcock Receivable s , at Fair Value $ 3 24 , 328 $ — $ (1 17 , 390 ) $ ( 742 ) $ — $ 206,196 Other Loans Receivable, at Fair Value 447 , 757 42 , 043 ( 27 , 026 ) 9 , 949 4,908 4 7 7, 631 Total Loans Receivable, at Fair Value $ 7 72 , 085 $ 42 , 043 $ ( 144,416 ) $ 9 , 207 $ 4,908 $ 683 , 827 ( Dollars in thousands) June 30, 2023 Total Fair Value $ 477,631 Total Principal $ 496,494 Number of Companies 14 Number of Loans 25 Average Principal per Name $ 35,464 Average Fair Value per Name $ 34,117 Interest Rate Range 7% - 18% Average Duration 0.9 years Badcock 30.1% Consumer / Retail 22.5% Technology 25.6% Communication … Utilities 3.9% Other … Summary Statistics of Other Loans Receivable (1)
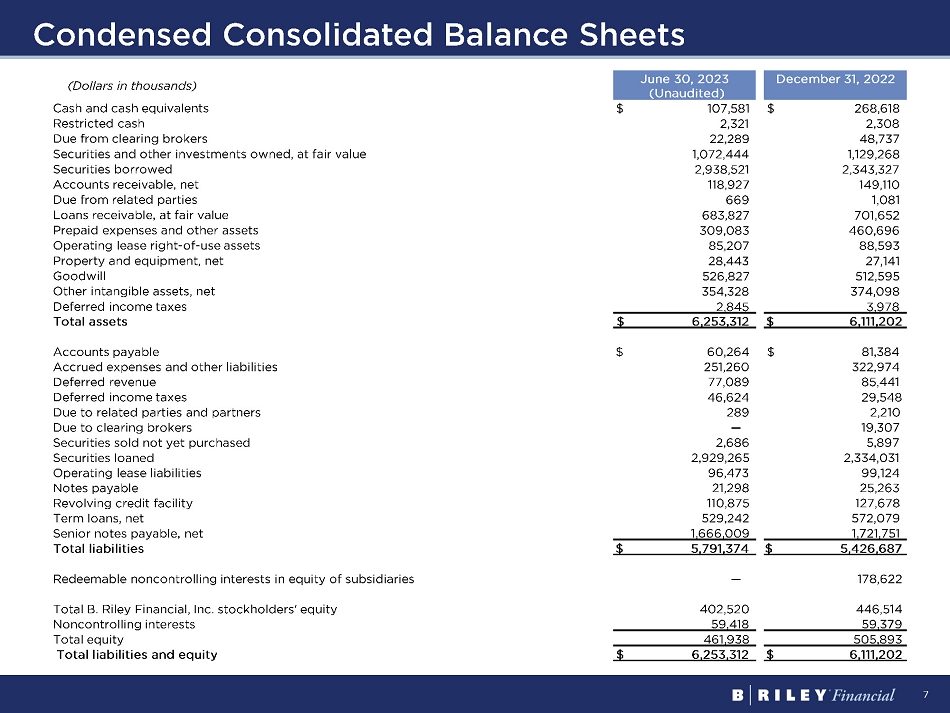
7 Condensed Consolidated Balance Sheets (Dollars in thousands) June 30, 2023 (Unaudited) December 31, 2022 Cash and cash equivalents $ 107,581 $ 268,618 Restricted cash 2,321 2,308 Due from clearing brokers 22,289 48,737 Securities and other investments owned, at fair value 1,072,444 1,129,268 Securities borrowed 2,938,521 2,343,327 Accounts receivable, net 118,927 149,110 Due from related parties 669 1,081 Loans receivable, at fair value 683,827 701,652 Prepaid expenses and other assets 309,083 460,696 Operating lease right - of - use assets 85,207 88,593 Property and equipment, net 28,443 27,141 Goodwill 526,827 512,595 Other intangible assets, net 354,328 374,098 Deferred income taxes 2,845 3,978 Total assets $ 6,253,312 $ 6,111,202 Accounts payable $ 60,264 $ 81,384 Accrued expenses and other liabilities 251,260 322,974 Deferred revenue 77,089 85,441 Deferred income taxes 46,624 29,548 Due to related parties and partners 289 2,210 Due to clearing brokers — 19,307 Securities sold not yet purchased 2,686 5,897 Securities loaned 2,929,265 2,334,031 Operating lease liabilities 96,473 99,124 Notes payable 21,298 25,263 Revolving credit facility 110,875 127,678 Term loans, net 529,242 572,079 Senior notes payable, net 1,666,009 1,721,751 Total liabilities $ 5,791,374 $ 5,426,687 Redeemable noncontrolling interests in equity of subsidiaries — 178,622 Total B. Riley Financial, Inc. stockholders' equity 402,520 446,514 Noncontrolling interests 59,418 59,379 Total equity 461,938 505,893 Total liabilities and equity $ 6,253,312 $ 6,111,202
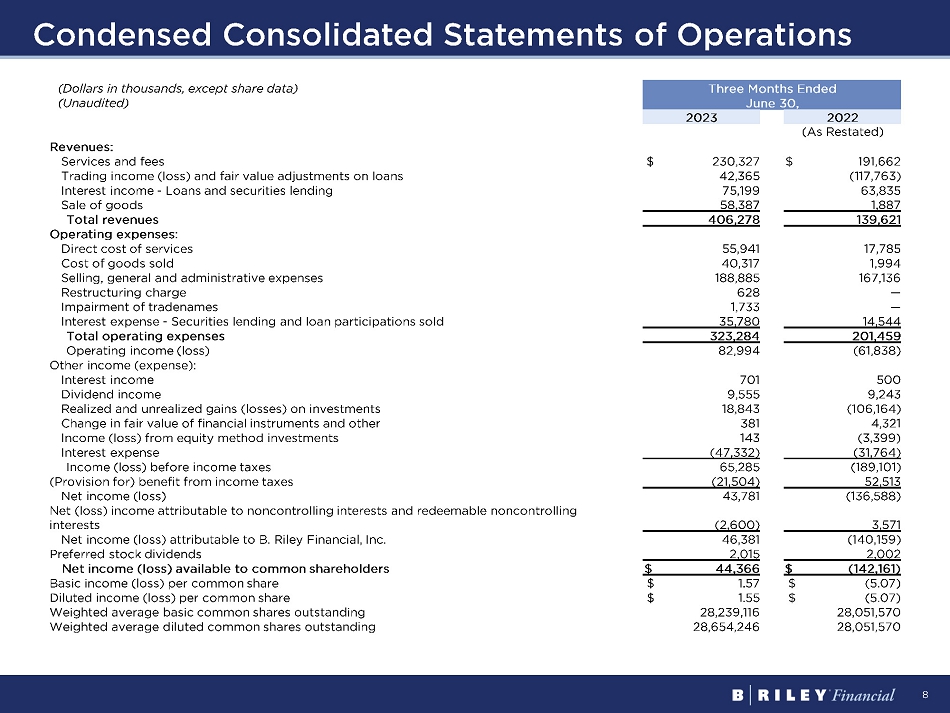
8 Condensed Consolidated Statements of Operations (Dollars in thousands, except share data) Three Months Ended (Unaudited) June 30, 2023 2022 (As Restated) Revenues: Services and fees $ 230,327 $ 191,662 Trading income (loss) and fair value adjustments on loans 42,365 (117,763) Interest income - Loans and securities lending 75,199 63,835 Sale of goods 58,387 1,887 Total revenues 406,278 139,621 Operating expenses: Direct cost of services 55,941 17,785 Cost of goods sold 40,317 1,994 Selling, general and administrative expenses 188,885 167,136 Restructuring charge 628 — Impairment of tradenames 1,733 — Interest expense - Securities lending and loan participations sold 35,780 14,544 Total operating expenses 323,284 201,459 Operating income (loss) 82,994 (61,838) Other income (expense): Interest income 701 500 Dividend income 9,555 9,243 Realized and unrealized gains (losses) on investments 18,843 (106,164) Change in fair value of financial instruments and other 381 4,321 Income (loss) from equity method investments 143 (3,399) Interest expense (47,332) (31,764) Income (loss) before income taxes 65,285 (189,101) (Provision for) benefit from income taxes (21,504) 52,513 Net income (loss) 43,781 (136,588) Net (loss) income attributable to noncontrolling interests and redeemable noncontrolling interests (2,600) 3,571 Net income (loss) attributable to B. Riley Financial, Inc. 46,381 (140,159) Preferred stock dividends 2,015 2,002 Net income (loss) available to common shareholders $ 44,366 $ (142,161) Basic income (loss) per common share $ 1.57 $ (5.07) Diluted income (loss) per common share $ 1.55 $ (5.07) Weighted average basic common shares outstanding 28,239,116 28,051,570 Weighted average diluted common shares outstanding 28,654,246 28,051,570
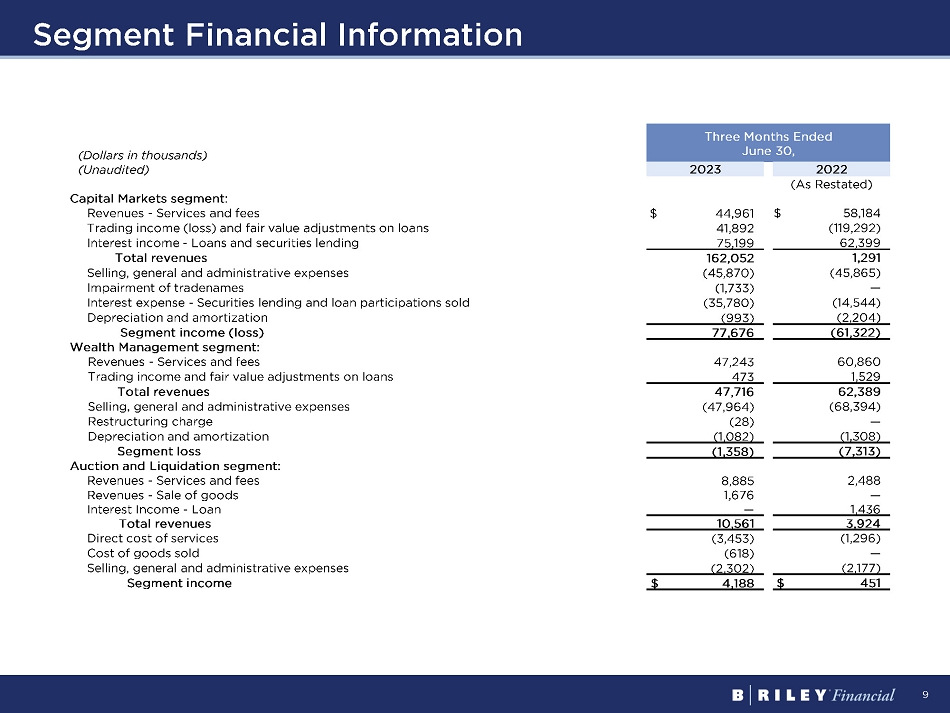
9 Segment Financial Information (Dollars in thousands) Three Months Ended June 30, (Unaudited) 2023 2022 (As Restated) Capital Markets segment: Revenues - Services and fees $ 44,961 $ 58,184 Trading income (loss) and fair value adjustments on loans 41,892 (119,292) Interest income - Loans and securities lending 75,199 62,399 Total revenues 162,052 1,291 Selling, general and administrative expenses (45,870) (45,865) Impairment of tradenames (1,733) — Interest expense - Securities lending and loan participations sold (35,780) (14,544) Depreciation and amortization (993) (2,204) Segment income (loss) 77,676 (61,322) Wealth Management segment: Revenues - Services and fees 47,243 60,860 Trading income and fair value adjustments on loans 473 1,529 Total revenues 47,716 62,389 Selling, general and administrative expenses (47,964) (68,394) Restructuring charge (28) — Depreciation and amortization (1,082) (1,308) Segment loss (1,358) (7,313) Auction and Liquidation segment: Revenues - Services and fees 8,885 2,488 Revenues - Sale of goods 1,676 — Interest Income - Loan — 1,436 Total revenues 10,561 3,924 Direct cost of services (3,453) (1,296) Cost of goods sold (618) — Selling, general and administrative expenses (2,302) (2,177) Segment income $ 4,188 $ 451
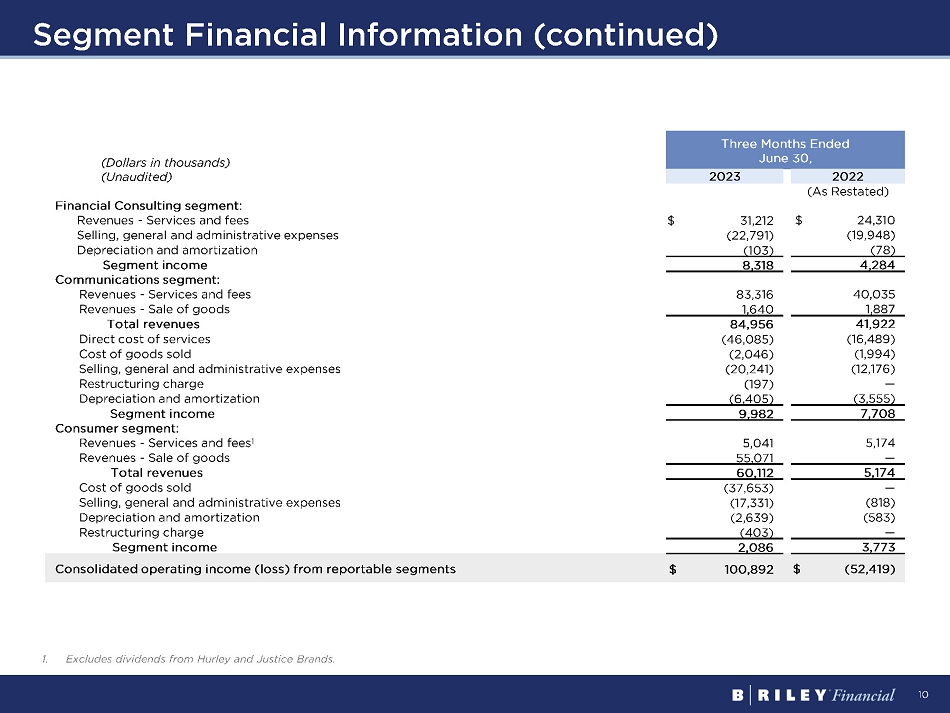
10 Segment Financial Information (continued) (Dollars in thousands) Three Months Ended June 30 , (Unaudited) 2023 2022 (As Restated) Financial Consulting segment: Revenues - Services and fees $ 31,212 $ 24,310 Selling, general and administrative expenses (22,791) (19,948) Depreciation and amortization (103) (78) Segment income 8,318 4,284 Communications segment: Revenues - Services and fees 83,316 40,035 Revenues - Sale of goods 1,640 1,887 Total revenues 84,956 41,922 Direct cost of services (46,085) (16,489) Cost of goods sold (2,046) (1,994) Selling, general and administrative expenses (20,241) (12,176) Restructuring charge (197) — Depreciation and amortization (6,405) (3,555) Segment income 9,982 7,708 Consumer segment: Revenues - Services and fees 1 5,041 5,174 Revenues - Sale of goods 55,071 — Total revenues 60,112 5,174 Cost of goods sold (37,653) — Selling, general and administrative expenses (17,331) (818) Depreciation and amortization (2,639) (583) Restructuring charge (403) — Segment income 2,086 3,773 Consolidated operating income (loss) from reportable segments $ 100,892 $ (52,419) 1. Excludes dividends from Hurley and Justice Brands.
11 Definition of US GAAP to Non - GAAP Financial Measures Certain of the information set forth herein, including operating revenue, adjusted EBITDA, operating adjusted EBITDA, and investment adjusted EBITDA may be considered non - GAAP financial measures . B . Riley Financial believes this information is useful to investors because it provides a basis for measuring the Company's available capital resources, the operating performance of its business and its revenues and cash flow, ( i ) excluding in the case of operating revenues, trading income (loss) and fair value adjustments on loans, (ii) excluding in the case of adjusted EBITDA, net interest expense, provisions for or benefit from income taxes, depreciation, amortization, fair value adjustment, restructuring charge, gain on extinguishment of loans, impairment of trade names, stock - based compensation and transaction and other expenses, (iii) excluding in the case of operating adjusted EBITDA, aforementioned adjustments for adjusted EBITDA, as well as trading income (loss) and fair value adjustments on loans, realized and unrealized gains (losses) on investments, and other investment related expenses, and (iv) in the case of investment adjusted EBITDA this includes trading income (loss) and fair value adjustments on loans and realized and unrealized gains (losses) on investments, net of other investment related expenses, that would normally be included in the most directly comparable measures calculated and presented in accordance with Generally Accepted Accounting Principles ("GAAP") . In addition, the Company's management uses these non - GAAP financial measures along with the most directly comparable GAAP financial measures in evaluating the Company's operating performance, capital resources and cash flow . Non - GAAP financial measures should not be considered in isolation from, or as a substitute for, financial information presented in compliance with GAAP, and non - financial measures as reported by the Company may not be comparable to similarly titled amounts reported by other companies .

12 For more information, please visit www.brileyfin.com
v3.23.2
Cover
|
Aug. 09, 2023 |
| Document Type |
8-K
|
| Amendment Flag |
false
|
| Document Period End Date |
Aug. 09, 2023
|
| Entity File Number |
001-37503
|
| Entity Registrant Name |
B.
RILEY FINANCIAL, INC.
|
| Entity Central Index Key |
0001464790
|
| Entity Tax Identification Number |
27-0223495
|
| Entity Incorporation, State or Country Code |
DE
|
| Entity Address, Address Line One |
11100
Santa Monica Boulevard
|
| Entity Address, Address Line Two |
Suite 800
|
| Entity Address, City or Town |
Los Angeles
|
| Entity Address, State or Province |
CA
|
| Entity Address, Postal Zip Code |
90025
|
| City Area Code |
310
|
| Local Phone Number |
966-1444
|
| Written Communications |
false
|
| Soliciting Material |
false
|
| Pre-commencement Tender Offer |
false
|
| Pre-commencement Issuer Tender Offer |
false
|
| Entity Emerging Growth Company |
false
|
| Common Stock, par value $0.0001 per share |
|
| Title of 12(b) Security |
Common
Stock, par value $0.0001 per share
|
| Trading Symbol |
RILY
|
| Security Exchange Name |
NASDAQ
|
| Depositary Shares (each representing a 1/1000th interest in a 6.875% Series A Cumulative Perpetual Preferred Share, par value $0.0001 per share) |
|
| Title of 12(b) Security |
Depositary
Shares (each representing a 1/1000th interest in a 6.875% Series A Cumulative Perpetual Preferred Share, par value $0.0001 per share)
|
| Trading Symbol |
RILYP
|
| Security Exchange Name |
NASDAQ
|
| Depositary Shares (each representing a 1/1000th interest in a 7.375% Series B Cumulative Perpetual Preferred Share, par value $0.0001 per share) |
|
| Title of 12(b) Security |
Depositary
Shares (each representing a 1/1000th interest in a 7.375% Series B Cumulative Perpetual Preferred Share, par value $0.0001 per share)
|
| Trading Symbol |
RILYL
|
| Security Exchange Name |
NASDAQ
|
| 6.75% Senior Notes due 2024 |
|
| Title of 12(b) Security |
6.75%
Senior Notes due 2024
|
| Trading Symbol |
RILYO
|
| Security Exchange Name |
NASDAQ
|
| 6.375% Senior Notes due 2025 |
|
| Title of 12(b) Security |
6.375%
Senior Notes due 2025
|
| Trading Symbol |
RILYM
|
| Security Exchange Name |
NASDAQ
|
| 5.00% Senior Notes due 2026 |
|
| Title of 12(b) Security |
5.00%
Senior Notes due 2026
|
| Trading Symbol |
RILYG
|
| Security Exchange Name |
NASDAQ
|
| 5.50% Senior Notes due 2026 |
|
| Title of 12(b) Security |
5.50%
Senior Notes due 2026
|
| Trading Symbol |
RILYK
|
| Security Exchange Name |
NASDAQ
|
| 6.50% Senior Notes due 2026 |
|
| Title of 12(b) Security |
6.50%
Senior Notes due 2026
|
| Trading Symbol |
RILYN
|
| Security Exchange Name |
NASDAQ
|
| 5.25% Senior Notes due 2028 |
|
| Title of 12(b) Security |
5.25%
Senior Notes due 2028
|
| Trading Symbol |
RILYZ
|
| Security Exchange Name |
NASDAQ
|
| 6.00% Senior Notes due 2028 |
|
| Title of 12(b) Security |
6.00%
Senior Notes due 2028
|
| Trading Symbol |
RILYT
|
| Security Exchange Name |
NASDAQ
|
| X |
- DefinitionBoolean flag that is true when the XBRL content amends previously-filed or accepted submission.
| Name: |
dei_AmendmentFlag |
| Namespace Prefix: |
dei_ |
| Data Type: |
xbrli:booleanItemType |
| Balance Type: |
na |
| Period Type: |
duration |
|
| X |
- DefinitionFor the EDGAR submission types of Form 8-K: the date of the report, the date of the earliest event reported; for the EDGAR submission types of Form N-1A: the filing date; for all other submission types: the end of the reporting or transition period. The format of the date is YYYY-MM-DD.
| Name: |
dei_DocumentPeriodEndDate |
| Namespace Prefix: |
dei_ |
| Data Type: |
xbrli:dateItemType |
| Balance Type: |
na |
| Period Type: |
duration |
|
| X |
- DefinitionThe type of document being provided (such as 10-K, 10-Q, 485BPOS, etc). The document type is limited to the same value as the supporting SEC submission type, or the word 'Other'.
| Name: |
dei_DocumentType |
| Namespace Prefix: |
dei_ |
| Data Type: |
dei:submissionTypeItemType |
| Balance Type: |
na |
| Period Type: |
duration |
|
| X |
- DefinitionAddress Line 1 such as Attn, Building Name, Street Name
| Name: |
dei_EntityAddressAddressLine1 |
| Namespace Prefix: |
dei_ |
| Data Type: |
xbrli:normalizedStringItemType |
| Balance Type: |
na |
| Period Type: |
duration |
|
| X |
- DefinitionAddress Line 2 such as Street or Suite number
| Name: |
dei_EntityAddressAddressLine2 |
| Namespace Prefix: |
dei_ |
| Data Type: |
xbrli:normalizedStringItemType |
| Balance Type: |
na |
| Period Type: |
duration |
|
| X |
- Definition
+ References
+ Details
| Name: |
dei_EntityAddressCityOrTown |
| Namespace Prefix: |
dei_ |
| Data Type: |
xbrli:normalizedStringItemType |
| Balance Type: |
na |
| Period Type: |
duration |
|
| X |
- DefinitionCode for the postal or zip code
| Name: |
dei_EntityAddressPostalZipCode |
| Namespace Prefix: |
dei_ |
| Data Type: |
xbrli:normalizedStringItemType |
| Balance Type: |
na |
| Period Type: |
duration |
|
| X |
- DefinitionName of the state or province.
| Name: |
dei_EntityAddressStateOrProvince |
| Namespace Prefix: |
dei_ |
| Data Type: |
dei:stateOrProvinceItemType |
| Balance Type: |
na |
| Period Type: |
duration |
|
| X |
- DefinitionA unique 10-digit SEC-issued value to identify entities that have filed disclosures with the SEC. It is commonly abbreviated as CIK. Reference 1: http://www.xbrl.org/2003/role/presentationRef
-Publisher SEC
-Name Exchange Act
-Number 240
-Section 12
-Subsection b-2
| Name: |
dei_EntityCentralIndexKey |
| Namespace Prefix: |
dei_ |
| Data Type: |
dei:centralIndexKeyItemType |
| Balance Type: |
na |
| Period Type: |
duration |
|
| X |
- DefinitionIndicate if registrant meets the emerging growth company criteria. Reference 1: http://www.xbrl.org/2003/role/presentationRef
-Publisher SEC
-Name Exchange Act
-Number 240
-Section 12
-Subsection b-2
| Name: |
dei_EntityEmergingGrowthCompany |
| Namespace Prefix: |
dei_ |
| Data Type: |
xbrli:booleanItemType |
| Balance Type: |
na |
| Period Type: |
duration |
|
| X |
- DefinitionCommission file number. The field allows up to 17 characters. The prefix may contain 1-3 digits, the sequence number may contain 1-8 digits, the optional suffix may contain 1-4 characters, and the fields are separated with a hyphen.
| Name: |
dei_EntityFileNumber |
| Namespace Prefix: |
dei_ |
| Data Type: |
dei:fileNumberItemType |
| Balance Type: |
na |
| Period Type: |
duration |
|
| X |
- DefinitionTwo-character EDGAR code representing the state or country of incorporation.
| Name: |
dei_EntityIncorporationStateCountryCode |
| Namespace Prefix: |
dei_ |
| Data Type: |
dei:edgarStateCountryItemType |
| Balance Type: |
na |
| Period Type: |
duration |
|
| X |
- DefinitionThe exact name of the entity filing the report as specified in its charter, which is required by forms filed with the SEC. Reference 1: http://www.xbrl.org/2003/role/presentationRef
-Publisher SEC
-Name Exchange Act
-Number 240
-Section 12
-Subsection b-2
| Name: |
dei_EntityRegistrantName |
| Namespace Prefix: |
dei_ |
| Data Type: |
xbrli:normalizedStringItemType |
| Balance Type: |
na |
| Period Type: |
duration |
|
| X |
- DefinitionThe Tax Identification Number (TIN), also known as an Employer Identification Number (EIN), is a unique 9-digit value assigned by the IRS. Reference 1: http://www.xbrl.org/2003/role/presentationRef
-Publisher SEC
-Name Exchange Act
-Number 240
-Section 12
-Subsection b-2
| Name: |
dei_EntityTaxIdentificationNumber |
| Namespace Prefix: |
dei_ |
| Data Type: |
dei:employerIdItemType |
| Balance Type: |
na |
| Period Type: |
duration |
|
| X |
- DefinitionLocal phone number for entity.
| Name: |
dei_LocalPhoneNumber |
| Namespace Prefix: |
dei_ |
| Data Type: |
xbrli:normalizedStringItemType |
| Balance Type: |
na |
| Period Type: |
duration |
|
| X |
- DefinitionBoolean flag that is true when the Form 8-K filing is intended to satisfy the filing obligation of the registrant as pre-commencement communications pursuant to Rule 13e-4(c) under the Exchange Act. Reference 1: http://www.xbrl.org/2003/role/presentationRef
-Publisher SEC
-Name Exchange Act
-Number 240
-Section 13e
-Subsection 4c
| Name: |
dei_PreCommencementIssuerTenderOffer |
| Namespace Prefix: |
dei_ |
| Data Type: |
xbrli:booleanItemType |
| Balance Type: |
na |
| Period Type: |
duration |
|
| X |
- DefinitionBoolean flag that is true when the Form 8-K filing is intended to satisfy the filing obligation of the registrant as pre-commencement communications pursuant to Rule 14d-2(b) under the Exchange Act. Reference 1: http://www.xbrl.org/2003/role/presentationRef
-Publisher SEC
-Name Exchange Act
-Number 240
-Section 14d
-Subsection 2b
| Name: |
dei_PreCommencementTenderOffer |
| Namespace Prefix: |
dei_ |
| Data Type: |
xbrli:booleanItemType |
| Balance Type: |
na |
| Period Type: |
duration |
|
| X |
- DefinitionTitle of a 12(b) registered security. Reference 1: http://www.xbrl.org/2003/role/presentationRef
-Publisher SEC
-Name Exchange Act
-Number 240
-Section 12
-Subsection b
| Name: |
dei_Security12bTitle |
| Namespace Prefix: |
dei_ |
| Data Type: |
dei:securityTitleItemType |
| Balance Type: |
na |
| Period Type: |
duration |
|
| X |
- DefinitionName of the Exchange on which a security is registered. Reference 1: http://www.xbrl.org/2003/role/presentationRef
-Publisher SEC
-Name Exchange Act
-Number 240
-Section 12
-Subsection d1-1
| Name: |
dei_SecurityExchangeName |
| Namespace Prefix: |
dei_ |
| Data Type: |
dei:edgarExchangeCodeItemType |
| Balance Type: |
na |
| Period Type: |
duration |
|
| X |
- DefinitionBoolean flag that is true when the Form 8-K filing is intended to satisfy the filing obligation of the registrant as soliciting material pursuant to Rule 14a-12 under the Exchange Act. Reference 1: http://www.xbrl.org/2003/role/presentationRef
-Publisher SEC
-Name Exchange Act
-Section 14a
-Number 240
-Subsection 12
| Name: |
dei_SolicitingMaterial |
| Namespace Prefix: |
dei_ |
| Data Type: |
xbrli:booleanItemType |
| Balance Type: |
na |
| Period Type: |
duration |
|
| X |
- DefinitionTrading symbol of an instrument as listed on an exchange.
| Name: |
dei_TradingSymbol |
| Namespace Prefix: |
dei_ |
| Data Type: |
dei:tradingSymbolItemType |
| Balance Type: |
na |
| Period Type: |
duration |
|
| X |
- DefinitionBoolean flag that is true when the Form 8-K filing is intended to satisfy the filing obligation of the registrant as written communications pursuant to Rule 425 under the Securities Act. Reference 1: http://www.xbrl.org/2003/role/presentationRef
-Publisher SEC
-Name Securities Act
-Number 230
-Section 425
| Name: |
dei_WrittenCommunications |
| Namespace Prefix: |
dei_ |
| Data Type: |
xbrli:booleanItemType |
| Balance Type: |
na |
| Period Type: |
duration |
|
| X |
- Details
| Name: |
us-gaap_StatementClassOfStockAxis=RILY_CommonStockParValue0.0001PerShareMember |
| Namespace Prefix: |
|
| Data Type: |
na |
| Balance Type: |
|
| Period Type: |
|
|
| X |
- Details
| Name: |
us-gaap_StatementClassOfStockAxis=RILY_DepositarySharesEachRepresenting11000thInterestIn6.875SeriesCumulativePerpetualPreferredShareParValue0.0001PerShareMember |
| Namespace Prefix: |
|
| Data Type: |
na |
| Balance Type: |
|
| Period Type: |
|
|
| X |
- Details
| Name: |
us-gaap_StatementClassOfStockAxis=RILY_DepositarySharesEachRepresenting11000thInterestIn7.375SeriesBCumulativePerpetualPreferredShareParValue0.0001PerShareMember |
| Namespace Prefix: |
|
| Data Type: |
na |
| Balance Type: |
|
| Period Type: |
|
|
| X |
- Details
| Name: |
us-gaap_StatementClassOfStockAxis=RILY_Sec6.75SeniorNotesDue2024Member |
| Namespace Prefix: |
|
| Data Type: |
na |
| Balance Type: |
|
| Period Type: |
|
|
| X |
- Details
| Name: |
us-gaap_StatementClassOfStockAxis=RILY_Sec6.375SeniorNotesDue2025Member |
| Namespace Prefix: |
|
| Data Type: |
na |
| Balance Type: |
|
| Period Type: |
|
|
| X |
- Details
| Name: |
us-gaap_StatementClassOfStockAxis=RILY_Sec5.00SeniorNotesDue2026Member |
| Namespace Prefix: |
|
| Data Type: |
na |
| Balance Type: |
|
| Period Type: |
|
|
| X |
- Details
| Name: |
us-gaap_StatementClassOfStockAxis=RILY_Sec5.50SeniorNotesDue2026Member |
| Namespace Prefix: |
|
| Data Type: |
na |
| Balance Type: |
|
| Period Type: |
|
|
| X |
- Details
| Name: |
us-gaap_StatementClassOfStockAxis=RILY_Sec6.50SeniorNotesDue2026Member |
| Namespace Prefix: |
|
| Data Type: |
na |
| Balance Type: |
|
| Period Type: |
|
|
| X |
- Details
| Name: |
us-gaap_StatementClassOfStockAxis=RILY_Sec5.25SeniorNotesDue2028Member |
| Namespace Prefix: |
|
| Data Type: |
na |
| Balance Type: |
|
| Period Type: |
|
|
| X |
- Details
| Name: |
us-gaap_StatementClassOfStockAxis=RILY_Sec6.00SeniorNotesDue2028Member |
| Namespace Prefix: |
|
| Data Type: |
na |
| Balance Type: |
|
| Period Type: |
|
|
Amplify Video Game Tech ... (AMEX:GAMR)
Historical Stock Chart
From Mar 2024 to Apr 2024

Amplify Video Game Tech ... (AMEX:GAMR)
Historical Stock Chart
From Apr 2023 to Apr 2024
