Final Results -13-
February 27 2012 - 2:01AM
UK Regulatory
  and onerous. A serious                Secretary and the Head of Internal Audit
  breach of these rules                 collectively retain principal responsibility
  and regulations could                 for maintaining and reporting on governance
  have a significant impact             changes that may have an impact on the Group.
  on the Group's reputation,            To ensure that all Directors and managers
  lead to a loss of confidence          are kept up to date on the latest governance
  on the part of investors,             requirements, periodic governance updates
  customers or other stakeholders       are provided to the Board and Executive Committee
  and ultimately have a                 at appropriate intervals, and to key operational
  material adverse impact               management. Recent examples of developments
  on the Group's enterprise             in this area include formulation of a Business
  value.                                Continuity Framework, IT Policy Guidelines,
                                        and anti-bribery training.
                                      ----------------------------------------------------------
Resources
Employees
The key resource of the Group is its employees, who have
extensive knowledge of the Group's key markets, customers, product
technology and manufacturing processes. The average number of
employees employed in the Group during 2011 was 5,374 (2010 -
4,872). Of these 4,523 were in production-related roles, 55 in
distribution, 323 in sales and 473 in administration. Senior is an
international group operating in 12 countries. At the end of 2011,
the Group employed a total of 5,878 people, with 49% located in
North America, 20% in the UK, 17% in the rest of Europe and 14% in
the Rest of the World.
Engineering capability and manufacturing technology
A key strength of the Group is its engineering capability and
manufacturing technology. The Group possesses significant product
design and manufacturing engineering capabilities, which are
essential to support the development of precision components for
customers and improve production processes to help maximise
production efficiency and product quality. This in turn maintains
and enhances the Group's reputation for delivering quality
added-value products to its customers on time and at a competitive
price. During 2011, the Group spent GBP22.1m (2010 - GBP14.2m) on
capital expenditure to strengthen the Group's manufacturing
capability, as well as its production capacity. This expenditure
was 1.2x the depreciation level (2010 - 0.7x).
Financial
The Group funds its activities through a mixture of equity and
debt financing. It obtains its equity financing from a wide range
of non-related institutional investors who trade the Company's
shares on the London Stock Exchange. The largest holder has an
interest in approximately 14% of the shares of the Company. As at
31 December 2011, the Company's share price was 171p, giving it a
market capitalisation of GBP687.8m.
In respect of debt financing, at the end of 2011 the Group had
committed borrowing facilities totalling GBP187.0m, of which
GBP119.4m was being utilised in addition to GBP2.9m of borrowings
from uncommitted facilities and finance leases. The Group held
GBP29.3m in cash and hence net debt was GBP93.0m. The committed
facilities at this time consisted of US$35m (GBP22.6m) of loan
notes due in 2014, US$25m (GBP16.1m) of loan notes due in 2015,
US$30m (GBP19.4m) of loan notes due in 2017, US$75m (GBP48.4m) of
loan notes due in 2018, US$20m (GBP12.9m) of loan notes due in
2020, a GBP60.0m multi-currency revolving credit facility maturing
in 2016 and a US$12m (GBP7.6m) bilateral facility maturing in
2014.
Corporate Social Responsibility
The policy of the Board is to seek to enhance shareholder value
in an ethical and socially responsible manner, taking into account
the wishes of all stakeholders, and with a particular focus on
health and safety and preserving the environment. Two of the
Group's six KPIs, namely reductions in carbon dioxide emissions and
lost time injuries, are targeted at this area. Details of the
Group's corporate and social responsibility principles and
performance indices are set out in the Corporate Social
Responsibility Report in the Annual Report & Accounts 2011.
Directors' Responsibility Statement
We confirm that to the best of our knowledge:
 1.   the Financial Statements, prepared in accordance with IFRS as
       adopted by the European Union, give a true and fair view of the
       assets, liabilities, financial position and profit or loss of
       the Company and the undertakings included in the consolidation
       taken as a whole; and
 2.   the Operating and Financial Review, which is incorporated into
       the Directors' Report, includes a fair review of the development
       and performance of the business and the position of the Company
       and the undertakings included in the consolidation taken as a
       whole, together with a description of the principal risks and
       uncertainties that they face.
By Order of the Board
 Mark Rollins            Simon Nicholls
 Group Chief Executive   Group Finance Director
 24 February 2012        24 February 2012
Consolidated Income Statement
For the year ended 31 December 2011
                                             Year ended   Year ended
                                                   2011         2010
                                     Notes         GBPm         GBPm
 Continuing operations
 Revenue                               3          640.7        566.9
                                            ===========  ===========
 Trading profit                                    83.3         62.0
 (Loss) / profit on sale of fixed
  assets                                          (0.3)          0.2
 Operating profit (1)                  3           83.0         62.2
 Investment income                                  0.3          0.5
 Finance costs                                   (10.6)       (10.6)
                                            -----------  -----------
 Profit before tax (2)                             72.7         52.1
 Tax                                   5         (17.7)       (11.7)
                                            -----------  -----------
 Profit for the period                             55.0         40.4
                                            ===========  ===========
 Attributable to:
 Equity holders of the parent                      55.0         40.4
                                            ===========  ===========
 Earnings per share
 Basic (3)                             7         13.68p       10.11p
                                            ===========  ===========
 Diluted                               7         13.21p        9.77p
                                            ===========  ===========


 (1) Adjusted operating profit      4     88.3     75.4
 (2) Adjusted profit before tax     4     78.0     65.3
 (3) Adjusted earnings per share    7   14.55p   12.01p
Consolidated Statement of Comprehensive Income
For the year ended 31 December 2011
                                                      Year ended   Year ended
                                                            2011         2010
                                                            GBPm         GBPm
 Profit for the period                                      55.0         40.4
                                                     -----------  -----------
 Other comprehensive income:
 (Losses) / gains on cash flow hedges during
  the period                                               (2.3)          0.8
 Reclassification adjustments for losses / (gains)
  included in profit or loss                                 0.2        (1.2)
                                                     -----------  -----------
 Losses on cash flow hedges                                (2.1)        (0.4)
 Gains on revaluation of financial instruments               0.1            -
 Exchange differences on translation of foreign
  operations                                               (1.4)          4.0
 Actuarial (losses) / gains on defined benefit
  pension schemes                                          (1.8)          0.4
                                                     -----------  -----------
 Other comprehensive (expense) / income                    (5.2)          4.0
 Tax relating to components of other comprehensive
  income                                                     8.8          2.7
                                                     -----------  -----------
 Other comprehensive income for the period, net
  of tax                                                     3.6          6.7
                                                     -----------  -----------
 Total comprehensive income for the period                  58.6         47.1
                                                     ===========  ===========
 Attributable to:
 Equity holders of the parent                               58.6         47.1
                                                     ===========  ===========
Consolidated Balance Sheet
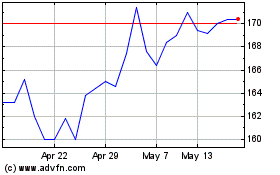
Senior (LSE:SNR)
Historical Stock Chart
From Jun 2024 to Jul 2024

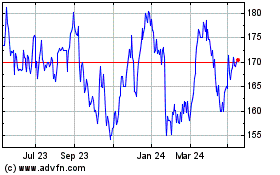
Senior (LSE:SNR)
Historical Stock Chart
From Jul 2023 to Jul 2024
