TIDMRAT
RNS Number : 1891M
Rathbone Brothers PLC
07 May 2020
Rathbone Brothers Plc
First quarter interim management statement
Rathbone Brothers Plc ("Rathbones") announces a trading update
for the three months ended 31 March 2020.
Paul Stockton, Chief Executive of Rathbones, said:
"I am very proud of the way our people and infrastructure have
responded to the COVID-19 crisis. Our business model is robust and
has rapidly adjusted to ways of working remotely whilst continuing
to provide clients with quality service, investment solutions and
advice, at a time when they need it most.
Funds under management and administration of GBP42.6 billion
decreased by 15.4% from 31 December 2019, which is a resilient
performance against a market backdrop where the FTSE 100 Index fell
27.4% in the first quarter. Clients from the Personal Injury and
Court of Protection business of Barclays Wealth joined us at the
end of the quarter, representing GBP0.4 billion of funds under
management.
The second quarter has started well with total net organic
inflows during April 2020 of GBP0.4 billion.
There remains a great deal of uncertainty around the duration
and severity of the pandemic, and we expect that global market
conditions will remain volatile and interest rates low. Our balance
sheet remains strong, and we are well positioned to continue with
our strategic growth agenda, mindful of the necessity to balance
the needs of the business with market conditions and the health and
well-being of our employees."
Financial highlights:
- Total funds under management and administration decreased by
15.4% to GBP42.6 billion at the end of the first quarter* (31
December 2019: GBP50.4 billion). The FTSE 100 Index on the first
quarter charging date decreased 27.4% from 31 December 2019, whilst
the MSCI PIMFA Private Investor Balanced Index decreased by
17.3%.
   -      GBP35.9 billion in the Investment Management business (31 December 2019: GBP43.0 billion).
   -      GBP6.8 billion in the Unit Trusts business (31 December 2019: GBP7.4 billion).
   -    Total net inflows were GBP0.7 billion in the first quarter (Q1 2019: GBP0.2 billion).
- Net organic flows in Investment Management were nil during Q1
2020 (Q1 2019: GBP9 million net inflow).
- Gross organic inflows in Investment Management were GBP1.0
billion in the first quarter against a challenging market backdrop,
up 18.9% from the same period last year. Total gross outflows of
GBP1.0 billion (Q1 2019: GBP0.8 billion) were driven by the part
withdrawal of previously reported short-term mandates and the
re-balancing of certain pension scheme portfolios.
- Acquired new business in the first quarter of GBP0.4 billion
predominantly reflected the transfer of clients from the
acquisition of the Personal Injury and Court of Protection business
of Barclays Wealth.
- Net inflows in Unit Trusts increased significantly year on
year to GBP0.2 billion (Q1 2019: GBP0.1 billion) with strong net
inflows into the Ethical Bond Fund, Global Opportunities Fund and
the High Quality Bond. Net flows into our Multi Asset Portfolios
were also strong, particularly into the Strategic Growth Fund.
- According to the Pridham Report, Rathbones was ranked in
10(th) position for overall net retail sales during the first
quarter of 2020, maintaining its top 10 position.
- Total underlying net operating income of GBP84.6 million for
the three months ended 31 March 2020 was consistent with last year
(Q1 2019: GBP85.3 million).
- Income in Investment Management totalled GBP74.9 million in
the quarter, down 2.2% on the GBP76.6 million reported in the
corresponding period in 2019. The value of the FTSE 100 Index on
the first quarter charging date was 5416 compared with 7447 a year
ago. The MSCI PIMFA Private Investor Balanced Index was 1389
compared to 1610 on the equivalent dates.
- Investment Management fees were down 9.7% compared to the
prior year while commissions were 29.0% ahead, driven by high
trading volumes throughout the quarter. Net interest income
decreased by 13.9% to GBP3.1 million (Q1 2019: GBP3.6 million).
- Fees from advisory services and other income increased by 2.1%
to GBP4.8 million (Q1 2019: GBP4.7 million).
- Income in Unit Trusts, which accrues daily, totalled GBP9.7
million for the three months ended 31 March 2020, an increase of
11.5% on the GBP8.7 million reported for the first quarter in
2019.
- Total funds under management and administration at 30 April
2020 were GBP46.5 billion, an increase of 9.2% from 5 April 2020
(Investment Management: GBP39.2 billion; Unit Trusts: GBP7.3
billion).
- Net organic inflows in Investment Management during April were
GBP0.3 billion while net inflows into Unit Trusts were GBP0.1
billion.
- The final dividend for 31 December 2019 of 45 pence per share will be paid on 12 May 2020.
* Funds under management at the end of the first quarter are
measured at 5 April for Investment Management (to coincide with the
first charging date for Investment Management private clients) and
at 31 March for Unit Trusts.
Net operating income
                                                                           3 months ended
                                           3 months ended 31 March           31 December
                                            2020     2019     Change           2019     Change
 Investment Management                      GBPm     GBPm          %           GBPm          %
 - Fees                                     49.2     54.5      (9.7)           57.5     (14.4)
 - Commissions                              17.8     13.8       29.0           12.1       47.1
 - Net interest income                       3.1      3.6     (13.9)            4.3     (27.9)
 - Fees from advisory services (1)
  & other income (2)                         4.8      4.7        2.1            4.6        4.3
                                        --------  -------  ---------  -------------  ---------
                                            74.9     76.6      (2.2)           78.5      (4.6)
 Unit Trusts (2)                             9.7      8.7       11.5           10.2      (4.9)
 Underlying net operating income            84.6     85.3      (0.8)           88.7      (4.6)
                                        --------  -------  ---------  -------------  ---------

 FTSE 100 Index on principal charging
  dates (3)                                 5416     7447     (27.3)           7456     (27.4)
 MSCI PIMFA Private Investor Balanced
  Index on principal charging dates
  (3)                                       1389     1610     (13.7)           1679     (17.3)
(1) Including income from trust, tax, financial planning
services and Vision Independent Financial Planning.
(2) Fair value adjustments to holdings in our own unit trusts
(linked to deferred profit share awards) have been re-presented in
the prior periods from the "other income" line to "Unit Trusts" in
order to align them with the business unit to which they relate (Q1
2020: GBP0.5 million loss; Q1 2019: GBP0.2 million gain; Q4 2019:
GBP0.1 million gain).
(3) The principal charging dates for Investment Management
clients are 5 April, 30 June, 30 September and 31 December. Unit
Trust income accrues on daily levels of funds under management. The
index levels for 31 December 2019 represents the average of the
closing index levels at each of the principal charging dates during
the year.
Funds under management and administration
(i) Investment Management                       Period ended 5 April        3 months ended
                                                                              31 December
                                                 2020     2019    Change      2019    Change
                                                 GBPm     GBPm         %      GBPm         %
 Opening FUMA (1 January / 1 October)          42,965   38,456      11.7    42,422       1.3
 Inflows                                        1,469      975      50.7       820      79.1
------------------------------------------  ---------  -------  --------  --------  --------
  Organic new business                          1,015      854      18.9       794      27.8
  Acquired new business                           454      121     275.2        26   1,646.2
------------------------------------------  ---------  -------  --------  --------  --------
 Outflows                                     (1,015)    (845)    (20.1)   (1,147)      11.5
 Market effect and investment performance     (7,544)    2,859   (363.9)       870   (967.1)
                                            ---------  -------  --------  --------  --------
 Closing FUMA                                  35,875   41,445    (13.4)    42,965    (16.5)
                                            ---------  -------  --------  --------  --------

 Underlying annualised rate of net
  organic growth                                    -     0.1%              (3.3%)
 Total annualised net organic and
  acquired growth                                4.2%     1.4%              (3.1%)


(ii) Unit Trusts                               3 months ended 31 March      3 months ended
                                                                              31 December
                                                 2020     2019    Change      2019    Change
                                                 GBPm     GBPm         %      GBPm         %
 Opening FUM (1 January / 1 October)            7,438    5,643      31.8     7,028       5.8
 Inflows                                          767      407      88.5       642      19.5
 Outflows                                       (569)    (348)    (63.5)     (348)    (63.5)
 Market effect and investment performance       (865)      378   (328.8)       116   (845.7)
                                            ---------  -------  --------  --------  --------
 Closing FUM                                    6,771    6,080      11.4     7,438     (9.0)
                                            ---------  -------  --------  --------  --------

 Total FUMA(4)                                 42,646   47,525    (10.3)    50,403    (15.4)
                                            ---------  -------  --------  --------  --------


   Net flows

 Investment Management                            454      130     249.2     (327)     238.8
 Unit Trusts                                      198       59     235.6       294    (32.7)
                                            ---------  -------  --------  --------  --------
 Total                                            652      189     245.0      (33)   2,075.8
                                            ---------  -------  --------  --------  --------
(4) Includes GBP2.0 billion of funds under execution only
mandates (Q4 2019: GBP2.4 billion), Greenbank funds of GBP1.4
billion (Q4 2019: GBP1.6 billion) and funds managed with a
charitable mandate of GBP5.0 billion (Q4 2019: GBP6.1 billion).
(iii) Investment Management; Service                 5 April               31 December
 level breakdown
                                               2020      2019   Change      2019   Change
                                               GBPm      GBPm        %      GBPm        %
 Direct                                      26,305    29,045    (9.4)    31,013   (15.2)
 Financial Adviser linked                     7,387     8,214   (10.0)     8,735   (15.4)
-----------------------------------------  --------  --------  -------  --------  -------
 Total Discretionary                         33,692    37,259    (9.6)    39,748   (15.2)
 Non-Discretionary Investment Management      1,781     3,325   (46.4)     2,550   (30.2)
 Execution Only                               1,976     2,274   (13.1)     2,411   (18.0)
-----------------------------------------  --------  --------  -------  --------  -------
 Gross Investment Management FUMA            37,449    42,858   (12.6)    44,709   (16.2)
 Discretionary wrapped funds (5)            (1,574)   (1,413)   (11.4)   (1,744)    (9.8)
-----------------------------------------  --------  --------  -------  --------  -------
 Total Investment Management FUMA            35,875    41,445   (13.4)    42,965   (16.5)
-----------------------------------------  --------  --------  -------  --------  -------
(5) Discretionary wrapped funds represent funds operated by Unit
Trusts, managed by both Investment Management teams and Unit Trusts
fund managers.
The FTSE 100 Index closed at 5854 on 6 May 2020, an increase of
8.1% since 5 April 2020. Investment Management fee income in the
second quarter is dependent upon the value of funds under
management at 30 June 2020.
The Annual General Meeting will be held today at Rathbones'
offices and the interim results for the six months to 30 June 2020
will be announced on 29 July 2020. Given the current COVID-19
situation and the government measures which prohibit public
gatherings of more than two people, shareholders have been
requested not to attend the AGM in person. Instead, one director
and one employee, who are both shareholders, will attend in person.
A live webcast is in place so that shareholders can listen to
proceedings. The webcast can be accessed using the following link:
https://www.investis-live.com/rathbone-brothers/5e871b2d1176b691000c02a0/fjfj
. Shareholders were also requested to send their questions via
email in advance of the meeting and to the extent practicable,
answers will be published on the Group website ( www.rathbones.com)
.
7 May 2020
For further information contact:
Rathbone Brothers Plc
Tel: 020 7399 0000
Email: dominic.lagan@rathbones.com
Paul Stockton, Chief Executive
Jennifer Mathias, Group Finance Director
Dominic Lagan, Interim Head of Investor Relations
Camarco
Tel: 020 3757 4984
Email: ed.gascoigne-pees@camarco.co.uk
Ed Gascoigne-Pees
Julia Tilley
Rathbone Brothers Plc
Rathbones provides individual investment and wealth management
services for private clients, charities, trustees and professional
partners. We have been trusted for generations to manage and
preserve our clients' wealth. Our tradition of investing and acting
responsibly has been with us from the beginning and continues to
lead us forward. Our ambition is to be recognised as the UK's most
responsible wealth manager.
Rathbones has over 1,500 staff in 15 UK locations and Jersey;
its headquarters is 8 Finsbury Circus, London.
www. rathbones.com
This information is provided by RNS, the news service of the
London Stock Exchange. RNS is approved by the Financial Conduct
Authority to act as a Primary Information Provider in the United
Kingdom. Terms and conditions relating to the use and distribution
of this information may apply. For further information, please
contact rns@lseg.com or visit www.rns.com.
END
QRFEAXSKEFNEEFA
(END) Dow Jones Newswires
May 07, 2020 02:00 ET (06:00 GMT)
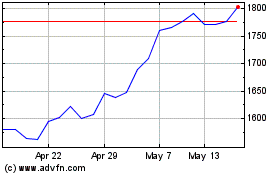
Rathbones (LSE:RAT)
Historical Stock Chart
From Jun 2024 to Jul 2024

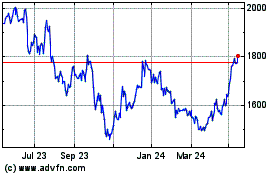
Rathbones (LSE:RAT)
Historical Stock Chart
From Jul 2023 to Jul 2024
