RNS Number:6726G
Oryx International Growth Fund Ld
21 December 2004


FOR IMMEDIATE RELEASE
RELEASED BY MANAGEMENT INTERNATIONAL (GUERNSEY) LIMITED
ORYX INTERNATIONAL GROWTH FUND LIMITED
PRELIMINARY ANNOUNCEMENT


THE BOARD OF DIRECTORS OF ORYX INTERNATIONAL GROWTH FUND LIMITED ANNOUNCE
RESULTS FOR THE SIX MONTHS ENDED 30 SEPTEMBER 2004:


                            UNAUDITED BALANCE SHEET
                            As at 30 September 2004
                         (Expressed in pounds sterling)


                                                  2004         2003
                                                     #            #
INVESTMENTS
Listed investments at market value
(Cost #17,626,868: 2003 - #11,556,855)      18,601,484    9,851,644
Unlisted investments
(Cost #1,387,764: 2003 - #3,888,292)         3,233,628    6,044,433
                                            21,835,112   15,896,077


CURRENT ASSETS
Dividends and interest receivable              172,051      359,393
Amounts due from brokers                        31,429       65,604
Bank balances                                1,212,359    2,358,693
Other receivables                               33,623        6,958
                                             1,449,462    2,790,648

CURRENT LIABILITIES
Amounts due to brokers                         440,125      573,327
Creditors and accrued expenses                  74,525       52,977
                                               514,650      626,304

NET CURRENT ASSETS                             934,812    2,164,344
TOTAL ASSETS LESS CURRENT LIABILITIES       22,769,924   18,060,421


LONG TERM LIABILITIES
Convertible loan stock                         687,709    2,516,647

TOTAL NET ASSETS                            22,082,215   15,543,774


EQUITY SHARE CAPITAL                         5,143,159    4,049,116

RESERVES
Share premium                                5,488,522    4,247,457
Reserve relating to warrants                         -     (18,704)
Capital redemption reserve                   1,246,500    1,099,000
Other reserves                              10,204,034    6,166,905
                                            16,939,056   11,494,658

EQUITY SHAREHOLDERS' FUNDS                  22,082,215   15,543,774

Net Asset Value per Share                       # 2.15       # 1.92

Fully Diluted Net Asset Value per Share         # 2.07       # 1.65


                       UNAUDITED STATEMENT OF OPERATIONS
                   For the six months ended 30 September 2004
                         (Expressed in pounds sterling)


                                                                   2004        2003
                                                                      #           #
INCOME
Deposit interest                                                 28,452      28,861
Dividends and investment income                                 134,300     462,950
                                                                162,752     491,811

EXPENDITURE
Management and investment adviser's fee                         129,635     106,765
Finance charge                                                    9,317      11,719
Custodian fees                                                    8,933       9,288
Administration fee                                               10,162      10,027
Registrar and transfer agent fees                                 2,289       1,750
Directors' fees and expenses                                     66,030      52,806
Audit fees                                                       15,684       5,014
Insurance                                                         5,273       9,500
Legal and professional fees                                      40,072       4,031
Printing and advertising expenses                                     -       6,793
Miscellaneous expenses                                           12,701      10,461
                                                                300,096     228,154

NET (EXPENSE)/INCOME BEFORE TAXATION                          (137,344)     263,657

Taxation                                                       (27,964)    (14,584)


NET (EXPENSE)/INCOME FOR THE
PERIOD AFTER TAXATION                                         (165,308)     249,073

Realised gain/(loss) on investments                           1,552,657   (162,322)
Loss on foreign currency translation                              (549)    (30,237)
Movement in unrealised (loss)/gain on
revaluation of investments                                    (686,356)   2,297,281

TOTAL SURPLUS ATTRIBUTABLE TO SHAREHOLDERS FOR THE PERIOD       700,444   2,353,795

EARNINGS PER SHARE FOR THE PERIOD                                 #0.09       #0.29

FULLY DILUTED EARNINGS PER                                        #0.07       #0.22
SHARE FOR THE PERIOD


                       UNAUDITED STATEMENT OF CASH FLOWS
                   For the six months ended 30 September 2004
                         (Expressed in pounds sterling)


                                                                     2004          2003
                                                                        #             #
Net cash outflow from operating activities                       (81,624)      (46,456)

INVESTING ACTIVITIES
Purchase of investments                                      (10,141,885)   (7,620,928)
Sale of investments                                             7,540,172     9,764,609
Net cash (outflow)/inflow from investing activities           (2,601,713)     2,143,681

FINANCING ACTIVITIES
Payment to holders of convertible stock                           (8,776)      (50,992)
Payment to holders of warrants                                    (7,222)             -
Payment to shareholders                                          (25,870)             -
Shares issued on exercise of warrants                             687,324             -
Net cash inflow/(outflow) from financing activities               645,456      (50,992)

Net cash (outflow)/inflow                                     (2,037,881)     2,046,233

RECONCILIATION OF NET CASH FLOW TO MOVEMENT IN NET FUNDS

Net cash (outflow)/inflow                                     (2,037,881)     2,046,233
Exchange movements                                                  (549)      (30,237)
Net cash at beginning of period                                 3,250,789       342,697

Net cash at end of period                                       1,212,359     2,358,693


                              CHAIRMAN'S STATEMENT


As you will see from the report of the Investment Manager, the first half was
relatively quiet with the company performing better than the benchmark. This
again justifies the strategy of investing in fundamentally good businesses which
are undervalued by the equity markets where active management can assist in
unlocking value.

The Company reaches its tenth anniversary next year and it is your board's
intention to put forward proposals during the first quarter concerning the
future of the Company. A special resolution will be included in the 2005 Annual
General Meeting to wind the Company up, however following consultation with a
number of shareholders, it is believed that this resolution will not be favoured
by the majority of them. Should the shareholders want the Company to continue
its current activities the future of the Company will be re discussed in 2007
and every two years thereafter.

In line with our stated policy, your Board do not propose paying a dividend.
However, we have continued with our policy of buying back shares when discounts
allow. During the period the Fund acquired 5000 Convertible Loan Notes and
763,950 warrants for cancellation. The purchase price was at a discount to net
asset value and therefore benefited all shareholders.


Nigel Cayzer
Chairman


                          INVESTMENT ADVISER'S REPORT

The Fund continued to perform acceptably during the six month period rising by
3.5% as compared with a fall in the FTSE Small Cap Index of 3.0%.

During the period the market drifted within a tight band making it difficult to
deliver exceptional performance.

Certain stocks did however perform well. Mentmore rose by 7% on the completion
of the takeover; Paramount rose by 17% due to a proposed takeover and Hartstone
Prefs rose by nearly 20% for similar reasons. Finally Whatman also performed
well rising by nearly 10%.

This good performance was to some extent offset by Ennstone which fell by nearly
13% and Austin Reed falling by 8%.

There were no changes in the unquoted portfolio (other than the completion of
the sale of Executive Air Support) during the period. However, negotiations have
started to sell Waterbury which, if successful, would be at a substantial
premium to the current valuation.

During the period the Company acquired 5,000 convertible loan notes and 763,950
warrants for cancellation. The purchase price was at a discount to net asset
value and therefore benefited all shareholders.

The stock market is currently benefiting from a not untypical fourth quarter
rally. Notwithstanding this, we remain concerned about rising inflation and
interest rate control with a level of consumer debt which, in our opinion, is
unsustainable over the long term.

The Trust however has a portfolio of special situations which we believe have
the potential to give positive absolute return over the balance of the current
financial year.


North Atlantic Value LLP


                      This information is provided by RNS
            The company news service from the London Stock Exchange
END

IR FFLFLZLBEFBZ
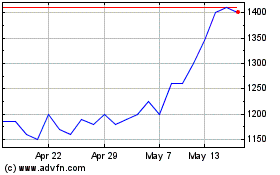
Oryx International Growth (LSE:OIG)
Historical Stock Chart
From Jun 2024 to Jul 2024

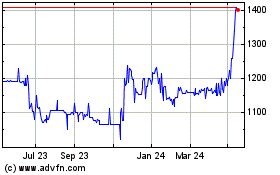
Oryx International Growth (LSE:OIG)
Historical Stock Chart
From Jul 2023 to Jul 2024
