BlackRock Income Portfolio Update
March 15 2023 - 9:55AM
UK Regulatory
TIDMBRIG

The information contained in this release was correct as at 28 February 2023.
Information on the Company's up to date net asset values can be found on the
London Stock Exchange website at:

https://www.londonstockexchange.com/exchange/news/market-news/
market-news-home.html.

BLACKROCK INCOME & GROWTH INVESTMENT TRUST PLC (LEI:5493003YBY59H9EJLJ16)

All information is at 28 February 2023 and unaudited.

Performance at month end with net income reinvested

                                   One    Three        One    Three       Five     Since
                                 Month   Months       Year    Years      Years   1 April
                                                                                    2012

Sterling

Share price                       0.3%     2.2%      11.2%    21.7%      17.8%    114.7%

Net asset value                   1.8%     5.7%       8.1%    28.2%      29.0%    117.1%

FTSE All-Share Total Return       1.5%     4.6%       7.3%    28.9%      29.2%    111.4%

Source: BlackRock

BlackRock took over the investment management of the Company with effect from 1
April 2012.

At month end

Sterling:

Net asset value - capital only:                                              211.84p

Net asset value - cum income*:                                               213.02p

Share price:                                                                 190.50p

Total assets (including income):                                              £48.7m

Discount to cum-income NAV:                                                    10.6%

Gearing:                                                                        5.2%

Net yield**:                                                                    3.8%

Ordinary shares in issue***:                                              20,968,251

Gearing range (as a % of net assets):                                          0-20%

Ongoing charges****:                                                            1.2%


* Includes net revenue of 1.18 pence per share

** The Company's yield based on dividends announced in the last 12 months as at
the date of the release of this announcement is 3.8% and includes the 2022
interim dividend of 2.60p per share declared on 22 June 2022 with pay date 1
September 2022 and the 2022 final dividend of 4.70p per share declared on 1
February 2023 with pay date 15 March 2023.

*** excludes 10,081,532 shares held in treasury.

**** The Company's ongoing charges are calculated as a percentage of average
daily net assets and using management fee and all other operating expenses
excluding finance costs, direct transaction costs, custody transaction charges,
VAT recovered, taxation and certain non-recurring items for the year ended 31
October 2022.


Sector Analysis                                                     Total assets (%)

Support Services                                                                11.0

Pharmaceuticals & Biotechnology                                                 10.1

Oil & Gas Producers                                                              9.5

Banks                                                                            9.4

Media                                                                            7.7

Financial Services                                                               6.7

Mining                                                                           6.4

Household Goods & Home Construction                                              6.3

Personal Goods                                                                   4.0

General Retailers                                                                4.0

Health Care Equipment & Services                                                 3.1

Life Insurance                                                                   3.0

Tobacco                                                                          2.8

Electronic & Electrical Equipment                                                2.7

Food Producers                                                                   2.6

Nonlife Insurance                                                                1.8

Gas, Water & Multiutilities                                                      1.3

Fixed Line Telecommunications                                                    1.2

Real Estate Investment Trusts                                                    1.2

Leisure Goods                                                                    1.0

Travel & Leisure                                                                 0.7

Net Current Assets                                                               3.5

                                                                               -----

Total                                                                          100.0

                                                                               =====


Country Analysis                                                          Percentage


United Kingdom                                                                  90.2

France                                                                           2.1

Switzerland                                                                      2.1

United States                                                                    2.1

Net Current Assets                                                               3.5

                                                                               -----

                                                                               100.0

                                                                               =====


Top 10 holdings                                                               Fund %


Shell                                                                            7.6

AstraZeneca                                                                      7.1

RELX                                                                             4.9

Rio Tinto                                                                        4.3

Reckitt Benckiser                                                                4.0

3i Group                                                                         3.8

Standard Chartered                                                               3.7

Smith & Nephew                                                                   3.1

Phoenix Group                                                                    3.0

Unilever                                                                         2.9

Commenting on the markets, representing the Investment Manager noted:

Performance Overview:

The Company returned 1.8% during the month, outperforming the FTSE All-Share
which returned 1.5%.

The FTSE All Share Index rose 1.5% during the month with Oil & Gas,
Telecommunications and Health Care as top performing sectors while Basic
Materials and Technology underperformed.

The bigger than expected fall in UK inflation prompted a repricing of Bank of
England rate expectations and helped the FTSE 100 to break the 8000 barrier1
for the first time.

The Oil & Gas sector saw strength despite a flat oil price as holdings
including Shell reported better than expected results.

The Bank of England hiked interest rates by 50bps2 as expected but signalled it
was closer to pausing. This move was matched by the European Central Bank as
the Euro area Q4 GDP data showed a marked slowing of growth in the second half
of the year and outright contraction in the four largest European economies.

In the US, the annual rate of the personal consumption expenditures (PCE) index
rose to 4.6%3 in January, missing economists' expectations for a moderation to
4.3%. The CPI for January also showed that core inflation is proving persistent
and is not consistent with prior market hopes of a quick return to the Federal
Reserve's 2% target. The labour market showed few signs of cooling with the
tightness persisting due to a lack of supply, leading to higher job postings.
There was a clear services story in the January payrolls report, with the
majority of the new jobs created in the services sector. In addition, the S&P
Global US Flash Composite purchasing managers' index (PMI) rose to its highest
level since June 2022. These CPI and PMI revisions and the payrolls data showed
the tightest labour market in half a century. The Fed went on to deliver a
25bps4 hike and asserted "it is only the early stage" of the disinflation
process.

Stocks:

Standard Chartered was the top positive contributor to performance during the
period. While short term results were a touch weaker on provisions, the shares
rose in response a mix of greater optimism from management in achieving their
return on equity targets through an expanding net interest margin alongside
further bid speculation.

RELX was another top positive contributor; organic growth for 2022 was ahead of
expectations as the Risk division continues to compound at a high rate while
Legal and STM are benefitting from new product investment in data analytics.

The share prices of Tate & Lyle and Smith & Nephew also rose after both
companies delivered strong results.

Watches of Switzerland was a top detractor from performance during the month as
the company's share price fell on the back of their Q3 results. While the sales
growth slowed down in Q3 versus H1, this was predominantly driven by jewellery,
which fell mainly on the back of the company's own decision not to discount and
to hold its price premium versus competition.

Rio Tinto and BHP also detracted from performance as miners saw general
weakness during the period.

Changes:

Trading activity was limited during the period; we reduced positions in British
American Tobacco and Moonpig.

Outlook:

Inflation has consistently surprised in its depth and breadth, driven by
resilient demand, supply chain constraints, and most importantly by rising
wages in more recent data. Central banks across the developed world continue to
unwind ten years of excess liquidity by tightening monetary policy, desperate
to prevent the entrenchment of higher inflation expectations. Meanwhile, the
risk of policy error from central banks or politicians remains high, as
evidenced by the turmoil created by the 'mini-budget' in the UK that sent gilts
spiralling. The cost and availability of credit has changed and strengthens our
belief in investing in companies with robust balance sheets capable of funding
their own growth. The rise in the risk-free or discount rate also challenges
valuation frameworks especially for long duration, high growth or highly valued
businesses. We are mindful of this and feel it is incredibly important to focus
on companies with strong, competitive positions, at attractive valuations that
can deliver in this environment.

The political and economic impact of the war in Ukraine has been significant in
uniting Europe and its allies, whilst exacerbating the demand/supply imbalance
in the oil and soft commodity markets. We are conscious of the impact this has
on the cost of energy, and we continue to expect divergent regional monetary
approaches with the US being somewhat more insulated from the impact of the
conflict, than for example, Europe. Complicating this further, is the continued
impact COVID is having on certain parts of the world, notably China, which has
used lockdowns to control the spread of the virus impacting economic activity.
We also see the potential for longer-term inflationary pressure from
decarbonisation and deglobalisation, the latter as geopolitical tensions rise
more broadly across the world.

We would expect broader demand weakness as we enter 2023 although the 'scars'
of supply chain disruption are likely to support parts of industrial capital
expenditure demand as companies seek to enhance the resilience of their supply
chains. A notable feature of our conversations with a wide range of corporates
has been the ease with which they have been able to pass on cost increases and
protect or even expand margins during 2022, as evidenced by US corporate
margins reaching 70-year highs. We believe that as demand weakens and as the
transitory inflationary pressures start to fade during 2023 (e.g. commodity
prices, supply chain disruption) then pricing conversations will become more
challenging, despite pressure from wage inflation which may prove more
persistent. While this does not bode well for margins in aggregate, we believe
that 2023 will see greater differentiation as corporates' pricing power will
come under intense scrutiny.

The UK's policy has somewhat diverged from the G7 in fiscal policy terms as the
present government attempts to create stability after the severe reaction from
the "mini-budget". The early signs of stability are welcome as financial market
liquidity has increased and the outlook, whilst challenged, has improved.
Although the UK stock market retains a majority of internationally weighted
revenues, the domestic facing companies have continued to be impacted by this
backdrop, notably financials, housebuilders and property companies. The
valuation of the UK market remains highly supportive as currency weakness
supports international earnings, whilst domestic earners are in many cases at
COVID or Brexit lows in share price or valuation terms. Although we anticipate
further volatility ahead as earnings estimates moderate, we know that in the
course of time, risk appetites will return and opportunities are emerging.

We continue to focus the portfolio on cash generative businesses with durable,
competitive advantages boasting strong leadership as we believe these companies
are best-placed to drive returns over the long-term.  We anticipate economic
and market volatility will persist in 2023 and we are excited by the
opportunities this will likely create by identifying those companies using this
cycle to strengthen their long-term prospects as well as attractive turnarounds
situations.

1 Source: Investment Week, February 2023: https://www.investmentweek.co.uk/news
/4074541/ftse-100-breaks-historic-barrier#::text=
The%20FTSE%20100%20has%20broken,8%2C045.89%20at%20time%20of%20writing.

2 Source: Bank of England, February 2023:  https://www.bankofengland.co.uk/
monetary-policy-summary-and-minutes/2023/february-2023

3 Source: Financial Times, February 2023:  https://www.ft.com/content/
87593f86-501d-4e28-ac1f-bb72127bcc7f

4 Source: Financial Times, February 2023:  https://www.ft.com/content/
03b5354d-ad3c-4bfd-b1cc-c64d46dfdf28

15 March 2023


END
(END) Dow Jones Newswires
March 15, 2023 09:55 ET (13:55 GMT)
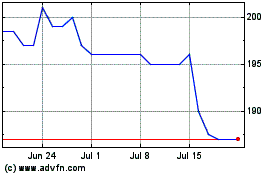
Blackrock Income And Gro... (LSE:BRIG)
Historical Stock Chart
From Aug 2024 to Sep 2024

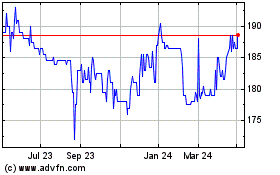
Blackrock Income And Gro... (LSE:BRIG)
Historical Stock Chart
From Sep 2023 to Sep 2024
