Pence Pence
All items in the above Consolidated Statement of Comprehensive
Income derive from continuing operations.
Consolidated Balance Sheet
as at 31 December 2011
                                                      2011           2010
                                                       GBP            GBP
 ASSETS
 Non-current assets
 Freehold investment properties                137,181,065    119,911,195
 Leasehold investment properties                20,031,594     31,481,594
 Lease incentives                                3,516,748      3,273,974
                                               160,729,407    154,666,763

 Investment property held for sale                 998,000              -

 Current assets
 Trade and other receivables                     1,642,602      1,607,101
 Prepaid expenses                                  675,462              -
 Cash and cash equivalents                      17,825,381     21,170,716

 Total assets                                  181,870,852    177,444,580

 EQUITY
 Capital and reserves attributable
 to Company's equity holders
 Share capital                                  20,440,011      6,671,438
 Retained earnings                               6,349,453      5,158,901
 Capital reserves                             (37,372,610)   (36,638,104)
 Other distributable reserves                   97,838,372     98,138,586
 Total equity                                   87,255,226     73,330,821

 LIABILITIES
 Non-current liabilities
 Bank borrowings                                84,238,408     84,140,896
 Interest rate swaps                             3,007,460      4,578,987
 Redeemable preference shares                            -      9,041,060
 Other liabilities                                   6,094          6,094
 Rental deposits due to tenants                    341,660        450,799
                                                87,593,622     98,217,836
 Current liabilities
 Trade and other payables                        3,955,266      3,079,758
 Interest rate swaps                             3,066,238      2,815,665
 Other liabilities                                     500            500
                                                 7,022,004      5,895,923
 Total liabilities                              94,615,626    104,113,759

 Total equity and liabilities                  181,870,852    177,444,580
Approved by the Board of Directors on 23 March 2011
Consolidated Statement of Charges in Equity
for the year ended 31 December 2011
                                                                                    Other
                             Share     Share      Retained        Capital   distributable
                                                                                                  Total
                           capital   premium      earnings       reserves        reserves        equity
                               GBP       GBP           GBP            GBP             GBP           GBP
 Opening balance
  1 January 2011         6,671,438         -     5,158,901   (36,638,104)      98,138,586    73,330,821

 Profit for
  the year                       -         -     4,180,116              -               -     4,180,116
 Valuation gain
  on cash flow
  hedges                         -         -             -      1,320,954               -     1,320,954
 Total comprehensive
  income for
  the year                       -         -     4,180,116      1,320,954               -     5,501,070

 Ordinary shares
  issued                13,768,573         -             -              -               -    13,768,573
 Dividends Paid                  -         -   (5,345,238)              -               -   (5,345,238)
 Valuation loss
  from investment
  properties                     -         -     2,668,105    (2,668,105)               -             -
 Profit on disposal
  of investment
  properties                     -         -     (612,645)        612,645               -             -
 Transfer between
  reserves*                      -         -       300,214              -       (300,214)             -
 Balance as
  at 31 December
  2011                  20,440,011         -     6,349,453   (37,372,610)      97,838,372   87,255,226
*this is a transfer to move redeemable preference share finance
costs from the retained earnings reserve to the other distributable
reserves
Consolidated Statement of Charges in Equity
for the year ended 31 December 2010
                                                                                       Other
                            Share         Share      Retained        Capital   distributable
                                                                                                     Total
                          capital       premium      earnings       reserves        reserves        equity
                              GBP           GBP           GBP            GBP             GBP           GBP
 Opening balance
  1 January 2010        6,671,438     5,217,022     6,662,276   (46,055,762)      93,433,322    65,928,296

 Profit for
  the year                      -             -    13,895,179              -               -    13,895,179
 Valuation loss
  on cash flow
  hedges                        -             -             -    (1,287,454)               -   (1,287,454)
 Total comprehensive
  income for
  the year                      -             -    13,895,179    (1,287,454)               -    12,607,725

 Dividends                      -             -   (5,205,200)              -               -   (5,205,200)
 Valuation gain
  from investment
  properties                    -             -   (6,909,885)      6,909,885               -             -
 Profit on disposal
  of investment
  properties                    -             -   (3,795,227)      3,795,227               -             -
 Transfer between
  reserves*                     -             -       511,758              -       (511,758)             -
 Transfer between
  reserves**                    -   (5,217,022)             -              -       5,217,022             -
 Balance as
  at 31 December
  2010                  6,671,438             -     5,158,901   (36,638,104)      98,138,586    73,330,821
*this is a transfer to move redeemable preference share finance
costs from the retained earnings reserve to the other distributable
reserves
** on 18 March 2010 the Audit Committee approved the
re-categorisation of the share premium to other distributable
reserves under the provisions of The Companies (Guernsey) Law,
2008.
Consolidated Cash Flow Statement
for the year ended 31 December 2011
                                                         2011           2010
                                                          GBP            GBP

 Cash flows from operating activities              11,965,530      8,291,372

 Cash flows from investing activities
 Finance income                                        51,732         91,338
 Purchase of investment property                 (22,274,624)   (32,430,642)
 Capital expenditure on investment properties       (747,844)   (10,767,410)
 Proceeds from disposal of investment
  properties                                       14,175,639     35,325,327
 Net cash used in investing activities            (8,795,097)    (7,781,387)

 Cash flows from financing activities
 Ordinary shares issued net of issue costs          4,427,299              -
 Bank borrowing arrangement costs                   (675,462)              -
 Interest paid on bank borrowings                 (1,774,420)    (1,719,974)
 Payment on interest rate swaps                   (3,147,947)    (3,211,093)
 Dividends paid to the Company's shareholders     (5,345,238)    (5,205,200)
 Net cash used in financing activities            (6,515,768)   (10,136,267)

 Net decrease in cash and cash equivalents
  in the year                                     (3,345,335)    (9,626,282)

 Cash and cash equivalents at beginning
  of the year                                      21,170,716     30,796,998
 Cash and cash equivalents at end of year          17,825,381     21,170,716
Standard Life Investments Property Income Trust Limited
Notes to the Consolidated Financial Statements
For the year ended 31 December 2011
1. Accounting Polices
The accounting policies adopted are consistent with those of the
previous financial year, except that the group has adopted the
following new and amended IFRS interpretations as of 1 January
2011:
IAS 24 Related Party Disclosures (amendment) effective 1 January
2011.
IAS 32 Financial Instruments: Presentation (amendment) effective
1 February 2010.
Improvements to IFRSs (May 2010).
2. Significant accounting judgements, estimates and assumptions
The preparation of the Group's financial statements requires
management to make judgements, estimates and assumptions that
affect the reported amounts of revenues, expenses, assets and
liabilities, and the disclosure of contingent liabilities, at the
reporting date. However, uncertainty about these assumptions and
estimates could result in outcomes that could require material
adjustment to the carrying amount of the asset or liability
affected in the future periods.
Going Concern
The Group's management has made an assessment of the Group's
ability to continue as a going concern and is satisfied that the
Group has the resources to continue in business for the foreseeable
future. Furthermore, management is not aware of any material
uncertainties that may cast significant doubt upon the Group's
ability to continue as a going concern. Therefore, the financial
statements continue to be prepared on the going concern basis.
Fair value of investment properties
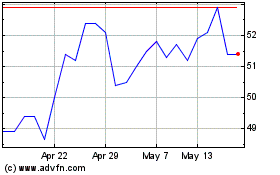
Abrdn Property Income (LSE:API)
Historical Stock Chart
From Jun 2024 to Jul 2024

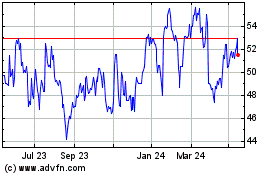
Abrdn Property Income (LSE:API)
Historical Stock Chart
From Jul 2023 to Jul 2024
