Saul Centers, Inc. Reports First Quarter Earnings BETHESDA, Md.,
April 22 /PRNewswire/ -- Saul Centers, Inc. , an equity real estate
investment trust (REIT), announced its first quarter operating
results. Total revenues for the quarter ended March 31, 2004
increased 10.4% to $26,341,000 compared to $23,870,000 for the 2003
quarter. Operating income before minority interests and preferred
stock dividends increased 27.4% to $8,329,000 compared to
$6,539,000 for the comparable 2003 quarter. The Company reported
net income available to common stockholders (after deducting
preferred stock dividends) of $4,305,000 or $.27 per share for the
2004 quarter, a per share decrease of 6.9% compared to net income
available to common stockholders of $4,519,000 or $0.29 per share
for the 2003 quarter (basic & diluted). Overall same property
operating income for the total portfolio increased 5.0% for the
2004 first quarter compared to the same period in 2003. The same
property comparisons exclude the results of operations of
development and acquisition properties not in operation for each of
the quarterly. Operating income is calculated as total revenue less
property operating expenses, provision for credit losses and real
estate taxes. Same center operating income in the shopping center
portfolio increased 4.9% for the 2004 first quarter. Same property
operating income in the office portfolio grew 5.3% for the 2004
quarter. As of March 31, 2004, 94.2% of the portfolio was leased,
compared to 93.0% a year earlier. The comparative increase in the
2004 leasing percentage is largely attributable to the leasing of
approximately 75,000 square feet of space at 601 Pennsylvania
Avenue, which was vacant at the end of the 2003 quarter, following
the expiration of a major lease. Funds From Operations (FFO)
available to common shareholders (after deducting preferred stock
dividends), increased 3.6% to $10,967,000 in the 2004 first quarter
compared to $10,581,000 for the same quarter in 2003. While FFO
available to common shareholders increased by only $386,000, the
2004 results include payment of $2,000,000 in preferred dividends
relating to the November 2003 offering. Property operating income
from retail acquisitions and development, reduced interest expense,
and successful leasing efforts which contributed to same center
operating income growth have exceeded the effect of these preferred
dividend payments. On a fully diluted per share basis, FFO
available to common shareholders was $0.52 per share for both of
the 2004 and 2003 quarters. FFO, a widely accepted non-GAAP
financial measure of operating performance for real estate
investment trusts, is defined as net income, plus minority
interests, extraordinary items and real estate depreciation and
amortization, excluding gains and losses from property sales. Saul
Centers is a self-managed, self-administered equity real estate
investment trust headquartered in Bethesda, Maryland. Saul Centers
currently operates and manages a real estate portfolio of 38
community and neighborhood shopping center and office properties
totaling approximately 6.9 million square feet of leasable area.
Over 80% of the Company's cash flow is generated from properties in
the metropolitan Washington, DC/Baltimore area. Saul Centers, Inc.
Condensed Consolidated Balance Sheets ($ in thousands) March 31,
December 31, 2004 2003 (Unaudited) Assets Real estate investments
Land $99,411 $82,256 Buildings 479,843 436,487 Construction in
progress 38,461 33,372 617,715 552,115 Accumulated depreciation
(168,705) (164,823) 449,010 387,292 Cash and cash equivalents 6,100
45,244 Accounts receivable and accrued income, net 15,570 14,642
Prepaid expenses 21,031 18,977 Deferred debt costs, net 4,498 4,224
Other assets 3,350 1,237 Total assets $499,559 $471,616 Liabilities
Notes payable $379,269 $357,248 Dividends and distributions payable
10,260 9,454 Accounts payable, accrued expenses and other
liabilities 11,221 7,793 Deferred income 4,579 4,478 Total
liabilities 405,329 378,973 Stockholders' Equity (Deficit)
Preferred stock 100,000 100,000 Common stock 160 159 Additional
paid in capital 94,986 91,469 Accumulated deficit (100,916)
(98,985) Total stockholders' equity (deficit) 94,230 92,643 Total
liabilities and stockholders' equity (deficit) $499,559 $471,616
Saul Centers, Inc. Condensed Consolidated Statements of Operations
(Unaudited) (In thousands, except per share amounts) Three Months
Ended March 31, 2004 2003 Revenue Base rent $21,276 $19,051 Expense
Recoveries 3,894 3,805 Percentage Rent 444 449 Other 727 565 Total
revenue 26,341 23,870 Operating Expenses Property operating
expenses 2,892 3,029 Provision for credit losses 69 36 Real estate
taxes 2,392 2,131 Interest expense 6,049 6,494 Amortization of
deferred debt expense 216 198 Depreciation and amortization 4,638
4,042 General and administrative 1,756 1,401 Total operating
expenses 18,012 17,331 Operating Income 8,329 6,539 Minority
Interests (2,024) (2,020) Net Income 6,305 4,519 Preferred
Dividends (2,000) - Net Income Available to Common Stockholders
$4,305 $4,519 Per Share Amounts: Net income available to common
stockholders (basic) $0.27 $0.29 Net income available to common
stockholders (fully diluted) $0.27 $0.29 Weighted average common
stock outstanding: Common stock 15,947 15,330 Effect of dilutive
options 27 9 Fully diluted weighted average common stock 15,974
15,339 Saul Centers, Inc. Supplemental Information (Unaudited) (In
thousands, except per share amounts) Three Months Ended March 31,
2004 2003 Reconciliation of Net Income to Funds From Operations
(FFO) (1) Net Income $6,305 $4,519 Add: Real property depreciation
& amortization 4,638 4,042 Add: Minority Interests 2,024 2,020
FFO 12,967 10,581 Less: Preferred dividends (2,000) - FFO available
to common shareholders $10,967 $10,581 Per Share Amounts (basic and
fully diluted): FFO available to common shareholders $0.52 $0.52
Weighted average shares outstanding: Fully diluted weighted average
common stock 15,974 15,339 Convertible limited partnership units
5,190 5,177 Fully diluted & converted weighted average shares
21,164 20,516 Reconciliation of Net Income to Same Property
Operating Income (2) Net Income $6,305 $4,519 Add: Interest expense
6,049 6,494 Add: Amortization of deferred debt expense 216 198 Add:
Depreciation and amortization 4,638 4,042 Add: General and
administrative 1,756 1,401 Add: Minority Interests 2,024 2,020
Property operating income 20,988 18,674 Less: Acquisition &
developments (1,376) - Total same property operating income $19,612
$18,674 Total Shopping Centers $13,197 $12,581 Total Office
Properties 6,415 6,093 Total same property operating income $19,612
$18,674 (1) FFO is a widely accepted non-GAAP financial measure of
operating performance of real estate investment trusts ("REITs").
FFO is defined by the National Association of Real Estate
Investment Trusts as net income, computed in accordance with GAAP,
plus minority interests, extraordinary items and real estate
depreciation and amortization, excluding gains or losses from
property sales. FFO does not represent cash generated from
operating activities in accordance with GAAP and is not necessarily
indicative of cash available to fund cash needs, which is disclosed
in the Consolidated Statements of Cash Flows in the Company's SEC
reports for the applicable periods. FFO should not be considered as
an alternative to net income, its most directly comparable GAAP
measure, as an indicator of the Company's operating performance, or
as an alternative to cash flows as a measure of liquidity.
Management considers FFO a supplemental measure of operating
performance and along with cash flow from operating activities,
financing activities and investing activities, it provides
investors with an indication of the ability of the Company to incur
and service debt, to make capital expenditures and to fund other
cash needs. FFO may not be comparable to similarly titled measures
employed by other REITs. (2) Although same property operating
income and property operating income are GAAP financial measures,
the Company has elected to present a reconciliation of the measures
to net income. DATASOURCE: Saul Centers, Inc. CONTACT: Scott V.
Schneider of Saul Centers, Inc., +1-301-986-6220 Web site:
http://www.saulcenters.com/
Copyright
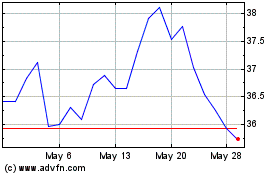
Saul Centers (NYSE:BFS)
Historical Stock Chart
From Jun 2024 to Jul 2024

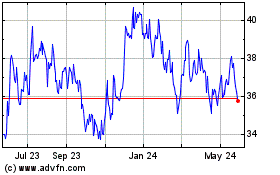
Saul Centers (NYSE:BFS)
Historical Stock Chart
From Jul 2023 to Jul 2024
