Saul Centers, Inc. Reports Third Quarter Operating Results
BETHESDA, Md., Nov. 5 /PRNewswire-FirstCall/ -- Saul Centers, Inc.
, an equity real estate investment trust (REIT), announced its
third quarter operating results. Total revenues for the quarter
ended September 30, 2003 increased 5.1% to $24,659,000 compared to
$23,471,000 for the 2002 quarter. Operating income before gain on
property sold and minority interests increased 27.8% to $7,035,000
compared to $5,503,000 for the comparable 2002 quarter. The Company
reported net income of $5,012,000 or $.32/share for the 2003
quarter, a per share increase of 33.3% compared to net income of
$3,486,000 or $0.24/share for the 2002 quarter (basic &
diluted). For the nine month period ending September 30, 2003,
total revenues increased 3.3% to $71,755,000 compared to
$69,455,000 for the 2002 period. Operating income before gain on
property sold and minority interests increased 3.5% to $19,590,000
compared to $18,928,000 for the comparable 2002 period. The Company
reported net income of $13,527,000 or $.87/share for the 2003
period, a per share decrease of 10.3% compared to net income of
$14,303,000 or $0.97/share for the 2002 period (basic &
diluted). Net income in the 2002 nine month period included
recognition of a gain on property sold of $1,426,000 when it was
awarded a final settlement for the condemnation and purchase of the
Company's Park Road property by the District of Columbia. Overall
same property net operating income for the total portfolio
increased 0.6% for the 2003 third quarter and decreased 1.2% for
the 2003 nine month period compared to the same periods in 2002.
Net operating income is calculated as total revenue less property
operating expenses, provision for credit losses and real estate
taxes. The same property comparisons exclude Ashburn Village Phase
IV, placed in service during the summer of 2002, Kentlands Square
acquired in September 2002 and Old Forte Village acquired July
2003. Same center net operating income in the shopping center
portfolio increased 0.5% for the 2003 third quarter and decreased
1.1% for the 2003 nine month period. The decrease in same center
net operating income in the shopping center portfolio for the nine
month period was primarily attributable to increased current year
snow removal expenses. Same center net operating income in the
office portfolio increased 0.8% for the 2003 third quarter and
decreased 1.3% for the 2003 nine month period compared to the same
period in 2002. Net operating income in the office portfolio during
the quarter and nine month periods ended September 30, 2003 was
adversely impacted by the February 2003 expiration of a major
tenant lease (120,000 square feet, 53% of the leasable area) at 601
Pennsylvania Avenue. As of September 30, 2003, 601 Pennsylvania
Avenue was 91.4% leased. As of September 30, 2003, 93.8% of the
portfolio was leased, compared to 94.3% a year earlier. This
decrease in the percentage of space leased is primarily due to
approximately 50,000 square feet of redevelopment space at the
recently acquired Old Forte Village shopping center. Funds From
Operations (FFO), a widely accepted non-GAAP financial measure of
operating performance for real estate investment trusts, increased
4.5% to $11,584,000 in the 2003 third quarter compared to
$11,081,000 for the same quarter in 2002. FFO is defined as net
income, plus minority interests, extraordinary items and real
estate depreciation and amortization, excluding gains and losses
from property sales. On a fully diluted per share basis, FFO was
$0.55 per share for both of the 2003 and 2002 third quarters. For
the nine month period ending September 30, 2003, FFO decreased 1.0%
to $32,466,000 compared to $32,810,000 for the 2002 period. On a
fully diluted per share basis, FFO was $1.57 per share for the 2003
nine month period, a 4.3% decrease from $1.64 per share for the
same period last year. The decrease in the nine month FFO was
primarily attributable to decreased net operating income at the
Company's 601 Pennsylvania Avenue office building. Saul Centers is
a self-managed, self-administered equity real estate investment
trust headquartered in Bethesda, Maryland. Saul Centers currently
operates and manages a real estate portfolio of 36 community and
neighborhood shopping center and office properties totaling
approximately 6.6 million square feet of leasable area. Over 80% of
the Company's cash flow is generated from properties in the
metropolitan Washington, DC/Baltimore area. Saul Centers, Inc.
Condensed Consolidated Balance Sheets ($ in thousands) September
30, December 31, 2003 2002 Assets (Unaudited) Real estate
investments Land $ 95,878 $ 90,469 Buildings 420,596 405,153
Construction in progress 20,698 8,292 537,172 503,914 Accumulated
depreciation (161,153) (150,286) 376,019 353,628 Cash and cash
equivalents 2,169 1,309 Accounts receivable and accrued income, net
13,249 12,505 Prepaid expenses 19,567 15,712 Deferred debt costs,
net 4,255 4,125 Other assets 2,275 1,408 Total assets $ 417,534 $
388,687 Liabilities Notes payable $ 400,668 $ 380,743 Accounts
payable, accrued expenses and other liabilities 18,115 16,727
Deferred income 4,355 4,484 Total liabilities 423,138 401,954
Stockholders' Equity (Deficit) Common stock 157 152 Additional paid
in capital 91,507 79,131 Accumulated deficit (97,268) (92,550)
Total stockholders' equity (deficit) (5,604) (13,267) Total
liabilities and stockholders' equity (deficit) $ 417,534 $ 388,687
Saul Centers, Inc. Condensed Consolidated Statements of Operations
(Unaudited) (In thousands, except per share amounts) Three Months
Ended Nine Months Ended September 30, September 30, 2003 2002 2003
2002 Revenue Base rent $ 19,751 $ 19,184 $ 57,733 $ 56,532 Expense
Recoveries 3,303 3,207 10,473 9,317 Percentage Rent 438 446 1,102
1,220 Other 1,167 634 2,447 2,386 Total revenue 24,659 23,471
71,755 69,455 Operating Expenses Property operating expenses 2,653
2,441 8,261 7,165 Provision for credit losses 26 131 118 402 Real
estate taxes 2,130 1,947 6,391 5,917 Interest expense 6,566 6,335
19,526 18,757 Amortization of deferred debt expense 201 180 598 504
Depreciation and amortization 4,549 5,578 12,876 13,882 General and
administrative 1,499 1,356 4,395 3,900 Total operating expenses
17,624 17,968 52,165 50,527 Operating Income 7,035 5,503 19,590
18,928 Gain on property disposition - - - 1,426 Minority Interests
(2,023) (2,017) (6,063) (6,051) Net Income $ 5,012 $ 3,486 $ 13,527
$ 14,303 Per Share Amounts: Net income (basic) $ 0.32 $ 0.24 $ 0.87
$ 0.97 Net income (fully diluted) $ 0.32 $ 0.24 $ 0.87 $ 0.97
Weighted average common stock outstanding: Common stock 15,683
14,924 15,516 14,788 Effect of dilutive options 16 25 14 19 Fully
diluted weighted average common stock 15,699 14,949 15,530 14,807
Saul Centers, Inc. Supplemental Information (Unaudited) (In
thousands, except per share amounts) Three Months Ended Nine Months
Ended September 30, September 30, 2003 2002 2003 2002 Funds From
Operations (FFO)(1) Net Income $ 5,012 $ 3,486 $ 13,527 $ 14,303
Less: Gain on sale of property - - - (1,426) Add: Real property
depreciation & amortization 4,549 5,578 12,876 13,882 Add:
Minority Interests 2,023 2,017 6,063 6,051 Funds From Operations $
11,584 $ 11,081 $ 32,466 $ 32,810 Per Share Amounts(basic and fully
diluted): Funds From Operations $ 0.55 $ 0.55 $ 1.57 $ 1.64
Weighted average shares outstanding: Fully diluted weighted average
common stock 15,699 14,949 15,530 14,807 Convertible limited
partnership units 5,184 5,173 5,181 5,172 Fully diluted &
converted weighted average shares 20,883 20,122 20,711 19,979 Same
Property Net Operating Income (2) Net Income $ 5,012 $ 3,486 $
13,527 $ 14,303 Add: Interest expense 6,566 6,335 19,526 18,757
Add: Amortization of deferred debt expense 201 180 598 504 Add:
Depreciation and amortization 4,549 5,578 12,876 13,882 Add:
General and administrative 1,499 1,356 4,395 3,900 Less: Gain on
property disposition - - - (1,426) Add: Minority Interests 2,023
2,017 6,063 6,051 Property net operating income 19,850 18,952
56,985 55,971 Less: Acquisition & developments (914) (125)
(1,804) (125) Total same property net operating income $ 18,936 $
18,827 $ 55,181 $ 55,846 Total Shopping Centers $ 12,711 $ 12,654 $
37,166 $ 37,595 Total Office Properties 6,225 6,173 18,015 18,251
Total same property net operating income $ 18,936 $ 18,827 $ 55,181
$ 55,846 (1) FFO is a widely accepted non-GAAP financial measure of
operating performance of real estate investment trusts ("REITs").
FFO is defined by the National Association of Real Estate
Investment Trusts as net income, computed in accordance with GAAP,
plus minority interests, extraordinary items and real estate
depreciation and amortization, excluding gains or losses from
property sales. FFO does not represent cash generated from
operating activities in accordance with GAAP and is not necessarily
indicative of cash available to fund cash needs, which is disclosed
in the Consolidated Statements of Cash Flows in the Company's SEC
reports for the applicable periods. FFO should not be considered as
an alternative to net income, its most directly comparable GAAP
measure, as an indicator of the Company's operating performance, or
as an alternative to cash flows as a measure of liquidity.
Management considers FFO a supplemental measure of operating
performance and along with cash flow from operating activities,
financing activities and investing activities, it provides
investors with an indication of the ability of the Company to incur
and service debt, to make capital expenditures and to fund other
cash needs. FFO may not be comparable to similarly titled measures
employed by other REITs. (2) Although same property net operating
income and property net operating income are GAAP financial
measures, the Company has elected to present a reconciliation of
the measures to net income. DATASOURCE: Saul Centers, Inc. CONTACT:
Scott V. Schneider of Saul Centers, Inc., +1-301-986-6220 Web site:
http://www.saulcenters.com/
Copyright
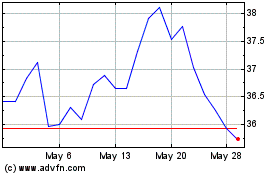
Saul Centers (NYSE:BFS)
Historical Stock Chart
From Jun 2024 to Jul 2024

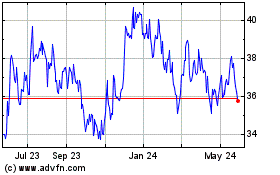
Saul Centers (NYSE:BFS)
Historical Stock Chart
From Jul 2023 to Jul 2024
