BETHESDA, Md., Feb. 22 /PRNewswire-FirstCall/ -- Saul Centers, Inc.
(NYSE:BFS), an equity real estate investment trust (REIT),
announced its operating results for the quarter and year ended
December 31, 2006. Total revenue for the quarter ended December 31,
2006 increased 9.5% to $35,903,000 compared to $32,774,000 for the
2005 quarter. Operating income, defined as net income available to
common stockholders before minority interests and preferred stock
dividends, increased 12.8% to $10,988,000 for the 2006 quarter
compared to $9,740,000 for the comparable 2005 quarter. Net income
available to common stockholders was $6,855,000 or $0.39 per
diluted share for the 2006 quarter, a per share increase of 11.4%
compared to net income available to common stockholders of
$5,890,000 or $0.35 per diluted share for the 2005 quarter. For the
year ended December 31, 2006, total revenue increased 8.6% to
$137,978,000 compared to $127,015,000 for the 2005 year. Operating
income before minority interests and preferred stock dividends
increased 9.3% to $40,473,000 in 2006 compared to $37,025,000 in
2005. Net income available to common stockholders was $24,680,000
or $1.43 per diluted share in 2006, resulting in a per share
increase of 12.6% compared to net income available to common
stockholders of $21,227,000 or $1.27 per diluted share in 2005.
Successful leasing activity at several core shopping centers and
operating income from development properties produced the
significant portion of increased operating income for the 2006
quarter and year. Same property revenue for the total portfolio
increased 3.2% for the 2006 fourth quarter compared to the same
quarter in 2005 and same property operating income increased 4.4%.
The same property comparisons exclude the results of operations of
properties not in operation for each of the comparable reporting
periods. Same property operating income in the shopping center
portfolio increased 5.2% for the 2006 fourth quarter compared to
the prior year's quarter. Same property operating income in the
office portfolio grew 2.4% for the 2006 quarter. Same property
revenue for the total portfolio increased 4.3% for the 2006 year
compared to the 2005 year and same property operating income
increased 4.5%. Same property operating income in the shopping
center portfolio increased 6.0% from 2005 to 2006. Successful
leasing activity at several core shopping centers produced the
significant portion of increased shopping center operating income
for the 2006 quarter and year. Same property operating income in
the office portfolio grew 0.7% for the 2006 year. As of December
31, 2006, excluding development properties, 96.3% of the operating
portfolio was leased, compared to 97.1% a year earlier. The
company's significant development property, the 188,000 square foot
Lansdowne Towne Center, was 85.0% leased at year-end 2006. On a
same property basis, 96.7% of the portfolio was leased, compared to
the prior year level of 97.1%. The 2006 leasing percentages
decreased due to the departure of two local grocery anchors at the
Belvedere and West Park shopping centers totaling 59,000 square
feet. Funds From Operations (FFO) available to common shareholders
(after deducting preferred stock dividends) increased 13.0% to
$15,397,000 in the 2006 fourth quarter compared to $13,628,000 for
the same quarter in 2005. On a diluted per share basis, FFO
available to common shareholders increased 9.8% to $0.67 per share
in 2006 compared to $0.61 per share for the 2005 quarter. FFO, a
widely accepted non-GAAP financial measure of operating performance
for real estate investment trusts, is defined as net income plus
minority interests, extraordinary items and real estate
depreciation and amortization, excluding gains and losses from
property sales. FFO available to common shareholders for the 2006
year increased 9.2% to $58,121,000 compared to $53,222,000 in 2005.
Diluted per share FFO available to common shareholders increased
6.2% to $2.57 per share in 2006 compared to $2.42 per share for the
2005 year. During the 2005 year, the Company included $1,555,000
($0.07 per diluted share) in FFO due to the resolution of a land
use dispute with a property owner adjacent to Lexington Mall. FFO
increased in the 2006 quarter and 2006 year, despite the impact of
the one-time Lexington Mall land use settlement included in the
prior year period, due to increased operating income from
successful leasing activity at several core shopping centers and
operating income from new developments. During 2006, the Company
paid four quarterly dividends to its common stockholders totaling
$1.68 per share, compared to $1.60 paid per share in 2005. On
January 31, 2007, the Company paid a quarterly dividend of $0.42
per share to its common stockholders. Also during 2006, the Company
acquired two grocery anchored shopping centers, Hunt Club Corners
and Smallwood Village Center, totaling 299,000 square feet, and
developed two neighborhood shopping centers, Lansdowne Towne Center
and Broadlands Village III, totaling 211,000 square feet. Saul
Centers is a self-managed, self-administered equity real estate
investment trust headquartered in Bethesda, Maryland. Saul Centers
currently operates and manages a real estate portfolio of 47
community and neighborhood shopping center and office properties
totaling approximately 7.9 million square feet of leasable area.
Over 80% of the Company's property operating income is generated
from properties in the metropolitan Washington, DC/Baltimore area.
Saul Centers, Inc. Condensed Consolidated Balance Sheets ($ in
thousands) December 31, December 31, 2006 2005 Assets (Unaudited)
Real estate investments Land $154,047 $139,421 Buildings and
equipment 631,797 575,504 Construction in progress 56,017 47,868
841,861 762,793 Accumulated depreciation (214,210) (195,376)
627,651 567,417 Cash and cash equivalents 8,061 8,007 Accounts
receivable and accrued income, net 33,248 23,410 Deferred leasing
costs, net 18,137 19,834 Prepaid expenses, net 2,507 2,540 Deferred
debt costs, net 5,328 5,875 Other assets 5,605 4,386 Total assets
$700,537 $631,469 Liabilities Mortgage notes payable $487,443
$471,931 Revolving credit facility 35,000 10,500 Dividends and
distributions payable 11,558 11,319 Accounts payable, accrued
expenses and other liabilities 16,409 13,679 Deferred income 12,251
9,558 Total liabilities 562,661 516,987 Minority Interests 5,785
3,068 Stockholders' Equity Preferred stock 100,000 100,000 Common
stock 173 169 Additional paid in capital 141,554 123,339
Accumulated deficit (109,636) (112,094) Total stockholders' equity
132,091 111,414 Total liabilities and stockholders' equity $700,537
$631,469 Saul Centers, Inc. Condensed Consolidated Statements of
Operations (In thousands, except per share amounts) Three Months
Ended Years Ended December 31, December 31, 2006 2005 2006 2005
Revenue (Unaudited) (Unaudited) Base rent $28,295 $25,784 $110,121
$99,448 Expense recoveries 5,914 5,343 22,636 20,027 Percentage
rent 843 639 1,767 2,057 Other 851 1,008 3,454 5,483 Total revenue
35,903 32,774 137,978 127,015 Operating Expenses Property operating
expenses 4,083 4,031 16,278 14,724 Provision for credit losses 98
54 400 237 Real estate taxes 3,328 2,870 12,503 11,040 Interest
expense and amortization of deferred debt 8,298 7,658 32,534 30,207
Depreciation and amortization of leasing costs 6,409 5,888 25,648
24,197 General and administrative 2,699 2,533 10,142 9,585 Total
operating expenses 24,915 23,034 97,505 89,990 Operating Income
10,988 9,740 40,473 37,025 Minority Interests (2,133) (1,850)
(7,793) (7,798) Net Income 8,855 7,890 32,680 29,227 Preferred
Dividends (2,000) (2,000) (8,000) (8,000) Net Income Available to
Common Stockholders $6,855 $5,890 $24,680 $21,227 Per Share Net
Income Available to Common Stockholders: Diluted $0.39 $0.35 $1.43
$1.27 Weighted Average Common Stock Outstanding: Common stock
17,278 16,840 17,075 16,663 Effect of dilutive options 199 119 158
107 Diluted weighted average common stock 17,477 16,959 17,233
16,770 Saul Centers, Inc. Supplemental Information (In thousands,
except per share amounts) Three Months Ended Years Ended December
31, December 31, 2006 2005 2006 2005 Reconciliation of Net Income
to Funds From Operations (FFO)(1) (Unaudited) (Unaudited) Net
Income $8,855 $7,890 $32,680 $29,227 Add: Real property
depreciation & amortization 6,409 5,888 25,648 24,197 Add:
Minority interests 2,133 1,850 7,793 7,798 FFO 17,397 15,628 66,121
61,222 Less: Preferred dividends (2,000) (2,000) (8,000) (8,000)
FFO available to common shareholders $15,397 $13,628 $58,121
$53,222 Weighted Average Shares Outstanding: Diluted weighted
average common stock 17,477 16,959 17,233 16,770 Convertible
limited partnership units 5,416 5,291 5,395 5,233 Diluted &
converted weighted average shares 22,893 22,250 22,628 22,003 Per
Share Amounts: FFO available to common shareholders $0.67 $0.61
$2.57 $2.42 Reconciliation of Net Income to Same Property Operating
Income Net Income $8,855 $7,890 $32,680 $29,227 Add: Interest
expense and amortization of deferred debt 8,298 7,658 32,534 30,207
Add: Depreciation and amortization of leasing costs 6,409 5,888
25,648 24,197 Add: General and administrative 2,699 2,533 10,142
9,585 Less: Interest income (114) (140) (334) (661) Add: Minority
interests 2,133 1,850 7,793 7,798 Property operating income 28,280
25,679 108,463 100,353 Less: Acquisitions & developments
(1,779) (304) (7,523) (1,828) Less: Lexington property operating
income - - (20) (1,966) Total same property operating income
$26,501 $25,375 $100,920 $96,559 Total Shopping Centers $19,493
$18,532 $73,745 $69,577 Total Office Properties 7,008 6,843 27,175
26,982 Total same property operating income $26,501 $25,375
$100,920 $96,559 (1) The National Association of Real Estate
Investment Trusts (NAREIT) developed FFO as a relative non-GAAP
financial measure of performance of an equity REIT in order to
recognize that income-producing real estate historically has not
depreciated on the basis determined under GAAP. FFO is defined by
NAREIT as net income, computed in accordance with GAAP, plus
minority interests, extraordinary items and real estate
depreciation and amortization, excluding gains or losses from
property sales. FFO does not represent cash generated from
operating activities in accordance with GAAP and is not necessarily
indicative of cash available to fund cash needs, which is disclosed
in the Company's Consolidated Statements of Cash Flows for the
applicable periods. There are no material legal or functional
restrictions on the use of FFO. FFO should not be considered as an
alternative to net income, its most directly comparable GAAP
measure, as a indicator of the Company's operating performance, or
as an alternative to cash flows as a measure of liquidity.
Management considers FFO a meaningful supplemental measure of
operating performance because it primarily excludes the assumption
that the value of the real estate assets diminishes predictably
over time (i.e. depreciation), which is contrary to what we believe
occurs with our assets, and because industry analysts have accepted
it as a performance measure. FFO may not be comparable to similarly
titled measures employed by other REITs. DATASOURCE: Saul Centers,
Inc. CONTACT: Scott V. Schneider of Saul Centers, Inc.,
+1-301-986-6220 Web site: http://www.saulcenters.com/
Copyright
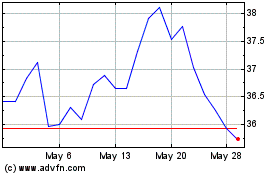
Saul Centers (NYSE:BFS)
Historical Stock Chart
From Jun 2024 to Jul 2024

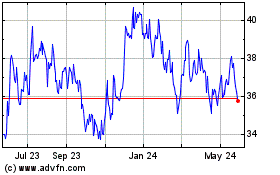
Saul Centers (NYSE:BFS)
Historical Stock Chart
From Jul 2023 to Jul 2024
