BETHESDA, Md., Aug. 8 /PRNewswire-FirstCall/ -- Saul Centers, Inc.
(NYSE:BFS), an equity real estate investment trust, announced its
second quarter 2006 operating results. Total revenues for the
quarter ended June 30, 2006 increased 9.7% to $33,748,000 compared
to $30,752,000 for the 2005 quarter. Operating income before
minority interests and preferred stock dividends increased 7.8% to
$9,648,000 compared to $8,952,000 for the comparable 2005 quarter.
Net income available to common stockholders was $5,797,000 or $0.34
per diluted share for the 2006 quarter, a per share increase of
17.2% compared to $4,871,000 or $0.29 per diluted share for the
2005 quarter. Successful leasing activity at several core shopping
centers and operating income from development properties produced
the significant portion of increased operating income for the 2006
quarter. Overall same property revenues for the total portfolio
increased 4.1% for the 2006 second quarter compared to the same
quarter in 2005 and same property operating income increased 4.0%.
The same property comparisons exclude the results of operations of
properties not in operation for each of the comparable reporting
periods. Property operating income is calculated as total property
revenue less property operating expenses, provision for credit
losses and real estate taxes. Same property operating income in the
shopping center portfolio increased 6.5% for the 2006 second
quarter, compared to the prior year's quarter. Successful leasing
activity at several core shopping centers was the primary
contributor to the improvement in same property results. Same
property operating income in the office portfolio declined 2.3% for
the 2006 quarter, compared to the prior year's quarter, due to
higher lease termination fees recognized in the 2005 quarter. For
the six month period ended June 30, 2006, total revenues increased
10.1% to $67,215,000 compared to $61,059,000 for the 2005 period.
Operating income before minority interests and preferred stock
dividends increased 8.9% to $19,157,000 compared to $17,591,000 for
the comparable 2005 period. Net income available to common
stockholders was $11,504,000 or $0.67 per diluted share for the
2006 period, a per share increase of 17.5% compared to $9,481,000
or $0.57 per diluted share for the 2005 period. Overall same
property revenues for the total portfolio increased 4.3% for the
2006 six month period compared to the same period in 2005 and same
property operating income increased 4.4%. Shopping center same
property operating income increased 6.5% due to successful leasing
activity at several core shopping centers and office same property
operating income declined 1.1% due to higher lease termination fees
recognized in the 2005 period. As of June 30, 2006, 96.7% of the
operating portfolio was leased, compared to 93.2% a year earlier.
The 2005 leasing percentage was adversely affected by the combined
impact of a 113,000 square foot vacancy at Great Eastern Plaza and
133,000 square feet of vacant space in the Lexington Mall which the
Company was not leasing in anticipation of redeveloping the
shopping center. Since September 30, 2005, the Company has been
actively planning the redevelopment of Lexington and has taken the
space out of service. On a same property basis, 96.8% of the
portfolio was leased, compared to the prior year level of 94.8%.
The increase in 2006 leasing percentage resulted from the lease-up
of space at Great Eastern Plaza, Southside Plaza and Olde Forte
Village and to a lesser extent, improved leasing at several other
properties. Funds From Operations (FFO) available to common
shareholders (after deducting preferred stock dividends) increased
12.5% to $14,048,000 in the 2006 second quarter compared to
$12,484,000 for the same quarter in 2005. FFO, a widely accepted
non-GAAP financial measure of operating performance for real estate
investment trusts, is defined as net income, plus minority
interests, extraordinary items and real estate depreciation and
amortization, excluding gains and losses from property sales. On a
diluted per share basis, FFO available to common shareholders
increased 8.8% to $0.62 per share for the 2006 quarter compared to
$0.57 per share for the 2005 quarter. FFO available to common
shareholders for the 2006 six month period increased 12.9% to
$27,933,000 from $24,738,000 during the 2005 period. Fully diluted
per diluted share FFO available to common shareholders increased
9.7% to $1.24 per diluted share for the 2006 six month period
compared to $1.13 per diluted share for the 2005 period. These
increases resulted primarily from increased operating income from
successful leasing activity at several core shopping centers and
operating income from new developments. Saul Centers is a
self-managed, self-administered equity real estate investment trust
headquartered in Bethesda, Maryland. Saul Centers currently
operates and manages a real estate portfolio of 46 community and
neighborhood shopping center and office properties totaling
approximately 7.7 million square feet of leaseable area. Over 80%
of the Company's cash flow is generated from properties in the
metropolitan Washington, DC/Baltimore area. Saul Centers, Inc.
Condensed Consolidated Balance Sheets ($ in thousands) June 30,
December 31, 2006 2005 Assets (Unaudited) Real estate investments
Land $149,863 $139,421 Buildings and equipment 607,119 575,504
Construction in progress 62,577 47,868 819,559 762,793 Accumulated
depreciation (205,122) (195,376) 614,437 567,417 Cash and cash
equivalents 3,045 8,007 Accounts receivable and accrued income, net
23,136 23,410 Leasing costs, net 19,698 19,834 Prepaid expenses,
net 1,473 2,540 Deferred debt costs, net 5,845 5,875 Other assets
6,995 4,386 Total assets $674,629 $631,469 Liabilities Mortgage
notes payable $487,242 $471,931 Revolving credit facility 26,000
10,500 Dividends and distributions payable 11,418 11,319 Accounts
payable, accrued expenses and other liabilities 17,909 13,679
Deferred income 12,546 9,558 Total liabilities 555,115 516,987
Minority Interests 6,194 3,068 Stockholders' Equity Preferred stock
100,000 100,000 Common stock 170 169 Additional paid in capital
128,009 123,339 Accumulated deficit (114,859) (112,094) Total
stockholders' equity 113,320 111,414 Total liabilities and
stockholders' equity $674,629 $631,469 Saul Centers, Inc. Condensed
Consolidated Statements of Operations (In thousands, except per
share amounts) Three Months Ended Six Months Ended June 30, June
30, 2006 2005 2006 2005 Revenue (Unaudited) (Unaudited) Base rent
$27,190 $24,509 $54,090 $48,641 Expense recoveries 5,407 4,700
10,920 9,680 Percentage rent 272 507 598 1,011 Other 879 1,036
1,607 1,727 Total revenue 33,748 30,752 67,215 61,059 Operating
Expenses Property operating expenses 3,963 3,483 7,931 7,256
Provision for credit losses 107 79 187 133 Real estate taxes 2,994
2,757 6,046 5,340 Interest expense and amortization of deferred
debt 8,072 7,615 16,091 15,024 Depreciation and amortization of
leasing costs 6,400 5,532 12,776 11,147 General and administrative
2,564 2,334 5,027 4,568 Total operating expenses 24,100 21,800
48,058 43,468 Operating Income 9,648 8,952 19,157 17,591 Minority
Interests (1,851) (2,081) (3,653) (4,110) Net Income 7,797 6,871
15,504 13,481 Preferred Dividends (2,000) (2,000) (4,000) (4,000)
Net Income Available to Common Stockholders $5,797 $4,871 $11,504
$9,481 Per Share Net Income Available to Common Stockholders:
Diluted $0.34 $0.29 $0.67 $0.57 Weighted Average Common Stock
Outstanding: Common stock 16,993 16,613 16,952 16,540 Effect of
dilutive options 132 94 142 92 Diluted weighted average common
stock 17,125 16,707 17,094 16,632 Saul Centers, Inc. Supplemental
Information (In thousands, except per share amounts) Three Months
Ended Six Months Ended June 30, June 30, 2006 2005 2006 2005
Reconciliation of Net Income (Unaudited) (Unaudited) to Funds From
Operations (FFO)(1) Net Income $7,797 $6,871 $15,504 $13,481 Add:
Real property depreciation & amortization 6,400 5,532 12,776
11,147 Add: Minority interests 1,851 2,081 3,653 4,110 FFO 16,048
14,484 31,933 28,738 Less: Preferred dividends (2,000) (2,000)
(4,000) (4,000) FFO available to common shareholders $14,048
$12,484 $27,933 $24,738 Weighted Average Shares Outstanding:
Diluted weighted average common stock 17,125 16,707 17,094 16,632
Convertible limited partnership units 5,400 5,201 5,374 5,201
Diluted & converted weighted average shares 22,525 21,908
22,468 21,833 Per Share Amounts: FFO available to common
shareholders $0.62 $0.57 $1.24 $1.13 Reconciliation of Net Income
to Same Property Operating Income: Net Income $7,797 $6,871 $15,504
$13,481 Add: Interest expense and deferred debt amortization 8,072
7,615 16,091 15,024 Add: Depreciation and amortization 6,400 5,532
12,776 11,147 Add: General and administrative 2,564 2,334 5,027
4,568 Less: Interest income (99) (157) (166) (297) Add: Minority
interests 1,851 2,081 3,653 4,110 Property operating income 26,585
24,276 52,885 48,033 Less: Acquisitions & developments (1,417)
(45) (3,307) (460) Less: Lexington property operating income 17
(23) (2) (79) Total same property operating income $25,185 $24,208
$49,576 $47,494 Total Shopping Centers $18,604 $17,475 $36,342
$34,112 Total Office Properties 6,581 6,733 13,234 13,382 Total
same property operating income $25,185 $24,208 $49,576 $47,494 (1)
FFO is a widely accepted non-GAAP financial measure of operating
performance of real estate investment trusts ("REITs"). FFO is
defined by the National Association of Real Estate Investment
Trusts as net income, computed in accordance with GAAP, plus
minority interests, extraordinary items and real estate
depreciation and amortization, excluding gains or losses from
property sales. FFO does not represent cash generated from
operating activities in accordance with GAAP and is not necessarily
indicative of cash available to fund cash needs, which is disclosed
in the Consolidated Statements of Cash Flows in the Company's SEC
reports for the applicable periods. FFO should not be considered as
an alternative to net income, its most directly comparable GAAP
measure, as an indicator of the Company's operating performance, or
as an alternative to cash flows as a measure of liquidity.
Management considers FFO a supplemental measure of operating
performance and along with cash flow from operating activities,
financing activities and investing activities, it provides
investors with an indication of the ability of the Company to incur
and service debt, to make capital expenditures and to fund other
cash needs. FFO may not be comparable to similarly titled measures
employed by other REITs. DATASOURCE: Saul Centers, Inc. CONTACT:
Scott V. Schneider of Saul Centers, Inc., +1-301-986-6220 Web site:
http://www.saulcenters.com/
Copyright
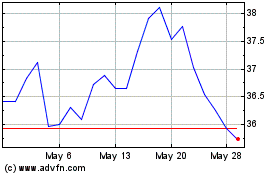
Saul Centers (NYSE:BFS)
Historical Stock Chart
From Jun 2024 to Jul 2024

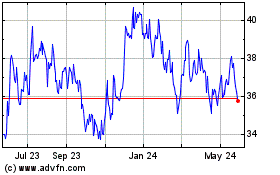
Saul Centers (NYSE:BFS)
Historical Stock Chart
From Jul 2023 to Jul 2024
