BETHESDA, Md., Nov. 8 /PRNewswire-FirstCall/ -- Saul Centers, Inc.
(NYSE:BFS), an equity real estate investment trust, announced its
third quarter 2005 operating results. Total revenue for the quarter
ended September 30, 2005 increased 14.2% to $33,182,000 compared to
$29,044,000 for the 2004 quarter. Third quarter 2005 revenue
included $1,801,000 related to resolution of a land use dispute
with a property owner adjacent to its Lexington Mall. The
resolution of the land dispute, together with the recapture of the
Dillard's store space provides the Company favorable alternatives
for redeveloping the shopping center. Operating income before
minority interests, real estate sale gains and preferred stock
dividends increased 10.2% to $9,694,000 compared to $8,793,000 for
the comparable 2004 quarter. After minority interests, real estate
sale gains and preferred stock dividends, the Company reported net
income available to common stockholders of $5,856,000 or $0.35 per
share (basic & diluted) for the 2005 quarter, a per share
increase of 6.1% compared to net income available to common
stockholders of $5,355,000 or $0.33 per share (basic & diluted)
for the 2004 quarter. As a result of the recent developments
related to Lexington Mall, the Company increased depreciation
expense by $1,515,000 representing a one-time charge related to the
shortened useful life of vacant buildings at the property,
exclusive of the Dillard's space. The Company also increased
general and administrative expenses by $246,000 for the write-off
of abandoned redevelopment costs associated with pre-settlement
land use plans. During the 2004 quarter the Company recorded a
$572,000 property sale gain resulting from the State of Maryland's
condemnation of a small strip of unimproved land for road widening
at the White Oak shopping center. Overall same property revenue for
the total portfolio increased 2.0% for the 2005 third quarter
compared to the same quarter in 2004 and same property operating
income increased 0.9%. The same property comparisons exclude the
results of operations of properties not in operation for each of
the comparable reporting periods. The Lexington Mall results are
not included in same property performance. Property operating
income is calculated as total property revenue less property
operating expenses, provision for credit losses and real estate
taxes. Same center property operating income in the shopping center
portfolio increased 1.6% for the 2005 third quarter, compared to
the prior year's quarter. Same property operating income in the
office portfolio decreased 1.0% for the 2005 quarter. For the nine
month period ended September 30, 2005, total revenue increased
13.2% to $94,241,000 compared to $83,273,000 for the 2004 period.
Operating income before minority interests, real estate sale gains
and preferred stock dividends increased 7.2% to $27,285,000
compared to $25,451,000 for the comparable 2004 period. Net income
available to common stockholders was $15,337,000 or $0.92 per share
(basic & diluted) for the 2005 period, a per share increase of
7.0% (diluted) compared to net income available to common
stockholders of $13,946,000 or $0.87 per share (basic) and $0.86
per share (diluted) for the 2004 period. Overall same property
revenue for the total portfolio increased 3.2% for the 2005 nine
month period compared to the same period in 2004 and same property
operating income increased 2.0%. The shopping center portfolio same
center operating income increased 2.2% and the office portfolio
grew 1.5%. As of September 30, 2005, 97.2% of the operating
portfolio was leased, compared to 94.2% a year earlier. The 2004
leasing percentage was adversely impacted by 133,000 square feet of
vacant space in the Lexington Mall which the Company had not leased
in anticipation of redeveloping the shopping center. As of
September 30, 2005, the Company has been actively planning the
redevelopment of the property and has taken the space out of
service. On a same property basis, 97.0% of the portfolio was
leased, compared to the prior year level of 95.9%. The increase in
2005 leasing percentage resulted from the lease-up of space at Olde
Forte and Southside Plaza and to a lesser extent, the full lease-up
of Washington Square. Funds From Operations (FFO) available to
common shareholders (after deducting preferred stock dividends)
increased 20.7% to $14,856,000 in the 2005 third quarter compared
to $12,304,000 for the same quarter in 2004. FFO, a widely accepted
non-GAAP financial measure of operating performance for real estate
investment trusts, is defined as net income, plus minority
interests, extraordinary items and real estate depreciation and
amortization, excluding gains and losses from property sales. The
$2,552,000 increase in FFO available to common shareholders in the
2005 quarter resulted primarily from the combination of (1) the
resolution of the Lexington Mall land use dispute and (2) increased
operating income from retail acquisition and development
properties. On a diluted per share basis, FFO available to common
shareholders increased 17.5% to $0.67 per share in 2005 compared to
$0.57 per share for the 2004 quarter. FFO available to common
shareholders for the 2005 nine month period increased 13.3% to
$39,594,000 from $34,947,000 during the 2004 period. Diluted per
share FFO available to common shareholders increased 9.8% to $1.80
per share in 2005 compared to $1.64 per share for the 2004 period.
FFO available to common shareholders before the Lexington Mall
impact was $13,301,000 or $0.60 per share (basic & diluted) for
the 2005 quarter and $38,039,000 or $1.74 per share (basic &
diluted) for the nine months ended September 30, 2005. On October
31, 2005, Saul Centers paid a quarterly dividend of $0.42 per share
on its common stock, representing a $0.02 per share increase (5.0%)
over the prior quarter's dividend and an annualized dividend rate
of $1.68 per share. Saul Centers is a self-managed,
self-administered equity real estate investment trust headquartered
in Bethesda, Maryland. Saul Centers currently operates and manages
a real estate portfolio of 42 community and neighborhood shopping
center and office properties totaling approximately 7.3 million
square feet of leaseable area. Over 80% of the Company's cash flow
is generated from properties in the metropolitan Washington,
DC/Baltimore area. Saul Centers, Inc. Condensed Consolidated
Balance Sheets ($ in thousands) September 30, December 31, 2005
2004 Assets (Unaudited) Real estate investments Land $124,915
$119,029 Buildings 534,872 521,161 Construction in progress 57,380
42,618 717,167 682,808 Accumulated depreciation (191,699) (181,420)
525,468 501,388 Cash and cash equivalents 27,344 33,561 Accounts
receivable and accrued income, net 22,448 20,654 Lease acquisition
costs, net 17,031 17,745 Prepaid expenses 3,704 2,421 Deferred debt
costs, net 5,930 5,011 Other assets 3,337 2,616 Total assets
$605,262 $583,396 Liabilities Mortgage notes payable $461,416
$453,646 Dividends and distributions payable 11,247 10,424 Accounts
payable, accrued expenses and other liabilities 13,985 12,318
Deferred income 8,427 6,044 Total liabilities 495,075 482,432
Minority Interests 1,484 - Stockholders' Equity Preferred stock
100,000 100,000 Common stock 168 164 Additional paid in capital
119,429 106,886 Accumulated deficit (110,894) (106,086) Total
stockholders' equity 108,703 100,964 Total liabilities and
stockholders' equity $605,262 $583,396 Saul Centers, Inc. Condensed
Consolidated Statements of Operations (In thousands, except per
share amounts) Three Months Ended Nine Months Ended September 30,
September 30, 2005 2004 2005 2004 Revenue (Unaudited) (Unaudited)
Base rent $25,023 $23,324 $73,664 $67,351 Expense Recoveries 5,004
4,448 14,684 12,360 Percentage Rent 407 440 1,418 1,144 Other 2,748
832 4,475 2,418 Total revenue 33,182 29,044 94,241 83,273 Operating
Expenses Property operating expenses 3,437 3,186 10,693 8,948
Provision for credit losses 50 131 183 299 Real estate taxes 2,830
2,325 8,170 7,204 Interest expense and deferred debt amortization
7,525 7,008 22,549 19,908 Depreciation and amortization 7,162 5,511
18,309 15,496 General and administrative 2,484 2,090 7,052 5,967
Total operating expenses 23,488 20,251 66,956 57,822 Operating
Income 9,694 8,793 27,285 25,451 Gain on Property Disposition - 572
- 572 Minority Interests (1,838) (2,010) (5,948) (6,077) Net Income
7,856 7,355 21,337 19,946 Preferred Dividends (2,000) (2,000)
(6,000) (6,000) Net Income Available to Common Stockholders $5,856
$5,355 $15,337 $13,946 Per Share Net Income Available to Common
Stockholders: Basic $0.35 $0.33 $0.92 $0.87 Diluted $0.35 $0.33
$0.92 $0.86 Weighted Average Common Stock Outstanding: Common stock
16,733 16,227 16,604 16,088 Effect of dilutive options 127 68 103
42 Diluted weighted average common stock 16,860 16,295 16,707
16,130 Saul Centers, Inc. Supplemental Information (In thousands,
except per share amounts) Three Months Ended Nine Months Ended
September 30, September 30, 2005 2004 2005 2004 (Unaudited)
(Unaudited) Reconciliation of Net Income to Funds From Operations
(FFO)(1) Net Income $7,856 $7,355 $21,337 $19,946 Less: Gain on
sale of property - (572) - (572) Add: Real property depreciation
amortization 7,162 5,511 18,309 15,496 Add: Minority interests
1,838 2,010 5,948 6,077 FFO 16,856 14,304 45,594 40,947 Less:
Preferred dividends (2,000) (2,000) (6,000) (6,000) FFO available
to common shareholders $14,856 $12,304 $39,594 $34,947 Weighted
Average Shares Outstanding: Diluted weighted average common stock
16,860 16,295 16,707 16,130 Convertible limited partnership units
5,236 5,196 5,214 5,193 Diluted & converted weighted average
shares 22,096 21,491 21,921 21,323 Per Share Amounts: FFO available
to common shareholders $0.67 $0.57 $1.80 $1.64 Reconciliation of
Net Income to Same Property Operating Income Net Income $7,856
$7,355 $21,337 $19,946 Add: Interest expense and deferred debt
amortization 7,525 7,008 22,549 19,908 Add: Depreciation and
amortization 7,162 5,511 18,309 15,496 Add: General and
administrative 2,484 2,090 7,052 5,967 Less: Gain on property
disposition - (572) - (572) Less: Interest income (224) (70) (521)
(176) Add: Minority interests 1,838 2,010 5,948 6,077 Property
operating income 26,641 23,332 74,674 66,646 Less: Acquisitions
& developments (1,280) - (8,869) (3,953) Less: Lexington
property operating income (1,846) (20) (1,926) (77) Total same
property operating income $23,515 $23,312 $63,879 $62,616 Total
Shopping Centers $16,758 $16,487 $43,740 $42,784 Total Office
Properties 6,757 6,825 20,139 19,832 Total same property operating
income $23,515 $23,312 $63,879 $62,616 (1) FFO is a widely accepted
non-GAAP financial measure of operating performance of real estate
investment trusts ("REITs"). FFO is defined by the National
Association of Real Estate Investment Trusts as net income,
computed in accordance with GAAP, plus minority interests,
extraordinary items and real estate depreciation and amortization,
excluding gains or losses from property sales. FFO does not
represent cash generated from operating activities in accordance
with GAAP and is not necessarily indicative of cash available to
fund cash needs, which is disclosed in the Consolidated Statements
of Cash Flows in the Company's SEC reports for the applicable
periods. FFO should not be considered as an alternative to net
income, its most directly comparable GAAP measure, as an indicator
of the Company's operating performance, or as an alternative to
cash flows as a measure of liquidity. Management considers FFO a
supplemental measure of operating performance and along with cash
flow from operating activities, financing activities and investing
activities, it provides investors with an indication of the ability
of the Company to incur and service debt, to make capital
expenditures and to fund other cash needs. FFO may not be
comparable to similarly titled measures employed by other REITs.
DATASOURCE: Saul Centers, Inc. CONTACT: Scott V. Schneider of Saul
Centers, Inc., +1-301-986-6220 Web site:
http://www.saulcenters.com/
Copyright
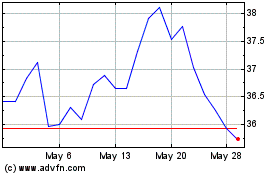
Saul Centers (NYSE:BFS)
Historical Stock Chart
From Jun 2024 to Jul 2024

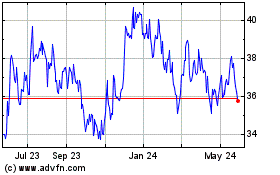
Saul Centers (NYSE:BFS)
Historical Stock Chart
From Jul 2023 to Jul 2024
