UNITED STATES
SECURITIES AND EXCHANGE COMMISSION
Washington, D.C. 20549
FORM 6-K
Report of Foreign Private Issuer
Pursuant to Rule 13a-16 or 15d-16
of the Securities Exchange Act of 1934
Date: February
5, 2020
Commission File Number 001-31528
IAMGOLD CORPORATION
(Translation of registrant's name into English)
401 Bay Street Suite 3200, PO Box 153
Toronto, Ontario, Canada M5H 2Y4
Tel: (416) 360-4710
(Address of principal executive offices)
Indicate by check mark whether the registrant files or will file annual reports under cover Form 20-F or Form 40-F.
|
Form 20-F
|
[ ]
|
Form 40-F
|
[X]
|
Indicate by check mark if the registrant is submitting the Form 6-K in paper as permitted by Regulation S-T Rule 101(b)(1): ____
|
|
Note: Regulation S-T Rule 101(b)(1) only permits the submission in paper of a Form 6-K if submitted solely to provide an attached annual report to security holders.
|
Indicate by check mark if the registrant is submitting the Form 6-K in paper as permitted by Regulation S-T Rule 101(b)(7): ____
|
|
Note: Regulation S-T Rule 101(b)(7) only permits the submission in paper of a Form 6-K if submitted to furnish a report or other document that the registrant foreign private issuer must furnish and make public under the laws of the jurisdiction in which the registrant is incorporated, domiciled or legally organized (the registrant's "home country"), or under the rules of the home country exchange on which the registrant's securities are traded, as long as the report or other document is not a press release, is not required to be and has not been distributed to the registrant's security holders, and, if discussing a material event, has already been the subject of a Form 6-K submission or other Commission filing on EDGAR.
|
Description of Exhibit
Signatures
Pursuant to the requirements of the Securities Exchange Act of 1934, the registrant has duly caused this report to be signed on its behalf by the undersigned, thereunto duly authorized.
|
|
|
|
|
|
IAMGOLD CORPORATION
|
| |
|
|
|
Date: February 5, 2020
|
By:
|
/s/ Tim Bradburn_______________
|
|
|
VP, Legal and Corporate Secretary
|
|
|
|
|
3CI009.018 – IAMGOLD Corporation
|
|
| Independent Technical Report for the São Sebastião Gold Deposit, Pitangui Gold Project, Brazil |
Page i |
Independent Technical Report
for the São Sebastião Gold Deposit, Pitangui Gold Project, Brazil
IAMGOLD Corporation
Suite 3200, 401 Bay Street
Toronto, Ontario
M5H 2Y4
E-mail: info@iamgold.com
Website: www.iamgold.com
Tel: +1 416 360 4710
SRK Consulting (Canada) Inc.
Suite 1500, 155 University Avenue
Toronto, Ontario, Canada
M5H 3B7
E-mail: toronto@srk.com
Website: www.srk.com
Tel: +1 416 601 1445
SRK Project Number 3CI009.018
Effective date: December 2, 2019
Signature date: January 27, 2020
Qualified Persons:
|
["Original signed"]
|
["Original signed"]
|
|
Aleksandr Mitrofanov, PGeo
Senior Consultant (Resource Geology)
|
Glen Cole, PGeo
Principal Resource Geologist
|
Reviewer:
|
["Original signed"]
|
|
Oy Leuangthong, PEng
Principal Consultant (Geostatistics)
|
Contributing Authors:
|
Joycelyn Smith, PGeo
Consultant (Mineral Resources)
|
_________________
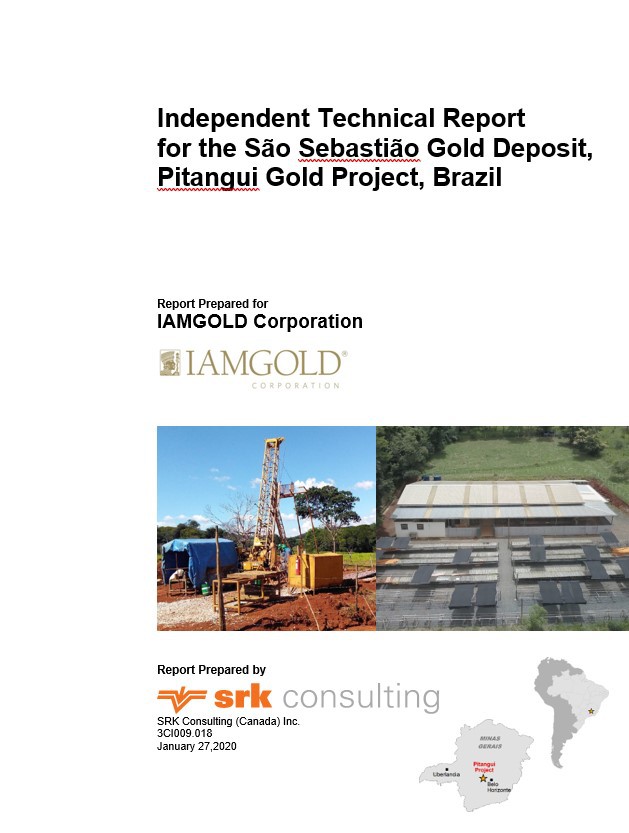
Cover: Diamond drill rig (left) and core shed (right) on the Pitangui property
|
3CI009.018 – IAMGOLD Corporation
|
|
| Independent Technical Report for the São Sebastião Gold Deposit, Pitangui Gold Project, Brazil |
Page ii |
IMPORTANT NOTICE
This report was prepared as a National Instrument 43-101 Standards of Disclosure for Mineral Projects Technical Report for IAMGOLD Corporation (IAMGOLD) by SRK Consulting (Canada) Inc. (SRK). The quality of information, conclusions, and estimates contained herein are consistent with the quality of effort involved in SRK's services. The information, conclusions, and estimates contained herein are based on: i) information available at the time of preparation, ii) data supplied by outside sources, and iii) the assumptions, conditions, and qualifications set forth in this report. This report is intended for use by IAMGOLD subject to the terms and conditions of its contract with SRK and relevant securities legislation. The contract permits IAMGOLD to file this report as a Technical Report with Canadian securities regulatory authorities pursuant to National Instrument 43-101. Except for the purposes legislated under provincial securities law, any other uses of this report by any third party is at that party's sole risk. The responsibility for this disclosure remains with IAMGOLD. The user of this document should ensure that this is the most recent Technical Report for the property as it is not valid if a new Technical Report has been issued.
© 2019 SRK Consulting (Canada) Inc.
This document, as a collective work of content and the coordination, arrangement and any enhancement of said content, is protected by copyright vested in SRK Consulting (Canada) Inc. (SRK).
Outside the purposes legislated under provincial securities laws and stipulated in SRK's client contract, this document shall not be reproduced in full or in any edited, abridged or otherwise amended form unless expressly agreed in writing by SRK.
|
3CI009.018 – IAMGOLD Corporation
|
|
| Independent Technical Report for the São Sebastião Gold Deposit, Pitangui Gold Project, Brazil |
Page iii |
Executive Summary
Introduction
The Pitangui Gold Project is an advanced exploration project, located in southeastern Brazil. It is located 110 kilometres northwest of Belo Horizonte, in the central region of Minas Gerais State. IAMGOLD Corporation holds 100% interest in the Pitangui Project containing the São Sebastião gold deposit, in part through its wholly owned subsidiary Agua Nova Pesquisas Minerais Ltda.
This technical report documents a Mineral Resource Statement for the Pitangui Project prepared by SRK Consulting (Canada) Inc. (SRK). It was prepared following the guidelines of the Canadian Securities Administrators' National Instrument 43-101 and Form 43-101F1.
In May 2019, IAMGOLD commissioned SRK to visit the property and prepare a geological and mineral resource model for the Pitangui Project. The services were rendered between August and November 2019 leading to the preparation of the mineral resource statement reported herein.
Property Description and Ownership
The Pitangui concession block is located in the central region of Minas Gerais State, in southeastern Brazil. The São Sebastião gold deposit occurs within the Pitangui Project that comprises 12 contiguous exploration permits, covering a total area of 18,072.74 hectares.
Exploration permits in Brazil are subject to an annual tax to the Federal Government. The annual tax per hectare is R$3.29 / US$0.86 (July 2019) for the first three years of exploration, which increases to R$5.00 / US$1.31 (July 2019) for the next three years of exploration.
Access to the project area is from Belo Horizonte by car. Highway BR381 is taken west until it meets up with highway BR262, which is taken northwest to the city of Pará de Minas. From Pará de Minas, the project area can be accessed via a number of unpaved roads from the city itself, or from the highways which link Pará de Minas to Pequi (MG 431) and to Pitangui (MG 423, BR 352).
No exploration work was performed on the Pitangui property prior to IAMGOLD's ownership.
Geology and Mineralization
The Pitangui Project is located in the Southern tip of the western sector of the Neoarchean to Proterozoic São Francisco craton. This area of the Quadrilátero Ferrifero (Iron Quadrangle) is composed of Archean greenstone belts, Archean to Proterozoic granite-gneiss terrains, and Neoarchean to Proterozoic supracrustal units.
The Rio das Velhas Greenstone Belt is the main greenstone belt in the Quadrilátero Ferrífero and represents a collage of oceanic fragments resulting from the tectonic amalgamation of continental crust and metavolcano-sedimental units of approximately 2.79 to 2.75 Ga. The Rio das Velhas Greenstone Belt comprises the Rio Das Velhas Supergroup, subdivided into the Nova Lima and Maquiné Groups and is tectonically juxtaposed against granite-gneiss terrains.
|
3CI009.018 – IAMGOLD Corporation
|
|
| Independent Technical Report for the São Sebastião Gold Deposit, Pitangui Gold Project, Brazil |
Page iv |
The Pitangui Greenstone Belt is a northwest- trending synclinorium interpreted as the northwest extension of the Rio das Velhas Greenstone Belt. The geology of the Pitangui Greenstone Belt is divided into a lower, middle and upper units by IAMGOLD.
The lower units comprises ultramafic and mafic volcanic rock intercalated with Algoma-type banded iron formation, clastic and chemical metasedimentary rocks. The middle unit is composed of clastic metasedimentary rocks with minor chemical metasedimentary and metavolcanic rocks. The upper units is correlated with the Casa Forte Formation of the Maquiné Group and comprises micaceous quartzites, quartz-schists and polymictic metaconglomerates.
Three deformation events can be recognized within the Pitangui greenstone belt. The São Sebastião gold deposit is located along the northeastern limb of the D2 Jaguara anticline, which is an open asymmetric fold plunging northwest and verging southwest. Key structural features include:
- D1 isoclinal to tight recumbent northwest-plunging folds and bedding-parallel shear zones, and an S1 foliation that strikes northwest subparallel to bedding (except in fold hinges).
- D2 open to tight northwest-plunging folds with steep to moderate dipping axial planes that refold earlier isoclinal folds, northwest-striking, northeast-dipping shear zones, and a weakly developed S2 axial planar and crenulation cleavage.
- D3 open northeast-plunging folds and an associated S3 spaced, axial planar and crenulation cleavage.
Gold mineralization at São Sebastião deposit is hosted by three main strata-confined sulfidation zones within several stacked banded iron formation (BIF) layers in the lower units of the Pitangui greenstone belt. The mineralized zones are locally named Tomate, Biquinho, and Pimentão from top to bottom.
Exploration and Drilling
IAMGOLD has drilled a total of 240 core boreholes (approximately 88,034 metres) at the São Sebastião gold deposit between 2011 and 2019, inclusive of 8 deflection boreholes. In addition, IAMGOLD has conducted airborne radiometric, magnetics, and VTEM surveys, several ground geophysical surveys, surface geochemistry and geological mapping programs.
The procedures undertaken by IAMGOLD at the Pitangui Project's São Sebastião gold deposit for core drilling, handling, logging and maintenance of the database for the project are well managed, documented, and undertaken with a well-defined set of procedures that meet industry standard practice. SRK is not aware of any drilling, sampling or other factors that could materially impact the accuracy and reliability of the results discussed herein.
|
3CI009.018 – IAMGOLD Corporation
|
|
| Independent Technical Report for the São Sebastião Gold Deposit, Pitangui Gold Project, Brazil |
Page v |
Sample Preparation, Analyses and Security
Exploration Samples collected by IAMGOLD personnel between 2009 and April 2015 were submitted to ACME analytical laboratories (ACME) in Goiânia and Vespasiano, Brazil, currently operating as Bureau Veritas Mineral Laboratories. Exploration samples collected between April 2015 and June 2019 were submitted to ALS Brasil Ltda (ALS) in Vespasiano, Brazil. Both facilities are independent, commercial geochemical laboratories that operated independently from IAMGOLD.
SRK recommends limiting the number of specific certified reference materials used for gold analysis for low, medium and high-grade categories in order to accurately monitor laboratory trends in quality control results. In the opinion of SRK, the sampling preparation, security and analytical procedures used by IAMGOLD are consistent with generally accepted industry best practices and are, therefore, adequate for an advanced exploration project.
Data Verification
SRK carried out a detailed quality control review including the review of analytical quality control programs carried out by IAMGOLD from 2014 to 2019. The aim of this review was to verify the reliability of exploration data generated during this period to be used in the mineral resource update. This review is in addition to that conducted and discussed in the 2014 report.
Based on previous project exposure and on SRK's most recent site visit completed during active drilling operations in June 2019, SRK believes that drilling, logging, core handling, core storage, and analytical quality control protocols used by IAMGOLD meet generally accepted industry best practices, and are, therefore, adequate for an advanced exploration project.
Overall, SRK considers analytical results from core sampling conducted between 2009 and 2019 at the Pitangui Project are globally sufficiently reliable for the purpose of resource estimation. The data examined by SRK do not present obvious evidence of analytical bias.
Mineral Resource and Mineral Reserve Estimates
The mineral resource model prepared by SRK considers 240 core boreholes drilled by IAMGOLD during the period of 2011 to 2019, of which 216 core boreholes (80,041 metres) are in the modelled area. The mineral resources have been estimated in conformity with generally accepted Canadian Institute of Mining, Metallurgy and Petroleum (CIM) Estimation of Mineral Resource and Mineral Reserves Best Practices Guidelines (November 2019) and are reported in accordance with the Canadian Securities Administrators' National Instrument 43-101.
SRK is of the opinion that the current drilling information is sufficiently reliable to interpret with confidence the boundaries for banded iron formation-hosted gold mineralization and that the assay data are reliable to support mineral resource estimation. The mineralization zones within the BIF units were developed using a grade threshold of 0.1 gram of gold per tonne (g/t gold). SRK applied the original IAMGOLD interpretation as the reference for the modelling of 21 mineralized subdomains: 7 for Biquinho, 11 for Pimentao and 4 for Tomate zones. The majority of the mineralized intervals are constrained within subdomains, which reside within the BIF units.
|
3CI009.018 – IAMGOLD Corporation
|
|
| Independent Technical Report for the São Sebastião Gold Deposit, Pitangui Gold Project, Brazil |
Page vi |
SRK chose to composite at 1-metre length, excluding composites shorter than 50% of the composite length (or 0.50 metres) in data analysis and block grade estimation. Capping was performed on the composites and within the grouped mineralized subdomains in each BIF unit, the BIF host rock, ultramafic, metasediment and schist domains. Gold variograms were only calculated and modelled for the mineralized and unmineralized portions of the BIF units.
A rotated block model was populated with a gold value using ordinary kriging in the mineralized domains, with three estimation runs using progressively relaxed search ellipsoids and data requirements. A block size of 10 metres × 10 metres × 2 metres was chosen, with sub-cells at a resolution of 5 metres × 5 metres × 1 metre. The three host rock domains (ultramafic, metasediment and schist) were estimated using inverse distance weighting with a power of 2. Specific gravity was estimated in all mineralized and unmineralized BIF domains by applying two estimation runs using inverse distance weighting with a power of 2. Mean specific gravity values were assigned for host rock domains.
The block classification strategy considers borehole spacing, geologic confidence and continuity of category. SRK examined the classification visually by inspecting sections and plans throughout the block model. SRK considers that there are no Measured blocks within the São Sebastião gold deposit. Indicated blocks are generally estimated within a 50-metre × 50-metre × 50-metre search radius, using a minimum of three boreholes and belonging to the largest mineralized subdomains within the BIF units. All other estimated blocks within the mineralized sub-domains inside a BIF unit were classified as Inferred. SRK concludes that the material classified as Indicated reflects estimates made with a moderate level of confidence within the meaning of CIM Definition Standards for Mineral Resources and Mineral Reserves (May 2014), and all other material is estimated at a lower confidence level.
In the opinion of SRK, the mineral resource evaluation reported in Table i is a reasonable representation of the global gold mineral resources found in the São Sebastião deposit at the current level of sampling. The mineral resources were estimated in conformity with the widely accepted CIM Estimation of Mineral Resource and Mineral Reserve Best Practices Guidelines (November 2019) and are reported in accordance with the Canadian Securities Administrators' National Instrument 43-101. The mineral resources may be affected by further infill and exploration drilling that may result in increases or decreases in subsequent mineral resource estimates. The mineral resources may also be affected by subsequent assessments of mining, environmental, processing, permitting, taxation, socio-economic, and other factors. The effective date of the Mineral Resource Statement is December 2, 2019.
|
3CI009.018 – IAMGOLD Corporation
|
|
| Independent Technical Report for the São Sebastião Gold Deposit, Pitangui Gold Project, Brazil |
Page vii |
Table i: Mineral Resource Statement*, São Sebastião Deposit, Brazil, SRK Consulting (Canada) Inc., December 2, 2019
|
Category
|
Quantity
|
Grade
|
Contained Metal
|
|
|
(000't)
|
Gold (g/t)
|
Gold (000'oz)
|
|
Underground*
|
|
|
|
|
Indicated
|
3,330
|
4.39
|
470
|
|
Inferred
|
3,559
|
3.78
|
433
|
|
* Mineral resources are not mineral reserves and have not demonstrated economic viability. All figures have been rounded to reflect the relative accuracy of the estimates. Reported at underground resource cut-off grades of 2.5 g/t gold. Cut-off grades are based on a price of US$1,500 per ounce of gold and gold recoveries of 93%.
|
Conclusion and Recommendations
The Mineral Resource Statement presented herein represents the second mineral resource evaluation prepared by SRK and the fourth mineral resource evaluation for the São Sebastião gold deposit. SRK can confirm that IAMGOLD's exploration work is conducted using field procedures that generally meet accepted industry best practices.
The increased drilling density since the 2017 interpretation has resulting in a significant change in the interpretation of geological and estimation domains. An increased confidence in geological continuity and abundance of drilling data in the densely drilled areas allows classifying the most continuous and well-explored portion of the mineralized domains as Indicated. Correspondingly, Inferred tonnage, grade and ounces are significantly reduced.
The geological setting, character of the gold mineralization delineated and modeled are of sufficient merit to justify additional exploration and pre-development investigations. In this regard, SRK propose a project development strategy focussed on optimizing the definition of the current mineral resource, realising and characterizing the full exploration potential of the Pitangui Project and on evaluating the economic merit of the project.
To achieve the above goals, IAMGOLD has proposed a budget of US$7 million to the Pitangui Project for project evaluation and an exploration work program phased over three years to position the project to examine potential development scenarios. The principal objectives of the three-year exploration program are to:
- Complete an additional 5,000 metres of core drilling to continue to expand and outline potential mineral resource extensions at depth down plunge.
- Selected infill drilling of 10,000 metres to convert inferred resources to indicated, targeting shallow, high grade areas which could potentially be mined in the early stages of a mine development.
- Additional metallurgical testing on approximately 2,000 metres of core to confirm optimal process plant flow sheet parameters. The program will involve the completion of large diameter core drill holes targeted to extract suitable sample volumes to yield a projected LOM composite grade.
- Initiate 1,000 metres of geotechnical drilling to assess proposed portal locations.
|
3CI009.018 – IAMGOLD Corporation
|
|
| Independent Technical Report for the São Sebastião Gold Deposit, Pitangui Gold Project, Brazil |
Page viii |
- Initiate a base line environmental sampling and monitoring program in areas of possible mine infrastructure sites to a support future ESIA study.
- Evaluate the mineral resource potential and remaining exploration potential of other exploration targets by completing 2,500 metres of drilling on the Onca vein system and 2,500 metres of drilling the Vilaca and Aparicao prospects.
SRK considers that the implementation of the proposed work program will advance the Pitangui Project towards a pre-development stage and will provide key inputs required to evaluate at a conceptual level the economic potential of an underground mine on the property.
|
3CI009.018 – IAMGOLD Corporation
|
|
| Independent Technical Report for the São Sebastião Gold Deposit, Pitangui Gold Project, Brazil |
Page ix |
Table of Contents
|
3CI009.018 – IAMGOLD Corporation
|
|
| Independent Technical Report for the São Sebastião Gold Deposit, Pitangui Gold Project, Brazil |
Page x |
|
3CI009.018 – IAMGOLD Corporation
|
|
| Independent Technical Report for the São Sebastião Gold Deposit, Pitangui Gold Project, Brazil |
Page xi |
|
3CI009.018 – IAMGOLD Corporation
|
|
| Independent Technical Report for the São Sebastião Gold Deposit, Pitangui Gold Project, Brazil |
Page xii |
List of Tables
| Table 1: Mineral Tenure Information |
8 |
| |
|
| Table 2: Mineral Resource Statement* São Sebastião Gold Deposit, Minas Gerais, Brazil, SRK Consulting (Canada) Inc., January 9, 2014 |
14 |
| |
|
| Table 3: Mineral Resource Statement* São Sebastião Gold Deposit, Minas Gerais, Brazil, IAMGOLD Corporation, December 31, 2015 |
15 |
| |
|
| Table 4: Comparisons Between Stratigraphic Divisions Proposed for the Pitangui Greenstone Belt |
20 |
| |
|
| Table 5: Summary of Drilling on Pitangui Project, Brazil |
31 |
| |
|
| Table 6: Summary Characteristics of Control Samples Used by IAMGOLD for the São Sebastião Gold Deposit, Pitangui Gold Project |
41 |
| |
|
| Table 7: Summary of Analytical Quality Control Data Produced by IAMGOLD on the São Sebastião Gold Deposit, Pitangui Project (Period 2013-2019) |
45 |
| |
|
| Table 8: Assay Results for Verification Samples Collected SRK on the São Sebastião Gold Deposit, Pitangui Project |
46 |
| |
|
| Table 9: Composite Location |
47 |
| |
|
| Table 10: Screen Metallics Assay Results |
47 |
| |
|
| Table 11: Summary of the Database |
53 |
| |
|
| Table 12: Domains Summary |
56 |
| |
|
| Table 13: Summary Basic Statistics for Raw Sample, Composite and Capped Composite Data (St Dev = standard deviation, CV = coefficient of variation) |
59 |
| |
|
| Table 14: Gold Variograms by Domain |
60 |
| |
|
| Table 15: Cap Values and Associated Statistics for Specific Gravity |
62 |
| |
|
| Table 16: São Sebastião Gold Deposit Block Model Specifications |
62 |
| |
|
| Table 17: Estimation Parameters for Gold and Specific Gravity |
63 |
| |
|
| Table 18: Conceptual Assumptions Considered for Underground Resource Reporting |
68 |
| |
|
| Table 19: Mineral Resource Statement*, São Sebastião Gold Deposit, Brazil, SRK Consulting (Canada) Inc., December 2, 2019 |
69 |
| |
|
| Table 20: Mineral Resource Statement Reported by Domain |
69 |
| |
|
| Table 21: Global Block Model Quantity and Grade Estimates* at Various Cut-off Grades, São Sebastião Gold Deposit, Brazil |
70 |
| |
|
| Table 22: Mineral Resource Statement, São Sebastião Gold Deposit, IAMGOLD Corporation, Brazil, December 31, 2018 |
71 |
| |
|
| Table 23: Comparison Between 2018 and 2019 Mineral Resource Statements |
72 |
| |
|
| Table 24: Estimated Cost for the Proposed Exploration Program |
77 |
|
3CI009.018 – IAMGOLD Corporation
|
|
| Independent Technical Report for the São Sebastião Gold Deposit, Pitangui Gold Project, Brazil |
Page xiii |
List of Figures
1 Introduction and Terms of Reference
The Pitangui Gold Project is an advanced exploration project, located in southeastern Brazil. It is located 110 kilometres northwest of Belo Horizonte, in the central region of Minas Gerais State. IAMGOLD Corporation (IAMGOLD) is a Toronto based public company trading on the Toronto Stock Exchange (TSX) under the symbol of IMG and on the New York Stock Exchange under the symbol IAG. IAMGOLD holds 100% interest in the Pitangui Project containing the São Sebastião gold deposit through its wholly owned subsidiary Agua Nova Pesquisas Minerais Ltda.
In May 2019, IAMGOLD commissioned SRK Consulting (Canada) Inc. (SRK) to visit the property and prepare a geological and mineral resource model for the Pitangui Project. The services were rendered between August and September 2019 leading to the preparation of the mineral resource statement reported herein.
This technical report documents a Mineral Resource Statement for the Pitangui Project prepared by SRK. It was prepared following the guidelines of the Canadian Securities Administrators' National Instrument 43-101 and Form 43-101F1. The mineral resource statement reported herein was prepared in conformity with generally accepted Canadian Institute of Mining, Metallurgy and Petroleum (CIM) Estimation of Mineral Resources and Mineral Reserves Best Practice Guidelines (November 2019).
1.1 Scope of Work
The scope of work, as defined in a letter of engagement executed on April 25, 2019 between IAMGOLD and SRK includes the construction of a mineral resource model for the gold mineralization delineated by drilling on the Pitangui Project and the preparation of an independent technical report in compliance with National Instrument 43-101 and Form 43-101F1 guidelines. This work typically involves the assessment of the following aspects of this project:
- Topography, landscape, access.
- Regional and local geology.
- Exploration history.
- Audit of exploration work carried out on the project.
- Geological modelling.
- Mineral resource estimation and validation.
- Preparation of a Mineral Resource Statement.
- Recommendations for additional work.
1.2 Work Program
The Mineral Resource Statement reported herein is a collaborative effort between IAMGOLD and SRK personnel. The exploration database was compiled and maintained by IAMGOLD and was audited by SRK. The geological model and outlines for the gold mineralization were constructed by SRK from a three-dimensional geological interpretation developed in Leapfrog and provided by IAMGOLD. In the opinion of SRK, the geological model is a reasonable representation of the distribution of the targeted mineralization at the current level of sampling. The geostatistical analysis, variography and grade models were completed by SRK during the month of August 2019. The mineral resource statement reported herein was presented to IAMGOLD in a memorandum report on December 9, 2019.
The Mineral Resource Statement reported herein was prepared in conformity with the generally accepted CIM Exploration Best Practices Guidelines (November 2018) and CIM Estimation of Mineral Resource and Mineral Reserves Best Practices Guidelines (November 2019). This technical report was prepared following the guidelines of the Canadian Securities Administrators' National Instrument 43-101 and Form 43-101F1.
The technical report was assembled in SRK's Toronto office during the months of September to December 2019.
1.3 Basis of Technical Report
This report is based on information collected by SRK during a site visit performed between June 10 to 12, 2019, and on additional information provided by IAMGOLD throughout the course of SRK's investigations. SRK has no reason to doubt the reliability of the information provided by IAMGOLD. Other information was obtained from the public domain. This technical report is based on the following sources of information:
- Discussions with IAMGOLD personnel.
- Inspection of the Pitangui Project area, including outcrop and drill core.
- Review of exploration data collected by IAMGOLD.
- Additional information from public domain sources.
1.4 Qualifications of SRK and SRK Team
The SRK Group comprises more than 1,400 professionals, offering expertise in a wide range of resource engineering disciplines. The independence of the SRK Group is ensured by the fact that it holds no equity in any project it investigates and that its ownership rests solely with its staff. These facts permit SRK to provide its clients with conflict-free and objective recommendations. SRK has a proven track record in undertaking independent assessments of mineral resources and mineral reserves, project evaluations and audits, technical reports and independent feasibility evaluations to bankable standards on behalf of exploration and mining companies, and financial institutions worldwide. Through its work with a large number of major international mining companies, the SRK Group has established a reputation for providing valuable consultancy services to the global mining industry.
The site visit and review of the geology and database was completed under the supervision of Mr. Glen Cole, PGeo (APGO#1416). The 3D geological review and resource evaluation work was completed by Dr. Aleksandr Mitrofanov, PGeo (APGO#2824). By virtue of their education, membership to a recognized professional association and relevant work experience, Mr. Cole and Dr. Mitrofanov are independent Qualified Persons as this term is defined by National Instrument 43-101. The quality control data analysis and technical report compilation were provided by Ms. Joycelyn Smith, PGeo (APGO#2963).
Dr. Oy Leuangthong, PEng (PEO#90563867), a Principal Consultant (Geostatistics) with SRK, reviewed drafts of this technical report prior to their delivery to IAMGOLD as per SRK internal quality management procedures.
1.5 Site Visit
In accordance with National Instrument 43-101 guidelines, Mr. Glen Cole, PGeo and Ms. Camila Passos, PGeo from the SRK Toronto and Belo Horizonte offices respectively, visited the Pitangui Project on June 10 to 12, 2019, accompanied by Mr. Milton Prado, the Exploration Manager (Brazil) of IAMGOLD and his exploration team inclusive of Mr. Antonio Modesto, Mr. Luedson Manduca and Mr. Pedro Montenegro.
The purpose of the site visit was to review the digitalization of the exploration database and validation procedures, review exploration procedures, define geological modelling procedures, examine drill core, interview project personnel, and collect all relevant information for the preparation of a revised mineral resource model and the compilation of a technical report. During the visit, particular attention was given to geological modeling advances undertaken by the Pitangui exploration team.
The site visit aimed at investigating the geological and structural controls on the distribution of the gold mineralization in order to aid the construction of three-dimensional gold mineralization domains.
SRK was given full access to relevant data and conducted interviews with IAMGOLD personnel to obtain information on the past exploration work, to understand procedures used to collect, record, store and analyze historical and current exploration data.
1.6 Acknowledgement
SRK would like to acknowledge the support and collaboration provided by IAMGOLD personnel for this assignment. Their collaboration was greatly appreciated and instrumental to the success of this project.
1.7 Declaration
SRK's opinion contained herein and effective December 2, 2019 is based on information collected by SRK throughout the course of SRK's investigations. The information in turn reflects various technical and economic conditions at the time of writing this report. Given the nature of the mining business, these conditions can change significantly over relatively short periods of time. Consequently, actual results may be significantly more or less favourable.
This report may include technical information that requires subsequent calculations to derive subtotals, totals, and weighted averages. Such calculations inherently involve a degree of rounding and consequently introduce a margin of error. Where these occur, SRK does not consider them to be material.
SRK is not an insider, associate or an affiliate of IAMGOLD, and neither SRK nor any affiliate has acted as advisor to IAMGOLD, its subsidiaries or its affiliates in connection with this project. The results of the technical review by SRK are not dependent on any prior agreements concerning the conclusions to be reached, nor are there any undisclosed understandings concerning any future business dealings.
2 Reliance on Other Experts
SRK has not performed an independent verification of land title and tenure information as summarized in Section 3 of this report. SRK did not verify the legality of any underlying agreement(s) that may exist concerning the permits or other agreement(s) between third parties but has relied on Lucila de Oliveira Carvalho as expressed in a legal opinion provided to IAMGOLD on August 2, 2019.
The mineral rights for the exploration permits are all valid, regular, and in good standing. IAMGOLD is in compliance with the mining regulation related to the mining rights, which includes meeting the requirements of ANM rules (former DNPM), the payment of the annual fee per hectare, or any other applicable fees. A copy of the title opinions is provided in Appendix A. The reliance applies solely to the legal status of the rights disclosed in Sections 3.1 and 3.2 below.
SRK was informed by IAMGOLD that there are no known litigations potentially affecting the Pitangui Project.
3 Property Description and Location
The Pitangui concession block is located in the central region of Minas Gerais State, in southeastern Brazil (Figure 1). This area is approximately 110 kilometres northwest of Belo Horizonte, placed within the São João river hydrographic basin between the towns of Onça de Pitangui (in the northwest) and Pará de Minas (in the southwest).

Figure 1: Location of the Pitangui Gold Project
3.1 Mineral Tenure
The São Sebastião gold deposit occurs within the Pitangui Project that comprises 12 contiguous exploration permits, covering a total area of 18,072.74 hectares (Figure 2).

Figure 2: Land Tenure Map
IAMGOLD holds 100% interest in the Pitangui Project partly through its wholly owned subsidiary Agua Nova Pesquisas Minerais Ltda. Table 1 summarizes the mineral tenure information for the exploration permits.
The mineral resources reported herein for the São Sebastião gold deposit are located in tenements 830.936/07 and 830.934/07. All 10 other exploration permits are in good standing regarding particular time expiration and their respective reporting.
There are no statutory royalty obligations because the mineral rights are currently exploration permits. The permits are not located within buffer zones of environmental conservation units, indigenous areas, or areas dedicated to land reform purposes.
Table 1: Mineral Tenure Information
|
ANM-ID
|
Area
(ha)
|
Company
|
Phase
|
Status
|
Grant Date (dd/mm/yy)
|
Renewal Date (dd/mm/yy)
|
Expiry Date (dd/mm/yy)
|
|
830.934/07
|
1,686.09
|
Água Nova Pesquisas Minerais Ltda.
|
Exploration Permit
|
Final Report Approved; Updated Report Submitted
|
18/02/09
|
Pending
|
-
|
|
830.936/07
|
1,593.54
|
Água Nova Pesquisas Minerais Ltda.
|
Exploration Permit
|
Final Report Approved; Updated Report Submitted
|
27/11/08
|
Pending
|
-
|
|
833.743/11
|
933.93
|
Água Nova Pesquisas Minerais Ltda.
|
Exploration Permit
|
Extension Permit
|
21/11/11
|
3/1/2018
|
3/1/2021
|
|
830.512/15
|
446.71
|
IAMGOLD Brasil Prospecção Mineral Ltda
|
Exploration Permit
|
Extension Permit Requested
|
26/08/16
|
Pending
|
-
|
|
830.509/15
|
1,886.85
|
IAMGOLD Brasil Prospecção Mineral Ltda.
|
Exploration Permit
|
Extension Permit
|
3/7/2015
|
28/09/18
|
28/09/21
|
|
830.510/15
|
1,787.33
|
IAMGOLD Brasil Prospecção Mineral Ltda.
|
Exploration Permit
|
Extension Permit
|
3/7/2015
|
28/09/18
|
28/09/21
|
|
830.511/15
|
1,677.19
|
IAMGOLD Brasil Prospecção Mineral Ltda.
|
Exploration Permit
|
Extension Permit
|
23/06/15
|
28/09/18
|
28/09/21
|
|
830.513/15
|
1,259.05
|
IAMGOLD Brasil Prospecção Mineral Ltda.
|
Exploration Permit
|
Extension Permit
|
26/08/16
|
22/10/19
|
22/10/22
|
|
830.514/15
|
1,519.58
|
IAMGOLD Brasil Prospecção Mineral Ltda.
|
Exploration Permit
|
Extension Permit
|
26/08/16
|
22/10/19
|
22/10/22
|
|
830.515/15
|
1,749.47
|
IAMGOLD Brasil Prospecção Mineral Ltda.
|
Exploration Permit
|
Extension Permit
|
26/08/16
|
22/10/19
|
22/10/22
|
|
831.135/15
|
1,850.67
|
IAMGOLD Brasil Prospecção Mineral Ltda.
|
Exploration Permit
|
Extension Permit
|
26/10/15
|
26/12/18
|
26/12/21
|
|
831.136/15
|
1,682.33
|
IAMGOLD Brasil Prospecção Mineral Ltda.
|
Exploration Permit
|
Extension Permit
|
26/08/16
|
22/10/19
|
22/10/22
|
|
Total
|
18,072.74
|
|
|
|
|
|
|
3.2 Mining Rights in Brazil
Exploration permits in Brazil are issued based on digital geographic map staking and are not required to be legally surveyed.
In December 2017 Agência Nacional de Mineração (ANM; National Mining Agency), replaced the National Department of Mineral Production (DNPM), taking over the responsibility of managing exploration and mining activities in Brazil, under the control of the Ministry of Mines and Energy (MME).
Any Brazilian or Foreign Company properly registered in Brazil in accordance with Brazilian laws, as well as any Brazilian born citizen, can own mineral rights in Brazil. Mineral rights are granted as concessions by the ANM.
Applications to obtain mineral rights must be filed at the ANM local office for the relevant mineral commodity, with precise reference to the land extents. Once the application is accepted, a concession (Alvará) will be granted, normally for a period of three years. The concession owner can request an additional three-year extension by filing a report that details the completed exploration work and a proposed exploration program.
At the end of the three-year extension period, a final report must be filed to demonstrate the delineation of reserves or resources supported by drill results. Once the final report is approved by the ANM, the concession owner will have a one-year period to complete the equivalent of a feasibility study, named a PAE (Plano de Aproveitamento Economico). This can also be renewed for another one-year period, if appropriately justified. During the PAE period, the concession owner must apply for the necessary environmental permits. Once the permits are granted and the PAE report is approved the concession owner has a period of 9 months to commence mining operations.
The granted concession for mining provides the miner a title that warrants the use of the mineral resource, through a decree from the Minister of the Mines and Energy (also known as Exploitation Decree or Portaria de Lavra). This title can only be achieved through definition of an economic mineral reserve through mineral exploration, which is presented in the PAE.
IAMGOLD submitted a Final Positive Report for the two central concessions covering the São Sebastião gold deposit that were approved in June 2016. The Special Concession status was granted a few months later for a period of three years. A comprehensive report detailing all activities and the outcome for this "Special Concession" phase was submitted to ANM in August 2019. The two concessions of the Pitangui Project that were granted Special Concession status are shown in Figure 3.

Figure 3: Pitangui Block Mineral Rights Highlighting Blocks Granted "Special Concession"
The DNPM/ANM granted extra time to the Special Concessions due to the time delays in obtaining the necessary environmental permits to conduct drilling in areas covered by mature vegetation. IAMGOLD provided sufficient evidence for improving the project's economic parameters, while substantiating that the Government (through any of its agents), or any "force major," delayed important activity to be conducted while the concession was valid.
This delay was well documented by IAMGOLD Brasil and the evidences shown to DNPM/ANM was the time consumed in obtaining the necessary environmental permits to conduct drilling in the areas covered by mature vegetation.
Extension reports have been submitted for the remaining areas of the Pitangui concession block, of which five concessions have been granted for three years to date.
3.3 Underlying Agreements
IAMGOLD Corporation holds 100% interest in the Pitangui Project containing the São Sebastião gold deposit, in part through its wholly owned subsidiary Agua Nova Pesquisas Minerais Ltda Exploration permits in Brazil are subject to an annual tax to the Federal Government. The annual tax per hectare is R$3.29 / US$0.86 (as of July 2019) for the first three years of exploration, which increases to R$5.00 / US$1.31 (as of July 2019) for the next three years of exploration.
There are no other underlying agreements currently affecting the Pitangui Project.
3.4 Permits and Authorization
Mineral rights in the exploration phase are granted exclusively by the ANM. An environmental operation licenses is required to undertake exploration drilling if it requires substantial removal of mature vegetation.
3.5 Environmental Considerations
Drilling activity conducted in densely vegetated area requires a specific environmental license according to the local state environmental rules. Most of the drilling conducted by IAMGOLD has been in cattle farming pasture and other agricultural plantations which has not required this licensing.
An environmental license was obtained for drilling conducted in the southeastern portion of the Pitangui Project, where vegetation is dense. The license was awarded for an initial period of three years and renewed for two additional years. During this period, drilling was conducted in accordance to all defined requirements. Drilling in this area concluded in 2018 with no intention for further renewal. The environmental license expired on August 22, 2019.
All compulsory conditions required to obtain and maintain this environmental license were reported to the State Environmental Agency annually and at the end of the license period.
4 Accessibility, Climate, Local Resources, Infrastructure, and Physiography
4.1 Accessibility
The Pitangui Project is located approximately 110 kilometres northwest of the city of Belo Horizonte within Onça do Pitangui County, 13 kilometres east of the town of Onça do Pitangui. The cities of Pará de Minas, Pitangui, and Pequi, which are located approximately 12, 23, and 12 kilometres to the southeast, northwest, and north, respectively.
Access to the Pitangui Project area takes between two to three hours from Belo Horizonte by car. From Belo Horizonte, highway BR381 is taken west out of town until it meets up with highway BR262, which is taken northwest to the city of Pará de Minas. From Pará de Minas, the project area can be accessed via a number of unpaved roads from the city itself, or from the highways which link Pará de Minas to Pequi (MG 431) and to Pitangui (MG 423, BR 352). The highways and unpaved roads are generally in acceptable to good condition.
Belo Horizonte can be accessed by road via numerous highways in Brazil or by plane via Belo Horizonte's international airport that is served on a daily basis by a number of regional airlines. Short range flights can also be obtained from Belo Horizonte's Pampulha - Carlos Drummond de Andrade Airport. The city of Pará de Minas also has an airport (Arnauld Marinho Airport) with a 1.2-kilometre paved runway, where it is possible to charter flights (Figure 4).
4.2 Local Resources and Infrastructure
The city of Pará de Minas is approximately 12 kilometres to the southeast of the São Sebastião gold deposit and is located in the centre of the municipality of Pará de Minas, which has a population of approximately 93,000. This city hosts the strongest economy in the region, driven primarily by chicken and cattle farms, and several vegetable plantations. Common services and infrastructure are available in Pará de Minas. Local labourers can be hired from the nearby town of Onça de Pitangui, and the Jaguara de Minas district and Barreiro village.
The region is connected with 500-kilovolt power lines to the Brazilian power network. A diversified reliance on hydro, thermoelectric and nuclear power ensures that the Brazilian power network can consistently supply a sufficient source of power. Water to support drilling activities is available from a small river that crosses the São Sebastião gold deposit. A license has been granted for this purpose.
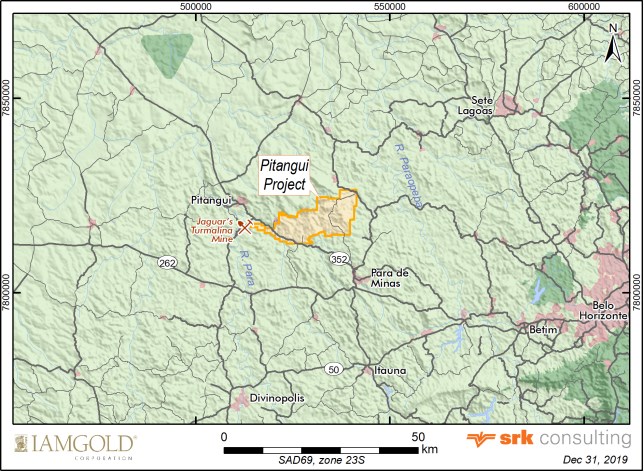
Figure 4: Location and Access of the Pitangui Gold Project
The Pitangui region has a history of mining, including Jaguar Mining's nearby Turmalina mine, located approximately 7 kilometres west of the city of Onça do Pitangui. In addition, several large iron and gold mines are located approximately 110 kilometres to the east. This history has resulted in a mining-aware environment throughout the region in which experienced mining personnel and infrastructure are available. Furthermore, the cities of Pitangui and Belo Horizonte host institutions which offer mine technician and university level geology courses, respectively.
Project infrastructure for the São Sebastião gold deposit is located in the nearby town of Onça de Pitangui and the village of Jaguara de Minas and includes a core shed facility for drill core logging sampling, and storage, offices, and housing.
4.3 Climate
The climate in the Pitangui Project area is defined by two distinct seasons. The dry season lasts from April to September and is characterized by temperatures ranging from 13 to 28°C and a lack of precipitation. The rainy season spans October to March and is characterized by temperatures ranging from 20 to 35°C and frequent tropical storms. The yearly average rainfall precipitation is between 1,400 and 1,500 millimetres (CPRM, 2011).
Gravel roads to the project area are accessible in all seasons. Exploration and mining in the area is possible throughout the year.
4.4 Physiography
The São Sebastião gold deposit is situated in a region of low topographic relief, comprising gently rolling hills with an average elevation of 750 to 800 metres. Local weathering-resistant geology, mainly banded iron formations, have led to linear topographic features reaching a maximum height of 1,060 metres (CERN, 2012).
The area directly surrounding the project comprises mostly pasture fields. Original vegetation, comprising tropical deciduous forest transitioning into Brazilian savannah, is locally preserved. Rock outcrops are scarce and limited to road cuts. General illustrations of the physiography of the project area are shown in Figure 5.

Figure 5: Typical Landscape in the Project Area
Images A-D represent a mosaic of landscape images from within the project area
5 History
The Pitangui Project is located at the north-west extension of the Quadrilátero Ferrifero, which hosts a number of significant mineral deposits, iron and gold being the most economically important. The discovery of gold in the Pitangui region dates back to the early 18th century and modern gold exploration in the Pitangui greenstone belt began in the late 20th century. Regional scale exploration in the Pitangui greenstone belt was conducted by Anglo American and its subsidiary Unigeo, replaced by AngloGold, between the late 1970s and early 1990s, culminating in the discovery of what is now the Turmalina Mine approximately 20 kilometres to the west of the São Sebastião gold deposit.
No exploration work was performed on the Pitangui property prior to exploration by IAMGOLD. The Pitangui applications/concessions were originally claimed to gain the mineral right control over some of the most promising lithologies and structures detected from field reconnaissance work and by the interpretation of a Minas Gerais State sponsored airborne geophysical survey.
Initial exploration by IAMGOLD started in 2009 with regional geologic mapping and a soil geochemistry grid program over concessions covering the São Sebastião gold deposit. The first drilling campaign was conducted in the latter half of 2011 and nearly 88,000 metres have been drilled up to July 2019.
5.1 Prior Ownership and Changes
The São Sebastião gold deposit was discovered by IAMGOLD. There are no prior owners or ownership changes.
5.2 Previous Mineral Resource Estimates
A mineral resource estimate was prepared by SRK in early in 2014, documented in a National Instrument 43-101 technical report. The deposit was estimated at 638 thousand ounces of gold with an average grade of 4.88 grams of gold per tonne (g/t gold) using a cut-off of 3.00 g/t gold. All the reported mineral resources were classified as Inferred (Table 2).
Table 2: Mineral Resource Statement* São Sebastião Gold Deposit, Minas Gerais, Brazil, SRK Consulting (Canada) Inc., January 9, 2014
|
Category
|
Quantity
|
Grade
|
Contained Metal
|
|
('000 tonnes)
|
Au (gpt)
|
Au (000'ounces)
|
|
Inferred
|
4.070
|
4.88
|
638
|
|
* Reported at a cut-off grade of 3.0 grams of gold per tonne based on an underground mining scenario, metal prices of US$1,500 per ounce for gold, metallurgical recovery of 93% for gold and an exchange rate of C$1.10 to US$1.00. All figures rounded to reflect the relative accuracy of the estimates. Mineral resources are not mineral reserves and have not demonstrated economic viability.
|
SRK understands that IAMGOLD generated an internal Mineral Resource estimate in 2016 documenting an estimated at 679 thousand ounces of gold at an average grade of 5.00 g/t at a cut-off of 2.5 g/t gold (Table 3). All these mineral resources for the São Sebastião deposit were classified as Inferred.
IAMGOLD published a press release in early 2018 documenting an internal mineral resource estimate of 819 thousand ounces of gold with an average grade of 4.75 g/t, at a cut-off grade of 2.50 g/t gold. All of the mineral resources for the São Sebastião deposit were classified as Inferred at this time.
Table 3: Mineral Resource Statement* São Sebastião Gold Deposit, Minas Gerais, Brazil, IAMGOLD Corporation, December 31, 2015
|
Category
|
Quantity
|
Grade
|
Contained Metal
|
|
('000 tonnes)
|
Au (gpt)
|
Au (000'ounces)
|
|
Inferred
|
4.252
|
5
|
679
|
|
* Notes:
1. CIM Definitions were followed for classification of Mineral Resources;
2. Mineral Resources are estimated at a cut-off grade of 2.5 g/t Au;
3. Mineral Resources are estimated using a gold price of US$1,500 per ounce and metallurgical recovery of 93.5%;
4. High grade assays are capped from 10 g/t to 22 g/t depending on domain;
5. Bulk density of 3.24 t/m3 was used for all rocks;
6. The Mineral Resource Estimate is constrained within economical domains with a minimal vertical thickness of 2.5 m.
|
5.3 Historical Production
There has been no historical production on the São Sebastião gold deposit. In addition, SRK is not aware of any artisanal or irregular small-scale miners operating within the project area.
6 Geological Setting and Mineralization
6.1 Regional Geology
The Pitangui Project is located in the Southern tip of the western sector of the Neoarchean to Proterozoic São Francisco craton in the area referred to as the Quadrilátero Ferrifero (Figure 6 and Figure 7; Almeida, 1977; Alkmim, 2004; Hasui et al., 2010). The Quadrilátero Ferrifero is composed of Archean greenstone belts, Archean to Proterozoic granite-gneiss terrains, and Neoarchean to Proterozoic supracrustal units (Baltazar and Zucchetti, 2007). The Quadrilátero Ferrífero is a mineral-rich region in Brazil hosting iron, gold, manganese, aluminum, topaz and emerald. Extensive gold production has occurred since the 18th century and is mainly hosted in the Meso- to Neoarchean Rio das Velhas Greenstone Belt (Machado and Carneiro, 1992; Machado et al., 1992, 1996; Schrank et al., 2002; Hartmann et al., 2006; Noce et al., 2007; Baltazar and Zucchetti, 2007; Moreira et al., 2016).
The Rio das Velhas Greenstone Belt is the main greenstone belt in the Quadrilátero Ferrífero and represents a collage of oceanic fragments resulting from the tectonic amalgamation of continental crust and metavolcano-sedimental units of approximately 2.79 to 2.75 billion years old (Ga). Several potassic intrusive complexes were generated through the final stages of the orogeny. The greenstone belt is overlain by 2.55 to 2.58 Ga clastic and chemical metasedimentary rocks of the Minas Supergroup (Dopico et al., 2017).
The Rio das Velhas Greenstone Belt comprises the Rio Das Velhas Supergroup, subdivided into the Nova Lima and Maquiné Groups and is tectonically juxtaposed against granite-gneiss terrains. The Nova Lima Group comprises mainly mafic volcanic rock with komatiitic flows at the base, clastic sedimentary units, abundant chemical sedimentary rocks including iron, quartz-dolomite and quartz-ankerite formations, conglomerate and carbonaceous phyllite. There is no widely accepted stratigraphy for the Nova Lima Group due to intense deformation, hydrothermal alteration, and weathering in the Quadrilátero Ferrifero. Ages for the volcanic rocks in this group range from 3,035 to 2,772 million years old (Ma) (Baltazar and Zucchetti, 2007). The Maquiné Group comprises sandstones, conglomerate and quartz-phyllite that unconformably overlie the Nova Lima Group.
Proterozoic supracrustal units are represented by the Minas, Espinhaço and São Francisco Supergroups that were deposited in passive margin basins during intermittent episodes of rifting (Baltazar and Zucchetti, 2007; Castro and Dardenne, 2000).
The Pitangui Greenstone Belt is a northwest- trending synclinorium interpreted as the northwest extension of the Rio das Velhas Greenstone Belt (Heineck et al., 2003; Romano, 2007; Pinto, 2014).
It is bound to the southwest by the Divinópolis Complex and the northeast by the Belo Horizonte Complex. The east and northeastern part of the belt are bound by the Pequi and Florestal intrusive complexes. The belt is covered by the Ediacaran sedimentary rocks of the Bambuí Group to the northwest. The southeastern part of the belt is characterized by the presence of the Jaguara granitic stock.
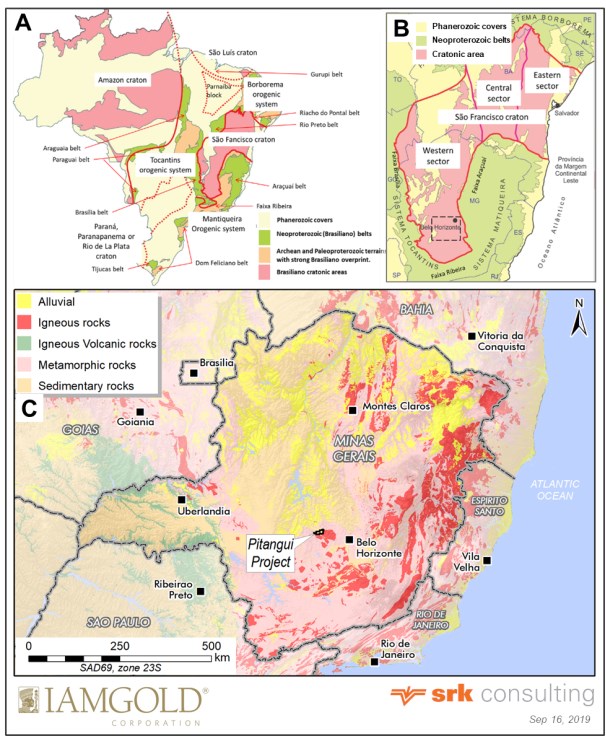
Figure 6: Regional Geology Setting
A: Brazil's main cratonic areas, Brasiliano (Neoproterozoic) mobile belts and phanerozoic sedimentary covers.
B: Subdivisions of the São Francisco craton; dashed rectangle corresponds approximately to the area of Figure 7.
C: Regional geological setting of the Pitangui Project
Source: maps (A) and (B) were modified after Hasui et al. (2010). Map (C) is SRK.

Figure 7: Regional Geological Setting of the Quadrilátero Ferrífero in the South Sector of the São Francisco Craton
Source: Modified after Dorr (1969), Corrêa Neto et al. (2012), Pinto and Silva (2014) and Brando Soares et al. (2018, 2019).
6.2 Property Geology
The geology of the Pitangui Greenstone Belt is divided into lower, middle and upper units by IAMGOLD. The lower and middle units can be broadly correlated with the Nova Lima Group, while the upper unit can be correlated with the Maquiné Group of the Rio das Velhas Greenstone Belt. A similar division of units was proposed by Brito et al. (2016). Table 4 contains the main three stratigraphic interpretations of the belt.
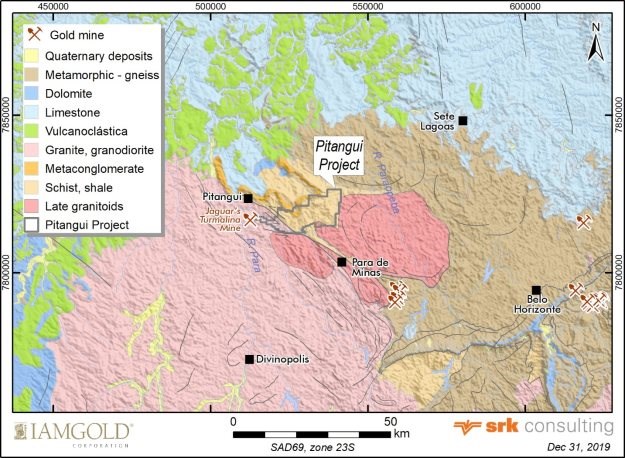
Figure 8: Property Geology of the Pitangui Project
The lower unit comprises ultramafic and mafic volcanic rock intercalated with Algoma-type banded iron formation, clastic and chemical metasedimentary rocks. Schists of chlorite, talc, sericite and biotite are common of this unit. Metavolcanic mafic and ultramafic rocks are predominant in the lower part of the lower unit. Clastic and chemical medisedimentary rocks include pelites, sandstones, BIFs and cherts (Table 4). The maximum depositional age for the metasandstones is estimated at 2.86 Ga (Soares et al., 2017).
The stratigraphy of the lower unit can be divided into five main intervals (Figure 9):
1. Interval I comprises a succession of interbedded metasandstones, BIFs and minor metapelites.
2. Interval II represents an approximately 100-metre thick package of interbedded turbiditic metasediments. The BIF layers of this interval are collectively referred as the Pimentão BIF.
3. Interval III consists of ultramafic metavolcanic and carbon-rich metapelitic rocks containing thin metachert lenses.
4. Interval IV comprises metasedimentary rocks containing lenses of carbon-rich metapelite at the base. This interval is overlain by a 2- to 30-metre thick layer of laterally extensive BIF termed the Biquinho BIF.
5. Interval V is composed of a roughly 5-metre thick mafic metavolcanic unit interstratified with a 3- to 5-metre unit of thinly layered BIFs termed the Tomate zone. This interval contains thick packages of metasandstones interbedded with mafic metavolcanic rocks.
The middle unit is composed of clastic metasedimentary rocks with minor chemical metasedimentary and metavolcanic rocks. Interbedded phyllites (both carbonaceous and sericitic), sericite and biotite schists, and micaceous quartzites are common (Table 4). Maximum depositional age is inferred to be 2.76 Ga through uranium-lead isotopic data of detrital zircon grains.
Table 4: Comparisons Between Stratigraphic Divisions Proposed for the Pitangui Greenstone Belt
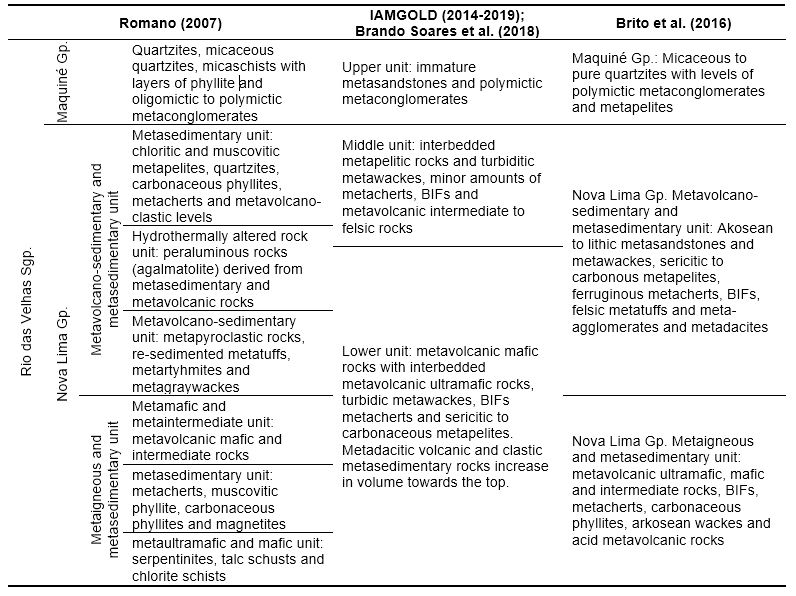
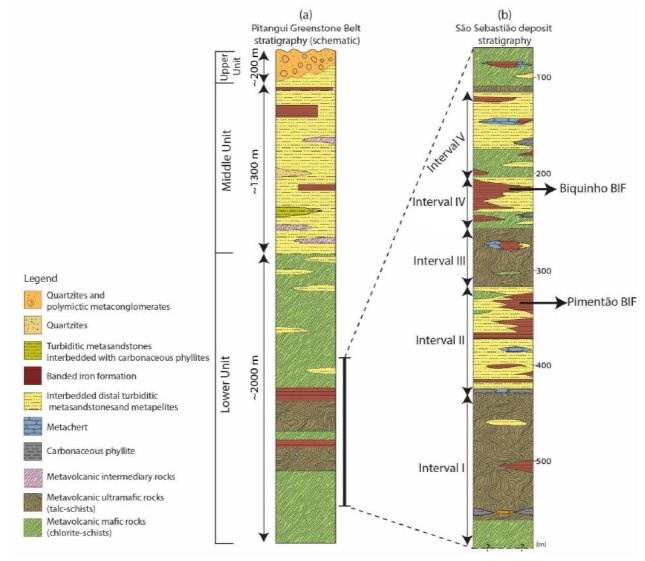
Figure 9: Schematic Stratigraphic Columns
A: Pitangui Greenstone Belt
B: São Sebastião deposit
Source: Brando Soares et al., 2017
The upper unit is correlated with the Casa Forte Formation of the Maquiné Group and comprises micaceous quartzites, quartz-schists and polymictic metaconglomerates. This unit is exposed at surface in the northern sector of the belt.
6.3 Structure
The granite-gneiss terrains and greenstone belts comprising the Quadrilátero Ferrífero were affected by three main orogenic events. These include:
1. The ~2,750 to 2,650 Ma Rio das Velhas orogeny resulting from overall northeast-southwest compression (Baltazar and Zucchetti, 2007).
2. The 2,100 to 1,900 Ma Rhyacian-Orosirian orogeny, also known as Transamazonian orogeny, resulting in the formation of the São Francisco paleocontinent.
3. The ~600 to 500 Ma Panafrican-Brasiliano orogeny associated with east-west thrusting along the easternmost portion of the Quadrilátero Ferrífero (Alkmin and Marshak, 1998; Noce et al., 2007).
Baltazar and Zucchetti (2007) recognize four generations of structures in the Rio das Velhas Greenstone Belt, related to these three deformation events. The formation of west- to northwest-striking faults and folds is attributed to the first stage (D1) of a progressive compressional deformation event (D1-D2) during the Rio das Velhas orogeny. During the second stage of this orogeny (D2) southwest-verging, northwest-striking ductile shear zones and associated overturned tight to isoclinal northwest-trending folds were formed that exhibit a spatial relationship with gold deposits. Diapiric uprising of batholiths as metamorphic core complexes during the Rhyacian-Orosirian orogeny (D3) coincided with the formation of regional-scale open and upright synclines in the Archean and overlying Proterozoic supracrustal units. These fold structures define the quadrangular shape of the Quadrilátero Ferrífero. Domes comprised of granite-gneiss basement blocks also developed during this stage of deformation. The Panafrican-Brasiliano orogeny (D4) resulted from initial east-west compression evolving into transpressional late-orogenic belt-parallel tectonics that affected the eastern margin of Brasil, but also the western part of the Quadrilátero Ferrífero.
Three deformation events can be recognized within the Pitangui greenstone belt. Lithological domains are oriented northwest with variable dips (Heineck et al., 2003; Romano, 2007, Reis et al., 2017). Key structural features include:
- D1 isoclinal to tight recumbent northwest-plunging folds and bedding-parallel shear zones, and an S1 foliation that strikes northwest subparallel to bedding (except in fold hinges).
- D2 open to tight northwest-plunging folds with steep to moderate dipping axial planes that refold earlier isoclinal folds, northwest-striking, northeast-dipping shear zones, and a weakly developed S2 axial planar and crenulation cleavage.
- D3 open northeast-plunging folds and an associated S3 spaced, axial planar and crenulation cleavage.
The similarity in the style and orientation of D1 and D2 structures may indicate development during a single progressive deformation event. The main penetrative tectonic fabric (S1) is tangential to the relict sedimentary bedding. S1 foliation is also associated with bedding-tangential shear and thrust fault zones. Those structures can be used to define a pervasive D1 deformation phase, related to northeast-southwest shortening and tectonic transport.
The São Sebastião gold deposit is located along the northeastern limb of the D2 Jaguara anticline, which is an open asymmetric fold plunging northwest and verging southwest. The overall structural pattern of the Pitangui greenstone belt can be described as a dome-and-basin fold interference pattern at surface.
The metamorphic signatures in the Pitangui Greenstone Belt indicate maximum pressure-temperature conditions within the lower- to medium amphibolite facies (Romano, 2007; Brando Soares et al., 2017; Silva et al., 2018). In the belt's northwestern sector, maximum temperatures around 600°C were estimated using the garnet geothermometer (Silva et al., 2018). Most of the belt exhibits regional metamorphism in the biotite zone, with sporadic occurrence of garnet and hornblende, followed by widespread retrograde-metamorphism to chlorite.
6.4 Mineralization
Gold mineralization at the São Sebastião deposit is contained within deposits hosted in three main strata-confined sulfidation zones within several stacked BIF layers in the lower unit of the Pitangui greenstone belt. The mineralized zones are locally named Tomate, Biquinho and Pimentão from top to bottom. The main mineralized zone is Biquinho. One of the smaller zones, Pimentão, is located within a thrust-fold with the fold-axis gently plunging to north and gold mineralization concentrated in one of its limbs.
The main mineralized zones in the São Sebastião gold deposit are hosted in the two most continuous BIF packages (Biquinho and Pimentão) of the lower unit, corresponding to intervals II and IV as shown in Figure 9.
Sulfide mineralization in these zones most commonly occurs as disseminations replacing magnetite, however occasional massive sulfide mineralization in quartz-carbonate veins and breccias can occur. Pyrrhotite is the dominant sulfide, followed by arsenopyrite, pyrite and chalcopyrite, which appear in smaller concentrations.
The following mineralization styles have been identified in BIFs from the São Sebastião deposit (Figure 10 and Figure 11):
1. Disseminated sulfides: generated after the replacement of magnetite by sulfides, this style composes the vast majority of the deposit's volume. This mineralization style is tabular and follows the relict bedding.
2. Sulfides in breccia zones: breccia zones with thickness variating between a few centimetres to a few metres can be found in the São Sebastião deposit, such as in fold hinges.
3. Quartz-carbonate-sulfides veins: these veins contain variable amounts of sulfides and may be spatially associated to breccia zones.
4. Other styles of sulfidation: sulfides disseminated in chlorite schists, carbonaceous phyllites and turmalinites can also be found.

Figure 10: Drill Core Photos Illustrating Mineralized and Barren BIFs from the São Sebastião Gold Deposit
A: Non-mineralized BIF, FJG56 drillhole, 275.5 m, 0.019 g/t gold.
B: "Biquinho" mineralization, with pyrrhotite replacing magnetite and a small breccia zone (pyrrhotite and pyrite), FJG84 drillhole, 156.6 m, 9.96 g/t gold.
C: "Biquinho" mineralization, euhedral arsenopyrite overgrowing pyrrhotite, FJG53 drillhole, 155.60 m, 9.90 g/t gold. NQ2 cores, each pictured core is 5.2 cm wide.
Source: Extracted from Almeida et al. (2016).
Gold at the São Sebastião deposit occurs as native gold and electrum. Gold in the deposit is free but fine-grained; it occurs as rounded to semi angular grains with sizes ranging from <5 to 200 microns, usually between 10 to 20 microns.
Gold inclusions are common in pyrrhotite crystals from breccia zones but have also been identified in pyrrhotite crystals formed after magnetite. Larger gold grains are located between crystals of gangue minerals (50 to 200 microns). Rounded, fine-grained (approximately 10 microns) gold inclusions displaying exsolution features can be found in pyrite crystals. In arsenopyrite crystals, free gold can be seen filling fractures (grains from 20 to 80 microns), as fine-grained inclusions (approximately 5 to 10 microns) or, more rarely, in the borders of crystals. Small amounts of invisible gold (approximately 150 parts per million) were detected in less common arsenical pyrite crystals. Scanning Electron Microscopic (SEM) images of gold are displayed in Figure 12.
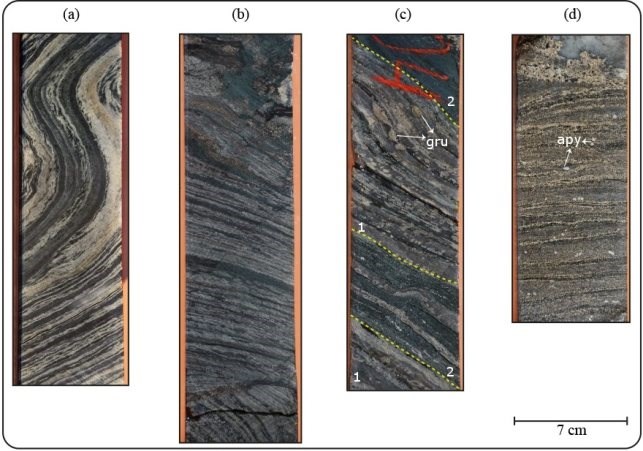
Figure 11: Drill Core Photos Illustrating Mineralized BIFs
A: Oxide-facies BIF displaying alternate dark gray (magnetite-rich) and white (chert-rich) microbands.
B: Oxide-facies BIF with greenish shear-bands (chlorite-rich).
C: Radial grunerite agglomerates (gru) growing between chert-rich and magnetite-rich bands in silicate-facies BIF. 1 - shear-band poor domains; 2- shear-band rich domains. Domains are separated by yellow dashed lines.
D: Sulfide-facies BIF with disseminated pyrrhotite and euhedral arsenopyrite (apy) crystals.
Source: IAMGOLD

Figure 12: SEM Images of Gold Grains from the São Sebastião Gold Deposit
A: Fracture in arsenopyrite (apy) filled with gold (Au) and pyrrhotite (po), FJG 84, 149.80 m.
B: Bright-colored particle composed of native gold and bismuth as inclusion in pyrrhotite from a breccia zone and associated to a coarse (0.5 cm) quartz (qtz) crystal, FJG-112, 246.63 m.
C,D: Bismuth and gold droplets formed around ankerite (ank) and qtz crystals, FJG-109, 160.08 m.
E: Gold inclusion/exsolution in pyrite1 (py1); pyrite1 forms intergrowths with ISS, chalcopyrite1 (ccp1) and stilpnomelane (stp), FJG-86, 126.30 m.
F: Gold and scheelite (sch) inclusions in pyrite1; sphalerite (sph) is surrounded by pyrite 1, FJG-86, 126.30.
G: Gold crystal with quartz inclusions associated to pyrrhotite and to the gangue minerals (ankerite + quartz), FJG-115, 150.29 m.
H: Fractures in arsenopyrite filled by pyrite 1 and ISS, which are associated with native bismuth, stilpnomelane, quartz and ankerite, FJG-47, 50.56 m.
Source: Extracted from Brando Soares et al. (2018).
7 Deposit Types
The style of gold mineralization in the São Sebastião deposit is similar to many other Banded Iron Formation (BIF) -hosted deposits in the Rio das Velhas Greenstone Belt in the Quadrilátero Ferrifero. The Rio das Velhas Greenstone Belt, including the northwest-trending volcano-sedimentary belt, referred to as the Pitangui belt, hosts a number of large gold deposits, including the Morro Velho, Cuiabá, São Bento, Raposos, Faria, Bicalho, and Bela Fama deposits (Groves et al., 1998; Goldfarb et al., 2001), as well as hundreds of smaller individual gold occurrences. Gold mineralization within the Quadrilátero Ferrífero of Brazil is typically hosted by Algoma-type BIFs, felsic and mafic metavolcanic rocks and clastic metasedimentary rocks of the Nova Lima Group, Rio das Velhas Supergroup (Lobato et al., 2001, 2007). All of these deposits, regardless of size, are structurally controlled, related to either shear zones or folds, and are characterized by extensive down-plunge continuity (Vial et al., 2007).
Several styles of gold mineralization have been recognized in the Rio das Velhas Greenstone Belt. The main styles include:
- Banded iron formation-hosted gold (e.g., Cuiabá, São Bento, Raposos).
- Lapa seca (a term used to describe massive ankerite/ferroan dolomite, quartz and plagioclase rock; e.g., Morro Velho, Bela Fama).
- Orogenic-type quartz veins (e.g. Juca Vieira, Fernandes).
Another group of gold deposits are hosted by Paleoproterozoic sedimentary rocks, including those of the Minas Supergroup. This second group can be subdivided into three types, including:
- Arsenopyrite-tourmaline-bearing quartz veins hosted by ductile-brittle shear zones in quartzites and phyllites of the Caraça Group and overlying Lake Superior-type banded iron formations of the Cauê Formation (Minas Supergroup, e.g., Passagem de Mariana) (Vial et al., 2007b; Cabral and Koglin, 2011).
- Gold-palladium deposits associated with itabirites (metamorphosed oxide iron formation) of the Minas Group, also referred to as Jacutinga-type gold mineralization (Cabral, 2006; Galbiatti et al., 2007).
- Paleoproterozoic sediment-hosted Witwatersrand-type gold deposits in the lowermost unit of the Minas Supergroup (e.g., Palmital and Ouro Fino).
Similar to the São Sebastião deposit, gold mineralization at Cuiabá and Raposos occurs as multiple mineralized lenses composed of massive and disseminated sulfide zones (pyrrhotite, pyrite and arsenopyrite with minor amounts of chalcopyrite) hosted by poly-deformed Algoma-type BIFs interbedded within mafic to felsic metavolcanic rocks and pelitic metasedimentary rocks (Lobato et al., 2007; Junqueira et al., 2007).
The Turmalina gold deposit owned by Jaguar Mining is located 20 kilometres west of the São Sebastião gold deposit in the Pitangui greenstone belt and is the only mine currently in production. This deposit comprises five main zones of shear-hosted quartz-sulphide veins and minor sulphide dissemination zones within metasedimentary, and mafic and ultramafic metavolcanic rocks.
The Cuiabá, Raposos and Turmalina gold deposits present similar hydrothermal alteration mineral assemblages composed of sulfide-rich core zones (pyrrhotite with varied amounts of arsenopyrite, pyrite and chalcopyrite) with chlorite, sericite and carbonate halos. Mineralization occurs as disseminations, massive sulfides or in vein zones, often stratabound and structurally controlled by fold hinges, shear and breccia zones.
The São Sebastião gold deposit has features and characteristics that allow classification as an epigenetic Archean orogenic gold deposit (e.g., Groves et al., 1998; Goldfarb et al., 2001). These can be summarized as: 1) mineralization associated with a stage of crustal deformation; 2) lithological control: major gold deposits in the Quadrilátero Ferrifero are hosted by and confined to banded iron formation; 3) strong structural control on the distribution of gold mineralization: major gold deposits in the Quadrilátero Ferrifero show an extensive down-plunge continuity relative to strike length and width (up to 20 metres); 4) epigenetic nature of the mineralization: sulphidation is interpreted as the major host rock alteration and gold deposition mechanism; and 5) the geochemical signature: gold mineralization has a positive correlation with arsenic content.
Exploration techniques used to explore for this deposit type include surface rock and soil sampling in conjunction with detailed structural and geological mapping. Geophysical surveys, particularly magnetic, electromagnetic, and induced polarization methods are useful in defining sulphide-rich zones that may be auriferous.
8 Exploration
The IAMGOLD Brazil exploration team selected the Pitangui Greenstone Belt as a target for regional greenfield exploration during a country-wide evaluation program conducted between 2006 and 2007. Exploration plans were based on IAMGOLD's interpretations of available geological maps and regional government-sponsored airborne geophysical surveys.
Initial exploration of the Pitangui Project began in 2007 with regional geological reconnaissance covering area of 200 square kilometres, permit applications and an initial 19 chip samples. The reconnaissance program continued in 2009 with the collection of 109 stream sediment samples. Between 2009 and 2010, IAMGOLD completed 150 square kilometres of regional-scale mapping and a 400 × 50 metres open-grid soil geochemical survey over two specific sectors of the mineral exploration concessions. The first sector was chosen based on initial geological reconnaissance results, and proximity to structural trends known to host historical gold workings near Onça do Pitangui town. The other sector is adjacent to Jaguara village and was selected for the occurrence of BIFs. There are no previous records of gold occurrences or historical gold workings in the area of Jaguara village, located approximately 10 kilometres east of the structural trend near Onça do Pitangui town.
These efforts yielded several gold anomalies, including the São Sebastião gold deposit adjacent to the Jaguara village. The first drilling program was initiated in the second half of 2011 targeting anomalous soil results at Onça do Pitangui town and Jaguara village. Assay results proved the existence of gold mineralization at both targets, but the results and lithologies intersected at São Sebastião encouraged further exploration interest.
In 2012 an airborne radiometric and magnetic survey was completed by Fugro GeoServices Ltd (Fugro). A total of 2.056 linear kilometres were flown, covering an area of 92 square kilometres. Areas with high density of facilities (chicken-farms) were excluded from this airborne survey.
In 2014 an airborne VTEM survey was performed by Geotech ltd. (Geotech) on the eastern portion of Pitangui Project. A total of 617.5 linear kilometres were flown, covering an area of 57 square kilometres.
An additional airborne magnetic survey using an Unmanned Aerial Vehicle (UAV) was conducted by STRATUS AERONAUTICS. The goal of this survey was to extend the detailed magnetic data obtained from the 2012 airborne survey to areas that were not previously surveyed due to the density of chicken farms. This UAV-borne survey covered 473 linear kilometres on the northeastern sector of the Property.
Several ground geophysical surveys were conducted over IAMGOLD permits between 2012 and 2016. The methods adopted during the delineation of São Sebastião gold deposit include Induced Polarization/Resistivity (IP/RES), Down-Hole Induced Polarization (DHIP), Time-Domain Electromagnetic (TDEM), and Borehole Electromagnetic (BHEM). Ground geophysical surveys (IP, TDEM and BHEM) were also conducted over regional targets (Aparição and Vilaça) during this period.
Surface geochemistry programs and geological mapping were extended towards the north and northeast within the IAMGOLD permits. These additional geochemical surveys covered continuation along strike of known gold anomalies in surface and regional structures (lineaments) on the central portion of Pitangui Project. These efforts yielded some new targets, such as Aparição, approximately 4 to 6 kilometres southeast of the São Sebastião gold deposit plus Vilaça, about 9 km north-northeast of the deposit. Figure 13 summarizes the regional exploration work conducted by IAMGOLD.
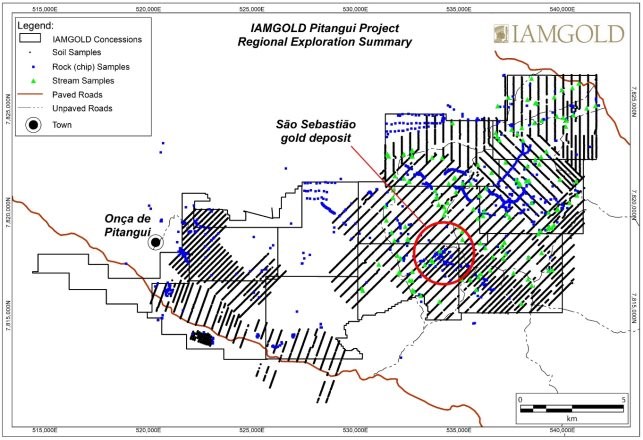
Figure 13: Summary of Regional Exploration Conducted by IAMGOLD, Pitangui Gold Project
UTM Coordinates, DATUM Córrego Alegre, Zone 23S
Source: IAMGOLD
9 Drilling
9.1 Introduction
IAMGOLD has drilled a total of 232 core boreholes (approximately 88,034 metres) at the São Sebastião gold deposit between 2011 and 2019, including eight deflection boreholes. All boreholes were conducted from surface with up to a maximum borehole length of 792 metres. The details of this drilling are presented in Table 5 and Figure 14.
Table 5: Summary of Drilling on Pitangui Project, Brazil
|
Company
|
Year
|
Total Drilled (m)
|
Rigs at the Site
|
|
IAMGOLD
|
2011
|
1,319
|
1
|
|
2012
|
7,747
|
1
|
|
2013
|
14,497
|
2
|
|
2014
|
21,067
|
4
|
|
2015
|
7,674
|
2
|
|
2016
|
2,166
|
1
|
|
2017
|
9,567
|
1
|
|
2018
|
17,600
|
2
|
|
2019
|
6,396
|
2
|
|
Total
|
|
88,034
|
|
9.2 Drilling by IAMGOLD (2011 - 2019)
IAMGOLD defined the initial core drilling program to test geochemical/geophysical anomalies determined by greenfield exploration. This drilling program was designed close to Jaguara village (São Sebastião gold deposit) on a 100 × 100-metre and 50 × 50-metre grid with section-lines oriented in a NE-SW direction.
Between October and November 2011 IAMGOLD conducted a reconnaissance drilling program at the São Sebastião gold deposit comprising 5 core boreholes and one deflection borehole for a total of 1,319 metres. In 2013, the 'discovery hole' (borehole FJG40) was drilled, which intersected significant mineralization including 4.33 g/t gold over 23.85 metres (from 131.29 to 155.14 metres) at Biquinho Zone; and 2.79 g/t gold over 10.50 metres (from 228.94 to 239.44 metres) at Pimentão Zone.
In 2014 IAMGOLD implemented a core drilling program utilizing 4 drill rigs to further delineate these mineralized zones, which totaled 21,067 metres.
All drilling at the Pitangui Project between 2011 and 2014 was restricted to pasture, plantation or non-vegetated areas due to environmental limitations. Mindful of the restrictions, in 2014 IAMGOLD began an infill core drilling program in the central sector of the deposit on a grid of 50 × 50 metres.
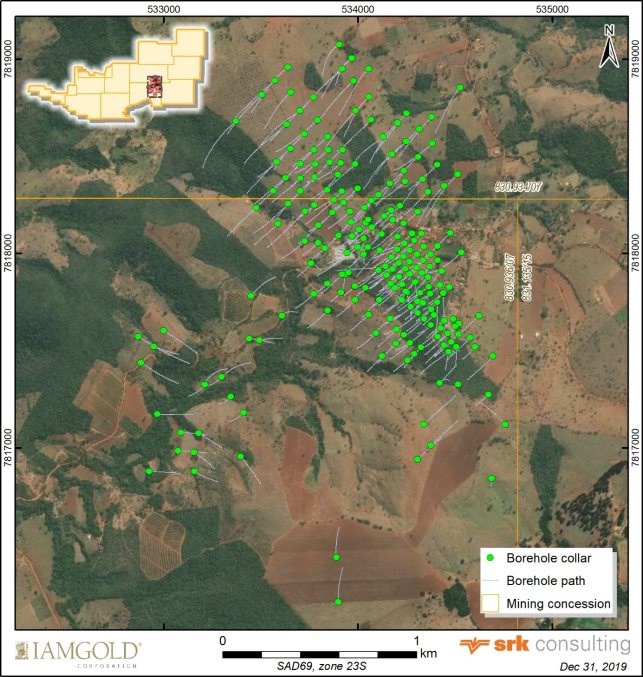
Figure 14: Map Showing the Distribution of Drilling at the São Sebastião Gold Deposit from 2011 to 2019
Core drilling conducted by IAMGOLD between May 2015 and October 2016 focused on regional targets, such as Aparição, Barreiro, São Francisco and Vilaça of the Pitangui Project due to environmental restrictions. IAMGOLD was granted the required environmental license in 2017.
Subsequent to the granting of the environmental permits, drilling activities between 2017 and 2019 focused on delineating the down- and up-plunge extension of the São Sebastião gold deposit. During this program, the main mineralization zones (Tomate, Biquinho and Pimentão; Figure 15) were defined and a new zone was identified (Upper Pimentão).

Figure 15: Gold Mineralization Zones (Tomate, Biquinho and Pimentão), São Sebastião Gold Deposit
Source: IAMGOLD
9.3 Drilling Procedures and Approach
All drilling was undertaken by Mata Nativa Comércio e Serviços Ltda., an independent contractor from Nova Lima, Minas Gerais, Brazil. Boreholes are drilled with HQ diameter equipment for weathered material including soil, laterite and saprolite, and with NQ2 diameter equipment for fresh rock.
All borehole collars were surveyed according to the local UTM coordinates (Corrego_Alegre_UTM, Zone 23S) using a handheld GPS before drilling commenced. The handheld GPS is kept in place for three to four minutes during each measurement to increase accuracy. Following the completion of drilling and the removal of the drill rig, collar locations were marked with a PVC pipe and concrete blocks, and labeled according to borehole ID, azimuth, dip, and commencement and completion dates of the boreholes. For boreholes that were selected for down-hole geophysical surveys, the drill casings were left in-situ.
Drilling platforms of approximately 11 metres x 12 metres were assembled by IAMGOLD staff. Once assembled, using a geological compass, two wooden stakes are positioned in the orientation of the borehole azimuth. The drill rig is then aligned parallel to this orientation by the drill contractor, while under the supervision of IAMGOLD staff. If required, additional positioning to ensure correct azimuth and dip of the drill rig is performed with the use of a geological compass and a clinometer. REFLEX EZ-GYRO (EZ-GYRO) tool is used for drill pads close to outcropping banded iron formation.
IAMGOLD employees continuously supervise drilling operations to ensure that correct health and safety protocols, environmental standards and drilling procedures are being followed. At the end of each drilling shift, core boxes are delivered by Mata Nativa staff to IAMGOLD's core shed in Jaguara Village.
Borehole collars are surveyed with a handheld Differential GPS (DGPS) unit once drilling is completed. Boreholes are cased with 50- or 70-millimetre PVC pipe to the weathering level. Occasionally steel casing is left in-situ for geophysical survey. Collar locations are marked with PVC pipes and labeled by borehole ID, azimuth, dip, length, and the date of drilling.
Core recovered from all boreholes was oriented. From 2011 to January 2013 (up to borehole FJG28), core orientation was performed using a spear. This method involves lowering a heavy steel spear inside drill rod after the inner tube is removed; The heavy spear slides along the base of the rods and mark the bottom edge of the core for the subsequent drill run. From February 2013 onwards (starting at borehole FJG29) with the exception of borehole FJG40, core orientation was performed using the REFLEX ACT III (ACT) tool. The ACT tool used a digital system that allowed the user to orient the core at three-metre intervals.
Upon delivery to the core shed, IAMGOLD technicians assemble the core and an orientation line is drawn down the length of the core with a dermotographic pencil, where possible. Geomagnetic data is collected using a Portable Magnetic Susceptibility Meter SM-30 (ZH Instruments) every 0.2 to 0.5 metres for the entire length of the drill core. Geotechnical and magnetic data are recorded in a Microsoft Excel spreadsheet and sent to the geologist for review.
All geological core logging, including lithology, alteration and structure, was performed by IAMGOLD geologists with the use of notebooks and the GemsLogger application. Structural measurements were collected using an in-house core orienting tool prior to mid-2012 and using a Kenometer tool thereafter. Structural measurements are collected approximately every 1 to 3 metres, including banding, foliation, folding, veining and contacts. Pictures were taken of all core, typically prior to sampling. An example of drill core box storage is presented in Figure 16.
All digital data is stored on the IAMGOLD Brazil computer servers.

Figure 16: Photo of Drill Core Boxes
9.3.1 Surveying
Down-hole surveys were completed for all boreholes. Surveys for boreholes FJG01 to FJG214 were completed using a MAXIBOR down-hole survey. MAXIBOR uses relative down-hole measurements, considering the measurement collected in the previous station. For boreholes FJG215 to FJG232, down-hole surveys were performed using EZ-GYRO north-seeking tool with measurements taken every 10 metres. For validation purposes the deviation survey was measured twice for all boreholes.
9.4 Core Sampling Method and Approach
Drill core intervals selected to be sampled for assaying were marked with red marker by IAMGOLD staff. Core intervals to be sampled for other application such as petrographic studies, whole-rock chemical assays, organic carbon compound determination and geochronology were marked with a blue marker. Assay sample intervals range between 0.4 and 1.0 metres in length. Visual geological indicators that can limit the sampling interval include lithological contacts, hydrothermal alteration zones, and structural boundaries. Only core intervals that intersected BIF layers, veins and sulphide zones were sampled (with the exception of boreholes FJG01 to FJG09, in which core from the entire boreholes were sampled). Sampling was carried out by IAMGOLD technicians, under the supervision of IAMGOLD geologists. The sampling procedures were as follows:
- Core was placed in core boxes and transported by drilling staff from drilling platforms to the core shack at the end of each work shift.
- Once transported, core boxes were aligned according to increasing down-hole depth and reviewed by IAMGOLD staff for core recovery.
- Core orientation was marked by a continuous green line, photographed, and logged.
- Samples were marked using a red markers arrows pointing up the borehole, core was also marked along sample lines.
- The borehole length intervals were marked with metal tags in the core box.
- Samples were cut lengthwise using a diamond saw along the orientation line, where available, and one side was packed in plastic bags and sealed. The other half core was retained for future reference.
- Sample tags were taped to each sample bag and inserted in each sample bag.
- Sample bags were ordered sequentially, and standards and blanks were inserted at set intervals.
- One local blank sample inserted every 40th sample.
- One certified standard inserted every 20th sample.
- Photos of all samples, including standards and blanks were taken.
- A third party (TG Transportes) transported the samples by truck from the IAMGOLD core shack at Onça de Pitangui to one of two sample preparation labs in Goiânia (ACME labs), or in Belo Horizonte (ALS and ACME labs).
Sample identification codes comprise two parts, the borehole ID and a sequential sample number. All digital data associated with sampling is stored on the IAMGOLD Brazil computer servers.
9.5 Drilling Pattern and Density
Boreholes are designed using a southwest to northeast oriented grid. Borehole spacing in the centre of the deposit follows a 50 × 50 metres grid due to an infill drilling conducted in 2014 and 2015. Borehole spacing is approximately 100 × 100 metres elsewhere in the deposit area. Boreholes aim to intersect mineralized zones at an approximately perpendicular angle and maintain a regular distance between intersections at depth (Figure 14 and Figure 15).
9.6 SRK Comments
The procedures undertaken by IAMGOLD at the Pitangui Project for core drilling, handling, logging and maintenance of the database for the project are well managed, documented, and undertaken with a well-defined set of procedures that meet industry standard practice. These procedures, which encompass every aspect of the exploration cycle from drilling to database management are appropriate for the project and are well-understood and implemented by the exploration team. A diagram depicting the inter-relationship between the different exploration tasks is shown in Figure 17. SRK is not aware of any drilling, sampling or other factors that could materially impact the accuracy and reliability of the results discussed herein.

Figure 17: Diagram Showing Relationship Between Exploration Tasks at the Pitangui Project
Source: IAMGOLD Brasil
10 Sample Preparation, Analyses, and Security
Sample preparation and analytical procedures used by IAMGOLD between 2009 and 2014 are described by SRK (2014).
Exploration Samples collected by IAMGOLD personnel between 2009 and April 2015 were submitted to ACME analytical laboratories (ACME) in Goiânia and Vespasiano, Brazil, currently operating as Bureau Veritas Mineral Laboratories. Exploration samples collected between April 2015 and June 2019 were submitted to ALS Brasil Ltda. (ALS) in Vespasiano, Brazil. Both facilities are independent, commercial geochemical laboratories that operated independently from IAMGOLD. ACME, subsequently Bureau Veritas, is accredited to ISO 9001 global certification and have been accredited to ISO/IEC 17025:2005 since 2011 by the Standard Council of Canada (SCC) for the methods used by IAMGOLD. ALS is part of the ALS Global group of laboratories accredited to ISO 17025:2005 UKAS ref 4028 for tests used by IAMGOLD.
IAMGOLD used SGS GEOSOL laboratory in Vespasiano, Brazil for ICP check assays, and SGS in Lakefield, Ontario for metallurgical testwork and umpire testing of core samples. SGS GEOSOL is compliant with ISO 9001:2008 and 14001:2004 certified by ABS Quality Evaluation Inc. (USA) with accreditation by ANAB (USA) in April 2006. SGS in Lakefield is accredited to ISO/IEC 17025:2005 since May 2013 by the SCC (accredited laboratory no. 184).
10.1 Sample Preparation and Analyses
Sampling was performed by IAMGOLD personnel. Samples are grouped in batches of 15 and are transported from the core shack at Onça de Pitangui to the sample preparation laboratories by an independent carrier, TG Transportes Ltd., maintaining the chain of custody.
Core samples were prepared using a standard rock preparation procedure (drying, weigh, crushing, splitting, and pulverization).
From the onset of sampling in May 2009 until May 2013, sample preparation was completed at ACME Analytical Laboratory in Goiânia and Vespasiano, Brazil, where they were crushed, split and pulverized until passing a 200 microns mesh. Sample pulps were subsequently shipped to ACME Analytical Laboratory in Santiago, Chile for analyses. Gold was assayed through fire assay with an atomic absorption finish (ACME code G601 and G610). Samples were also assayed for a suite of trace elements using an aqua regia digestion and inductively coupled plasma-emission spectroscopy (ICP-ES, ACME code: Group 1D).
In March 2012, ICP check assays were performed at SGS GEOSOL Laboratory in Vespasiano, Brazil using an aqua regia digestion (SGS GEOSOL code: ICP14B). In December 2012, ICP check assays were conducted using four-acid digestion (SGS GEOSOL code: ICM40B).
From May 2013 to July 2013, sample preparation was performed solely by the ACME Analytical Laboratory in Vespasiano, Brazil, involving crushing, splitting and pulverization until passing a 200 microns mesh. Sample pulps were then shipped to two separate laboratories: ACME Analytical Laboratory in Santiago, Chile, for gold assays using a fire assay procedure with an atomic absorption finish (ACME code G601 and G610), and ACME Analytical Laboratory in Vancouver, Canada for analysis of trace elements using a four acid digestion and inductively coupled plasma-mass spectroscopy (ICP-MS, ACME code: Group 1T-MS).
From July 2013 to March 2015, samples prepared at the ACME Analytical Laboratory in Vespasiano, Brazil were all shipped to ACME Analytical Laboratory in Vancouver, Canada, by ACME, and assayed for gold using a fire assay procedure and an atomic absorption finish (ACME code G601 and G610), and for trace elements using four-acid digestion and inductively coupled plasma-emission spectroscopy (ICP-MS, ACME code: Group 1T-MS).
Samples collected by IAMGOLD personnel between April 2015 to June 2019 were submitted to ALS Minerals in Vespasiano, Brazil, for preparation and subsequently analyzed at ALS. Samples were crushed to 70% passing a 2-millimetre mesh, split by riffle splitter and pulverized to 85% passing a 75-micron mesh. Samples were analyzed for gold by fire assay with atomic absorption finish (ALS code Au-AA23), and for a suite of 48 elements through ultra-trace level method using inductively coupled plasma-atomic emission spectrometry (ALS code ME-MS61). Gold samples grading over 30 g/t were subsequently analyzed by a gravimetric finish (ALS code AU-GRA21).
Between September 2015 and November 2018, sample pulps were analyzed at a secondary umpire laboratory, SGS GEOSOL laboratory in Vespasiano, Brazil, for gold by fire assay with atomic absorption finish and multi-element using four-acid digestion (SGS GEOSOL codes: FAA313 and ICM40B).
10.2 Core Storage
After completion of all logging procedures, core boxes are stored in corridors of racks at the new core shed. Borehole information is indicated on secured metal plates facing the aisle for organized access. The boxes are stacked in sequence, from the bottom up and from left to right.
A location map of all drill core boxes is fixed at the new core shed and each corridor has an identification plate. IAMGOLD employees use manual vehicles for transporting drill cores boxes and use an adapted platform for accessing core boxes located on upper shelves.
Following analyses, pulps and crushed samples were returned to the IAMGOLD field camp at the Pitangui Project and are stored in plastic buckets. IAMGOLD's preferred policy is to retain rejects and pulps indefinitely, or until the start of production.
10.3 Specific Gravity Data
IAMGOLD measures density of drill core samples in fresh rock by water displacement method, using an in-house densimeter tool. The database contains 34,197 density measurements.
Density measurements in sampled intervals are taken from the remaining half of drill core in the core box, after sampling. Pieces of drill core which better represent the lithology of the sample with a minimum length of 10 centimetres are selected for the water displacement procedure. The lithology and the depth of the selected piece of core is registered in a spreadsheet together with its weights in air and in water. A "D" blue mark is registered at the measured piece of drill core after the procedure, for future verifications, if needed.
At intervals without samples (waste rock), density measurements are obtained every 5 metres, from entire pieces of drill core longer than 10 centimetres. Drill core samples in weathered rock (soil, laterite, saprolite, etc.) have not been measured.
For QA/QC purposes, duplicates are taken in every 20 samples and standards with certified weights are taken every 30 samples. Control measurements are revised by geologists and density values with variations greater than 1.5% are measured again.
10.4 Quality Assurance and Quality Control Programs
Quality control measures are typically set in place to ensure the reliability and trustworthiness of the exploration data. These measures include written field procedures and independent verifications of aspects such as drilling, surveying, sampling and assaying, data management, and database integrity. Appropriate documentation of quality control measures and regular analysis of quality control data are important as a safeguard for project data and form the basis for the quality assurance program implemented during exploration.
Analytical control measures typically involve internal and external laboratory control measures implemented to monitor the precision and accuracy of the sampling, preparation, and assaying process. They are also important to prevent sample mix-up and to monitor the voluntary or inadvertent contamination of samples.
Assaying protocols typically involve regularly duplicating and replicating assays and inserting quality control samples to monitor the reliability of assaying results throughout the sampling and assaying process. Check assaying is normally performed as an additional test of the reliability of assaying results. It generally involves re-assaying a set number of sample rejects and pulps at a secondary umpire laboratory.
SRK analyzed the analytical quality control data accumulated by IAMGOLD for São Sebastião gold deposit during the core drilling conducted between May 2013 and June 2019. Results of the IAMGOLD quality control program are discussed in Section 11.2.2 and summarized in Appendix B.
IAMGOLD implemented external analytical control measures consisting in the use of control samples (field blanks and certified reference materials) in all core sample batches submitted for assaying.
Field blanks were created by IAMGOLD from barren gneiss taken from a quarry located in the municipality of Cristiano Otoni (near Itaverava), Minas Gerais, Brazil. A total of 20 samples of the field blank material were collected and assayed to return values below the detection limit (5 parts per billion). A total of 27 gold mineralized certified reference materials were used between 2014 and 2019. The specifications of the control samples used to support the gold assay dataset used to update the mineral resource model in this study are summarized in Table 6.
Table 6: Summary Characteristics of Control Samples Used by IAMGOLD for the São Sebastião Gold Deposit, Pitangui Gold Project
|
Standard ID
|
Expected Value
|
SD*
|
Inserts
|
|
Low Grade Gold (0-1 g/t)
|
|
|
|
|
|
OxB130
|
0.125
|
0
|
2
|
|
|
OxC109
|
0.201
|
0
|
3
|
|
|
OxC72
|
0.205
|
0
|
1
|
|
|
OxD107
|
0.452
|
0
|
8
|
|
|
SE68
|
0.599
|
0
|
229
|
|
|
SE44
|
0.606
|
0
|
5
|
|
|
OxF65
|
0.805
|
0
|
5
|
|
|
SF45
|
0.848
|
0
|
18
|
|
|
OxG104
|
0.925
|
0
|
15
|
|
Total
|
|
|
286
|
|
Medium Grade Gold (1-5 g/t)
|
|
|
|
|
|
SG66
|
1.086
|
0
|
220
|
|
|
SH41
|
1.344
|
0
|
4
|
|
|
Si54
|
1.78
|
0
|
3
|
|
|
Si64
|
1.78
|
0
|
236
|
|
|
Oxi67
|
1.817
|
0
|
13
|
|
|
OxJ68
|
2.342
|
0
|
18
|
|
|
SJ63
|
2.632
|
0
|
36
|
|
|
SJ80
|
2.656
|
0
|
128
|
|
|
OxK69
|
3.583
|
0
|
12
|
|
|
SK43
|
4.086
|
0
|
82
|
|
|
SK62
|
4.075
|
0
|
23
|
|
|
SK78
|
4.134
|
0
|
234
|
|
Total
|
|
|
1,009
|
|
High Grade Gold (>5 g/t)
|
|
|
|
|
|
SL61
|
5.931
|
0
|
2
|
|
|
SN38
|
8.573
|
0
|
4
|
|
|
SN60
|
8.595
|
0
|
3
|
|
|
SN75
|
8.671
|
0
|
86
|
|
|
SP59
|
18.12
|
0
|
46
|
|
|
SP73
|
18.17
|
0
|
42
|
|
Total
|
|
|
183
|
|
* Standard Deviation
|
Control samples were inserted every 20 samples, beginning at sample number 20. The type of control sample inserted was selected by IAMGOLD geologists based on expected grade and oxidation state of the sampled interval. Blanks were inserted every 40 samples, beginning at sample number 10. The location of each control sample in the sampling process was modified by IAMGOLD geologists as required, monitoring for potential contamination proximal to intervals where mineralization was expected. Additional blank samples were inserted immediately next to sulfide-rich intervals to check for contamination issues. When quality control failures occur, the failed group is flagged and re-assayed by the laboratory with new certified reference materials.
Umpire laboratory testing was performed on approximately 8% of the samples. Field and laboratory duplicate samples were not collected.
10.5 SRK Comments
SRK recommends limiting the number of specific certified reference materials used for gold analysis for low, medium and high-grade categories in order to accurately monitor laboratory trends in quality control results. In the opinion of SRK, the sampling preparation, security and analytical procedures used by IAMGOLD are consistent with generally accepted industry best practices and are, therefore, adequate for an advanced exploration project.
11 Data Verification
The verification and analysis of data provided to SRK from IAMGOLD between 2009 and May 2013 is described in SRK (2014) and includes data produced for the 2014 mineral resource model. The conclusions from this analysis are referenced in this section. This report focusses on the verification of exploration data derived during the period May 2013 and June 2019.
11.1 Verifications by IAMGOLD
For the verification of drilling data, IAMGOLD relied partly on verification processes for logging core and data storage that is built into DataShed software up to and including 2016, and in GemsLogger software thereafter. Possible data errors such as logging interval overlaps, end-of-hole values greater than the borehole length, missing information etc., are detected automatically and send error messages within the program. A manual override of information automatically added to the logging information by the software is possible.
Regular analysis of analytical quality control data was undertaken by IAMGOLD following the IAMGOLD Fire Assay Guidelines. These guidelines state that when a quality control failure occurs, the sample batch should be re-assayed with new control samples, and the project geologist is notified of the failure. A quality control failure was defined by IAMGOLD as, for any given sample batch, the analysis of two standard samples outside of two standard deviations, or one standard sample outside of three standard deviations. For blanks returning a value above 10 times the detection limit, repeat assays are requested from coarse reject material for 5 samples before and after the failure.
All drilling assay data, including borehole survey locations and assays results, are stored on the IAMGOLD server located at IAMGOLD's Brasil office in Belo Horizonte. Access to the server room is strictly limited to the IT technician and the secretary of the IAMGOLD manager. Remote access to the server is controlled by permissions, and database editing is restricted to the database administrator.
Core logs are completed and stored in a Microsoft Access database managed by GEMS Logging Application developed by Gemcom Software International™. Additions to the GEMS database are sent to the database administrator, who checks the logs for common errors before adding it to the master database in Microsoft Access. Drilling logs are then exported as Microsoft Excel files to the project geologists.
As part of the analytical data verification, IAMGOLD submitted 2,040 sample pulps to SGS for umpire testing between 2013 and 2019. The samples cover a range of gold values and were assayed by fire assay with an atomic absorption finish (SGS method code FAA313) on 30-gram aliquots. The analysis of this testing is discussed below.
11.2 Verifications by SRK
11.2.1 Site Visit
In accordance with National Instrument 43-101 guidelines, SRK conducted a site visit to the Pitangui São Sebastião gold deposit twice between 2013 and 2019. At the time of both visits, IAMGOLD was actively drilling.
From November 12 to 15, 2013, a site visit was completed by Ms. Dorota El-Rassi and Dr. Ivo Vos from the SRK Toronto office. Mr. Glen Cole and Ms. Camila Passos from the SRK Toronto and Belo Horizonte offices respectively visited the project site on June 10 to 12, 2019, accompanied by Mr. Milton Prado and members of the of IAMGOLD Brasil exploration team.
The purpose of both site visits was to inspect the property and assess logistical aspects relating to conducting exploration work in the area. SRK was given full access to project data. While on site, SRK interviewed project personnel regarding the exploration strategy and field procedures used by IAMGOLD.
SRK inspected operating drilling sites, observed the core handling, logging and sampling. The site visit was also aimed at investigating the geological and structural controls on the distribution of the gold mineralization in order to aid the construction of three-dimensional gold mineralization domains.
11.2.2 Verifications of Analytical Quality Control Data
For this study, SRK analyzed the analytical quality control data accumulated by IAMGOLD for São Sebastião gold deposit for core drilling conducted between May 2013 and June 2019.
IAMGOLD provided SRK with an external analytical control dataset containing the assay results for the quality control samples for the São Sebastião gold deposit in Microsoft Excel spreadsheets, accompanied by original lab PDFs. SRK aggregated the assay results of the external analytical control samples for further analysis. Control samples (field blanks and certified reference materials) were summarized on time series plots to highlight the performance of the control samples. Paired data (umpire check assays) were analyzed using bias charts, quantile-quantile, and relative precision plots. These charts are summarized in Appendix B.
In general, analyses of blank samples consistently yielded gold values near or below the detection limit of the primary laboratory. The performance of blank samples between 2015 and 2019 is acceptable with little to no sample contamination detected and less than 0.4% returning values above 10 times the detection limit.
IAMGOLD used a total of 27 certified standard reference material types with a variable range of expected gold values (Table 7). Overall, the performance of these materials is acceptable with failure rates ranging from 0% to 7%, typically below 5%. Some standard materials had a sample count lower than 10 due to recent adoption or discontinued use, and therefore the statistical performance of these material may be unevolved or undetermined.
Table 7: Summary of Analytical Quality Control Data Produced by IAMGOLD on the São Sebastião Gold Deposit, Pitangui Project (Period 2013-2019)
|
|
Total
|
(%)
|
Comment
|
|
Sample Count
|
26,910
|
|
|
|
Blanks
|
811
|
3.01%
|
Field blank
|
|
QC Samples
|
1,478
|
5.49%
|
|
|
OxB130
|
2
|
|
Rocklabs (0.125 g/t)
|
|
OxC109
|
3
|
|
Rocklabs (0.201 g/t)
|
|
OxC72
|
1
|
|
Rocklabs (0.205 g/t)
|
|
OxD107
|
8
|
|
Rocklabs (0.452 g/t)
|
|
SE68
|
229
|
|
Rocklabs (0.599 g/t)
|
|
SE44
|
5
|
|
Rocklabs (0.606 g/t)
|
|
OxF65
|
5
|
|
Rocklabs (0.805 g/t)
|
|
SF45
|
18
|
|
Rocklabs (0.848 g/t)
|
|
OxG104
|
15
|
|
Rocklabs (0.925 g/t)
|
|
SG66
|
220
|
|
Rocklabs (1.086 g/t)
|
|
SH41
|
4
|
|
Rocklabs (1.344 g/t)
|
|
Si54
|
3
|
|
Rocklabs (1.780 g/t)
|
|
Si64
|
236
|
|
Rocklabs (1.780 g/t)
|
|
Oxi67
|
13
|
|
Rocklabs (1.817 g/t)
|
|
OxJ68
|
18
|
|
Rocklabs (2.342 g/t)
|
|
SJ63
|
36
|
|
Rocklabs (2.632 g/t)
|
|
SJ80
|
128
|
|
Rocklabs (2.656 g/t)
|
|
OxK69
|
12
|
|
Rocklabs (3.583 g/t)
|
|
SK43
|
82
|
|
Rocklabs (4.086 g/t)
|
|
SK62
|
23
|
|
Rocklabs (4.075 g/t)
|
|
SK78
|
234
|
|
Rocklabs (4.134 g/t)
|
|
SL61
|
2
|
|
Rocklabs (5.931 g/t)
|
|
SN38
|
4
|
|
Rocklabs (8.573 g/t)
|
|
SN60
|
3
|
|
Rocklabs (8.595 g/t)
|
|
SN75
|
86
|
|
Rocklabs (8.671 g/t)
|
|
SP59
|
46
|
|
Rocklabs (18.12 g/t)
|
|
SP73
|
42
|
|
Rocklabs (18.17 g/t)
|
|
Total QC Samples
|
2,289
|
8.51%
|
|
|
Umpire Checks
|
|
|
ACME & SGS
|
1,119
|
3.42%
|
|
|
ALS & SGS
|
623
|
1.90%
|
|
Approximately 5% of samples analyzed by ALS were chosen randomly by laboratory staff from additional pulp material and sent to SGS for repeat analysis. Rank half absolute relative difference (HARD) plots suggested that 81.8% of the umpire check assays conducted on pulps, had HARD below 10%, suggesting good reproducibility between two laboratories (Appendix B).
Reproducibility of core assays from pulp material was satisfactory with a correlation coefficient of 0.99 for both primary laboratories.
11.2.3 Independent Verification Sampling
SRK collected and submitted 13 verification samples for independent assaying in 2019. The samples selected replicated IAMGOLD core sample intervals by splitting the remaining half core. The verification samples were submitted to the SGS GEOLSOL laboratory in Vespasiano, Brazil for independent assaying to confirm the presence of gold mineralization.
The verification samples collected by SRK show a good correlation between the field duplicate and original samples (Table 8). The field duplicates sample yielded comparable results to the original assays.
Table 8: Assay Results for Verification Samples Collected SRK on the São Sebastião Gold Deposit, Pitangui Project
|
Borehole
|
Sample
|
SRK
|
IAMGOLD
|
|
Au (ppb)
|
Au (ppb)
|
|
FJG86
|
FJG86/119
|
1,804
|
1,799
|
|
FJG86
|
FJG86/121
|
12,534
|
12,600
|
|
FJG88
|
FJG88/095
|
304
|
429
|
|
FJG115
|
FJG115/195
|
5,452
|
5,194
|
|
FJG47
|
FJG47/095
|
2,947
|
2,884
|
|
FJG109
|
FJG109/193
|
63
|
58
|
|
FJG198
|
FJG198/114
|
913
|
725
|
|
FJG198
|
FJG198/115
|
16,157
|
16,100
|
|
FJG85
|
FJG85/073
|
728
|
587
|
|
FJG211
|
FJG211/201
|
851
|
379
|
|
FJG141
|
FJG141/046
|
43
|
65
|
|
FJG97
|
FJG97/162
|
92
|
119
|
|
FJG97
|
FJG97/137
|
16,544
|
13,700
|
|
Summary
|
Mean
|
4,495
|
4,203
|
|
|
Maximum
|
16,544
|
16,100
|
|
|
Minimum
|
43
|
58
|
11.3 SRK Comment
SRK carried out a detailed quality control review including the review of analytical quality control programs carried out by IAMGOLD from 2014 to 2019. The aim of this review was to verify the reliability of exploration data generated during this period to be used in the mineral resource update. This review is in addition to that conducted and discussed in the 2014 report.
Based on previous project exposure and on SRK's most recent site visit completed during active drilling operations in June 2019, SRK believes that drilling, logging, core handling, core storage, and analytical quality control protocols used by IAMGOLD meet generally accepted industry best practices, and are, therefore, adequate for an advanced exploration project.
Overall, SRK considers analytical results from core sampling conducted between 2009 and 2019 at the Pitangui Project are globally sufficiently reliable for the purpose of resource estimation. The data examined by SRK do not show any obvious evidence of analytical bias.
12 Mineral Processing and Metallurgical Testing
12.1 Introduction
Preliminary metallurgical testwork was undertaken by SGS Lakefield in 2014 on five representative composite core samples from borehole FJG040. Subsequent SMC, gravity concentration, flotation and leaching testwork on selected composite samples was also undertaken by ALS in 2016.
This testwork is summarized in this section.
12.2 Metallurgical Testwork by SGS (2014)
Preliminary metallurgical testwork was performed at the SGS Lakefield in Lakefield, Ontario in 2013 on five representative composite core samples extracted from borehole FJG-040 (Table 9). Documentation of this testwork was provided to SRK, which is summarized in this section (Pelletier, 2013).
Composites 1 and 2 are from a high-grade section, whereas composites 3 to 5 are from a low grade section adjacent the high grade section. A summary of the screened metallic gold assays is presented in Table 10.
Table 9: Composite Location
|
Hole FJG40
|
Sample Number
|
Interval
(metres)
|
Mass
(kilogram)
|
|
Composite 1
|
FJG40/081 to FJG40/094
|
131.29 - 138.37
|
34.08
|
|
Composite 2
|
FJG40/116 to FJG40/123
|
149.51 - 153.34
|
18.17
|
|
Composite 3
|
FJG40/074 to FJG40/079
|
127.42 - 131.29
|
7.90
|
|
Composite 4
|
FJG40/095 to FJG40/099
|
138.37 - 141.20
|
6.10
|
|
Composite 5
|
FJG40/124 to FJG40/135
|
153.34 - 159.35
|
12.70
|
Table 10: Screen Metallics Assay Results
|
Composite
|
Calc Head Grade
g/t gold
|
+ 150 Mesh
|
-150 Mesh
|
|
%Mass
|
g/t gold
|
%Mass
|
g/t gold Cut A
|
g/t gold Cut B
|
|
Comp 1
|
5.58
|
4.2
|
4.51
|
95.8
|
5.71
|
5.54
|
|
Comp 2
|
12.30
|
5.3
|
5.24
|
94.7
|
12.30
|
13.10
|
|
Comp 3
|
0.28
|
5.8
|
0.38
|
94.2
|
0.27
|
0.27
|
|
Comp 4
|
0.62
|
4.5
|
0.69
|
95.5
|
0.62
|
0.61
|
|
Comp 5
|
0.75
|
5.7
|
0.39
|
94.3
|
0.78
|
0.76
|
Preliminary grinding and abrasion tests were performed on Composites 1 and 2. The material can be classified as average in term of hardness for the SAG index and relatively soft in term of Ball Work index. The material is however classified as abrasive.
Preliminary gold "Carbon-In-Leach" (CIL) leaching tests returned a gold recovery varying from 89% to 95% from a grinding size varying between 102 to 50 microns. The gold recovery appears lightly sensitive to grind. A gold recovery of 93% to 95% is achieved at the nominal grinding size of 74 microns. Cyanide consumption is high at 3.0 to 3.5 kilograms per tonne (kg/t) and is directly affected by pyrrhotite and to some extent by fine grinding. However, extended pre-aeration with lead nitrate addition decreased cyanide consumption to 1.3 kg/t to 1.5 kg/t.
All the composites (high and low grade) are likely to be acid generators with a value of net neutralization potential between 20 kg/t to 232 kg/t and neutralization potential ratios varying from 0.20 to 0.87.
In conclusion, the preliminary metallurgical testwork results suggest that the gold mineralization is not refractory, and that recovery can be expected from conventional CIL leaching. The gold mineralized material tested is relatively soft. Both auriferous and waste rock tested show potential for acid generation.
12.3 Metallurgical Testwork by ALS (2016)
In collaboration with Soutex, IAMGOLD undertook a metallurgical testwork program on mineralized Pitangui deposit material in 2016. The following metallurgical test program was undertaken by the ALS Minerals laboratories between April to September 2016 (ALS, 2016). The summary below is modified from ALS (2016).
The testwork program comprised the following components:
- Measure the chemical content and mineralogical characteristics of a master composite, and three select drill intervals.
- Conduct comminution testing including SMC testing and Bond ball mill work index testing on the Master Composite.
- Using the Master Composite, develop and optimize conditions for a gold extraction process assessing gravity concentration, sulphide flotation followed by cyanidation leach of the products, and whole ore leaching.
- Conduct cyanidation leach tests on three select drill intervals using the developed process.
- Conduct an oxygen uptake rate test on the Master Composite to determine the oxygen requirements of the sample.
- Conduct Acid Base Accounting (ABA) on various samples generated from the metallurgical testing to determine the potential of acid rock drainage.
Testing focused around a Master Composite, with additional testing on three interval samples, representing low, medium, and high grade. Chemical analysis indicated the gold content was about 5.0 g/t for the Master Composite, and from 2.3 to 9.2 g/t for the interval samples.
The samples also measured high sulphur content, measuring between 5.1 and 14.8%. Mineralogical analysis, via QEMSCAN, determined that the majority of the sulphur was present as pyrrhotite. Liberation analysis indicated that the major sulphide minerals were generally well liberated, and good flotation performance would be expected provided the correct chemical conditions were applied.
Metallurgical testing on the Master Composite included gravity separation, magnetic separation, bulk sulphide flotation followed by cyanidation leach of the products, and whole ore cyanidation leach. Primary grind sizings between 36 and 135 microns were tested, and gold extraction appeared to be largely influenced by this parameter.
Extraction of about 95% of the gold in the feed was recorded for both whole ore cyanidation, and flotation followed by cyanidation of products. For whole ore leach testing, this was achieved at 52 microns K80 primary grind, while flotation was conducted at a 67 microns K80 primary grind sizing, and the rougher concentrate was reground to 25 microns. Both the reground rougher concentrate and rougher tailings were cyanidation leached to achieve 95% extraction. Additional testing should be performed to further refine flowsheet conditions so that a trade-off study could compare whole ore cyanidation against a flotation/cyanidation flowsheet, for optimized conditions.
The best results for bulk sulphide flotation used 80 g/t potassium amyl xanthate (PAX), and 500 g/t copper sulphate. At a primary grind sizing of about 67 microns K80, about 97% of the sulphur, and 89% of the gold was recovered to a rougher concentrate at a mass recovery of about 30%. Gold recovery did not increase as much as sulphur when copper sulphate was employed; this could indicate gold associated with non-sulphide gangue minerals.
Due to the high pyrrhotite content in the feed, and consequently in the rougher concentrates, it was difficult to maintain dissolved oxygen levels in cyanidation leach tests and significant pre-aeration was required. This was achieved either through repeated oxygen sparging over the pre-aeration period, or through an extended period of agitation and aeration in a flotation cell.
Whole ore leach testing was also conducted on three interval samples, FJG 116 209.26-213.43, FJG 96 143.48-146.4 and FJG 137 325.72-329.26 using the developed conditions. The intervals represented high, medium, and low gold grade, respectively. Gold leach extraction was related to gold feed grade and ranged from 91% to 96% gold extraction. The primary grind sizing was 41 to 43 microns K80 for these tests. Sodium cyanide content appeared to increase with increasing chalcopyrite content; additional testing would be required to confirm.
For gravity testing, about 16% and 22% of the gold was recovered to a final gravity concentrate at primary grind sizings of 89 and 67 microns K80, respectively. This indicates only a limited opportunity for gravity recoverable gold. Full circuit testing and lower gravity concentrate mass recoveries would be required to further define potential for gravity operation.
The pyrrhotite in the Master Composite was not amenable to recovery by magnetic concentration at 4,500 Gauss. Comminution testing on the Master Composite resulted in a Bond ball mill work index of 11.0 kilowatt hours per tonne, which would be considered soft for ball mill grinding. The SMC test produced an Axb value of 32.8, and the SCSE value was reported to be 12.0 kilowatt hours per tonne.
13 Mineral Resource Estimates
13.1 Introduction
The Mineral Resource Statement presented herein represents the second mineral resource evaluation prepared by SRK and fourth mineral resource evaluation total for the São Sebastião gold deposit in accordance with the Canadian Securities Administrators' National Instrument 43-101.
The mineral resource model prepared by SRK considers 240 core boreholes drilled by IAMGOLD during the period of 2011 to 2019, of which 216 core boreholes (80,041 metres) are in the modelled area. Mr. Glen Cole, PGeo (APGO#1416), visited the site on June 10 to 12, 2019. The domain modelling and resource estimation work were completed by Dr. Aleksandr Mitrofanov (APGO#2824) PGeo, with guidance from Mr. Cole and geostatistical support from Dr. Oy Leuangthong, PEng (PEO#90563867). All are full-time employees of SRK. By virtue of their education, relevant work experience, and affiliation to a recognized professional association, Dr. Mitrofanov and Mr. Cole are appropriate independent Qualified Persons as this term is defined in National Instrument 43-101. The effective date of the Mineral Resource Statement is December 2, 2019.
The database used to estimate the São Sebastião gold deposit mineral resources was audited by SRK. SRK is of the opinion that the current drilling information is sufficiently reliable to interpret with confidence the boundaries for banded iron formation-hosted gold mineralization and that the assay data are reliable to support mineral resource estimation.
Leapfrog Geo™ software (version 4.5.1) was used to construct the geological and resource domains. SRK used a combination of Leapfrog Geo™ and GSLib™ software to prepare assay data for geostatistical analysis and Leapfrog Edge™ software to construct the block model and estimate gold grades. The estimation for several domains were also verified in Datamine Studio RM™ software (version 1.2.47).
This section describes the resource estimation methodology and summarizes the key assumptions considered by SRK. In the opinion of SRK, the resource evaluation reported herein is a reasonable representation of the global gold mineral resources found in the São Sebastião deposit at the current level of sampling. The mineral resources have been estimated in conformity with generally accepted CIM Estimation of Mineral Resource and Mineral Reserves Best Practices Guidelines and are reported in accordance with the Canadian Securities Administrators' National Instrument 43-101. Mineral resources are not mineral reserves and have not demonstrated economic viability. There is no certainty that all or any part of the mineral resource will be converted into mineral reserve.
13.2 Resource Estimation Methodology
The resource evaluation methodology involved the following procedures:
- Database compilation and verification.
- Construction of wireframe models for the boundaries of the gold mineralization.
- Definition of resource domains.
- Data conditioning (compositing and capping) for geostatistical analysis and variography.
- Grade interpolation in a 3D block model.
- Model validation and resource classification.
- Assessment of "reasonable prospects for eventual economic extraction" and selection of appropriate cut-off grades.
- Preparation of the Mineral Resource Statement.
13.2.1 Resource Database
The resource database comprises samples from core boreholes drilled from surface. IAMGOLD provided the resource database together with the Leapfrog project used by the IAMGOLD project team to develop the geological interpretation. The header, down-hole survey, lithology intervals, and assay results were received on July 29, 2019. SRK was provided with a database comprising 240 core boreholes (88,034 metres). After discussion with IAMGOLD, SRK excluded 24 boreholes from the database due to the following reasons:
- FJG123A and FJG217A - twin drilling, only the data from the original boreholes were used.
- FJG139, FJG140 and FJG42 - drilled on geophysics anomalies in the lower meta-ultramafic unit out of the current resource area.
- FJG143 to FJG148 (6); FJG173 to FJG180 (8), and FJG187, FJG189, FJG191, FJG194, FJG196 (5) - drilled out of the resource area.
The locations of the excluded boreholes against the resource domains are presented in Figure 18.
The final database used for the resource modelling comprises 216 (80,041 metres) boreholes drilled by IAMGOLD and includes 32,724 samples assayed for gold and 30,505 specific gravity samples. This represents the addition of 21 boreholes (12,431 metres) since the December 2017 model (Table 11). SRK received the sampling data imported in Leapfrog Geo™ software and performed the following validation steps:
- Checked the absence of collar, survey and interval tables information for all boreholes.
- Checked minimum and maximum values for each quality value field.
- Checked for gaps, overlaps, and out of sequence intervals for both assays and lithology tables.
- Checked the absent values in assay information (all unsampled intervals were treated as zeros).
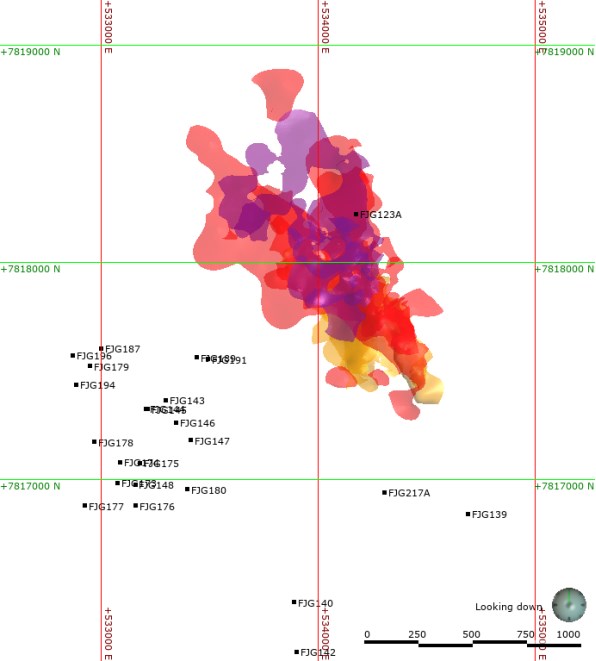
Figure 18: Plan View of Boreholes Excluded from the Mineral Resource Modelling
Table 11: Summary of the Database
|
Data Type
|
2017
|
2019
|
% Increase Rel. 2017
|
|
Database
|
Database
|
Excluded
|
Used
|
% Excluded
|
|
Collars
|
195
|
240
|
24
|
216
|
10%
|
11%
|
|
Drilling Length
|
67,610
|
88,034
|
7,993
|
80,041
|
9%
|
18%
|
|
Assays
|
27,821
|
36,616
|
3,892
|
32,724
|
11%
|
18%
|
|
SG
|
25,836
|
34,197
|
3,692
|
30,505
|
11%
|
18%
|
All borehole collars were surveyed according to UTM coordinates (Corrego_Alegre_UTM Zone 23S). IAMGOLD also transferred to SRK a high-resolution topographic surface as part of the Leapfrog project used for geological modelling.
Mr. Glen Cole, PGeo and Ms. Camila Passos from SRK visited the São Sebastião deposit during June 10 to June 12, 2019 to particularly review all inputs to the exploration database. SRK is satisfied that the exploration work carried out by IAMGOLD is conducted in a manner consistent with industry best practices and, therefore, the exploration data and the drilling database are sufficiently reliable to support a preliminary mineral resource evaluation.
13.2.2 Domain Modelling
The style of iron formation-hosted gold mineralization in the São Sebastião deposit suggests strong geological controls are appropriate for development of resource domains. Continuous zones of gold mineralization are assumed to be primarily spatially associated with the replacement of magnetite within the banded iron formation (BIF), whereas the presence of the mineralized samples outside BIF in the host rocks represent disseminated mineralization associated primarily with gold remobilization processes. The geological / domainal modelling included two stages:
1. Geological modelling of the lithology units and;
2. Developing of the mineralized zones within BIF lithology.
Lithology
The lithology model for the São Sebastião deposit includes 4 main geological units:
1. BIF domains that are split into three stratigraphic levels (from top to bottom):
a. Tomate
b. Biquinho
c. Pimentao
2. Ultramafic rocks
3. Metasedimentary rocks
4. Schists
The lithology model was developed by IAMGOLD and reviewed by SRK against the existing lithology information and sectional interpretation. In SRK's opinion, the quality of the existing lithology model is good and can be used for resource modelling purposes. A representative section of the lithology model is presented in Figure 19.
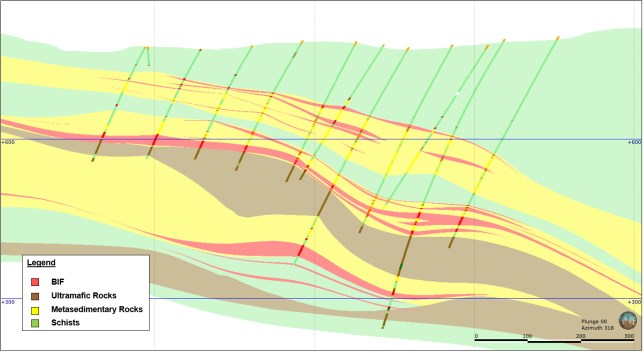
Figure 19: Lithology Model Section
Mineralization Zones
The mineralization zones within the BIF units were developed using a grade threshold of 0.1 gram of gold per tonne (g/t gold) with maximum of 2 m internal waste inclusion allowance. SRK used the original IAMGOLD interpretation as the reference for the modelling of 21 mineralized subdomains: 7 for Biquinho, 11 for Pimentao and 4 for Tomate zones. The mineralized subdomains were developed as continuous zones of gold mineralization constrained within different stratigraphic levels of BIF units and are consistent with the overall geometry of their respective BIF units. A longitudinal view of the mineralized zones is presented in Figure 20.
To assess the quality of the subdomains within the BIF units, SRK coded the assay intervals into groups based on the grade and their location inside/outside of the mineralized zones and analyzed the length distribution of the intervals constrained in BIF units. The results of this comparison for the Biquinho zone are presented in Figure 21. The left-side graph shows that the over 90% of the intervals less than 0.1 g/t gold reside outside of the mineralized zones within the Biquinho BIF, while the right-side plot shows that 85% of the intervals inside the mineralized zones are greater than or equal to 0.1 g/t gold. This analysis confirms that the majority of the mineralized intervals are constrained within subdomains.
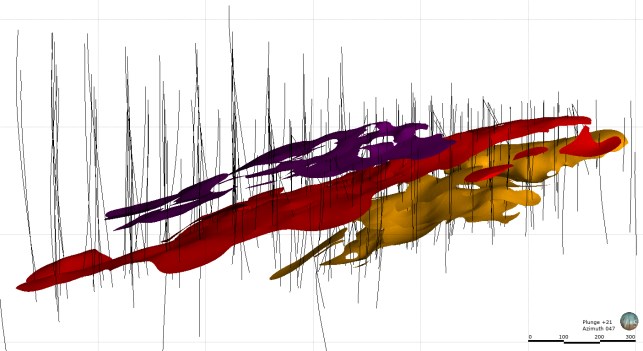
Figure 20: Longitudinal View of the Mineralized Subdomains (looking Northeast)
Red - Biquinho, Orange - Pimentao, Purple - Tomate, Black traces - Boreholes. Azimuth/dip of the view - 047/21.
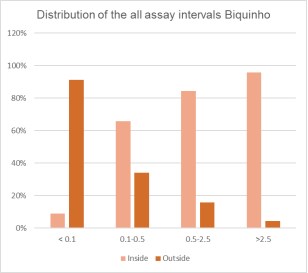

Figure 21: Length Distribution of the Coded Assays within Biquinho BIF Zone
SRK coded and grouped domains for estimation purposes. The coding system of the domains is presented in Table 12 below. The BIF units were split into mineralized and non-mineralized zones whereas other lithology units were not changed and were used directly in resource estimation. For the purpose of statistical and geostatistical analyses, all mineralized subdomains within Biquinho, Pimentao and Tomate zones were grouped into 199, 299 and 399 domains, respectively. All BIF unmineralized domains were grouped into the 1000 domain.
Table 12: Domains Summary
|
Lithology
|
Zone
|
Mineralization
|
Codes
|
Original IAMGOLD
Interpretation
|
Groups for Data Processing
|
Mineralized Volume
|
Azimuth/Dip of the Zone
|
|
BIF
|
Biquinho
|
Host
|
100
|
|
1000
|
|
|
|
Mineralized
|
101
|
B01
|
199
|
48%
|
350/20
|
|
102
|
B02
|
10%
|
|
151
|
B07
|
1%
|
|
152
|
B03 and B14
|
4%
|
|
153
|
B04 and B11
|
0%
|
|
154
|
B06 and B17
|
0%
|
|
161
|
B08 and B09
|
1%
|
|
Pimentao
|
Host
|
200
|
|
1000
|
|
|
|
Mineralized
|
201
|
P08
|
299
|
1%
|
325/20
|
|
202
|
P07
|
1%
|
|
203
|
P04
|
6%
|
|
204
|
P02
|
5%
|
|
205
|
P03 and P13
|
2%
|
|
206
|
P05
|
3%
|
|
207
|
P06
|
0%
|
|
208
|
P01 and P12
|
1%
|
|
209
|
P09
|
0%
|
|
210
|
P10
|
5%
|
Variable
|
|
211
|
P11
|
0%
|
|
Tomate
|
Host
|
300
|
|
1000
|
|
|
|
Mineralized
|
301
|
T03
|
399
|
6%
|
350/25
|
|
302
|
T01
|
5%
|
|
303
|
T02
|
1%
|
|
304
|
T04
|
0%
|
|
Ultramafic
|
Host
|
400
|
|
400
|
|
|
|
Metasediments
|
500
|
|
500
|
|
|
|
Schists
|
600
|
|
600
|
|
|
13.2.3 Compositing
Figure 22 shows the distribution of assay lengths within the mineralized subdomains. Virtually all assays are sampled at less than 1-metre intervals. SRK chose to composite at 1 metre to avoid 'breaking' assays to form smaller composites. This composite length also considered the potential block size to be estimated as well as the thickness of the mineralized BIF zones.
Residual length composites were evaluated to determine if they should remain in the database. The general concern is that shorter composite intervals may be associated with higher grades, and the direct use of these composites in mineral resource estimation may lead to overestimation. This is particularly concerning if the length of the composites is not used as a weight in the estimation; as most general mine planning packages do not allow the use of weighting composite grades by length, this may be a risk in implementation.

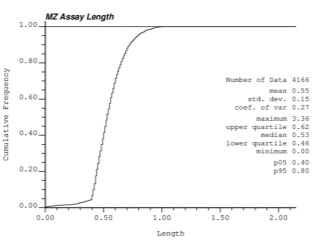
Figure 22: Assay Lengths for Mineralized Subdomains
SRK reviewed the impact of residual composites by comparing the length-weighted average of assay intervals against the unweighted average of composite grades when residual composites shorter than 50% (0.50 metres) of the composite length were removed from the database on a by-domain basis. Although sparsely informed domains showed a significant change in the mean, the overall impact to the mean grade was less than 1% due to the removal of shorter length composites for all mineralized subdomains. Thus, SRK chose to exclude composites shorter than 50% of the composite length (or 0.50 metres) in subsequent data analysis and block grade estimation. In all cases, composite files were derived from raw assay values within the modelled resource domains.
13.2.4 Evaluation of Outliers
To further limit the influence of high gold grade outliers during grade estimation, SRK chose to cap composites, as these are the data used explicitly in estimation. Capping was performed for the grouped mineralized subdomains (i.e. 199, 299, and 399) and lithology domains. SRK relied on a combination of probability plots and capping sensitivity plots. Separation of grade populations characterized by inflections in the probability plot or gaps in the high tail of the grade distribution were indicators of potential capping values. SRK used the following capping values for the domains:
1. Mineralized domains within:
a. Biquinho (Group 199) - 22 g/t
b. Pimentao (Group 299) - 20 g/t
c. Tomate (Group 399) - no capping applied
2. BIF host rocks (group 1000) - 3 g/t
3. Ultramafic rocks (400) - 0.5 g/t
4. Meta-sedimentary rocks (500) and schists (600) - 1.5 g/t
The selected capped values, along with the uncapped and capped composite statistics are provided in Table 13. Figure 23 shows an example probability plot and capping sensitivity curve for group 199 (Biquinho mineralized zones). Appendix A shows relevant capping plots for all other domains. The selected capping values generally correspond with previously used by IAMGOLD for 2017 resource estimation. Overall, the global mean grade dropped for 1% in comparison with non-capped population.

Figure 23: Grade Probability Plot (Left) and Capping Sensitivity Curve (Right) for Group Domain 199
Table 13: Summary Basic Statistics for Raw Sample, Composite and Capped Composite Data (St Dev = standard deviation, CV = coefficient of variation)
|
Domain
|
Original Assays (Length-weighted)
|
Composites
|
Capped Composites
|
Assay Length / Number of Comp
|
Compositing Impact
|
Capping Impact
|
|
Count
|
Length
|
Mean
|
St Dev
|
CV
|
Min
|
Max
|
Count
|
Mean
|
St Dev
|
CV
|
Min
|
Max
|
Count
|
Mean
|
St Dev
|
CV
|
Min
|
Max
|
Mean
|
CV
|
Comps
|
Mean
|
CV
|
|
100
|
3,656
|
2,078
|
0.12
|
0.62
|
5.35
|
0.00
|
19.50
|
2,070
|
0.11
|
0.49
|
4.35
|
0.00
|
11.29
|
2,070
|
0.10
|
0.31
|
3.08
|
0.00
|
3.00
|
0%
|
-2%
|
-19%
|
0.00%
|
-12%
|
-29%
|
|
101
|
1,529
|
828
|
3.21
|
5.16
|
1.61
|
0.00
|
58.50
|
828
|
3.22
|
4.31
|
1.34
|
0.00
|
42.20
|
828
|
3.18
|
4.11
|
1.29
|
0.00
|
22.00
|
0%
|
0%
|
-17%
|
0.00%
|
-1%
|
-4%
|
|
102
|
379
|
204
|
1.80
|
4.31
|
2.40
|
0.00
|
55.60
|
206
|
1.83
|
3.37
|
1.85
|
0.02
|
25.15
|
206
|
1.81
|
3.27
|
1.81
|
0.02
|
22.00
|
1%
|
2%
|
-23%
|
0.00%
|
-1%
|
-2%
|
|
151
|
45
|
23
|
0.94
|
1.34
|
1.43
|
0.01
|
5.96
|
23
|
1.05
|
1.27
|
1.21
|
0.05
|
5.96
|
23
|
1.05
|
1.27
|
1.21
|
0.05
|
5.96
|
0%
|
12%
|
-15%
|
0.00%
|
0%
|
0%
|
|
152
|
197
|
106
|
1.36
|
2.25
|
1.66
|
0.00
|
12.90
|
105
|
1.36
|
1.84
|
1.36
|
0.01
|
12.06
|
105
|
1.36
|
1.84
|
1.36
|
0.01
|
12.06
|
-1%
|
0%
|
-18%
|
0.00%
|
0%
|
0%
|
|
153
|
14
|
7
|
2.21
|
2.48
|
1.12
|
0.08
|
6.74
|
7
|
1.99
|
1.60
|
0.80
|
0.36
|
4.93
|
7
|
1.99
|
1.60
|
0.80
|
0.36
|
4.93
|
-4%
|
-10%
|
-28%
|
0.00%
|
0%
|
0%
|
|
154
|
19
|
10
|
1.62
|
1.79
|
1.11
|
0.12
|
5.86
|
10
|
1.44
|
1.32
|
0.92
|
0.21
|
3.68
|
10
|
1.44
|
1.32
|
0.92
|
0.21
|
3.68
|
5%
|
-11%
|
-17%
|
0.00%
|
0%
|
0%
|
|
161
|
44
|
26
|
0.73
|
1.03
|
1.42
|
0.01
|
3.59
|
25
|
0.65
|
0.76
|
1.18
|
0.02
|
2.83
|
25
|
0.65
|
0.76
|
1.18
|
0.02
|
2.83
|
-2%
|
-11%
|
-17%
|
0.00%
|
0%
|
0%
|
|
200
|
3,333
|
2,102
|
0.07
|
0.44
|
6.43
|
0.00
|
19.20
|
2,104
|
0.07
|
0.26
|
3.71
|
0.00
|
5.57
|
2,104
|
0.07
|
0.20
|
3.08
|
0.00
|
3.00
|
0%
|
0%
|
-42%
|
0.00%
|
-4%
|
-17%
|
|
201
|
58
|
30
|
0.99
|
1.82
|
1.84
|
0.01
|
9.87
|
30
|
0.89
|
1.36
|
1.52
|
0.02
|
5.26
|
30
|
0.89
|
1.36
|
1.52
|
0.02
|
5.26
|
1%
|
-10%
|
-17%
|
0.00%
|
0%
|
0%
|
|
202
|
44
|
24
|
1.83
|
2.64
|
1.44
|
0.01
|
12.20
|
24
|
1.84
|
2.22
|
1.21
|
0.01
|
7.88
|
24
|
1.84
|
2.22
|
1.21
|
0.01
|
7.88
|
-1%
|
0%
|
-16%
|
0.00%
|
0%
|
0%
|
|
203
|
325
|
183
|
2.34
|
4.25
|
1.82
|
0.02
|
38.90
|
185
|
2.35
|
3.27
|
1.39
|
0.02
|
24.16
|
185
|
2.33
|
3.13
|
1.34
|
0.02
|
20.00
|
1%
|
0%
|
-23%
|
0.00%
|
-1%
|
-3%
|
|
204
|
254
|
137
|
2.19
|
3.86
|
1.76
|
0.00
|
25.10
|
140
|
2.18
|
3.18
|
1.46
|
0.00
|
16.60
|
140
|
2.18
|
3.18
|
1.46
|
0.00
|
16.60
|
2%
|
-1%
|
-17%
|
0.00%
|
0%
|
0%
|
|
205
|
125
|
73
|
1.66
|
4.72
|
2.85
|
0.00
|
32.40
|
73
|
1.67
|
4.26
|
2.54
|
0.00
|
32.06
|
73
|
1.51
|
3.15
|
2.09
|
0.00
|
20.00
|
0%
|
1%
|
-11%
|
0.00%
|
-10%
|
-18%
|
|
206
|
219
|
116
|
1.37
|
4.41
|
3.22
|
0.00
|
61.40
|
117
|
1.36
|
2.94
|
2.17
|
0.02
|
22.54
|
117
|
1.34
|
2.79
|
2.09
|
0.02
|
20.00
|
1%
|
-1%
|
-33%
|
0.00%
|
-2%
|
-4%
|
|
207
|
33
|
18
|
4.42
|
7.40
|
1.67
|
0.04
|
35.00
|
18
|
4.51
|
5.25
|
1.16
|
0.09
|
17.64
|
18
|
4.51
|
5.25
|
1.16
|
0.09
|
17.64
|
-2%
|
2%
|
-30%
|
0.00%
|
0%
|
0%
|
|
208
|
72
|
40
|
0.91
|
1.77
|
1.94
|
0.00
|
10.80
|
40
|
0.97
|
1.55
|
1.60
|
0.02
|
7.89
|
40
|
0.97
|
1.55
|
1.60
|
0.02
|
7.89
|
0%
|
6%
|
-17%
|
0.00%
|
0%
|
0%
|
|
209
|
8
|
4
|
1.78
|
1.59
|
0.89
|
0.21
|
4.28
|
4
|
1.82
|
1.22
|
0.67
|
0.58
|
3.37
|
4
|
1.82
|
1.22
|
0.67
|
0.58
|
3.37
|
-4%
|
2%
|
-25%
|
0.00%
|
0%
|
0%
|
|
210
|
320
|
169
|
2.00
|
4.24
|
2.13
|
0.00
|
51.30
|
170
|
2.05
|
3.26
|
1.59
|
0.02
|
21.66
|
170
|
2.04
|
3.20
|
1.57
|
0.02
|
20.00
|
1%
|
3%
|
-25%
|
0.00%
|
0%
|
-1%
|
|
211
|
6
|
2
|
0.86
|
1.65
|
1.92
|
0.25
|
6.47
|
3
|
0.45
|
0.23
|
0.50
|
0.25
|
0.69
|
3
|
0.45
|
0.23
|
0.50
|
0.25
|
0.69
|
32%
|
-47%
|
-74%
|
0.00%
|
0%
|
0%
|
|
300
|
1,633
|
910
|
0.09
|
0.44
|
4.90
|
0.00
|
7.41
|
921
|
0.10
|
0.42
|
4.44
|
0.00
|
6.15
|
921
|
0.09
|
0.31
|
3.58
|
0.00
|
3.00
|
1%
|
6%
|
-9%
|
0.00%
|
-11%
|
-19%
|
|
301
|
220
|
130
|
0.91
|
1.65
|
1.81
|
0.00
|
10.90
|
127
|
0.96
|
1.36
|
1.42
|
0.03
|
7.97
|
127
|
0.96
|
1.36
|
1.42
|
0.03
|
7.97
|
-3%
|
5%
|
-21%
|
0.00%
|
0%
|
0%
|
|
302
|
192
|
107
|
0.69
|
1.17
|
1.70
|
0.00
|
9.69
|
108
|
0.70
|
0.93
|
1.33
|
0.01
|
5.29
|
108
|
0.70
|
0.93
|
1.33
|
0.01
|
5.29
|
1%
|
1%
|
-22%
|
0.00%
|
0%
|
0%
|
|
303
|
38
|
24
|
0.84
|
1.11
|
1.33
|
0.01
|
4.62
|
25
|
0.80
|
0.98
|
1.23
|
0.05
|
3.88
|
25
|
0.80
|
0.98
|
1.23
|
0.05
|
3.88
|
3%
|
-5%
|
-7%
|
0.00%
|
0%
|
0%
|
|
304
|
25
|
15
|
0.36
|
0.40
|
1.11
|
0.03
|
1.34
|
15
|
0.39
|
0.42
|
1.07
|
0.06
|
1.34
|
15
|
0.39
|
0.42
|
1.07
|
0.06
|
1.34
|
3%
|
8%
|
-4%
|
0.00%
|
0%
|
0%
|
|
400
|
2,630
|
16,317
|
0.00
|
0.05
|
21.69
|
0.00
|
31.60
|
16,317
|
0.00
|
0.03
|
13.60
|
0.00
|
2.33
|
16,317
|
0.00
|
0.02
|
8.51
|
0.00
|
0.50
|
0%
|
0%
|
-37%
|
0.00%
|
-14%
|
-37%
|
|
500
|
14,769
|
20,919
|
0.02
|
0.29
|
11.81
|
0.00
|
51.30
|
20,932
|
0.02
|
0.17
|
7.18
|
0.00
|
9.80
|
20,932
|
0.02
|
0.10
|
4.83
|
0.00
|
1.50
|
0%
|
-2%
|
-39%
|
0.00%
|
-12%
|
-33%
|
|
600
|
7,872
|
35,383
|
0.01
|
0.10
|
16.73
|
0.00
|
8.57
|
35,385
|
0.01
|
0.07
|
12.74
|
0.00
|
5.14
|
35,385
|
0.01
|
0.05
|
10.24
|
0.00
|
1.50
|
0%
|
1%
|
-24%
|
0.00%
|
-8%
|
-20%
|
|
Total Mineralized
|
4,166
|
2,276
|
2.20
|
|
|
|
|
2,283
|
2.21
|
|
|
|
|
2,283
|
2.19
|
|
|
|
|
0%
|
0%
|
|
0.00%
|
-1%
|
|
|
Total BIF
|
8,622
|
5,089
|
0.09
|
|
|
|
|
5,095
|
0.09
|
|
|
|
|
5,095
|
0.08
|
|
|
|
|
0%
|
0%
|
|
0.00%
|
-10%
|
|
|
Host rocks
|
25,271
|
72,619
|
0.01
|
|
|
|
|
72,634
|
0.01
|
|
|
|
|
72,634
|
0.01
|
|
|
|
|
0%
|
-1%
|
|
0.00%
|
-11%
|
|
13.2.5 Variography
SRK used the Geostatistical Software Library (GSLib, Deutsch and Journel, 1998) to calculate and model gold variograms for the mineralized and BIF domains (Table 14). For each domain, SRK assessed three different spatial metrics: (1) traditional semivariogram of gold, (2) correlogram of gold, and (3) traditional semivariogram of normal scores of gold. Downhole variograms were calculated to determine the nugget effect. Figure 24 shows an example variogram model for group 199 (Biquinho mineralized zones); all gold domain variograms are provided in Appendix D.
Table 14: Gold Variograms by Domain
|
Rock Code
|
GSLIB Angles
|
Leapfrog Angles
|
Variogram Model
|
|
ANG1
|
ANG2
|
ANG3
|
Dip
|
Dip Azm
|
Pitch
|
Nugget*
|
Str. No.
|
Type
|
CC*
|
Strike Range (X)
|
Dip Range (Y)
|
Vert Range (Z)
|
|
199
|
310
|
-20
|
20
|
28
|
357
|
47
|
0.25
|
1
|
Exponential
|
0.6
|
60
|
60
|
4
|
|
2
|
Spherical
|
0.15
|
80
|
80
|
8
|
|
299
|
310
|
-20
|
20
|
28
|
357
|
47
|
0.2
|
1
|
Exponential
|
0.6
|
45
|
60
|
2
|
|
2
|
Spherical
|
0.2
|
45
|
90
|
5
|
|
399
|
315
|
-20
|
0
|
20
|
315
|
90
|
0.25
|
1
|
Exponential
|
0.3
|
12
|
12
|
1
|
|
2
|
Spherical
|
0.45
|
90
|
90
|
6
|
|
1000
|
310
|
-20
|
20
|
28
|
357
|
47
|
0.2
|
1
|
Exponential
|
0.6
|
50
|
50
|
4
|
|
2
|
Spherical
|
0.2
|
50
|
50
|
9
|
|
* Str. No. = structure number; CC = variance contribution
|

Figure 24: Gold Variogram Biquinho Mineralized Zone (199 Group)
13.2.6 Specific Gravity
Specific gravity was measured using a standard weight in water/weight in air methodology on the core from 10-centimetre sample intervals. The specific gravity database contains 30,505 measurements, representing an 18% increase in specific gravity measurements since the 2017 resource model. Figure 25 shows the boxplots of the specific gravity measurements by estimation domains.

Figure 25: Boxplot of Specific Gravity by Estimation Domains
Specific gravity was estimated in the block model for domains 199, 299, 399 and 1000, as detailed in the following estimation section. For host rocks (domains 400, 500, 600), an average specific gravity of 2.89, 2.88 and 2.86 was assigned, respectively.
Unlike grade composites, which are 1.0-metre lengths, specific gravity data are only 10 centimetres in length and are not collected continuously down the core. Compositing of specific gravity was not possible, and given the small support, estimation parameters for specific gravity were chosen to yield a smooth interpolation result. Specific gravity data were also capped, to avoid any extreme low and/or high values for estimation. Chosen cap values for specific gravity are provided in Table 15; the impact of capping on the average specific gravity was less than 1% for all zones. In comparison with IAMGOLD's 2017 model, the Biquinho mineralized zone is characterized by higher specific gravity (+8%) whereas Pimentao and Tomate have comparable mean values (0% and -5% respectively). This is attributed to updates in the estimation dataset as well as to substantial reinterpretation of the mineralized domains.
Table 15: Cap Values and Associated Statistics for Specific Gravity
|
Domain
|
Samples
|
Mean
|
Std. Dev.*
|
Minimum
|
Maximum
|
CoV*
|
No. Capped
|
|
199
|
2,148
|
3.25
|
0.22
|
2.61
|
4.00
|
0.07
|
4
|
|
299
|
1,419
|
3.22
|
0.23
|
2.62
|
3.80
|
0.07
|
8
|
|
399
|
397
|
3.03
|
0.19
|
2.50
|
3.63
|
0.06
|
1
|
|
1000
|
7,619
|
3.22
|
0.26
|
2.50
|
4.00
|
0.08
|
14
|
|
* Std. Dev. = Standard Deviation; CoV = Coefficient of Variation
|
13.2.7 Block Model Parameters
The selection of the block size considered the borehole spacing, composite length, the geometry of the modelled zone and the anticipated mining method. A block size of 10 metres × 10 metres × 2 metres was chosen, with sub-cells at a resolution of 5 metres × 5 metres × 1 metre to better reflect the shape of the mineralization domain. Sub-cells were assigned the same values as their parent cell. The Z rotation of 345° was applied to the block model to better reflect the dip direction of the mineralized zones. The block model definition is summarized in Table 16. The sub-celling is efficient in filling the wireframe volumes. The block model was assigned the domain codes from the wireframes.
Table 16: São Sebastião Gold Deposit Block Model Specifications
|
Axis
|
Block Size
(metres)
|
Origin*
|
Number of Cells
|
Rotation
|
|
X
|
10
|
533649.264
|
125
|
0
|
|
Y
|
10
|
7816873.997
|
198
|
0
|
|
Z
|
5
|
150
|
400
|
345
|
|
* UTM Zone 23S
|
13.2.8 Estimation
The block model was populated with a gold value using ordinary kriging in the mineralized domains, with three estimation runs using progressively relaxed search ellipsoids and data requirements. The first estimation pass uses a search radii up to the variogram range. The second pass uses a radii set to 2.0 times the variogram range. The third pass was used to fill the rest of the block model. All passes used an ellipsoidal search. The estimation ellipse ranges and orientations are based on the variogram models developed for the various domains within the deposit, and generally conform to the orientation of the individual zones. One exception is domain 210 within Pimentao, which was modeled as a folded structure; for this domain, a dynamic orientation of the search was used in estimation due to its complex geometry. The three host rock domains (400, 500 and 600) were estimated using inverse distance weighting with a power of 2.
Specific gravity was estimated in all mineralized and BIF domain (groups 199, 299, 399 and 1000) applying two estimation runs using inverse distance weighting with a power of 2. Mean values were assigned for host rocks (400, 500 and 600).
Table 17 summarizes the data requirements for gold grade and specific gravity estimation. In all cases, gold and specific gravity were estimated using a hard boundary approach separately within every domain.
Several estimation sensitivity scenarios were considered before applying the final set of estimation parameters. The impact of an alternative interpretation of variogram models with slightly longer ranges was checked for the largest mineralized domains (101, 102, 203, 204 and 210). This resulted in a negligible impact of less than 1% difference in the average gold grade.
Table 17: Estimation Parameters for Gold and Specific Gravity
|
Domain Group
|
Name
|
Pass
|
Estimation Gold
|
Estimation SG
|
|
Ranges, m
(X, Y, Z)
|
Number of Data (min-max)
|
Max Comp per Hole
|
Estimator
|
Run
|
Ranges, m
(X, Y, Z)
|
Number of data (min-max)
|
Max Samp per Hole
|
Estimator
|
|
199
|
Biquinho
|
First
Second
Third
|
80x80x40
160x160x80
400x400x200
|
5/12
3/16
2/20
|
2
2
2
|
OK
|
First
Second
|
200x200x80
1500x1500x500
|
6/20
6/40
|
5
5
|
IDW2
|
|
299
|
Pimentao
|
First
Second
Third
|
90x90x40
180x180x80
450x450x200
|
|
399
|
Tomate
|
First
Second
Third
|
90x90x40
180x180x80
450x450x200
|
|
1000
|
BIF
|
First
Second
Third
|
100x100x40
200x200x80
1500x1500x500
|
|
400
|
Ultramafic
|
IDW2
|
Assigned Average
|
|
500
|
Metasediments
|
|
600
|
Schists
|
A hard boundary between the mineralized and unmineralized zones within BIF domains was used in the base case model. As a sensitivity, a soft boundary was tested which allowed all the samples within the BIF domains to influence the volume of both mineralized and unmineralized portions of the BIF zone. This is equivalent to the estimation of the entire BIF domains, without any distinct mineralized sub-domains. This scenario resulted in up to 25% more grade and metal in the insitu model; however, at a 2.5 g/t cut off grade value, this yielded 32% less tonnage, at 8% lower grade to give 41% fewer ounces. SRK considers this to have a material impact, however, the presence of continuous mineralized zones within BIF domains is confirmed from the core review and anomalies observed in gold, arsenic and sulfur distribution. In SRK's opinion, the use of hard boundaries prevents unreasonable grade smearing into the large BIF domains delineated by the lithology criteria only.
SRK developed the estimation using Leapfrog Edge™ software as a base case and compared the estimation results against Datamine Studio RM™ software for the large mineralized Biquinho and Pimentao domains 101, 102, 203, 204 and 210. This resulted in a 0.04% total difference in gold grade for all domains, which SRK considers to be immaterial.
One more sensitivity estimation check was conducted for specific gravity. SRK applied less smoothing in the estimation to increase the variability of the estimation results in the block model, which resulted in less than 1% difference for mineralized domains and confirms that specific gravity estimation is not sensitive to the estimation parameters.
13.2.9 Model Validation
SRK validated the block model using visual comparison of block estimates and informing composites, and statistical comparisons between composites and block model distributions at zero cut-offs. Every estimated domain was visually compared against the informing composites (Figure 26). No significant deviations between the block model and informing data were found.
A swath plot showing the ordinary kriged block model, clustered and nearest neighbours declustered composites is provided in Figure 27. This shows generally good agreement between the OK block model and the nearest neighbours declustered data. The swath plots for other domains are available in Appendix C.

Figure 26: Visual Validation of the Block Model Against Informing Composites. Domain 101
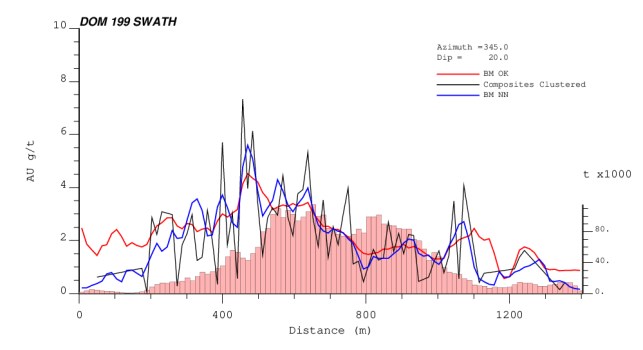
Figure 27: Swath Plot of Block Model for Biquinho Mineralized Zones, Oriented Along Dip
(Histogram corresponds to block model tonnage along the swath)
SRK also did a change of support check for the mineralized grouped zones of 199, 299, 399 and 1000. This involved a comparison of the ordinary kriging block model distribution with the nearest-neighbours declustered, change-of-support corrected distribution of the informing composites. Declustering mitigates the influence of preferential sampling of borehole data; this often results in a distribution of composites whose mean statistic is often comparable to that of the estimated model. Further, a change-of-support correction is applied to account for the volume difference between the composite scale and the final block volume scale. A quantile-quantile plot was used to compare the declustered, change-of-support corrected distribution to the estimated block model grades (Figure 28). In general, the estimated model corresponds well to the declustered, change-of-support corrected distributions. This is especially true for the mineralized zones within the BIF layers.
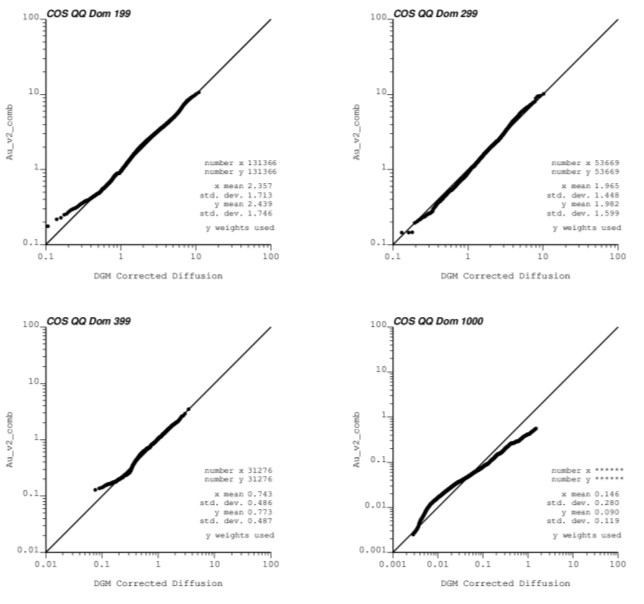
Figure 28: Comparison of Quantile-Quantile Plot for Block Model Grades and Declustered and Change of Support Corrected Distribution
13.2.10 Mineral Resource Classification
Mineral resource classification is typically a subjective concept. Industry best practices suggest that resource classification should consider the confidence in the geological continuity of the mineralized structures, the quality and quantity of exploration data supporting the estimates, and the geostatistical confidence in the tonnage and grade estimates. Appropriate classification criteria should aim at integrating these concepts to delineate regular areas at similar resource classification.
The block classification strategy considers borehole spacing, geologic confidence and continuity of category. SRK considers that there are no Measured blocks within the São Sebastião gold deposit. To differentiate between Indicated and Inferred, a separate block model was created solely to assist with block classification using an estimation run that accounts for the geometric configuration of the available boreholes. The criteria used for block classification are:
– Blocks estimated within a 50-metre × 50-metre × 50-metre search radius, using a minimum of three boreholes and belonging to the largest mineralized domains (101, 102, 152, 203, 204, 206, 208, 210). This nominally corresponds to a borehole spacing of 60 to 70 metres. The mean average distance of informing composites for this category is within 50 metres, the average number of boreholes used to estimate Indicated blocks is 5 (Figure 29).
– Relatively thin areas of the mineralized domains (less than 2 metres thickness) were excluded from the Indicated category. Some thin areas were, however, preserved to maintain the continuity of the category and/or in the high-grade areas where the thinner intersection may be justified economically.
– All blocks not classified as Indicated within mineralized domains (groups 199, 299 and 399). This nominally corresponds to a borehole spacing of 100 to 125 m.
– All the blocks within host rocks (domains 100, 200, 300, 400, 500, and 600) were unclassified.

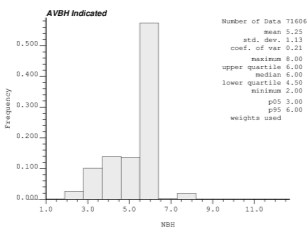
Figure 29: Distribution of Average Distance of Informing Composites (left) and Number of Boreholes (right) for Indicated Blocks
SRK examined the classification visually by inspecting sections and plans throughout the block model. SRK concludes that the material classified as Indicated reflects estimates made with a moderate level of confidence within the meaning of CIM Definition Standards for Mineral Resources and Mineral Reserves (May 2014), and all other material is estimated at a lower confidence level. Additionally, SRK applied a post-smoothing filter on the classified material for each mineralized domain to ensure continuity within the classification categories.
13.3 Mineral Resource Statement
CIM Definition Standards for Mineral Resources and Mineral Reserves (May 2014) defines a mineral resource as:
"A Mineral Resource is a concentration or occurrence of solid material of economic interest in or on the Earth's crust in such form, grade or quality and quantity that there are reasonable prospects for eventual economic extraction.
The location, quantity, grade or quality, continuity and other geological characteristics of a Mineral Resource are known, estimated or interpreted from specific geological evidence and knowledge, including sampling."
The "reasonable prospects for eventual economic extraction" requirement generally implies that the quantity and grade estimates meet certain economic thresholds and that the mineral resources are reported at an appropriate cut-off grade that takes into account extraction scenarios and processing recoveries. In order to meet this requirement, SRK considers that major portions of the São Sebastião gold deposit are amenable for underground extraction.
The block model quantities and grade estimates were also reviewed to determine the portions of the São Sebastião gold deposit having "reasonable prospects for economic extraction" from an underground mine, based on parameters summarized in Table 18. These assumptions were provided by IAMGOLD, based on an internal mine design.
Table 18: Conceptual Assumptions Considered for Underground Resource Reporting
|
Parameter
|
Unit
|
Value
|
|
Gold price
|
US$ per ounce
|
1,500
|
|
Exchange rate
|
US$/C$
|
1.10
|
|
Mining costs
|
US$ per tonne mined
|
31.70
|
|
Process cost
|
US$ per tonne of feed
|
50.70
|
|
General and administrative
|
US$ per tonne of feed
|
5.30
|
|
Mining dilution
|
percent
|
20
|
|
Mining recovery
|
percent
|
85
|
|
Process recovery
|
percent
|
93
|
|
Assumed process rate
|
tonne per year
|
400,000
|
|
Assumed mining rate
|
tonnes per day
|
1,100
|
SRK is satisfied that the mineral resources were estimated in conformity with the widely accepted CIM Estimation of Mineral Resource and Mineral Reserve Best Practices Guidelines. The mineral resources may be affected by further infill and exploration drilling that may result in increases or decreases in subsequent mineral resource estimates. The mineral resources may also be affected by subsequent assessments of mining, environmental, processing, permitting, taxation, socio-economic, and other factors. The Mineral Resource Statement for the São Sebastião gold deposit presented in Table 19 was prepared by Dr. Aleksandr Mitrofanov PGeo (APGO#2824) and Mr. Glen Cole, PGeo (APGO#1416). The overall process was reviewed by Dr. Oy Leuangthong, PEng (PEO#90563867). Dr. Mitrofanov and Mr. Cole are appropriate independent Qualified Persons as this term is defined in National Instrument 43-101. The effective date of the Mineral Resource Statement is December 2, 2019.
Table 19: Mineral Resource Statement*, São Sebastião Gold Deposit, Brazil, SRK Consulting (Canada) Inc., December 2, 2019
|
Category
|
Quantity
|
Grade
|
Contained Metal
|
|
|
(000't)
|
Gold (g/t)
|
Gold (000'oz)
|
|
Underground*
|
|
|
|
|
Indicated
|
3,330
|
4.39
|
470
|
|
Inferred
|
3,559
|
3.78
|
433
|
|
* Mineral resources are not mineral reserves and have not demonstrated economic viability. All figures have been rounded to reflect the relative accuracy of the estimates. Reported at underground resource cut-off grades of 2.5 g/t gold. Cut-off grades are based on a price of US$1,500 per ounce of gold and gold recoveries of 93%.
|
The Mineral Resource Statement split by zones and mineralized domains is presented in Table 20
Table 20: Mineral Resource Statement Reported by Domain
|
Category
|
Zone
|
Domain
|
Quantity
|
Grade
|
Contained Metal
|
|
(000't)
|
Gold (g/t)
|
Gold (000'oz)
|
|
Underground*
|
|
|
|
|
|
|
Indicated
|
Biquinho
|
101
|
2,018
|
4.62
|
300
|
|
102
|
246
|
3.73
|
29
|
|
152
|
80
|
3.26
|
8
|
|
Pimentao
|
203
|
321
|
3.57
|
37
|
|
204
|
215
|
4.26
|
29
|
|
205
|
16
|
4.57
|
2
|
|
206
|
73
|
5.29
|
12
|
|
208
|
1
|
2.87
|
0
|
|
210
|
361
|
4.43
|
51
|
|
|
Total Indicated
|
|
3,330
|
4.39
|
470
|
|
Inferred
|
Biquinho
|
101
|
3,127
|
3.75
|
377
|
|
102
|
120
|
3.67
|
14
|
|
151
|
1
|
3.00
|
0
|
|
152
|
14
|
2.78
|
1
|
|
153
|
2
|
2.82
|
0
|
|
Pimentao
|
202
|
15
|
3.46
|
2
|
|
203
|
43
|
3.51
|
5
|
|
204
|
48
|
3.72
|
6
|
|
205
|
28
|
3.20
|
3
|
|
206
|
4
|
3.14
|
0
|
|
207
|
25
|
6.69
|
5
|
|
210
|
119
|
4.81
|
18
|
|
Tomate
|
301
|
13
|
2.78
|
1
|
|
302
|
0
|
2.51
|
0
|
|
|
Total Inferred
|
|
3,559
|
3.78
|
433
|
|
* Mineral resources are not mineral reserves and have not demonstrated economic viability. All figures have been rounded to reflect the relative accuracy of the estimates. Reported at underground resource cut-off grade of 2.5 g/t gold. Cut-off grade are based on a price of US$1,500 per ounce of gold and a gold recovery of 93%.
|
13.3.1 Grade Sensitivity Analysis
The mineral resources of the São Sebastião gold deposit are sensitive to the selection of the reporting cut-off grade. To illustrate this sensitivity, the global model quantities and grade are presented in Table 21 at different cut-off grades. The reader is cautioned that the figures presented in this table should not be misconstrued with a Mineral Resource Statement. The figures are only presented to show the sensitivity of the block model estimates to the selection of cut-off grade. Figure 30 presents this sensitivity as grade tonnage curves.
Table 21: Global Block Model Quantity and Grade Estimates* at Various Cut-off Grades, São Sebastião Gold Deposit, Brazil
|
Cut-off
Grade
|
Indicated
|
Inferred
|
|
Quantity
|
Grade
|
Metal
Content
|
Quantity
|
Grade
|
Metal
Content
|
|
Au (g/t)
|
(000' t)
|
Au (g/t)
|
(000'oz)
|
(000' t)
|
Au (g/t)
|
(000'oz)
|
|
0.00
|
7,564
|
2.72
|
661
|
13,510
|
1.82
|
791
|
|
0.50
|
7,230
|
2.83
|
657
|
11,690
|
2.05
|
771
|
|
1.00
|
6,275
|
3.14
|
634
|
8,395
|
2.56
|
692
|
|
1.50
|
5,221
|
3.53
|
592
|
6,407
|
2.98
|
613
|
|
2.00
|
4,303
|
3.91
|
540
|
4,872
|
3.37
|
527
|
|
2.50
|
3,330
|
4.39
|
470
|
3,559
|
3.78
|
433
|
|
3.00
|
2,564
|
4.88
|
403
|
2,526
|
4.21
|
342
|
|
3.50
|
1,955
|
5.39
|
339
|
1,758
|
4.64
|
262
|
|
4.00
|
1,465
|
5.95
|
280
|
1,182
|
5.09
|
193
|
|
4.50
|
1,151
|
6.42
|
238
|
744
|
5.59
|
134
|
|
5.00
|
891
|
6.91
|
198
|
444
|
6.16
|
88
|
|
5.50
|
718
|
7.31
|
169
|
278
|
6.72
|
60
|
|
6.00
|
571
|
7.72
|
142
|
171
|
7.33
|
40
|
|
6.50
|
444
|
8.14
|
116
|
117
|
7.84
|
30
|
|
7.00
|
342
|
8.56
|
94
|
90
|
8.18
|
24
|
|
7.50
|
255
|
9.00
|
74
|
69
|
8.47
|
19
|
|
8.00
|
200
|
9.35
|
60
|
47
|
8.80
|
13
|
|
8.50
|
145
|
9.77
|
46
|
25
|
9.23
|
8
|
|
9.00
|
109
|
10.10
|
35
|
13
|
9.69
|
4
|
|
9.50
|
73
|
10.52
|
25
|
6
|
10.26
|
2
|
|
10.00
|
42
|
11.16
|
15
|
5
|
10.39
|
2
|
|
* The reader is cautioned that the figures in this table should not be misconstrued with a Mineral Resource Statement. The figures are only presented to show the sensitivity of the block model estimates to the selection of a cut-off grade. All figures have been rounded to reflect the relative accuracy of the estimates.
|
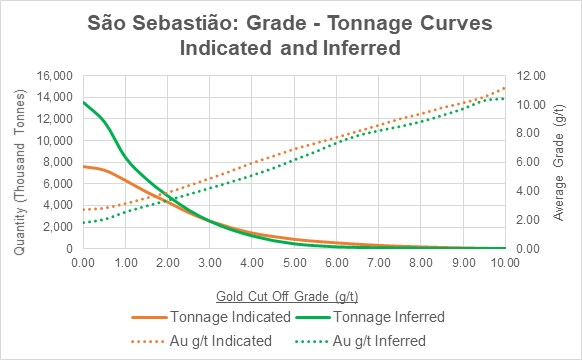
Figure 30: Global Grade-Tonnage Curves (Indicated and Inferred)
13.3.2 Reconciliation with 2018 Mineral Resource Statement
The December 31, 2018 Mineral Resource Statement was initially prepared by IAMGOLD in 2017, who restated this in 2018 (Table 22). Table 23 tabulates a reconciliation between the December 31, 2018 and the December 2, 2019 mineral resource statements.
Table 22: Mineral Resource Statement, São Sebastião Gold Deposit, IAMGOLD Corporation, Brazil, December 31, 2018
|
Category
|
Quantity
|
Grade
|
Contained Metal
|
|
|
(000't)
|
Gold (g/t)
|
Gold (000'oz)
|
|
Underground*
|
|
|
|
|
Inferred
|
5,365
|
4.75
|
819
|
|
* Mineral resources are not mineral reserves and have not demonstrated economic viability. All figures have been rounded to reflect the relative accuracy of the estimates. Reported at underground resource cut-off grades of 2.5 g/t gold. Cut-off grades are based on a price of US$1,500 per ounce of gold and gold recoveries of 93%.
|
Table 23: Comparison Between 2018 and 2019 Mineral Resource Statements
|
Classification
|
Quantity
|
Grade
|
Contained Metal
|
|
(000′t)
|
Gold (g/t)
|
Gold (000'oz)
|
|
December 2018
|
|
Indicated
|
|
|
|
|
Inferred
|
5,365
|
4.75
|
819
|
|
December 2019
|
|
Indicated
|
3,330
|
4.39
|
470
|
|
Inferred
|
3,559
|
3.78
|
433
|
|
Percentage Difference
|
|
Indicated
|
new
|
new
|
new
|
|
Inferred
|
-34%
|
-20%
|
-47%
|
IAMGOLD drilled an additional 21 boreholes for 12,431 metres of drilling since the December 2017 resource model, an increase of 11%. Additionally, the geological and estimation domains have changed significantly since the 2017 interpretation. In collaboration with the IAMGOLD project site team, SRK developed the mineralized subdomains within the BIF lithology and made several updates in the domain modelling. Those contributed to an overall increase of 10% in contained metal.
Another significant revision was the change in the classification approach. In SRK's opinion, the increased confidence in defining geological continuity and the abundance of drilling data in the densely drilled areas allows classifying the most continuous and well-explored portion of the mineralized domains as Indicated. Correspondingly, Inferred tonnage, grade and ounces are significantly reduced.
14 Adjacent Properties
The Turmalina gold deposit is the only gold mine currently in operation in the Pitangui Greenstone Belt. It is located in the Conceição do Pará municipality in the state of Minas Gerais, approximately 20 kilometres west of São Sebastião deposit and 6 kilometres south of the town of Pitangui. The property comprises seven contiguous mineral rights concessions that cover an area of 5,034 ha.
The property contains the Turmalina Mine and two satellite deposits, Faina and Pontal, to which Jaguar has 100% ownership. Ownership is subject to a 5% net revenue interest up to $10 million and 3% thereafter, to an unrelated third party. In addition, there is a 0.5% net revenue interest payable to the surface landowner.
The Turmalina deposit comprises five main zones of shear-hosted quartz-sulfide veins and minor sulfide dissemination zones (pyrrhotite, pyrite, arsenopyrite and some chalcopyrite). Mineralization is hosted in metasedimentary, mafic metavolcanic mafic and ultramafic rocks. Both open pit and underground mining methods have been employed on the property, however, only the underground mine is currently operating.
AngloGold Ashanti Ltd. (AngloGold) controlled the Turmalina mineral rights from 1978 to 2004 through a number of Brazilian subsidiaries. AngloGold explored the area extensively between 1979 and 1988 using geochemistry, ground geophysics, and trenching. A total of 373,000 tonnes of oxide ore were mined from open pits between 1992 and 1993, recovering 35,500 ounces of gold.
Jaguar acquired the Turmalina Mine from AngloGold in September 2004 and commenced mining operations in late 2006. The Turmalina plant has processed approximately 6.2 million tonnes of ore and produced a total of approximately 672 Koz of gold at 3.56 g/t.
The Mineral Resource estimate for the Turmalina Mine effective on April 5, 2019 documented a total of 697 thousand ounces of combined Measured and Indicated gold at a grade of 5.53 g/t. The cut-off grades were 2.1 g/t gold for the Turmalina Mine, and 3.8 g/t gold and 2.9 g/t gold for the Faina and Pontal deposits, respectively.
More information can be found in the technical report for the Turmalina Mine Complex, Minas Gerais State, Brazil (effective April 5, 2019) filed on SEDAR (www.sedar.com).
15 Other Relevant Data and Information
There is no other relevant data available about the Pitangui Gold Project.
16 Interpretation and Conclusions
The Mineral Resource Statement presented herein represents the second mineral resource evaluation prepared by SRK and fourth mineral resource evaluation for the São Sebastião gold deposit. The mineral resource model prepared by SRK considers 240 core boreholes drilled by IAMGOLD during the period of 2011 to 2019, of which 216 core boreholes (80,041 metres) are in the modelled area.
The gold mineralization at the São Sebastião deposit is hosted in a series of parallel and complex folded horizons of banded iron formation (BIF), separated by mafic volcanic and minor sedimentary units within the lower greenstone belt stratigraphy. Gold mineralization, within the BIF, is associated with sulphide replacement of the primary magnetite bands and is characterized by the presence of pyrrhotite and to a lesser extent, arsenopyrite, pyrite and chalcopyrite. Three main horizons of mineralization have been identified by IAMGOLD to date, the Biquinho, Pimentao and Tomate zones, which are vertically separated by approximately 100 metres.
SRK can confirm that IAMGOLD's exploration work is conducted using field procedures that generally meet accepted industry best practices. SRK is of the opinion that the exploration data are sufficiently reliable to interpret with confidence the boundaries of the gold mineralization and support the evaluation and classification of mineral resources.
An exploration database comprising 32,724 core sample intervals assayed for gold was used to prepare a mineral resource model using a conventional geostatistical block modelling approach constrained by mineralization wireframes. A block model was constructed to accommodate the gold mineralization in the area of the São Sebastião gold deposit. The block models were populated with gold grades estimated using ordinary kriging informed from capped composited data and estimation parameters derived from variography.
SRK considers that the current drilling spacing is sufficient to infer the continuity of the gold mineralization within the meaning of the CIM Definition Standards for Mineral Resources and Mineral Reserves (May 10, 2014).
The increased drilling density since the 2017 interpretation has resulting in a significant change in the interpretation of geological and estimation domains. The understanding of the geological continuity and abundance of drilling data in the densely drilled areas allows classifying the most continuous and well-explored portion of the mineralized domains as Indicated. Correspondingly, Inferred tonnage, grade and ounces are significantly reduced.
17 Recommendations
The geological setting and the character of the gold mineralization delineated and modeled are of sufficient merit to justify additional exploration and pre-development investigations. In this regard, SRK propose a project development strategy focussed on optimizing the full exploration potential of the Pitangui Project and on evaluating the economic merit of the project.
This strategy can be summarized as follows:
- Further improve the delineation and classification of current mineral resources and to characterize the geological and structural setting of the entire property with the identification and prioritization of additional gold exploration targets.
- Evaluate at a conceptual level the viability of an underground mine of the Pitangui property.
To evaluate the viability of the project, SRK recommends that IAMGOLD initiates engineering, metallurgical, environmental, permitting, and other studies aimed at completing the characterization of the context of the gold mineralization found in the Pitangui Project to allow evaluating at a conceptual level the economic potential of an underground mine on the property.
A proposed work program to achieve this should include:
- Additional mineral processing and metallurgical testing.
- Rock and soil geotechnical and hydrogeology investigations.
- Geochemistry investigations of mineralization and waste.
- Environmental baseline studies, permitting, and social or community impact.
- Conceptual mine design work to evaluate at a scoping level which mining scenario offers the best potential for an economic return.
- Preparation of a preliminary economic assessment study.
To achieve the above goals, IAMGOLD has committed a budget of US$7 million to the Pitangui Project for project evaluation and an exploration work program phased over three years to position the project to examine potential development scenarios (Table 24). The principal objectives of the three-year exploration program are to:
- Complete an additional 5,000 metres of core drilling to continue to expand and outline potential mineral resource extensions at depth down plunge.
- Selected infill drilling of 10,000 metres to convert inferred resources to indicated, targeting shallow, high grade areas which could potentially be mined in the early stages of a mine development.
- Additional metallurgical testing on approximately 2,000 metres of core to confirm optimal process plant flow sheet parameters. The program will involve the completion of large diameter core drill holes targeted to extract suitable sample volumes to yield a projected LOM composite grade.
- Initiate 1,000 metres of geotechnical drilling to assess proposed portal locations.
- Initiate a base line environmental sampling and monitoring program in areas of possible mine infrastructure sites to a support future ESIA study.
- Evaluate the mineral resource potential and remaining exploration potential of other exploration targets by completing 2,500 metres of drilling on the Onca vein system and 2,500 metres of drilling the Vilaca and Aparicao prospects.
SRK considers that the implementation of the proposed work program will advance the Pitangui Project towards a pre-development stage and will provide key inputs required to evaluate at a conceptual level the economic potential of an underground mine on the property.
Table 24: Estimated Cost for the Proposed Exploration Program
|
Description
|
Quantity
|
Total Cost (US$)
|
|
Year 1
|
|
|
|
Resource Drilling (expansion)
|
5,000 metres
|
525,000
|
|
Exploration Drilling
|
2,500 metres
|
275,000
|
|
Assays
|
2,000 samples
|
50,000
|
|
Camp and Land Access
|
|
150,000
|
|
Geology and Support
|
|
750,000
|
|
Environmental Monitoring
|
|
125,000
|
|
Subtotal
|
|
1,875,000
|
|
Year 2
|
|
|
|
Resource Drilling (infill)
|
10,000 metres
|
1,050,000
|
|
Exploration Drilling
|
2,500 metres
|
275,000
|
|
Assays
|
5,000 samples
|
125,000
|
|
Camp and Land Access
|
|
150,000
|
|
Geology and Support
|
|
950,000
|
|
Environmental Monitoring
|
|
125,000
|
|
Subtotal
|
|
2,675,000
|
|
Year 3
|
|
|
|
Resource Drilling (metallurgical)
|
2,000 metres
|
300,000
|
|
Metallurgical Testing
|
|
375,000
|
|
Geotechnical Drilling
|
1,000 samples
|
200,000
|
|
Camp and Land Access
|
|
150,000
|
|
Geology and Support
|
|
750,000
|
|
ESIA
|
|
350,000
|
|
PEA
|
|
325,000
|
|
Subtotal
|
|
2,450,000
|
|
Total
|
|
7,000,000
|
SRK reviewed the proposed program and considers that this program is appropriate and reasonable.
SRK is unaware of any other significant factors and risks that may affect access, title, or the right or ability to perform the exploration and mining preparation work recommended for the Pitangui Gold Project.
18 References
ALS Minerals.,2004. Metallurgical Assessment of the Pitangui Gold Project, Brazil. KM5017. Internal report to IAMGOLD p. 204.
Alkmim, F.F., 2004. O que faz de um cráton um cráton? O Cráton do SãoFrancisco e as revelações almeidianas ao revelá-lo. In: V. Mantesso Neto, A. Bartorelli, C.D.R. Carneiro, B.B.de Brito-Neves. orgs. 2004. Geologia do Continente Sul-Americano: Evolução da obra de Fernando Flávio Marques de Almeida. São Paulo: Ed. Beca. p. 17-35. (Cap. 1).
Almeida, A. M. de; Bueno do Prado, M. G.; Corrêa Neto, A. V.; Mabub, R. O, de Araújo; Manduca, L. G.; Montenegro, P. H. da S.; Sampaio, M. F.; Schlichta, T. M., 2016. São Sebastião gold deposit, Onça do Pitangui, Minas Gerais, Brazil: a greenfields discovery. SIMEXMIN 2016, ADIMB, Minas Gerais.
Almeida, F.F.M. de, 1977. Origem e evolução da Plataforma Brasileira. Boletim. Divisão de Geologia e Mineralogia. Rio de Janeiro: DNPM, n. 241, p. 1-36.
Baltazar, O.F., Zucchetti, M., 2007. Lithofacies associations and structural evolution of the Archean Rio das Velhas greenstone belt, Quadrilátero Ferrífero, Brazil: a review of the regional setting of gold deposits. Ore Geology Reviews 32: 471-499.
Brando Soares, M., Corrêa Neto, A.V., Zeh, A., Cabral, A.R., Pereira, L.F., Prado, M.G.B., Almeida, A.M., Manduca, L.G., Silva, P.H.M., Araújo, R.O., Schlichta, T.M., 2017. Geology of the Pitangui greenstone belt, Minas Gerais, Brazil: stratigraphy, geochronology and BIF geochemistry. Precambrian Research. 291, 17-41.
Brando Soares, M., Corrêa Neto, A.V., Bertolino, L. C., Alves, F.E.A., Almeida, A.M., Silva, P.H.M., Araújo, R.O., Manduca, L.G., Araújo,I.M.C.P., 2018. Multistage Mineralization at the Hypozonal São Sebastião Gold Deposit, Pitangui Greenstone Belt, Minas Gerais, Brazil. Ore Geology Reviews 102, 618-638.
Brando-Soares, M., Pereira, L.F., Almeida, A. M. de; Bueno do Prado, M. G.; Corrêa Neto, A. V.; Mabub, R. O, de Araújo; Manduca, L. G.; Montenegro, P. H. da S.; Sampaio, M. F.; Schlichta, T. M., 2016. Contrasting geochemical trends from the São Sebastião gold deposit, Onça de Pitangui, Minas Gerais. SIMEXMIN 2016, ADIMB, Minas Gerais.
Cabral, A.R., Corrêa Neto, A.V., 2015. Empirical Bi8Te3 and Bi2Te From the São Sebastião Gold Deposit, Brazil: Implications for Lode-Gold Mineralization In Minas Gerais. Canadian Mineralogist 53, 1061-1072.
Cabral, A.R., Lehmann, B., Tupinambá, M., Schlosser, S., Kwitko-Ribeiro, R., de Abreu,F.R., 2009. The platiniferous Au-Pd belt of Minas Gerais, Brazil, and genesis of its botryoidal Pt-Pd-Hg aggregates. Econ. Geol. 104, 1265-1276.
Cabral, A.R.; Zeh, A.; Koglin, N.; Seabra Gomes, A.A. Jr; Viana, D.J.; Lehmann, B., 2012a. Dating the Itabira iron formation, Quadrilátero Ferrífero of Minas Gerais, Brazil, at 2.65 Ga: depositional U-Pb age of zircon from a metavolcanic layer. Precambrian Res 204-205:40-45.
Cabral, A.R., Wiedenbeck, M., Rios, F.J., Seabra Gomes, A.A. Jr, Rocha Filho, O.G., Jones, R.D., 2012b. Talc mineralisation associated with soft hematite ore, Gongo Soco deposit, Minas Gerais, Brazil: petrography, mineral chemistry and boron-isotope composition of tourmaline. Miner Deposita 47:411-424.
Castro, P. T. A., Dardenne, M. A., 2000. The sedimentology, stratigraphy and tectonic context of the São Francisco Supergroup at the southeast boundary of the São Francisco Craton. Revista Brasileira de Geosciencias, 30, 439-441.
Corrêa Neto, A.V., Modesto, A.M., de Caputo Neto, V., Guerrero, J.C., 2012. Alteração hidrotermal em zona de cisalhamento associada ao Lineamento Congonhas, suldo Quadrilátero Ferrífero, Minas Gerais. An. Inst. Geociênc.: UFRJ 35 (2), 55-64.
David, M.E.V., 2006. Composição isotópica de Pb - Sr e Nd da mineralização de ouro do depósito Córrego do Sítio, Quadrilátero Ferrífero (M.G.): implicações na modelagem conceitual. IGc-USP (M.Sc. Dissertation. 76 pp.).
Dopico, C.I.M., Lana, C., Moreira, H.S., Cassino, L.F., Alkmim, F.F., 2017. U-Pb ages and Hf-isotope data of detrital zircons from the late Neoarchean-Paleoproterozoic Minas Basin, SE Brazil. Precambrian Research. 291, 143-161.
El-Rassi, D., Vos, I., 2014. Independent Technical Report for the São Sebastião Gold Deposit, Pitangui Project, Brazil. SRK consulting and IAMGOLD Corporation, 2014.
Fabrício-Silva, W., Rosière, C.A., Bühn, B., 2018. The shear zone-related gold mineralization at the Turmalina deposit, Quadrilátero Ferrífero, Brazil: structural evolution and the two stages of mineralization. Miner. Deposita.
Gair, J.E., 1962. Geology and ore deposit of the Nova Lima and Rio Acima quadrangles, Minas Gerais, Brazil. United States Geological Survey Professional Paper 341-A, 67pp.
Goldfarb, R.J., Groves, D.I., Gardoll, S., 2001. Orogenic gold and geologic time: a global synthesis. Ore Geology Reviews 18, 1-75.
Groves, D.I., Goldfarb, R.J., Gebre-Mariam, M., Hagemann, S.G., Robert, F., 1998. Orogenic gold deposits: a proposed classification in the context of their crustal distribution and relationship to other gold deposit types. Ore Geol. Rev. 13, 7-27.
Hartmann, L.A., Endo, I., Suita, M.D.F., Santos, J.O.S., Frantz, J.C., Carneiro, M.A., McNaughton, N.J., Barley, M.E., 2006. Provenance and age delimitation of Quadrilátero Ferrífero sandstones based on zircon U-Pb isotopes. Journal of South American Earth Sciences 20, 273-285.
Hasui, Y. A grande colisão pré-Cambriana do sudeste brasileiro e a estruturação regional. Geociências, São Paulo, v. 29, n. 2, p. 141-169, 2010.
Heineck C.A., Leite C.A.S., Silva M.A., Vieira V.S, 2003. Mapa geológico do Estado de Minas Gerais, Escala 1:1.000.000. Belo Horizonte, CODEMIG/CPRM.
Junqueira, P.A., Lobato, L.M., Ladeira, E.A., Simões E.J.M., 2007. Structural control and hydrothermal alteration at the BIF-hosted Raposos lode-gold deposit, Quadrilátero Ferrífero, Brazil. Ore Geology Reviews 32 (2007) 629-650.
Lobato, L.M.; Ribeiro-Rodrigues, L.C.; Vieira, F.W.R., 2001; Brazil's premier gold province. Part II: geology and genesis of gold deposits in the Archean Rio das Velhas greenstone belt, Quadrilátero Ferrífero.
Lobato, L.M., Santos, J.O.S., McNaughton, N.J., Fletcher, I.R., Noce, C.M., 2007. U-Pb SHRIMP monazite ages of the giant Morro Velho and Cuiabá gold deposits, Rio das Velhas greenstone belt, Quadrilátero Ferrífero, Minas Gerais, Brazil. Ore Geol. Rev. 32, 674-680.
Machado, N., and Carneiro, M.A., 1992. U-Pb evidence of late Archean tectono-thermal activity in the southern São Francisco shield, Brazil. Canadian Journal of Earth Sciences. 29 (11), 2341-2346.
Machado, N., Noce, C.M., Ladeira, E.A., Belo De Oliveira, O., 1992. U-Pb geochronology of Archean magmatism and Proterozoic metamorphism in the Quadrilatero Ferrifero, southern Sao Francisco Craton, Brazil. Geol. Soc. Am. Bull. 104, 1221-1227.
Machado, N., Schrank, A., Noce, C.M., Gauthier, G., 1996. Ages of detrital zircon from Archean-Paleoproterozoic sequences: Implications for Greenstone Belt setting and evolution of a Transamazonian foreland basin in Quadrilátero Ferrífero, southeast Brazil. Earth Planet. Sci. Lett. 141, 259-276.
Moreira, H., Lana, C., Nalini, H.A., 2016. The detrital zircon record of an Archaean convergent basin in the Southern São Francisco Craton, Brazil. Precambrian Res. 275, 84-99.
Noce, C.M., Tassinari, C.C.G., Lobato, L.M., 2007. Geochronological framework of the Quadrilátero Ferrífero, with emphasis on the age of gold mineralization hosted in Archean greenstone belts. Ore Geology Reviews 32, 500-510.
Pelletier, P., 2013. Preliminary metallurgical testwork results on the Pitangui deposit. IAMGOLD Internal Report, 7 pages.
Pinto, C.P., Silva, M.A., 2014. Mapa Geológico do Estado de Minas Gerais. CODEMIG, Governo de Minas, CPRM, Secretaria de Geologia, Mineração e Transformação Mineral, Ministério de Minas e Energia, Governo Federal do Brasil.
Reis, H.L.S., Suss, J.F., Fonseca, R.C.S., Alkmim, F.F., 2017. Ediacaran forebulge grabens of the southern São Francisco basin, SE Brazil: Craton interior dynamics during West Gondwana assembly. Precambrian Res. 302, 150-170.
Ribeiro-Rodrigues, L.C., Oliveira, C.G. de, Friedrich, G., 2007. The Archean BIF-hosted Cuiabá Gold deposit, Quadrilátero Ferrífero, Minas Gerais, Brazil. Ore Geology Reviews 32: 543-570.
Romano, A.W., 2007. Nota Explicativa da Folha Pará de Minas (SE.23-Z-C-IV) 1:100.000. UFMG/CPRM, 65pp.
Schrank, A., Machado, N., Stern, R., 2002. Eventos no Arqueano com base em idades U/Pb-SHRIMP de zircões detríticos em metassedimentos da mina de Morro Velho-Quadrilátero Ferrífero-Minas Gerais. 41th Congresso Brasileiro de Geologia, Sociedade Brasileira de Geologia, João Pessoa, p. 527.
SRK Consulting (Canada)., 2014. Independent technical report for the Sao Sebastião Gold Deposit, Pitangui Project, Brazil. Publically filed technical report generated for IAMGOLD. 85pp.
Tassinari, C.G., Mateus, A.M., Velásquez, M.E., Munhá, J.M.U., Lobato, L.M., Bello, R.M., Chiquini, A.P., Campos, W.F., 2015. Geochronology and thermochronology of gold mineralization in the Turmalina deposit, NE of the Quadrilátero Ferrífero Region, Brazil. Ore Geology Reviews 67:368-381.
Vial, D.S., Abreu, G.C., Schubert, G., Ribeiro-Rodrigues, L.C., 2007a. Smaller gold deposits in the Archean Rio das Velhas greenstone belt, Quadrilátero Ferrífero, Brazil. Ore Geology Reviews 32 (2007) 651-673.
Vial, D.S., Dewitt, Lobato, L.M., Thormann, C.H., 2007b. The geology of the Morro Velho gold deposit in the Archean Rio das Velhas greenstone belt, Quadrilátero Ferrífero, Brazil. Ore Geol. Rev. 32, 511-542.
Vial, D.S., Duarte, B.P., Fuzikawa, K., Vieira, M.B.H., 2007c. An epigenetic origin for the Passagem de Mariana gold deposit, Quadrilátero Ferrífero, Minas Gerais, Brazil. Ore Geology Reviews 32:596-613.
APPENDIX A
Legal Title Opinion

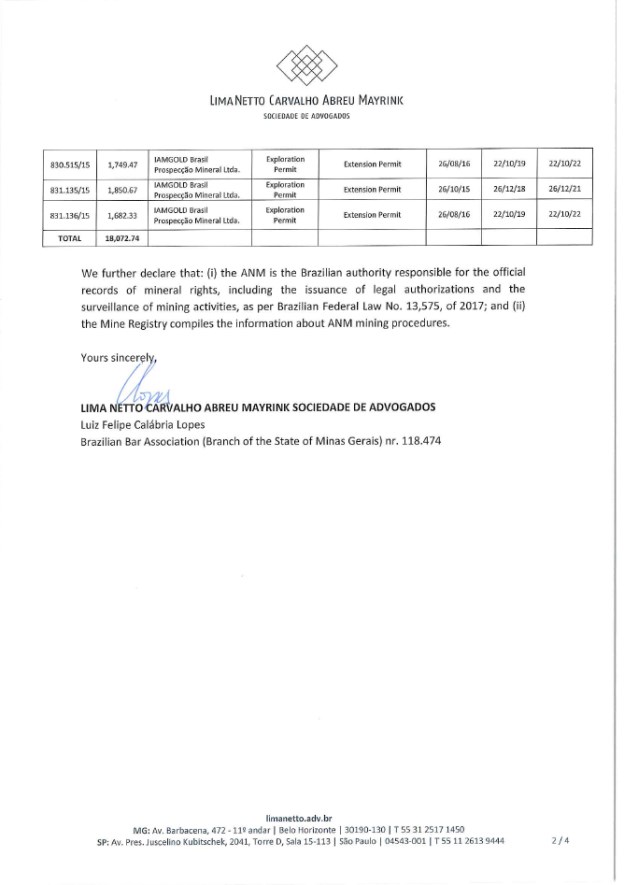
APPENDIX B
Analytical Quality Control Data and
Relative Precision Charts
Time Series Plots for Blank and Certified Reference Material Samples Assayed by ACME Labs and ALS Minerals for the Pitangui Gold Project Between 2014-2019
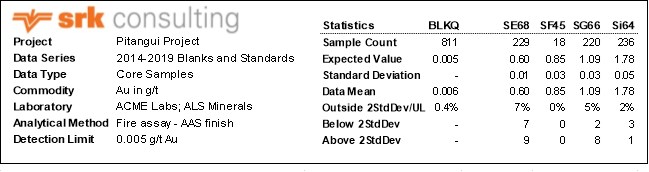
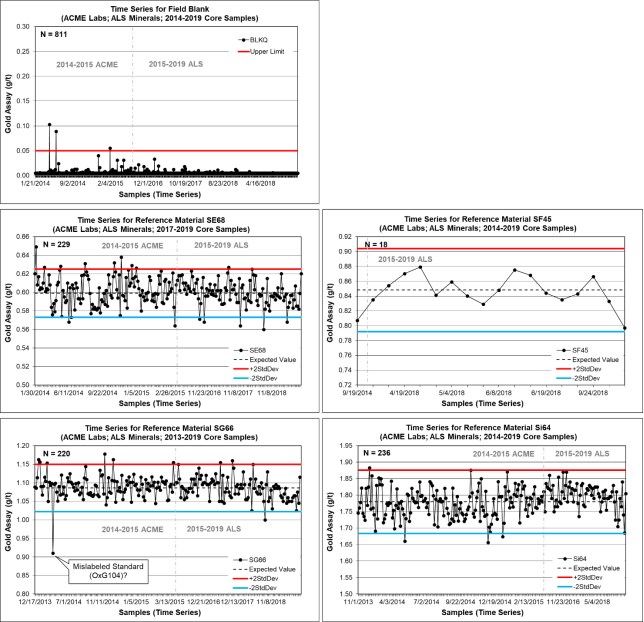
Time Series Plots for Blank and Certified Reference Material Samples Assayed by ACME Labs and ALS Minerals for the Pitangui Gold Project Between 2014-2019
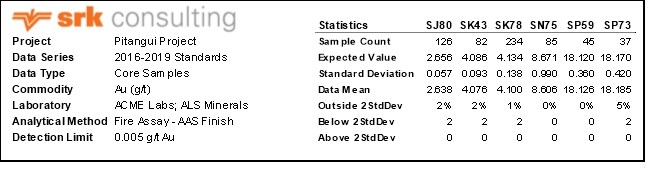
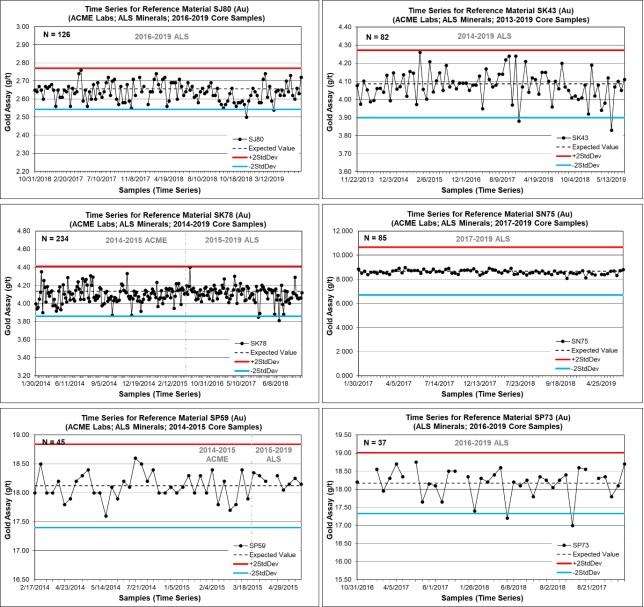
Bias Charts and Precision Plots for umpire check assay pulps (ACME versus SGS samples) for Pitangui Gold Project between 2014-2015
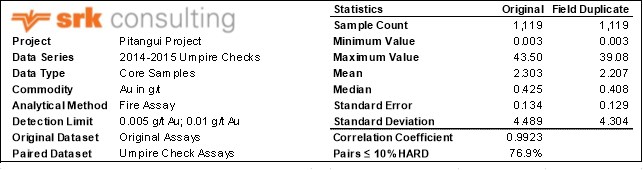
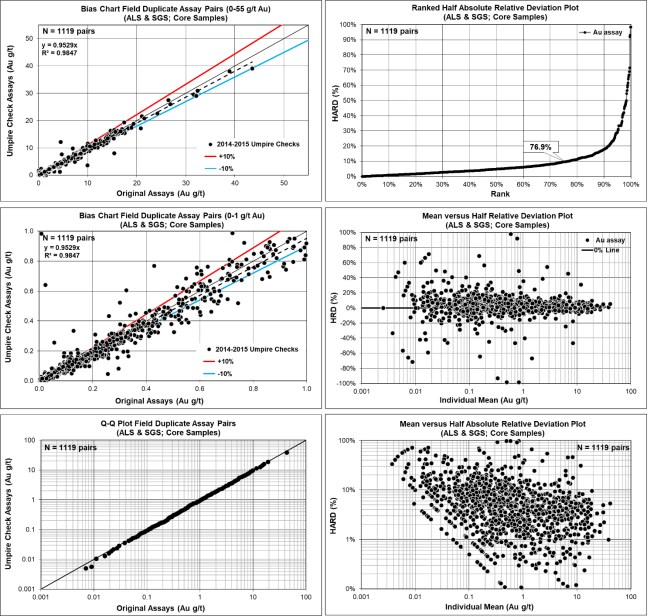
Bias Charts and Precision Plots for umpire check assay pulps (ALS versus SGS samples) for Pitangui Gold Project between 2015-2019
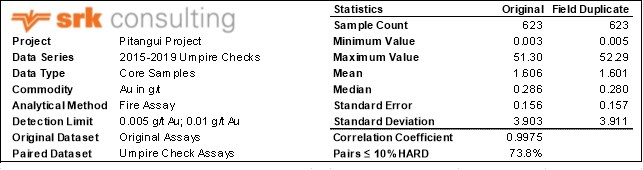

APPENDIX C
Capping Charts

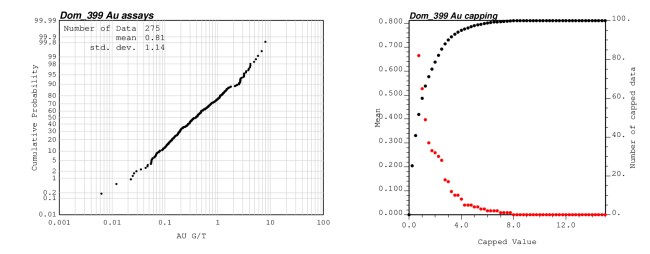
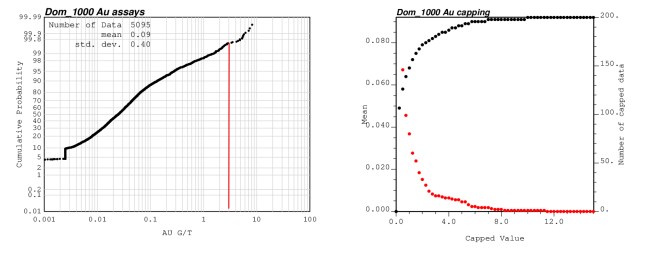
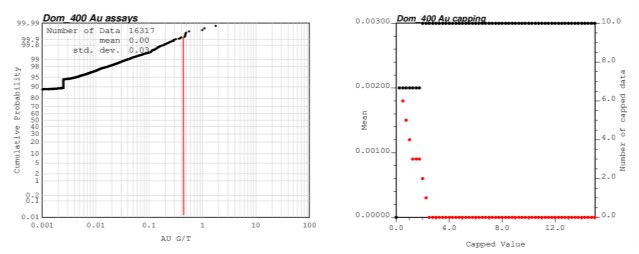


APPENDIX D
Gold Variograms
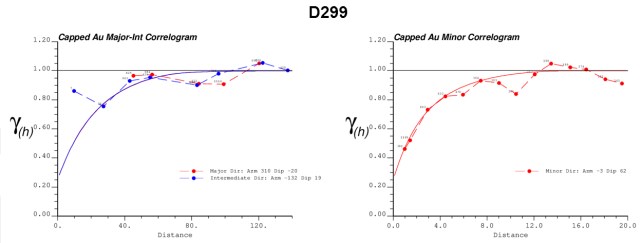
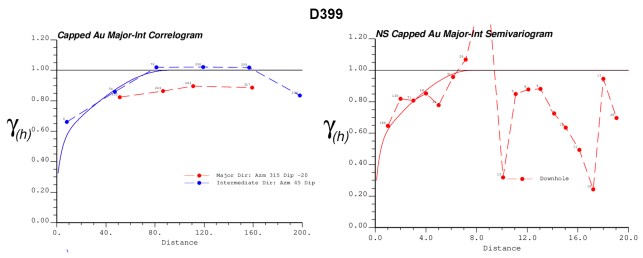
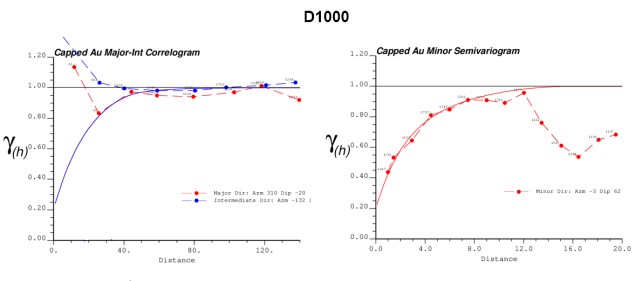
APPENDIX E
Gold SWATH Plots
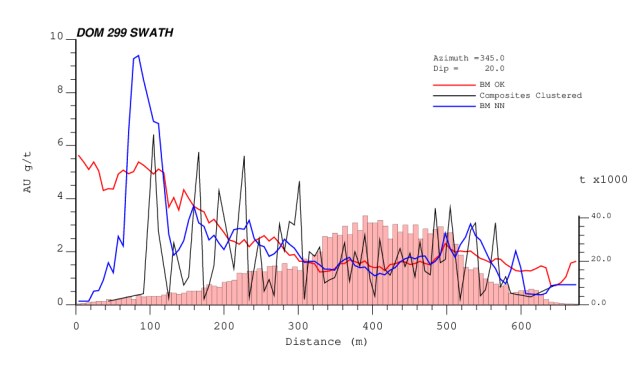
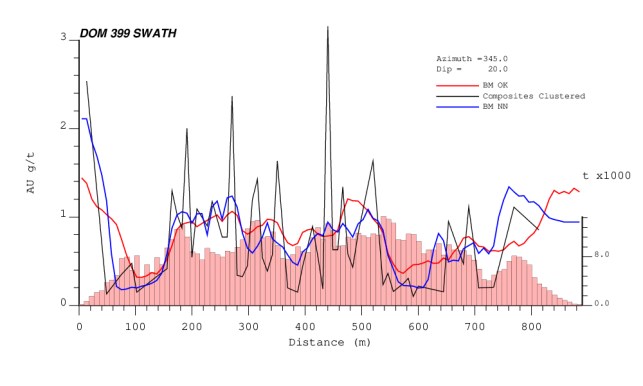
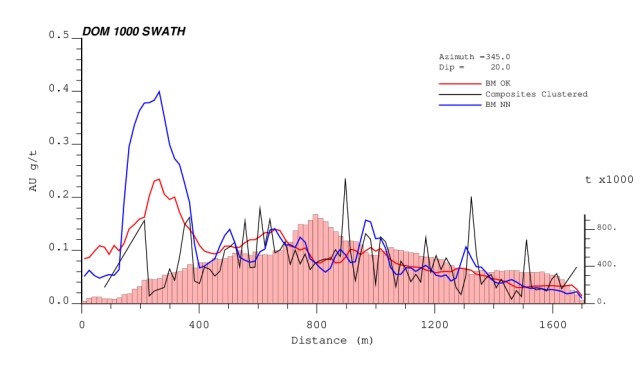
CERTIFICATE OF QUALIFIED PERSON
To Accompany the report entitled: Independent Technical Report for the São Sebastião Gold Deposit, Pitangui Gold Project, Brazil, January 27, 2020
I, Glen Cole, do hereby certify that:
|
1)
|
I am a Principal Consultant (Resource Geology) with the firm of SRK Consulting (Canada) Inc. (SRK) with an office at Suite 1500, 155 University Avenue, Toronto, Ontario, Canada;
|
| |
|
|
2)
|
I am a graduate of the University of Cape Town in South Africa with a B.Sc. (Hons) in Geology in 1983; I obtained a M.Sc. (Geology) from the University of Johannesburg in South Africa in 1995 and an MEng in Mineral Economics from the University of the Witwatersrand in South Africa in 1999. I have practiced my profession continuously since 1986, having worked on multi-commodity international exploration and mining projects. I worked on gold exploration projects, underground and open pit mining gold operations in Africa and held positions of Mineral Resource Manager, Chief Mine Geologist and Chief Evaluation Geologist, with the responsibility for estimation of mineral resources and mineral reserves for development gold projects and operating gold mines;
|
| |
|
|
3)
|
I am a Professional Geoscientist registered with the Association of Professional Geoscientists of the Province of Ontario (APGO#1416) and am also registered as a Professional Natural Scientist with the South African Council for Scientific Professions (Reg#400070/02);
|
| |
|
|
4)
|
I have personally inspected the subject project from June 10 to June 12, 2019;
|
| |
|
|
5)
|
I have read the definition of Qualified Person set out in National Instrument 43-101 and certify that by virtue of my education, affiliation to a professional association, and past relevant work experience, I fulfill the requirements to be a Qualified Person for the purposes of National Instrument 43-101 and this technical report has been prepared in compliance with National Instrument 43-101 and Form 43-101F1;
|
| |
|
|
6)
|
I, as a Qualified Person, I am independent of the issuer as defined in Section 1.5 of National Instrument 43-101;
|
| |
|
|
7)
|
I am the principal author of this report and am responsible for all the sections of the report] and accept professional responsibility for those sections of this technical report;
|
| |
|
|
8)
|
I have had prior involvement with the subject property, having contribute to a technical report in 2014;
|
| |
|
|
9)
|
I have read National Instrument 43-101 and confirm that this technical report has been prepared in compliance therewith;
|
| |
|
|
10)
|
SRK Consulting (Canada) Inc. was retained by IAMGOLD Corporation to prepare a technical report for São Sebastião gold deposit, Pitangui Gold Project. In conducting our audit, a gap analysis of project technical data was completed using CIM Estimation of Mineral Resources and Mineral Reserves Best Practice Guidelines and Canadian Securities Administrators National Instrument 43-101 guidelines. The preceding report is based on a site visit, a review of project files and discussions with IAMGOLD Corporation personnel;
|
| |
|
|
11)
|
I have not received, nor do I expect to receive, any interest, directly or indirectly, in the Pitangui Gold Project or securities of IAMGOLD Corporation; and
|
| |
|
|
12)
|
That, as of the date of this certificate, to the best of my knowledge, information and belief, this technical report contains all scientific and technical information that is required to be disclosed to make the technical report not misleading.
|
| |
|
|
Toronto, Ontario
January 27, 2020
|
["Original signed and sealed"]
Glen Cole, PGeo (APGO#1416), PrSciNat. (Reg#400070/02)
Principal Consultant (Resource Geology)
|
CERTIFICATE OF QUALIFIED PERSON
To Accompany the report entitled: Independent Technical Report for the São Sebastião Gold Deposit, Pitangui Gold Project, Brazil, January 27, 2020
I, Aleksandr Mitrofanov, do hereby certify that:
|
1)
|
I am a Senior Consultant (Resource Geology) with the firm of SRK Consulting (Canada) Inc. (SRK) with an office at Suite 1500, 155 University Avenue, Toronto, Ontario, Canada;
|
| |
|
|
2)
|
I am a graduate of Moscow State University, where in 2013 I obtained a doctorate in geology, in 2010 I obtained a M.Sc. and in 2008, a B.Sc. I have practiced my profession continuously since 2009. I have experience in exploration projects, geological modelling and mineral resource estimation. Since joining SRK Consulting in 2013, my responsibilities have included geological and structural modelling, preparation of geological chapters on mineral resources for 43-101 and JORC-code reports: scoping study, pre-feasibility study, feasibility study and all other geological activities;
|
| |
|
|
3)
|
I am a professional Geologist registered with the Association of Professional Geoscientists of Ontario (APGO#2824);
|
| |
|
|
4)
|
I have not personally inspected the subject project;
|
| |
|
|
5)
|
I have read the definition of Qualified Person set out in National Instrument 43-101 and certify that by virtue of my education, affiliation to a professional association, and past relevant work experience, I fulfill the requirements to be a Qualified Person for the purposes of National Instrument 43-101 and this technical report has been prepared in compliance with National Instrument 43-101 and Form 43-101F1;
|
| |
|
|
6)
|
I, as a Qualified Person, I am independent of the issuer as defined in Section 1.5 of National Instrument 43-101;
|
| |
|
|
7)
|
I am the co-author of this report and am responsible for Section 13 of the report] and accept professional responsibility for those sections of this technical report;
|
| |
|
|
8)
|
I have had no prior involvement with the subject property;
|
| |
|
|
9)
|
I have read National Instrument 43-101 and confirm that this technical report has been prepared in compliance therewith;
|
| |
|
|
10)
|
SRK Consulting (Canada) Inc. was retained by IAMGOLD Corporation to prepare a technical report for São Sebastião gold deposit, Pitangui Gold Project. In conducting our audit, a gap analysis of project technical data was completed using CIM Estimation of Mineral Resources and Mineral Reserves Best Practice Guidelines and Canadian Securities Administrators National Instrument 43-101 guidelines. The preceding report is based on a site visit, a review of project files and discussions with IAMGOLD Corporation personnel;
|
| |
|
|
11)
|
I have not received, nor do I expect to receive, any interest, directly or indirectly, in the Pitangui Gold Project or securities of IAMGOLD Corporation; and
|
| |
|
|
12)
|
That, as of the date of this certificate, to the best of my knowledge, information and belief, this technical report contains all scientific and technical information that is required to be disclosed to make the technical report not misleading.
|
| |
|
|
Toronto, Ontario
January 27, 2020
|
["Original signed and sealed"]
Aleksandr Mitrofanov, PhD, PGeo (APGO#2824)
Senior Consultant (Resource Geology)
|
This regulatory filing also includes additional resources:
exhibit99-1.pdf
Iamgold (NYSE:IAG)
Historical Stock Chart
From Aug 2024 to Sep 2024

Iamgold (NYSE:IAG)
Historical Stock Chart
From Sep 2023 to Sep 2024
