Delta Air Lines Down Over 24%, on Pace for Record Percent Decrease -- Data Talk
March 18 2020 - 12:06PM
Dow Jones News
Delta Air Lines, Inc. (DAL) is currently at $24.03, down $7.71
or 24.29%
-- Would be lowest close since Oct. 15, 2013, when it closed at
$24.02
-- Would be largest percent decrease on record (Based on
available data back to April 26, 2007)
-- On Tuesday, Moody's placed all ratings for Delta Air Lines on
review for downgrade
-- Reeling from the coronavirus crisis, U.S. airlines are
seeking over $50 billion in financial assistance from the
government, more than three times the size of the industry's
bailout after the Sept. 11, 2001, attacks
-- Worst three day stretch on record (Based on available data
back to April 26, 2007)
-- Down 47.91% month-to-date
-- Down 58.91% year-to-date
-- Down 61.95% from its all-time closing high of $63.16 on July
24, 2019
-- Down 51.81% from 52 weeks ago (March 20, 2019), when it
closed at $49.87
-- Down 61.95% from its 52 week closing high of $63.16 on July
24, 2019
-- Would be a new 52 week closing low
-- Traded as low as $24.01; lowest intraday level since Oct. 16,
2013, when it hit $23.88
-- Down 24.35% at today's intraday low; largest intraday percent
decrease since Jan. 27, 2009, when it fell as much as 24.47%
-- Eighth worst performer in the S&P 500 today
-- 10th most active stock in the S&P 500 today
All data as of 11:29:50 AM
Source: Dow Jones Market Data, FactSet
(END) Dow Jones Newswires
March 18, 2020 11:51 ET (15:51 GMT)
Copyright (c) 2020 Dow Jones & Company, Inc.
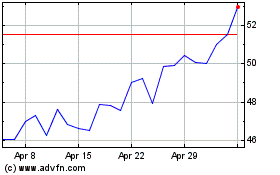
Delta Air Lines (NYSE:DAL)
Historical Stock Chart
From Apr 2024 to May 2024

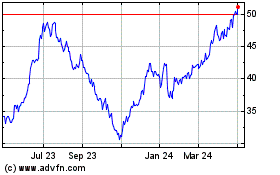
Delta Air Lines (NYSE:DAL)
Historical Stock Chart
From May 2023 to May 2024
