CHESAPEAKE UTILITIES CORP false 0000019745 0000019745 2023-08-04 2023-08-04
UNITED STATES
SECURITIES AND EXCHANGE COMMISSION
WASHINGTON, D.C. 20549
FORM 8-K
CURRENT REPORT
Pursuant to Section 13 or 15(d)
of the Securities Exchange Act of 1934
Date of Report (Date of Earliest Event Reported): August 4, 2023
Chesapeake Utilities Corporation
(Exact name of registrant as specified in its charter)
|
|
|
|
|
| Delaware |
|
001-11590 |
|
51-0064146 |
(State or other jurisdiction
of incorporation) |
|
(Commission
File Number) |
|
(I.R.S. Employer
Identification No.) |
|
|
|
| 500 Energy Lane, Dover, Delaware |
|
19901 |
| (Address of principal executive offices) |
|
(Zip Code) |
Registrant’s telephone number, including area code: 302. 734.6799
Not Applicable
Former name or former address, if changed since last report
Check the appropriate box below if the Form 8-K filing is intended to simultaneously satisfy the filing obligation of the registrant under any of the following provisions (see General Instruction A.2. below):
| ☐ |
Written communications pursuant to Rule 425 under the Securities Act (17 CFR 230.425) |
| ☐ |
Soliciting material pursuant to Rule 14a-12 under the Exchange Act (17 CFR 240.14a-12) |
| ☐ |
Pre-commencement communications pursuant to Rule 14d-2(b) under the Exchange Act (17 CFR 240.14d-2(b)) |
| ☐ |
Pre-commencement communications pursuant to Rule 13e-4(c) under the Exchange Act (17 CFR 240.13e-4(c)) |
Securities registered pursuant to Section 12(b) of the Act:
|
|
|
|
|
| Title of each class |
|
Trading
Symbol(s) |
|
Name of each exchange
on which registered |
| Common Stock - par value per share $0.4867 |
|
CPK |
|
New York Stock Exchange |
Indicate by check mark whether the registrant is an emerging growth company as defined in Rule 405 of the Securities Act of 1933 (§230.405 of this chapter) or Rule 12b-2 of the Securities Exchange Act of 1934 (§240.12b-2 of this chapter).
Emerging growth company ☐
If an emerging growth company, indicate by check mark if the registrant has elected not to use the extended transition period for complying with any new or revised financial accounting standards provided pursuant to Section 13(a) of the Exchange Act. ☐
| Item 7.01 |
Regulation FD Disclosure. |
On August 4, 2023, Chesapeake Utilities Corporation (the “Company”) posted a presentation that will be used during its conference call to discuss the Company’s financial results for the second quarter ended June 30, 2023 on its website (www.chpk.com) under the “Investors” section. This presentation is being furnished as Exhibit 99.1 to this Current Report on Form 8-K (this “Report”).
The information contained in this Item 7.01 and in Exhibit 99.1 attached to this Report is being furnished and shall not be deemed filed for purposes of Section 18 of the Securities Exchange Act of 1934, as amended, or otherwise subject to the liabilities of such section. Furthermore, such information shall not be deemed to be incorporated by reference into any registration statement or other document filed pursuant to the Securities Act of 1933, as amended.
| Item 9.01 |
Financial Statements and Exhibits. |
(d) Exhibits.
SIGNATURES
Pursuant to the requirements of the Securities Exchange Act of 1934, the registrant has duly caused this report to be signed on its behalf by the undersigned hereunto duly authorized.
|
|
|
|
|
|
|
|
|
|
|
Chesapeake Utilities Corporation |
|
|
|
|
| August 4, 2023 |
|
|
|
By: |
|
/s/ Beth W. Cooper |
|
|
|
|
Name: |
|
Beth W. Cooper |
|
|
|
|
Title: |
|
Executive Vice President and Chief Financial Officer |

Exhibit 99.1 Second Quarter 2023 CHE S AP EAKE Earnings Conference Call
UT IL ITIES CORP ORAT ION August 4, 2023 1

Today’s Presenters Jeff Householder Chairman of the Board,
President, and Chief Executive Officer Beth Cooper Executive Vice President, Chief Financial Officer, Treasurer, and Assistant Corporate Secretary Jim Moriarty Executive Vice President, General Counsel, Corporate Secretary, and Chief Policy and Risk
Officer 2

Forward Looking Statements and Other Statements Safe Harbor Statement
Some of the Statements in this document concerning future Company performance will be forward-looking within the meanings of the securities laws. Actual results may materially differ from those discussed in these forward-looking statements. You
should refer to the additional information contained in Chesapeake Utilities’ Annual Report on Form 10-K for the year ended December 31, 2022 filed with the SEC and other subsequent SEC filings concerning factors that could cause those results
to be different than contemplated in today’s discussion. Non-GAAP Financial Information This presentation includes non-GAAP financial measures including Adjusted Gross Margin. A non-GAAP financial measure is generally defined as a numerical
measure of a company's historical or future performance that includes or excludes amounts, or that is subject to adjustments, so as to be different from the most directly comparable measure calculated or presented in accordance with GAAP. Our
management believes certain non-GAAP financial measures, when considered together with GAAP financial measures, provide information that is useful to investors in understanding period-over- period operating results separate and apart from items that
may, or could, have a disproportionately positive or negative impact on results in any particular period. A reconciliation of GAAP to non-GAAP financial measures is included in the appendix of this presentation. The Company calculates Adjusted Gross
Margin by deducting the purchased cost of natural gas, propane and electricity and the cost of labor spent on direct revenue-producing activities from operating revenues. The costs included in Adjusted Gross Margin exclude depreciation and
amortization and certain costs presented in operations and maintenance expenses in accordance with regulatory requirements. Adjusted Gross Margin should not be considered an alternative to Gross Margin under US GAAP which is defined as the excess of
sales over cost of goods sold. The Company believes that Adjusted Gross Margin, although a non-GAAP measure, is useful and meaningful to investors as a basis for making investment decisions. It provides investors with information that demonstrates
the profitability achieved by the Company under the Company's allowed rates for regulated energy operations and under the Company's competitive pricing structures for unregulated energy operations. The Company's management uses Adjusted Gross Margin
as one of the financial measures in assessing a business unit’s performance. Other companies may calculate Adjusted Gross Margin in a different manner. 3

Financial Highlights • Diluted EPS of $0.90 and $2.94,
respectively, for the quarter and year- to-date periods ended June 30, 2023 • Significantly warmer weather impacted EPS by approximately $0.09 and $0.38, respectively • Exclude a one-time gain of $0.08 per share related to real estate
rationalization from the second quarter of 2022 • $7.4 million in adjusted gross margin growth driven by regulatory initiatives as well as continued growth and new expansion projects • Deployed approximately $50 million on new capital
investments, • On track for current year guidance of $200 to $230 million • Announced customer information system platform upgrade to enhance service to more than 220,000 natural gas customers in DE, MD and FL • Significant
advancements in various growth and regulatory initiatives • Wildlight, Lake Wales, and Newberry expansions • Florida GUARD program approved in August 2023 4
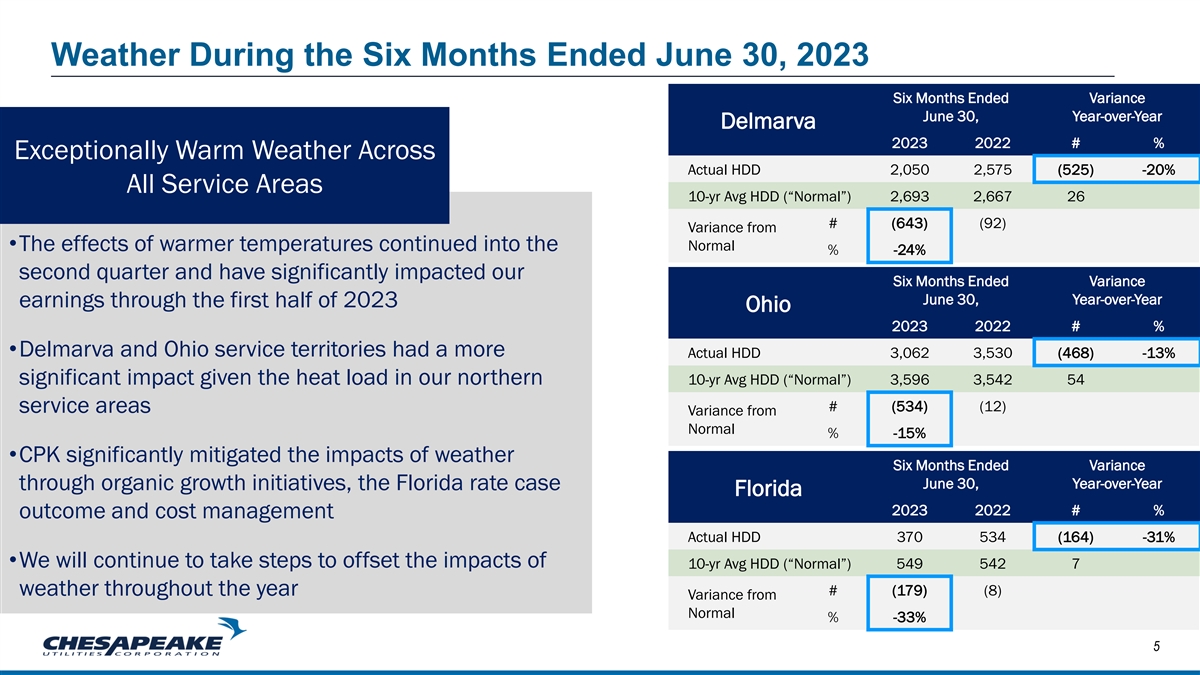
Weather During the Six Months Ended June 30, 2023 Six Months Ended
Variance June 30, Year-over-Year Delmarva 2023 2022 # % Exceptionally Warm Weather Across Actual HDD 2,050 2,575 (525) -20% All Service Areas 10-yr Avg HDD (“Normal”) 2,693 2,667 26 # (643) (92) Variance from •The effects of warmer
temperatures continued into the Normal % -24% second quarter and have significantly impacted our Six Months Ended Variance June 30, Year-over-Year earnings through the first half of 2023 Ohio 2023 2022 # % •Delmarva and Ohio service
territories had a more Actual HDD 3,062 3,530 (468) -13% significant impact given the heat load in our northern 10-yr Avg HDD (“Normal”) 3,596 3,542 54 # (534) (12) service areas Variance from Normal % -15% •CPK significantly
mitigated the impacts of weather Six Months Ended Variance June 30, Year-over-Year through organic growth initiatives, the Florida rate case Florida 2023 2022 # % outcome and cost management Actual HDD 370 534 (164) -31% •We will continue to
take steps to offset the impacts of 10-yr Avg HDD (“Normal”) 549 542 7 weather throughout the year # (179) (8) Variance from Normal % -33% 5
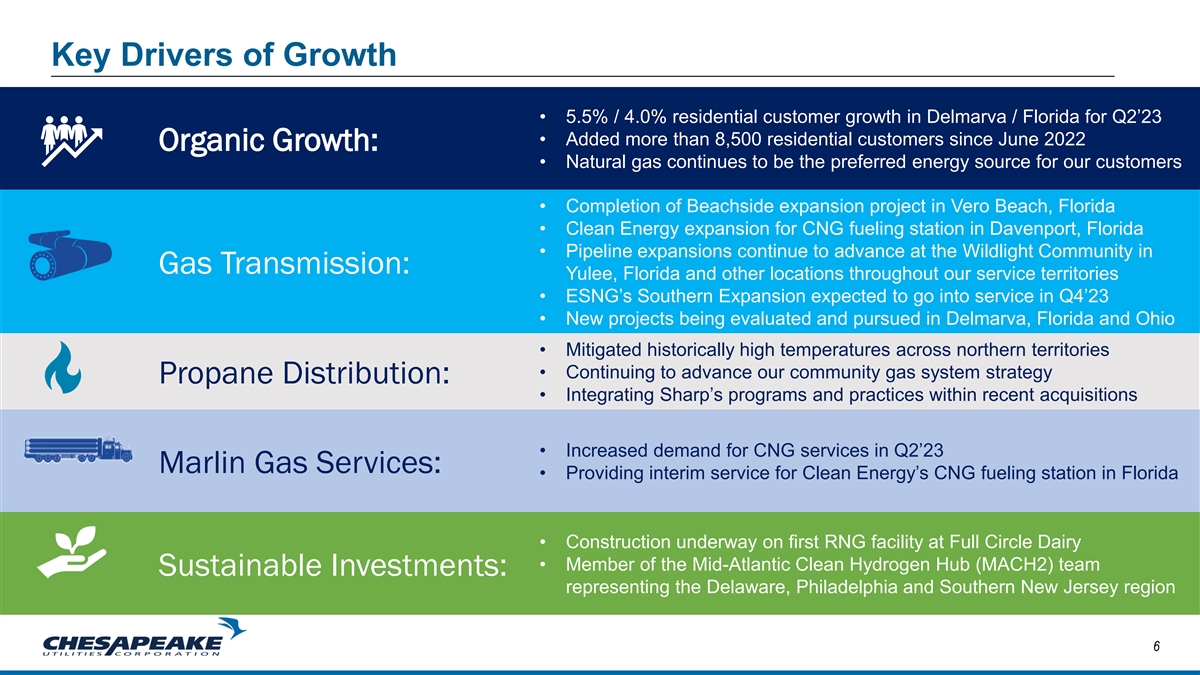
Key Drivers of Growth • 5.5% / 4.0% residential customer growth in
Delmarva / Florida for Q2’23 • Added more than 8,500 residential customers since June 2022 Organic Growth: • Natural gas continues to be the preferred energy source for our customers • Completion of Beachside expansion
project in Vero Beach, Florida • Clean Energy expansion for CNG fueling station in Davenport, Florida • Pipeline expansions continue to advance at the Wildlight Community in Gas Transmission: Yulee, Florida and other locations throughout
our service territories • ESNG’s Southern Expansion expected to go into service in Q4’23 • New projects being evaluated and pursued in Delmarva, Florida and Ohio • Mitigated historically high temperatures across
northern territories • Continuing to advance our community gas system strategy Propane Distribution: • Integrating Sharp’s programs and practices within recent acquisitions • Increased demand for CNG services in Q2’23
Marlin Gas Services: • Providing interim service for Clean Energy’s CNG fueling station in Florida • Construction underway on first RNG facility at Full Circle Dairy • Member of the Mid-Atlantic Clean Hydrogen Hub (MACH2)
team Sustainable Investments: representing the Delaware, Philadelphia and Southern New Jersey region 6

Growing Service Areas – Delmarva and Florida Well positioned to
service concentrated growth areas: Middletown, Delaware • Increased customer base by 71% over last 10 years • Ranked in top five towns in the nation by Fortune.com • Nine schools built in past 10 years to support 30% of population
aged 19 or younger • Future home of major Pharmaceutical facility Wildlight (Yulee), Florida • Multi-phase project with ~22 thousand residential units at full buildout • Additional load expected due to new supporting infrastructure
• High-end growth targets provide potential for ~$100 million in total capital and ~$20 million in annual margin 7

Gas Transmission Expansions to Serve Growing Demand Eastern Shore -
Southern Expansion: increasing capacity in Delaware Delaware to meet growth • Natural gas driven compressor skid at Bridgeville compressor station • Expected to go into service in the fourth quarter of 2023 and provide 7,300 Dts of
incremental firm transportation capacity • Will generate adjusted gross margin of $2.3 million in 2024 and thereafter Peninsula Pipeline - Wildlight Expansion: multi-phase project in Yulee, Florida • Multiple pipeline extensions, a gas
injection interconnect, and associated facilities • Various phases commenced in Q1’23 and continue through 2025 • Expected adjusted gross margin of $2 million in 2024 and beyond Peninsula Pipeline - Newberry Expansion: pipeline
extension project approved by Florida PSC in July 2023 • Support the development of a natural gas distribution system that will bring gas service to the City of Newberry • Related transportation service agreement provides for 8,000 Dt/d
of firm service 8
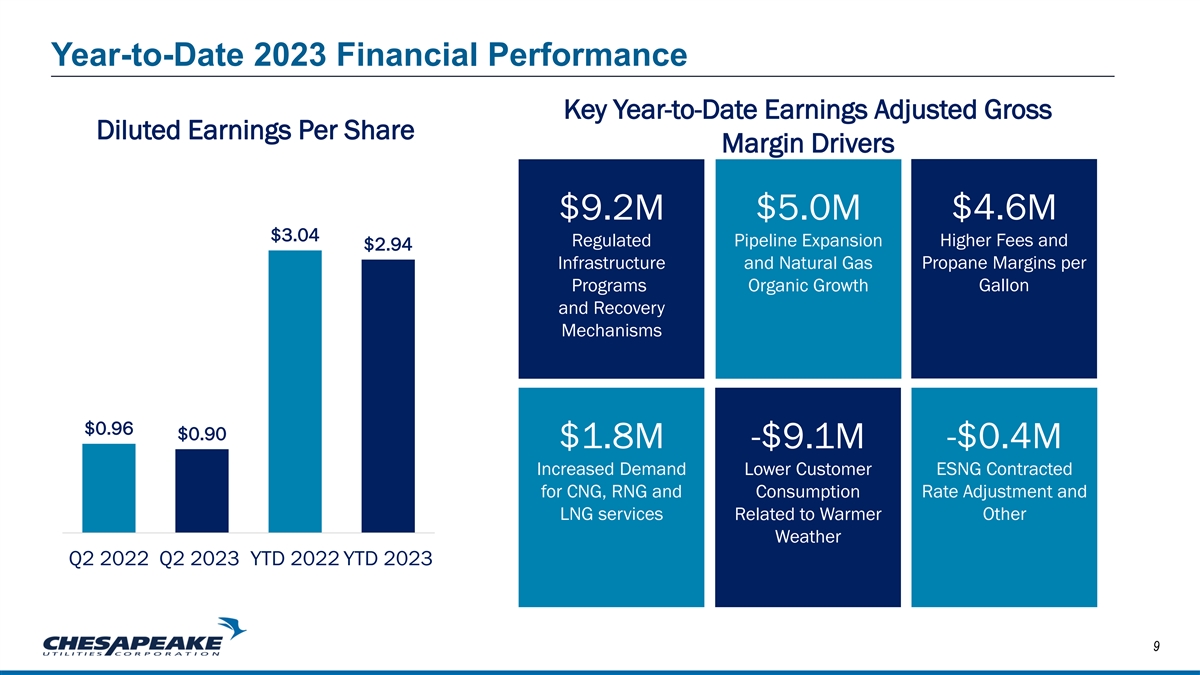
Year-to-Date 2023 Financial Performance Key Year-to-Date Earnings
Adjusted Gross Diluted Earnings Per Share Margin Drivers $4.6M $9.2M $5.0M $3.04 Regulated Pipeline Expansion Higher Fees and $2.94 Propane Margins per Infrastructure and Natural Gas Programs Organic Growth Gallon and Recovery Mechanisms $0.96 $0.90
$1.8M -$9.1M -$0.4M Increased Demand Lower Customer ESNG Contracted for CNG, RNG and Consumption Rate Adjustment and LNG services Related to Warmer Other Weather Q2 2022 Q2 2023 YTD 2022 YTD 2023 9

Second Quarter and Year-to-Date 2023 Financial Summary Solid
performance, despite significantly warmer weather and continued inflationary environment Consolidated Second Quarter Change Year to Date Change (in thousands except per share data) 2023 2022 $ % 2023 2022 $ % 1 Total Adjusted Gross Margin $ 99,800 $
92,354 $ 7,446 8.1% $ 229,340 $ 218,053 $ 11,287 5.2% Operating Income 28,346 26,469 1,877 7.1% 83,261 81,334 1,927 2.4% Other Income, Net 831 2,584 (1,753) -67.8% 1,107 3,498 (2,391) -68.4% Interest Charges 6,964 5,825 1,139 19.6% 14,196 11,164
3,032 27.2% Pre-tax Income 22,213 23,228 (1,015) -4.4% 70,172 73,668 (3,496) -4.7% Income Taxes 6,080 6,177 (97) -1.6% 17,695 19,683 (1,988) -10.1% Net Income $ 16,133 $ 17,051 $ (918) -5.4% $ 5 2,477 $ 53,985 $ ( 1,508) -2.8% Diluted EPS $ 0.90 $
0.96 $ (0.06) -6.2% $ 2.94 $ 3.04 $ (0.10) -3.3% 1 See appendix for GAAP to non-GAAP reconciliation of adjusted gross margin 10
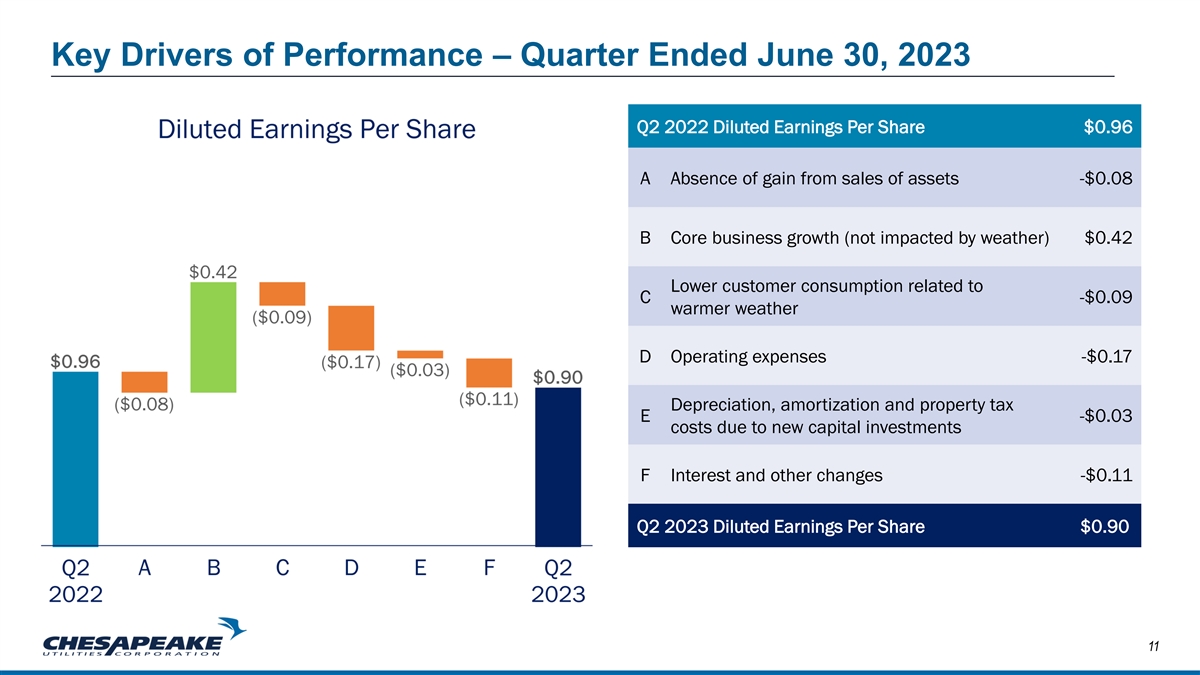
Key Drivers of Performance – Quarter Ended June 30, 2023 Q2 2022
Diluted Earnings Per Share $0.96 A Absence of gain from sales of assets -$0.08 B Core business growth (not impacted by weather) $0.42 Lower customer consumption related to C -$0.09 warmer weather D Operating expenses -$0.17 Depreciation,
amortization and property tax E -$0.03 costs due to new capital investments F Interest and other changes -$0.11 Q2 2023 Diluted Earnings Per Share $0.90 11

Key Drivers of Performance – Year-to-Date June 30, 2023 YTD 2022
Diluted Earnings Per Share $3.04 A Absence of gain from sales of assets -$0.08 B Reduction in state tax rate $0.07 Lower customer consumption related to C -$0.38 warmer weather D Core business growth (not impacted by weather) $0.84 E Operating
expenses -$0.27 Depreciation, amortization and property tax F -$0.07 costs due to new capital investments G Interest and other changes -$0.21 YTD 2023 Diluted Earnings Per Share $2.94 12

Regulated Energy Segment – Financial Summary Solid growth,
offsetting warmer weather Second Quarter Change Year-to-Date Change (in thousands) 2023 2022 $ % 2023 2022 $ % 1 Adjusted Gross Margin $ 77,255 $ 70,620 $ 6,635 9.4% $ 164,237 $ 153,068 $ 11,169 7.3% Dep., amort. & property taxes 18,854 18,380
474 2.6% 37,524 36,631 893 2.4% Other operating expenses 29,110 26,399 2,711 10.3% 59,797 55,898 3,899 7.0% Operating income $ 29,291 $ 25,841 $ 3,450 13.4% $ 66,916 $ 60,539 $ 6,377 10.5% Year-to-Date Highlights •Operating income up 10.5%
driven by: • Permanent rates associated with Florida natural gas base rate proceeding • Organic growth in natural gas distribution operations, including propane CGS conversions • Pipeline expansions by Eastern Shore Natural Gas,
Florida Natural Gas, Peninsula Pipeline and Aspire Energy Express • Incremental contributions from regulated infrastructure programs • Partially offset by reduced consumption attributable to warmer weather 1 See appendix for GAAP to
non-GAAP reconciliation of adjusted gross margin 13

Unregulated Energy Segment – Financial Summary Warmer weather
partially offset by continued demand for CNG/RNG/LNG services Second Quarter Change Year-to-Date Change (in thousands) 2023 2022 $ % 2023 2022 $ % 1 Adjusted Gross Margin $ 22,635 $ 2 1,762 $ 873 4.0% $ 65,229 $ 65,046 $ 183 0.3% Dep., amort. &
property taxes 4,777 4 ,466 311 7.0% 9 ,598 8,762 836 9.5% Other operating expenses 18,851 1 6,736 2,115 12.6% 39,379 35,671 3,708 10.4% Operating income (loss) $ (993) $ 560 $ ( 1,553) -277.3% $ 1 6,252 $ 20,613 $ (4,361) -21.2% Year-to-Date
Highlights •Operating income down 21.0% due to: • Reduced customer consumption impacted adjusted gross margin by $5 million in Delmarva and Ohio regions due to warmer weather • Partially offset by increased propane margins and
service fees • Decreased consumption from the conversion of propane customers to our natural gas system • Increased demand for CNG/RNG/LNG services 1 See appendix for GAAP to non-GAAP reconciliation of adjusted gross margin 14

Capital Structure Overview – Strong Balance Sheet to Support
Growth 6/30/2023 12/31/2022 Long-Term Debt Stockholders' equity $ 864,228 $ 832,801 Long-term debt, net of current maturities 645,742 578,388 • Avg. Interest Rate: 3.89% Total permanent capitalization $ 1,509,970 $ 1,411,189 • $80M:
5.43% issued in March 2023 Current portion of long-term debt 19,994 21,483 Short-term debt 95,807 202,157 Short-Term Debt Total capitalization and short-term financing $ 1,625,771 $ 1,634,829 • $400M facility • 1 year facility: $200M,
SOFR + 0.70% Equity to Permanent Capital 57.2% 59.0% • 5 year facility: $200M, SOFR + 0.95% Equity to Total Capitalization 53.2% 50.9% • Maintaining a $50M interest rate swap at New Long-Term Debt Issuance $ 80,000 $ 50,000 3.98% through
September 2025 Net New Equity Issuance $ 821 $ 8,916 • Focused on 1 year facility which is up for renewal in August 2023 Stockholders’ Equity increased $31.4 million since the end of 2022 • $100M aggregate green sublimit to
primarily driven by: support ongoing initiatives • Strong Net Income performance of $52.5 million • Continued Dividend payments of $20.2 million • 2022 - $9.4M Planet Found acquisition • 2023 – Full Circle Dairy
15
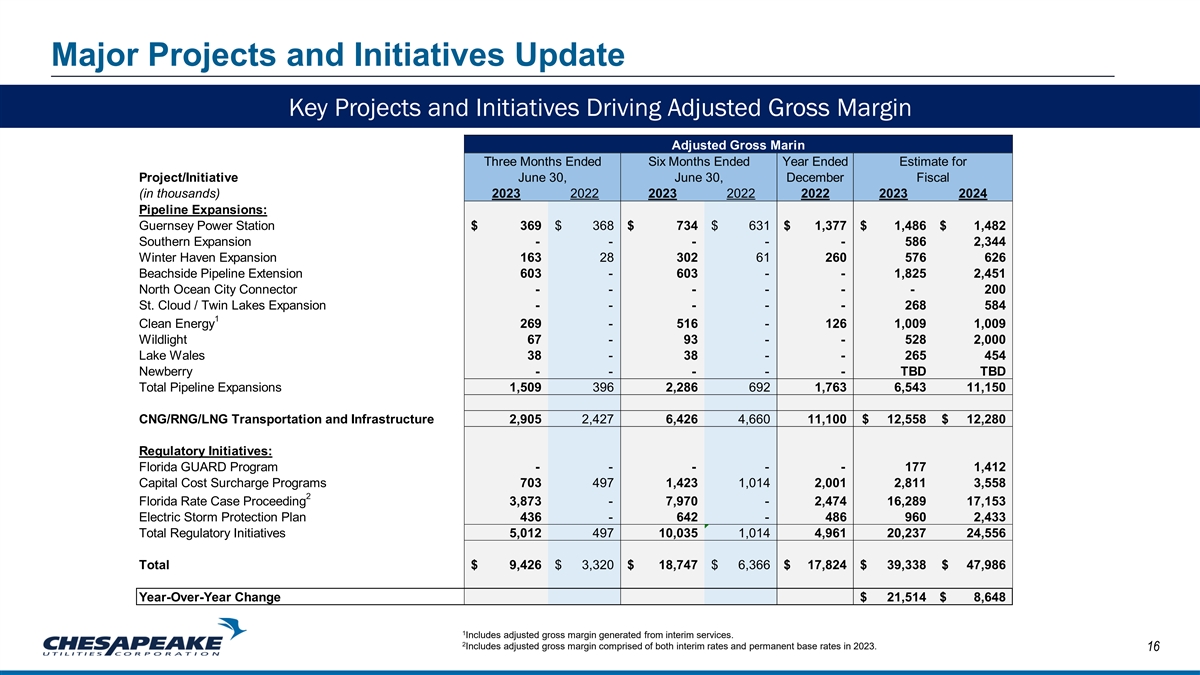
Major Projects and Initiatives Update Key Projects and Initiatives
Driving Adjusted Gross Margin Adjusted Gross Marin Three Months Ended Six Months Ended Year Ended Estimate for Project/Initiative June 30, June 30, December Fiscal (in thousands) 2023 2022 2023 2022 2022 2023 2024 Pipeline Expansions: Guernsey Power
Station $ 369 $ 368 $ 734 $ 631 $ 1,377 $ 1,486 $ 1,482 Southern Expansion - - - - - 586 2,344 Winter Haven Expansion 163 28 302 61 260 576 626 Beachside Pipeline Extension 603 - 603 - - 1,825 2,451 North Ocean City Connector - - - - - - 200 St.
Cloud / Twin Lakes Expansion - - - - - 268 584 1 Clean Energy 269 - 516 - 126 1,009 1,009 Wildlight 67 - 93 - - 528 2,000 Lake Wales 38 - 38 - - 265 454 Newberry - - - - - TBD TBD Total Pipeline Expansions 1,509 396 2,286 692 1,763 6,543 11,150
CNG/RNG/LNG Transportation and Infrastructure 2,905 2,427 6,426 4,660 11,100 $ 1 2,558 $ 12,280 Regulatory Initiatives: Florida GUARD Program - - - - - 177 1,412 Capital Cost Surcharge Programs 703 497 1,423 1,014 2,001 2,811 3,558 2 Florida Rate
Case Proceeding 3,873 - 7,970 - 2,474 16,289 17,153 Electric Storm Protection Plan 436 - 642 - 486 960 2,433 Total Regulatory Initiatives 5,012 497 10,035 1,014 4,961 20,237 24,556 Total $ 9,426 $ 3,320 $ 18,747 $ 6,366 $ 17,824 $ 39,338 $ 47,986
Year-Over-Year Change $ 21,514 $ 8,648 1 Includes adjusted gross margin generated from interim services. 2 Includes adjusted gross margin comprised of both interim rates and permanent base rates in 2023. 16

Key Expansion Projects Significant activity in 2023 Fully Annual
Adjusted Gross Margin Project Capital Investment In Service Estimate Guernsey Power Station $6.4 million Q4 2021 $1.5 million Winter Haven Expansion $3.5 million Q3 2022 $0.6 million North Ocean City Connector* $6.3 million Q2 2023 $0.2 million
Beachside Pipeline Extension $10.5 million Q2 2023 $2.5 million Lake Wales $2.2 million Q2 2023 $0.5 million St. Cloud / Twin Lakes Expansion $3.5 million Q3 2023 $0.6 million Clean Energy Expansion $5.5 million Q3 2023 $1.0 million Southern
Expansion $14.0 million Q4 2023 $2.3 million Wildlight Expansion $13.4 million 2025 $2.0 million Newberry Expansion $18.1 million 2025 TBD Total investments of $83.4 million generate incremental adjusted gross margin of $11.2 million once fully in
service in 2025 *Adjusted gross margin expected to begin generating in Q3 2024, following MD rate case 17

Regulatory Initiatives - Rate Case Activity •Florida Public
Utilities’ natural gas base rate case was approved in February, with an effective date beginning on March 1, 2023 • Included a depreciation study and the consolidation of four natural gas distribution entities in Florida • Provides
incremental rate base of $17.2 million and allowed return on equity of 10.25% • Equity percentage of 55% March 1, 2023 Sept 2022 May 2022 Permanent Rates Interim Rates Filed $7.7M Annualized $17.2M Annualized •Maryland rate case •
Planning combined rate case and depreciation studies for Maryland Division, Sandpiper Energy, and Elkton Gas • Filing date anticipated by January 31, 2024 18

Regulatory Initiatives – Infrastructure Programs Florida GUARD
Program • In February 2023, Florida Public Utilities filed for petition of the GUARD program (Gas Utility Access and Replacement Directive) • 10-year program to enhance safety, reliability and accessibility of portions of FPU’s
natural gas distribution system by: • Relocating mains and service lines from rear easements and other difficult access areas to front of street • Replacing problematic distribution mains, service lines and maintenance and repair
equipment • Approved by the Florida Public Service Commission in August 2023, and includes $205 million of capital expenditures projected to be spent over a 10-year period • Expected adjusted gross margin impact of less than $0.1 million
in 2023 and $1.4 million in 2024 Storm Protection Plan • FPU’s electric utility Storm Protection Plan and Storm Protection Plan Cost Recovery mechanisms were approved in the fourth quarter of 2022, with modifications by the Florida PSC
• Annual adjusted gross margin of $1.0 million in 2023 and $2.4 million in 2024, with continued investment going forward Eastern Shore Capital Cost Surcharge Programs • Eastern Shore recovery mechanism for capital costs associated with
mandated highway and railroad relocation projects, along with PHMSA required safety upgrades that required the replacement of existing Eastern Shore facilities • Expect the program will generate adjusted gross margin of approximately $2.8
million in 2023 and $3.6 million in 2024 19

Chesapeake Utilities' Company Culture 2022 Sustainability Report 2022
Top Safety Performer • Recognized by the American Gas Association (AGA) • FPU and ESNG earned AGA Safety Achievement Award, demonstrating commitment to employee and vehicular safety • Aspire Energy named an industry leader in
accident prevention and for achieving a lower than industry standard rate related to the impact of workplace injuries 20

Reaffirmation of Guidance Diluted Earnings Per Share from Continuing
Operations Short-term and Long-term Capital Guidance through 2025 Guidance $6.35 $900 million $6.15 to $1.1 billion $5.04 $4.73 $4.21 $3.72 $3.47 $461 million $200 million to through Q2 2023 $230 million in 2023 ~$92 million YTD Forecast Target 2023
2021-2025 Strategic capital investments continue to drive earnings growth 21 CPK Guidance – Low Range CPK Guidance – High Range

Historical Earnings and Dividend Performance Long history of industry
leading earnings and dividend growth Diluted Earnings Per Share from Annualized Dividends Continuing Operations Per Share $2.36 $2.14 $5.04 $4.73 $1.92 $1.76 $4.21 $1.62 $3.72 $3.47 2022 2023 +6.6% +10.3% Increase Increase 2018 2019 2020 2021 2022
2019 2020 2021 2022 2023 22

Investment Proposition – Committed to Superior Performance Track
Record Energized Team Sustainability Strategy Strong Foundation for Growth GROW Financial Discipline Platforms for Growth Responsibly grow the Company to achieve long-term, sustainable success for our stakeholders. Financial Objectives in Support of
Increased Shareholder Value: PROTECT ✓ Investing $900 million to $1.1 billion through 2025 with increasing Give precedence to the protection of renewable energy investments our people, communities, assets and the environment. ✓
Targeting 2025 EPS $6.15 to $6.35 ✓ Targeting 11.0% or higher consolidated ROE TRANSFORM ✓ Pursuing dividend growth supported by earnings growth, with a ramp towards a dividend payout ratio of ~45% Drive next-generation technological
and organizational improvements. ✓ Maintaining a strong balance sheet 23

CHE S AP EAKE UT IL ITIES Appendix CORP ORAT ION 24

GAAP to Non-GAAP Reconciliation – Consolidated Results Second
Quarter Change Year-to-Date Change (in thousands) 2023 2022 $ % 2023 2022 $ % Operating Revenues $ 135,593 $ 139,470 $ ( 3,877) -2.8% $ 3 53,722 $3 62,350 $ (8,628) -2.4% Cost of Sales: Natural gas, propane and electric costs ( 35,793) ( 47,116) 1
1,323 -24.0% (124,382) (144,297) 19,915 -13.8% Depreciation & amortization (17,303) ( 17,216) (87) 0.5% (34,486) (34,193) (293) 0.9% 1 Operations &maintenance expense (16,762) ( 15,544) (1,218) 7.8% (34,520) (31,185) ( 3,335) 10.7% Gross
Margin (GAAP) 65,735 5 9,594 6,141 10.3% 1 60,334 1 52,675 7,659 5.0% 1 Operations &maintenance expense 1 6,762 1 5,544 1 ,218 7.8% 34,520 31,185 3,335 10.7% Depreciation & amortization 17,303 1 7,216 87 0.5% 3 4,486 34,193 293 0.9% Adjusted
Gross Margin (non-GAAP) $ 9 9,800 $ 92,354 $ 7,446 8.1% $ 2 29,340 $ 218,053 $ 11,287 5.2% 1 Operations & maintenance expenses within the Consolidated Statements of Income are presented in accordance with regulatory requirements and to provide
comparability within the industry. Operations & maintenance expenses which are deemed to be directly attributable to revenue producing activities have been separately presented above in order to calculate Gross Margin as defined under US GAAP.
See Chesapeake Utilities’ Annual Report on Form 10-K for the year ended December 31, 25 2022 for additional details.

GAAP to Non-GAAP Reconciliation – Regulated Energy Segment Second
Quarter Change Year-to-Date Change (in thousands) 2023 2022 $ % 2023 2022 $ % Operating Revenues $ 1 01,141 $ 9 2,193 $ 8,948 9.7% $ 243,411 $ 220,084 $ 2 3,327 10.6% Cost of Sales: Natural gas, propane and electric costs ( 23,886) (21,573) (2,313)
10.7% (79,174) (67,016) (12,158) 18.1% Depreciation & amortization (13,035) ( 13,140) 105 -0.8% (25,987) (26,225) 238 -0.9% 1 Operations &maintenance expense ( 9,240) (8,324) (916) 11.0% (18,527) (16,485) (2,042) 12.4% Gross Margin (GAAP)
54,980 49,156 5 ,824 11.8% 119,723 1 10,358 9,365 8.5% 1 Operations &maintenance expense 9,240 8,324 916 11.0% 1 8,527 1 6,485 2 ,042 12.4% Depreciation & amortization 13,035 13,140 (105) -0.8% 25,987 26,225 (238) -0.9% Adjusted Gross Margin
(non-GAAP) $ 7 7,255 $ 7 0,620 $ 6 ,635 9.4% $ 1 64,237 $1 53,068 $ 1 1,169 7.3% 1 Operations & maintenance expenses within the Consolidated Statements of Income are presented in accordance with regulatory requirements and to provide
comparability within the industry. Operations & maintenance expenses which are deemed to be directly attributable to revenue producing activities have been separately presented above in order to calculate Gross Margin as defined under US GAAP.
See Chesapeake Utilities’ Annual Report on Form 10-K for the year ended December 31, 26 2022 for additional details.

GAAP to Non-GAAP Reconciliation – Unregulated Energy Segment 1
Operations & maintenance expenses within the Consolidated Statements of Income are presented in accordance with regulatory requirements and to provide comparability within the industry. Operations & maintenance expenses which are deemed to
be directly attributable to revenue producing activities have been separately presented above in order to calculate Gross Margin as defined under US GAAP. See Chesapeake Utilities’ Annual Report on Form 10-K for the year ended December 31, 27
2022 for additional details.

Capital Investment Has Driven Our Earnings Growth Long track record of
prudent capital investments 2013 2022 Last 10 Years: $1.8 Billion 2022 2009 Since FPU Acquisition: $2.1 Billion $283 $228 $199 $196 $195 $192 $169 $154 $141 $200 $108 $240 $98 to $78 $193 $230 $180 $174 $174 $169 $144 $49 $130 $44 $98 $92 $78 $47
$44 $26 Capital investments Acquisitions Hurricane Michael 28 Amounts in chart reflected in millions.

Quarterly Earnings Cadence Year Q1 EPS Q2 EPS Q3 EPS Q4 EPS FY EPS
$2.04 $0.90 2023 2022 $2.08 $0.96 $0.54 $1.46 $5.04 % of FY 41% 19% 11% 29% 2021 $1.96 $0.78 $0.71 $1.28 $4.73 % of FY 41% 16% 15% 27% 2020 $1.77 $0.64 $0.56 $1.24 $4.21 % of FY 42% 15% 13% 29% 2019 $1.75 $0.54 $0.38 $1.04 $3.72* % of FY 47% 15% 10%
28% $1.66 $0.35 $0.37 $1.09 $3.47 2018 % of FY 48% 10% 11% 31% 5yr % Band 41% - 48% 10% - 19% 10% - 15% 27% - 31% Note: Historic EPS presented from continuing operations 29 *The sum of the four quarters does not equal the full year amount due to
rounding and the impact of average share counts
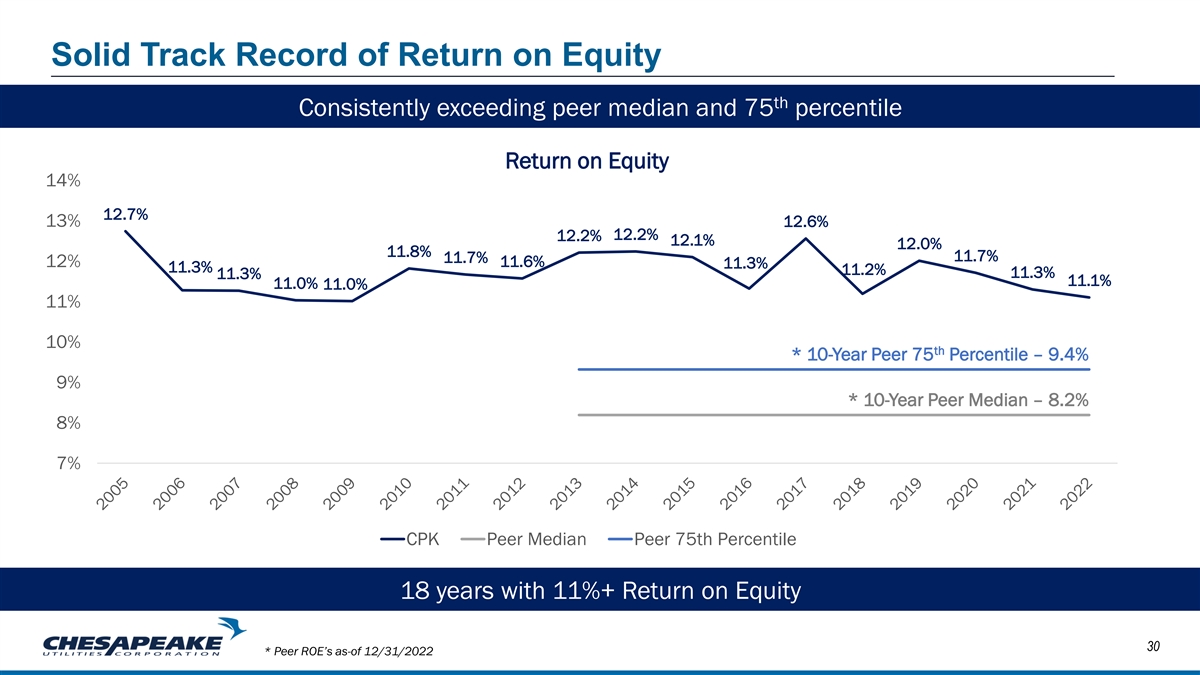
Solid Track Record of Return on Equity th Consistently exceeding peer
median and 75 percentile Return on Equity 14% 12.7% 13% 12.6% 12.2% 12.2% 12.1% 12.0% 11.8% 11.7% 11.7% 12% 11.6% 11.3% 11.3% 11.2% 11.3% 11.3% 11.1% 11.0% 11.0% 11% 10% th * 10-Year Peer 75 Percentile – 9.4% 9% * 10-Year Peer Median –
8.2% 8% 7% CPK Peer Median Peer 75th Percentile 18 years with 11%+ Return on Equity 30 * Peer ROE’s as-of 12/31/2022
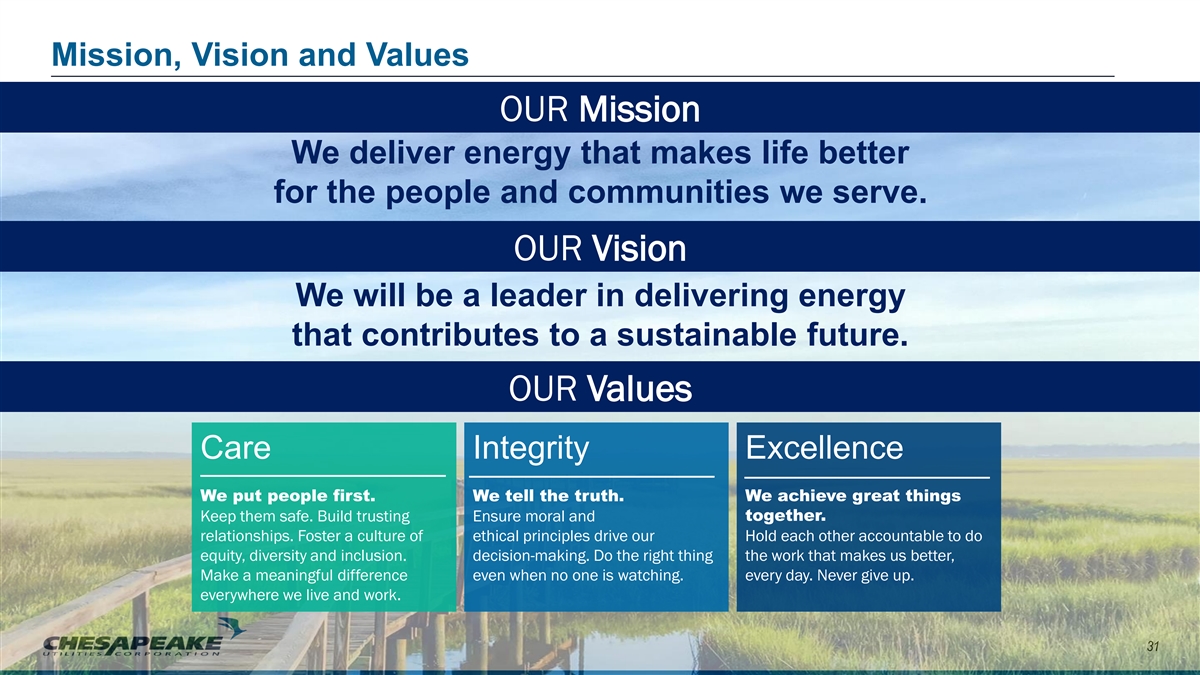
Mission, Vision and Values OUR Mission We deliver energy that makes
life better for the people and communities we serve. OUR Vision We will be a leader in delivering energy that contributes to a sustainable future. OUR Values Care Integrity Excellence We put people first. We tell the truth. We achieve great things
Keep them safe. Build trusting Ensure moral and together. relationships. Foster a culture of ethical principles drive our Hold each other accountable to do equity, diversity and inclusion. decision-making. Do the right thing the work that makes us
better, Make a meaningful difference even when no one is watching. every day. Never give up. everywhere we live and work. 31
v3.23.2
| X |
- DefinitionBoolean flag that is true when the XBRL content amends previously-filed or accepted submission.
| Name: |
dei_AmendmentFlag |
| Namespace Prefix: |
dei_ |
| Data Type: |
xbrli:booleanItemType |
| Balance Type: |
na |
| Period Type: |
duration |
|
| X |
- DefinitionFor the EDGAR submission types of Form 8-K: the date of the report, the date of the earliest event reported; for the EDGAR submission types of Form N-1A: the filing date; for all other submission types: the end of the reporting or transition period. The format of the date is YYYY-MM-DD.
| Name: |
dei_DocumentPeriodEndDate |
| Namespace Prefix: |
dei_ |
| Data Type: |
xbrli:dateItemType |
| Balance Type: |
na |
| Period Type: |
duration |
|
| X |
- DefinitionThe type of document being provided (such as 10-K, 10-Q, 485BPOS, etc). The document type is limited to the same value as the supporting SEC submission type, or the word 'Other'.
| Name: |
dei_DocumentType |
| Namespace Prefix: |
dei_ |
| Data Type: |
dei:submissionTypeItemType |
| Balance Type: |
na |
| Period Type: |
duration |
|
| X |
- DefinitionAddress Line 1 such as Attn, Building Name, Street Name
| Name: |
dei_EntityAddressAddressLine1 |
| Namespace Prefix: |
dei_ |
| Data Type: |
xbrli:normalizedStringItemType |
| Balance Type: |
na |
| Period Type: |
duration |
|
| X |
- Definition
+ References
+ Details
| Name: |
dei_EntityAddressCityOrTown |
| Namespace Prefix: |
dei_ |
| Data Type: |
xbrli:normalizedStringItemType |
| Balance Type: |
na |
| Period Type: |
duration |
|
| X |
- DefinitionCode for the postal or zip code
| Name: |
dei_EntityAddressPostalZipCode |
| Namespace Prefix: |
dei_ |
| Data Type: |
xbrli:normalizedStringItemType |
| Balance Type: |
na |
| Period Type: |
duration |
|
| X |
- DefinitionName of the state or province.
| Name: |
dei_EntityAddressStateOrProvince |
| Namespace Prefix: |
dei_ |
| Data Type: |
dei:stateOrProvinceItemType |
| Balance Type: |
na |
| Period Type: |
duration |
|
| X |
- DefinitionA unique 10-digit SEC-issued value to identify entities that have filed disclosures with the SEC. It is commonly abbreviated as CIK. Reference 1: http://www.xbrl.org/2003/role/presentationRef
-Publisher SEC
-Name Exchange Act
-Number 240
-Section 12
-Subsection b-2
| Name: |
dei_EntityCentralIndexKey |
| Namespace Prefix: |
dei_ |
| Data Type: |
dei:centralIndexKeyItemType |
| Balance Type: |
na |
| Period Type: |
duration |
|
| X |
- DefinitionIndicate if registrant meets the emerging growth company criteria. Reference 1: http://www.xbrl.org/2003/role/presentationRef
-Publisher SEC
-Name Exchange Act
-Number 240
-Section 12
-Subsection b-2
| Name: |
dei_EntityEmergingGrowthCompany |
| Namespace Prefix: |
dei_ |
| Data Type: |
xbrli:booleanItemType |
| Balance Type: |
na |
| Period Type: |
duration |
|
| X |
- DefinitionCommission file number. The field allows up to 17 characters. The prefix may contain 1-3 digits, the sequence number may contain 1-8 digits, the optional suffix may contain 1-4 characters, and the fields are separated with a hyphen.
| Name: |
dei_EntityFileNumber |
| Namespace Prefix: |
dei_ |
| Data Type: |
dei:fileNumberItemType |
| Balance Type: |
na |
| Period Type: |
duration |
|
| X |
- DefinitionTwo-character EDGAR code representing the state or country of incorporation.
| Name: |
dei_EntityIncorporationStateCountryCode |
| Namespace Prefix: |
dei_ |
| Data Type: |
dei:edgarStateCountryItemType |
| Balance Type: |
na |
| Period Type: |
duration |
|
| X |
- DefinitionThe exact name of the entity filing the report as specified in its charter, which is required by forms filed with the SEC. Reference 1: http://www.xbrl.org/2003/role/presentationRef
-Publisher SEC
-Name Exchange Act
-Number 240
-Section 12
-Subsection b-2
| Name: |
dei_EntityRegistrantName |
| Namespace Prefix: |
dei_ |
| Data Type: |
xbrli:normalizedStringItemType |
| Balance Type: |
na |
| Period Type: |
duration |
|
| X |
- DefinitionThe Tax Identification Number (TIN), also known as an Employer Identification Number (EIN), is a unique 9-digit value assigned by the IRS. Reference 1: http://www.xbrl.org/2003/role/presentationRef
-Publisher SEC
-Name Exchange Act
-Number 240
-Section 12
-Subsection b-2
| Name: |
dei_EntityTaxIdentificationNumber |
| Namespace Prefix: |
dei_ |
| Data Type: |
dei:employerIdItemType |
| Balance Type: |
na |
| Period Type: |
duration |
|
| X |
- DefinitionLocal phone number for entity.
| Name: |
dei_LocalPhoneNumber |
| Namespace Prefix: |
dei_ |
| Data Type: |
xbrli:normalizedStringItemType |
| Balance Type: |
na |
| Period Type: |
duration |
|
| X |
- DefinitionBoolean flag that is true when the Form 8-K filing is intended to satisfy the filing obligation of the registrant as pre-commencement communications pursuant to Rule 13e-4(c) under the Exchange Act. Reference 1: http://www.xbrl.org/2003/role/presentationRef
-Publisher SEC
-Name Exchange Act
-Number 240
-Section 13e
-Subsection 4c
| Name: |
dei_PreCommencementIssuerTenderOffer |
| Namespace Prefix: |
dei_ |
| Data Type: |
xbrli:booleanItemType |
| Balance Type: |
na |
| Period Type: |
duration |
|
| X |
- DefinitionBoolean flag that is true when the Form 8-K filing is intended to satisfy the filing obligation of the registrant as pre-commencement communications pursuant to Rule 14d-2(b) under the Exchange Act. Reference 1: http://www.xbrl.org/2003/role/presentationRef
-Publisher SEC
-Name Exchange Act
-Number 240
-Section 14d
-Subsection 2b
| Name: |
dei_PreCommencementTenderOffer |
| Namespace Prefix: |
dei_ |
| Data Type: |
xbrli:booleanItemType |
| Balance Type: |
na |
| Period Type: |
duration |
|
| X |
- DefinitionTitle of a 12(b) registered security. Reference 1: http://www.xbrl.org/2003/role/presentationRef
-Publisher SEC
-Name Exchange Act
-Number 240
-Section 12
-Subsection b
| Name: |
dei_Security12bTitle |
| Namespace Prefix: |
dei_ |
| Data Type: |
dei:securityTitleItemType |
| Balance Type: |
na |
| Period Type: |
duration |
|
| X |
- DefinitionName of the Exchange on which a security is registered. Reference 1: http://www.xbrl.org/2003/role/presentationRef
-Publisher SEC
-Name Exchange Act
-Number 240
-Section 12
-Subsection d1-1
| Name: |
dei_SecurityExchangeName |
| Namespace Prefix: |
dei_ |
| Data Type: |
dei:edgarExchangeCodeItemType |
| Balance Type: |
na |
| Period Type: |
duration |
|
| X |
- DefinitionBoolean flag that is true when the Form 8-K filing is intended to satisfy the filing obligation of the registrant as soliciting material pursuant to Rule 14a-12 under the Exchange Act. Reference 1: http://www.xbrl.org/2003/role/presentationRef
-Publisher SEC
-Name Exchange Act
-Section 14a
-Number 240
-Subsection 12
| Name: |
dei_SolicitingMaterial |
| Namespace Prefix: |
dei_ |
| Data Type: |
xbrli:booleanItemType |
| Balance Type: |
na |
| Period Type: |
duration |
|
| X |
- DefinitionTrading symbol of an instrument as listed on an exchange.
| Name: |
dei_TradingSymbol |
| Namespace Prefix: |
dei_ |
| Data Type: |
dei:tradingSymbolItemType |
| Balance Type: |
na |
| Period Type: |
duration |
|
| X |
- DefinitionBoolean flag that is true when the Form 8-K filing is intended to satisfy the filing obligation of the registrant as written communications pursuant to Rule 425 under the Securities Act. Reference 1: http://www.xbrl.org/2003/role/presentationRef
-Publisher SEC
-Name Securities Act
-Number 230
-Section 425
| Name: |
dei_WrittenCommunications |
| Namespace Prefix: |
dei_ |
| Data Type: |
xbrli:booleanItemType |
| Balance Type: |
na |
| Period Type: |
duration |
|
Chesapeake Utilities (NYSE:CPK)
Historical Stock Chart
From Jun 2024 to Jul 2024

Chesapeake Utilities (NYSE:CPK)
Historical Stock Chart
From Jul 2023 to Jul 2024
