BP 2Q Earnings Beat Expectations -- Earnings Review
July 30 2019 - 8:15AM
Dow Jones News
By Oliver Griffin
BP PLC (BP.LN) reported results for the second quarter on
Tuesday. Here is how the results came in:
UNDERLYING REPLACEMENT COST PROFIT: BP reported second-quarter
underlying replacement cost profit--a figure that is similar to the
net profit figure U.S. oil companies use, but strips out one-off
items--of $2.81 billion. This is roughly flat on the $2.82 billion
reported in the year-earlier period and beat analyst expectations.
A company-compiled consensus of 20 brokers had forecast underlying
replacement cost profit for the quarter at $2.46 billion.
SALES: The oil company reported sales and operating revenue of
$72.67 billion for the second quarter, representing a 3.7% fall
from $75.44 billion in the year earlier period. A consensus
estimate of three broker forecasts compiled by FactSet saw BP's
second-quarter sales and operating revenue at $71.50 billion. Total
revenue for the second quarter came in at $73.75 billion.
WHAT WE WATCHED:
-PRODUCTION: Second-quarter reported production came in at 3.8
million barrels of oil equivalent a day, up 4% on the year-earlier
period. Excluding contributions from Rosneft Oil Co. (ROSN.MZ), in
which BP holds a 19.7% stake, production for the quarter came in at
2.64 million barrels of oil equivalent a day, roughly flat on the
first quarter of 2019, when the company reported production of 2.66
million barrels a day.
-NET DEBT: Net debt rose over the quarter to $46.5 billion. In a
note, Citi analysts said they believe progress in disposals is
being hampered by low U.S. gas prices. The analysts said operating
cash flow is outfacing rising debt and added that the
second-quarter should be peak angst for investors on the leverage
issue.
-U.S. NATURAL GAS: Henry Hub gas prices fell to $2.64 per
million British thermal units, from $2.80 in the year-earlier
period and $3.15 in the first quarter of 2019.
Shares at 1053 GMT were up 3% at 543 pence each.
Write to Oliver Griffin at oliver.griffin@dowjones.com;
@OliGGriffin
(END) Dow Jones Newswires
July 30, 2019 08:00 ET (12:00 GMT)
Copyright (c) 2019 Dow Jones & Company, Inc.
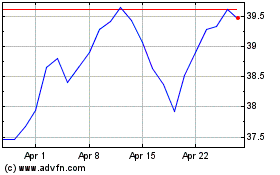
BP (NYSE:BP)
Historical Stock Chart
From Mar 2024 to Apr 2024

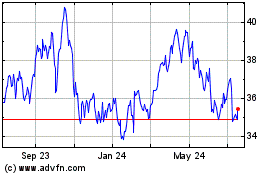
BP (NYSE:BP)
Historical Stock Chart
From Apr 2023 to Apr 2024
