UNITED STATES
SECURITIES AND EXCHANGE
COMMISSION
Washington, D.C. 20549
FORM 6-K
REPORT OF FOREIGN PRIVATE ISSUER
PURSUANT TO RULE 13a-16
OR 15d-16 OF
THE SECURITIES EXCHANGE ACT OF 1934
For the month of August 2023
Commission File Number 001-36903
KORNIT DIGITAL LTD.
(Translation of Registrant’s name into English)
12 Ha’Amal Street
Park Afek
Rosh Ha’Ayin 4824096 Israel
(Address of Principal Executive
Office)
Indicate by check mark whether the registrant
files or will file annual reports under cover of Form 20-F or Form 40-F.
Form 20-F ☒
Form 40-F ☐
CONTENTS
Results of Operations and Financial Condition- Quarter and Six
Months Ended June 30, 2023
On August 9, 2023, Kornit Digital Ltd. (“Kornit”)
issued a press release entitled “Kornit Digital Reports Second Quarter 2023 Results,” in which Kornit reported its results
of operations for the second quarter and six months ended June 30, 2023. A copy of that press release is furnished as Exhibit 99.1
hereto.
Kornit is holding a conference call on August
9, 2023 to discuss its results for the quarter and six months ended June 30, 2023, and, in connection with that call, will make available
to its investors a slide presentation to provide additional information regarding its business and its financial results. That slide presentation
is attached as Exhibit 99.2 to this Report of Foreign Private Issuer on Form 6-K (this “Form 6-K”) and is incorporated
herein by reference.
Incorporation by Reference
The U.S. GAAP financial information
contained in the (i) consolidated balance sheets, (ii) consolidated statements of operations and (iii) consolidated statements of
cash flows included in the press release attached as Exhibit 99.1 to this Report of Foreign Private Issuer on Form 6-K is hereby
incorporated by reference into Kornit’s Registration Statements on Form F-3 (File No. 333-248784)
and Form S-8 (File No.’s 333-203970, 333-214015, 333-217039, 333-223794, 333-230567, 333-237346,
333-254749, and 333-263975).
Exhibits
SIGNATURES
Pursuant to the requirements of the Securities
Exchange Act of 1934, the registrant has duly caused this report to be signed on its behalf by the undersigned, thereunto duly authorized.
| |
KORNIT DIGITAL LTD. |
| |
|
|
| Date: August 9, 2023 |
By: |
/s/ Lauri Hanover |
| |
Name: |
Lauri Hanover |
| |
Title: |
Chief Financial Officer |
2
Exhibit
99.1
Investor
Contact:
Andrew
G. Backman
Global Head
of Investor Relations
andrew.backman@kornit.com

Kornit
Digital Reports Second Quarter 2023 Results
| ● | Second
quarter revenues of $56.2 million, in line with previous guidance |
| | |
| ● | Second
quarter GAAP net loss of $14.3 million; non-GAAP net loss of $7.4 million |
| | |
| ● | Double-digit
year-over-year impressions and consumables growth across all regions |
| | |
| ● | Successful
ITMA tradeshow in Milan, Italy, securing high-quality leads and providing a healthy pipeline
for 2024 and beyond |
| | |
| ● | Company
issues third-annual Impact Report highlighting progress on its long-term impact strategy
and reaffirming commitment to a more sustainable fashion and textiles industry |
Rosh-Ha’Ayin,
Israel – August 9, 2023 – Kornit Digital Ltd. (“Kornit” or “the Company”) (Nasdaq: KRNT), a worldwide
market leader in sustainable, on-demand, digital fashionX and textile production technologies, reported today its results
for the second quarter ended June 30, 2023.
“During
the quarter, impressions grew at a double-digit pace year-over-year for the second consecutive quarter, driving a steady improvement
in capacity utilization and strong double-digit consumables revenue growth across our customer segments and throughout all our operating
regions,” said Ronen Samuel, Kornit’s Chief Executive Officer. “Services revenues again demonstrated exceptional growth,
as it has during the past year, with customers upgrading to our new MAX technology. While system sales volumes are expected to remain
modest in the near-term due to continued softness in capital equipment spending and lengthening sales cycles, we have taken actions through
various initiatives to diversify our customer base, increase operating efficiencies, and build a healthy pipeline for 2024 and beyond.”
Mr.
Samuel concluded, “We were pleased with our successful participation in the recent ITMA trade show in Milan, where exceptional
customer interest in our innovative solutions generated numerous high-quality leads and sales orders. We remain confident that our strategy,
product roadmap, and solid balance sheet position us well to generate meaningful, long-term, profitable growth and continue to expect
to approach break-even on an adjusted EBITDA basis for the fourth quarter of this year, and aim to deliver profitable growth for the
full year 2024.”
Second
Quarter 2023 Results of Operations
| ● | Total
revenue for the second quarter of 2023 was $56.2 million compared with $58.1 million in the prior year period, due primarily to lower
systems revenues. |
| ● | GAAP
gross profit margin for the second quarter of 2023 was 33.3% compared with 35.3% in the prior year period. On a non-GAAP basis, gross
profit margin was 36.1% compared with 38.6% in the prior year period. |
| ● | GAAP
operating expenses for the second quarter of 2023 decreased by 12.8% to $39.6 million compared with the prior year period. On a non-GAAP
basis, operating expenses decreased by 16.3% to $34.1 million compared with the prior year period. |
| ● | GAAP
net loss for the second quarter of 2023 was $14.3 million, or ($0.29) per basic share, compared with net loss of $19.5 million, or ($0.39)
per basic share, for the second quarter of 2022. |
| ● | Non-GAAP
net loss for the second quarter of 2023 was $7.4 million, or ($0.15) per basic share, compared with non-GAAP net loss of $15.6 million,
or ($0.31) per basic share, for the second quarter of 2022. |
| ● | Adjusted
EBITDA loss for the second quarter of 2023 was $10.7 million compared with adjusted EBITDA loss of $15.7 million for the second quarter
of 2022. Adjusted EBITDA margin for the second quarter of 2023 was -19.1% compared with -27.1% for the second quarter of 2022. |
Third
Quarter 2023 Guidance
For
the third quarter of 2023, the Company expects revenues to be in the range of $58 million to $62 million and adjusted EBITDA margin between
-6% to -13% of revenue. The guidance for revenue and adjusted EBITDA margin includes the impact of the non-cash expense associated
with the fair value of the Company’s warrants.
Second
Quarter Earnings Conference Call Information
The
Company will host a conference call today at 8:30 a.m. ET, or 3:30 p.m. Israel time, to discuss the results, followed by a question-and-answer
session with the investor community.
A
live webcast of the call can be accessed at ir.kornit.com. To access the call, participants may dial toll-free at 1-877-407-0792
or 1-201-689-8263. The toll-free Israeli number is 1 809 406 247. The conference confirmation code is 13739895.
To
listen to a replay of the conference call, dial toll-free 1-844-512-2921 or 1-412-317-6671 (international) and enter confirmation code
13739895. The telephonic replay will be available approximately three hours after the completion of the live call until 11:59 pm ET on
August 23, 2023. The call will also be available for replay via the webcast link on Kornit’s Investor Relations website.
About
Kornit Digital
Kornit
Digital Ltd. (NASDAQ: KRNT) is a worldwide market leader in sustainable, on-demand, digital fashionx and textile production
technologies. The Company is writing the operating system for fashion with end-to-end solutions including digital printing systems, inks,
consumables, and an entire global ecosystem that manages workflows and fulfillment. Headquartered in Israel with offices in the USA,
Europe, and Asia Pacific, Kornit serves customers in more than one hundred countries and states worldwide. To learn more about how Kornit
Digital is boldly transforming the world of fashion and textiles, visit www.kornit.com.
Forward
Looking Statements
Certain
statements in this press release are “forward-looking statements” within the meaning of the Private Securities Litigation
Reform Act of 1995 and other U.S. securities laws. Forward-looking statements are characterized by the use of forward-looking terminology
such as “will,” “expects,” “anticipates,” “continue,” “believes,” “should,”
“intended,” “guidance,” “preliminary,” “future,” “planned,” or other words.
These forward-looking statements include, but are not limited to, statements relating to the Company’s objectives, plans and strategies,
statements of preliminary or projected results of operations or of financial condition and all statements that address activities, events,
or developments that the Company intends, expects, projects, believes or anticipates will or may occur in the future. Forward-looking
statements are not guarantees of future performance and are subject to risks and uncertainties. The Company has based these forward-looking
statements on assumptions and assessments made by its management in light of their experience and their perception of historical trends,
current conditions, expected future developments and other factors they believe to be appropriate. Important factors that could cause
actual results, developments and business decisions to differ materially from those anticipated in these forward-looking statements include,
among other things: the duration and severity of current adverse macro-economic headwinds being caused by inflationary pressures, rising
interest rates, and supply-chain delays, which have been impacting, and may continue to impact, in an adverse manner, the Company’s
operations, financial position and cash flows, in part due to the adverse impact on the Company’s customers and suppliers; the
Company’s degree of success in developing, introducing and selling new or improved products and product enhancements including
specifically the Company’s Poly Pro and Presto products; the extent of the Company’s ability to consummate sales to large
accounts with multi-system delivery plans; the degree of the Company’s ability to fill orders for its systems; the extent of the
Company’s ability to increase sales of its systems, ink and consumables; the extent of the Company’s ability to leverage
its global infrastructure build-out; the development of the market for digital textile printing; the availability of alternative ink;
competition; sales concentration; changes to the Company’s relationships with suppliers; the extent of the Company’s success
in marketing; and those additional factors referred to under “Risk Factors” in Item 3.D of the Company’s Annual Report
on Form 20-F for the year ended December 31, 2022, filed with the SEC on March 30, 2023. Any forward-looking statements in this press
release are made as of the date hereof, whether as a result of new information, future events or otherwise, except as required by law.
Non-GAAP
Discussion Disclosure
The
Company presents certain non-GAAP financial measures, in this press release and in the accompanying conference call to discuss the Company’s
quarterly results. These non-GAAP financial measures reflect adjustments to corresponding GAAP financial measures in order to exclude
the impact of the following: share-based compensation expenses; amortization of intangible assets; acquisition related expenses; restructuring
expenses; foreign exchange differences associated with ASC 842; and non-cash deferred tax income.
The
Company defines “Adjusted EBITDA” as non-GAAP operating income (loss), which reflects the adjustments described in the preceding
paragraph, as further adjusted to exclude depreciation expense.
The
purpose of the foregoing non-GAAP financial measures is to convey the Company’s performance exclusive of non-cash charges and other
items that are considered by management to be outside of the Company’s core operating results. These non-GAAP measures are among
the primary factors management uses in planning for and forecasting future periods. Furthermore, the non-GAAP measures are regularly
used internally to understand, manage, and evaluate the Company’s business and make operating decisions, and the Company believes
that they are useful to investors as a consistent and comparable measure of the ongoing performance of the Company’s business.
The Company’s non-GAAP financial measures are not meant to be considered in isolation or as a substitute for comparable GAAP measures
and should be read only in conjunction with the Company’s consolidated financial statements prepared in accordance with GAAP. Additionally,
these non-GAAP financial measures may differ materially from the non-GAAP financial measures used by other companies.
The
reconciliation tables included below present a reconciliation of our non-GAAP financial measures to the most directly comparable GAAP
financial measures.
KORNIT DIGITAL LTD.
AND ITS SUBSIDIARIES
CONSOLIDATED BALANCE SHEETS
(U.S. dollars in thousands)
| | |
June 30, | | |
December 31, | |
| | |
2023 | | |
2022 | |
| | |
(Unaudited) | | |
(Audited) | |
| ASSETS | |
| | |
| |
| CURRENT ASSETS: | |
| | |
| |
| Cash and cash equivalents | |
$ | 101,322 | | |
$ | 104,597 | |
| Short-term bank deposit | |
| 220,098 | | |
| 275,033 | |
| Marketable securities | |
| 42,463 | | |
| 20,380 | |
| Trade receivables, net | |
| 84,216 | | |
| 67,360 | |
| Inventory | |
| 88,209 | | |
| 89,415 | |
| Other accounts receivable and prepaid expenses | |
| 22,820 | | |
| 22,054 | |
| Total current assets | |
| 559,128 | | |
| 578,839 | |
| | |
| | | |
| | |
| LONG-TERM ASSETS: | |
| | | |
| | |
| Marketable securities | |
| 227,798 | | |
| 245,970 | |
| Deposits and other long-term assets | |
| 7,805 | | |
| 5,927 | |
| Severance pay fund | |
| 279 | | |
| 274 | |
| Property, plant and equipment, net | |
| 56,981 | | |
| 60,463 | |
| Operating lease right-of-use assets | |
| 29,921 | | |
| 27,139 | |
| Intangible assets, net | |
| 8,707 | | |
| 9,890 | |
| Goodwill | |
| 29,164 | | |
| 29,164 | |
| Total long-term assets | |
| 360,655 | | |
| 378,827 | |
| | |
| | | |
| | |
| Total assets | |
| 919,783 | | |
| 957,666 | |
| | |
| | | |
| | |
| LIABILITIES AND SHAREHOLDERS’ EQUITY | |
| | | |
| | |
| CURRENT LIABILITIES: | |
| | | |
| | |
| Trade payables | |
| 11,550 | | |
| 14,833 | |
| Employees and payroll accruals | |
| 16,307 | | |
| 14,255 | |
| Deferred revenues and advances from customers | |
| 2,464 | | |
| 5,701 | |
| Operating lease liabilities | |
| 4,753 | | |
| 4,989 | |
| Other payables and accrued expenses | |
| 26,570 | | |
| 25,592 | |
| Total current liabilities | |
| 61,644 | | |
| 65,370 | |
| | |
| | | |
| | |
| LONG-TERM LIABILITIES: | |
| | | |
| | |
| Accrued severance pay | |
| 1,166 | | |
| 1,223 | |
| Operating lease liabilities | |
| 23,041 | | |
| 21,035 | |
| Other long-term liabilities | |
| 526 | | |
| 1,216 | |
| Total long-term liabilities | |
| 24,733 | | |
| 23,474 | |
| | |
| | | |
| | |
| SHAREHOLDERS’ EQUITY | |
| 833,406 | | |
| 868,822 | |
| | |
| | | |
| | |
| Total liabilities and shareholders’ equity | |
$ | 919,783 | | |
$ | 957,666 | |
KORNIT DIGITAL LTD.
AND ITS SUBSIDIARIES
CONSOLIDATED STATEMENTS OF OPERATIONS
(U.S. dollars in thousands, except share
and per share data)
| | |
Three Months Ended | | |
Six Months Ended | |
| | |
June 30, | | |
June 30, | |
| | |
2023 | | |
2022 | | |
2023 | | |
2022 | |
| | |
(Unaudited) | | |
(Unaudited) | |
| Revenues | |
| | |
| | |
| | |
| |
| Products | |
$ | 40,083 | | |
$ | 47,566 | | |
$ | 71,986 | | |
$ | 120,080 | |
| Services | |
| 16,116 | | |
| 10,570 | | |
| 31,991 | | |
| 21,349 | |
| Total revenues | |
| 56,199 | | |
| 58,136 | | |
| 103,977 | | |
| 141,429 | |
| | |
| | | |
| | | |
| | | |
| | |
| Cost of revenues | |
| | | |
| | | |
| | | |
| | |
| Products | |
| 22,620 | | |
| 25,667 | | |
| 42,999 | | |
| 64,904 | |
| Services | |
| 14,886 | | |
| 11,937 | | |
| 29,213 | | |
| 22,591 | |
| Total cost of revenues | |
| 37,506 | | |
| 37,604 | | |
| 72,212 | | |
| 87,495 | |
| | |
| | | |
| | | |
| | | |
| | |
| Gross profit | |
| 18,693 | | |
| 20,532 | | |
| 31,765 | | |
| 53,934 | |
| | |
| | | |
| | | |
| | | |
| | |
| Operating expenses: | |
| | | |
| | | |
| | | |
| | |
| Research and development, net | |
| 12,907 | | |
| 14,081 | | |
| 25,989 | | |
| 28,091 | |
| Sales and marketing | |
| 18,158 | | |
| 21,100 | | |
| 33,341 | | |
| 37,631 | |
| General and administrative | |
| 8,541 | | |
| 10,250 | | |
| 17,489 | | |
| 20,016 | |
| Total operating expenses | |
| 39,606 | | |
| 45,431 | | |
| 76,819 | | |
| 85,738 | |
| | |
| | | |
| | | |
| | | |
| | |
| Operating loss | |
| (20,913 | ) | |
| (24,899 | ) | |
| (45,054 | ) | |
| (31,804 | ) |
| | |
| | | |
| | | |
| | | |
| | |
| Financial income, net | |
| 7,018 | | |
| 4,324 | | |
| 12,422 | | |
| 6,123 | |
| Loss before taxes on income | |
| (13,895 | ) | |
| (20,575 | ) | |
| (32,632 | ) | |
| (25,681 | ) |
| | |
| | | |
| | | |
| | | |
| | |
| Taxes on income (tax benefit) | |
| 430 | | |
| (1,099 | ) | |
| 624 | | |
| (1,008 | ) |
| Net loss | |
$ | (14,325 | ) | |
$ | (19,476 | ) | |
$ | (33,256 | ) | |
$ | (24,673 | ) |
| | |
| | | |
| | | |
| | | |
| | |
| Basic loss per share | |
$ | (0.29 | ) | |
$ | (0.39 | ) | |
$ | (0.67 | ) | |
$ | (0.50 | ) |
| | |
| | | |
| | | |
| | | |
| | |
| Weighted average number of shares used in
computing basic net loss per share | |
| 49,554,383 | | |
| 49,756,990 | | |
| 49,720,453 | | |
| 49,707,782 | |
| | |
| | | |
| | | |
| | | |
| | |
| Diluted net loss per share | |
$ | (0.29 | ) | |
$ | (0.39 | ) | |
$ | (0.67 | ) | |
$ | (0.50 | ) |
| | |
| | | |
| | | |
| | | |
| | |
| Weighted average number of shares used in
computing diluted net loss per share | |
| 49,554,383 | | |
| 49,756,990 | | |
| 49,720,453 | | |
| 49,707,782 | |
KORNIT DIGITAL LTD.
AND ITS SUBSIDIARIES
RECONCILIATION OF GAAP TO NON-GAAP
CONSOLIDATED STATEMENTS OF OPERATIONS
(U.S. dollars in thousands, except share
and per share data)
| | |
Three
Months Ended | | |
Six
Months Ended | |
| | |
June
30, | | |
June
30, | |
| | |
2023 | | |
2022 | | |
2023 | | |
2022 | |
| | |
(Unaudited) | | |
(Unaudited) | |
| Revenues | |
$ | 56,199 | | |
$ | 58,136 | | |
$ | 103,977 | | |
$ | 141,429 | |
| | |
| | | |
| | | |
| | | |
| | |
| GAAP
cost of revenues | |
$ | 37,506 | | |
$ | 37,604 | | |
$ | 72,212 | | |
$ | 87,495 | |
| Cost
of product recorded for share-based compensation (1) | |
| (672 | ) | |
| (606 | ) | |
| (1,179 | ) | |
| (1,055 | ) |
| Cost
of service recorded for share-based compensation (1) | |
| (493 | ) | |
| (461 | ) | |
| (844 | ) | |
| (846 | ) |
| Intangible
assets amortization on cost of product (3) | |
| (263 | ) | |
| (666 | ) | |
| (526 | ) | |
| (839 | ) |
| Intangible
assets amortization on cost of service (3) | |
| (160 | ) | |
| (160 | ) | |
| (320 | ) | |
| (320 | ) |
| Restructuring
expenses (4) | |
| - | | |
| - | | |
| (89 | ) | |
| - | |
| Non-GAAP
cost of revenues | |
$ | 35,918 | | |
$ | 35,711 | | |
$ | 69,254 | | |
$ | 84,435 | |
| | |
| | | |
| | | |
| | | |
| | |
| GAAP
gross profit | |
$ | 18,693 | | |
$ | 20,532 | | |
$ | 31,765 | | |
$ | 53,934 | |
| Gross
profit adjustments | |
| 1,588 | | |
| 1,893 | | |
| 2,958 | | |
| 3,060 | |
| Non-GAAP
gross profit | |
$ | 20,281 | | |
$ | 22,425 | | |
$ | 34,723 | | |
$ | 56,994 | |
| | |
| | | |
| | | |
| | | |
| | |
| GAAP
operating expenses | |
$ | 39,606 | | |
$ | 45,431 | | |
$ | 76,819 | | |
$ | 85,738 | |
| Share-based
compensation (1) | |
| (5,385 | ) | |
| (4,414 | ) | |
| (9,772 | ) | |
| (8,878 | ) |
| Acquisition
related expenses (2) | |
| - | | |
| - | | |
| - | | |
| (512 | ) |
| Intangible
assets amortization (3) | |
| (152 | ) | |
| (333 | ) | |
| (340 | ) | |
| (419 | ) |
| Restructuring
expenses (4) | |
| - | | |
| - | | |
| (206 | ) | |
| - | |
| Non-GAAP
operating expenses | |
$ | 34,069 | | |
$ | 40,684 | | |
$ | 66,501 | | |
$ | 75,929 | |
| | |
| | | |
| | | |
| | | |
| | |
| GAAP
Financial income, net | |
$ | 7,018 | | |
$ | 4,324 | | |
$ | 12,422 | | |
$ | 6,123 | |
| Foreign
exchange losses associated with ASC 842 | |
| (121 | ) | |
| (2,480 | ) | |
| (497 | ) | |
| (3,129 | ) |
| Non-GAAP
Financial income , net | |
$ | 6,897 | | |
$ | 1,844 | | |
$ | 11,925 | | |
$ | 2,994 | |
| | |
| | | |
| | | |
| | | |
| | |
| GAAP
Taxes on income (tax benefit) | |
$ | 430 | | |
$ | (1,099 | ) | |
$ | 624 | | |
$ | (1,008 | ) |
| Non-cash
deferred tax income | |
$ | 102 | | |
$ | 250 | | |
$ | 323 | | |
$ | 467 | |
| Non-GAAP
Taxes on income (tax benefit) | |
$ | 532 | | |
$ | (849 | ) | |
$ | 947 | | |
$ | (541 | ) |
| | |
| | | |
| | | |
| | | |
| | |
| GAAP
net loss | |
$ | (14,325 | ) | |
$ | (19,476 | ) | |
$ | (33,256 | ) | |
$ | (24,673 | ) |
| Share-based
compensation (1) | |
| 6,550 | | |
| 5,481 | | |
| 11,795 | | |
| 10,779 | |
| Acquisition
related expenses (2) | |
| - | | |
| - | | |
| - | | |
| 512 | |
| Intangible
assets amortization (3) | |
| 575 | | |
| 1,159 | | |
| 1,186 | | |
| 1,578 | |
| Restructuring
expenses (4) | |
| - | | |
| - | | |
| 295 | | |
| - | |
| Foreign
exchange losses associated with ASC 842 | |
| (121 | ) | |
| (2,480 | ) | |
| (497 | ) | |
| (3,129 | ) |
| Non-cash
deferred tax income | |
| (102 | ) | |
| (250 | ) | |
| (323 | ) | |
| (467 | ) |
| Non-GAAP
net loss | |
$ | (7,423 | ) | |
$ | (15,566 | ) | |
$ | (20,800 | ) | |
$ | (15,400 | ) |
| | |
| | | |
| | | |
| | | |
| | |
| GAAP
diluted loss per share | |
$ | (0.29 | ) | |
$ | (0.39 | ) | |
$ | (0.67 | ) | |
$ | (0.50 | ) |
| Non-GAAP
diluted loss per share | |
$ | (0.15 | ) | |
$ | (0.31 | ) | |
$ | (0.42 | ) | |
$ | (0.31 | ) |
| | |
| | | |
| | | |
| | | |
| | |
| Weighted
average number of shares | |
| | | |
| | | |
| | | |
| | |
| Shares
used in computing GAAP diluted net loss per share | |
| 49,554,383 | | |
| 49,756,990 | | |
| 49,720,453 | | |
| 49,707,782 | |
| Shares
used in computing Non-GAAP diluted net loss per share | |
| 49,554,383 | | |
| 49,756,990 | | |
| 49,720,453 | | |
| 49,707,782 | |
| | |
| | | |
| | | |
| | | |
| | |
| (1)
Share-based compensation | |
| | | |
| | | |
| | | |
| | |
| Cost
of product revenues | |
$ | 672 | | |
$ | 606 | | |
$ | 1,179 | | |
$ | 1,055 | |
| Cost
of service revenues | |
$ | 493 | | |
| 461 | | |
| 844 | | |
| 846 | |
| Research
and development | |
$ | 1,601 | | |
| 1,268 | | |
| 2,952 | | |
| 2,457 | |
| Sales
and marketing | |
$ | 1,944 | | |
| 1,491 | | |
| 3,307 | | |
| 3,300 | |
| General
and administrative | |
$ | 1,840 | | |
| 1,655 | | |
| 3,513 | | |
| 3,121 | |
| | |
$ | 6,550 | | |
$ | 5,481 | | |
$ | 11,795 | | |
$ | 10,779 | |
| (2)
Acquisition related expenses | |
| | | |
| | | |
| | | |
| | |
| General
and administrative | |
$ | - | | |
$ | - | | |
$ | - | | |
$ | 512 | |
| | |
$ | - | | |
$ | - | | |
$ | - | | |
$ | 512 | |
| (3)
Intangible assets amortization | |
| | | |
| | | |
| | | |
| | |
| Cost
of product revenues | |
$ | 263 | | |
$ | 666 | | |
$ | 526 | | |
$ | 839 | |
| Cost
of service revenues | |
$ | 160 | | |
| 160 | | |
| 320 | | |
| 320 | |
| Sales
and marketing | |
$ | 152 | | |
| 333 | | |
| 340 | | |
| 419 | |
| | |
$ | 575 | | |
$ | 1,159 | | |
$ | 1,186 | | |
$ | 1,578 | |
| | |
| | | |
| | | |
| | | |
| | |
| (4)
Restructuring expenses | |
| | | |
| | | |
| | | |
| | |
| Cost
of product revenues | |
$ | - | | |
$ | - | | |
$ | 89 | | |
$ | - | |
| Research
and development | |
$ | - | | |
| - | | |
| 20 | | |
| - | |
| Sales
and marketing | |
$ | - | | |
| - | | |
| 186 | | |
| - | |
| | |
$ | - | | |
$ | - | | |
$ | 295 | | |
$ | - | |
KORNIT DIGITAL LTD.
AND ITS SUBSIDIARIES
CONSOLIDATED STATEMENTS OF CASH FLOWS
(U.S. dollars in thousands)
| | |
Three Months Ended | | |
Six Months Ended | |
| | |
June 30, | | |
June 30, | |
| | |
2023 | | |
2022 | | |
2023 | | |
2022 | |
| | |
(Unaudited) | | |
(Unaudited) | |
| Cash flows from operating activities: | |
| | |
| | |
| | |
| |
| Net loss | |
$ | (14,325 | ) | |
$ | (19,476 | ) | |
$ | (33,256 | ) | |
$ | (24,673 | ) |
| Adjustments to reconcile net loss to net cash used in operating activities: | |
| | | |
| | | |
| | | |
| | |
| Depreciation and amortization | |
| 3,654 | | |
| 3,322 | | |
| 7,527 | | |
| 5,902 | |
| Fair value of warrants deducted from revenues | |
| 3,332 | | |
| 4,516 | | |
| 5,676 | | |
| 12,521 | |
| Share-based compensation | |
| 6,550 | | |
| 5,481 | | |
| 11,795 | | |
| 10,779 | |
| Amortization of premium and accretion of discount on marketable securities, net | |
| 202 | | |
| 484 | | |
| 525 | | |
| 1,012 | |
| Realized gain (loss) on sale and redemption of marketable securities | |
| (43 | ) | |
| 7 | | |
| (3 | ) | |
| 10 | |
| Change in operating assets and liabilities: | |
| | | |
| | | |
| | | |
| | |
| Trade receivables, net | |
| (11,248 | ) | |
| 22,189 | | |
| (16,856 | ) | |
| (9,004 | ) |
| Other accounts receivables and prepaid expenses | |
| (1,682 | ) | |
| 673 | | |
| (766 | ) | |
| (1,791 | ) |
| Inventory | |
| 4,963 | | |
| (14,816 | ) | |
| 1,940 | | |
| (23,852 | ) |
| Operating leases right-of-use assets and liabilities, net | |
| (555 | ) | |
| (2,449 | ) | |
| (1,012 | ) | |
| (2,857 | ) |
| Deferred taxes | |
| - | | |
| (2,111 | ) | |
| - | | |
| (2,416 | ) |
| Deposits and other long term assets | |
| (851 | ) | |
| (1,327 | ) | |
| (1,878 | ) | |
| (1,321 | ) |
| Trade payables | |
| (225 | ) | |
| (4,476 | ) | |
| (1,702 | ) | |
| (11,920 | ) |
| Employees and payroll accruals | |
| 1,752 | | |
| (364 | ) | |
| 2,489 | | |
| (6,834 | ) |
| Deferred revenues and advances from customers | |
| (2,199 | ) | |
| (2,643 | ) | |
| (3,237 | ) | |
| (4,114 | ) |
| Other payables and accrued expenses | |
| (4,378 | ) | |
| 3,081 | | |
| (38 | ) | |
| 3,440 | |
| Accrued severance pay, net | |
| (161 | ) | |
| (103 | ) | |
| (62 | ) | |
| (292 | ) |
| Other long - term liabilities | |
| (330 | ) | |
| 413 | | |
| (690 | ) | |
| 729 | |
| Loss from sale and disposal of property, plant and equipment | |
| - | | |
| 41 | | |
| - | | |
| 41 | |
| Net cash used in operating activities | |
$ | (15,544 | ) | |
$ | (7,558 | ) | |
$ | (29,548 | ) | |
$ | (54,640 | ) |
| | |
| | | |
| | | |
| | | |
| | |
| Cash flows from investing activities: | |
| | | |
| | | |
| | | |
| | |
| Purchase of property, plant and equipment | |
$ | (1,791 | ) | |
$ | (1,985 | ) | |
$ | (5,069 | ) | |
$ | (9,447 | ) |
| Investment in equity securities | |
| - | | |
| (354 | ) | |
| - | | |
| (354 | ) |
| Acquisition of intangible assets | |
| - | | |
| (133 | ) | |
| - | | |
| (133 | ) |
| Proceeds from sale of property, plant and equipment | |
| - | | |
| 55 | | |
| - | | |
| 55 | |
| Cash paid in connection with acquisition, net of cash acquired | |
| - | | |
| (14,654 | ) | |
| - | | |
| (14,654 | ) |
| Proceeds from (investment in) short-term bank deposits, net | |
| (219,997 | ) | |
| 160,090 | | |
| 54,935 | | |
| (250,895 | ) |
| Proceeds from sales and redemption of marketable securities | |
| 1,250 | | |
| 1,500 | | |
| 5,250 | | |
| 1,945 | |
| Proceeds from maturities of marketable securities | |
| 7,680 | | |
| 5,500 | | |
| 11,252 | | |
| 17,422 | |
| Investment in marketable securities | |
| (8,911 | ) | |
| (23,003 | ) | |
| (18,935 | ) | |
| (103,897 | ) |
| Net cash provided by (used in) investing activities | |
$ | (221,769 | ) | |
$ | 127,016 | | |
$ | 47,433 | | |
$ | (359,958 | ) |
| | |
| | | |
| | | |
| | | |
| | |
| Cash flows from financing activities: | |
| | | |
| | | |
| | | |
| | |
| Exercise of employee stock options | |
$ | 53 | | |
$ | 41 | | |
$ | 95 | | |
$ | 340 | |
| Payments related to shares withheld for taxes | |
| (302 | ) | |
| (172 | ) | |
| (437 | ) | |
| (682 | ) |
| Repurchase of ordinary shares | |
| (14,066 | ) | |
| - | | |
| (20,818 | ) | |
| - | |
| Net cash used in financing activities | |
$ | (14,315 | ) | |
$ | (131 | ) | |
$ | (21,160 | ) | |
$ | (342 | ) |
| | |
| | | |
| | | |
| | | |
| | |
| Increase (decrease) in cash and cash equivalents | |
$ | (251,628 | ) | |
$ | 119,327 | | |
$ | (3,275 | ) | |
$ | (414,940 | ) |
| Cash and cash equivalents at the beginning of the period | |
| 352,950 | | |
| 77,284 | | |
| 104,597 | | |
| 611,551 | |
| Cash and cash equivalents at the end of the period | |
$ | 101,322 | | |
$ | 196,611 | | |
$ | 101,322 | | |
$ | 196,611 | |
| | |
| | | |
| | | |
| | | |
| | |
| Non-cash investing and financing activities: | |
| | | |
| | | |
| | | |
| | |
| Purchase of property and equipment on credit | |
| 46 | | |
| 1,823 | | |
| 219 | | |
| 1,823 | |
| Inventory transferred to be used as property and equipment | |
| - | | |
| 592 | | |
| - | | |
| 1,289 | |
| Property, plant and equipment transferred to be used as inventory | |
| - | | |
| 5 | | |
| 734 | | |
| 9 | |
| Lease liabilities arising from obtaining right-of-use assets | |
| (550 | ) | |
| 641 | | |
| 5,487 | | |
| 6,387 | |
KORNIT DIGITAL LTD.
AND ITS SUBSIDIARIES
RECONCILIATION OF GAAP NET INCOME
TO ADJUSTED EBITDA
(U.S. dollars in thousands, except share
and per share data)
| | |
Three Months Ended | | |
Six Months Ended | |
| | |
June 30, | | |
June 30, | |
| | |
2023 | | |
2022 | | |
2023 | | |
2022 | |
| | |
(Unaudited) | | |
(Unaudited) | |
| | |
| | |
| | |
| | |
| |
| GAAP Revenues | |
$ | 56,199 | | |
$ | 58,136 | | |
$ | 103,977 | | |
$ | 141,429 | |
| | |
| | | |
| | | |
| | | |
| | |
| GAAP Net Loss | |
| (14,325 | ) | |
| (19,476 | ) | |
| (33,256 | ) | |
| (24,673 | ) |
| Taxes on income | |
| 430 | | |
| (1,099 | ) | |
| 624 | | |
| (1,008 | ) |
| Financial income | |
| (7,018 | ) | |
| (4,324 | ) | |
| (12,422 | ) | |
| (6,123 | ) |
| Share-based compensation | |
| 6,550 | | |
| 5,481 | | |
| 11,795 | | |
| 10,779 | |
| Intangible assets amortization | |
| 575 | | |
| 790 | | |
| 1,186 | | |
| 1,209 | |
| Acquisition related expenses | |
| - | | |
| - | | |
| - | | |
| 512 | |
| Excess cost of product on acquired inventory | |
| - | | |
| 369 | | |
| - | | |
| 369 | |
| Restructuring expenses | |
| - | | |
| - | | |
| 295 | | |
| - | |
| Non-GAAP Operating Loss | |
| (13,788 | ) | |
| (18,259 | ) | |
| (31,778 | ) | |
| (18,935 | ) |
| Depreciation | |
| 3,079 | | |
| 2,532 | | |
| 6,341 | | |
| 4,693 | |
| Adjusted EBITDA | |
$ | (10,709 | ) | |
$ | (15,727 | ) | |
$ | (25,437 | ) | |
$ | (14,242 | ) |
8
Exhibit 99.2

©2023 Kornit Digital. All rights reserved. KORNIT DIGITAL (NASDAQ: KRNT) Second Quarter 2023 Earnings Conference Call Supporting Slides August 9, 2023

ON TODAY’S CALL Ronen Samuel CEO Lauri Hanover CFO Amir Shaked Mandel Andrew Backman EVP Corp Dev Global Head of IR 2 ©2023 Kornit Digital. All rights reserved.
SAFE HARBOR 3 ©2023 Kornit Digital. All rights reserved. This presentation contains “forward - looking statements” within the meaning of the Private Securities Litigation Reform Act of 1995 and other U . S . securities laws . Forward - looking statements are characterized by the use of forward - looking terminology such as “will,” “expects,” “anticipates,” “continue,” “believes,” “should,” “intended,” “guidance,” “preliminary,” “future,” “planned,” or other words . These forward - looking statements include, but are not limited to, statements relating to the Company’s objectives, plans and strategies, statements of preliminary or projected results of operations or of financial condition and all statements that address activities, events, or developments that the Company intends, expects, projects, believes or anticipates will or may occur in the future . Forward - looking statements are not guarantees of future performance and are subject to risks and uncertainties . The Company has based these forward - looking statements on assumptions and assessments made by its management in light of their experience and their perception of historical trends, current conditions, expected future developments and other factors they believe to be appropriate . Important factors that could cause actual results, developments and business decisions to differ materially from those anticipated in these forward - looking statements include, among other things : the duration and severity of current adverse macro - economic headwinds being caused by inflationary pressures, rising interest rates, and supply chain delays, which have been impacting, and may continue to impact, in an adverse manner, the Company’s operations, financial position and cash flows, in part due to the adverse impact on the Company’s customers and suppliers ; the Company’s degree of success in developing, introducing and selling new or improved products and product enhancements including specifically the Company’s Poly Pro and Presto products ; the extent of the Company’s ability to consummate sales to large accounts with multi - system delivery plans ; the degree of the Company’s ability to fill orders for its systems ; the extent of the Company’s ability to increase sales of its systems, ink and consumables ; the extent of the Company’s ability to leverage its global infrastructure build - out ; the development of the market for digital textile printing ; the availability of alternative ink ; competition ; sales concentration ; changes to the Company’s relationships with suppliers ; the extent of the Company’s success in marketing ; and those additional factors referred to under “Risk Factors” in Item 3 . D of the Company’s Annual Report on Form 20 - F for the year ended December 31 , 2022 , filed with the SEC on March 30 , 2023 . Any forward - looking statements in this press release are made as of the date hereof, whether as a result of new information, future events or otherwise, except as required by law . In addition to U . S . GAAP financials, this presentation includes certain non - GAAP financial measures . These non - GAAP financial measures are in addition to, and not a substitute for or superior to, measures of financial performance prepared in accordance with U . S . GAAP . Please see the reconciliation table that appears among the financial tables in our earnings release being issued today, which earnings release is attached as Exhibit 99 . 1 to our report of foreign private issuer on Form 6 - K being furnished to the SEC today, which reconciliation table is incorporated by reference in this presentation . This presentation contains statistical data that we obtained from industry publications and reports generated by third parties . Although we believe that the publications and reports are reliable, we have not independently verified this statistical data . Kornit, Kornit Digital, the K logo, and NeoPigment are trademarks of Kornit Digital Ltd . All other trademarks are the property of their respective owners and are used for reference purposes only . Such use should not be construed as an endorsement of our products or services .

BUSINESS HIGHLIGHTS 4 ©2023 Kornit Digital. All rights reserved. Ronen Samuel Chief Executive Officer

SECOND QUARTER - RECAP 5 ©2023 Kornit Digital. All rights reserved. • Total second quarter revenues of $56.2 million, in line with guidance provided in May • As a reminder, revenues include the impact from the fair value of issued warrants • Impressions grew at a double - digit pace year - over - year for the second consecutive quarter; steady improvement in capacity utilization • Consumables revenue grew at a strong double - digit rate across our customer segments, including key strategic accounts, and throughout all operating regions • So far in 3Q23 impressions growth on pace to increase at a double - digit rate year - over - year; providing confidence in solid consumables growth for 2H23
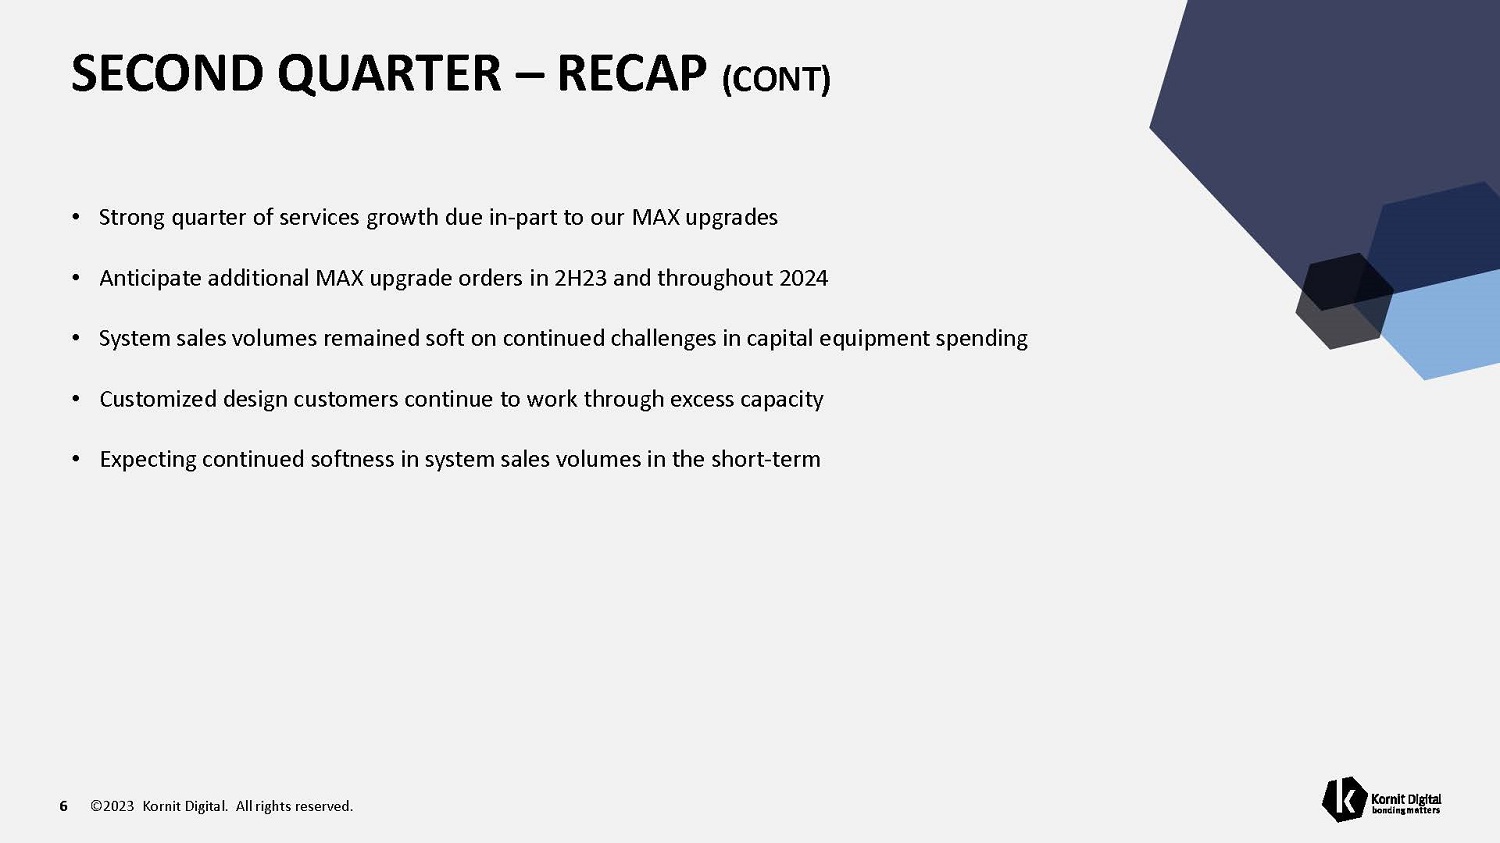
SECOND QUARTER – RECAP (CONT) 6 ©2023 Kornit Digital. All rights reserved. • Strong quarter of services growth due in - part to our MAX upgrades • Anticipate additional MAX upgrade orders in 2H23 and throughout 2024 • System sales volumes remained soft on continued challenges in capital equipment spending • Customized design customers continue to work through excess capacity • Expecting continued softness in system sales volumes in the short - term

MAKING PROGRESS ON STRATEGIC ACTIONS 7 ©2023 Kornit Digital. All rights reserved. • Implemented strategic measures to attract new customers including brands, retailers, and digital platforms • Targeting new growth regions within key textile production hubs to establish a healthy pipeline for 2024 and beyond • Taken various actions to increase efficiencies throughout operations • Currently expect to approach breakeven on an adjusted EBITDA basis for 4Q23 • Based on a mid - $60 million quarterly revenue run - rate and a more favorable mix of higher - margin consumables and quarterly OpEx in the low to mid - $30 million range • Aiming to deliver profitable growth for the full year 2024

HIGHLY SUCCESSFUL ITMA – MILAN, ITALY 8 ©2023 Kornit Digital. All rights reserved. • Very high customer engagements, with new customers from key textile regions such as India, China, Turkey, Morocco, and LATAM (Argentina, Brazil, and Mexico) • Met with hundreds of customers and prospects, very favorable feedback on our portfolio • Secured a high number of quality leads and sales orders for both direct - to - fabric and direct - to - garment systems • Signed one of the top textile manufacturers in India, opening a new market that has the potential to meaningfully grow over the next several years • Approximately 60% of deals signed from net new customers; providing healthy pipeline for 2024 and beyond
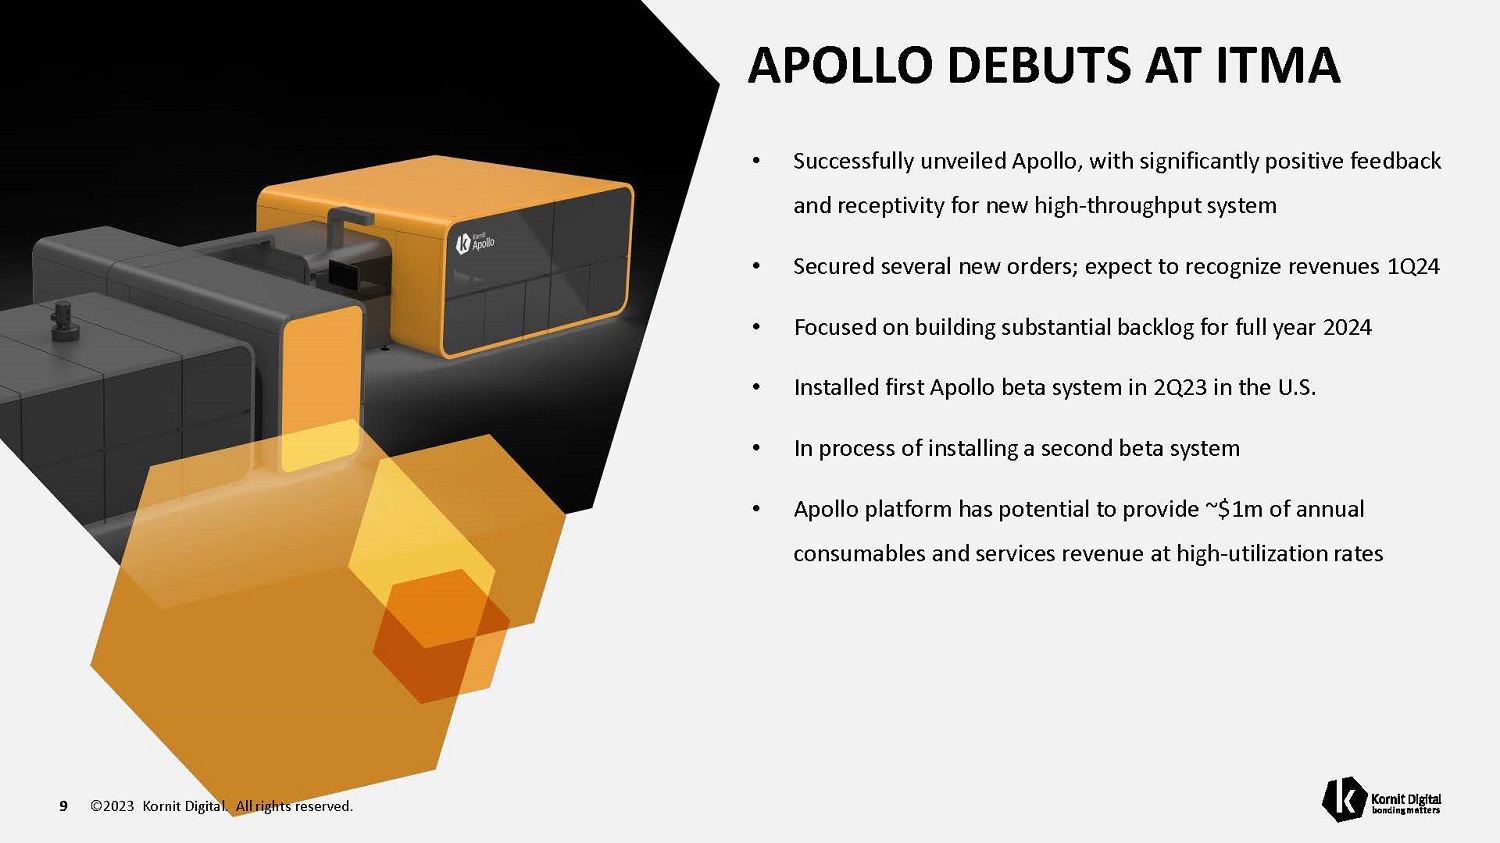
APOLLO DEBUTS AT ITMA 9 ©2023 Kornit Digital. All rights reserved. • Successfully unveiled Apollo, with significantly positive feedback and receptivity for new high - throughput system • Secured several new orders; expect to recognize revenues 1Q24 • Focused on building substantial backlog for full year 2024 • Installed first Apollo beta system in 2Q23 in the U.S. • In process of installing a second beta system • Apollo platform has potential to provide ~$1m of annual consumables and services revenue at high - utilization rates

FIRST HALF 2023 PROGRESS 10 ©2023 Kornit Digital. All rights reserved. • Built a solid foundation for future growth • Long - term growth drivers remain firmly intact; strategy and vision reinforced at ITMA • Successful introduction of new technologies and solutions • MAX platform well received by the market, becoming the new standard • Kornit's quality of prints, XDi capabilities, and ability to sustainably print white on dark fabrics have opened new markets and driven increased customer interest and engagements • Continue to diversify business and bolster pipeline • Materially adjusted cost structure and operations, reallocated resources to further enable growth engines • Successfully launching the Apollo • Capitalizing on growth opportunities in new markets for our direct - to - fabric business with Presto MAX Remain confident that Kornit's strategy, product roadmap, and solid balance sheet position us well to generate meaningful, long - term growth

FINANCIAL HIGHLIGHTS 11 ©2023 Kornit Digital. All rights reserved. Lauri Hanover Chief Financial Officer

REVENUES • 2Q23 revenues of $56.2 million in line with the guidance range of $54 million to $59 million provided in May • Both consumables and services revenues grew strong double - digits year - over - year • Lower system sales drove the year - over - year decline in total revenues 12 ©2023 Kornit Digital. All rights reserved.

REGIONAL OVERVIEW • Americas: • Growth attributable to a double - digit increase in consumables revenue across strategic accounts • Strong quarter of services growth contribution due mainly to MAX upgrades • EMEA: • Consumables revenue growth robust due to a larger installed base and increased usage • Decline driven by lower system sales, as customers continued to encounter financing challenges • Continue to explore ways to support qualified buyers to secure financing, including third - party financing partners • Asia Pacific: • Healthy consumables and services growth • Continue to develop a meaningful pipeline of long - term growth opportunities, especially in key textile producing countries such as India and China 13 ©2023 Kornit Digital. All rights reserved.
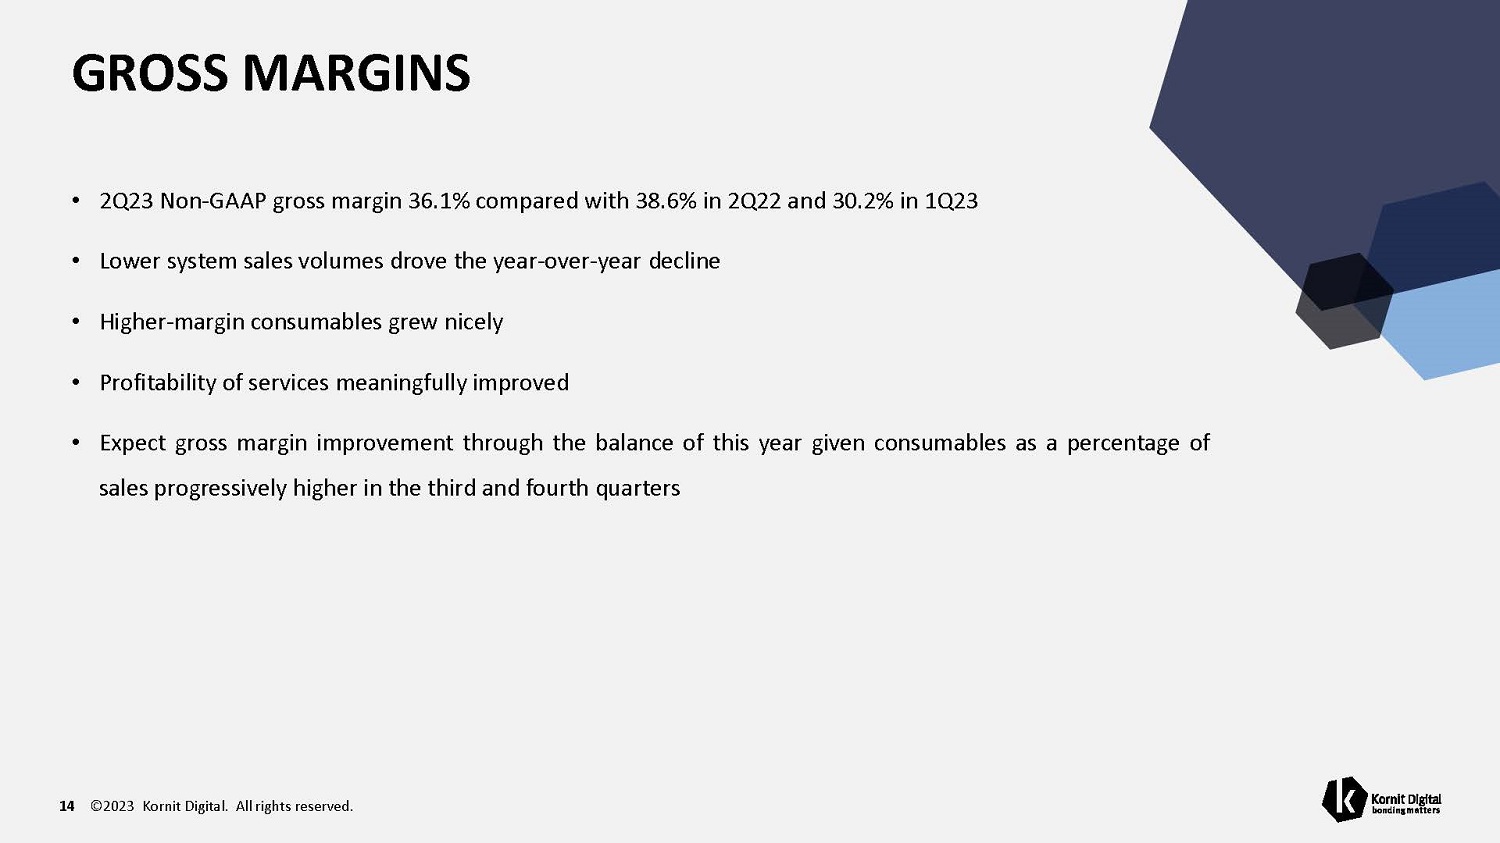
GROSS MARGINS 14 ©2023 Kornit Digital. All rights reserved. • 2Q23 Non - GAAP gross margin 36.1% compared with 38.6% in 2Q22 and 30.2% in 1Q23 • Lower system sales volumes drove the year - over - year decline • Higher - margin consumables grew nicely • Profitability of services meaningfully improved • Expect gross margin improvement through the balance of this year given consumables as a percentage of sales progressively higher in the third and fourth quarters
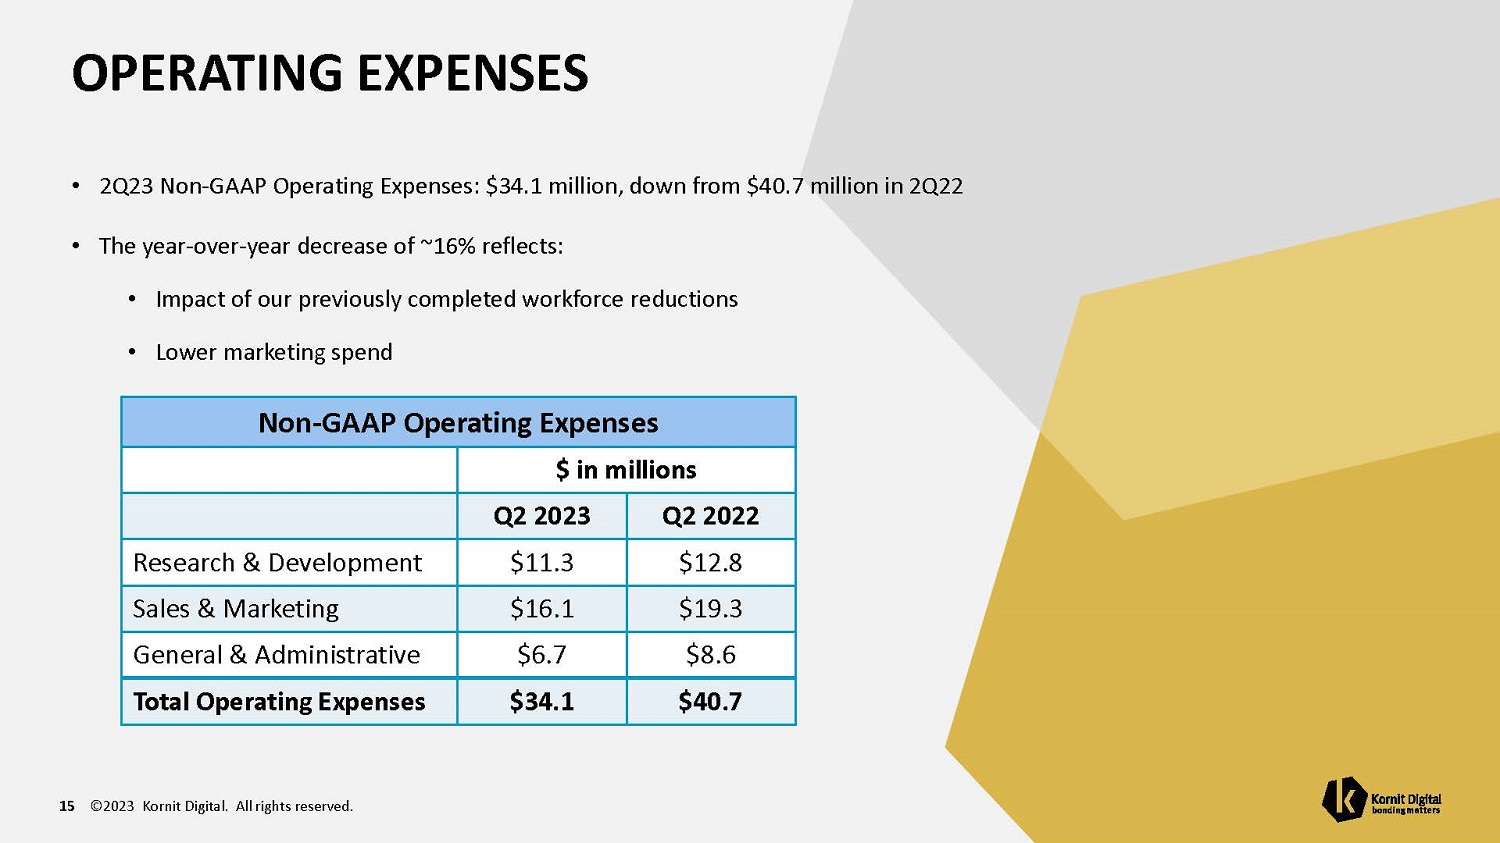
OPERATING EXPENSES 15 ©2023 Kornit Digital. All rights reserved. • 2Q23 Non - GAAP Operating Expenses: $34.1 million, down from $40.7 million in 2Q22 • The year - over - year decrease of ~16% reflects: • Impact of our previously completed workforce reductions • Lower marketing spend Non - GAAP Operating Expenses $ in millions Q2 2022 Q2 2023 $12.8 $11.3 Research & Development $19.3 $16.1 Sales & Marketing $8.6 $6.7 General & Administrative $40.7 $34.1 Total Operating Expenses
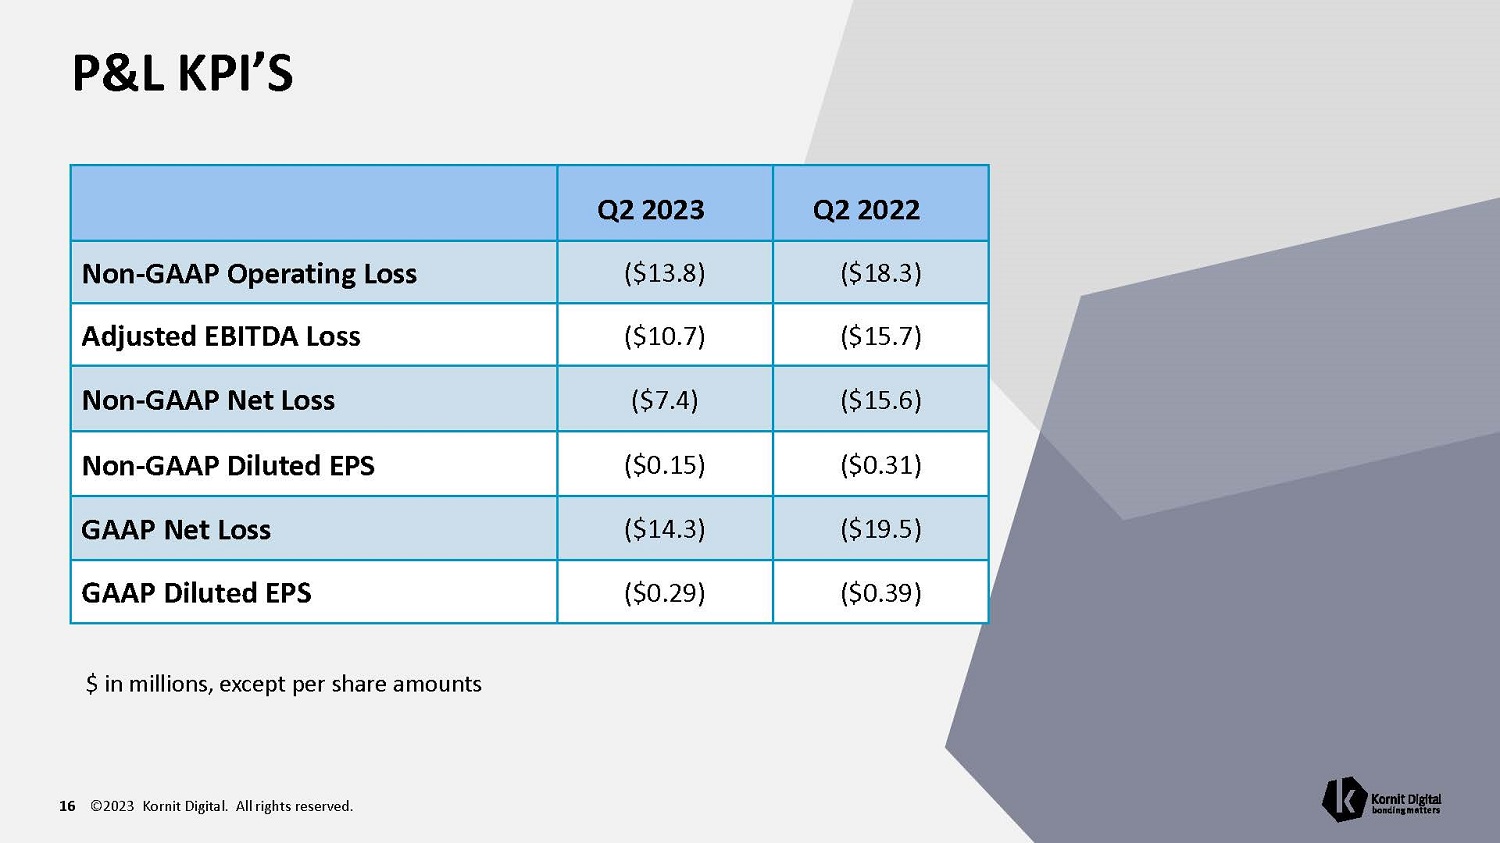
P&L KPI’S 16 ©2023 Kornit Digital. All rights reserved. Q2 2022 Q2 2023 ($18.3) ($13.8) Non - GAAP Operating Loss ($15.7) ($10.7) Adjusted EBITDA Loss ($15.6) ($7.4) Non - GAAP Net Loss ($0.31) ($0.15) Non - GAAP Diluted EPS ($19.5) ($14.3) GAAP Net Loss ($0.39) ($0.29) GAAP Diluted EPS $ in millions, except per share amounts

BALANCE SHEET AND CASH FLOW 17 ©2023 Kornit Digital. All rights reserved. • Cash balances, including bank deposits and marketable securities, ~$592 million at quarter end • 2Q23 cash used in operating activities: ~$15.5 million • Receivables increased ~$11.2 million from 1Q23 • Inventories decreased ~$4.5 million from 1Q23 • Trade payables decreased ~$0.2 million from 1Q23 Q2 2022 Q1 2023 Q2 2023 $704.6 $623.9 $591.7 Cash, Deposits & Marketable Securities $60.5 $73.0 $84.2 Accounts Receivables $89.6 $92.7 $88.2 Inventory $30.8 $11.8 $11.6 Trade Payables
SHARE REPURCHASE PROGRAM UPDATE 18 ©2023 Kornit Digital. All rights reserved. • Repurchased ~938 thousand shares for ~$21.8 million at an average price of ~$23.20 per share since the beginning of 2023 • Initial court approved period for share repurchases of up to $75 million expired June 15 th • Applied for and received new approval from Israeli court covering an additional six - months • Given strong balance sheet, opportunistic share repurchases will not impact ability to execute on growth initiatives
THIRD QUARTER 2023 GUIDANCE 19 ©2023 Kornit Digital. All rights reserved. • Revenues: • Expect third quarter revenues to be in range of $58 million to $62 million, net of warrants impact • Adjusted EBITDA Margins: • Expect third quarter Adjusted EBITDA margins in range of - 6% to - 13% of revenue, net of warrants impact • Currently expect to approach breakeven on an adjusted EBITDA basis for the fourth quarter of 2023

©2023 Kornit Digital. All rights reserved. $ 141,429 $ 103,977 $ 58,136 $ 56,199 GAAP Revenues (24,673) (33,256) (19,476) (14,325) GAAP Net Loss (1,008) 624 (1,099) 430 Taxes on income (6,123) (12,422) (4,324) (7,018) Financial income 10,779 11,795 5,481 6,550 Share - based compensation 1,209 1,186 790 575 Intangible assets amortization 512 - - - Acquisition related expenses 369 - 369 - Excess cost of product on acquired inventory - 295 - - Restructuring expenses (18,935) (31,778) (18,259) (13,788) Non - GAAP Operating Loss 4,693 6,341 2,532 3,079 Depreciation $ (14,242) $ (25,437) $ (15,727) $ (10,709) Adjusted EBITDA KORNIT DIGITAL LTD. AND ITS SUBSIDIARIES RECONCILIATION OF GAAP NET INCOME TO ADJUSTED EBITDA (U.S. dollars in thousands, except share and per share data) Three Months Ended June 30, 2023 2022 (Unaudited) Six Months Ended June 30, 2023 2022 (Unaudited)

©2023 Kornit Digital. All rights reserved. TNX
Kornit Digital (NASDAQ:KRNT)
Historical Stock Chart
From Mar 2024 to Apr 2024

Kornit Digital (NASDAQ:KRNT)
Historical Stock Chart
From Apr 2023 to Apr 2024
